PwC / CB Insights MoneyTree™ Reportandhealth.com.au/wp-content/uploads/2019/04/CB-Insights...PwC |...
78
PwC / CB Insights MoneyTree™ Report Q1 2019
Transcript of PwC / CB Insights MoneyTree™ Reportandhealth.com.au/wp-content/uploads/2019/04/CB-Insights...PwC |...

PwC / CB Insights
MoneyTree™ ReportQ1 2019

PwC | CB Insights MoneyTree™ Report Q1 2019 2
Executive summaryUS VC funding and deal activity fell in Q1’19 from near-record levels in 2018
US VC funding and deal activity fell in Q1’19: US VC funding fell 36% in Q1’19 to $25B, with 4% fewer deals compared to Q4’18. Q4’18’s $39B and 2018’s $115B were the second largest quarter and year, respectively.
US mega-rounds were down from a record Q4’18, but well above historic levels: US private companies raised 46 $100M+ rounds in Q1’19, down from a record Q4’18 but well above historic levels.
Seed-stage deals continued to fall in Q1’19: Seed-stage deals as a percentage of total US deal activity continued to fall in Q1’19. Seed-stage deals began to decline starting in Q3’17, at 36% of all deals, falling to 24% in Q1’19.
Artificial Intelligence-related funding fell for the second-straight quarter: AI-related companies raised $2B in Q1’19, falling 22% compared to Q4’18, the second straight quarterly decline.
FinTech funding fell slightly after a record Q4’18: FinTech-related funding remained elevated at $3B in Q1’19, falling only 3% after a record Q4’18. Deal activity rose 13% in Q1’19, to 170 transactions.
Global funding fell 22% in Q1’19 after 2018 surge to near record levels
Global funding and deal activity fell in Q1’19: Funding fell by 22% to $52B, raised over 3,327 transactions. Deal activity fell by 5%.
Asian funding dropped off: Asia-based private companies raised $18B in Q1’19, a 12% decrease compared to Q4’18. Deal activity fell 7% to 1,128 transactions, the second-straight quarterly decrease.
North America minted 10 new unicorns: North America beat out Asia for the third-straight quarter in private companies newly valued at $1B+. NA saw 10 new $1B+ private company valuations, compared to 5 in Asia.
Silicon Valley funding fell amid declining deal activity: Silicon Valley fell by 19% to $4B, raised over 118 deals. Deal activity fell for the third straight quarter.
NY metro area funding jumped: NY metro-based VC backed companies raised $4.5B in Q1’19, a 110% increase compared to Q4’18. New York VC funding rounds included 6 mega-rounds, including one $1B round.
Note: Report includes all rounds to VC-backed companies. For a detailed brief on methodology, please reference page 94 of this report.

PwC | CB Insights MoneyTree™ Report Q1 2019
Table of contents
3
4 US Overall Trends
74 Global Trends
59 US Movers and Shakers
45 US Places
12 US Sector Activity

US Overall Trends01
4

5PwC | CB Insights MoneyTree™ Report Q3 2017
In Q1 2019
UNITED STATES
VC-backed companies raised
$24.6B

PwC | CB Insights MoneyTree™ Report Q1 2019 6
8-quarter US financing trendUS funding and deal activity decreased in Q1’19
• Funding was down 36% in Q1’19 as $24.6B was invested across 1,279 deals. Deal activity declined for the third consecutive quarter.
• US-based unicorns brought in noteworthy deals. Flexport, Nuro, and WeWork all raised $900M+ rounds in Q1’19.
$19.6 $20.8 $20.0 $22.8 $24.5 $28.9 $38.7 $24.6
1,4731,561
1,434 1,5241,639
1,4271,328 1,279
0
200
400
600
800
1,000
1,200
1,400
1,600
1,800
Q2'17 Q3'17 Q4'17 Q1'18 Q2'18 Q3'18 Q4'18 Q1'19
Title
Investments ($B) Deals

PwC | CB Insights MoneyTree™ Report Q1 2019 7
US financing trends
”
Over the past three quarters, we’ve seen the number of deals moderate down, while the total amount invested stays relatively consistent.
“
— Tom Ciccolella, Partner, US Ventures Leader at PwC

PwC | CB Insights MoneyTree™ Report Q1 2019 8
US deal share by stageUS seed-stage deals declined after six consecutive down or flat quarters• Seed-stage deals declined to 24% of all deals, their lowest in recent quarters.• Early-stage deals decreased slightly to 26%, their first decrease since Q1’18.
30% 36% 30% 30% 28% 25% 25% 24%
26%24%
26% 24% 24% 26% 27% 26%
19% 18% 19% 21% 21% 22% 23% 23%
9% 9% 9% 9% 10% 11% 10% 11%
16% 14% 17% 15% 17% 16% 15% 16%
Q2'17 Q3'17 Q4'17 Q1'18 Q2'18 Q3'18 Q4'18 Q1'19
Seed Stage Early Stage Expansion Stage Later Stage Other

PwC | CB Insights MoneyTree™ Report Q1 2019 9
Median US deal sizes by stageLater-stage median deal size increased for second consecutive quarter in Q1’19
• Median later-stage deal size increased to $40M in Q1’19, an $8M increase from Q3’18, while median deal size shrank to $32M.
• Expansion-stage median deal size was flat at $20M.
$1.7 $1.1 $2.0 $1.6 $2.0 $1.5 $2.1 $2.0$6.0 $6.0 $7.0 $7.0 $7.0 $6.5 $7.4 $7.0
$15.8 $15.5$18.0 $16.0 $15.5 $16.0
$20.0 $20.0
$36.2
$30.9
$25.0
$31.0
$44.0
$32.0
$37.5$40.0
Q2'17 Q3'17 Q4'17 Q1'18 Q2'18 Q3'18 Q4'18 Q1'19
Seed Stage Deal Size ($M) Early Stage Deal Size ($M) Expansion Stage Deal Size ($M) Later Stage Deal Size ($M)

PwC | CB Insights MoneyTree™ Report Q1 2019 10
US corporate deal participationCorporate participation in US deals increased to 30%, its highest level in recent quarters
• Corporate participation in US deals increased in Q1’19 to 30%, its highest level in recent quarters.
76% 77% 77% 76% 75% 73% 73% 70%
24% 23% 23% 24% 25% 27% 27% 30%
Q2'17 Q3'17 Q4'17 Q1'18 Q2'18 Q3'18 Q4'18 Q1'19Other Investors Corp / CVC Deal Participation
PwC | CB Insights MoneyTree™ Report Q1 2019 11
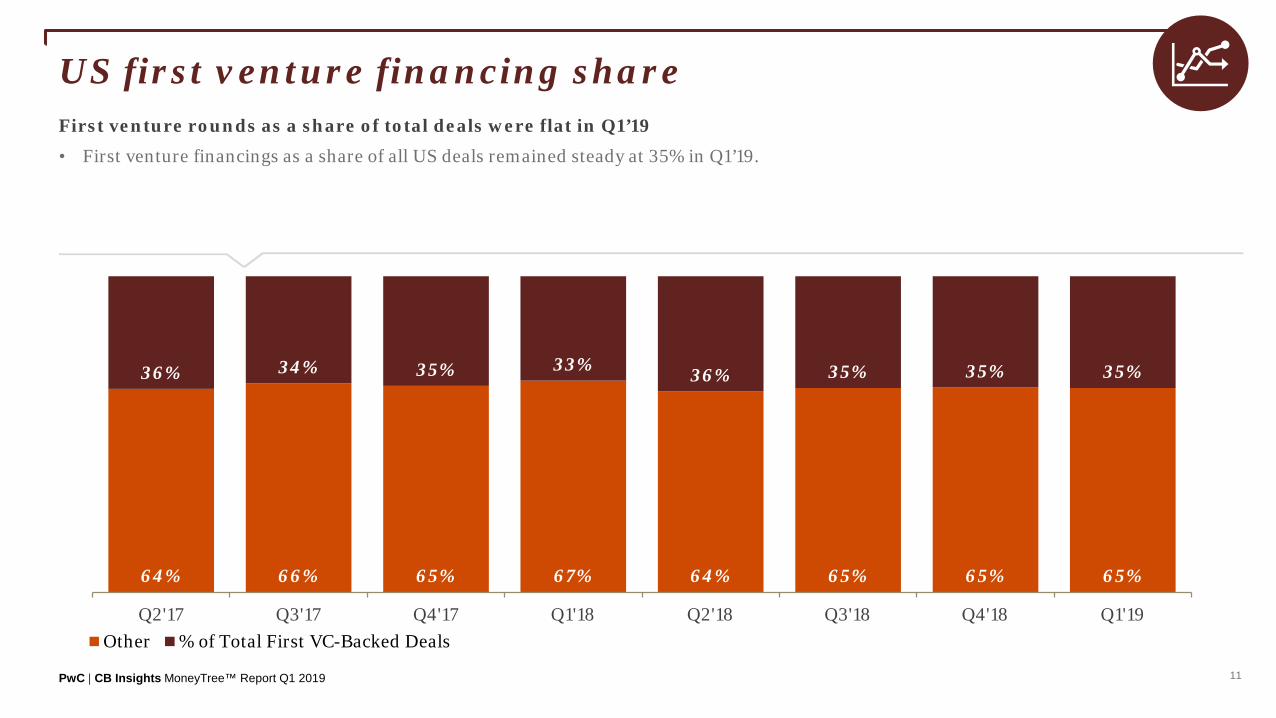
US first venture financing shareFirst venture rounds as a share of total deals were flat in Q1’19
• First venture financings as a share of all US deals remained steady at 35% in Q1’19.
64% 66% 65% 67% 64% 65% 65% 65%
36% 34% 35% 33% 36% 35% 35% 35%
Q2'17 Q3'17 Q4'17 Q1'18 Q2'18 Q3'18 Q4'18 Q1'19Other % of Total First VC-Backed Deals

US Sectors02
PwC | CB Insights MoneyTree™ Report Q1 2019
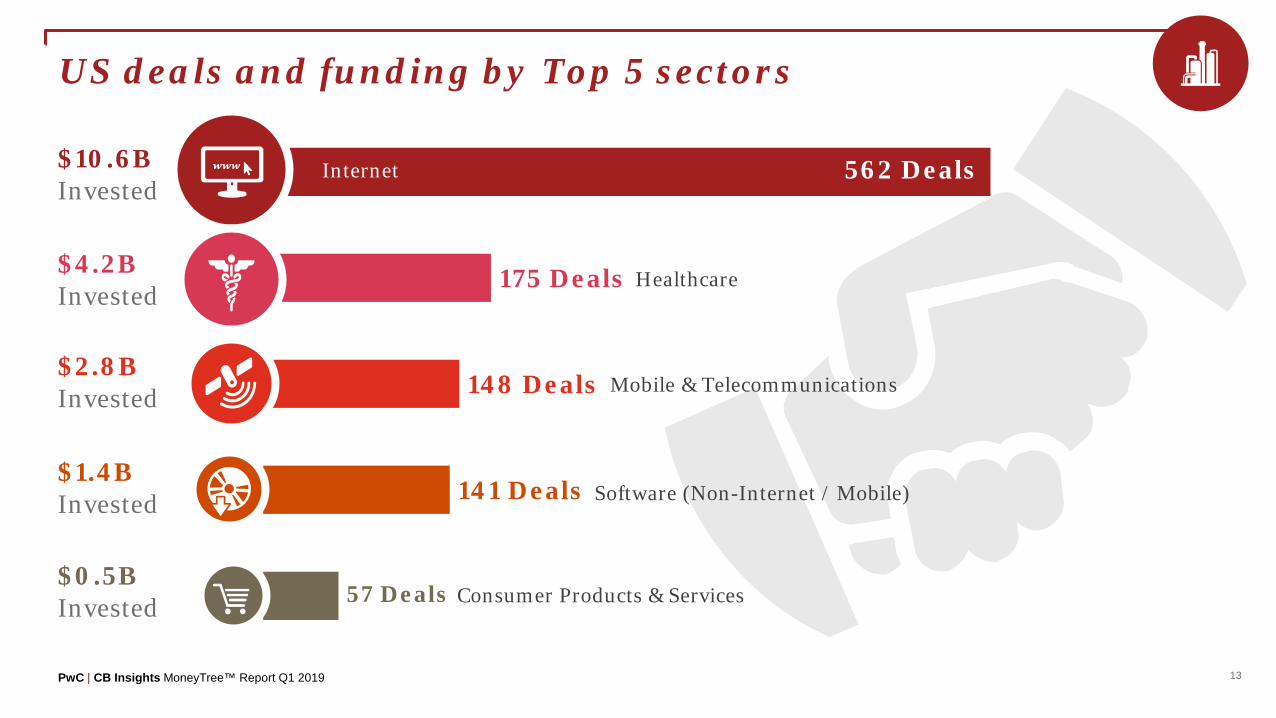
57 Deals
141 Deals
148 Deals
175 Deals
562 Deals
13
US deals and funding by Top 5 sectors
$10.6BInvested
$4.2BInvested
$2.8BInvested
$1.4BInvested
$0.5BInvested
Internet
Mobile & Telecommunications
Software (Non-Internet / Mobile)
Consumer Products & Services
Healthcare
PwC | CB Insights MoneyTree™ Report Q1 2019 14
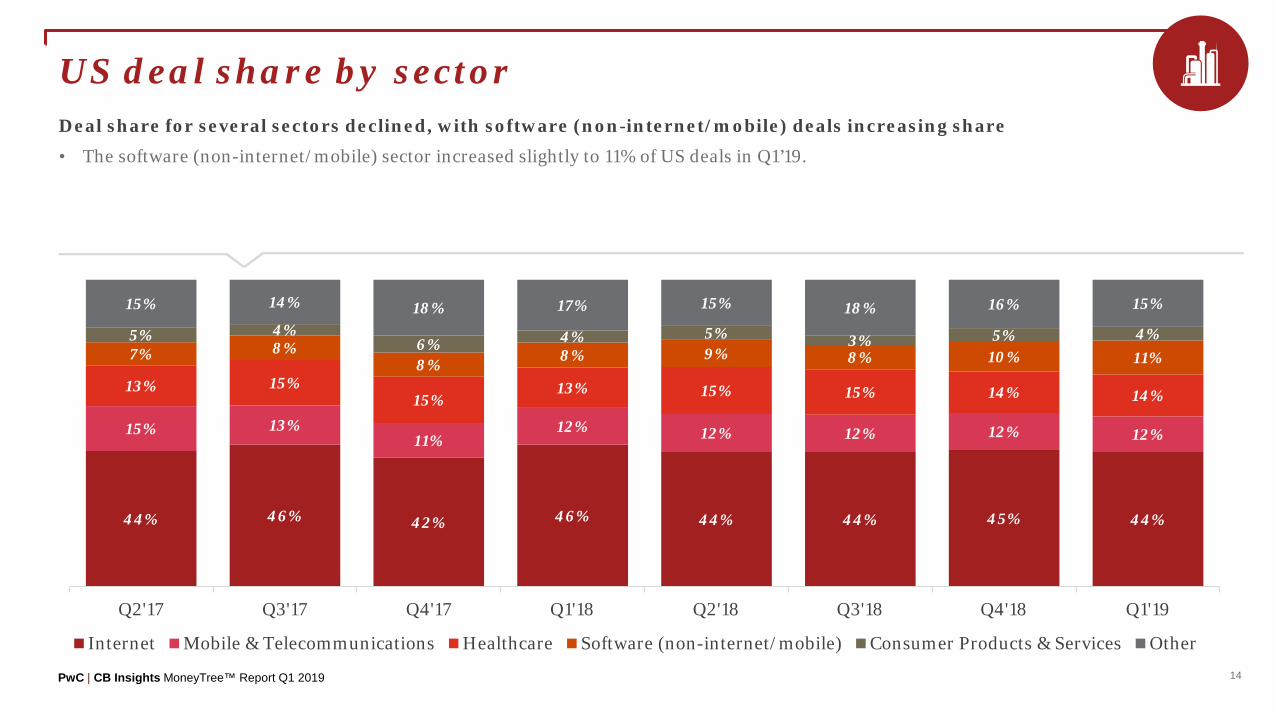
US deal share by sectorDeal share for several sectors declined, with software (non-internet/mobile) deals increasing share
• The software (non-internet/mobile) sector increased slightly to 11% of US deals in Q1’19.
44% 46% 42% 46% 44% 44% 45% 44%
15% 13%11%
12% 12% 12% 12% 12%
13% 15%15%
13% 15% 15% 14% 14%
7% 8%8% 8% 9% 8% 10% 11%
5% 4%6% 4% 5% 3% 5% 4%
15% 14% 18% 17% 15% 18% 16% 15%
Q2'17 Q3'17 Q4'17 Q1'18 Q2'18 Q3'18 Q4'18 Q1'19
Internet Mobile & Telecommunications Healthcare Software (non-internet/mobile) Consumer Products & Services Other

PwC | CB Insights MoneyTree™ Report Q1 2019 15
Artificial Intelligence

PwC | CB Insights MoneyTree™ Report Q1 2019 16
Artificial Intelligence: US funding over timeArtificial intelligence deal activity increased after three consecutive quarterly declines
• Artificial intelligence deals increased in Q1’19 to 116 deals, up from 104 deals in Q4’18.
• While deals increased, funding dropped to $2B in Q1’19. Close to half of all artificial intelligence funding for Q1’19 was driven by a $940M investment in Nuro by SoftBank Group.
$1,334 $1,475 $1,487 $2,012 $2,384 $2,740 $2,568 $2,000
121
151
120
148 145 112104
116
0
20
40
60
80
100
120
140
160
Q2'17 Q3'17 Q4'17 Q1'18 Q2'18 Q3'18 Q4'18 Q1'19
Title
Investments ($M) Deals
PwC | CB Insights MoneyTree™ Report Q1 2019 17
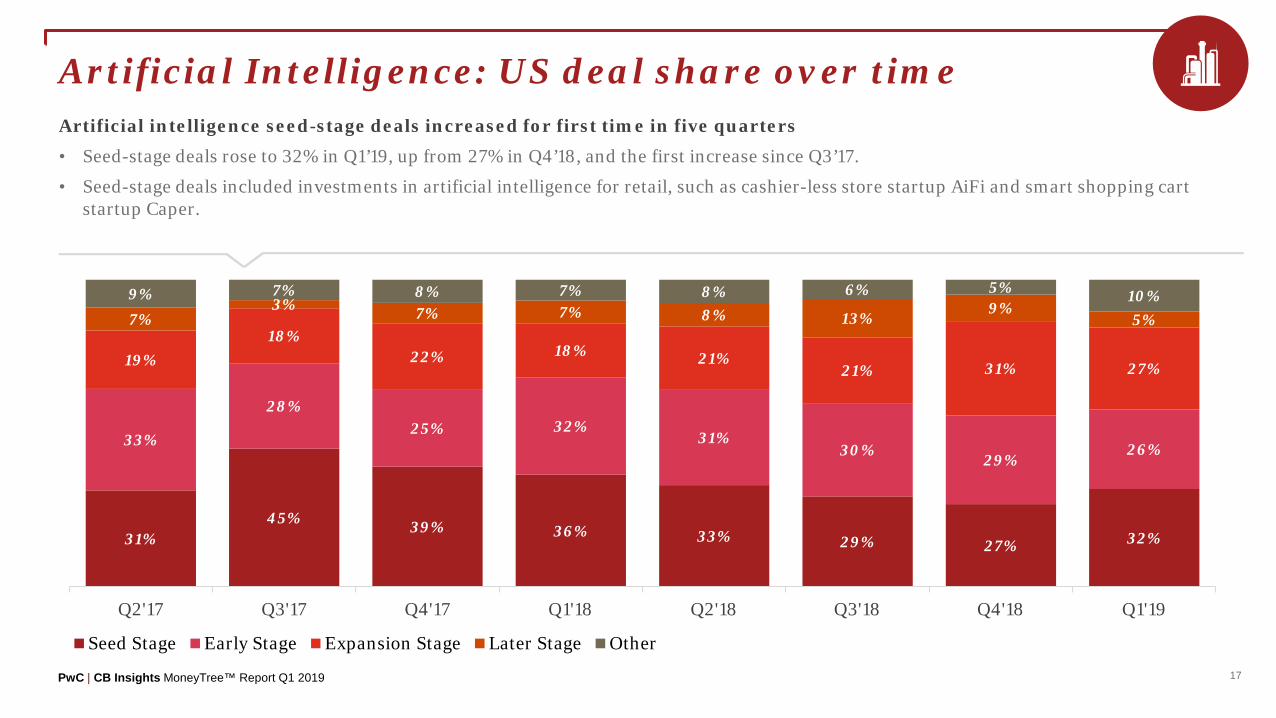
Artificial Intelligence: US deal share over timeArtificial intelligence seed-stage deals increased for first time in five quarters
• Seed-stage deals rose to 32% in Q1’19, up from 27% in Q4’18, and the first increase since Q3’17.
• Seed-stage deals included investments in artificial intelligence for retail, such as cashier-less store startup AiFi and smart shopping cart startup Caper.
31%45% 39% 36% 33% 29% 27% 32%
33%
28%25% 32%
31%30% 29%
26%
19%18%
22% 18% 21%21% 31% 27%
7%3% 7% 7% 8% 13% 9%
5%9% 7% 8% 7% 8% 6% 5% 10%
Q2'17 Q3'17 Q4'17 Q1'18 Q2'18 Q3'18 Q4'18 Q1'19
Seed Stage Early Stage Expansion Stage Later Stage Other

PwC | CB Insights MoneyTree™ Report Q1 2019 18
Artificial Intelligence: Top states by deals
61 deals$1,473M Invested
1. CA
18 deals$248M Invested
8 deals$85M Invested
2. NY
3. MA
3. TX 8 deals$58M Invested

PwC | CB Insights MoneyTree™ Report Q1 2019 19
Artificial Intelligence: Largest US deals of Q1’19Company Location Sector Industry Stage of
Funding$ Valueof Deal Select Investors
Nuro Mountain View, CA Automotive & Transportation
Automobile Manufacturing $940M SoftBank Group
Figure Technologies San Francisco, CA Internet Internet Software & Services $65M DCM Ventures, DST Global, Morgan Creek
Capital Management, Nimble Ventures
Ojo Labs Austin, TX Mobile & Telecommunications
Mobile Software & Services $45M LiveOak Venture Partners, Royal Bank of
Canada
PerimeterX San Mateo, CA Internet Internet Software & Services $43M Adams Street Partners, Canaan Partners,
Data Collective
Saama Technologies Campbell, CA Software (non-internet/mobile)
Business Intelligence $40M Perceptive Advisors
Gong San Francisco, CA Internet Internet Software & Services $40M Battery Ventures, Norwest Venture
Partners, Cisco Investments
Expansion Stage
Early Stage
Later Stage
Seed Stage

PwC | CB Insights MoneyTree™ Report Q1 2019 20
Cybersecurity

PwC | CB Insights MoneyTree™ Report Q1 2019 21
Cybersecurity: US funding over timeCybersecurity funding was flat in Q1’19 at $1B
• Cybersecurity funding was flat, while deal activity declined slightly to 48 transactions
• The quarter was led by large funding rounds to content delivery network services provider Cloudflare ($150M Series E+) and identity and access management software OneLogin ($100M Series D).
$1,353 $1,083 $847 $599 $1,702 $1,086 $1,050 $1,082
6771
59
6970
53 51 48
0
10
20
30
40
50
60
70
80
Q2'17 Q3'17 Q4'17 Q1'18 Q2'18 Q3'18 Q4'18 Q1'19
Title
Investments ($M) Deals
PwC | CB Insights MoneyTree™ Report Q1 2019 22
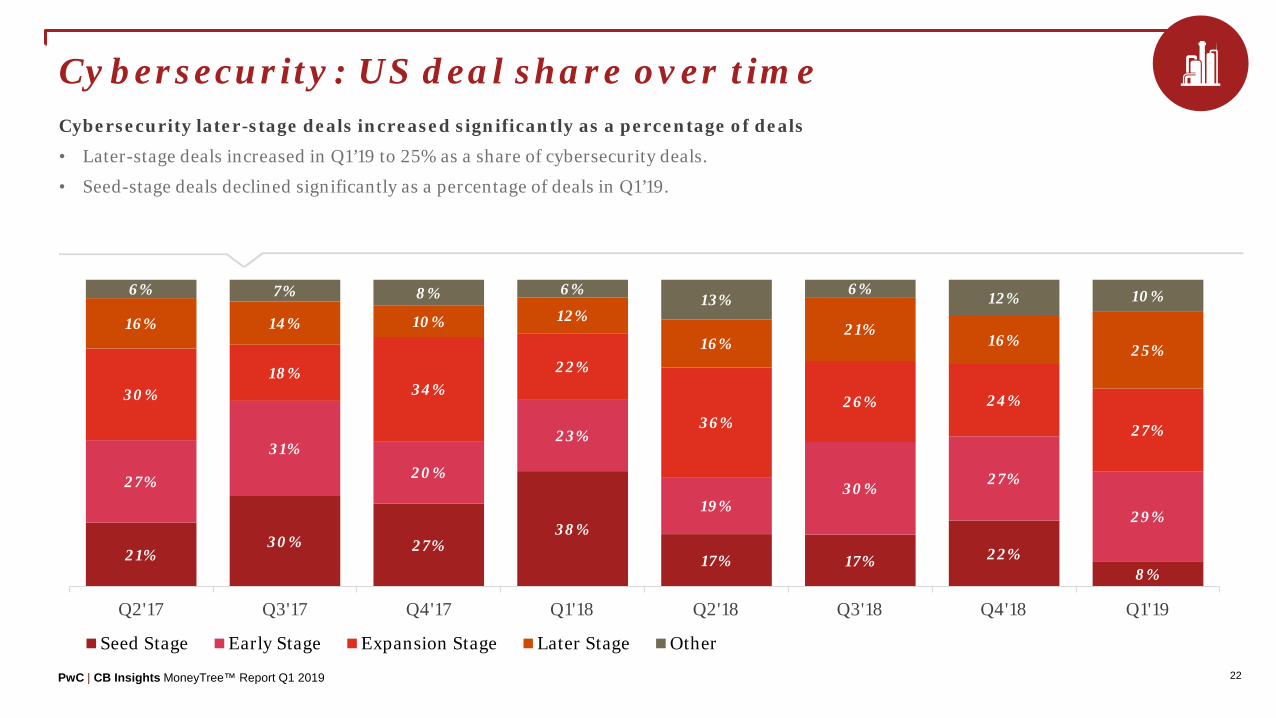
Cybersecurity: US deal share over timeCybersecurity later-stage deals increased significantly as a percentage of deals
• Later-stage deals increased in Q1’19 to 25% as a share of cybersecurity deals.
• Seed-stage deals declined significantly as a percentage of deals in Q1’19.
21%30% 27%
38%
17% 17% 22%8%
27%
31%20%
23%
19%30% 27%
29%
30%18%
34%22%
36%26% 24%
27%
16% 14% 10% 12%
16%21%
16% 25%
6% 7% 8% 6%13%
6% 12% 10%
Q2'17 Q3'17 Q4'17 Q1'18 Q2'18 Q3'18 Q4'18 Q1'19
Seed Stage Early Stage Expansion Stage Later Stage Other

PwC | CB Insights MoneyTree™ Report Q1 2019 23
Cybersecurity: Top states by deals
25 deals$733M Invested
1. CA
4 deals$111M Invested
3 deals$44M Invested
3. MA
3 deals$5M Invested
2. NY
3 deals$2M Invested
3. CO
3. FL
PwC | CB Insights MoneyTree™ Report Q1 2019 24
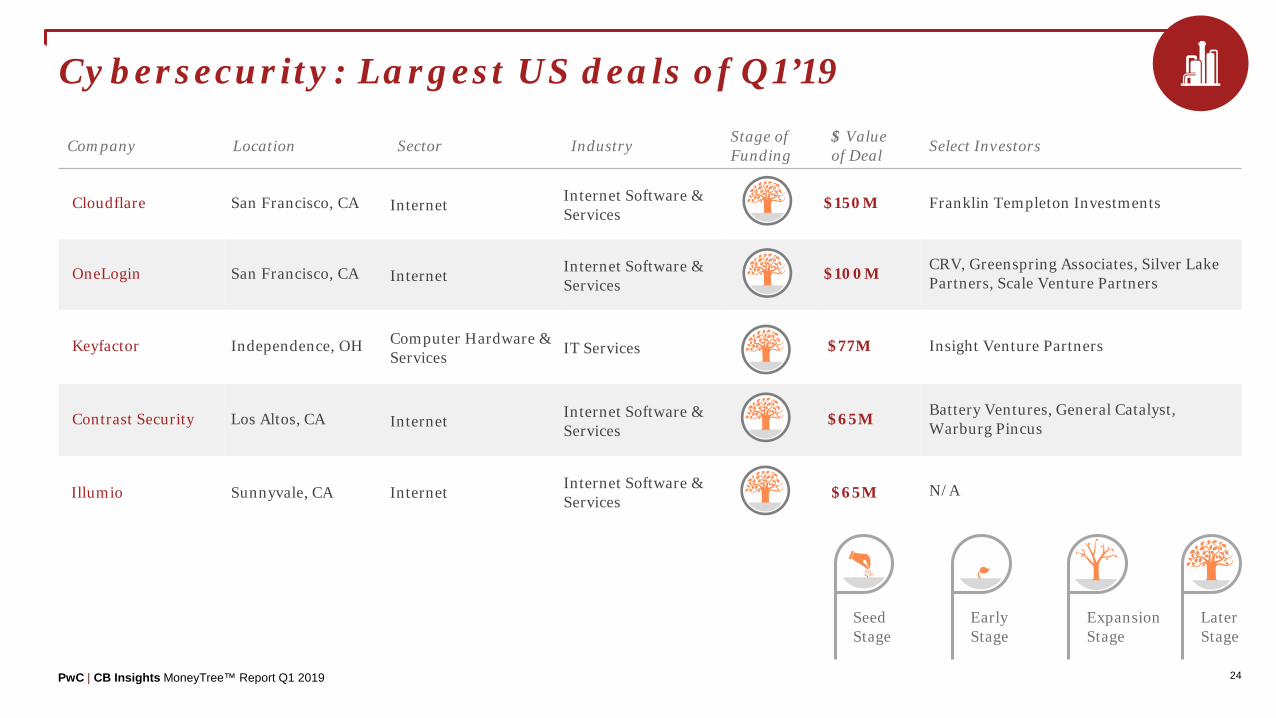
Cybersecurity: Largest US deals of Q1’19
Company Location Sector Industry Stage of Funding
$ Valueof Deal Select Investors
Cloudflare San Francisco, CA Internet Internet Software & Services
$150M Franklin Templeton Investments
OneLogin San Francisco, CA Internet Internet Software & Services
$100M CRV, Greenspring Associates, Silver Lake Partners, Scale Venture Partners
Keyfactor Independence, OH Computer Hardware & Services IT Services $77M Insight Venture Partners
Contrast Security Los Altos, CA Internet Internet Software & Services
$65M Battery Ventures, General Catalyst, Warburg Pincus
Illumio Sunnyvale, CA Internet Internet Software & Services $65M N/A
Expansion Stage
Early Stage
Later Stage
Seed Stage

PwC | CB Insights MoneyTree™ Report Q1 2019 25
FinTech
PwC | CB Insights MoneyTree™ Report Q1 2019 26
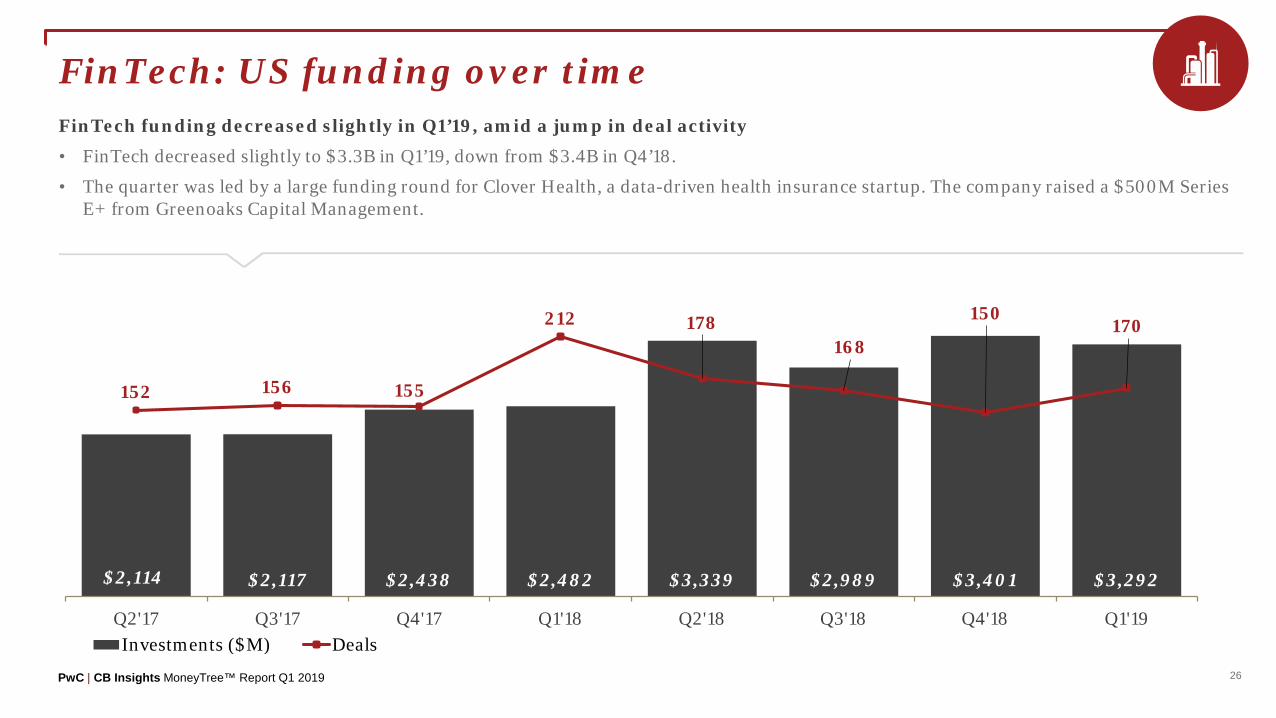
FinTech: US funding over timeFinTech funding decreased slightly in Q1’19, amid a jump in deal activity
• FinTech decreased slightly to $3.3B in Q1’19, down from $3.4B in Q4’18.
• The quarter was led by a large funding round for Clover Health, a data-driven health insurance startup. The company raised a $500M Series E+ from Greenoaks Capital Management.
$2,114 $2,117 $2,438 $2,482 $3,339 $2,989 $3,401 $3,292
152 156 155
212 178168
150170
0
50
100
150
200
250
Q2'17 Q3'17 Q4'17 Q1'18 Q2'18 Q3'18 Q4'18 Q1'19
Title
Investments ($M) Deals

PwC | CB Insights MoneyTree™ Report Q1 2019 27
FinTech: US deal share over timeFinTech deal share was largely flat in Q1’19
• Despite no significant fluctuations, early-stage and “other” deal shares decreased slightly.
• While later-stage deal share was only 8% of FinTech deals in Q1’19, the category accounted for close to $1.4B in funding during the quarter, around 42% of total FinTech funding.
38% 38% 35% 37%26% 26% 27% 27%
28% 20% 26% 25%29% 32% 29% 28%
17%21% 20% 18%
21% 23% 25% 25%
8% 12% 8% 9% 11% 10% 8% 8%
9% 9% 10% 10% 13% 10% 12% 11%
Q2'17 Q3'17 Q4'17 Q1'18 Q2'18 Q3'18 Q4'18 Q1'19
Seed Stage Early Stage Expansion Stage Later Stage Other

PwC | CB Insights MoneyTree™ Report Q1 2019 28
FinTech: Top states by deals
51 deals$1,253M Invested
1. CA
43 deals$575M Invested
14 deals$399M Invested
2. NY
3. MA

PwC | CB Insights MoneyTree™ Report Q1 2019 29
FinTech: Largest US deals of Q1’19Company Location Sector Industry Stage of
Funding$ Valueof Deal Select Investors
Clover Health Jersey City, NJ HealthcareMedical Facilities & Services
$500M Greenoaks Capital Management
Toast Boston, MA InternetInternet Software & Services
$250M Bessemer Venture Partners, T. Rowe Price, Technology Crossover Ventures
States Title San Francisco, CA InternetInternet Software & Services
$240M Undisclosed Investors
Chime San Francisco, CA Mobile & Telecommunications
Mobile Software & Services
$200M Cathay Innovation, Forerunner Ventures, ICONIQ Capital
Acorns Irvine, CA Mobile & Telecommunications
Mobile Software & Services
$105M Bain Capital Ventures, BlackRock, Comcast Ventures
Expansion Stage
Early Stage
Later Stage
Seed Stage

US Places03

PwC | CB Insights MoneyTree™ Report Q1 2019
$7,105M
31
US top five regions of Q1’19 by deals
98
118
131
205
236San Francisco (N. Bay Area)
New York Metro
New England
Silicon Valley (S. Bay Area)
Midwest
$4,455M
$2,758M
$4,333M
$664M
PwC | CB Insights MoneyTree™ Report Q1 2019 32
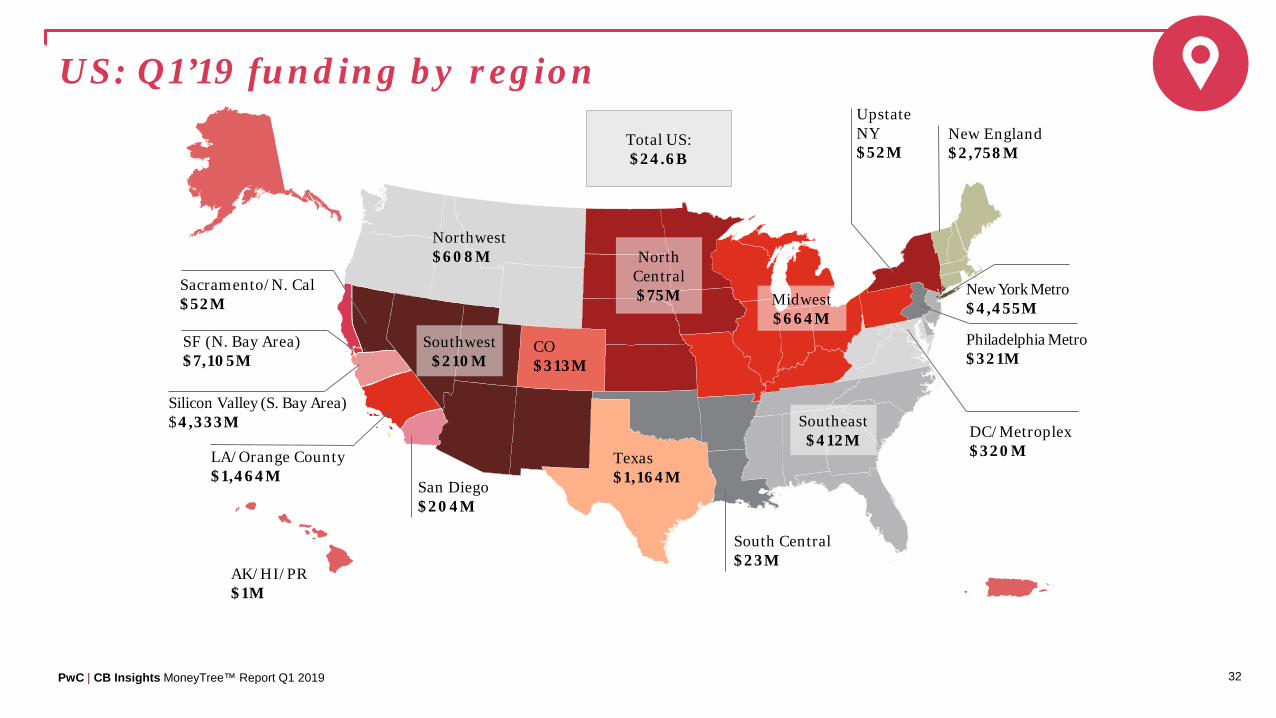
US: Q1’19 funding by region
Total US:$24.6B
SF (N. Bay Area)$7,105M
Northwest$608M
AK/HI/PR$1M
North Central$75M
Southeast$412M
CO$313M
Texas$1,164M
New England$2,758M
Midwest$664M
New York Metro$4,455M
Upstate NY$52M
DC/Metroplex$320MLA/Orange County
$1,464M
Philadelphia Metro$321M
Silicon Valley (S. Bay Area)$4,333M
San Diego$204M
Sacramento/N. Cal$52M
Southwest$210M
South Central$23M

PwC | CB Insights MoneyTree™ Report Q1 2019 33
US: Q1’19 deals by region
SF (N. Bay Area)236 Deals
Northwest63 Deals
AK/HI/PR3 Deals
North Central
24 Deals
Southeast65 Deals
CO40 Deals
Texas66 Deals
New England131 Deals
Midwest98 Deals
New York Metro205 Deals
Upstate NY7 Deals
DC/Metroplex48 DealsLA/Orange County
72 Deals
Philadelphia Metro31 Deals
Silicon Valley (S. Bay Area)118 Deals
San Diego20 Deals
Sacramento/N. Cal9 Deals
Southwest18 Deals
South Central5 Deals
Total US:1,279 Deals

PwC | CB Insights MoneyTree™ Report Q1 2019 34
8-quarter financing trend: San Francisco (North Bay Area)San Francisco funding fell compared to Q4’18, but stayed within its historical range
• San Francisco startups raised $7B over 236 deals in Q1’19.
• Q4’18 funding was pushed up by a $13B corporate minority investment in vape maker JUUL Labs.
$4,243 $3,855 $5,768 $6,716 $6,034 $8,890 $19,702 $7,105
277 290263
318 311278 256
236
Q2'17 Q3'17 Q4'17 Q1'18 Q2'18 Q3'18 Q4'18 Q1'19
Title
Investments ($M) Deals
PwC | CB Insights MoneyTree™ Report Q1 2019 35
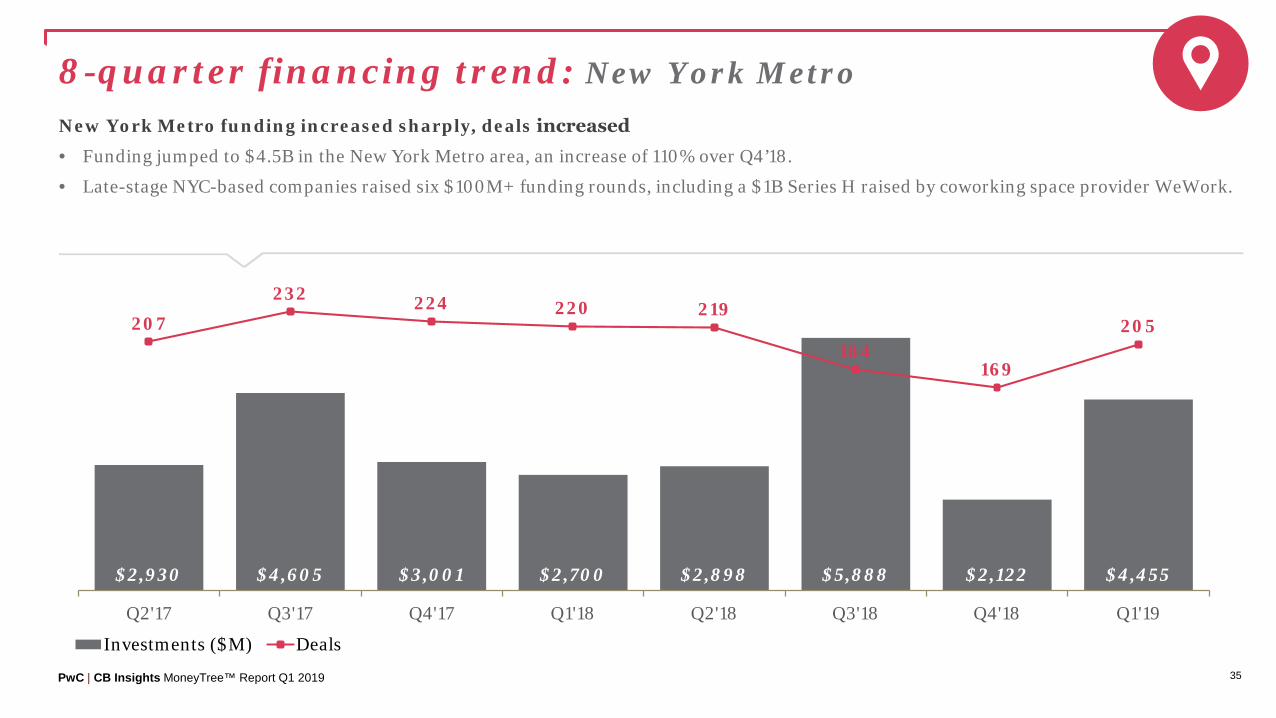
8-quarter financing trend: New York MetroNew York Metro funding increased sharply, deals increased
• Funding jumped to $4.5B in the New York Metro area, an increase of 110% over Q4’18.
• Late-stage NYC-based companies raised six $100M+ funding rounds, including a $1B Series H raised by coworking space provider WeWork.
$2,930 $4,605 $3,001 $2,700 $2,898 $5,888 $2,122 $4,455
207232 224 220 219
184169
205
Q2'17 Q3'17 Q4'17 Q1'18 Q2'18 Q3'18 Q4'18 Q1'19
Title
Investments ($M) Deals
PwC | CB Insights MoneyTree™ Report Q1 2019 36
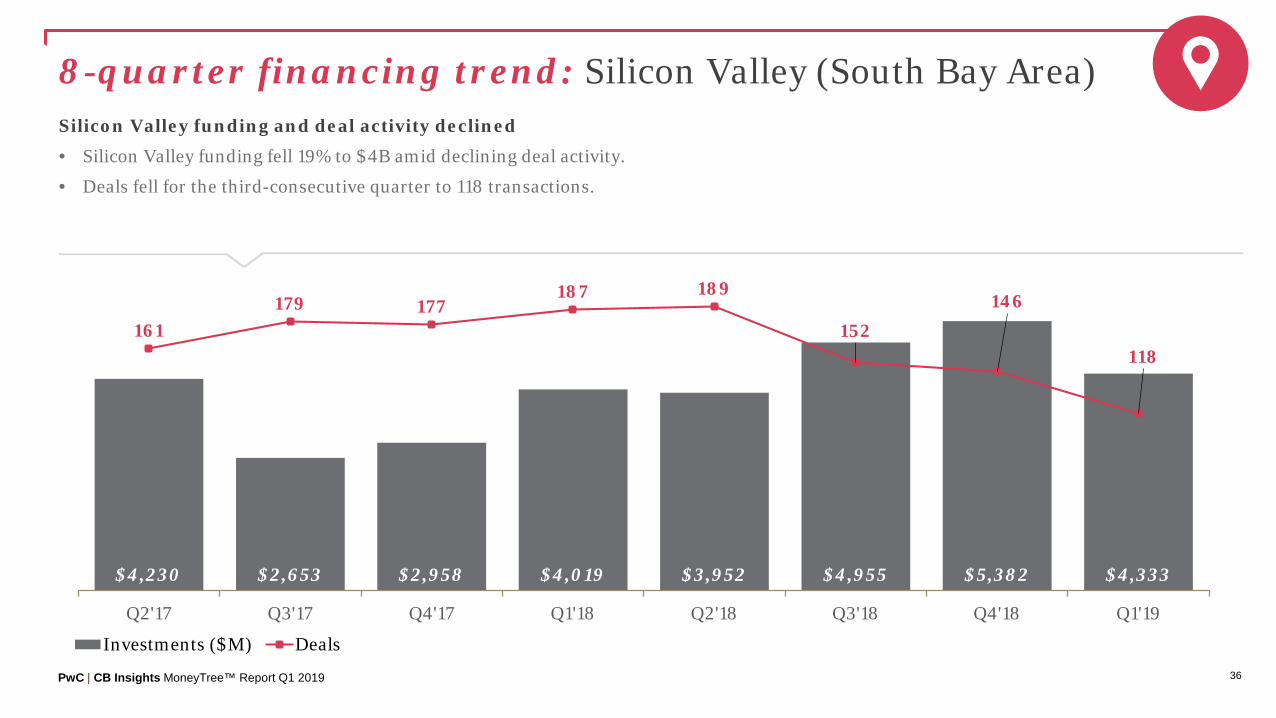
8-quarter financing trend: Silicon Valley (South Bay Area)Silicon Valley funding and deal activity declined
• Silicon Valley funding fell 19% to $4B amid declining deal activity.
• Deals fell for the third-consecutive quarter to 118 transactions.
$4,230 $2,653 $2,958 $4,019 $3,952 $4,955 $5,382 $4,333
161179 177
187 189
152146
118
Q2'17 Q3'17 Q4'17 Q1'18 Q2'18 Q3'18 Q4'18 Q1'19
Title
Investments ($M) Deals
PwC | CB Insights MoneyTree™ Report Q1 2019 37
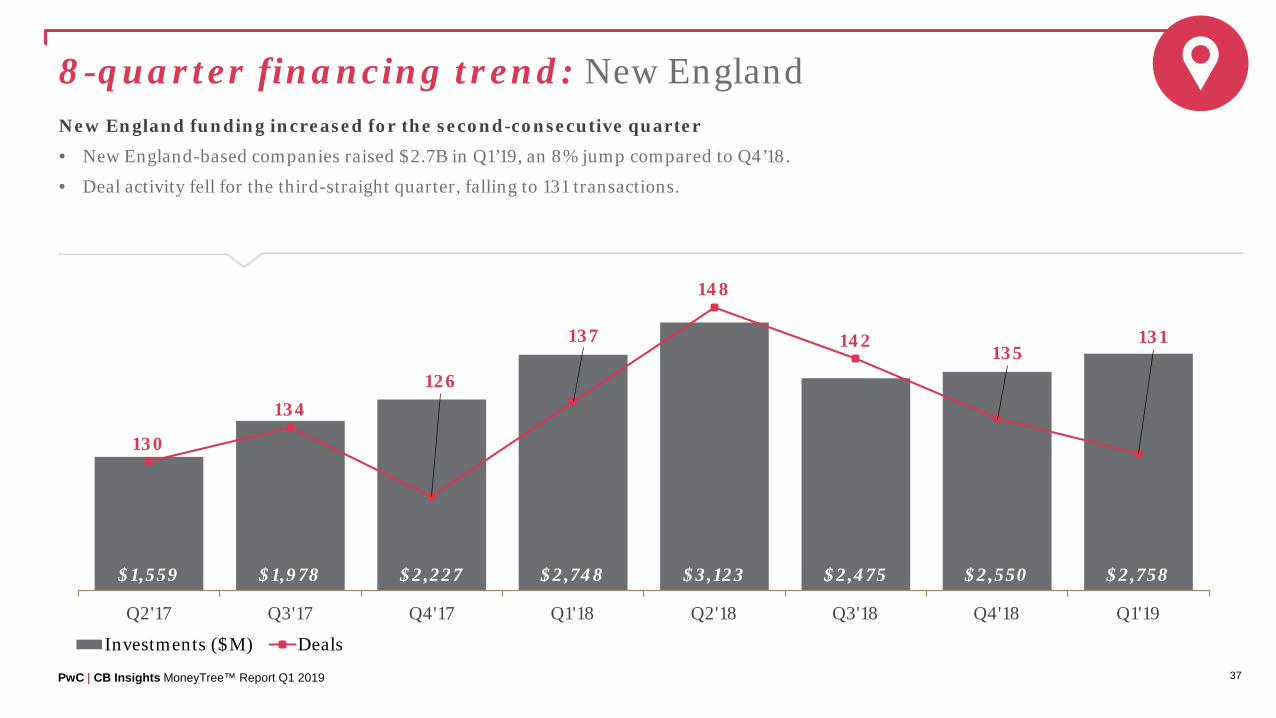
8-quarter financing trend: New EnglandNew England funding increased for the second-consecutive quarter
• New England-based companies raised $2.7B in Q1’19, an 8% jump compared to Q4’18.
• Deal activity fell for the third-straight quarter, falling to 131 transactions.
$1,559 $1,978 $2,227 $2,748 $3,123 $2,475 $2,550 $2,758
130
134126
137
148
142135
131
Q2'17 Q3'17 Q4'17 Q1'18 Q2'18 Q3'18 Q4'18 Q1'19
Title
Investments ($M) Deals
PwC | CB Insights MoneyTree™ Report Q1 2019 38
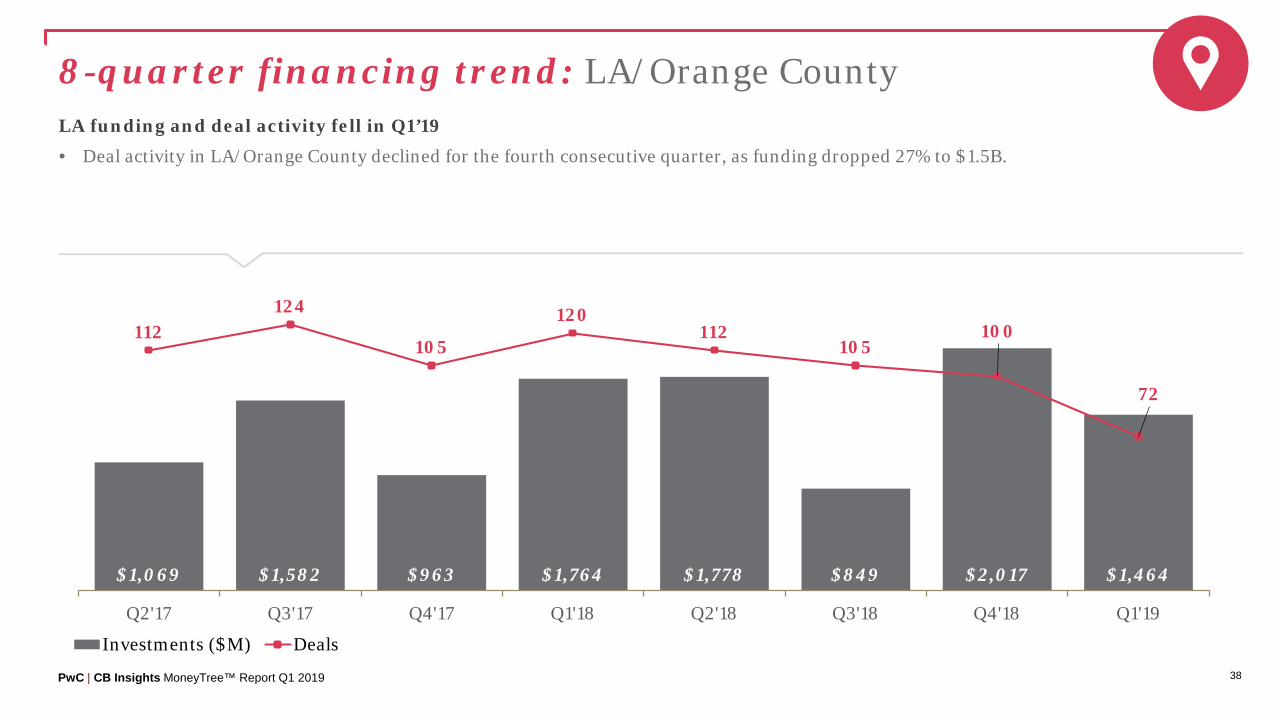
8-quarter financing trend: LA/Orange CountyLA funding and deal activity fell in Q1’19
• Deal activity in LA/Orange County declined for the fourth consecutive quarter, as funding dropped 27% to $1.5B.
$1,069 $1,582 $963 $1,764 $1,778 $849 $2,017 $1,464
112124
105
120112
105100
72
Q2'17 Q3'17 Q4'17 Q1'18 Q2'18 Q3'18 Q4'18 Q1'19
Title
Investments ($M) Deals
PwC | CB Insights MoneyTree™ Report Q1 2019 39
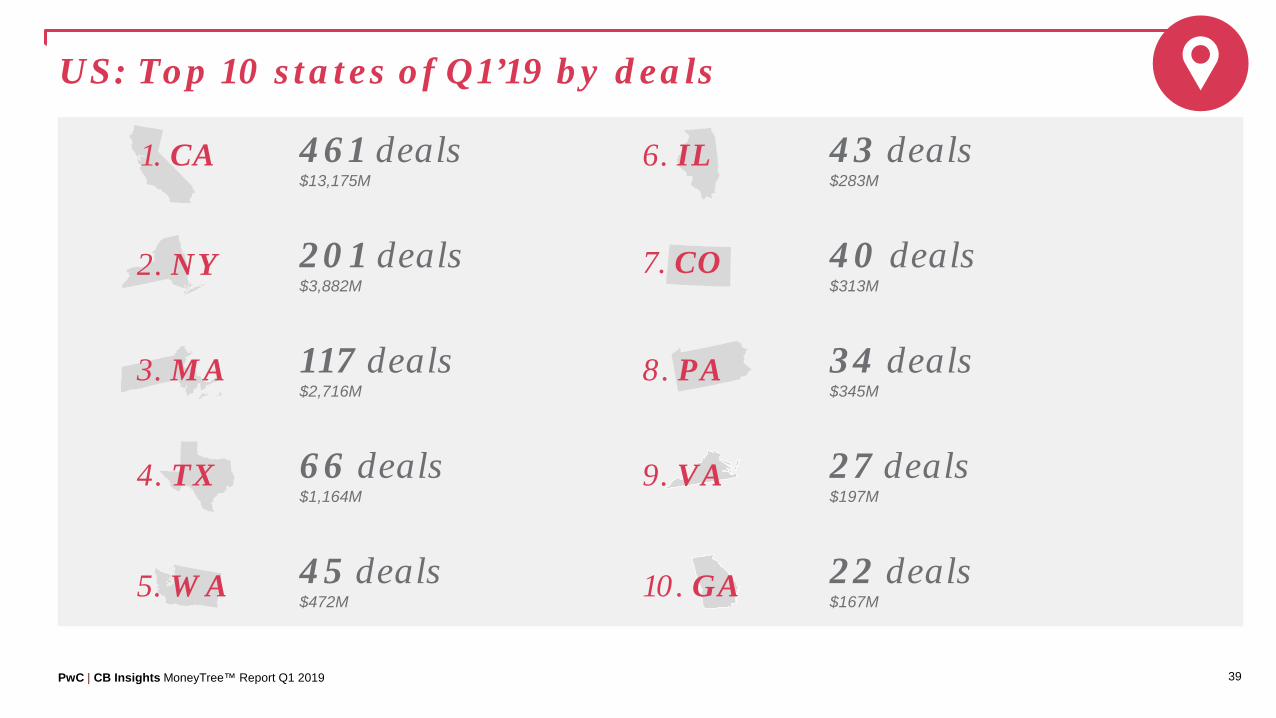
US: Top 10 states of Q1’19 by deals
461 deals$13,175M
201 deals$3,882M
117 deals$2,716M
66 deals$1,164M
45 deals$472M
1. CA
2. NY
3. MA
4. TX
5. WA
6. IL 43 deals$283M
40 deals$313M
34 deals$345M
27 deals$197M
22 deals$167M
7. CO
8. PA
9. VA
10. GA
PwC | CB Insights MoneyTree™ Report Q1 2019 40
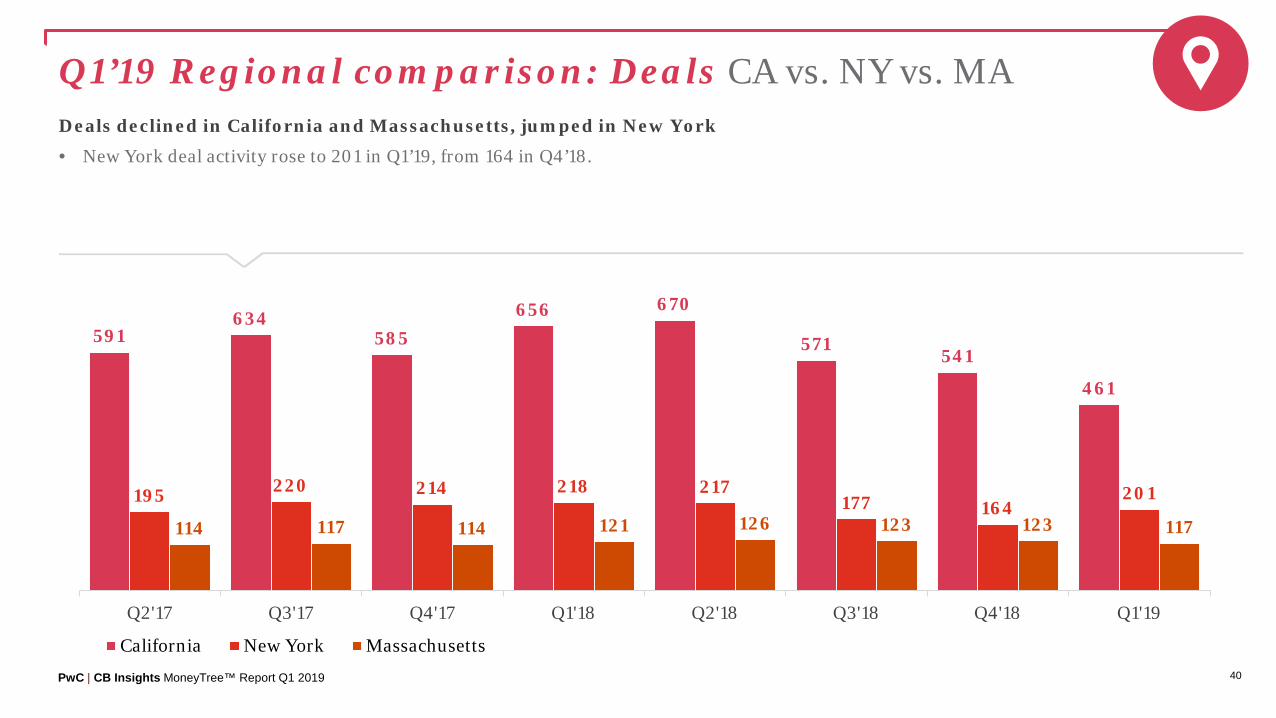
Q1’19 Regional comparison: Deals CA vs. NY vs. MADeals declined in California and Massachusetts, jumped in New York
• New York deal activity rose to 201 in Q1’19, from 164 in Q4’18.
591634
585656 670
571541
461
195 220 214 218 217177 164
201
114 117 114 121 126 123 123 117
Q2'17 Q3'17 Q4'17 Q1'18 Q2'18 Q3'18 Q4'18 Q1'19
California New York Massachusetts
PwC | CB Insights MoneyTree™ Report Q1 2019 41
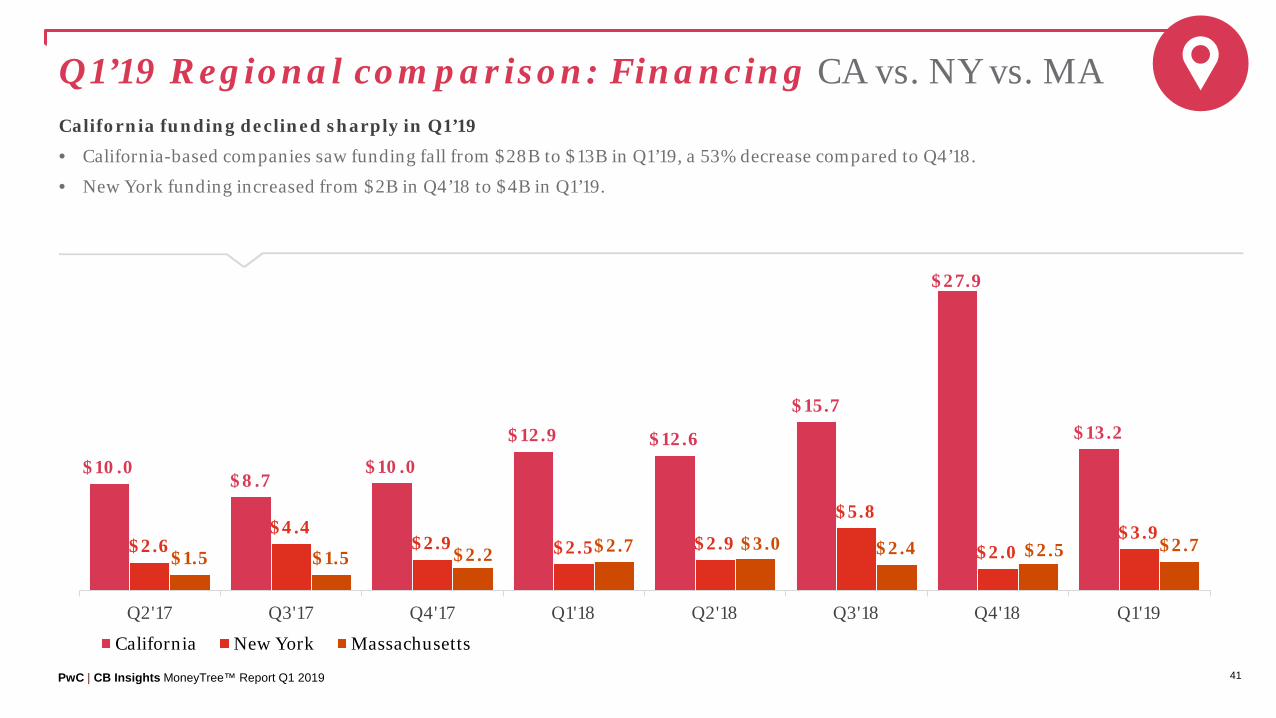
Q1’19 Regional comparison: Financing CA vs. NY vs. MACalifornia funding declined sharply in Q1’19
• California-based companies saw funding fall from $28B to $13B in Q1’19, a 53% decrease compared to Q4’18.
• New York funding increased from $2B in Q4’18 to $4B in Q1’19.
$10.0$8.7
$10.0
$12.9 $12.6
$15.7
$27.9
$13.2
$2.6$4.4
$2.9 $2.5 $2.9
$5.8
$2.0$3.9
$1.5 $1.5 $2.2 $2.7 $3.0 $2.4 $2.5 $2.7
Q2'17 Q3'17 Q4'17 Q1'18 Q2'18 Q3'18 Q4'18 Q1'19
California New York Massachusetts

US Movers & Shakers04

PwC | CB Insights MoneyTree™ Report Q1 2019 43
Mega-rounds
”
The prevalence of mega deals - characterized as rounds greater than $100 million - continues to shape the VC landscape.
“
— Tom Ciccolella, Partner, US Ventures Leader at PwC

PwC | CB Insights MoneyTree™ Report Q1 2019 44
Largest US deals of Q1’19
Company Location Sector Industry Stage of Funding
$ Valueof Deal Select Investors
WeWork New York, NY Business Products & Services Facilities $1,000M SoftBank Group
Flexport San Francisco, CA Internet Internet Software & Services $1,000M SoftBank Group, Founders Fund, Cherubic
Ventures
Nuro Mountain View, CA Automotive & Transportation
Automobile Manufacturing $940M SoftBank Group
Aurora Palo Alto, CA Automotive & Transportation
Automobile Manufacturing $530M Amazon, Greylock Partners, Lightspeed
Venture Partners, Sequoia Capital
Clover Health Jersey City, NJ Healthcare Medical Facilities & Services $500M Greenoaks Capital Management
DoorDash San Francisco, CA Internet eCommerce $400M Sequoia Capital, SoftBank Group, Y Combinator
Expansion Stage
Early Stage
Later Stage
Seed Stage

PwC | CB Insights MoneyTree™ Report Q1 2019 45
US mega-round activityUS $100M+ rounds fell, but remained at elevated levels
• US-based companies saw another big quarter for mega-rounds, raising 46 $100M+ rounds, down from the Q3’18 record but still elevated.
• Later-stage companies raised several massive funding rounds in Q1’19, including two $1B rounds by coworking provider WeWork and freight forwarding startup Flexport.
34 32 35 33 48 56 51 460.0
10.0
20.0
30.0
40.0
50.0
60.0
Q2'17 Q3'17 Q4'17 Q1'18 Q2'18 Q3'18 Q4'18 Q1'19
Mega-rounds Into US VC-Backed Companies

PwC | CB Insights MoneyTree™ Report Q1 2019 46
8-quarter US mega-round trendMega-rounds fell from record percentage of total US funding
• Mega-rounds accounted for 45% of all US VC funding, down from a record 64% in Q4’18.
• Mega-rounds were largely raised by late-stage companies, though there were three early stage $100M+ rounds in Q1’19.
$7.0 $8.5 $7.6 $7.9 $8.2 $14.8 $24.7 $11.1
$12.6 $12.3 $12.4 $14.9 $16.3
$14.2
$13.9
$13.5
36%41% 38% 35%
34%
51%
64%
45%
Q2'17 Q3'17 Q4'17 Q1'18 Q2'18 Q3'18 Q4'18 Q1'19
Mega-round funding ($B) Non Mega-round funding ($B) % Mega-rounds funding

PwC | CB Insights MoneyTree™ Report Q1 2019 47
US new unicorn births10 new unicorns were created in Q1’19
• 10 US companies saw their valuations rise to $1B+ in Q1’19.
• New $1B+ valuations included mattress startup Casper and direct-to-consumer beauty company Glossier.
108 7 7 8
17
21
10
Q2'17 Q3'17 Q4'17 Q1'18 Q2'18 Q3'18 Q4'18 Q1'19
US New VC-backed Unicorns
PwC | CB Insights MoneyTree™ Report Q1 2019 48
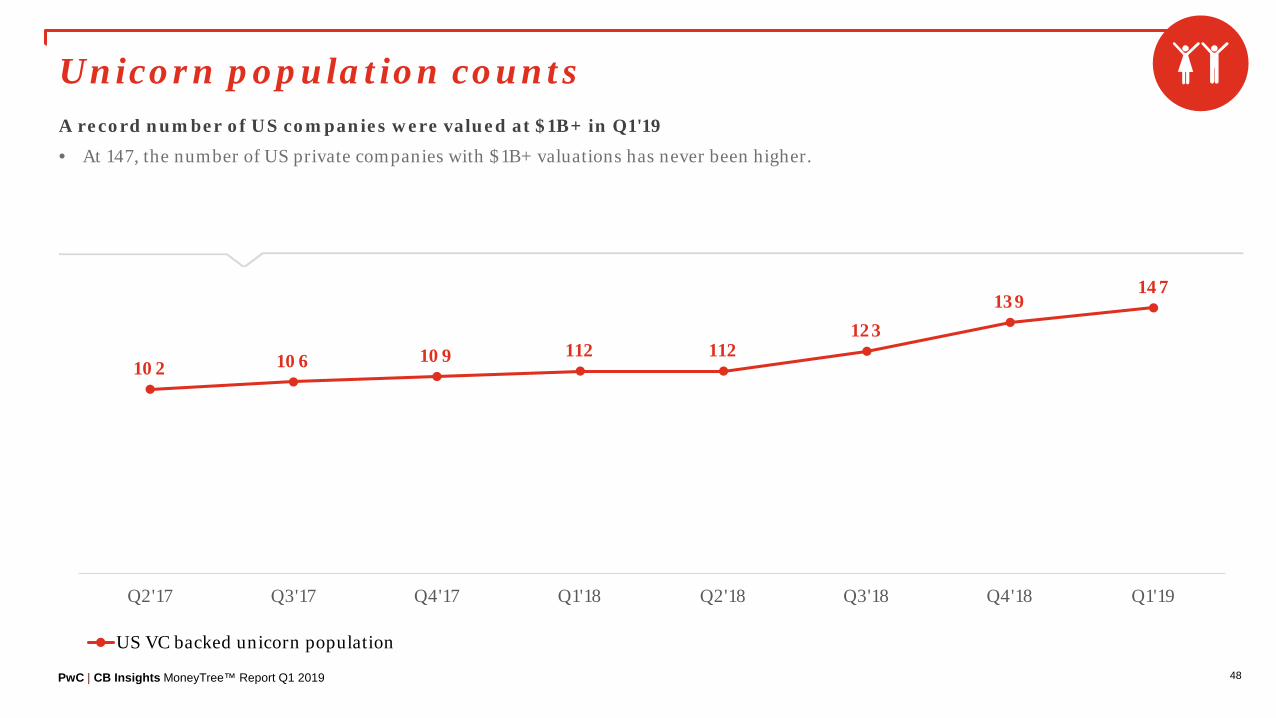
Unicorn population countsA record number of US companies were valued at $1B+ in Q1'19
• At 147, the number of US private companies with $1B+ valuations has never been higher.
102 106 109 112 112123
139147
Q2'17 Q3'17 Q4'17 Q1'18 Q2'18 Q3'18 Q4'18 Q1'19
US VC backed unicorn population
PwC | CB Insights MoneyTree™ Report Q1 2019 49
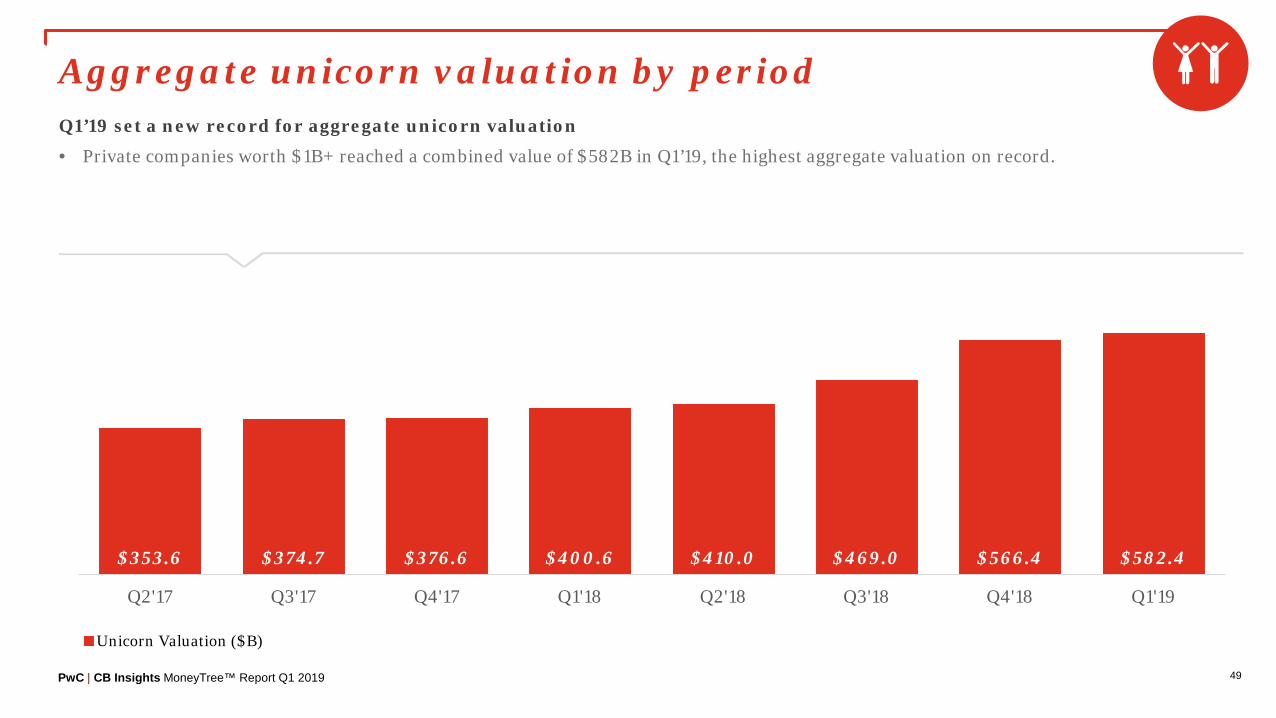
Aggregate unicorn valuation by periodQ1’19 set a new record for aggregate unicorn valuation
• Private companies worth $1B+ reached a combined value of $582B in Q1’19, the highest aggregate valuation on record.
$353.6 $374.7 $376.6 $400.6 $410.0 $469.0 $566.4 $582.4
Q2'17 Q3'17 Q4'17 Q1'18 Q2'18 Q3'18 Q4'18 Q1'19
Unicorn Valuation ($B)
PwC | CB Insights MoneyTree™ Report Q1 2019 50
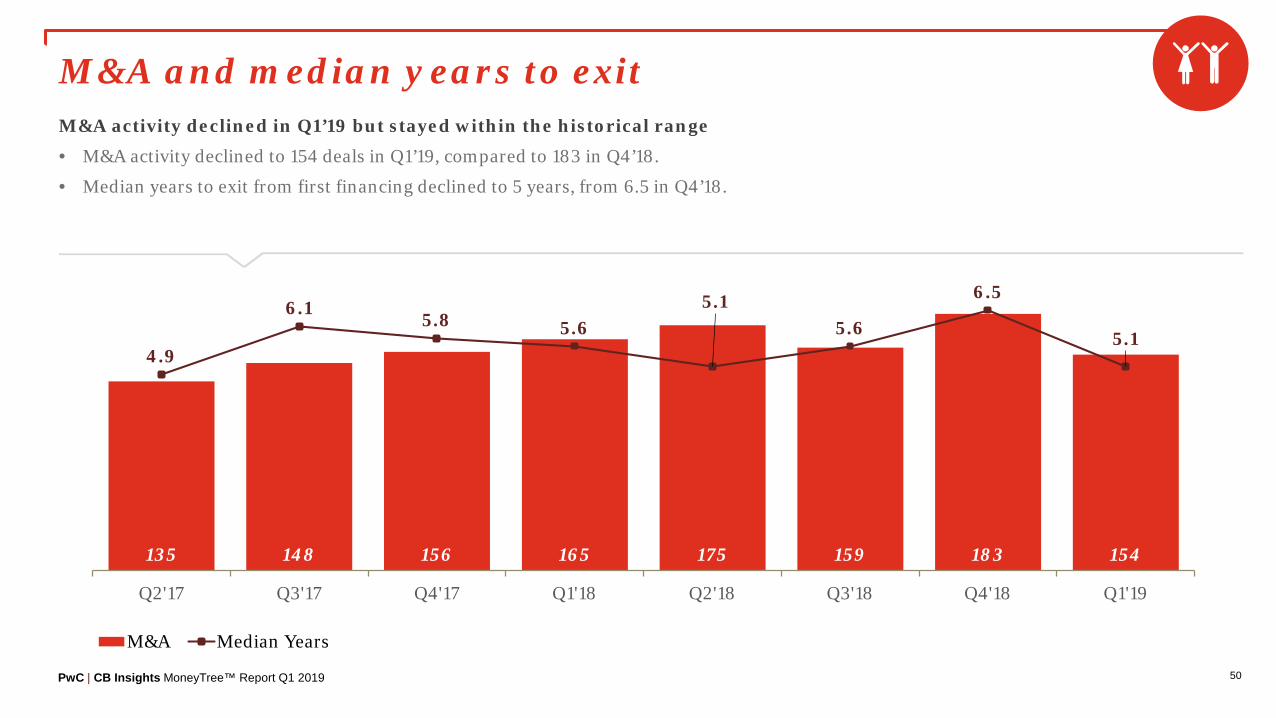
M&A and median years to exitM&A activity declined in Q1’19 but stayed within the historical range
• M&A activity declined to 154 deals in Q1’19, compared to 183 in Q4’18.
• Median years to exit from first financing declined to 5 years, from 6.5 in Q4’18.
135 148 156 165 175 159 183 154
4.9
6.1 5.8 5.65.1
5.6
6.5
5.1
0
1
2
3
4
5
6
7
Q2'17 Q3'17 Q4'17 Q1'18 Q2'18 Q3'18 Q4'18 Q1'19
Title
M&A Median Years
PwC | CB Insights MoneyTree™ Report Q1 2019 51
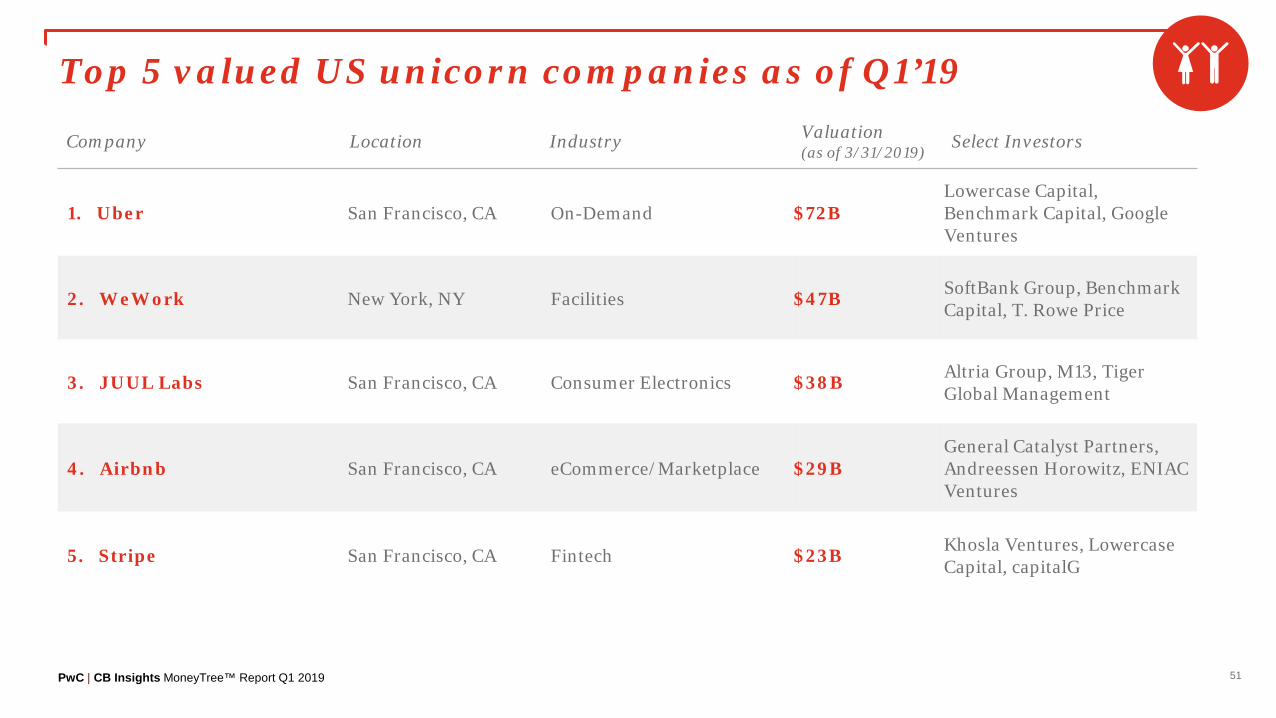
Top 5 valued US unicorn companies as of Q1’19
Company Location Industry Valuation (as of 3/31/2019)
Select Investors
1. Uber San Francisco, CA On-Demand $72BLowercase Capital, Benchmark Capital, Google Ventures
2. WeWork New York, NY Facilities $47B SoftBank Group, Benchmark Capital, T. Rowe Price
3. JUUL Labs San Francisco, CA Consumer Electronics $38B Altria Group, M13, Tiger Global Management
4. Airbnb San Francisco, CA eCommerce/Marketplace $29BGeneral Catalyst Partners, Andreessen Horowitz, ENIAC Ventures
5. Stripe San Francisco, CA Fintech $23B Khosla Ventures, Lowercase Capital, capitalG
PwC | CB Insights MoneyTree™ Report Q1 2019 52
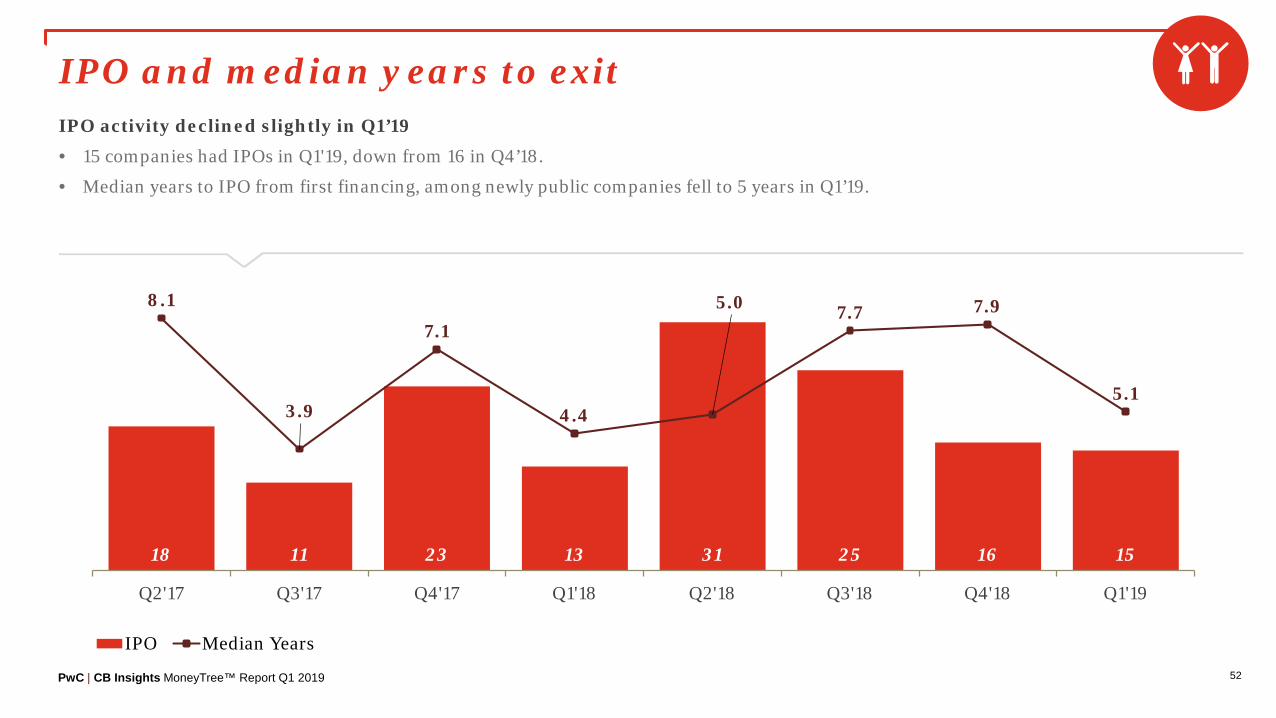
IPO and median years to exitIPO activity declined slightly in Q1’19
• 15 companies had IPOs in Q1'19, down from 16 in Q4’18.
• Median years to IPO from first financing, among newly public companies fell to 5 years in Q1’19.
18 11 23 13 31 25 16 15
8.1
3.9
7.1
4.4
5.0 7.7 7.9
5.1
0
1
2
3
4
5
6
7
8
9
Q2'17 Q3'17 Q4'17 Q1'18 Q2'18 Q3'18 Q4'18 Q1'19
Title
IPO Median Years

PwC | CB Insights MoneyTree™ Report Q1 2019 53
Largest US IPOs of Q1’19
Company Location Sector Industry $ Valuation at IPO
Lyft San Francisco, CA Mobile & Telecommunications Mobile Commerce $24.3B
Alector South San Francisco, CA Healthcare Biotechnology $1.2B
Gossamer Bio San Diego, CA Healthcare Drug Discovery $966M
Precision BioSciences Durham, NC Healthcare Biotechnology $784M
Kaleido Biosciences Bedford, MA Healthcare Biotechnology $441M
PwC | CB Insights MoneyTree™ Report Q1 2019 54
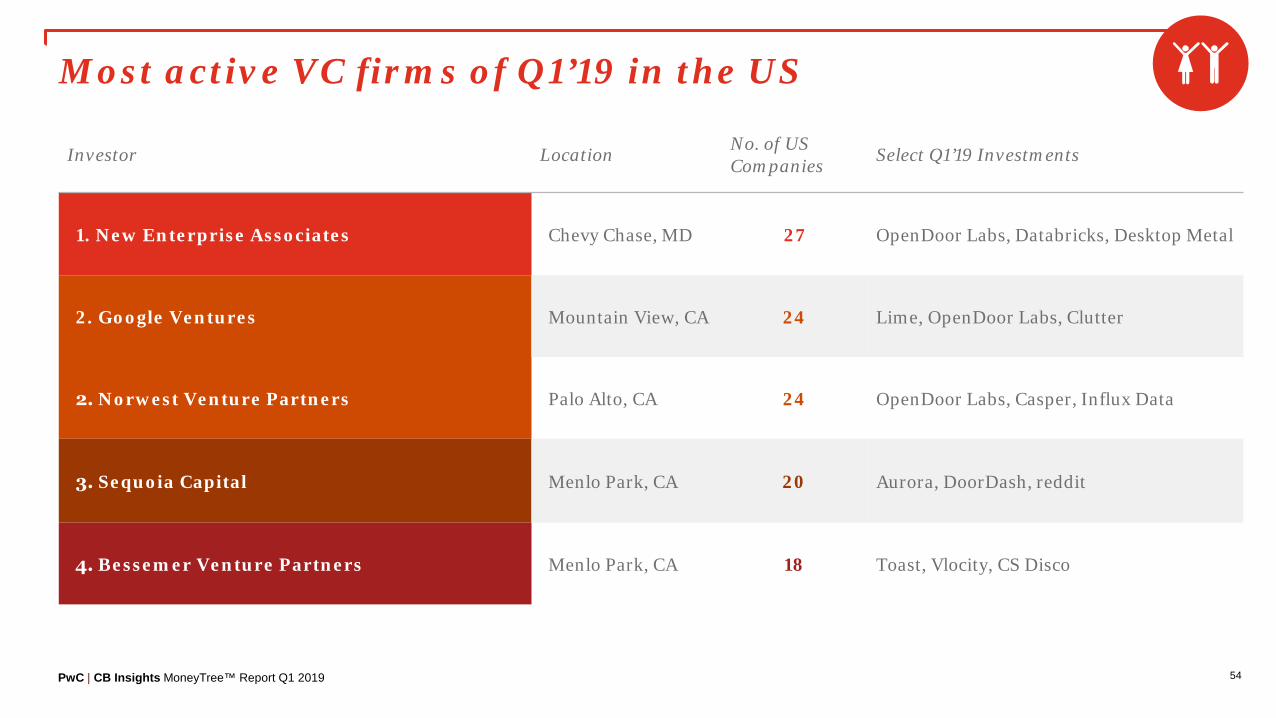
Most active VC firms of Q1’19 in the US
Investor Location No. of US Companies Select Q1’19 Investments
1. New Enterprise Associates Chevy Chase, MD 27 OpenDoor Labs, Databricks, Desktop Metal
2. Google Ventures Mountain View, CA 24 Lime, OpenDoor Labs, Clutter
Palo Alto, CA 24 OpenDoor Labs, Casper, Influx Data
Menlo Park, CA 20 Aurora, DoorDash, reddit
2. Norwest Venture Partners
3. Sequoia Capital
4. Bessemer Venture Partners Menlo Park, CA 18 Toast, Vlocity, CS Disco

PwC | CB Insights MoneyTree™ Report Q1 2019
Stage of funding
Location of investors
Seed Total number of seed stage deals: 221
Early Total number of early stage deals: 324
Expansion Total number of expansion stage deals: 385
Later Total number of later stage deals: 177
55
Q1’19 investor locationsCalifornia investor presence most prominent across all stages
• California and New York investors dominated the later-stage deals that have driven US funding to record levels.
• Funding was more geographically diverse at earlier stages, with other US states and international investors accounting for more deals.
26%
32%
36%
38%
13%
11%
12%
13%
3%
3%
3%
1%
26%
28%
25%
27%
33%
25%
25%
22%
California New York Illinois Other US International
PwC | CB Insights MoneyTree™ Report Q1 2019 56
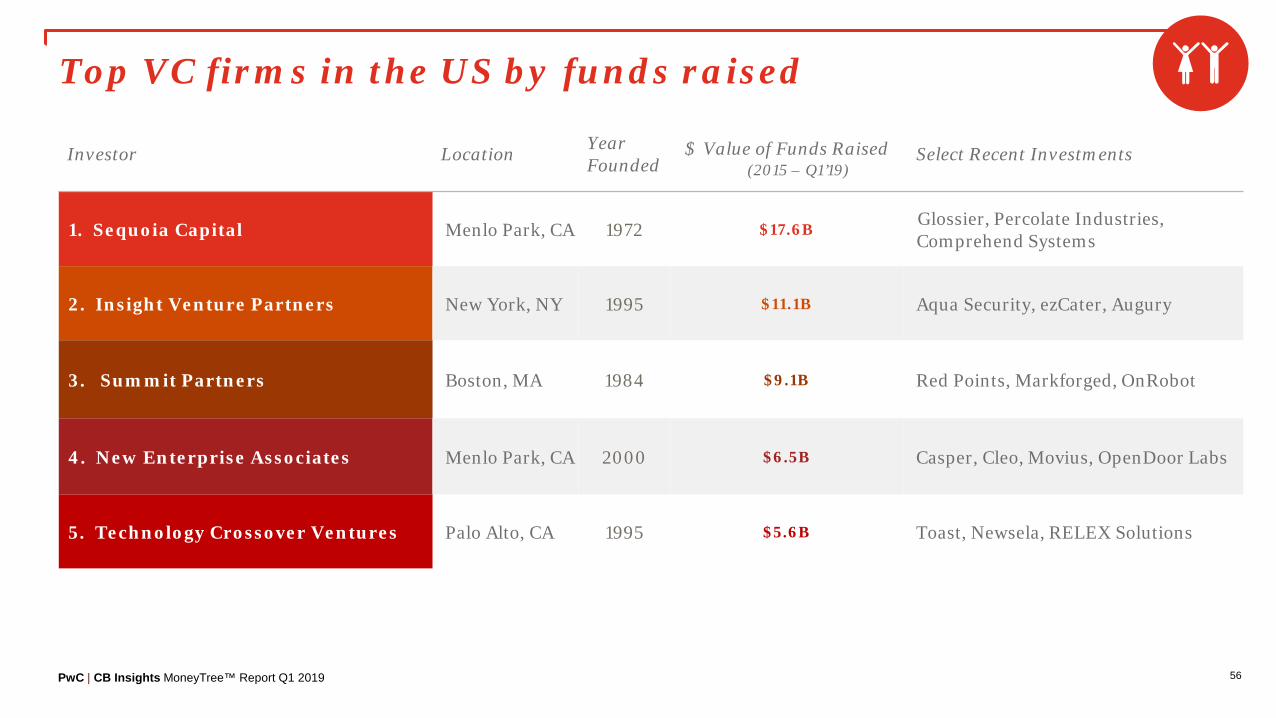
Top VC firms in the US by funds raised
Investor Location Year Founded
$ Value of Funds Raised(2015 – Q1’19)
Select Recent Investments
1. Sequoia Capital Menlo Park, CA 1972 $17.6B Glossier, Percolate Industries, Comprehend Systems
2. Insight Venture Partners New York, NY 1995 $11.1B Aqua Security, ezCater, Augury
3. Summit Partners Boston, MA 1984 $9.1B Red Points, Markforged, OnRobot
4. New Enterprise Associates Menlo Park, CA 2000 $6.5B Casper, Cleo, Movius, OpenDoor Labs
5. Technology Crossover Ventures Palo Alto, CA 1995 $5.6B Toast, Newsela, RELEX Solutions

Global Trends05

PwC | CB Insights MoneyTree™ Report Q1 2019 58
Q1’19 Global regional comparison
Deals
Deals
1,375$25.6B
1,128$18.4B724
$7.7B
3,327 Deals$52.2B Invested
Globally

PwC | CB Insights MoneyTree™ Report Q1 2019 59
8-quarter global financing trendGlobal funding and deal activity fell in Q1’19
• Global funding fell 22% in Q1’19 to $52B.
• Deals declined compared to Q4, falling to 3,327 from 3,508.
$45.2 $48.0 $48.7 $49.4 $54.1 $55.3 $67.0 $52.2
3,2783,483 3,475 3,601
4,1683,873 3,508
3,327
Q2'17 Q3'17 Q4'17 Q1'18 Q2'18 Q3'18 Q4'18 Q1'19
Investments ($B) Deals
PwC | CB Insights MoneyTree™ Report Q1 2019 60
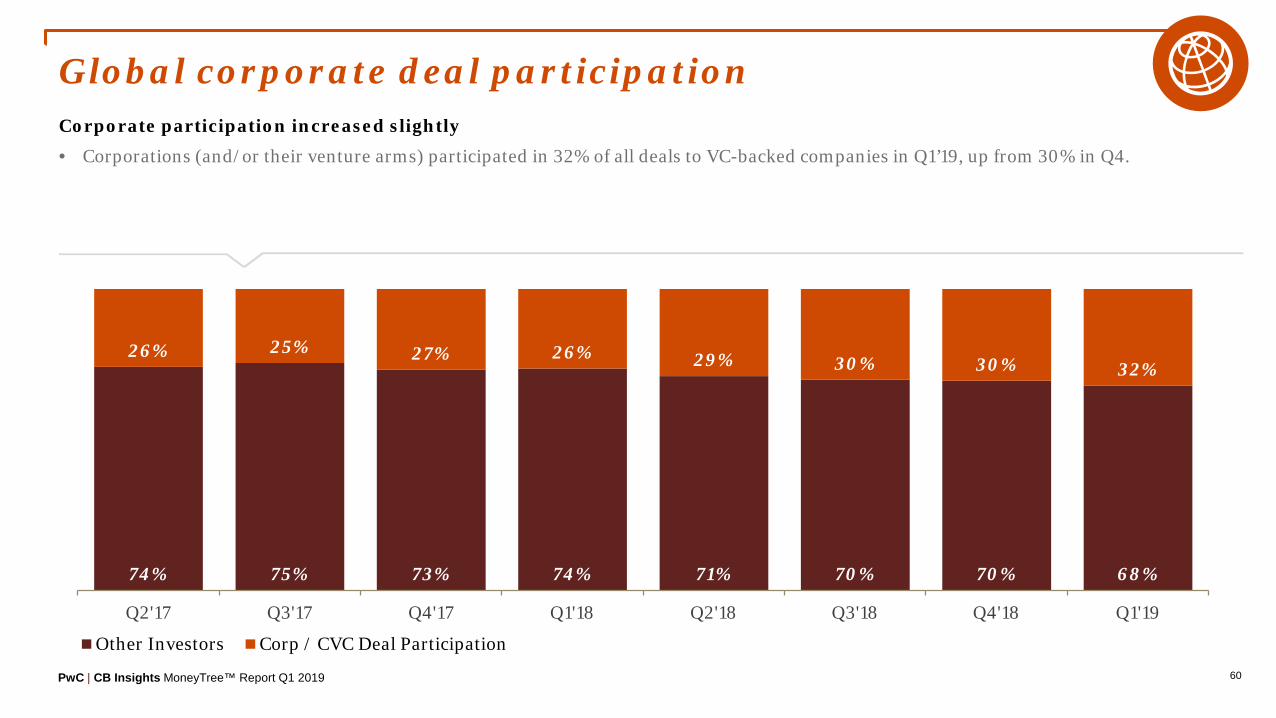
Global corporate deal participationCorporate participation increased slightly
• Corporations (and/or their venture arms) participated in 32% of all deals to VC-backed companies in Q1’19, up from 30% in Q4.
74% 75% 73% 74% 71% 70% 70% 68%
26% 25% 27% 26% 29% 30% 30% 32%
Q2'17 Q3'17 Q4'17 Q1'18 Q2'18 Q3'18 Q4'18 Q1'19
Other Investors Corp / CVC Deal Participation

PwC | CB Insights MoneyTree™ Report Q1 2019 61
8-quarter financing trend: North AmericaNorth American funding and deal activity fell in Q1’19
• VC-backed companies in North America raised $26B in Q1’19, down 36% compared to Q4’18.
• Deal activity declined slightly compared to Q4’18, falling to 1,375.
$20.1 $21.7 $20.6 $23.6 $25.5 $29.4 $39.7 $25.6
1,5611,663
1,5171,646
1,760
1,5361,424 1,375
Q2'17 Q3'17 Q4'17 Q1'18 Q2'18 Q3'18 Q4'18 Q1'19
Investments ($B) Deals
PwC | CB Insights MoneyTree™ Report Q1 2019 62
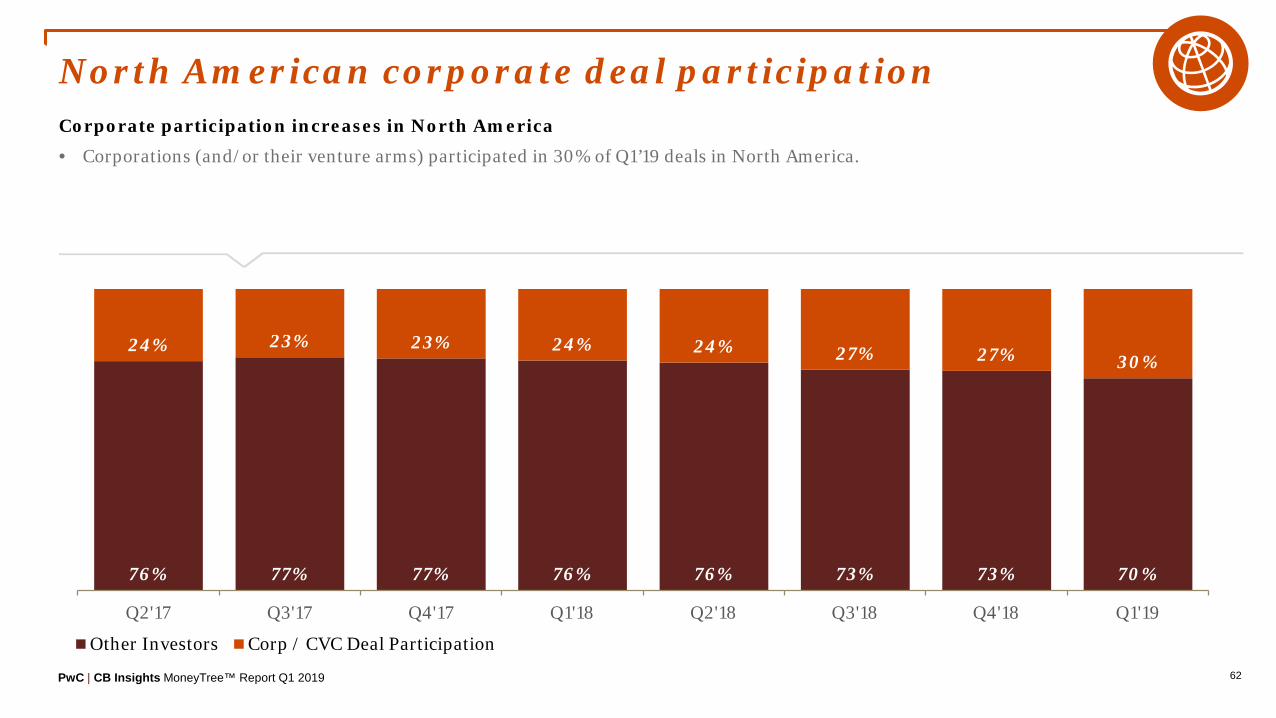
North American corporate deal participationCorporate participation increases in North America
• Corporations (and/or their venture arms) participated in 30% of Q1’19 deals in North America.
76% 77% 77% 76% 76% 73% 73% 70%
24% 23% 23% 24% 24% 27% 27% 30%
Q2'17 Q3'17 Q4'17 Q1'18 Q2'18 Q3'18 Q4'18 Q1'19
Other Investors Corp / CVC Deal Participation

PwC | CB Insights MoneyTree™ Report Q1 2019 63
8-quarter financing trend: EuropeEuropean funding jumped amid a drop in deal activity
• Europe-based startups raised $8B in Q1’19, a 48% jump compared to Q4’18.
• Deal activity fell 4% to 724 transactions.
$4.8 $5.6 $5.1 $5.2 $5.9 $5.1 $5.2 $7.7
704
728 729 725
766
699
751
724
Q2'17 Q3'17 Q4'17 Q1'18 Q2'18 Q3'18 Q4'18 Q1'19
Investments ($B) Deals
PwC | CB Insights MoneyTree™ Report Q1 2019 64
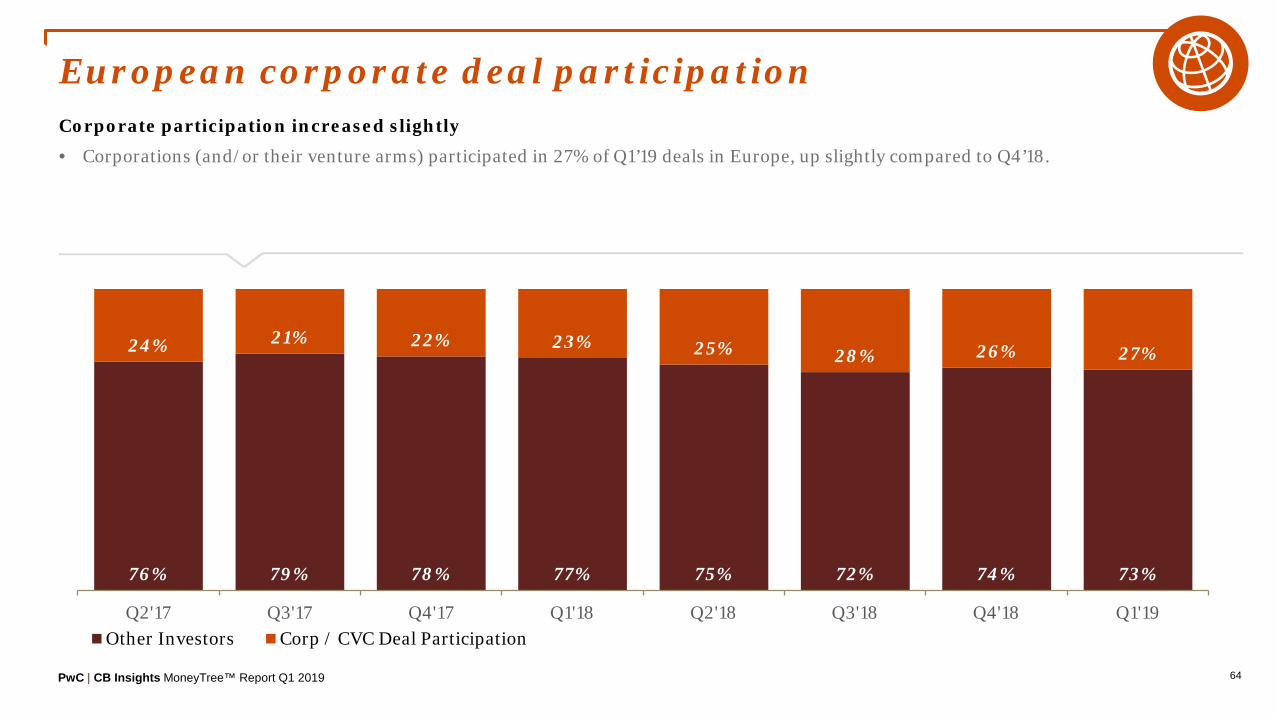
European corporate deal participationCorporate participation increased slightly
• Corporations (and/or their venture arms) participated in 27% of Q1’19 deals in Europe, up slightly compared to Q4’18.
76% 79% 78% 77% 75% 72% 74% 73%
24% 21% 22% 23% 25% 28% 26% 27%
Q2'17 Q3'17 Q4'17 Q1'18 Q2'18 Q3'18 Q4'18 Q1'19Other Investors Corp / CVC Deal Participation

PwC | CB Insights MoneyTree™ Report Q1 2019 65
8-quarter financing trend: AsiaFunding and deal activity fell in Asia
• Asia funding dropped 13% in Q1’19, falling to $18B.
• Deal activity fell to 1,128, down from 1,212 in Q4’18.
$19.8 $20.4 $22.5 $19.8 $22.4 $20.1 $21.1 $18.4
8841,002
1,110 1,124
1,495 1,497
1,2121,128
Q2'17 Q3'17 Q4'17 Q1'18 Q2'18 Q3'18 Q4'18 Q1'19
Investments ($B) Deals
PwC | CB Insights MoneyTree™ Report Q1 2019 66
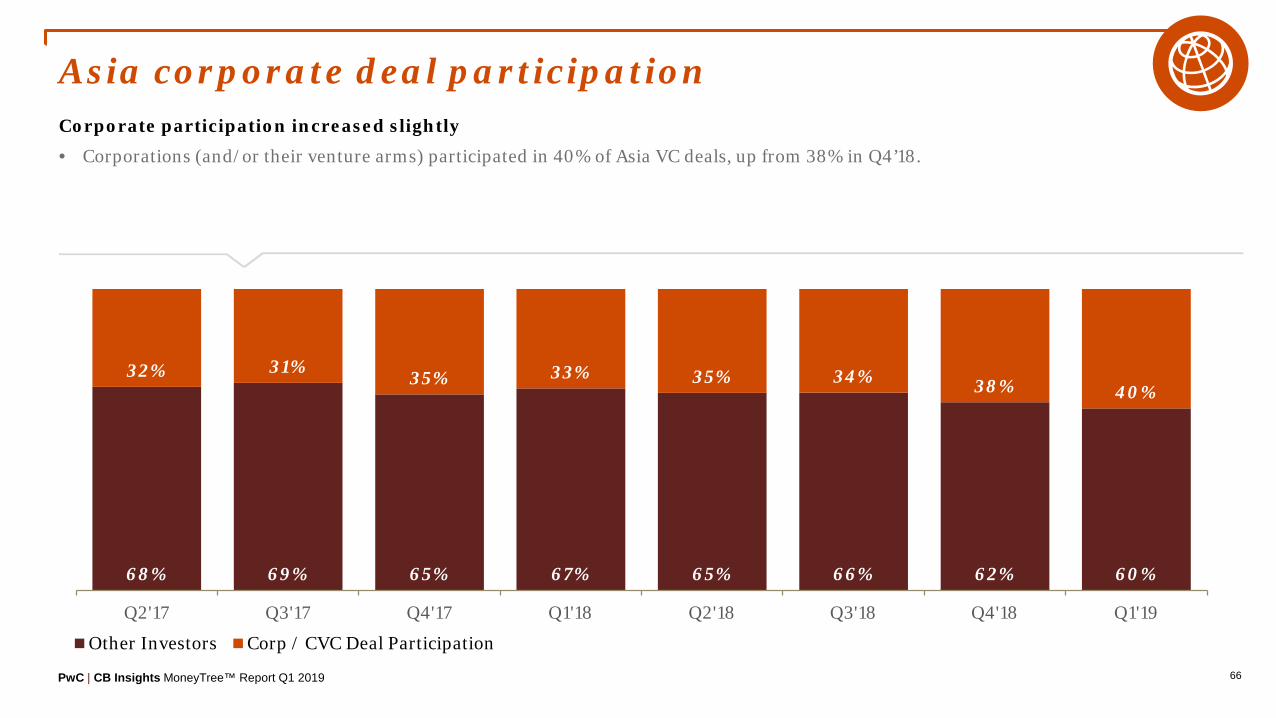
Asia corporate deal participationCorporate participation increased slightly
• Corporations (and/or their venture arms) participated in 40% of Asia VC deals, up from 38% in Q4’18.
68% 69% 65% 67% 65% 66% 62% 60%
32% 31% 35% 33% 35% 34% 38% 40%
Q2'17 Q3'17 Q4'17 Q1'18 Q2'18 Q3'18 Q4'18 Q1'19
Other Investors Corp / CVC Deal Participation
PwC | CB Insights MoneyTree™ Report Q1 2019 67
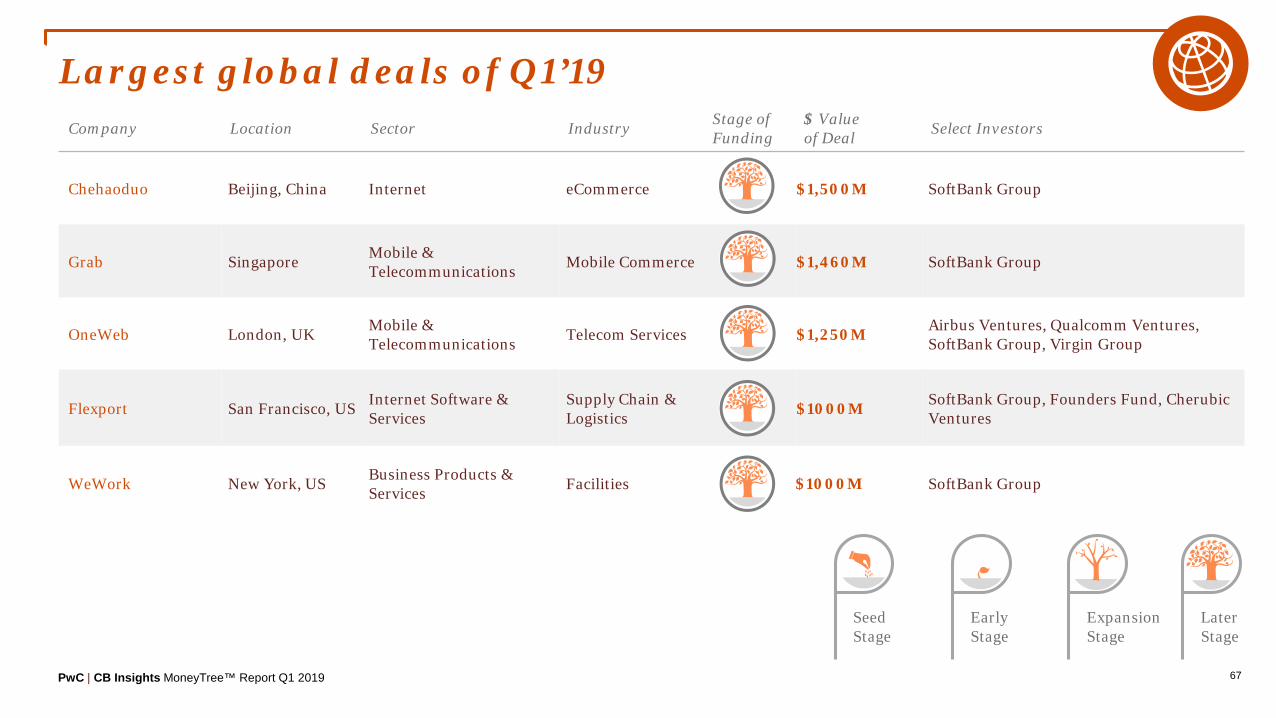
Largest global deals of Q1’19Company Location Sector Industry Stage of
Funding$ Valueof Deal Select Investors
Chehaoduo Beijing, China Internet eCommerce $1,500M SoftBank Group
Grab Singapore Mobile & Telecommunications Mobile Commerce $1,460M SoftBank Group
OneWeb London, UK Mobile & Telecommunications Telecom Services $1,250M Airbus Ventures, Qualcomm Ventures,
SoftBank Group, Virgin Group
Flexport San Francisco, US Internet Software & Services
Supply Chain & Logistics $1000M SoftBank Group, Founders Fund, Cherubic
Ventures
WeWork New York, US Business Products & Services Facilities $1000M SoftBank Group
Expansion Stage
Early Stage
Later Stage
Seed Stage

PwC | CB Insights MoneyTree™ Report Q1 2019 68
Most active VC firms of Q1’19 globally
Investor Location No. of US Companies Select Q1’19 Investments
Chevy Chase, MD 29 OpenDoor Labs, Databricks, Desktop Metal
Mountain View, CA 26 Lime, OpenDoor Labs, Clutter
1. New Enterprise Associates
2. Google Ventures
3. Norwest Venture Partners Palo Alto, CA 24 OpenDoor Labs, Casper, Influx Data
3. Accel Palo Alto, CA 24 Doctolib, GoCardless, Acko General Insurance
5. IDG Capital New York, NY 23 JUSDA, Shuidihuzhu, Medbanks Network Technology
PwC | CB Insights MoneyTree™ Report Q1 2019 69
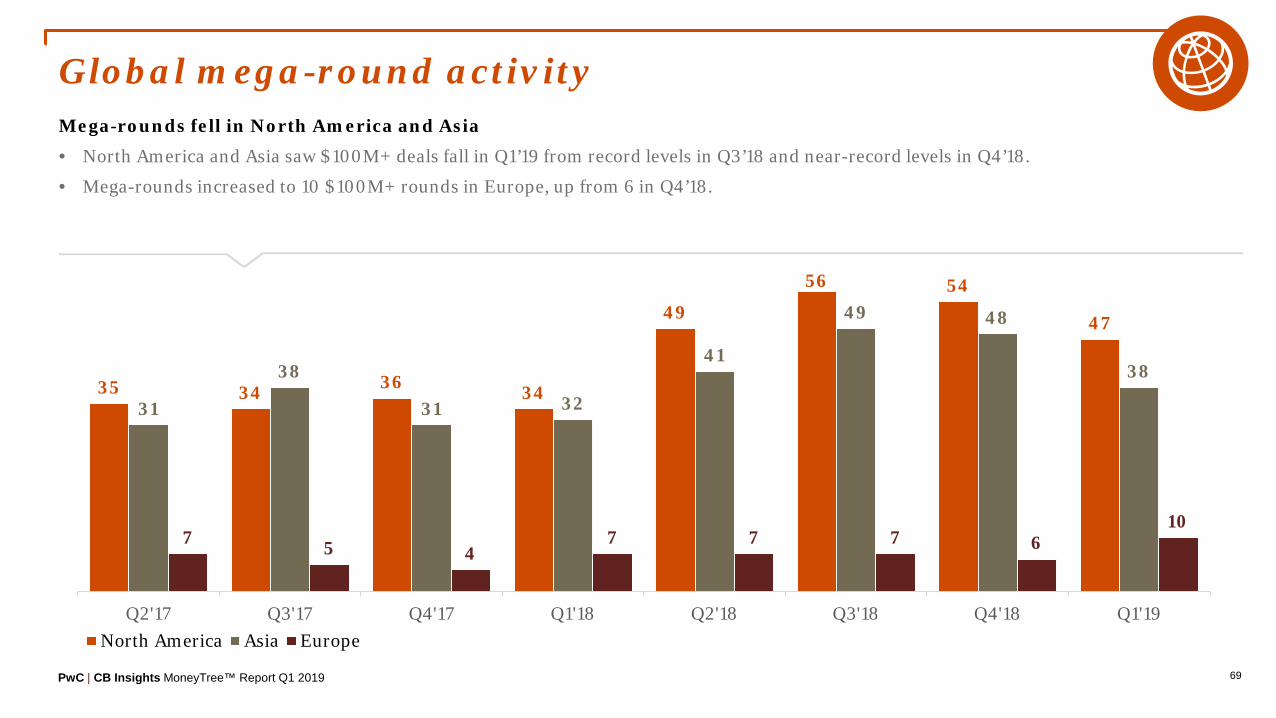
Global mega-round activityMega-rounds fell in North America and Asia
• North America and Asia saw $100M+ deals fall in Q1’19 from record levels in Q3’18 and near-record levels in Q4’18.
• Mega-rounds increased to 10 $100M+ rounds in Europe, up from 6 in Q4’18.
35 34 36 34
49
56 54
47
31
38
31 32
41
49 48
38
7 5 47 7 7 6
10
0.0
10.0
20.0
30.0
40.0
50.0
60.0
Q2'17 Q3'17 Q4'17 Q1'18 Q2'18 Q3'18 Q4'18 Q1'19North America Asia Europe

PwC | CB Insights MoneyTree™ Report Q1 2019 70
Global new unicorn birthsNorth America minted more unicorns than Asia for the third-straight quarter
• North America saw 10 private companies hit $1B+ valuations in Q1’19, compared to 5 in Asia
• New unicorns in Q1’19 were down compared to Q4’18 in North America, Europe, and Asia.
67
8 7
1116
8
5
108
7
7 8
17
21
10
1 20
35
24 3
Q2'17 Q3'17 Q4'17 Q1'18 Q2'18 Q3'18 Q4'18 Q1'19
Asia North America Europe
PwC | CB Insights MoneyTree™ Report Q1 2019 71
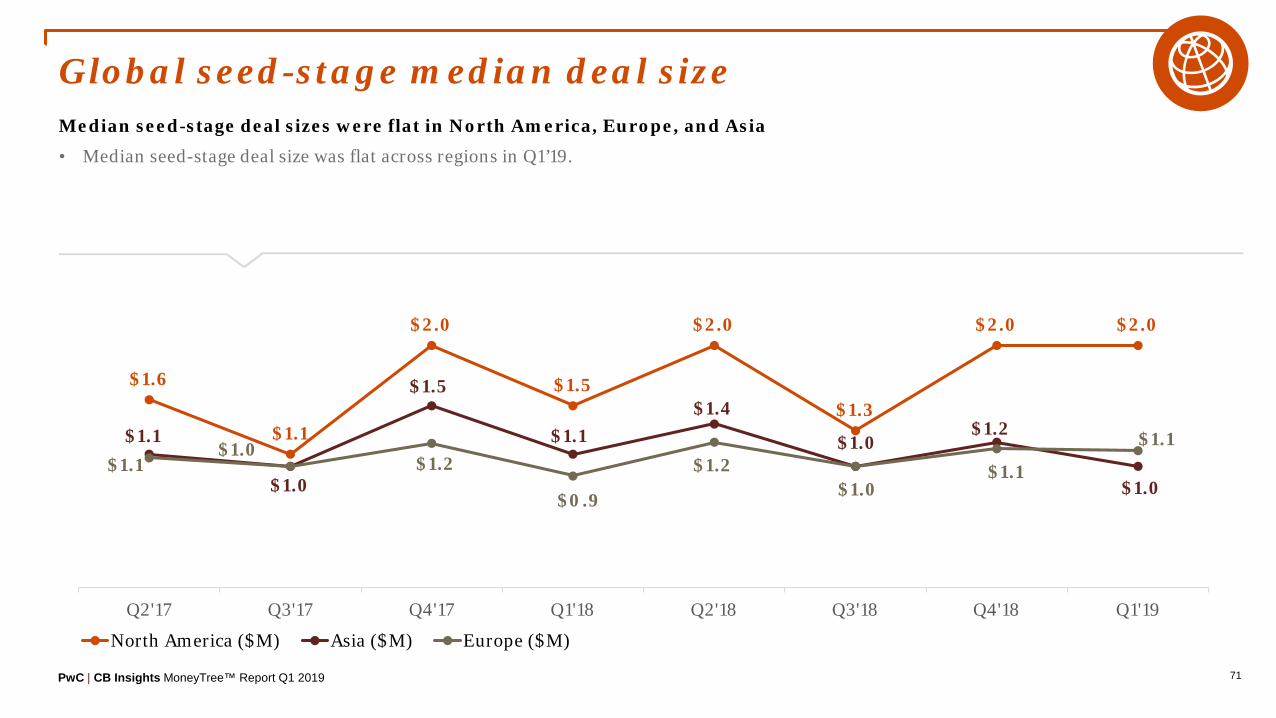
Global seed-stage median deal sizeMedian seed-stage deal sizes were flat in North America, Europe, and Asia
• Median seed-stage deal size was flat across regions in Q1’19.
$1.6
$1.1
$2.0
$1.5
$2.0
$1.3
$2.0 $2.0
$1.1
$1.0
$1.5
$1.1$1.4
$1.0$1.2
$1.0$1.1
$1.0$1.2
$0.9
$1.2$1.0
$1.1
$1.1
Q2'17 Q3'17 Q4'17 Q1'18 Q2'18 Q3'18 Q4'18 Q1'19
North America ($M) Asia ($M) Europe ($M)

PwC | CB Insights MoneyTree™ Report Q1 2019 72
Global early-stage median deal sizeMedian early-stage deal size jumped in Europe
• Early-stage median deal size increased to $5.2M in Europe, up from $4.6M in Q4’18.
$6.0
$6.0
$6.8 $7.0$7.3
$6.5$7.2 $7.2
$5.8$6.0
$5.7 $6.4
$6.3
$5.9 $5.0
$4.4$5.0
$4.7$5.2
$4.2
$5.3$4.6 $4.6
$5.2
Q2'17 Q3'17 Q4'17 Q1'18 Q2'18 Q3'18 Q4'18 Q1'19
North America ($M) Asia ($M) Europe ($M)
PwC | CB Insights MoneyTree™ Report Q1 2019 73
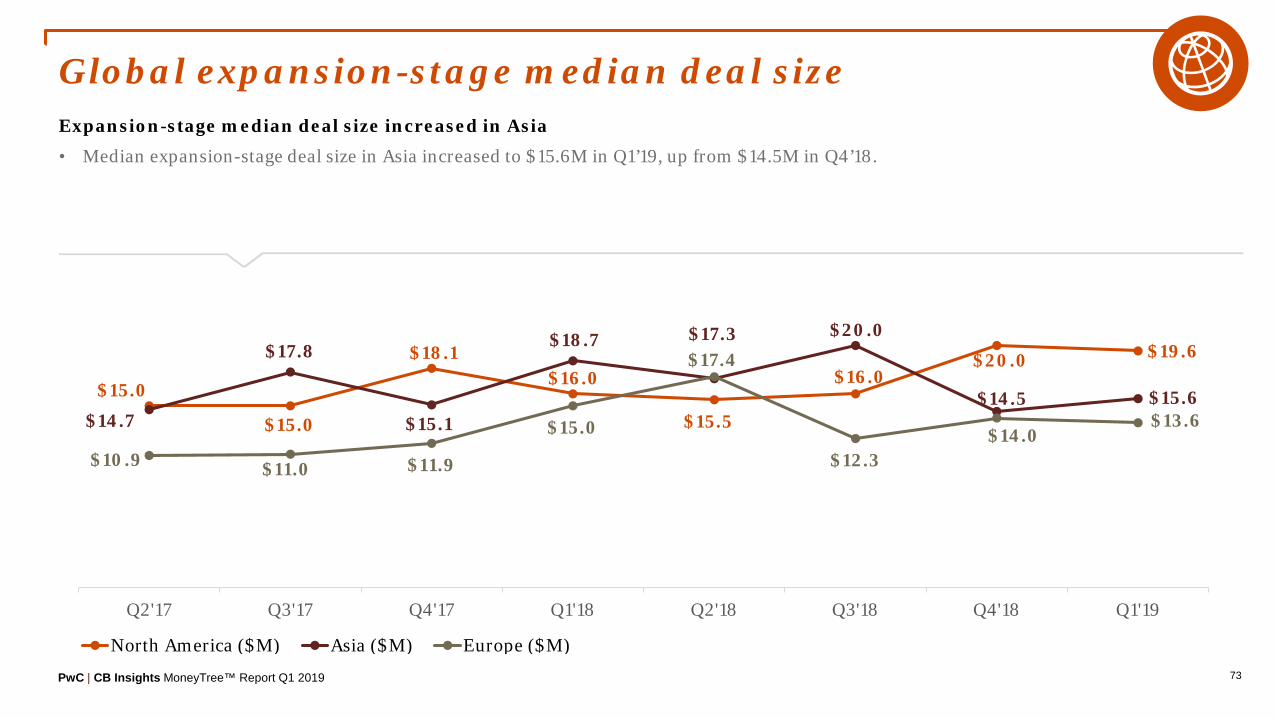
Global expansion-stage median deal sizeExpansion-stage median deal size increased in Asia
• Median expansion-stage deal size in Asia increased to $15.6M in Q1’19, up from $14.5M in Q4’18.
$15.0
$15.0
$18.1$16.0
$15.5
$16.0$20.0 $19.6
$14.7
$17.8
$15.1
$18.7 $17.3 $20.0
$14.5 $15.6
$10.9 $11.0 $11.9
$15.0
$17.4
$12.3$14.0
$13.6
Q2'17 Q3'17 Q4'17 Q1'18 Q2'18 Q3'18 Q4'18 Q1'19
North America ($M) Asia ($M) Europe ($M)

PwC | CB Insights MoneyTree™ Report Q1 2019 74
Global later-stage median deal sizeMedian later-stage deal size rose across the board
• Median later-stage deal size increased in North America, Europe, and Asia.
• Asia saw median later-stage deal size increase to $56M, up from $50M in Q4’18.
$34.2 $30.9 $26.6 $30.0
$44.5
$32.0 $35.0$40.0
$70.0
$90.0
$73.1$68.0
$88.0
$100.0
$50.0$56.1
$13.8 $12.0
$24.9$13.9 $11.2 $13.0
$18.5$27.9
Q2'17 Q3'17 Q4'17 Q1'18 Q2'18 Q3'18 Q4'18 Q1'19
North America ($M) Asia ($M) Europe ($M)

AppendixAppendix
PwC | CB Insights MoneyTree™ Report Q1 2019 76
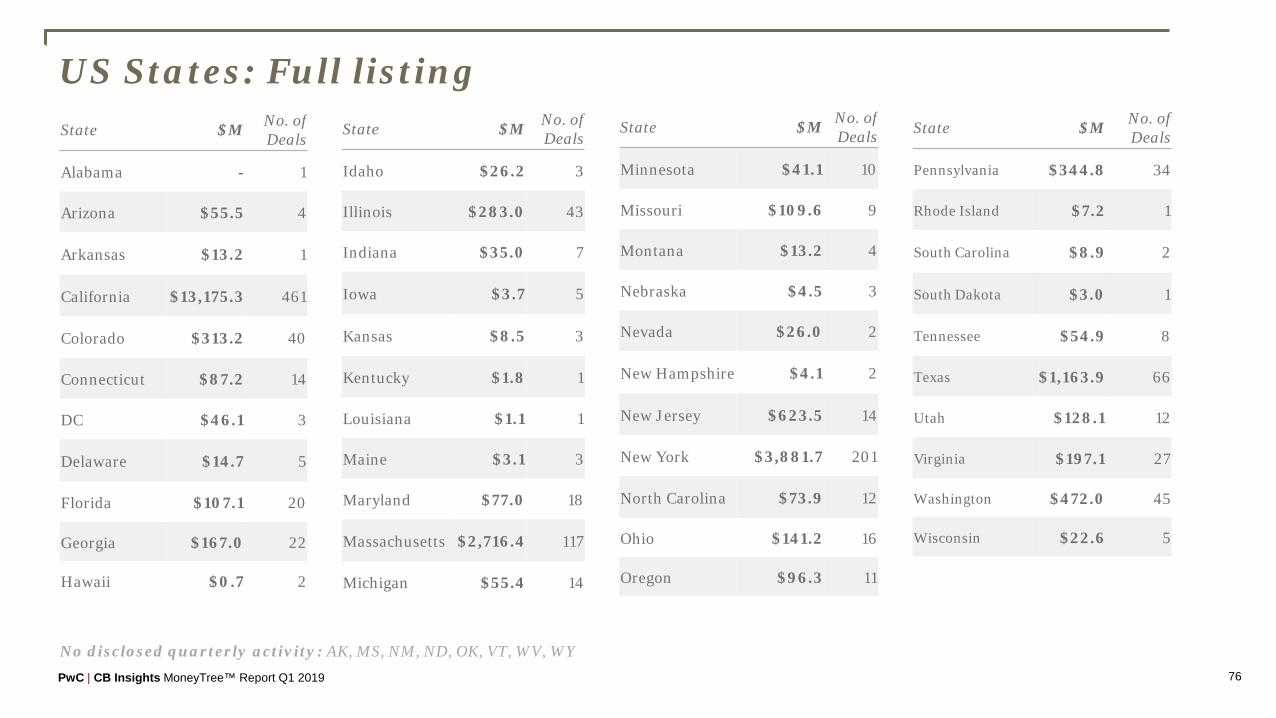
US States: Full listingState $M No. of
Deals
Alabama - 1
Arizona $55.5 4
Arkansas $13.2 1
California $13,175.3 461
Colorado $313.2 40
Connecticut $87.2 14
DC $46.1 3
Delaware $14.7 5
Florida $107.1 20
Georgia $167.0 22
Hawaii $0.7 2
No disclosed quarterly activity: AK, MS, NM, ND, OK, VT, WV, WY
State $M No. of Deals
Idaho $26.2 3
Illinois $283.0 43
Indiana $35.0 7
Iowa $3.7 5
Kansas $8.5 3
Kentucky $1.8 1
Louisiana $1.1 1
Maine $3.1 3
Maryland $77.0 18
Massachusetts $2,716.4 117
Michigan $55.4 14
State $M No. of Deals
Minnesota $41.1 10
Missouri $109.6 9
Montana $13.2 4
Nebraska $4.5 3
Nevada $26.0 2
New Hampshire $4.1 2
New Jersey $623.5 14
New York $3,881.7 201
North Carolina $73.9 12
Ohio $141.2 16
Oregon $96.3 11
State $M No. of Deals
Pennsylvania $344.8 34
Rhode Island $7.2 1
South Carolina $8.9 2
South Dakota $3.0 1
Tennessee $54.9 8
Texas $1,163.9 66
Utah $128.1 12
Virginia $197.1 27
Washington $472.0 45
Wisconsin $22.6 5
PwC | CB Insights MoneyTree™ Report Q1 2019 77
Notes on methodologyPwC (pwcmoneytree.com) and CB Insights (cbinsights.com) encourage you to review the methodology and definitions employed to better understand the numbers presented in this report. If you have any questions about the definitions or methodological principles used, we encourage you to reach out to CB Insights directly. Additionally, if you feel your firm has been underrepresented, please send an email to [email protected] and we can work together to ensure your firm’s investment data is up-to-date.
Rankings, e.g., top states and top sectors, are done by quarterly deal activity (that is, deal count for the given quarter).
What is included:
- Equity financings into emerging companies. Fundings must be to VC-backed companies, which are defined as companies that have received funding at any point from either: venture capital firms, corporate venture arms, or super angel investors.
- Fundings of private companies only. Funding rounds raised by public companies of any kind on any exchange (including Pink Sheets) are excluded from our numbers, even if they received investment by a venture firm(s).
- Only includes the investment made in the quarter for tranched investments. If a company does a second closing of its Series B round for $5M and previously had closed $2M in a prior quarter, only the $5M is reflected in our results.
- Round numbers reflect what has closed – not what is intended. If a company indicates the closing of $5M out of a desired raise of $15M, our numbers reflect only the amount which has closed.
- Only verifiable fundings are included. Fundings are verified via (1) various federal and state regulatory filings; (2) direct confirmation with firm or investor; (3) press release; or (4) credible media sources.
- Equity fundings to joint ventures and spinoffs/spinouts are included, given that they meet the VC-backed criteria.
- Geography note: Israel funding figures are classified in Asia.
What is excluded:
- No contingent funding. If a company receives a commitment for $20M subject to hitting certain milestones but first gets $8M, only the $8M is included in our data.
- No business development / R&D arrangements whether transferable into equity now, later or never. If a company signs a $300M R&D partnership with a larger corporation, this is not equity financing nor is it from venture capital firms. As a result, it is not included.
- No buyouts, consolidations or recapitalizations. All three of these transaction types are commonly employed by private equity firms and are tracked by CB Insights. However, they are excluded for the purposes of this report.
- No private placements. These investments, also known as PIPEs (Private Investment in Public Equities), are not included even if made by a venture capital firm(s).
- No debt/loans of any kind (except convertible notes). Venture debt or any kind of debt/loan issued to emerging, startup companies, even if included as an additional part of an equity financing, is not included. If a company receives $3M with $2M from venture investors and $1M in debt, only the $2M is included in these statistics.
- No non-equity government funding. Grants or loans by the federal government, state agencies, or public-private partnerships to emerging, startup companies are not included.
- No fundings to subsidiaries of a larger parent corporation.

This content is for general information purposes only, and should not be used as a substitute for consultation with professional advisors. Data is current as of April 1, 2019. PricewaterhouseCoopers and CB Insights have taken responsible steps to ensure that the information contained in the MoneyTree™ Report has been obtained from reliable sources. However, neither PwC nor CB Insights can warrant the ultimate validity of the data obtained in this manner. Results are updated periodically. Therefore, all data is subject to change at any time.
© 2019 PwC. All rights reserved. PwC refers to the US member firm or one of its subsidiaries or affiliates, and may sometimes refer to the PwC network. Each member firm is a separate legal entity. Please see www.pwc.com/structure for further details.