PwC / CB Insights MoneyTree™ Report · PDF filewith 4 mega-rounds of $100M or more....
101
PwC / CB Insights MoneyTree™ Report Q4 2017
Transcript of PwC / CB Insights MoneyTree™ Report · PDF filewith 4 mega-rounds of $100M or more....

PwC / CB Insights
MoneyTree™ Report
Q4 2017

PwC | CB Insights MoneyTree™ Report Q4 2017 2
Executive summary
Strong year in funding, driven by $100M+ mega-rounds record for this millennium, but deals down
Annual funding tops $70B for second time: US VC-backed companies saw $71.9B invested in 2017 across 5,052 deals. Funding was up 17% from 2016, but deals fell 4%, declining to the lowest annual total since 2012.
109 mega-rounds of $100M or more in 2017: Driving the strong funding total was a record number of 109 mega-rounds, edging out the count of 107 in 2015. Mega-rounds accounted for 36% of 2017 US funding, just shy of the 37% high in 2015.
Seed deal share dips to 8-quarter low: Corresponding with the broader deal slowdown, US seed deal share slid to an 8-quarter low of just 22% in Q4’17. Seed share crested 30% every quarter in 2016, but did not reach that mark in any quarter after Q1’17.
Four new unicorns ‘birthed’ in Q4’17: Four VC-backed companies achieved a valuation of $1B or more in the US in Q4’17. Through full-year 2017, 22 new unicorns were created in the US, up modestly from 2016 but significantly below the peak of 41 in 2015.
Funding to AI tops $1B every quarter in 2017: Compared to 2016, total annual funding increased 28% in 2017 with $5B across 444 deals.
Global funding total surges to post-2000 record, propelled by Asia
Global funding hits $164B: Total annual global funding increased nearly 50% in 2017, as over $164B was invested across 11,042 deals. Deal activity was up by 11%, with both deal and dollar figures representing annual highs.
Asian and European financing activity see full-year increases: Total annual Asian funding activity increased by 117%, with $70.8B invested across 2,847 deals in 2017, up from $32.7B and 1,950 deals in 2016. Total annual European funding activity stood at $17.6B across 2,483 deals, respectively up 40% and 16% from 2016.
San Francisco funding jumps even as deal activity declines:Total quarterly funding to San Francisco-based companies increased 23% in Q4’17 reaching $5.2B. Deal activity declined 19% over the same period, decreasing from 260 deals in Q3’17 to 210 deals in Q4’17.
New York Metro financing activity returns to Q2’17 levels and Silicon Valley sees more funding: Deal activity in the NY Metro area declined from 184 deals to 177 deals in Q4’17. Absent the $2B+ funding to WeWork in Q3’17, total quarterly funding declined by 33%. SV total quarterly funding increased by 18%, to reach $2.7B, with 4 mega-rounds of $100M or more.
Note: Report includes all rounds to VC-backed companies. For a detailed brief on methodology, please reference page 100 of this report.

PwC | CB Insights MoneyTree™ Report Q4 2017
Table of contents
3
4 US Overall Trends
74 Global Trends
63 US Movers and Shakers
40 US Places
16 US Sectors

US Overall Trends01
4

PwC | CB Insights MoneyTree™ Report Q4 2017 5
US financing trends
”
2017 was the second biggest year of investments ($71.9B) for venture backed US startup firms, increasing 17% over 2016.
“
— Tom Ciccolella, Partner, US Ventures Leader at PwC

6
In 2017
UNITED
STATESVC-backed companies raised
$71.9B

PwC | CB Insights MoneyTree™ Report Q4 2017 7
Annual US financing trend
US annual funding tops $70B on strong mega-round activity, but deals continue slip
• Total annual funding increased 17% in 2017, as $71.9B was invested across 5,052 deals.
• Q2’17 and Q4’17 both saw 33 rounds of $100M or more.
• 2017 was the second year that saw dollar funding top $70B, but deals declined for the third straight year, falling 4% from 2016 and reaching the lowest annual total since 2012.
$32.6 $36.1 $59.4 $76.8 $61.4 $71.9
4,6245,063
5,811 5,786
5,2685,052
0
1,000
2,000
3,000
4,000
5,000
6,000
7,000
2012 2013 2014 2015 2016 2017
Title
Investment ($B) Deals

PwC | CB Insights MoneyTree™ Report Q4 2017 8
US deal share by stage
US seed activity declines to 5 year low
• Seed activity as a proportion of all deals declined to 27% in 2017, down from 32% the year before.
• Early-stage activity remained constant, while expansion-stage and later-stage deal share increased.
35% 35% 35% 34% 32% 27%
25% 26% 25% 25% 26%26%
22% 21% 20% 20% 19%21%
12% 11% 11% 10% 8% 10%
6% 7% 9% 11% 15% 16%
2012 2013 2014 2015 2016 2017
Seed Stage Early Stage Expansion Stage Later Stage Other

9
In Q4 2017
UNITED
STATESVC-backed companies raised
$18.7B

PwC | CB Insights MoneyTree™ Report Q4 2017 10
8-quarter US financing trend
US deals slip in Q4’17, but funding remains steady, again driven by plentiful mega-rounds
• Deal activity receded 11% in Q4’17, as $18.7B was invested across 1,158 deals. Funding was down slightly from the record high of Q3’17, but topped $18B for the third consecutive quarter.
• 33 mega-rounds of $100M or more added to the strong US quarterly funding total. This was up from 25 in Q3’17, and tied with Q2’17 for mega-round activity.
$16.1 $17.9 $14.5 $12.9 $15.1 $19.0 $19.2 $18.7
1,4151,321 1,311
1,2211,335
1,260 1,299
1,158
0
200
400
600
800
1,000
1,200
1,400
1,600
Q1'16 Q2'16 Q3'16 Q4'16 Q1'17 Q2'17 Q3'17 Q4'17
Title
Investments ($B) Deals

PwC | CB Insights MoneyTree™ Report Q4 2017 11
US deal share by stage
US seed activity crashes to 8-quarter low
• Seed activity as a proportion of all deals declined to 22% in Q4’17, the lowest percentage in 8 quarters. After consistently hovering around a third of deals from Q1’16 to Q1’17, seed share has not topped 30% in any quarter since.
• Expansion-stage deal share increased from 21% to 23% in Q4’17. Early-stage deal share ticked up a percentage point.
33% 32% 32% 32% 33%25% 29%
22%
26% 26% 26% 25% 24%28%
25%26%
19% 20% 20% 17% 18% 21% 21%23%
9% 8% 8%9% 10% 10% 10%
10%
13% 15% 14% 17% 16% 17% 15% 19%
Q1'16 Q2'16 Q3'16 Q4'16 Q1'17 Q2'17 Q3'17 Q4'17
Seed Stage Early Stage Expansion Stage Later Stage Other

PwC | CB Insights MoneyTree™ Report Q4 2017 12
Median US deal sizes by stage
Expansion-, Early-, and Seed-stage deals all reach 8-quarter highs in Q4’17
• Later-stage median deal size declined to $25.5M from $30M the quarter before, in line with 2016 quarterly averages.
• Expansion-stage median deal sizes increased to $17.5M, up from $15M in Q3’17, hitting an 8-quarter high.
• Early-stage median deal sizes also reached an 8-quarter high of $7M, while Seed-stage deals tied Q2’17 at $2M.
$1.0 $1.3 $1.1 $1.7 $1.3 $2.0 $1.5 $2.0
$5.0 $5.5 $6.0 $6.0 $6.0 $6.0 $6.4 $7.0
$17.0$15.7
$13.2 $13.9$15.0 $16.0 $15.0
$17.5
$25.0$26.2
$22.7
$25.8
$22.2
$32.8
$30.0
$25.5
Q1'16 Q2'16 Q3'16 Q4'16 Q1'17 Q2'17 Q3'17 Q4'17
Seed Stage Deal Size ($M) Early Stage Deal Size ($M) Expansion Stage Deal Size ($M) Later Stage Deal Size ($M)

PwC | CB Insights MoneyTree™ Report Q4 2017 13
US corporate deal participation
Corporate participation ticks upwards
• Corporate participation in US deal activity increased by a percentage point in Q4’17 as corporations and CVCs were involved in 24% of all US deals to VC-backed companies.
• Corporate participation was lower in the back half of 2017 as compared to H1’17.
78% 77% 75% 77% 75% 74% 77% 76%
22% 23% 25% 23% 25% 26% 23% 24%
Q1'16 Q2'16 Q3'16 Q4'16 Q1'17 Q2'17 Q3'17 Q4'17
Other Investors Corp / CVC Deal Participation

PwC | CB Insights MoneyTree™ Report Q4 2017 14
US first venture financing share (Quarterly)
Proportion of first venture rounds decline by a percentage point but remain in historical range
• In Q4’17, 34% of all US deals were first venture financings.
• Excepting Q4’16, first venture financings as a share of all US deals has remained in the 33-35% range since early 2016.
67% 66% 67% 64% 66% 65% 65% 66%
33% 34% 33% 36% 34% 35% 35% 34%
Q1'16 Q2'16 Q3'16 Q4'16 Q1'17 Q2'17 Q3'17 Q4'17
Other % of Total First VC-Backed Deals
PwC | CB Insights MoneyTree™ Report Q4 2017 15
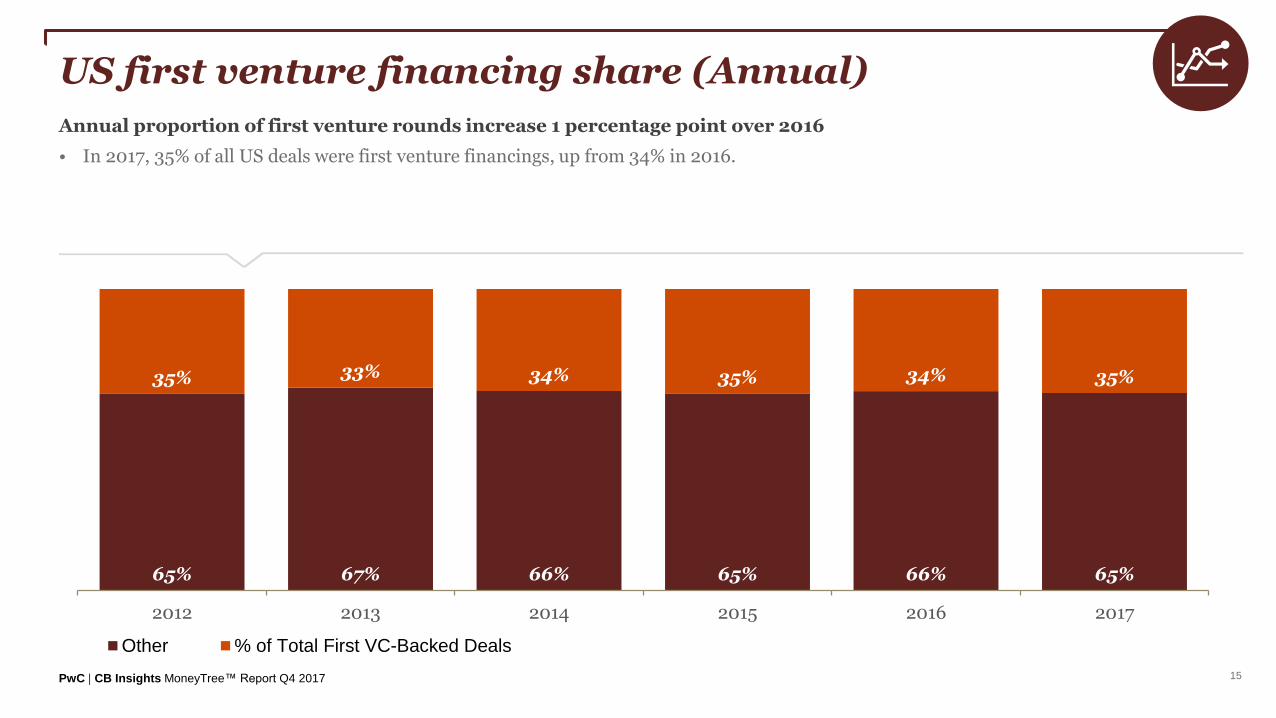
US first venture financing share (Annual)
Annual proportion of first venture rounds increase 1 percentage point over 2016
• In 2017, 35% of all US deals were first venture financings, up from 34% in 2016.
65% 67% 66% 65% 66% 65%
35% 33% 34% 35% 34% 35%
2012 2013 2014 2015 2016 2017
Other % of Total First VC-Backed Deals

US Sectors02

PwC | CB Insights MoneyTree™ Report Q4 2017
56 Deals
87 Deals
129 Deals
182 Deals
491 Deals
17
US deals and funding by Top 5 sectors
$6.5BInvested
$4.0BInvested
$3.8BInvested
$1.6BInvested
$0.4BInvested
Internet
Mobile & Telecommunications
Software (Non-Internet / Mobile)
Consumer Products & Services
Healthcare

PwC | CB Insights MoneyTree™ Report Q4 2017 18
US deal share by sector
Internet deal share declines to 8-quarter low; Healthcare outpaces Mobile for second straight quarter
• Internet deal share decreased from 47% in Q3’17 to 42%, an 8-quarter low for the sector in the US market.
• Healthcare deal share increased from 14% in Q3’17 to 16% this quarter. Healthcare deal share was greater than Mobile & Telecom activity (traditionally the second largest slice of deal share) for full-year 2017.
45% 48% 49% 45% 43% 44% 47% 42%
13% 12% 13%11% 16% 14%
14%16%
16% 15% 13%16% 14% 14% 12%
11%
4% 6% 7% 8% 7% 7% 8%8%
6% 5% 4% 5% 3% 4% 4%5%
16% 15% 15% 14% 18% 16% 15% 18%
Q1'16 Q2'16 Q3'16 Q4'16 Q1'17 Q2'17 Q3'17 Q4'17
Internet Healthcare Mobile & Telecommunications Software (non-internet/mobile) Consumer Products & Services Other

PwC | CB Insights MoneyTree™ Report Q4 2017 19
Artificial Intelligence

PwC | CB Insights MoneyTree™ Report Q4 2017 20
Artificial Intelligence
”
2017 was a record year for AI investment, each quarter exceeding $1B in total funding. Q4 had two mega-rounds for AI (Lemonade & Uptake Technologies)
“
— Anand Rao, Principal, Global Artificial Intelligence Leader at PwC

PwC | CB Insights MoneyTree™ Report Q4 2017 21
AI: US annual funding
Full-year annual financing activity shows continued growth in AI investment
• Total annual funding for AI increased 28% from 2016, as the dollar figure topped $5B for the first time.
• Deal activity also continued its climb to hit 444 deals in 2017, up 6% from the preceding year.
$595 $1,118 $2,489 $3,203 $3,921 $5,012
124
199
292
354
417444
0
50
100
150
200
250
300
350
400
450
500
2012 2013 2014 2015 2016 2017
Title
Investment ($M) Deals

PwC | CB Insights MoneyTree™ Report Q4 2017 22
AI: US quarterly funding
US Artificial Intelligence funding tops $1B every quarter in 2017
• Total quarterly funding to US AI companies reached $1.2B in Q4’17, outranked only by Q3’17 in dollar terms. Deal activity declined by 34%, as only 84 deals were completed in Q4’17, down from 127 the quarter before.
• The strong total quarterly funding was led by investment rounds to companies such as Lemonade ($120M Series C), Uptake Technologies ($117M Series D), and Petuum ($93M Series B).
$1,036 $1,007 $945 $933 $1,065 $1,183 $1,516 $1,248
112
10192
112
131
102
127
84
0
20
40
60
80
100
120
140
Q1'16 Q2'16 Q3'16 Q4'16 Q1'17 Q2'17 Q3'17 Q4'17
Title
Investments ($M) Deals

PwC | CB Insights MoneyTree™ Report Q4 2017 23
AI: US deal share over time
Expansion-stage deal share increases in Q4’17 as seed and early-stage activity declines
• Expansion-stage deals increased to 29% in Q4’17, up from 20% the previous quarter. Later-stage deals increased 5 percentage points.
• Seed stage deals declined to 32% of deal share from 38% the quarter prior. Early-stage deals also declined, decreasing to 25% in Q4’17, down from 32% in Q3’17.
49%38% 37%
46%40%
25%38%
32%
23%
28% 26%
30%
27%
36%
32%
25%
16%22%
18%
19%
18%22%
20%
29%
5% 5%8%
3%
5% 8%3% 8%
6% 8% 11%3%
10% 9% 6% 6%
Q1'16 Q2'16 Q3'16 Q4'16 Q1'17 Q2'17 Q3'17 Q4'17
Seed Stage Early Stage Expansion Stage Later Stage Other

PwC | CB Insights MoneyTree™ Report Q4 2017 24
AI: Top states by deals
42 deals$524M Invested
1. CA
13 deals$200M Invested
6 deals$110M Invested
5 deals$81M Invested
4 deals$122M Invested
3. MA
2. NY
5. IL
4. CO

PwC | CB Insights MoneyTree™ Report Q4 2017 25
AI: Largest US deals of Q4’17
Company Location Sector IndustryStage of Funding
$ Valueof Deal
Select Investors
Lemonade New York, NY InternetInternet Software & Services
$120MGoogle Ventures, Menlo Ventures, Sequoia Capital, SoftBank Group
Uptake Technologies Chicago, IL
Software (non-internet / mobile)
Biz Intelligence & Analytics
$117MBaillie Gifford & Co., GreatPoint Ventures, Revolution
Petuum Pittsburgh, PA
Software (non-internet / mobile)
Scientific, Engineering Software
$93MAdvantech Capital Partners, SoftBank Group
Recursion Pharmaceuticals
Salt Lake City, UT Healthcare Biotechnology $60MAdvantage Capital Partners, Data Collective
Feedzai San Mateo, CA
Software (non-internet / mobile)
Security Software $50M Capital One Growth, Citi Ventures
Expansion Stage
Early Stage
Later Stage
Seed Stage
PwC | CB Insights MoneyTree™ Report Q4 2017 26
Cybersecurity

PwC | CB Insights MoneyTree™ Report Q4 2017 27
Cybersecurity
”
2017 was a record year for Cybersecurity funding, with total investments exceeding $3.6B. 2017 also saw the most mega-rounds in Cybersecurity, with seven companies receiving $100M+ in funding.
“
— Sean Joyce, Principal, US Cybersecurity Leader at PwC

PwC | CB Insights MoneyTree™ Report Q4 2017 28
Cybersecurity: US annual funding
Cybersecurity funding increases in 2017, deal activity flat from 2016
• Total annual funding to US Cybersecurity companies increased 40% in 2017, despite 3 fewer deals occurring.
• 2017’s total funding of over $3.7B tops the $3.2B seen in 2015 for an annual high.
$1,313 $1,679 $2,555 $3,238 $2,624 $3,668
151
177
239 223229
226
0
50
100
150
200
250
300
2012 2013 2014 2015 2016 2017
Title
Investment ($M) Deals
PwC | CB Insights MoneyTree™ Report Q4 2017 29
Cybersecurity: US quarterly funding
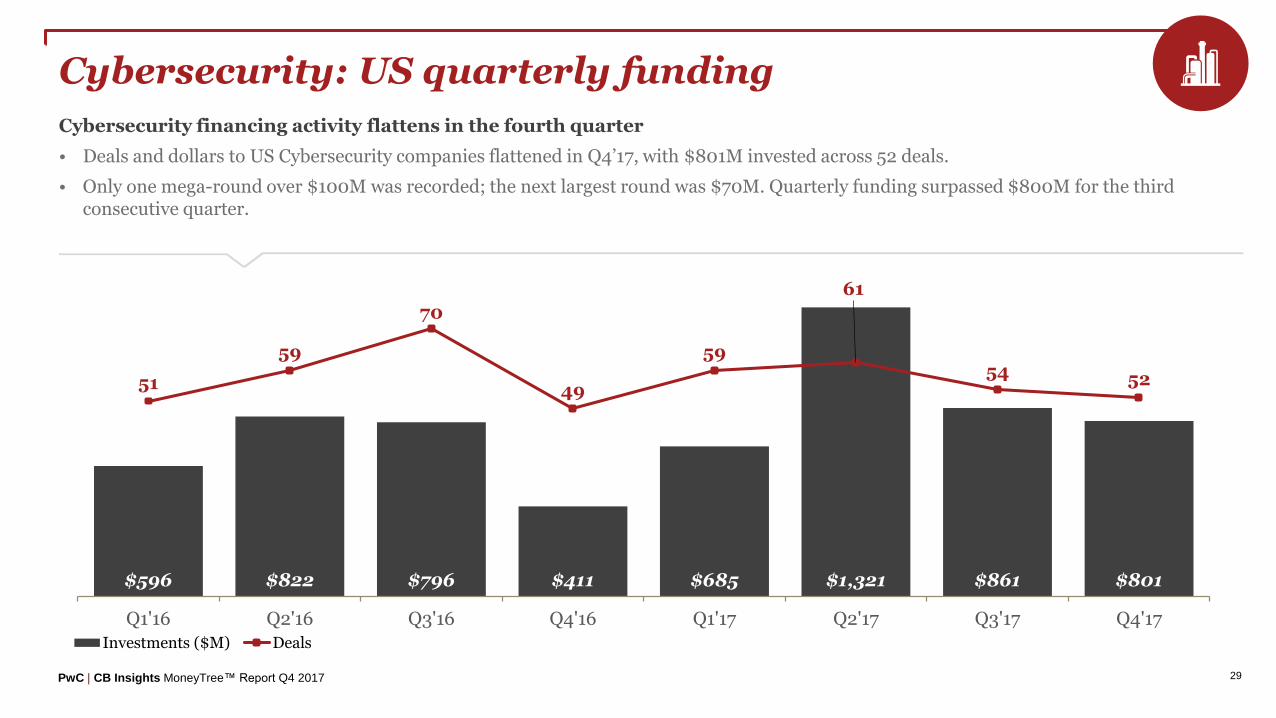
Cybersecurity financing activity flattens in the fourth quarter
• Deals and dollars to US Cybersecurity companies flattened in Q4’17, with $801M invested across 52 deals.
• Only one mega-round over $100M was recorded; the next largest round was $70M. Quarterly funding surpassed $800M for the third consecutive quarter.
$596 $822 $796 $411 $685 $1,321 $861 $801
51
59
70
49
59
61
54 52
0
10
20
30
40
50
60
70
80
Q1'16 Q2'16 Q3'16 Q4'16 Q1'17 Q2'17 Q3'17 Q4'17
Title
Investments ($M) Deals

PwC | CB Insights MoneyTree™ Report Q4 2017 30
Cybersecurity: US deal share over time
Expansion-stage deal share grows significantly
• Expansion-stage deal share increased to 38% of US Cybersecurity investments in Q4’17, up from 24% in Q3’17, and the highest mark this year.
• Early-stage deal share declined from 37% to 23% this quarter.
31%
19% 20%
37%25%
18% 20% 19%
33%
27%31%
24%
25%
25%
37%
23%
20%
36%33%
18%31%
33%
24%
38%
12%12% 10%
12% 14%18%
15%10%
4% 7% 6% 8% 5% 7% 4%10%
Q1'16 Q2'16 Q3'16 Q4'16 Q1'17 Q2'17 Q3'17 Q4'17
Seed Stage Early Stage Expansion Stage Later Stage Other

PwC | CB Insights MoneyTree™ Report Q4 2017 31
Cybersecurity: Top states by deals
24 deals$506M Invested
1. CA
7 deals$69M Invested
4 deals$39M Invested
3 deals$32M Invested
2. MA
3. NY
4. FL

PwC | CB Insights MoneyTree™ Report Q4 2017 32
Cybersecurity: Largest US deals of Q4’17
Company Location Sector IndustryStage of Funding
$ Valueof Deal
Select Investors
Skybox Security San Jose, CASoftware (non-internet/mobile)
Security Software
$150M CVC Capital Partners, Pantheon Ventures
Duo Security Ann Arbor, MI InternetInternet Software & Services
$70MIndex Ventures, Lead Edge Capital, True Ventures
Feedzai San Mateo, CASoftware (non-internet/mobile)
Security Software
$50M Capital One Growth Ventures, Citi Ventures
BitGo Palo Alto, CA InternetInternet Software & Services
$43M Valor Equity Partners, Bridgescale Partners
Menlo Security Palo Alto, CA InternetInternet Software & Services
$40MAmerican Express Ventures, Ericsson Ventures, Sutter Hill Ventures
Expansion Stage
Early Stage
Later Stage
Seed Stage

PwC | CB Insights MoneyTree™ Report Q4 2017 33
Genomics

PwC | CB Insights MoneyTree™ Report Q4 2017 34
Genomics
”
Genomics companies received record funding in 2017 at $2.5B. Companies focusing on Disease Diagnosis received a majority of the total funding this year ($1.7B), followed by Biotechnology ($550M).
“
— Laura Robinette, Partner, US Pharmaceuticals and Life Sciences Assurance Leader at PwC

PwC | CB Insights MoneyTree™ Report Q4 2017 35
Genomics: US annual funding
US Genomics funding nearly doubles to annual high of over $2.5B
• Total annual funding to US Genomics companies jumped 142% to over $2.5B, more than the previous three years combined.
• A nearly $1B mega-round in Q1’17 propelled this total, while deal activity also ticked upward.
$428 $411 $649 $649 $1,042 $2,525
39
4547
51
44
52
0
10
20
30
40
50
60
2012 2013 2014 2015 2016 2017
Title
Investment ($M) Deals

PwC | CB Insights MoneyTree™ Report Q4 2017 36
Genomics: US quarterly funding
Genomics funding remains steady, deal activity dips from Q3’17 peak
• Funding remained fairly steady, as US Genomics companies received $443M in Q4’17, down from half a billion dollars through each of the second and third quarters of 2017. A $200M+ mega-round contributed the bulk of Q4’17 quarterly funding.
• Deal activity declined from the spike of 22 deals in Q3’17 to 9 deals in Q4’17.
$310 $304 $140 $288 $1,039 $534 $509 $443
109
14
1110
11
22
9
0
5
10
15
20
25
Q1'16 Q2'16 Q3'16 Q4'16 Q1'17 Q2'17 Q3'17 Q4'17
Title
Investments ($M) Deals

PwC | CB Insights MoneyTree™ Report Q4 2017 37
Genomics: US deal share over time
Expansion stage deals account for majority of quarterly investment
• Expansion-stage deals accounted for more than half of the 9 US Genomics investments in Q4’17.
30% 33%21%
9%
40%
9%18%
11%
30%11%
43%
18%
10%
18%
45%
10% 44%
21%
36%
40%
27%
23%
56%
20%
11%7%
18%27%
5%
11%
10% 7%18%
10%18%
9%
22%
Q1'16 Q2'16 Q3'16 Q4'16 Q1'17 Q2'17 Q3'17 Q4'17
Seed Stage Early Stage Expansion Stage Later Stage Other
PwC | CB Insights MoneyTree™ Report Q4 2017 38
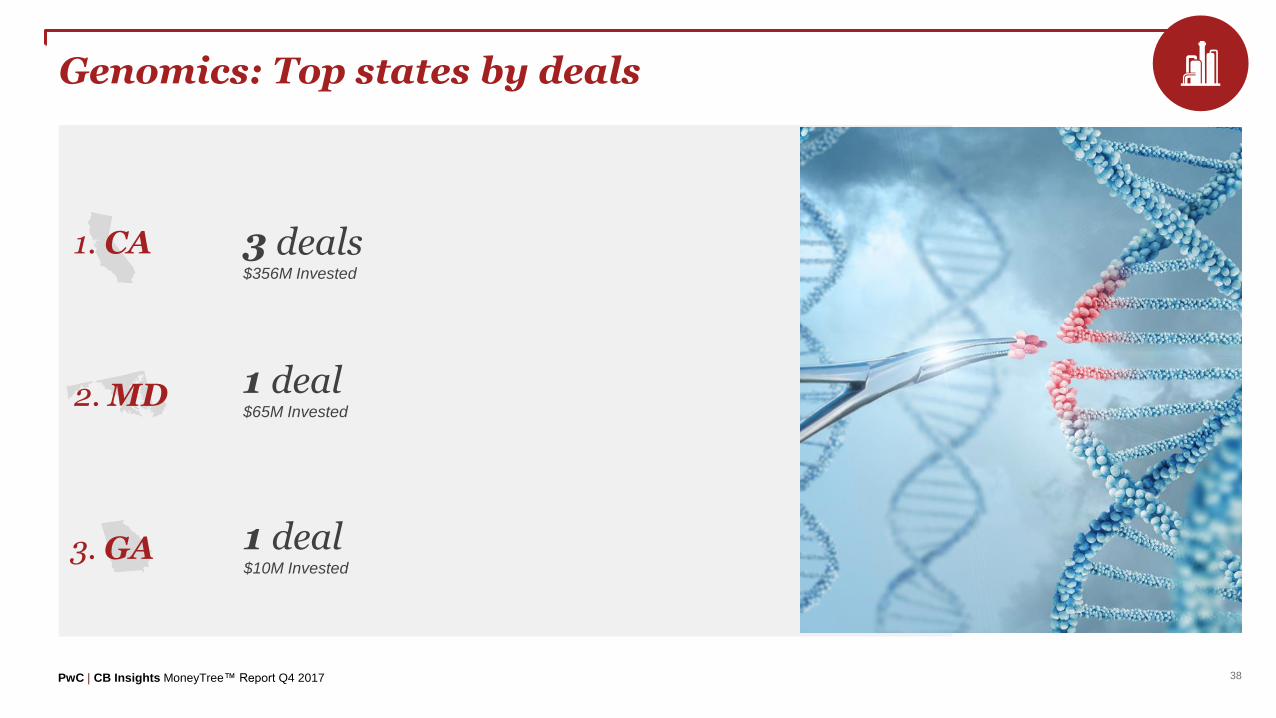
Genomics: Top states by deals
3 deals$356M Invested
1. CA
1 deal$65M Invested
1 deal$10M Invested
2. MD
3. GA
PwC | CB Insights MoneyTree™ Report Q4 2017 39
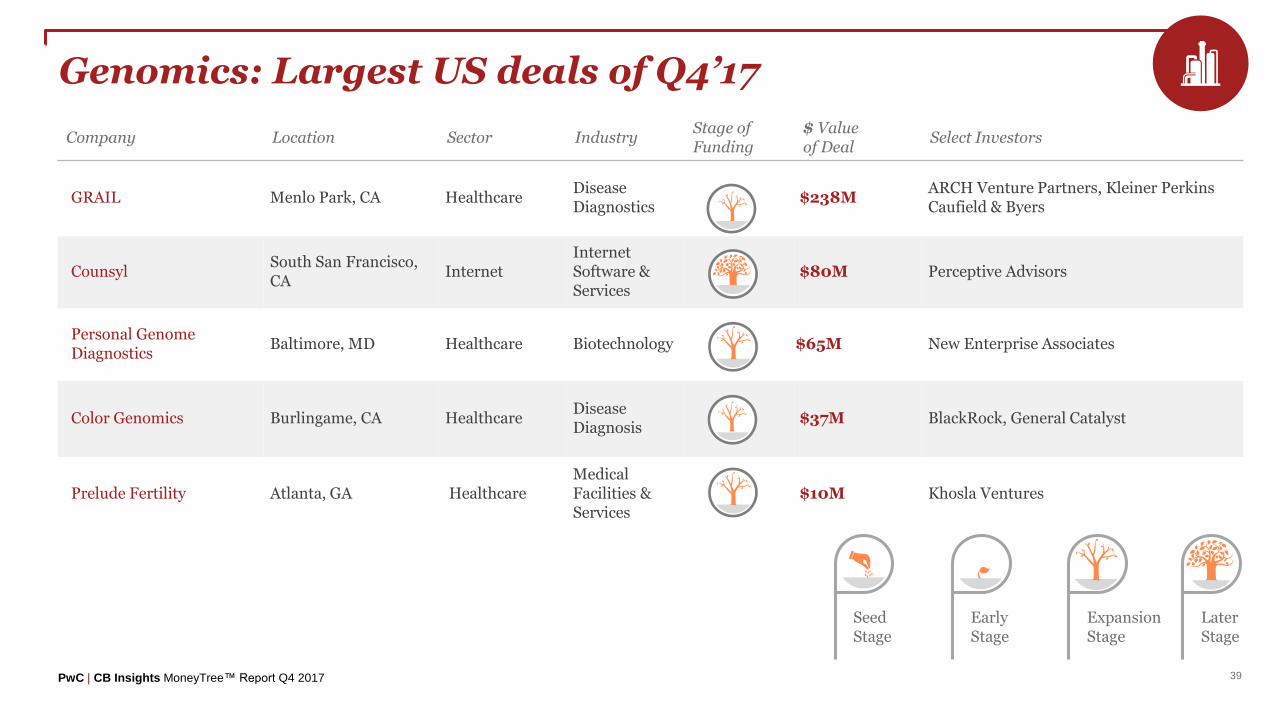
Genomics: Largest US deals of Q4’17
Company Location Sector IndustryStage of Funding
$ Valueof Deal
Select Investors
GRAIL Menlo Park, CA HealthcareDisease Diagnostics
$238MARCH Venture Partners, Kleiner Perkins Caufield & Byers
CounsylSouth San Francisco, CA
InternetInternet Software & Services
$80M Perceptive Advisors
Personal Genome Diagnostics
Baltimore, MD Healthcare Biotechnology $65M New Enterprise Associates
Color Genomics Burlingame, CA HealthcareDisease Diagnosis
$37M BlackRock, General Catalyst
Prelude Fertility Atlanta, GA HealthcareMedical Facilities & Services
$10M Khosla Ventures
Expansion Stage
Early Stage
Later Stage
Seed Stage

US Places03
PwC | CB Insights MoneyTree™ Report Q4 2017
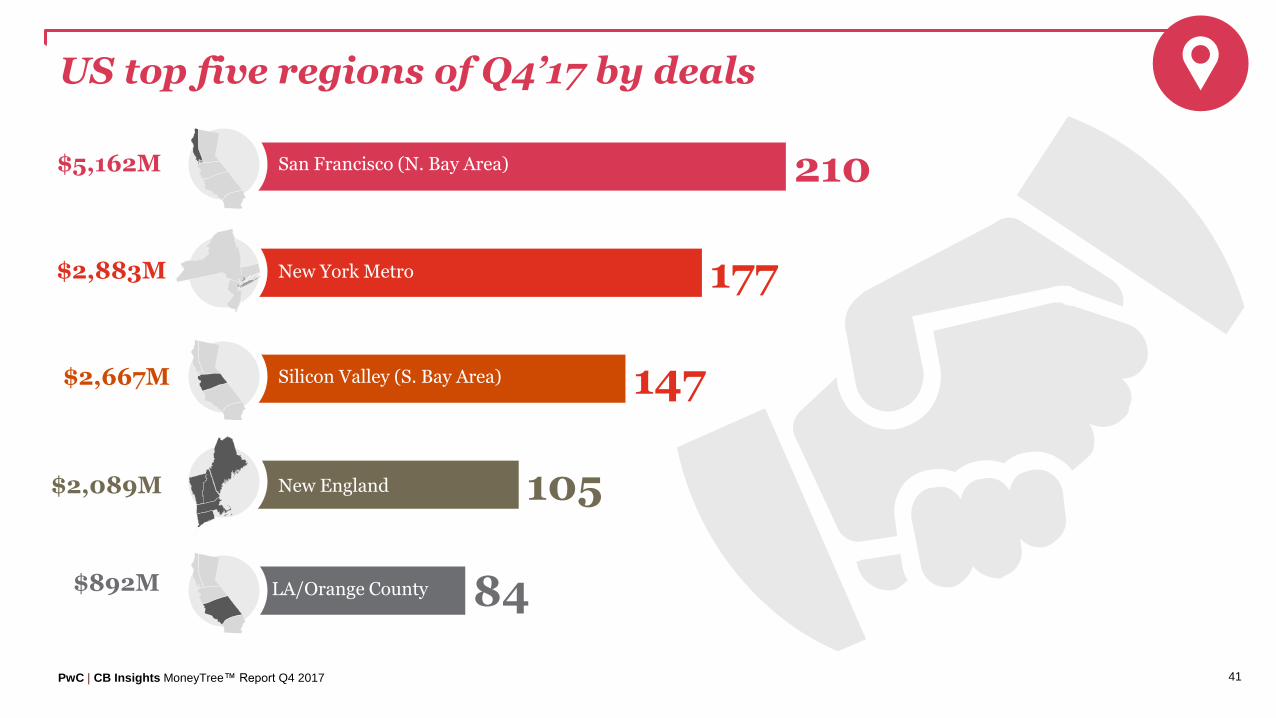
$5,162M
41
US top five regions of Q4’17 by deals
84
105
147
177
210San Francisco (N. Bay Area)
New York Metro
Silicon Valley (S. Bay Area)
New England
LA/Orange County
$2,883M
$2,667M
$2,089M
$892M
PwC | CB Insights MoneyTree™ Report Q4 2017 42
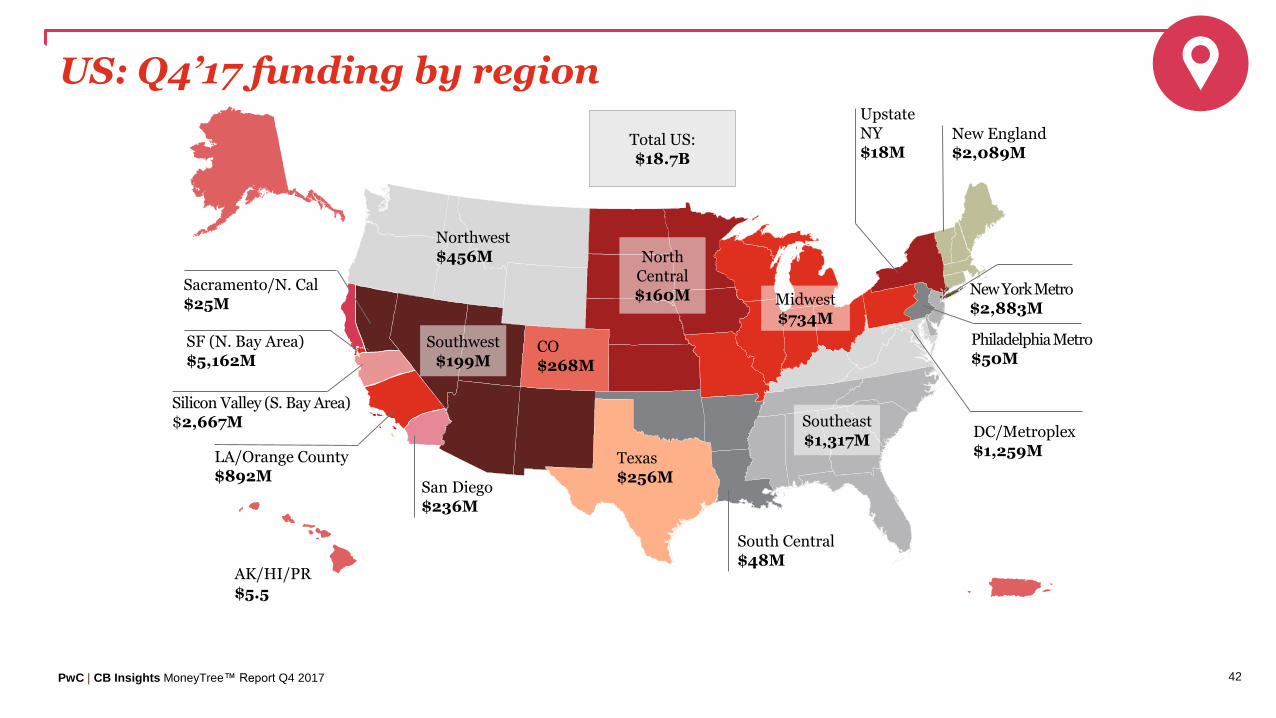
US: Q4’17 funding by region
Total US:$18.7B
SF (N. Bay Area)$5,162M
Northwest$456M
AK/HI/PR$5.5
North Central$160M
Southeast$1,317M
CO$268M
Texas$256M
New England$2,089M
Midwest$734M
New York Metro$2,883M
Upstate NY$18M
DC/Metroplex$1,259MLA/Orange County
$892M
Philadelphia Metro$50M
Silicon Valley (S. Bay Area)$2,667M
San Diego$236M
Sacramento/N. Cal$25M
Southwest$199M
South Central$48M

PwC | CB Insights MoneyTree™ Report Q4 2017 43
US: Q4’17 deals by region
SF (N. Bay Area)210 Deals
Northwest49 Deals
AK/HI/PR1 Deal
North Central
22 Deals
Southeast64 Deals
CO40 Deals
Texas42 Deals
New England105 Deals
Midwest80 Deals
New York Metro177 Deals
Upstate NY3 Deals
DC/Metroplex48 DealsLA/Orange County
84 Deals
Philadelphia Metro16 Deals
Silicon Valley (S. Bay Area)147 Deals
San Diego28 Deals
Sacramento/N. Cal1 Deal
Southwest23 Deals
South Central6 Deals
Total US:1,158 Deals

PwC | CB Insights MoneyTree™ Report Q4 2017 44
San Francisco
”
San Francisco continued to be the region with the highest annual funding level at $17.1bn in 2017 despite seeing decreases in annual funding for VC-backed companies in both deal count (-12%) and investment amounts (-8%) from 2016.
“
— Danny Wallace, Partner, US Emerging Company Services Co-leader at PwC
PwC | CB Insights MoneyTree™ Report Q4 2017 45
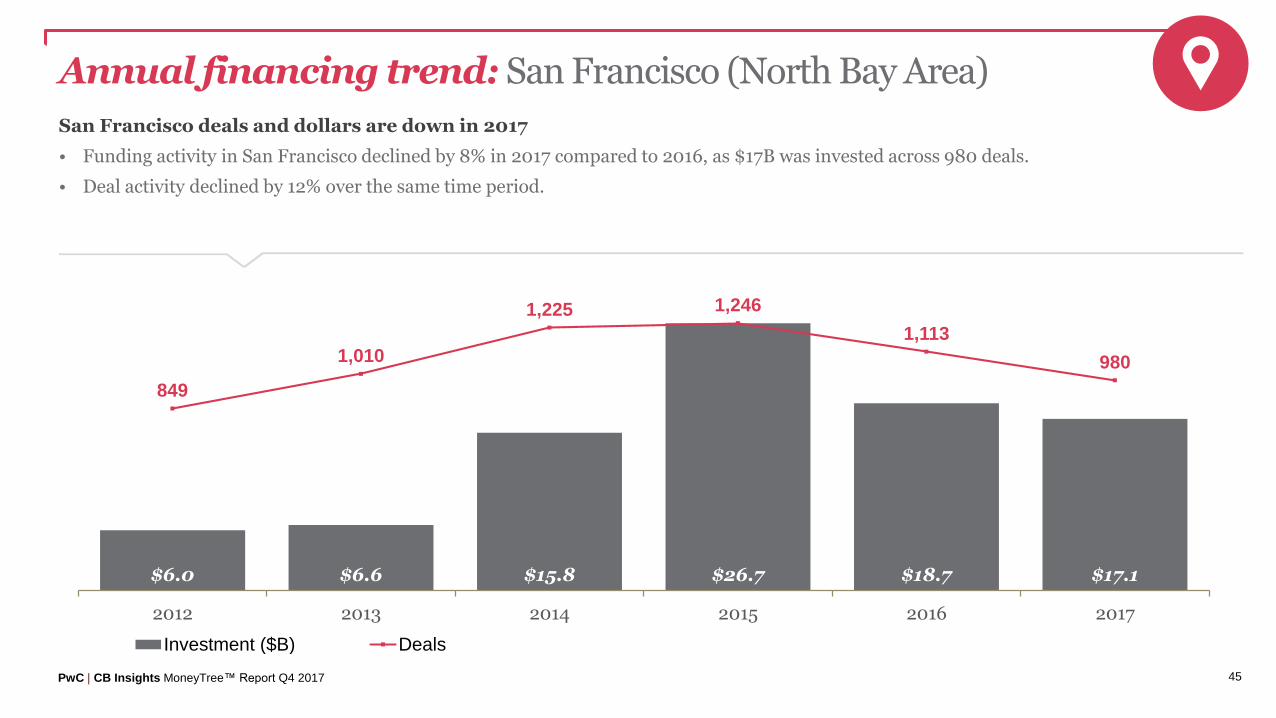
Annual financing trend: San Francisco (North Bay Area)
San Francisco deals and dollars are down in 2017
• Funding activity in San Francisco declined by 8% in 2017 compared to 2016, as $17B was invested across 980 deals.
• Deal activity declined by 12% over the same time period.
$6.0 $6.6 $15.8 $26.7 $18.7 $17.1
849
1,010
1,225 1,246
1,113
980
2012 2013 2014 2015 2016 2017
Title
Investment ($B) Deals

PwC | CB Insights MoneyTree™ Report Q4 2017 46
8-quarter financing trend: San Francisco (North Bay Area)
Q4’17 San Francisco funding surges even as deal activity declines
• Total quarterly funding to San Francisco-based companies increased 23% in Q4’17 reaching $5.2B.
• Deal activity declined 19% over the same period, decreasing from 260 deals in Q3’17 to 210 deals this past quarter as deal volume and seed-stage deals have declined across the industry.
$3,585 $7,466 $4,896 $2,767 $3,563 $4,233 $4,190 $5,162
281
315295
222
260 250 260
210
Q1'16 Q2'16 Q3'16 Q4'16 Q1'17 Q2'17 Q3'17 Q4'17
Title
Investments ($M) Deals

PwC | CB Insights MoneyTree™ Report Q4 2017 47
New York Metro
”
New York Metro Region received over $11.5B in funding in 2017. 12 NY Metro companies raised over $100M this year, with WeWorkleading the way ($2.76B raised across 3 deals).
“
— David Silverman, Partner, US Emerging Company Services Co-leader at PwC

PwC | CB Insights MoneyTree™ Report Q4 2017 48
Annual financing trend: New York Metro
New York funding activity has up year, despite flattening in deal activity
• Funding to New York-based VC-backed companies increased by 41% in 2017, despite 10 fewer deals occurring.
$2.6 $4.3 $5.8 $8.6 $8.2 $11.5
567
667
756 771741 731
2012 2013 2014 2015 2016 2017
Title
Investment ($B) Deals

PwC | CB Insights MoneyTree™ Report Q4 2017 49
8-quarter financing trend: New York Metro
Deals and dollars return to Q2’17 levels in the fourth quarter
• Deal activity in the New York Metro area declined from 184 deals in Q3’17 to 177 deals this past quarter.
• Absent the $2B+ funding to WeWork in Q3’17, total quarterly funding declined by 33%. 7 mega-rounds of $100M or more were recorded this quarter however, compared to 4 in Q3’17.
$2,680 $1,562 $1,782 $2,176 $1,591 $2,744 $4,326 $2,883
197
193
182
169
193
177
184
177
Q1'16 Q2'16 Q3'16 Q4'16 Q1'17 Q2'17 Q3'17 Q4'17
Title
Investments ($M) Deals
PwC | CB Insights MoneyTree™ Report Q4 2017 50
Silicon Valley
”
Silicon Valley venture-backed startups received the most funding ever in 2017 (surging 57% to $12.1B) while deal activity was down slightly (-5%) from 2016.
“
— Kathleen Borie, Director, US Emerging Company Services at PwC

PwC | CB Insights MoneyTree™ Report Q4 2017 51
Annual financing trend: Silicon Valley (South Bay Area)
Funding to Silicon Valley companies increases in 2017
• Funding to Silicon Valley-based VC-backed companies increased by 57% in 2017, as $12.1B was invested across 613 deals. Deal activity declined by 5%.
$6.1 $7.1 $11.4 $10.0 $7.7 $12.1
683 698
793746
645
613
2012 2013 2014 2015 2016 2017
Title
Investment ($B) Deals

PwC | CB Insights MoneyTree™ Report Q4 2017 52
8-quarter financing trend: Silicon Valley (South Bay Area)
Silicon Valley deal activity decreases as quarterly funding grows
• Deals activity decreased to 147 in Q4’17, down from 162 in Q3’17.
• Total quarterly funding increased by 18%, to reach $2.7B, with 4 mega-rounds of $100M or more.
$2,726 $2,085 $1,558 $1,320 $3,039 $4,112 $2,256 $2,667
191
142
170
142159
145
162147
Q1'16 Q2'16 Q3'16 Q4'16 Q1'17 Q2'17 Q3'17 Q4'17
Title
Investments ($M) Deals

PwC | CB Insights MoneyTree™ Report Q4 2017 53
Annual financing trend: New England
New England funding activity increases, but deals slip
• Funding to New England-based VC-backed companies increased by 15% in 2017, as $7.4B was invested across 460 deals. Deal activity declined by 5%.
$4.1 $4.0 $5.6 $7.3 $6.4 $7.4
508 509
557 555
485
460
2012 2013 2014 2015 2016 2017
Title
Investment ($B) Deals

PwC | CB Insights MoneyTree™ Report Q4 2017 54
8-quarter financing trend: New England
New England deal activity declines as funding hits a full-year high
• Deals to New England-based companies sunk to an eight-quarter low of 105, while total funding increased 13% to $2B—a 2017 high.
$1,584 $1,208 $2,220 $1,415 $1,988 $1,437 $1,852 $2,089
121 118118
128 128
111116 105
Q1'16 Q2'16 Q3'16 Q4'16 Q1'17 Q2'17 Q3'17 Q4'17
Title
Investments ($M) Deals

PwC | CB Insights MoneyTree™ Report Q4 2017 55
Annual financing trend: LA/Orange County
Deal activity increases in LA/Orange County but full-year funding is down
• Deal activity increased by 9% in LA/Orange county, but total annual funding declined by 15% as $4.3B was invested across 376 deals.
$2.9 $2.5 $4.0 $6.0 $5.1 $4.3
281313
352
404
345376
2012 2013 2014 2015 2016 2017
Title
Investment ($B) Deals

PwC | CB Insights MoneyTree™ Report Q4 2017 56
8-quarter financing trend: LA/Orange County
Deals and dollars sink in fourth quarter in LA/Orange County
• Deal count decreased by 20% to 84 deals in Q4’17.
• Quarterly funding declined by 29% to $892M, the lowest total funding amount since Q3’16.
$982 $2,491 $661 $937 $1,051 $1,112 $1,251 $892
86
104
78 77
89
98105
84
Q1'16 Q2'16 Q3'16 Q4'16 Q1'17 Q2'17 Q3'17 Q4'17
Title
Investments ($M) Deals

PwC | CB Insights MoneyTree™ Report Q4 2017 57
DC Metroplex
”
Five $100M+ 2017 investments in VC-backed startups represented the highest mega-round activity in DC/Metroplex's post-2000 history, further bolstered by a $500M deal in Q4'17, our region's largest deal.
“
— Gina Gin, Partner, Washington Metro Technology Assurance Practice Leader at PwC

PwC | CB Insights MoneyTree™ Report Q4 2017 58
Annual financing trend: DC/Metroplex
Deal and dollar activity is down in 2017 in DC/Metroplex
• Total annual funding to DC/Metroplex-based VC-backed companies declined by 11% as $2.5B was invested across 185 deals. Deal activity declined by 9%.
$0.9 $1.4 $1.4 $2.5 $2.8 $2.5
194183
238
210204
185
2012 2013 2014 2015 2016 2017
Title
Investment ($B) Deals
PwC | CB Insights MoneyTree™ Report Q4 2017 59
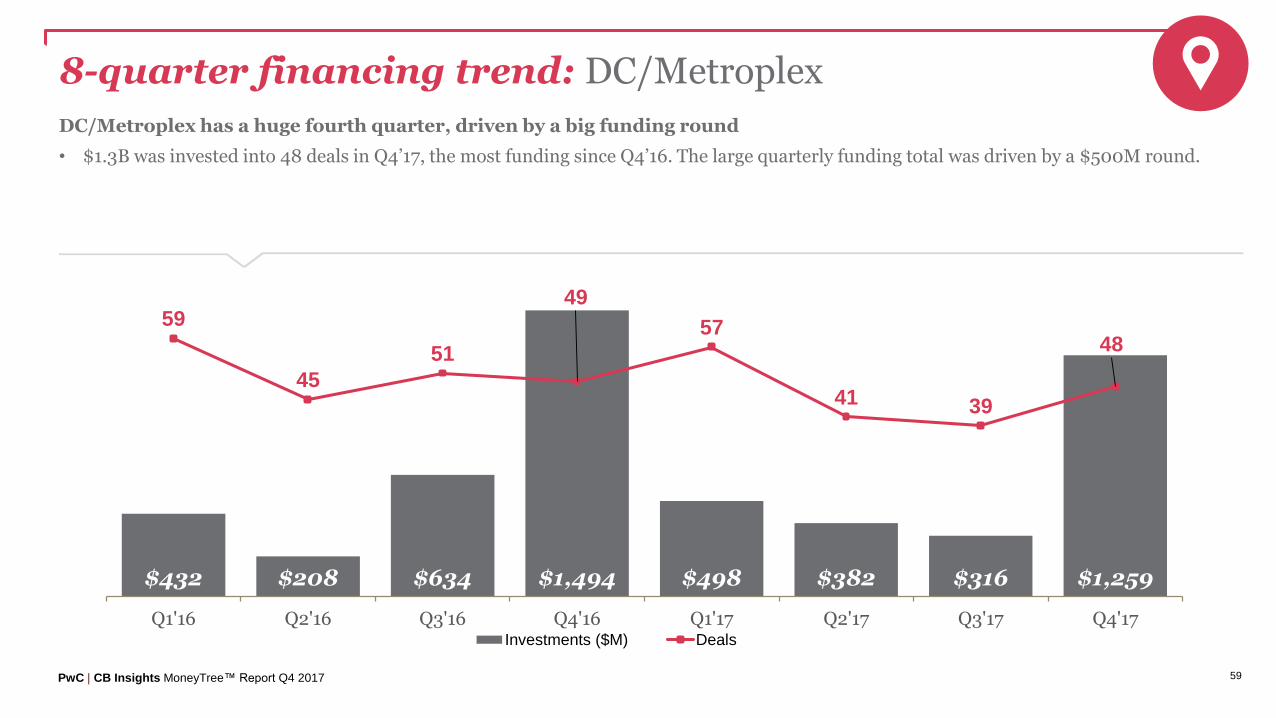
8-quarter financing trend: DC/Metroplex
DC/Metroplex has a huge fourth quarter, driven by a big funding round
• $1.3B was invested into 48 deals in Q4’17, the most funding since Q4’16. The large quarterly funding total was driven by a $500M round.
$432 $208 $634 $1,494 $498 $382 $316 $1,259
59
45
51
49
57
41 39
48
Q1'16 Q2'16 Q3'16 Q4'16 Q1'17 Q2'17 Q3'17 Q4'17
# D
eals
Investments ($M) Deals
PwC | CB Insights MoneyTree™ Report Q4 2017 60
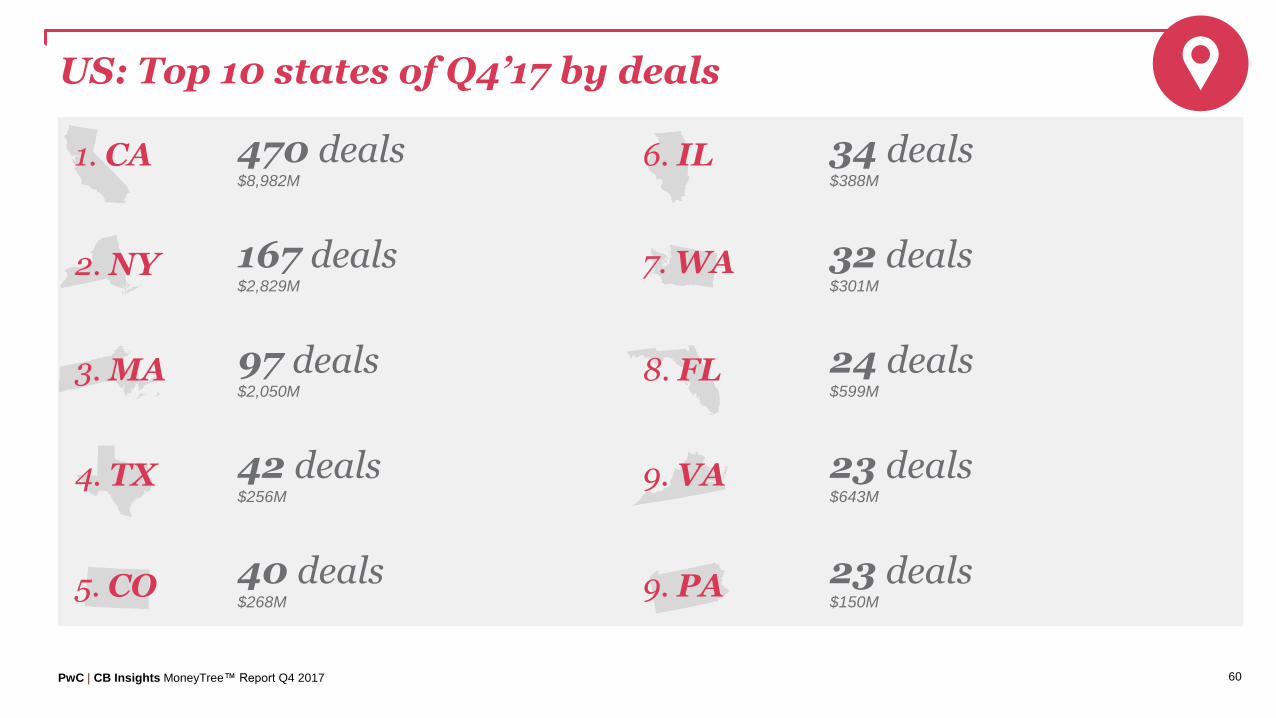
US: Top 10 states of Q4’17 by deals
470 deals$8,982M
167 deals$2,829M
97 deals$2,050M
42 deals$256M
40 deals$268M
1. CA
2. NY
3. MA
4. TX
5. CO
6. IL 34 deals$388M
32 deals$301M
24 deals$599M
23 deals$643M
23 deals$150M
7. WA
8. FL
9. PA
9. VA

PwC | CB Insights MoneyTree™ Report Q4 2017 61
Q4’17 Regional comparison: Deals CA vs. NY vs. MA
California deals sink, New York deals down
• Deal activity declined by 16% in California from 558 in Q3’17 to 470 in Q4’17.
• 6 fewer deals were recorded in New York, and 3 fewer deals were recorded in Massachusetts.
594 588 579
473
550528
558
470
192 173 175 164188
168 173 167
114 96 104 115 110 99 100 97
Q1'16 Q2'16 Q3'16 Q4'16 Q1'17 Q2'17 Q3'17 Q4'17
California New York Massachusetts
PwC | CB Insights MoneyTree™ Report Q4 2017 62
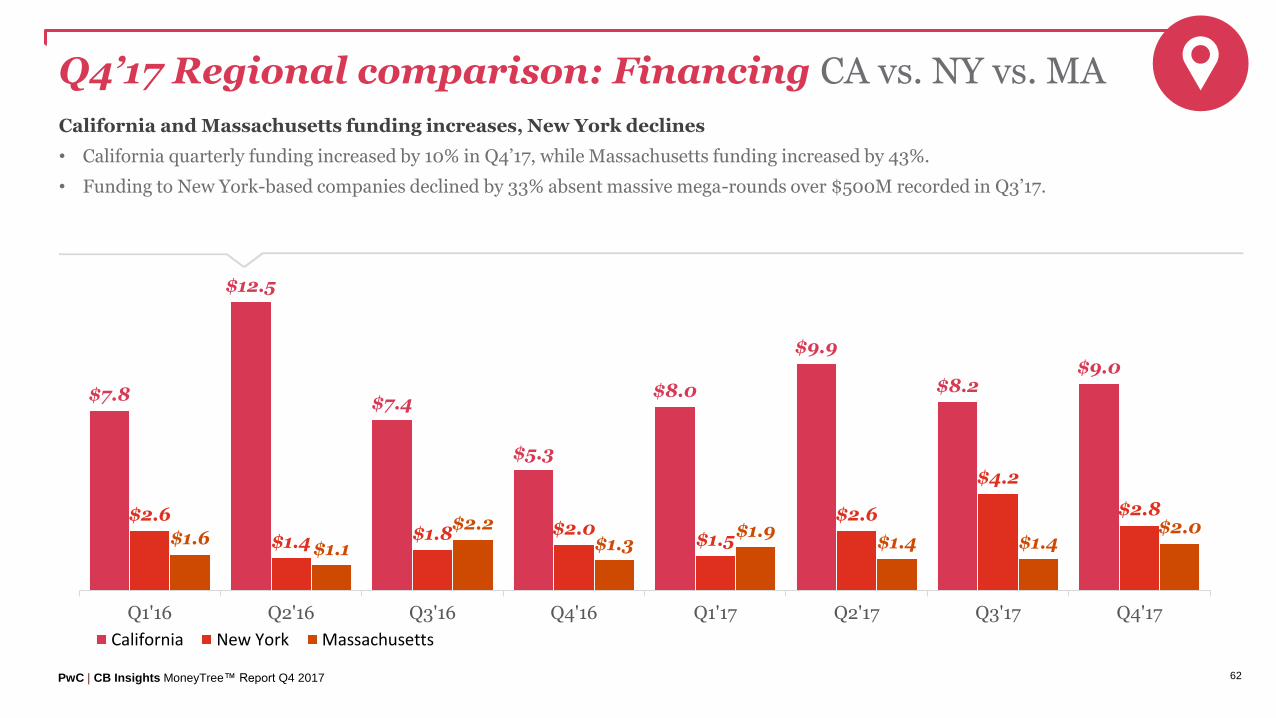
Q4’17 Regional comparison: Financing CA vs. NY vs. MA
California and Massachusetts funding increases, New York declines
• California quarterly funding increased by 10% in Q4’17, while Massachusetts funding increased by 43%.
• Funding to New York-based companies declined by 33% absent massive mega-rounds over $500M recorded in Q3’17.
$7.8
$12.5
$7.4
$5.3
$8.0
$9.9
$8.2$9.0
$2.6
$1.4 $1.8 $2.0$1.5
$2.6
$4.2
$2.8
$1.6$1.1
$2.2$1.3
$1.9$1.4 $1.4
$2.0
Q1'16 Q2'16 Q3'16 Q4'16 Q1'17 Q2'17 Q3'17 Q4'17
California New York Massachusetts

US Movers & Shakers04

PwC | CB Insights MoneyTree™ Report Q4 2017 64
Mega-rounds
”
2017 was also the busiest $100M+ mega-round year in history, surpassing 2015's record by two deals (109 vs. 107).
“
— Tom Ciccolella, Partner, US Ventures Leader at PwC

PwC | CB Insights MoneyTree™ Report Q4 2017 65
Annual US mega-round activity
Mega-rounds have a record 2017
• 109 mega-rounds were recorded in 2017, topping the 107 mega-rounds recorded in 2015.
28 25 77 107 62 109
2012 2013 2014 2015 2016 2017Mega-rounds into US VC-Backed Companies

PwC | CB Insights MoneyTree™ Report Q4 2017 66
Mega-rounds
”
On-demand transportation apps received over $2.5B of investment in 2017, marking the fourth consecutive year this category has received $2.5B+ in total annual funding. One company received the lion's share of funding this year, raising $2.1B over three rounds.
“
— Mark McCaffrey, Partner, US Technology, Media and Telecommunication Leader at PwC

PwC | CB Insights MoneyTree™ Report Q4 2017 67
Largest US deals of Q4’17
Company Location Sector IndustryStage of Funding
$ Valueof Deal
Select Investors
Lyft San Francisco, CAMobile & Telecommunications
Mobile Commerce $1000M capitalG
Magic Leap Plantation, FLSoftware (non-internet/mobile)
Scientific, Engineering Software
$502M Alibaba Group, Fidelity Investments
OneWeb Arlington, VAMobile & Telecommunications
Telecom Services $500M SoftBank Group
Lyft San Francisco, CAMobile & Telecommunications
Mobile Commerce $500M Baillie Gifford & Co., capitalG, Rakuten
Compass New York, NY InternetInternet Software & Services
$450M SoftBank Group
Expansion Stage
Early Stage
Later Stage
Seed Stage

PwC | CB Insights MoneyTree™ Report Q4 2017 68
Quarterly US mega-round activity
$100M+ mega-round financings surpass 30 for the second time in 2017
• Contributing to the high US quarterly funding total were 33 rounds of $100M or more, 8 more than Q3’17 and matching Q2’17 for an 8-quarter high.
19 14 15 14 18 33 25 330.0
5.0
10.0
15.0
20.0
25.0
30.0
35.0
Q1'16 Q2'16 Q3'16 Q4'16 Q1'17 Q2'17 Q3'17 Q4'17
Mega-rounds Into US VC-Backed Companies

PwC | CB Insights MoneyTree™ Report Q4 2017 69
Annual US mega-round share
US mega-rounds represent 36% of total funding in full-year 2017
• US mega-rounds accounted for 36% of total funding in 2017, up from 30% in 2016, as $25.7B of investment was comprised rounds valued at $100M or more.
• In full-year 2017, the US saw 109 mega-rounds.
4.9 4.1 16.9 28.1 18.2 25.727.7 32.0
42.5
48.7
43.2
46.2
15% 11%
28%
37%
30%
36%
2012 2013 2014 2015 2016 2017
Mega-round funding ($B) Non mega-round funding ($B) % Mega-rounds funding
PwC | CB Insights MoneyTree™ Report Q4 2017 70
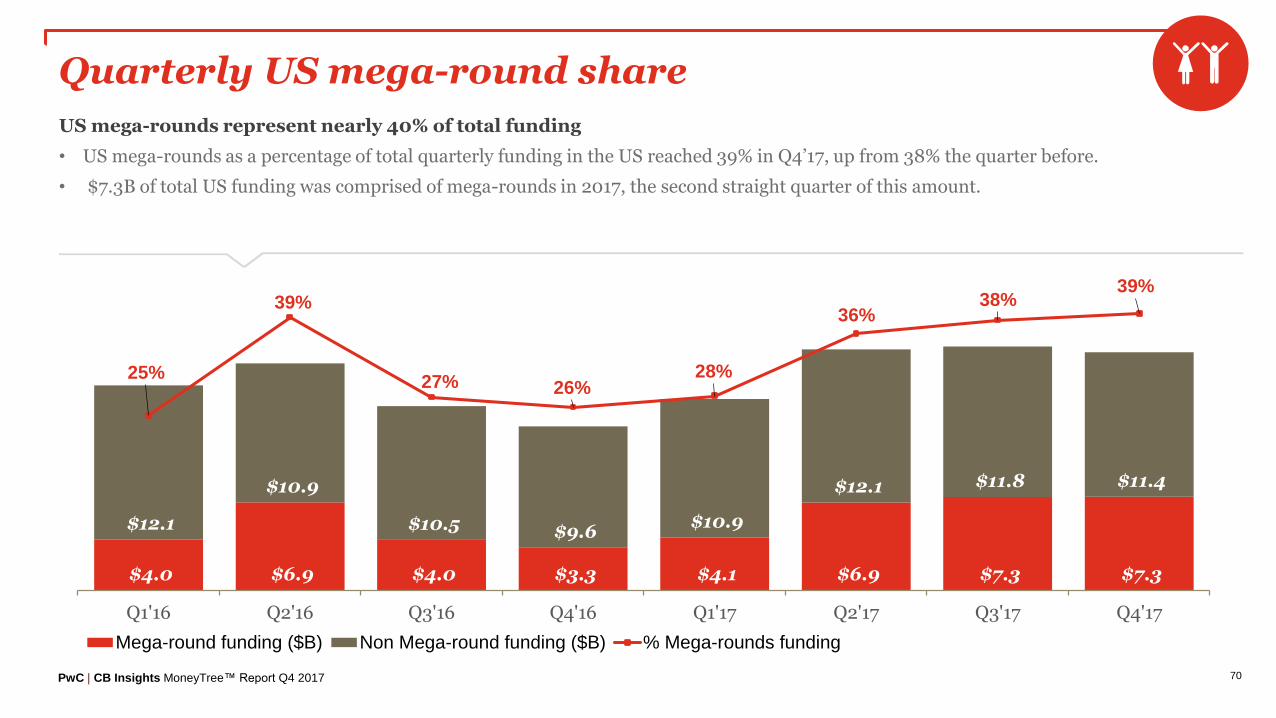
Quarterly US mega-round share
US mega-rounds represent nearly 40% of total funding
• US mega-rounds as a percentage of total quarterly funding in the US reached 39% in Q4’17, up from 38% the quarter before.
• $7.3B of total US funding was comprised of mega-rounds in 2017, the second straight quarter of this amount.
$4.0 $6.9 $4.0 $3.3 $4.1 $6.9 $7.3 $7.3
$12.1
$10.9
$10.5 $9.6 $10.9
$12.1 $11.8 $11.4
25%
39%
27% 26%28%
36%38%
39%
Q1'16 Q2'16 Q3'16 Q4'16 Q1'17 Q2'17 Q3'17 Q4'17
Mega-round funding ($B) Non Mega-round funding ($B) % Mega-rounds funding

PwC | CB Insights MoneyTree™ Report Q4 2017 71
US annual new unicorn births
VC-backed unicorn creation increases in 2017
• 22 private companies reached a billion-dollar valuation in 2017.
• This was up 57% from the slowdown in 2016, but is still down significantly compared to the unicorn craze of 2014 through 2015.
710
37
41
14
22
2012 2013 2014 2015 2016 2017US VC-Backed Unicorn Births

PwC | CB Insights MoneyTree™ Report Q4 2017 72
US quarterly new unicorn births
VC-backed unicorn creation rate flattens in the US
• 4 new VC-backed companies reached $1B+ valuations in Q4’17, one less than in Q3’17.
• New companies joining the unicorn club included Affirm, Duo Security, and Squarespace.
6
2
5
4
3 3
10
5
4
Q4'15 Q1'16 Q2'16 Q3'16 Q4'16 Q1'17 Q2'17 Q3'17 Q4'17
Number of New US VC-Backed Unicorns

PwC | CB Insights MoneyTree™ Report Q4 2017 73
Most active VC firms of Q4’17 in the US
Investor LocationNo. of US Companies
Select Q4’17 Investments
1. New Enterprise Associates Menlo Park, CA 32 WellTok, Moda Operandi, Allakos
2. Intel Capital Santa Clara, CA 17 MAANA, Foghorn Systems, MariaDB
3. Plug and Play Ventures Sunnyvale, CA 15 Madison Reed, Slice Labs, Cargo Systems
3. Google Ventures Mountain View, CA 15Arcus Biosciences, Veo Robotics, Lemonade
5. Lightspeed Venture Partners Menlo Park, CA 14 Affirm, Daily Harvest, Kespry
PwC | CB Insights MoneyTree™ Report Q4 2017
Stage of funding
Location of investors
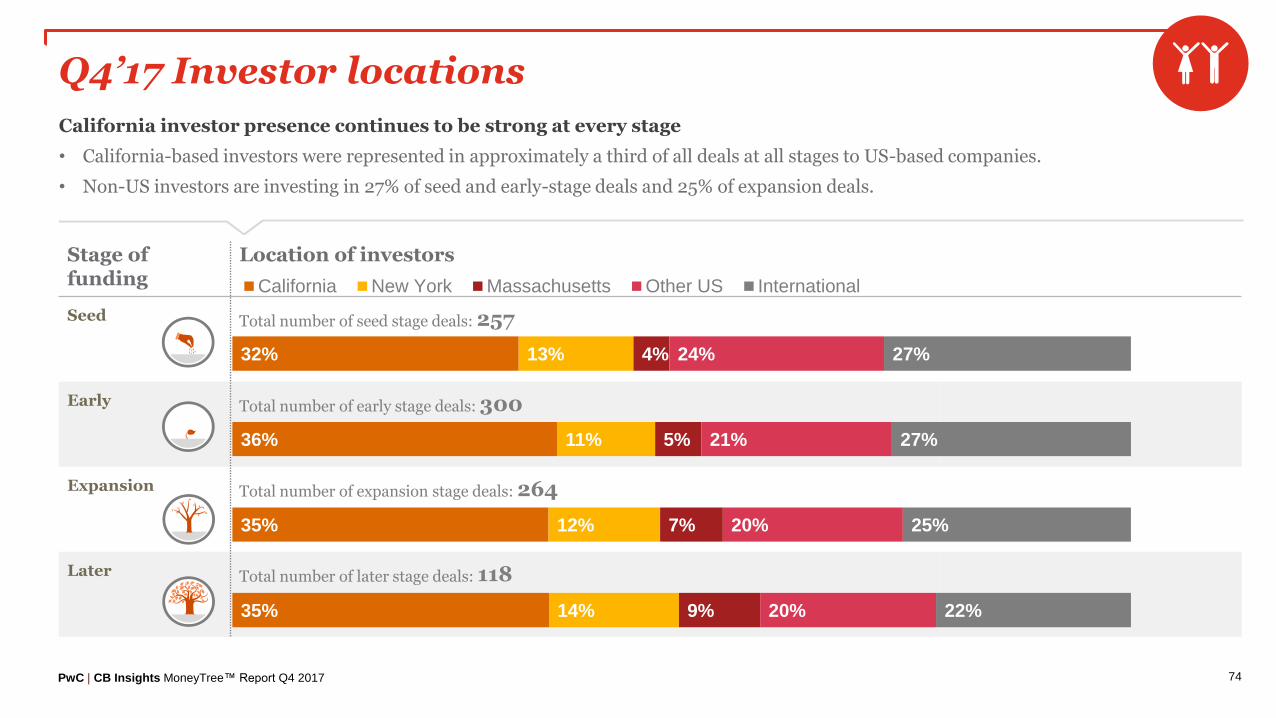
Seed Total number of seed stage deals: 257
Early Total number of early stage deals: 300
Expansion Total number of expansion stage deals: 264
Later Total number of later stage deals: 118
74
Q4’17 Investor locations
California investor presence continues to be strong at every stage
• California-based investors were represented in approximately a third of all deals at all stages to US-based companies.
• Non-US investors are investing in 27% of seed and early-stage deals and 25% of expansion deals.
32%
36%
35%
35%
13%
11%
12%
14%
4%
5%
7%
9%
24%
21%
20%
20%
27%
27%
25%
22%
California New York Massachusetts Other US International

Global Trends05

PwC | CB Insights MoneyTree™ Report Q4 2017 76
2017 Global regional comparison
Deals
Deals
5,365$74.5B
2,847$70.8B
2,483$17.6B
11,042 Deals$164.4B Invested
Globally

PwC | CB Insights MoneyTree™ Report Q4 2017 77
Annual global financing trend
Global financing activity sees record year in this millenium
• Total annual global funding increased nearly 50% in 2017, as $164.4B was invested across 11,042 deals.
• Deal activity increased by 11% to over 11,000. Both deal and dollar activity surpassed the highs seen in 2015.
$45.3 $52.0 $93.3 $136.2 $110.0 $164.4
6,823
7,861
9,20110,102 9,989
11,042
0
2,000
4,000
6,000
8,000
10,000
12,000
2012 2013 2014 2015 2016 2017
Title
Investment ($B) Deals

PwC | CB Insights MoneyTree™ Report Q4 2017 78
Q4’17 Global regional comparison
Deals
Deals
1,223$19.3B
881$22.6B
624$4.3B
2,827 Deals$46.6B Invested
Globally

PwC | CB Insights MoneyTree™ Report Q4 2017 79
8-quarter global financing trend
Global funding increases as deals flatten
• Total global quarterly funding increased 5% in Q4’17, as $46.7B was invested across 2,827 deals.
• Deal activity declined by less than a percentage point compared to the quarter before.
$28.2 $30.9 $27.2 $23.7 $29.2 $44.3 $44.3 $46.7
2,561
2,474 2,524
2,430
2,673
2,691
2,8512,827
Q1'16 Q2'16 Q3'16 Q4'16 Q1'17 Q2'17 Q3'17 Q4'17
Investments ($B) Deals

PwC | CB Insights MoneyTree™ Report Q4 2017 80
Global corporate deal participation
Corporate participation increases to 28% globally in the fourth quarter
• Corporations (and/or their venture arms) participated in 28% of all deals to VC-backed companies in Q4’17.
• Corporates have participated in 25%+ of deals throughout full-year 2017.
76% 76% 74% 76% 74% 73% 75% 72%
24% 24% 26% 24% 26% 27% 25% 28%
Q1'16 Q2'16 Q3'16 Q4'16 Q1'17 Q2'17 Q3'17 Q4'17
Other Investors Corp / CVC Deal Participation

PwC | CB Insights MoneyTree™ Report Q4 2017 81
Annual global financing trend: North America
North America funding increases as deal activity declines in full-year 2017
• Total annual funding activity increased 17% in 2017, as $74.5B was invested across 5,365 deals. Deal activity decreased by 5%.
$34.0 $37.8 $60.7 $78.8 $63.5 $74.5
4,8185,299
6,063 6,0805,620 5,365
0
1,000
2,000
3,000
4,000
5,000
6,000
7,000
2012 2013 2014 2015 2016 2017
Title
Investment ($B) Deals

PwC | CB Insights MoneyTree™ Report Q4 2017 82
8-quarter financing trend: North America
North America financing activity directionally similar to US; funding and deal count decrease
• VC-backed companies in North America received $19.3B of total funding across 1,223 deals, a 4% decrease in funding and a 12% decrease in deal activity.
• US financing activity accounted for 95% of deals and 97% of dollars invested in North America.
$16.5 $18.5 $14.9 $13.7 $15.6 $19.5 $20.1 $19.3
1,505
1,409
1,390
1,316
1,417
1,335
1,390
1,223
Q1'16 Q2'16 Q3'16 Q4'16 Q1'17 Q2'17 Q3'17 Q4'17
Investments ($B) Deals

PwC | CB Insights MoneyTree™ Report Q4 2017 83
North America corporate deal participation
Corporate participation increases a percentage point in North America, but remains below Q2’17 high
• Corporations (and/or their venture arms) participated in 24% of Q4’17 deals to VC-backed companies in North America; a one percentage point increase from 23% in Q3’17, but still below 26% in Q2’17.
78% 77% 75% 78% 76% 74% 77% 76%
22% 23% 25% 22% 24% 26% 23% 24%
Q1'16 Q2'16 Q3'16 Q4'16 Q1'17 Q2'17 Q3'17 Q4'17
Other Investors Corp / CVC Deal Participation

PwC | CB Insights MoneyTree™ Report Q4 2017 84
Annual global financing trend: Europe
Europe financing activity increases in full-year 2017
• Total annual Europe funding activity increased by 40% in 2017, as $17.6B was invested across 2,483 deals. Deal activity increased by 16%.
$5.3 $6.4 $9.6 $13.6 $12.6 $17.6
1,132
1,403 1,482
1,8512,134
2,483
0
500
1,000
1,500
2,000
2,500
3,000
2012 2013 2014 2015 2016 2017
Title
Investment ($B) Deals

PwC | CB Insights MoneyTree™ Report Q4 2017 85
8-quarter financing trend: Europe
Europe funding activity slips, but deal activity increases
• Quarterly funding decreased to $4.3B in Q4’17, a 22% decrease from $5.5B last quarter.
• Deal activity increased 6% in Q4’17, increasing from 590 deals in Q3’17 to 624 deals.
$3.6 $3.0 $2.5 $3.5 $3.4 $4.4 $5.5 $4.3
469
526558
581
663
606 590 624
Q1'16 Q2'16 Q3'16 Q4'16 Q1'17 Q2'17 Q3'17 Q4'17
Investments ($B) Deals
PwC | CB Insights MoneyTree™ Report Q4 2017 86
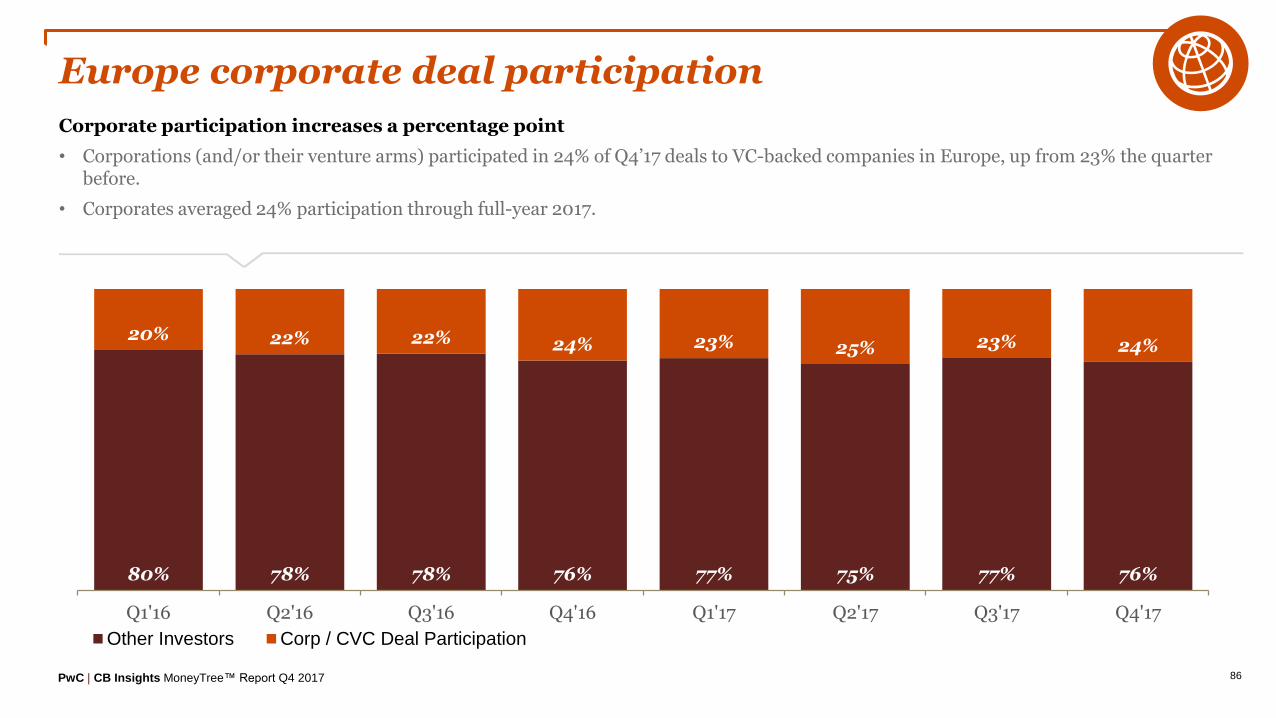
Europe corporate deal participation
Corporate participation increases a percentage point
• Corporations (and/or their venture arms) participated in 24% of Q4’17 deals to VC-backed companies in Europe, up from 23% the quarter before.
• Corporates averaged 24% participation through full-year 2017.
80% 78% 78% 76% 77% 75% 77% 76%
20% 22% 22% 24% 23% 25% 23% 24%
Q1'16 Q2'16 Q3'16 Q4'16 Q1'17 Q2'17 Q3'17 Q4'17
Other Investors Corp / CVC Deal Participation

PwC | CB Insights MoneyTree™ Report Q4 2017 87
Annual global financing trend: Asia
Asia achieves massive year-over-year growth in financing activity through full-year 2017
• Total annual Asia funding activity increased by 117% as $70.8B was invested across 2,847 deals, up from $32.7B in 2016. The top 5 largest deals of Q4’17 accounted for over $11B in funding.
• Deal activity increased by 46%.
$5.2$7.3 $21.6 $42.5 $32.7 $70.8
743
1,011
1,488
1,951 1,950
2,847
0
500
1,000
1,500
2,000
2,500
3,000
2012 2013 2014 2015 2016 2017
Title
Investment ($B) Deals
PwC | CB Insights MoneyTree™ Report Q4 2017 88
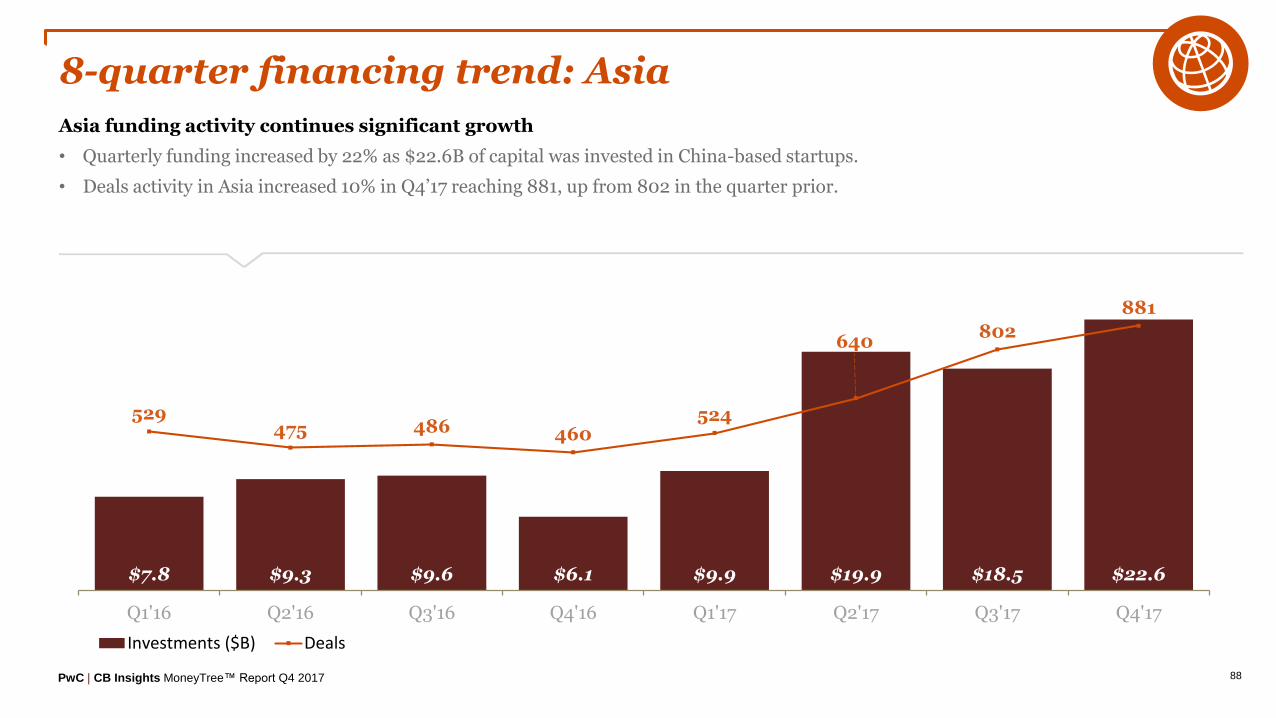
8-quarter financing trend: Asia
Asia funding activity continues significant growth
• Quarterly funding increased by 22% as $22.6B of capital was invested in China-based startups.
• Deals activity in Asia increased 10% in Q4’17 reaching 881, up from 802 in the quarter prior.
$7.8 $9.3 $9.6 $6.1 $9.9 $19.9 $18.5 $22.6
529475 486 460
524
640802
881
Q1'16 Q2'16 Q3'16 Q4'16 Q1'17 Q2'17 Q3'17 Q4'17
Investments ($B) Deals

PwC | CB Insights MoneyTree™ Report Q4 2017 89
Asia corporate deal participation
Corporate participation in Asia increases after Q3’17
• Corporations (and/or their venture arms) participated in 35% of deals to VC-backed companies in Asia in Q4’17.
• This represents a return to the level of corporate participation recorded in the first half of 2017 and gives Asia the highest continental percentage compared to N. America and Europe by 11 percentage points.
68% 68% 62% 70% 64% 65% 68% 65%
32% 32%38%
30%36% 35% 32%
35%
Q1'16 Q2'16 Q3'16 Q4'16 Q1'17 Q2'17 Q3'17 Q4'17
Other Investors Corp / CVC Deal Participation

PwC | CB Insights MoneyTree™ Report Q4 2017 90
Largest global deals of Q4’17
Company Location Sector IndustryStage of Funding
$ Valueof Deal
Select Investors
Didi Chuxing Beijing, ChinaMobile & Telecommunications
Mobile Commerce $4,000MMubadala Investment Company, SoftBank Group
China Internet Plus Beijing, China Internet e-Commerce $4,000MCoatue Management, IDG Capital, Sequoia Capital China
Olacabs Bengaluru, IndiaMobile & Telecommunications
Mobile Commerce $1,100M SoftBank Group, Tencent Holdings
Ofo Beijing, ChinaMobile & Telecommunications
Mobile Commerce $1,000M Alibaba Group
NIO Shanghai, ChinaAutomotive & Transportation
Automobile Manufacturing
$1,000MBaillie Gifford & Co., China Asset Management Co.
LyftSan Francisco, United States
Mobile & Telecommunications
Mobile Commerce $1,000M capitalG
Expansion Stage
Early Stage
Later Stage
Seed Stage

PwC | CB Insights MoneyTree™ Report Q4 2017 91
Most active VC firms of Q4’17 globally
Investor LocationNo. of Global Companies
Select Q4’17 Investments
1. New Enterprise Associates California, US 33 Allakos, Cydan, WellTok
2. Sequoia Capital China Beijing, China 28 Guazi, Klook, Kneron
3. 500 Startups California, US 26 Shippo, Trukker, Finova Financial
4. Intel Capital California, US 25Horizon Robotics, EchoPixel, MAANA
5. ZhenFund Beijing, China 22 NEIWAI, TransferEasy, MioTech
PwC | CB Insights MoneyTree™ Report Q4 2017 92
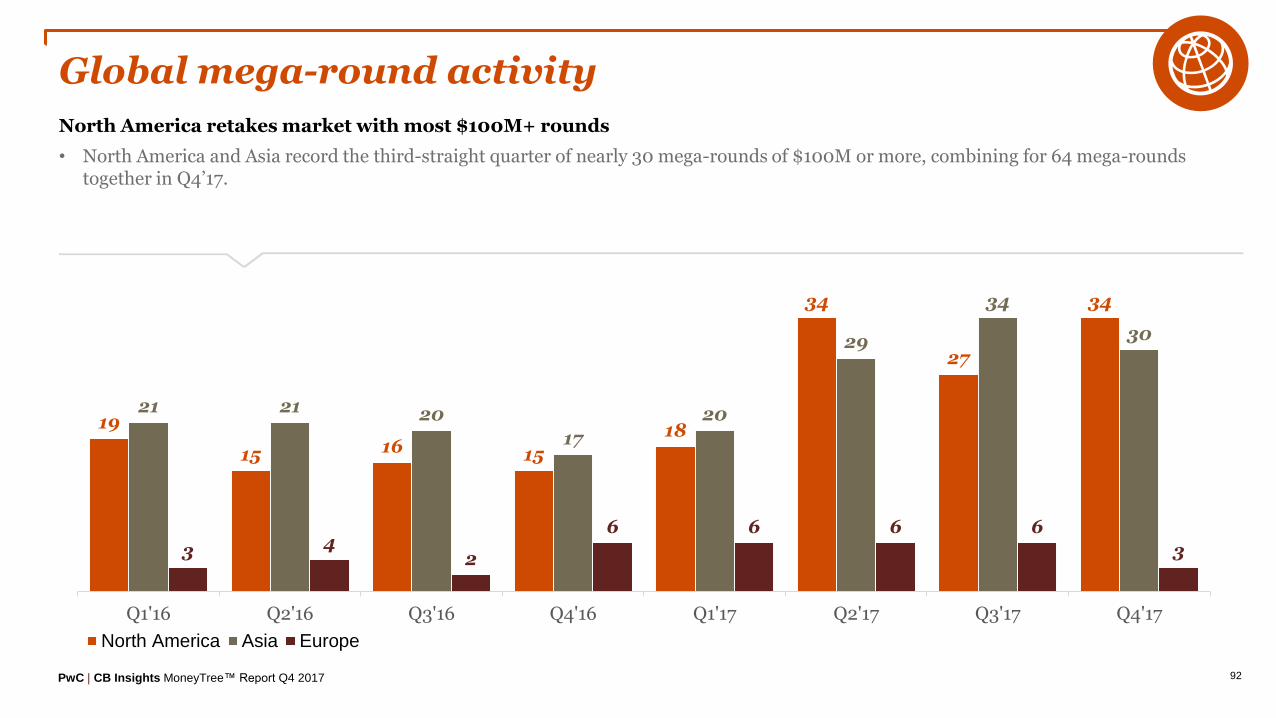
Global mega-round activity
North America retakes market with most $100M+ rounds
• North America and Asia record the third-straight quarter of nearly 30 mega-rounds of $100M or more, combining for 64 mega-roundstogether in Q4’17.
19
15 16 15
18
34
27
34
21 21 20
17
20
29
34
30
3 42
6 6 6 6
3
0.0
5.0
10.0
15.0
20.0
25.0
30.0
35.0
40.0
Q1'16 Q2'16 Q3'16 Q4'16 Q1'17 Q2'17 Q3'17 Q4'17
North America Asia Europe

PwC | CB Insights MoneyTree™ Report Q4 2017 93
Global new unicorn births
Unicorn creation flattens in Q4’17
• North America saw 4 companies joining the ranks of private companies valued at $1B or more in Q4’17, one less than Q3’17. Asia saw 4 companies become unicorns, one less than Q3’17.
53 3
5
3
4
6
5
4
01
0 0 0 0
1
3
0
6
2
5
43
3
10
5
4
Q4'15 Q1'16 Q2'16 Q3'16 Q4'16 Q1'17 Q2'17 Q3'17 Q4'17
Asia Europe North America

PwC | CB Insights MoneyTree™ Report Q4 2017 94
Global seed-stage median deal size
Seed deals sizes increase in North America and Asia
• Median North America deal sizes increased from $1.5M to $2.1M in Q4’17.
• Asia seed deals increased from a median of $1M to $1.5M this quarter.
$1.0
$1.3
$1.1
$1.5
$1.3
$1.9
$1.5
$2.1
$0.7
$1.0
$0.9 $0.9 $0.8
$1.3
$1.0
$1.5
$0.8$0.9
$0.9$1.0 $1.0
$1.1
$1.2
$1.3
Q1'16 Q2'16 Q3'16 Q4'16 Q1'17 Q2'17 Q3'17 Q4'17
North America ($M) Asia ($M) Europe ($M)

PwC | CB Insights MoneyTree™ Report Q4 2017 95
Global early-stage median deal size
North America retakes largest median early-stage deal sizes in Q4’17
• Median early-stage deal sizes in North America increased to $6.9M this quarter. Asia median deal sizes declined to $6.2M.
$5.0$5.5
$6.0
$5.8
$6.0
$6.0$6.3
$6.9
$5.0$5.2
$6.0
$6.1
$5.8
$6.6$7.1
$6.2
$5.8
$4.5
$3.9
$5.0 $5.0 $5.0 $5.0 $5.0
Q1'16 Q2'16 Q3'16 Q4'16 Q1'17 Q2'17 Q3'17 Q4'17
North America ($M) Asia ($M) Europe ($M)

PwC | CB Insights MoneyTree™ Report Q4 2017 96
Global expansion-stage median deal size
Expansion-stage deal sizes decline in Asia, North America deal sizes bend upwards
• Median expansion-stage deal sizes in Asia slid to $15.1M in Q4’17, down from $18.4M in Q3’17.
• North America expansion-stage deal sizes increased from $15M to $17.5M.
$16.7$15.4
$13.0$14.1
$15.0
$15.6
$15.0
$17.5$16.7
$20.0
$15.5 $15.0$16.0
$15.0
$18.4
$15.1
$12.0
$15.8
$9.1$10.4
$11.2$10.5 $10.5 $10.5
Q1'16 Q2'16 Q3'16 Q4'16 Q1'17 Q2'17 Q3'17 Q4'17
North America ($M) Asia ($M) Europe ($M)

PwC | CB Insights MoneyTree™ Report Q4 2017 97
Global later-stage median deal size
Asia later-stage deal sizes decrease but remain head and shoulders above North America and Europe
• Median later-stage deal sizes declined from $67.5M in Q3’17 to $61.2M in Q4’17.
• North America deal sizes declined to $26.6M after two quarters at ~$30M. Europe later-stage deal sizes jumped up from $12M in Q3’17 to $20.8M in Q4’17.
$23.0$25.6
$23.0 $25.0 $22.9$30.7 $30.0 $26.6$25.1
$100.0
$30.0$33.3
$55.5
$76.3$67.5
$61.2
$12.1 $15.0 $13.3 $13.5$17.8
$11.7 $12.0$20.8
Q1'16 Q2'16 Q3'16 Q4'16 Q1'17 Q2'17 Q3'17 Q4'17
North America ($M) Asia ($M) Europe ($M)

AppendixAppendix

PwC | CB Insights MoneyTree™ Report Q4 2017 99
US States: Full listing
State $MNo. of Deals
Alabama $0.47 2
Arizona $5.33 3
California $8,982 470
Colorado $268 40
Connecticut $33 7
DC $214 10
Delaware $13.5 4
Florida $599 24
Georgia $574 14
Hawaii $5.5 1
No disclosed quarterly activity: AK, AR, KY, MS, ND, NH, NM OK, WV, WY
State $MNo. of Deals
Idaho $0.5 1
Illinois $388 34
Indiana $55.6 8
Iowa $2.5 2
Kansas $34.6 3
Louisiana $13.7 3
Maine $5 2
Maryland $401.7 15
Massachusetts $2,050 97
Michigan $150.6 9
State $MNo. of Deals
Minnesota $107.5 7
Missouri $2.9 2
Montana $5.5 2
Nebraska $31.7 7
Nevada $4.5 2
New Jersey $70.7 12
New York $2,829 167
North Carolina $102.7 16
Ohio $22.2 16
Oregon $149.4 14
State $MNo. of Deals
Pennsylvania $150 23
Rhode Island $1.8 1
South Carolina $3.6 2
Tennessee $37 6
Texas $256 42
Utah $188.8 18
Vermont $1 1
Virginia $643.1 23
Washington $301 32
Wisconsin $18.3 6

PwC | CB Insights MoneyTree™ Report Q4 2017 100
Notes on methodology
PwC (pwc.com/moneytree) and CB Insights (cbinsights.com) encourage you to review the methodology and definitions employed to better understand the numbers presented in this report. If you have any questions about the definitions or methodological principles used, we encou rage you to reach out to CB Insights directly. Additionally, if you feel your firm has been underrepresented, please send an email to [email protected] and we can work together to ensure your firm’s investment data is up-to-date.
Rankings, e.g., top states and top sectors, are done by quarterly deal activity (that is, deal count for the given quarter).
What is included:
- Equity financings into emerging companies. Fundings must be to VC-backed companies, which are defined as companies that have received funding at any point from either: venture capital firms, corporate venture arms, or super angel investors.
- Fundings of private companies only. Funding rounds raised by public companies of any kind on any exchange (including Pink Sheets) are excluded from our numbers, even if they received investment by a venture firm(s).
- Only includes the investment made in the quarter for tranched investments. If a company does a second closing of its Series B round for $5M and previously had closed $2M in a prior quarter, only the $5M is reflected in our results.
- Round numbers reflect what has closed – not what is intended. If a company indicates the closing of $5M out of a desired raise of $15M, our numbers reflect only the amount which has closed.
- Only verifiable fundings are included. Fundings are verified via (1) various federal and state regulatory filings; (2) direct confirmation with firm or investor; (3) press release; or (4) credible media sources.
- Equity fundings to joint ventures and spinoffs/spinouts are included, given that they meet the VC-backed criteria.
- Geography note: Israel funding figures are classified in Asia.
What is excluded:
- No contingent funding. If a company receives a commitment for $20M subject to hitting certain milestones but first gets $8M, only the $8M is included in our data.
- No business development / R&D arrangements whether transferable into equity now, later or never. If a company signs a $300M R&D partnership with a larger corporation, this is not equity financing nor is it from venture capital firms. As a result, it is not included.
- No buyouts, consolidations or recapitalizations. All three of these transaction types are commonly employed by private equity firms and are tracked by CB Insights. However, they are excluded for the purposes of this report.
- No private placements. These investments, also known as PIPEs (Private Investment in Public Equities), are not included even if made by a venture capital firm(s).
- No debt/loans of any kind (except convertible notes). Venture debt or any kind of debt/loan issued to emerging, startup companies, even if included as an additional part of an equity financing, is not included. If a company receives $3M with $2M from venture investors and $1M in debt, only the $2M is included in these statistics.
- No non-equity government funding. Grants or loans by the federal government, state agencies, or public-private partnerships to emerging, startup companies are not included.
- No fundings to subsidiaries of a larger parent corporation.

This content is for general information purposes only, and should not be used as a substitute for consultation with professional advisors. Data is current as of January 5, 2018. PricewaterhouseCoopers and CB Insights have taken responsible steps to ensure that the information contained in the MoneyTree™ Report has been obtained from reliable sources. However, neither PwC nor CB Insights can warrant the ultimate validity of the data obtained in this manner. Results are updated periodically. Therefore, all data is subject to change at any time.
© 2018 PwC. All rights reserved. PwC refers to the US member firm or one of its subsidiaries or affiliates, and may sometimes refer to the PwC network. Each member firm is a separate legal entity. Please see www.pwc.com/structure for further details.