
PwC 2015-16 Annual Regulatory Compliance and … Compliance and Quality Report ... regulatory...
21
1 Annual Regulatory Compliance and Quality Report PwC LLP June 2016 Audit 2015/16
Transcript of PwC 2015-16 Annual Regulatory Compliance and … Compliance and Quality Report ... regulatory...

1
Annual Regulatory Compliance and Quality Report PwC LLP June 2016
Audit 2015/16

2
Public Sector Audit Appointments Limited (PSAA) is an independent company limited by guarantee incorporat ed by the Local Government Association in August 2014.
The Secretary of State for Communities and Local Go vernment delegated statutory functions (from the Audit Commi ssion Act 1998) to PSAA by way of a letter of delegation issu ed under powers contained in the Local Audit and Accountabil ity Act 2014.
The company is responsible for appointing auditors to local government, police and local NHS bodies, for settin g audit fees and for making arrangements for the certification o f housing benefit subsidy claims.
Before 1 April 2015, these responsibilities were di scharged by the Audit Commission.

3
Contents Summary report .............................................................................................................................. 4
Introduction ............................................................................................................................ 4
Overall performance .............................................................................................................. 5
Detailed report ................................................................................................................................ 6
Quality review programme .................................................................................................... 6
Regulatory compliance ........................................................................................................ 12
Recommendations ............................................................................................................... 14
Appendix 1 – Weightings to calculate overall quality score ........................................................... 15
Appendix 2 - Audit quality and regulatory compliance RAG rating ................................................. 16
Appendix 3 - Results of 2014/15 regulatory compliance monitoring .............................................. 18

4
Summary report
Introduction
1 Public Sector Audit Appointments Limited (PSAA) monitors the performance of all its audit firms. The results of our monitoring provide audited bodies and other stakeholders with assurance that auditors within our regime are delivering high-quality audits.
2 There are two strands to our monitoring:
■ audit quality- applying our annual quality review programme (QRP) to the audit work undertaken for the year ending 2014/15; and
■ regulatory compliance- reporting quarterly on audit firms’ compliance with our 2015/16 regulatory requirements as set out in the Terms of Appointment.
3 The audit quality and regulatory compliance monitoring for 2015/16 incorporated a range of measurements and checks comprising:
■ a review of each firm's latest published annual transparency reports;
■ the results of reviewing a sample of each firm’s audit quality monitoring reviews (QMRs) of its financial statements, Value for Money (VFM) conclusion and housing benefit (HB COUNT) work. Our review included assessing compliance with the HB COUNT guidance;
■ an assessment as to whether we could rely on the results of each firm's systems for quality control and monitoring;
■ a review of the Financial Reporting Council’s (FRC) published reports on the results of its inspection of audits in the private sector;
■ the results of our inspection of each firm by the FRC’s Audit Quality Review team (AQR) as part of our commissioned rolling inspection programme of financial statements and VFM work;
■ the results of each firm’s compliance with 15 key indicators relating to our Terms of Appointment requirements;
■ a review of each firms' systems to ensure they comply with our regulatory and information assurance requirements; and
■ a review of each firm’s client satisfaction surveys for 2014/15 work.
4 This report summarises the results of our monitoring work for PwC LLP.

5
Overall performance
5 The firm is meeting our standards for overall audit quality and our regulatory compliance requirements. We calculated the red, amber, green (RAG) indicator for overall audit quality and regulatory compliance using the principles detailed in Appendices 1 and 2. For 2015/16, PwC’s combined audit quality and regulatory compliance rating was amber.
Figure 1: 2016 Comparative performance for audit quality and regulatory compliance
BDO DT EY GT KPMG Mazars PwC
6 The firm has maintained its overall performance against the regulatory compliance indicators since last year. However, the firm’s overall weighted audit quality score has decreased slightly from last year.
7 The satisfaction survey results show that audited bodies are satisfied with the performance of PwC as their auditor.

6
Detailed report Quality review programme
FRC Inspection
8 Every year each firm provides a self-assessment in the form of a statutory transparency report. Our review of the PwC transparency report did not highlight any significant issues of note.
9 Annually, the FRC publishes reports on the audit firms subject to full scope FRC inspections, including firms in our regime. We place reliance on the work of the FRC, which reviews the firms’ systems and processes for ensuring audit quality and reviews a sample of their audits of public interest entities. In its latest public report on the firm, the FRC concluded that audit procedures were performed to a good standard or required only limited improvement for 21 of the audit engagements reviewed, with 4 requiring improvements and none audit requiring significant improvement.
10 The FRC has identified key issues in its reports which, profession wide, should be addressed in order to improve audit quality. These were:
•••• a need for auditors to improve their scepticism in challenging the appropriateness of assumptions in key areas of audit judgment such as impairment testing and property valuation;
•••• a need for some improvement in the sufficiency and appropriateness of audit procedures being performed on revenue recognition; and
•••• a need to report more thoroughly to audit committees.
11 We have raised these issues with PwC and with all other firms in our regime and we will continue to monitor progress in these areas.
12 We also commissioned inspections of all firms by the FRC for this year's QRP. The AQR inspected one VFM conclusion file from PwC’s PSAA work and provided an updated commentary on the applicability of firm-wide procedures to our audits. Having considered the review points raised by the AQR, we assessed the audit inspected as acceptable with only limited improvements required for the VFM conclusion work.
13 The improvement points raised by the AQR, from across the firms, following this year’s programme of work for PSAA were:
•••• clearly justify and document materiality considerations and not default automatically to the top of the materiality range;
•••• consider property valuations as significant risk areas and ensure that when considering external valuers’ work there is review and challenge of management assumptions. In addition, audit teams need to verify the completeness and accuracy of source data used by experts and evidence that assets are revalued on the appropriate cycle in accordance with accounting policies;
•••• evidence journals selected for testing by audit teams, while improving procedures to ensure the completeness of the population of journals considered for testing;
•••• evidence work on asset valuations and ensure actuarial assumptions are appropriately challenged;
•••• ensure that VFM work covers financial resilience over an appropriate period and that the outcomes from VFM work are reporting in sufficient detail to those charged with governance.
14 We have combined our scores for the AQR inspections for PSAA with the firm's QMR scores in the relevant sections in the rest of this report.

7
QMR programme
15 PSAA sets quality standards for its appointed auditors and monitors their performance against them. The principal means of monitoring and evaluating the quality of auditors’ work is the annual QRP. For 2015/16 we relied on each firm’s own quality monitoring arrangements.
16 All firms agreed to follow PSAA's methodology and reporting format for their QMRs for VFM conclusions and HB COUNT audit work and use their own methodology for assessing work on the financial statements (converting the financial statements results to our scoring system). We concluded that PwC's QMRs were sufficiently detailed and rigorous for us to place reliance on all of the reviews provided by the firm.
17 Each firm scored their QMRs using a common four-point scale, with 3 being the highest and 0 being the lowest. A score of 1 is our benchmark for acceptable performance. The full assessment scale is detailed in Table 1 and we calculated the score for overall audit quality on a weighted assessment using the weightings detailed in appendix 1.
Table 1- PSAA assessment scale
Score Descriptor
3 Good, no improvement required
2 Acceptable with limited improvements required
1 Acceptable overall with improvements required
0 Improvements required which are individually or collectively significant
18 PwC’s score was 1.86, compared to an all firm average of 2.21. This was a slight reduction on last year’s score of 1.95, although this year we used a slightly amended scoring baseI.
19 Figure 2 shows the assessment of PwC's overall audit quality performance in comparison to other firms.
I The prior year assessment included consideration of Whole of Government Accounts work which
is not included in the current year assessment. The current year assessment gives a higher weighting to financial statements work.

8
Figure 2: 2016 Audit quality performance
20 Our QRP methodology is designed to highlight any specific weaknesses at individual file level, specifically where our benchmark score of 1 is not met, which may have ordinarily been masked behind a high average score across the various elements (Financial statements, VFM and HB COUNT) of the QRP.
21 We have calculated a red, amber, green (RAG) indicator for each element of the QRP, using the principles detailed in Appendix 2, as well as for overall audit quality. Where a firm scores an average of less than 2, or has any scores of 0, a rating higher than amber in that element is not possible.
22 For 2015/16, PwC’s overall rating for audit quality was amber as the overall audit quality score was below 2. We consider each of the individual elements making up this rating below.
Figure 3: 2016 Comparative performance for audit quality
BDO DT EY GT KPMG Mazars PwC
Financial statements audit work
23 The firm provided the results of seven QMRs for financial statement audit files. We reviewed these and agreed with all the firm assessments.
24 The improvement areas from these included:
•••• ensuring clearer documentation on file of audit work undertaken and of the assessment of the control environment;
•••• ensure reporting of the outputs of the audit are accurate in all respects; and
•••• ensure testing of journals and related party transactions are carried out to high standards at all audits.
0123
Wei
ghte
d sc
ore Audit Quality
Weightedscore
Supplieraverage (2.21)
Acceptableperformance

9
25 Figure 4 shows the comparative performance for financial statement audit work based on the results of the QMRs and AQR review. PwC's average score was 1.57 compared to an all firm average of 2.2. The results of two reviews related to inaccuracies in audit reporting.
Figure 4: 2016 financial statements performance
26 For 2014/15, PwC’s rating for financial statements work was amber because of the relatively low score (average less than 2) on financial statements audit work.
Figure 5: 2015 Comparative performance for financial statemen ts audit work
BDO DT EY GT KPMG Mazars PwC
VFM conclusion audit work
27 The firm provided the results of six QMRs for VFM conclusion audit files. We reviewed the results and agreed the assessments.
28 In addition, the AQR review for PSAA provided a score for one additional VFM conclusion assessment.
29 The improvement areas from these individual QMRs and the AQR review included:
•••• ensuring better evidencing of the overall VFM risk assessment; and
•••• ensuring clear and accurate reporting of VFM conclusion work to the Audit Committee.
30 Figure 6 shows the comparative performance for VFM audit work based on the results of the QMRs and AQR review. PwC's score was 2.43 compared to an all firm average of 2.13.
0123
Wei
ghte
d sc
ore Financial statements
Weightedscore
Supplieraverage (2.2)
Acceptableperformance

10
Figure 6: 2016 VFM conclusion performance
31 For 2014/15, PwC’s rating was green on VFM conclusion work.
Figure 7: 2015 Comparative performance for VFM conclusion aud it work
BDO DT EY GT KPMG Mazars PwC
Housing benefit work
32 Each year auditors certify local authority claims for housing benefit subsidy to the Department for Work and Pensions (DWP). They are required to undertake this work using specific guidance and tools (HB COUNT) which are agreed annually with the DWP. HB COUNT sets out the approach and work needed to certify the subsidy claim form. It includes a requirement to test a sample of cases to check that benefits have been awarded in accordance with benefit regulations and that subsidy has been properly claimed.
33 The firm provided the results of three QMRs for HB COUNT audit work. We reviewed the results of these and we agreed with the firm’s assessments.
34 The improvement areas from these individual QMRs included:
•••• ensuring compliance with the certification instructions on housing benefit work, particularly around mapping and evidencing conclusions against the specific test requirements;
•••• ensuring that any amendments made to the claim relate to isolated errors only.
35 Figure 8 shows the comparative performance of each firm based on the QMRs. PwC's average score was 2.33 compared to an all firm average of 2.48.
0123
Wei
ghte
d sc
ore VFM Conclusions
Weightedscore
Supplieraverage (2.13)
Acceptableperformance

11
Figure 8: 2016 HB COUNT performance
36 For 2014/15, PwC’s rating was green for HB COUNT audit work.
Figure 9: 2015 Comparative performance for HB COUNT audit wor k
BDO DT EY GT KPMG Mazars PwC
0123
Wei
ghte
d sc
ore Housing Benefit
Weightedscore
Supplieraverage(2.48)
Acceptableperformance

12
Regulatory compliance
Systems for compliance with our regulatory requirem ents
37 In 2015/16, PwC confirmed to PSAA that its systems and procedures for regulatory compliance were the same as those in the previous year. Nothing came to PSAA’s attention in year to suggest this is not correct, and we concluded that it could continue to rely on PwC’s systems.
Systems for compliance with our information assuran ce requirements
38 During 2015, PSAA instructed its Internal Auditor (TIAA) to undertake a review of the firm’s information assurance arrangements based on a return completed by the firm. The review considered whether the firm met the requirements of information governance legislation. There were no issues arising as a result of this review and we concluded that we could continue to rely on the firm’s arrangements.
Quarterly monitoring of our regulatory requirements
39 PSAA reported the details in the quarterly monitoring reports issued to the firm during the year, including fee variation request and requests for non-audit services from the firm. Figure 10 details the firm's overall regulatory compliance RAG rating compared to other firms.
Figure 10: 2016 Comparative performance for regulatory complia nce
BDO DT EY GT KPMG Mazars PwC
40 The firm performed reasonably well across the regulatory compliance requirements, with all but one of the 15 indicators being rated as amber or green. The firm has performed poorly on the timely resolution of objections and has been rated as red in this area. The firm should act to resolve all longstanding objections as soon as possible.
41 We have included a summary at Appendix 3 of the results of the 2015/16 regulatory compliance monitoring RAG ratings, comparing the firm's performance against the overall performance for all firms.
13
Client satisfaction surveys
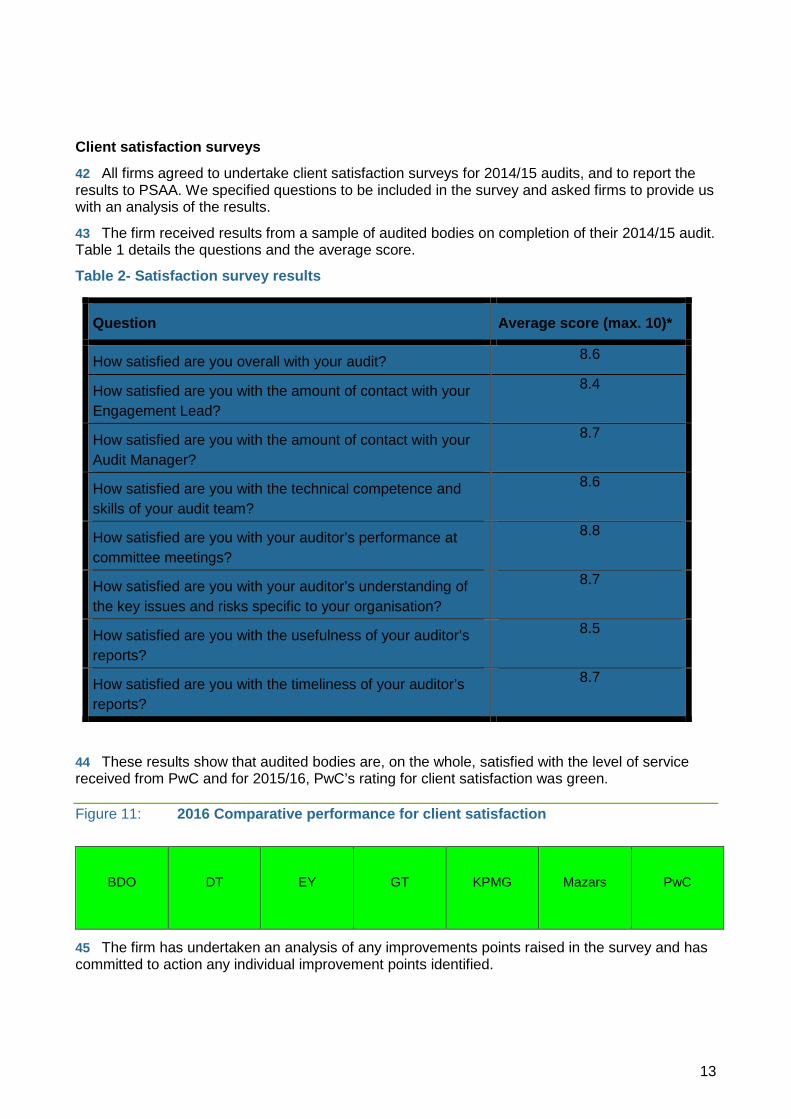
42 All firms agreed to undertake client satisfaction surveys for 2014/15 audits, and to report the results to PSAA. We specified questions to be included in the survey and asked firms to provide us with an analysis of the results.
43 The firm received results from a sample of audited bodies on completion of their 2014/15 audit. Table 1 details the questions and the average score.
Table 2- Satisfaction survey results
Question Average score (max. 10)*
How satisfied are you overall with your audit? 8.6
How satisfied are you with the amount of contact with your Engagement Lead?
8.4
How satisfied are you with the amount of contact with your Audit Manager?
8.7
How satisfied are you with the technical competence and skills of your audit team?
8.6
How satisfied are you with your auditor’s performance at committee meetings?
8.8
How satisfied are you with your auditor’s understanding of the key issues and risks specific to your organisation?
8.7
How satisfied are you with the usefulness of your auditor’s reports?
8.5
How satisfied are you with the timeliness of your auditor’s reports?
8.7
44 These results show that audited bodies are, on the whole, satisfied with the level of service received from PwC and for 2015/16, PwC’s rating for client satisfaction was green.
Figure 11: 2016 Comparative performance for client satisfactio n
BDO DT EY GT KPMG Mazars PwC
45 The firm has undertaken an analysis of any improvements points raised in the survey and has committed to action any individual improvement points identified.

14
Recommendations
Recommendations arising from the 2015/16 quality re view programme
46 The key areas for improvement identified this year from file reviews are noted below, as taken from the body of this report:
Financial statements
•••• ensuring clearer documentation on file of audit work undertaken and of the assessment of the control environment;
•••• ensure reporting of the outputs of the audit are accurate in all respects; and
•••• ensure testing of journals and related party transactions are carried out to high standards at all audits.
VFM
•••• ensuring better evidencing of the overall VFM risk assessment; and
•••• ensuring clear and accurate reporting of VFM conclusion work to the Audit Committee.
HB
•••• ensuring compliance with the certification instructions on housing benefit work, particularly around mapping and evidencing conclusions against the specific test requirements;
•••• ensuring that any amendments made to the claim relate to isolated errors only.
Compliance
•••• The firm should resolve longstanding objections as soon as possible.
47 We have not asked the firm to produce an action plan in response to our findings as the 2014/15 audits are the last to be delivered by PwC under their contract with us.

15
Appendix 1 – Weightings to calculate overall qualit y score
Table 3- weightings
Audit element Local government
%
NHS
%
Financial statements 60 70
VFM Conclusions 30 30
HB 10 -
Total 100 100

16
Appendix 2 - Audit quality and regulatory complianc e RAG rating
Table 4- QRP elements of financial statements, VFM conclusions and housing benefit work.
Rating Firm level: Overall Audit Quality score
Firm level: Individual QRP element
Green Firm audit quality score ≥2 and no scores of ‘0’ at file review level
Average element score ≥2 and no scores of ‘0’ at file review level
Amber Firm audit quality score ≥1 with up to two scores of ‘0’ at file review level
Average element score ≥1 with up to one score of ‘0’ at file review level
Red Firm audit quality score <1, or Firm audit quality score ≥1 but three or more scores of ‘0’ at file review level
Average element score <1, or Average element score ≥1 but two or more scores of ‘0’ at file review level
Table 5- Regulatory compliance RAG rating based on 15 quarterly monitoring indicators
Rating Overall firm level score - indicators
Green 11 or more at green and no more than two at red.
Red Six or more indicators at red.
Amber Neither green nor red.
Table 6- Combined audit quality and regulatory comp liance RAG
QRP RAG
Red Amber Green
Regulatory compliance RAG
Red R R A
Amber R A A
Green A A G

17
Table 7- RAG rating the results of satisfaction sur vey results
Firm 0-10 assessment
(average) Firm unsatisfactory –
satisfactory assessment (average)
PSAA RAG rating
0-3 very dissatisfied / dissatisfied / unsatisfactory R
4-6 reasonable / good / satisfied A
7-10 very good / very satisfied / outstanding G

18
Appendix 3 - Results of 2015/16 regulatory complian ce monitoring
Activity Target All firms %
(no).
PwC %
(no).
Red, amber, green (RAG) status
Issue of planning letters.
100% by 30 April 2015.
G >95.01% delivered or 1 missed. A 90.01 - 95.00% delivered or 2 missed. R <90.00% delivered or 3 missed.
Issue of NHS audit opinions.
100% by 29 May 2015 (CCG) and 5 June 2015 (NHS Trusts).
G >95.01% delivered or 1 missed. A 90.01 - 95.00% delivered or 2 missed. R <90.00% delivered or 3 missed.
Issue of NHS VFM conclusions.
100% by 29 May 2015 (CCG) and 5 June 2015 (NHS Trusts).
G >95.01% delivered or 1 missed. A 90.01 - 95.00% delivered or 2 missed. R <90.00% delivered or 3 missed.
Confirmation of final fee to NHS audited bodies.
100% by 31 July 2015.
G >95.01% delivered or 1 missed. A 90.01 - 95.00% delivered or 2 missed. R <90.00% delivered or 3 missed.
Issue of NHS annual audit letters.
100% by 31 July 2015.
G >95.01% delivered or 1 missed. A 90.01 - 95.00% delivered or 2 missed. R <90.00% delivered or 3 missed.
Issue of LG audit opinions.
100% by 30 September 2015.
G >95.01% delivered or 1 missed. A 90.01 - 95.00% delivered or 2 missed. R <90.00% delivered or 3 missed.
Issue of LG VFM conclusions.
100% by 30 September 2015.
G >95.01% delivered or 1 missed. A 90.01 - 95.00% delivered or 2 missed. R <90.00% delivered or 3 missed.
Issue of WGA reports.
100% issued by 2 October 2015.
G >95.01% delivered or 1 missed. A 90.01 - 95.00% delivered or 2 missed. R <90.00% delivered or 3 missed.
100
97.7(7)
98.0(6)
99.7(1)
98.7(4)
97.1 (15)
97.1 (15)
94.7 (27)
NA
100
100
91.2 (3)
93.5 (2)
93.5 (2)
97.1 (1)
97.1 (1)

19
Activity Target All firms %
(no).
PwC %
(no).
Red, amber, green (RAG) status
Confirmation of final LG fee to audited body.
100% by 30 October 2015.
G >95.01% delivered or 1 missed. A 90.01 - 95.00% delivered or 2 missed. R <90.00% delivered or 3 missed.
Issue of LG annual audit letters.
100% by 30 October 2015.
G >95.01% delivered or 1 missed. A 90.01 - 95.00% delivered or 2 missed. R <90.00% delivered or 3 missed.
Audited body database information.
Accurate information provided to PSAA.
G >95.01% delivered or 1 missed. A 90.01 - 95.00% delivered or 2 missed. R <90.00% delivered or 3 missed.
Complaints upheld against auditors.
No complaints upheld against auditors.
G = 0 upheld A = 1 R = 2 or more
Non-compliance with requirements on independence issues.
No instances of non-compliance.
Firm G = up to 1 A = 2 R = 3 or more Regime G = up to 7 A = 8 R = 9 or more.
Objections decided upon within nine months.
100% of objections decided upon within nine months.
Firm G = up to 1 A = 2 R = 3 or more Regime G = up to 7 A = 8 R = 9 or more.
Attendance at Contact Partner group meetings.
No meetings missed.
Firm G = up to 2 A = 3 R = 4 or more Regime G = up to 7
96.7 (17)
97.5 (13)
98.9 (15)
0
91.2 (3)
91.2 (3)
NA
0
2
14
0
5
0
0

20
Activity Target All firms %
(no).
PwC %
(no).
Red, amber, green (RAG) status
A = 8 R = 9 or more.

Public Sector Audit Appointments Page 21 of 21


![Sustainable Regulatory Compliance[1]](https://static.fdocuments.in/doc/165x107/577cdd861a28ab9e78ad346d/sustainable-regulatory-compliance1.jpg)


