PV Standards and Long Term Thermal Aging (LTTA) - … Standards and Long Term Thermal Aging (LTTA)...
54
© 2015 UL, LLC. PV Standards and Long Term Thermal Aging (LTTA) Overview
Transcript of PV Standards and Long Term Thermal Aging (LTTA) - … Standards and Long Term Thermal Aging (LTTA)...

© 2015 UL, LLC.
PV Standards and Long Term
Thermal Aging (LTTA)
Overview

Agenda
PV Standards Overview
Overview of the Relative Thermal Index (RTI)
The Long Term Thermal Aging (LTTA) Project – Overview
Developing the Test Program – Selecting Materials
Developing the Test Program – Selecting Temperatures
Introduction to Data Analysis

Who we are
Founded in 1894, UL has earned a reputation as a global leader in
product safety and performance standards development, inspecting,
testing and certification.
Today
2006
1862
Parkesine
1913
Cellophane
1891
Rayon
1907
Bakelite
1905
Synthetic
Rubber
1866
Celluloid
1926
PVC
1933
Polyethylene (PE)
1934
“Fiber 66”
1953
Polypropylene (PP)
1958
Polycarbonate (PC)
1945
Acrylic
1941
UL RB #22
1964
UL RB #55 1973
QMFZ2 1972
UL 94
1971
PBT 1964
PPO
1967 UL
SU 746

Slide 4
UL’s “Path to Plastics”
1938 World’s Fair –
• a TV is exhibited for the
public with plastics as the
major insulating material.
1941: “Comparative burning tests of common plastics”
• UL Research Bulletin #22 by A. J. Perkins (1941)

Slide 5
UL’s “Path to Plastics”
1964: “Burning, arcing, ignition, and tracking of plastics used in electrical appliances”
• UL Research Bulletin #55 by L. M. Kline (1964)
1967: “Guide to Requirements for Polymeric Materials used as Electrical Insulation”
• Subject 746 Bulletin dated March 1, 1967

Slide 6
UL’s “Path to Plastics”
UL 94, 1st Edition, September 1972 • Final comments in April 18, 1972 Bulletin

Who we are not
US Government Agency
Trade Association
Professional Society
Publicly Held Company
Slide 7

Overview of the Relative Thermal Index
(RTI)

Slide 9
Primary PV Standards
International
IEC 61730
IEC 61215 / 61646
US
UL 1703
UL 61215/61646
Electrical Devices – Insulation Coordination
IEC 61664
UL 840

Slide 10
Polymerics
Critical properties – Short Term
Polymers + Heat + Time = ???
• Long term thermal degradation resulting from cumulative degradation chemistry is
most often the critical limiting factor for long term performance capability.
RTI = Relative Thermal Index (not ATI)

Slide 11
Factors Affecting Thermal Performance
Thermal softening
Creep
Performance at temperature
Thermal Endurance

Slide 12
Thermal Softening
Short-term property
Thermoplastics Only
Evaluates how readily a material will distort or deform when
exposed to elevated temperatures
• Heat Deflection
• Vicat Softening
• Ball Pressure
• Mold Stress Relief Distortion

Slide 13
Creep
Permanent deformation resulting from
prolonged application of stress below the
elastic limit
Creep at room temperature is sometimes
called cold flow
Stresses include bending, compressive, or
tensile loading; leaf or coil springs; or
gravity
Rigid thermosets do not experience creep
(crosslinking restricts chain movement)
RTI does not address creep

Slide 14
Silly Putty and the Viscoelastic Profile of Plastics
Log (t)
1
2
3
4
s years
1: Elastic Solid
2: Viscoelastic solid
3: Viscoelastic liquid
4: Viscous liquid Higher temperatures results
in a shift to the left
Constant strain,

Slide 15
Performance at Temperature
Indicator of how well a product performs it’s function when exposed
to elevated temperature
Long-Term Heat Resistance Test (ASTM D794)
• Samples heated in oven (gradually increasing temp) until failure
• Failure = material is no longer acceptable for service
- Change in appearance, weight, or dimension
- Change in other property of concern

Slide 16
Thermal Endurance or RTI (746B)
A relative thermal index of a material is an indication of the material’s
ability to retain a particular property (physical, electrical, etc.) when
exposed to elevated temperatures for an extended period of time. It is a
measure of the material’s thermal endurance. For each material, a
number of relative thermal indices can be established, each index
related to a specific property and a specific thickness of the material.

Slide 17
Another Way (UL 746B, 6.5)
Not a “Maximum Operating Temperature” but a maximum
temperature below which a material maintains its characteristics
over a reasonable period.
Is also referred to as the service temperature of a material

What is Temperature Rating?
The temperature below which a critical property will not be
unacceptably compromised through chemical thermal degradation,
over the reasonable life of an electrical product
Slide 18

Slide 19
When is RTI required and which RTIs?
Is the material critical for the product’s safety performance?
• What happens when the material does not exist?

Slide 20
When is RTI required and which RTIs?
Which are the critical properties of the material in the application?
• Translate end product tests (ex. dielectric withstand, crushing
resistance, ball impact) into the basic properties: electrical, strength
and impact.

Slide 21
When is RTI required and which RTIs?
Are RTIs equal to, or higher than, the critical hotspot temperatures
measured during end-product testing?

What RTI Isn’t
The RTI of a material is not an indication of performance at elevated
temperature.
Slide 22

UL iQ – Generic RTI
Slide 23

UL iQ – Long Term Aging RTI
Slide 24

Slide 25
Degradation Mechanisms
Oxidation
• Chemical
• Thermal
Hydrolytic depolymerization
Crosslinking
Crazing

Slide 26
Oxidation
Recombination of elements in polymer with environmental oxygen
Increase in temperature increases oxidation rate
Aging process utilizes thermal-chemical oxidation

Slide 27
Aging Theory
IEEE
• 1: Recommended Practice - General Principles for Temperature Limits in the Rating of
Electrical Equipment and for the Evaluation of Electrical Insulation
• 98: Standard for the Preparation of Test Procedures for the Thermal Evaluation of Solid
Electrical Insulating Materials
• 101: Guide for the Statistical Analysis of Thermal Life Test Data
A comparison of the thermal-aging characteristics of one
material of proven field service at a particular temperature
level with the thermal-aging characteristics of another
material with no field service history provides a means for
estimating the relative thermal index level at which the
second material might also provide acceptable field
service.

Slide 28
Slide 28
Arrhenius, the Equation
This reduces to linear plot between:
• 1/T (reciprocal temperature) and
• ln k (natural log of specific reaction rate)
RT
E
Aek
k = Specific Reaction Rate
A = Constant
E = Reaction Activation Energy
R = Ideal Gas Constant
T = Absolute Temperature
RT
EAK ee loglog
ATR
EK ee log
1*log
BX*MY

UL 746B vs IEC 60216
TI: IEC 60216-3 method does not incorporate control concept
Correlation time is set at 20,000 hours
RTE: IEC 60216-5 (Fixed Temperature method)
IEC 60216-6 (Fixed Time method)
Slide 29

Long Term Thermal Aging (LTTA)–
Overview

Slide 31
Material Properties
What is appropriate for this material type?
• Impact Property
- Tensile
- Izod or Charpy
- Other
• Strength Property
- Tensile
- Flexural
- Other
• Electrical Property
- Dielectric
- Other

Slide 32
Primary Properties
Expected to reach end-of-life for each of the test temperatures
• When there is no information on degradation of individual properties,
assume all are primary
• If specific properties are known to degrade more rapidly, assign them as
primary and evaluate others as secondary
Monitored throughout the program

Slide 33
Secondary Property
Property which is not expected to reach end point before the primary
properties
Flammability
• Vertically rated materials only
Electrical (sometimes)
Strength (rarely)
Impact (never)

Slide 34
Samples (ASTM)
ASTM
• Type I for most applications
• Type IV for elastomeric
materials
Machined Samples
• Same direction
• Inspect radius
- Break in Clamp

Slide 35
Samples (ISO)
ISO 3167
• Multi-purpose Test Specimen
Molded: Type 1A
Machined: Type 1B
Different dimensions for
machined samples!!
• Higher radius
• Shorter middle region


Slide 37
Impact Strength
Tensile Impact
• ASTM D1822 and ISO 8256
- Not equivalent (Note: ASTM TI preferred)
Izod Impact
• ASTM D256 and ISO 180
- Not equivalent
- ISO = Notch A and edgewise only
Charpy Impact
• ASTM D6110 and ISO 179
- Not equivalent (Note: ISO CI preferred)


Slide 39
Charpy Impact
Similar to Izod, except
• Sample orientation (horizontal)
• No clamping pressure
Edgewise samples preferred

Slide 40
Dielectric Strength
ASTM D149 and IEC 60243
• Similar but not exactly equivalent
- Different electrode preferences
• All insulators exhibited some type of leakage
- This results in localized heating which facilitates greater voltages until
breakdown occurs
LTTA tests on just the minimum thickness
• Even if Recognized at just 3.0 mm, test DS at 0.75 mm
Per UL 746A
• Rate of rise = 500 V/s
• Test in air; for LTTA, we prefer oil (industry norm)
Slide 41
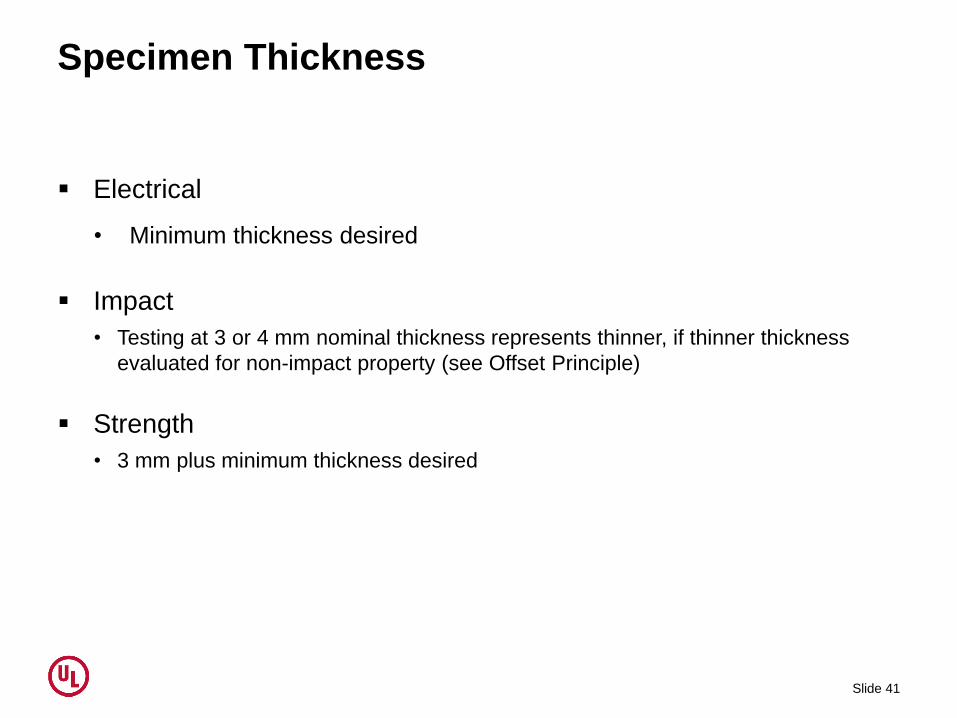
Specimen Thickness
Electrical
• Minimum thickness desired
Impact
• Testing at 3 or 4 mm nominal thickness represents thinner, if thinner thickness
evaluated for non-impact property (see Offset Principle)
Strength
• 3 mm plus minimum thickness desired

Slide 42
Specimen Quantity - General
Assumes end-of-life reached within number of aging cycles
indicated in the delayed-set schedules
Applies to Proposed and Control Materials
Assumes all properties are primary

Slide 43
Specimen Quantity – Rigid Non-polypropylene
Strength and Impact
• 3 mm thickness: 290 specimens
• Reduced thicknesses: 120 specimens each
Dielectric
• 0.8 mm thickness: 230 specimens
Flame (Candidate only)
• Minimum thickness: 140 specimens

Selecting Materials

Slide 45
Why Do I Need a Control?
Use of control is used to normalize lab variations
• Variations in oven temperatures or other lab elements happen to both
control and candidate
Allows for establishing an RTI, since the temperature is relative to
another material
Slide 46
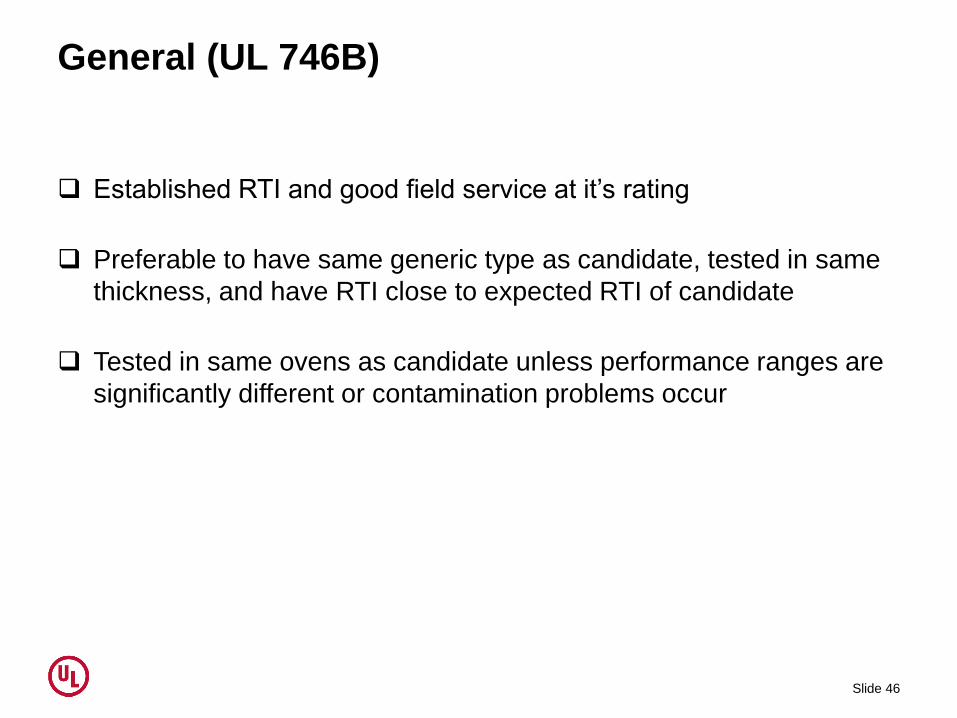
General (UL 746B)
Established RTI and good field service at it’s rating
Preferable to have same generic type as candidate, tested in same
thickness, and have RTI close to expected RTI of candidate
Tested in same ovens as candidate unless performance ranges are
significantly different or contamination problems occur

Slide 47
Selection of Controls
Goal = Similar degradation
mechanisms
• “… with a record of good
field service at its rated
temperature.”
Use Parameter Search
• Same mfr?
• Same generic base resin?
• ±10 C°?
• Descriptive similarities?

Module 5: Introduction to Data Analysis

% Retention 100
50
0 0 1,200 3,000 6,000 12,000 20,000
Hours
F50 Curve Fit
Why 50%
• Arbitrary point of measurement
• Assumption: 2x Safety Factor built in

Reference Material Aging
Temperature
RTI: 170°C
300°C 0° C
500
5000
Ho
urs
100,000

100,000
0
300°C
Temperature
Hours
X
Candidate
Reference
Calculation of Candidate RTI
0°C 170°C
RTI: 170°C

UL 746B vs IEC 60216
TI: IEC 60216-3 method does not incorporate control concept
• Correlation time is set at 20,000 hours
RTE: IEC 60216-5 (Fixed Temperature method)
IEC FDIS 60216-6 (Fixed Time method)
Slide 52

IEC 60216 Thermal Index
Slide 53
Hours 100,000
0
0 Temperature
5,000
100
130 C
Candidate
20,000
2,000