Putting “HOPE” Back into HOPE BAYs1.q4cdn.com/893791552/files/doc_presentations/... · Putting...
33
Putting “HOPE” Back into HOPE BAY Doris Mine and Plant
Transcript of Putting “HOPE” Back into HOPE BAYs1.q4cdn.com/893791552/files/doc_presentations/... · Putting...

Putting “HOPE” Back into HOPE BAY
Doris Mine and Plant

This document contains “forward-looking information” within the meaning of applicable Canadian securities laws. Forward-looking information includes statements that use forward-looking terminology such as “may”, “could”,
“would”, “will”, “intend”, “plan”, “expect”, “budget”, “estimate”, “forecast”, “schedule”, “anticipate”, “believe”, “continue”, “potential” or the negative or grammatical variation thereof or other variations thereof or comparable
terminology. Such forward-looking information includes, without limitation, statements with respect to Mineral Reserve and Mineral Resource estimates; targeting additional Mineral Resources and expansion of deposits; the capital
and operating cost estimates and the economic analyses (including cashflow projections) from the Hope Bay Technical Report; the Company’s expectations, strategies and plans for the Hope Bay Project, including the
Company’s planned exploration and development activities; the results of future exploration and drilling and estimated completion dates for certain milestones; successfully adding or upgrading resources and successfully
developing new deposits; the costs and timing of future exploration and development, commencing production at Madrid in 2020 and at Boston in 2022; that the Company will "bootstrap" the development of Madrid and Boston;
the timing and amount of future production at Doris, Madrid and Boston and the capacity of the Gekko Plant to process production; the timing, receipt and maintenance of approvals, licences and permits from the federal
government, from the Kitikmeot Inuit Association (“KIA”) and Nunavut Tunngavik Inc. (“NTI”) and from any other applicable government or regulator; future financial or operating performance and condition of the Company and
its business, operations and properties; and any other statement that may predict, forecast, indicate or imply future plans, intentions, levels of activity, results, performance or achievements.
Forward-looking information is not a guarantee of future performance and is based upon a number of estimates and assumptions of management, in light of management’s experience and perception of trends, current conditions
and expected developments, as well as other factors that management believes to be relevant and reasonable in the circumstances, as of the date of this document including, without limitation, assumptions about: favourable
equity and debt capital markets; the ability to raise any necessary additional capital on reasonable terms to advance the development of the Hope Bay Project and pursue planned exploration; future prices of gold and other
metal prices; the timing and results of exploration and drilling programs; the accuracy of any Mineral Reserve and Mineral Resource estimates; the geology of the Hope Bay Project being as described in the Hope Bay Technical
Report; the metallurgical characteristics of the deposit being suitable for the Gekko Plant; the successful operation of the Gekko Plant; production costs; the accuracy of budgeted exploration and development costs and
expenditures, including to complete development of the infrastructure at the Hope Bay Project; the price of other commodities such as fuel; future currency exchange rates and interest rates; operating conditions being
favourable, including whereby the Company is able to operate in a safe, efficient and effective manner; political and regulatory stability; the receipt of governmental and third party approvals, licences and permits on favourable
terms; obtaining required renewals for existing approvals, licences and permits and obtaining all other required approvals, licences and permits on favourable terms; sustained labour stability; stability in financial and capital
goods markets; availability of equipment; positive relations with the KIA and NTI and other local groups and the Company’s ability to meet its obligations under its property agreements with such groups; the Company’s ability to
operate in the harsh northern Canadian climate; and satisfying the terms and conditions of the Debt Facility. While the Company considers these assumptions to be reasonable, the assumptions are inherently subject to significant
business, social, economic, political, regulatory, competitive and other risks and uncertainties, contingencies and other factors that could cause actual actions, events, conditions, results, performance or achievements to be
materially different from those projected in the forward-looking information. Many assumptions are based on factors and events that are not within the control of the Company and there is no assurance they will prove to be
correct.
Furthermore, such forward-looking information involves a variety of known and unknown risks, uncertainties and other factors which may cause the actual plans, intentions, activities, results, performance or achievements of the
Company to be materially different from any future plans, intentions, activities, results, performance or achievements expressed or implied by such forward-looking information. Such risks include, without limitation: general
business, social, economic, political, regulatory and competitive uncertainties; differences in size, grade, continuity, geometry or location of mineralization from that predicted by geological modelling and the subjective and
interpretative nature of the geological modelling process; the speculative nature of mineral exploration and development, including the risk of diminishing quantities or grades of mineralization and the inherent riskiness of Inferred
Mineral Resources; a material decline in the price of gold; a failure to achieve commercial viability, despite an acceptable gold price, or the presence of cost overruns which render the project uneconomic; geological,
hydrological and climactic events which may adversely affect infrastructure, operations and development plans, and the inability to effectively mitigate or predict with certainty the occurrence of such events; credit and liquidity
risks associated with the Company’s financing activities, including constraints on the Company’s ability to raise and expend funds as a result of operational and reporting covenants associated with the Debt Facility and the risk
that the Company will be unable to service its indebtedness; delays in construction or development of the Hope Bay Project resulting from delays in the performance of the obligations of the Company’s contractors and
consultants, the receipt of governmental approvals and permits in a timely manner or to complete and successfully operate mining and processing components; the Company’s failure to accurately model and budget future
capital and operating costs associated with the development and operation of the Hope Bay Project; difficulties with transportation and logistics relating to the delivery of essential equipment and supplies to the Hope Bay Project,
including by way of airlift and sealift, and the logistical challenges presented by the Hope Bay Project’s location in a remote Arctic environment; the failure to develop or supply adequate infrastructure to sustain the operation and
development of the Hope Bay Project, including the provision of reliable sources of electrical power, water, and transportation; adverse fluctuations in the market prices and availability of commodities and equipment affecting
the Company’s business and operations; the unavailability of specialized expertise in respect of operating in a remote, environmentally extreme and ecologically sensitive area in the Kitikmeot region of Nunavut; the Company’s
management being unable to successfully apply their skills and experience and attract and retain highly skilled personnel; the cyclical nature of the mining industry and increasing prices and competition for resources and
personnel during mining cycle peaks; the Company’s failure to maintain good working relationships with Inuit organizations; the Company’s failure to comply with laws and regulations or other regulatory requirements; the
Company’s failure to comply with existing approvals, licences and permits, and Inuit agreements; the Company’s inability to renew existing approvals, licences, permits and Inuit agreements or to obtain required new approvals,
licences, permits and Inuit agreements on timelines required to support development plans; the Company’s failure to comply with environmental regulations, the tendency of such regulations to become more strict over time, and
the costs associated with maintaining and monitoring compliance with such regulations; the adverse influence of third party stakeholders, including social and environmental non-governmental organizations; the adverse impact
of competitive conditions in mineral exploration and the mining business; the Company’s failure to maintain satisfactory labour relations and the risk of labour disruptions or changes in legislation relating to labour; the Company’s
lack of operating history and no history of earnings; the limits of insurance coverage and uninsurable risks; the adverse effect of currency fluctuations on the Company’s financial performance; difficulties associated with enforcing
judgements against directors residing outside of Canada; conflicts of interest; the significant control exercised by RCF and Newmont over the Company; the dilutive effect of future acquisitions or financing activities and the failure
of future acquisitions to deliver the benefits anticipated; the failure of the Company’s information technology systems or the security measures protecting such systems; the costs associated with legal proceedings should the
Company become the subject of litigation or regulatory proceedings; costs associated with complying with public company regulatory reporting requirements.
Caution Regarding Forward-Looking
Information
32

Remote But Not Isolated – Accessible Via
Tidewater
VANCOUVER
(15 days)
MONTREAL
(15 days)
CHINA
(21 days)
HOPE BAY
• 160 km north of Arctic Circle
• Robert’s Bay on Bathurst Inlet in the Arctic Ocean
• Accessible via tidewater from east and west
• Sealift routes open 10 weeks per year
• Ice Free mid-August to mid-October
• Working Capital (~ C$60 million/year) 3

Yellowknife
Red Lake
Hemlo
Timmins
Kirkland Lake
Noranda
Val-d’Or
Hope Bay
Greenstone Belts
Nunavut
1,000 km
Meadowbank
Meliadine
Canadian Archean Greenstone Gold Belts
Gold Camp
34

Hope Bay Archean Gold Belt vs.
Kirkland Lake-Timmins-Red Lake
~3.6Moz ~30Moz ~58Moz ~30Moz 35
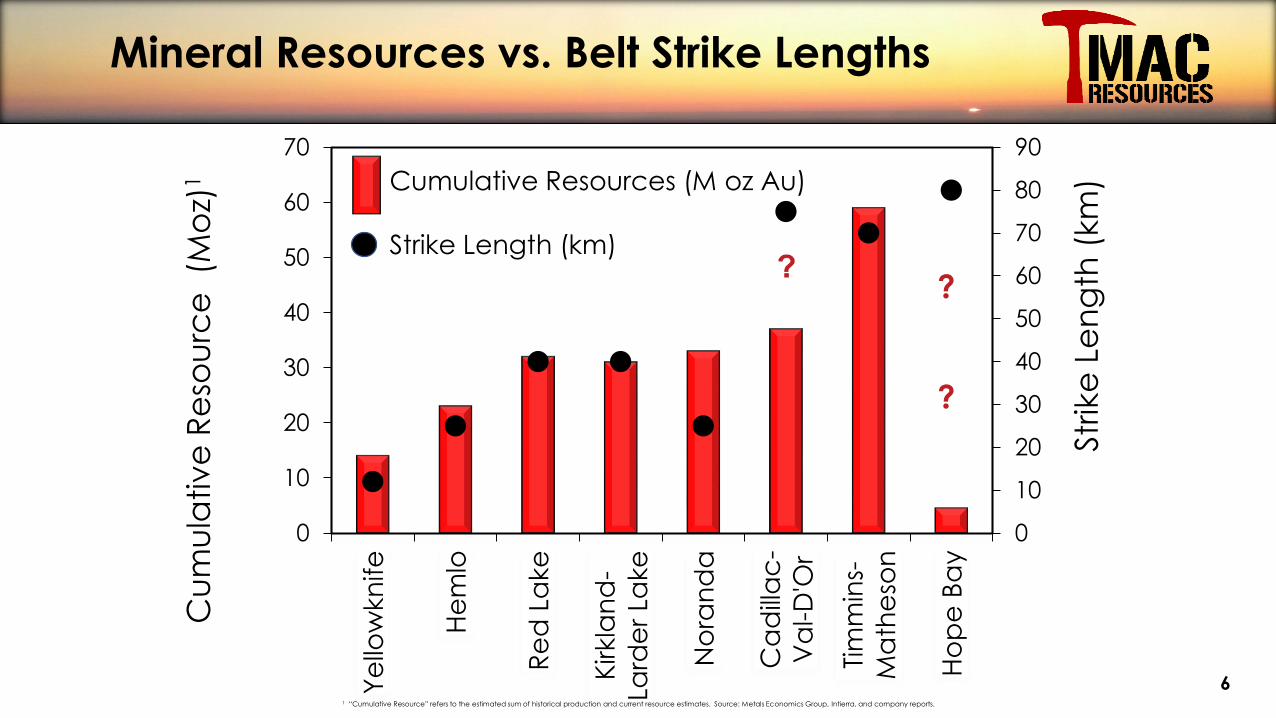
Mineral Resources vs. Belt Strike Lengths
0
10
20
30
40
50
60
70
80
90
0
10
20
30
40
50
60
70
Ye
llow
kn
ife
He
mlo
Re
d L
ake
Kirkla
nd
-
Lard
er
Lake
No
ran
da
Ca
dill
ac
-
Va
l-D
'Or
Tim
min
s-
Ma
the
son
Ho
pe
Ba
y
Str
ike
Le
ng
th (
km
)
Cu
mu
lativ
e R
eso
urc
e
(Mo
z)1 Cumulative Resources (M oz Au)
Strike Length (km)
1 “Cumulative Resource” refers to the estimated sum of historical production and current resource estimates. Source: Metals Economics Group, Intierra, and company reports.
?
?
36

David Bell
W E
1 km
Golden
GiantWilliams
Hemlo and Red Lake - Vertical Extent
HG Young
-500m
-1500m
-2000m
-1000m
1 km
Campbell Red Lake
EW
-2500m
Cumulative Res.
37

LaRonde &Kirkland Lake - Vertical Extent
Kirkla
nd
MacassaToburn
Sylv
an
ite
Wright-
HargreavesLakeShore
Tec
k
Hu
gh
esW E
1 km1 km
W E
LaRondeBosquet
-500m
-1500m
-2500m
-2000m
-1000m
38

1 km
Boston
Hope Bay Deposits – Vertical Extent
1 km
N S
Doris
-500m
1 km
BostonN S
-1500m
-2500m
Madrid
N S N S
-2000m
-1000m 13.9 g/t/ 1.0m7.5 g/t/ 2.0m7.0 g/t/ 1.1m
9.6 g/t 8.7m
12.4 g/t /4.2m
54.7 g/t/ 9.0m
4.9 g/t/ 20.3m
7.6 g/t/17.3m12.5 g/t/ 9.8m
39

Hope Bay Belt
Surface Grab Samples + Outcrop
Doris
Madrid
Boston
80km
>10g/t Au >50g/t AuOutcrop Map 310

History of Hope Bay Gold Belt
BHP Billiton1988 - 1999
Miramar1999 - 2007
Newmont2007 - 2013
TMAC2013 >>>>
Noel Avadluk
• Legendary Inuit Prospector
• Discovered Hope Bay in early 1960’s
• Worked with RCMP &
Geological Survey of Canada
311

More than $1.5 Billion in Infrastructure
Doris Mine & Plant, Madrid and Boston Camps
Roberts Bay
PortalProcessing Plant
Fuel Tanks
Doris Mountain
Accommodations
Ore pad
Warehouse
Garage
Power Plant
Helipad
Madrid Camp
Boston Camp 12

2013 – 2017
~$400 million
• Increased M&I resources by 76% since 2013
• Commenced mining October 2015
• 2 years of pre-production underground development
• Achieved Commercial Production June 2017
• Doris Camp Expansion and recommissioned Boston Camp
Excellent ground conditions
TMAC 2013 – 2017 Activity
313

2014 2015 2016 2017
Existing Permits Q4 Q1 Q2 Q3 Q4 Q1 Q2 Q3 Q4 Q1 Q2 Q3 Q4
Hope Bay Type BEWater Licence
Amended Doris Project Certificate - - - -
Doris Type A Water Licence Amendment - - - -
MadridType BB Water License - - - - - - -
Boston AmendedType BB Water Licence - - -
Hope Bay Existing Permits
Belt Wide
Exploration
Current Mining -
Doris
Bulk sample –
Madrid &
Boston
314

2016 2017 2018 2019
Required Permits Q1 Q2 Q3 Q4 Q1 Q2 Q3 Q4 Q1 Q2 Q3 Q4 Q1 Q2 Q3 Q4
Draft EIS Submitted
Final EIS and Water Licence Applications Submitted
- - - -
Project Certificates Received - - - - X
Type A Water Licences Received - - - - - - X
Hope Bay Required Permits
Doris Project Certificate - Includes Doris and Madrid Sites
- Expected Q3 - 2018
- Expand tailings capacity to 23 million tonnesType A Water Licence Amendment
- Expected Q2 - 2019
- Includes Mining Operations at Doris and Madrid Sites 15

Poured First Gold Feb 9/17
5.5 Months After Plant Offloaded
16

RBC’s Ramp-ups: What to expect when
expecting a new mine
17

Doris Processing Plant Improvements
Second active resin column
with new resin
Dewatering cone
Cyclone spider head distribution
Convert flotation to rougher cells only
Pump driven jig recirculation line
18

2017 Mineral Reserves and Resources1
1 Source: July 14, 2017 Press Release: TMAC Resources Provides Operations Update and Reports 2017 MineralReserves & Mineral Resources Estimate, Hope Bay, Nunavut
Proven and Probable
Tonnes(kt)
Grade(Au g/t)
Ounces(koz)
Proven 1,150 11.6 430
Probable 13,381 7.4 3,177
Proven and Probable 14,531 7.7 3,607
Measured and Indicated
Measured 889 14.3 408
Indicated 16,954 8.3 4,503
Measured and Indicated 17,843 8.6 4,911
Inferred
Inferred 7,459 7.1 1,694
Increased reserves 76 % since 2013
19

Doris North – East Limb UG Face
20

2020
Doris North ATD Connector Central
BTD Extension
BTD East
Limb
BTD Connector BTD Central
Infill DrillingInfill Drilling
Production
Development
Drilling
• BTD Connector
• BTD Central
Development
• Central ATD
• BTD Connector
Production
• Connector ATD
• Central ATD
• BTD Extension
Production
Production
Development
N
250 m
21

Madrid - The Second Mine
Naartok
East
N
250 m
Naartok West
• 6,500 m Surface Drilling (March start)
• Define wide, high-grade core near surface
• ~200,000 ozs Au above 150m level within target area
• Support Q4 2018 advanced exploration and bulk sample
program
Naartok
West
24.5 gpt/14.7 m
31.3 gpt/11.0 m
21.6 gpt/11.0 m
22.2 gpt/39.8 m
Suluk
2018
Drilling
Madrid North
CategoryTonnes
(kt)Grade
(Au g/t)Ounces
(koz)
Measured and Indicated 11,443 7.5 2,759
Inferred 4,125 6.4 843
22

Boston – B2 Zone
1996 B2N73 Face
13.7 g/t Au / 2.9m (chip samples)
Boston – The Third Mine
High Grade & Wide Widths = Bulk Mining
23

Boston Deposit – Vertical Potential
28.6 g/t Au/3.8m
Measured
And
Indicated
Inferred
Un-Classified
56.6g/t Au/8.8m 28.5 g/t Au/7.1m17.3 g/t Au/4.8m46.6 g/t Au/7.8m
PFS
Design
Boston
Category
Tonnes
(kt)
Grade
(Au g/t)
Ounces
(koz)
Measured and Indicated 3,711 9.2 1,096
Inferred 1,393 7.4 330
2017 Drillhole15.3 g/t Au/22.3m
22.0 g/t Au/17.55m 15.9 g/t Au/18.4m
24

2018 Strategic Drivers
• Complete ramp up of the Doris plant’s first concentrator line and
achieve designed throughput and gold recoveries
• Install and ramp up second concentrator line at Doris plant for total of
2,000 tpd
• Achieve steady state mine production of 1,500 tpd at Doris
• Augment underground ore production with up to 500 tpd from high
grade ore stockpile
• Extend Doris mine life
• Exploration, engineering and mine design at Madrid and Boston for
production in 2020 and 2022
• Secure all required permits
• Continue to attract and retain top talent25

Building Canada’s Next Gold Mining District
Inuit relations
Permitting
Staffing
Infrastructure, Logistics, Sealift and
Capital Projects
Mining
Processing Ramping Up
Financials
Exploration / Upside
26

Appendices
27

Share Capital Structure & Major Shareholders
Major Shareholders Number of Shares
Percentage of Shares
Outstanding
Resource Capital Fund VI L.P. 27,959,260 30.5
Newmont Mining Corporation 26,381,620 28.8
Blackrock, Inc 10,853,507 11.8
Directors and Officers 4,197,222 4.6
Kitikmeot Inuit Association 1,133,333 1.2
As at December 31, 2017
Common Shares (Issued and Outstanding) 91,642,301
Share Incentive Options 3,846,162
Warrants – C$ 7.50 – Expire July 23, 2020 433,834
Warrants – C$15.43 – Expire July 31, 2022 1,900,000
Restricted Shares 240,623
Fully Diluted Shares 98,062,920
28

Mineral Reserves (as at June 30, 2017)
Category/Deposit Tonnes(t 000)
Grade(g/t Au)
Contained Au(oz 000)
Proven
Doris 493 15.8 250
Boston 657 8.5 180
Total Proven 1,150 11.6 430
Probable
Doris 1,652 8.3 442
Madrid North 8,350 6.7 1,802
Madrid South 692 10.3 230
Boston 2,687 8.1 703
Total Probable 13,381 7.4 3,177
Total P & P
Doris 2,145 10.0 692
Madrid North 8,350 6.7 1,802
Madrid South 692 10.3 230
Boston 3,343 8.2 883
Total P & P 14,531 7.7 3,607 29

Mineral Resources (as at June 30, 2017)
Category/Deposit Tonnes(t 000)
Grade(g/t Au)
Contained Au(oz 000)
Measured
Doris 281 22.9 207
Boston 608 10.3 201
Total Measured 889 14.3 408
Indicated
Doris 1,838 9.6 567
Madrid North 11,443 7.5 2,759
Madrid South 571 15.4 282
Boston 3,103 9.0 895
Total Indicated 16,954 8.3 4,503
Total M&I 17,843 8.6 4,911
Inferred
Doris 1,521 8.2 400
Madrid North 4,125 6.4 843
Madrid South 420 9.0 122
Boston 1,393 7.4 330
Total Inferred 7,459 7.1 1,69430

Information Regarding Scientific and
Technical Information
• Notes:
• CIM definitions were followed for Mineral Reserves and Mineral Resources.
• Numbers may not add due to rounding.
• Mineral Reserves are estimated using a cut-off grade of 4.4 g/t for Doris and Madrid North. Madrid South and Boston use a 4.7 g/t Au cut-off grade.
• Mineral Reserves are estimated using an average long-term gold price of US$1250 per ounce and a US$/C$ exchange rate of 0.85.
• A minimum mining width of 1.5 metres for longhole mining and 3 metres for Drift and Fill mining was used.
• Density was calculated using the geological block model density field.
• A 95% extraction factor was applied to longhole mining.
• The application of dilution varied by deposit, and depended on stope thickness.
• Mineral Resources are estimated at a cut-off grade of 4.0 g/t Au for Doris and Madrid North, and 4.5 g/t Au for Madrid South and Boston.
• Mineral Resources are estimated using a long-term gold price of US$1400 per ounce, and a US$/C$ exchange rate of 0.85.
• A minimum mining width of approximately 1.5 metres was used.
• A 50 metre crown pillar allowance was applied to resources located below lakes.
• Doris North has been depleted based on surveyed mining cavities up to the end of May 2017. For the month of June 2017, a mathematical depletion was used based on production figures and the average dilution used for the Mineral Reserve estimate for Doris North.
• Mineral Resources are inclusive of those resources converted to Mineral Reserves.
• Mineral Resources that are not Mineral Reserves do not have demonstrated economic viability.31

Information Regarding Scientific and
Technical Information
• Several slides reported intervals represent down-hole thickness; true width varies depending on dip of the drill hole. True widths are estimated to be approximately 50% to 85% of down hole widths. Composite intervals are based on geological observations. Gold values used to calculate composite intervals are uncut.
• Reported historical drill hole intersections have been obtained from TMAC Resources’ Hope Bay Drillhole Database which has been independently validated by Roscoe Postle Associates Inc (“RPA”) and reported in Section 12 - Data Verification of the “Technical Report on the Hope Bay Project Nunavut, Canada” dated May 28th, 2015.
• Please refer to the news published August 10, 2017 and September 15, 2017 which are both available from TMAC’s website at www.tmacresources.com for the complete text of the releases covering the results of this work.
32

Notes
33