Putting ecosystem services on the map - oas.org€¦ · Shadrack Mwakalila Mathieu Rouget Ruth...
33
The Natural Capital Project Putting ecosystem services on the map Emily McKenzie, Lead – Policy & Finance OAS, 16 June, 2009
-
Upload
doankhuong -
Category
Documents
-
view
221 -
download
3
Transcript of Putting ecosystem services on the map - oas.org€¦ · Shadrack Mwakalila Mathieu Rouget Ruth...

The Natural Capital Project
Putting ecosystem services on the map
Emily McKenzie, Lead – Policy & Finance
OAS, 16 June, 2009

Natural processes through which
ecosystems sustain and fulfill human life.
Ecosystem Services
• Links nature to human welfare
• Full accounting of costs and benefits
• Conservation could pay for itself?

Appropriate scales for decisions
GLOBAL, SYNTHETIC
60% of global ES in decline (Millennium Assessment)
$33 Trillion/y (Costanza et al. 1997 Nature)
LOCAL, SPECIFIC
2 forest patches: $60K/year (Ricketts et al. 2004. PNAS)
22 others (just for pollination!)
NEEDED
• region/landscape scale
• scenario based
• spatially explicit
• multiple services

The Natural Capital Project
Make conservation economically attractive
– Develop science and policy tools to address
ecosystem services
– Apply tools in important places
– Support policies to maintain / pay for services
– Change the way ecosystems are viewed

NatCap within decision making
Stakeholders
ScenariosResults
Policy input
Mapping toolNow 2050
Now 2050
C (tons)
Policy implementation

6
Decision-maker questions
– Where are ecosystem services supplied?
– How would a proposed dam or logging project affect
different ecosystem services and biodiversity?
– What landscape pattern would optimize ecosystem
services now and under likely scenarios?
– Who should pay whom under a proposed PES
program, and how to scale it up?
ANSWERS:
landscape-scale, multi-service assessments

Information for policies & payments
Regulations
Payments
Markets
Fiscal incentives
Advocacy
How important are ecosystem services? To whom?What are impacts of policy on ecosystem services?What is lower-bound for payments?
Where could services be traded?
What are ecosystem service impacts of subsidies and taxes?

InVEST: Key features
• Biodiversity and multiple services
• Biophysical or (first estimate) economic values
• Spatially explicit (mapped)
• Tiered design: simple or complex
• Driven by management scenarios
• Free and open source
http://invest.ecoinformatics.org

InVEST: Which services?
• Biodiversity
• Ecosystem services– Carbon sequestration– Sediment retention– Water quality– Open-access harvest– Native pollination (for ag)– Commercial timber production– Flood control– Hydropower– Irrigation water (for ag)– Agricultural production– Recreation and tourism– Cultural and aesthetic values

Tiered Approach
Tier 1 Tier 2
Simple Complex
Models
Data
Tier 3
InVEST

InVEST within ArcGIS
http://invest.ecoinformatics.org

InVEST interface


16InVEST sites
Mekong
Amazon Borneo &
Sumatra
Puget Sound
Mexico
Andes
Hawai’i
Sierra
Nevada
Eastern
Arc Mtns
Upper
Yangtze
• test InVEST with field partners and experts
• ensure useful, relevant

17
Example: “Valuing the Arc”

Water yield
Carbon storage
Water payments
WWF and CAREREDD
Current ecosystem services
Charcoal harvest
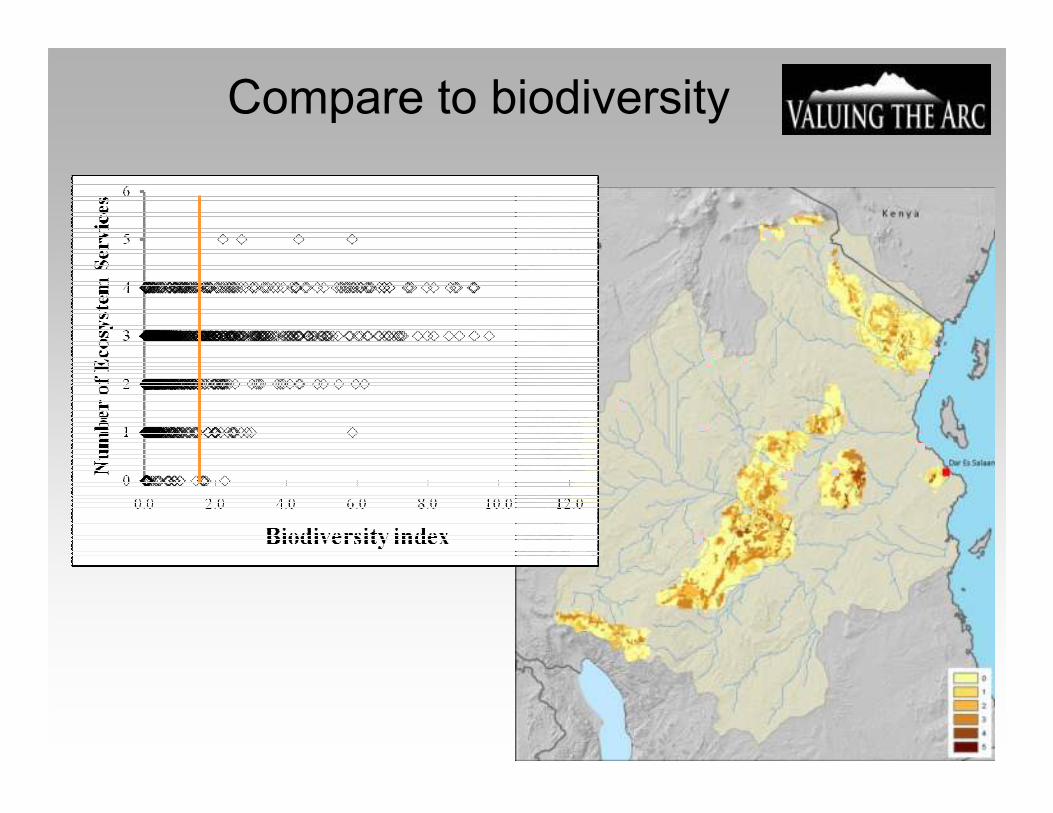
Compare to biodiversity

Assumptions matter!
Firewood - 5km access Firewood - 40km access
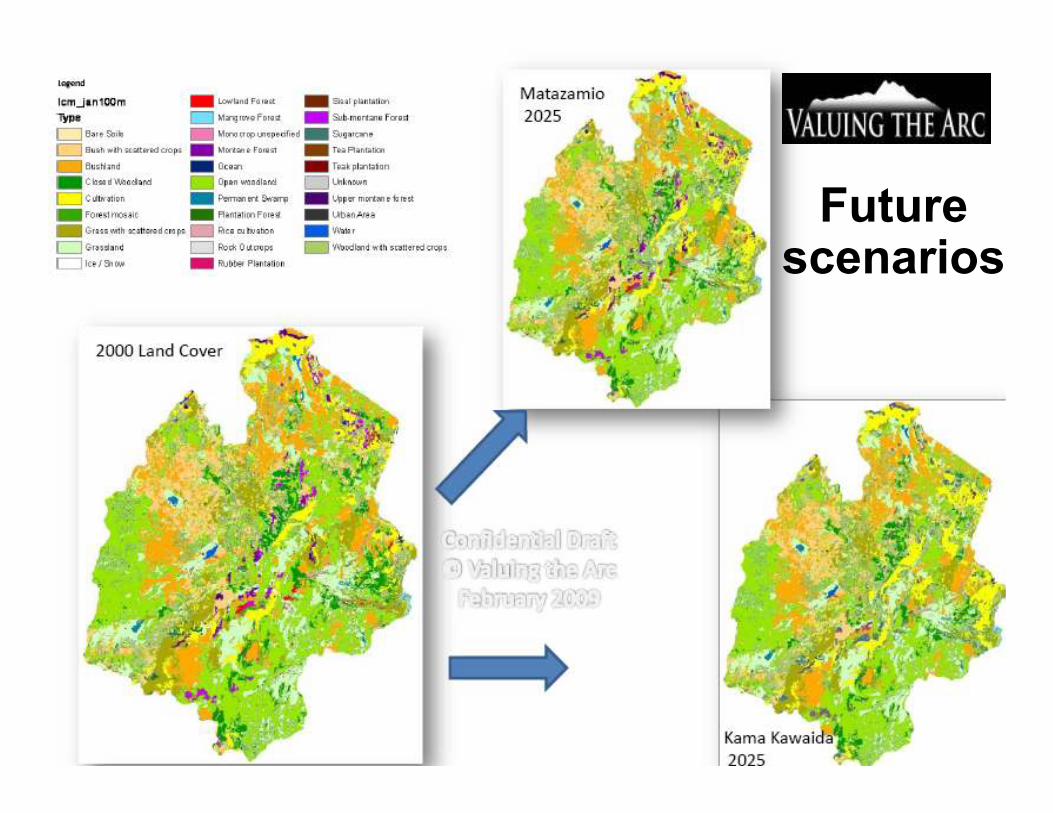
Future scenarios

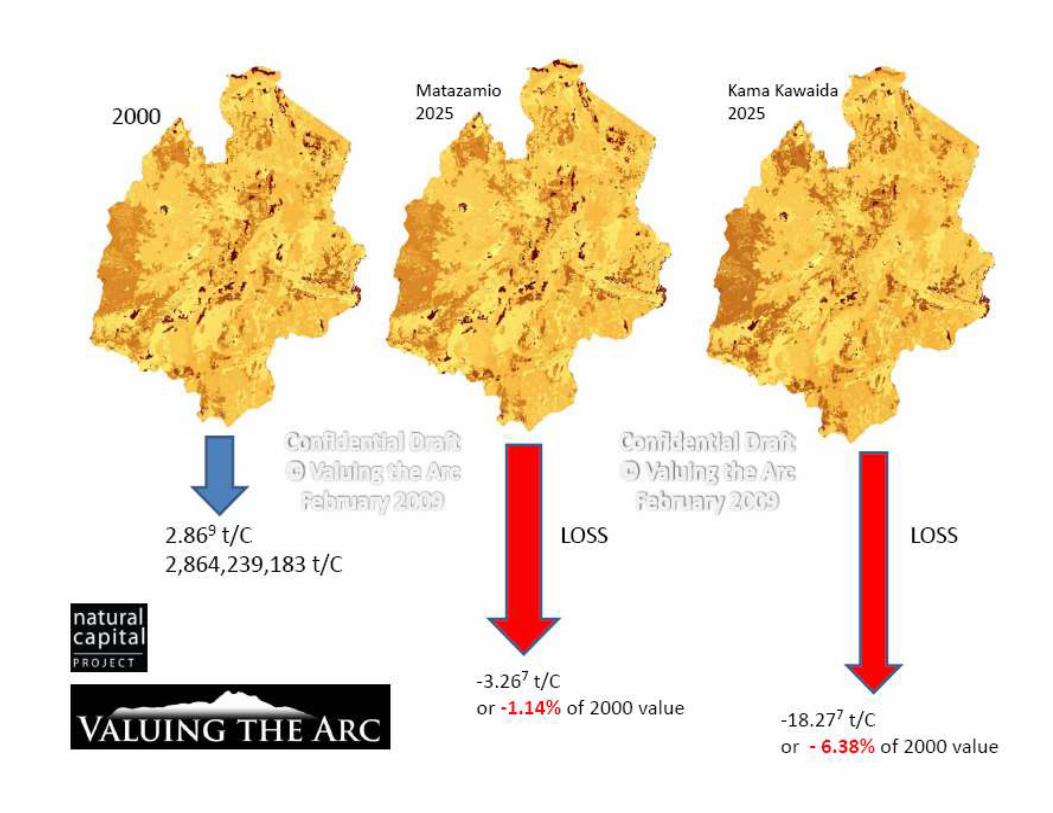
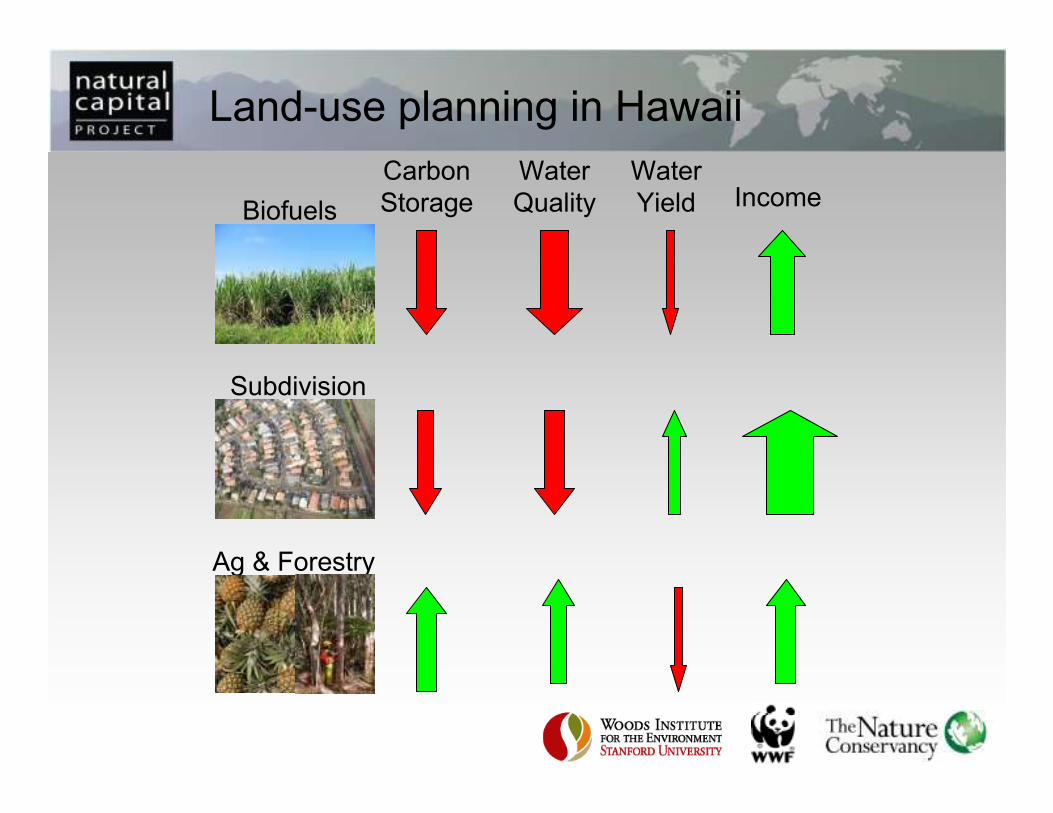
Carbon
Storage
Water
Quality
Water
Yield IncomeBiofuels
Subdivision
Ag & Forestry
Land-use planning in Hawaii
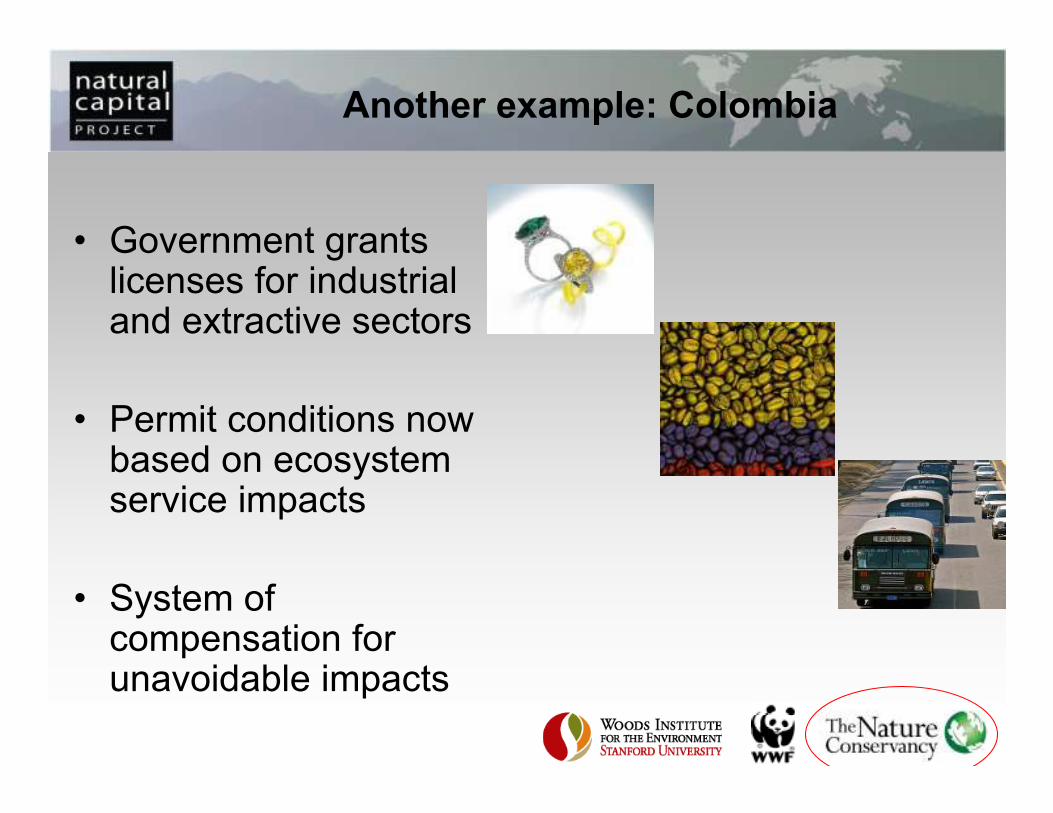
Another example: Colombia
• Government grants licenses for industrial and extractive sectors
• Permit conditions now based on ecosystem service impacts
• System of compensation for unavoidable impacts
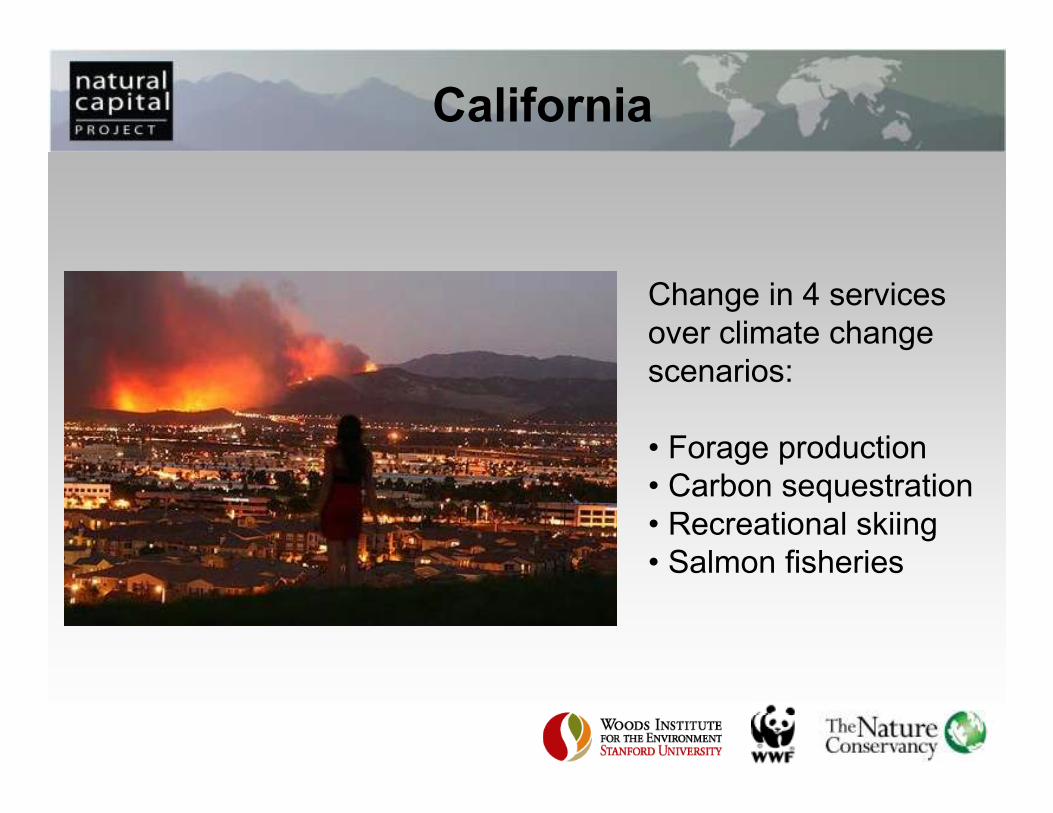
California
Change in 4 services
over climate change
scenarios:
• Forage production
• Carbon sequestration
• Recreational skiing
• Salmon fisheries

What do policy-makers still want?
• Distributional information
• Measures of uncertainty
• Opportunity costs
• Trade-off analysis
• Temporal dynamics
• Valuation (or not…)

What do practitioners want?
• Available data
• Builds local capacity
• Visually appealing
• Quick and cheap and easy
• Not always relying on external consultants
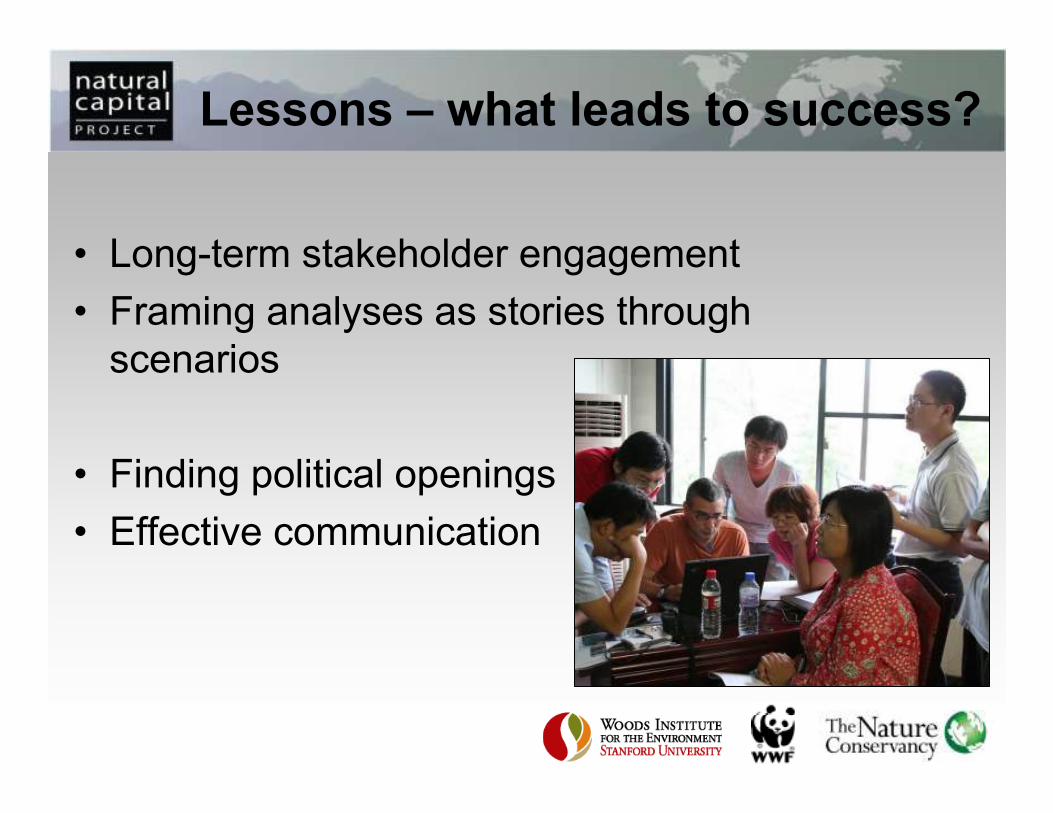
Lessons – what leads to success?
• Long-term stakeholder engagement
• Framing analyses as stories through
scenarios
• Finding political openings
• Effective communication

Scoping opportunities: Screening Criteria
• Will it deliver service &
conservation?
• Are conditions supportive?
Criteria Project A Project B
1
2
3
4
5
…Strong opportunity
High risk
Information gap

What’s next? Policy & finance tools
Scoping
opportunities
Mapping
Valuation
Policies &
payments
InVEST
for policy-
makers
WWF & TNC networks =
Field and policy experts
Screening Criteria =
Framework for prioritizing &
designing ES projects
InVEST = Software tool for
mapping & valuation of ES
Scenarios = Guidance on
methodologies

What’s next? Marine ecosystem services
33
Thanks…
NatCap
Kai Chan
Chris Colvin
Gretchen Daily
Helen Fox
Peter Kareiva
Chuck Katz
Erik Lonsdorf
Bruce McKenney
Guillermo Mendoza
Belinda Morris
Robin Naidoo
Erik Nelson
Nasser Olwero
Steve Polasky
Jim Regetz
M. Sanjayan
Rebecca Shaw
Heather Tallis
Christine Tam
Buzz Thompson
Michael Wright
…
Valuing the Arc
Andrew Balmford
Neil Burgess
Rhys Green
Shadrack Mwakalila
Mathieu Rouget
Ruth Swetnam
Kerry Turner
Sue White
…
Support
NSF-NCEAS
Leverhulme Trust
Packard Foundation
MacArthur Foundation
Moore Foundation
Roger and Vicki Sant
Peter and Helen Bing
…