Punjab
112
STATE PROFILES – PUNJAB
-
Upload
dr-amit-kapoor -
Category
Documents
-
view
421 -
download
3
Transcript of Punjab

STATE PROFILES – PUNJAB

ECONOMIC CHALLENGE FOR CHIEF MINISTERS IN 2012
Achieving Fiscal Stability
Enhancing State Competitiveness
• Competitiveness is the only way to achieve sustainable job growth, improving incomes and stable public finances
• Creating a clear economic strategy for the state that engages all stakeholders is even more important in times of budget cutting and austerity
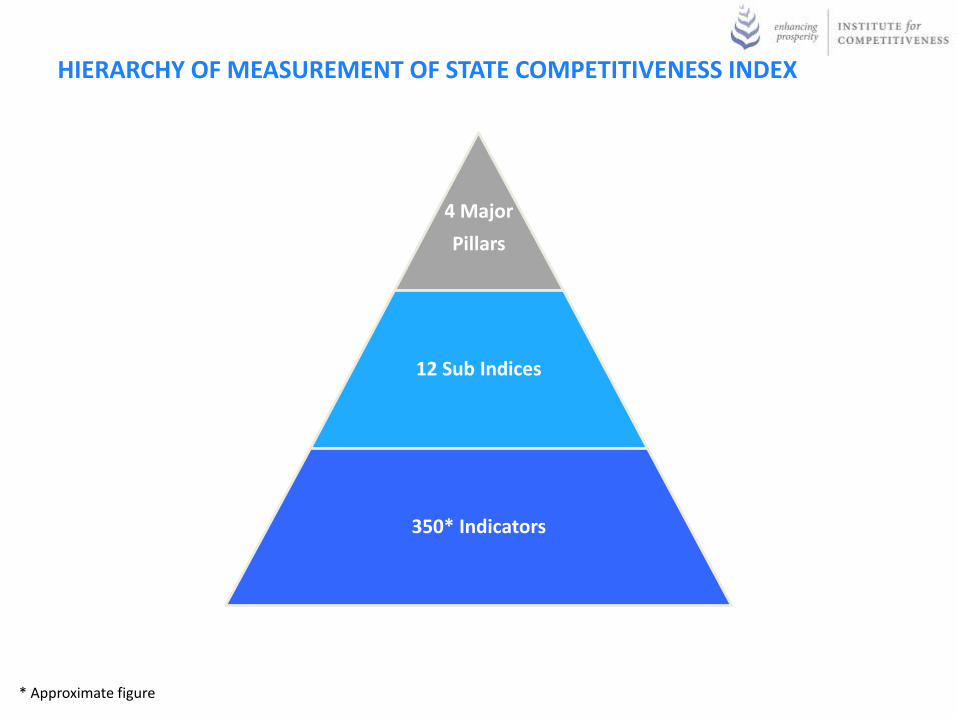
4 Major
Pillars
12 Sub Indices
350* Indicators
HIERARCHY OF MEASUREMENT OF STATE COMPETITIVENESS INDEX
* Approximate figure
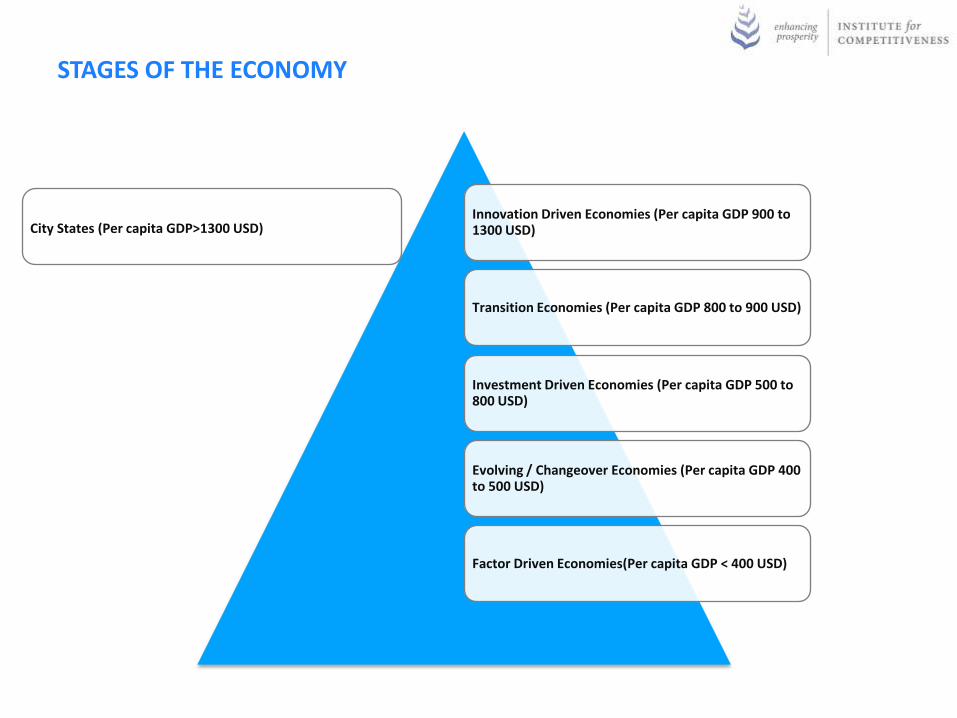
STAGES OF THE ECONOMY
Innovation Driven Economies (Per capita GDP 900 to 1300 USD)
Transition Economies (Per capita GDP 800 to 900 USD)
Investment Driven Economies (Per capita GDP 500 to 800 USD)
Evolving / Changeover Economies (Per capita GDP 400 to 500 USD)
Factor Driven Economies(Per capita GDP < 400 USD)
City States (Per capita GDP>1300 USD)
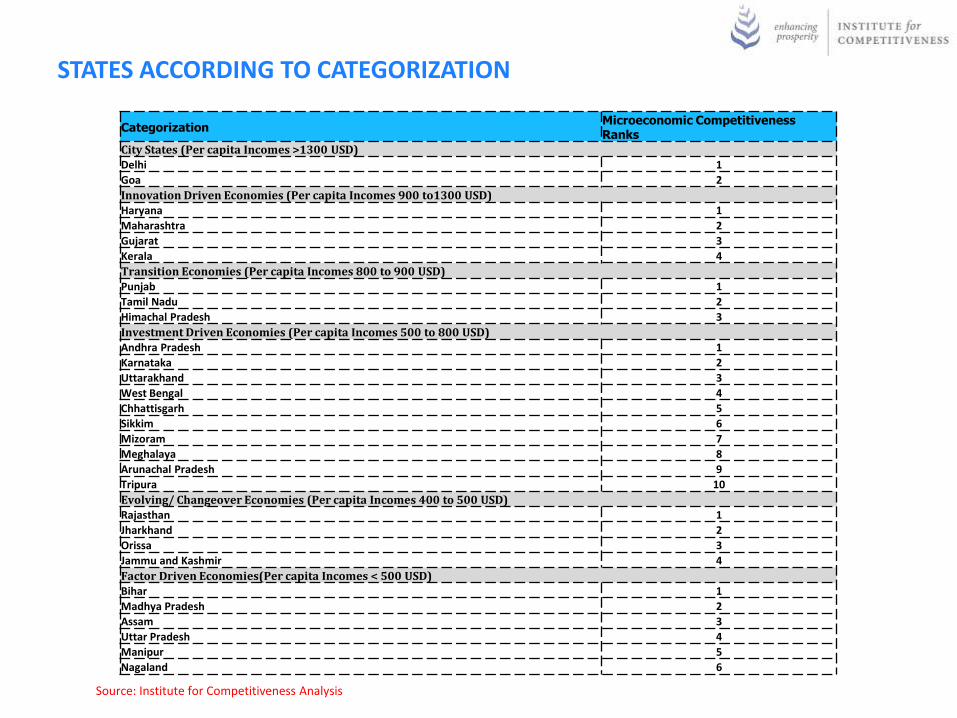
CategorizationMicroeconomic Competitiveness Ranks
City States (Per capita Incomes >1300 USD)Delhi 1
Goa 2
Innovation Driven Economies (Per capita Incomes 900 to1300 USD)Haryana 1
Maharashtra 2
Gujarat 3
Kerala 4
Transition Economies (Per capita Incomes 800 to 900 USD) Punjab 1
Tamil Nadu 2
Himachal Pradesh 3
Investment Driven Economies (Per capita Incomes 500 to 800 USD)Andhra Pradesh 1
Karnataka 2
Uttarakhand 3
West Bengal 4
Chhattisgarh 5
Sikkim 6
Mizoram 7
Meghalaya 8
Arunachal Pradesh 9
Tripura 10
Evolving/ Changeover Economies (Per capita Incomes 400 to 500 USD) Rajasthan 1
Jharkhand 2
Orissa 3
Jammu and Kashmir 4
Factor Driven Economies(Per capita Incomes < 500 USD) Bihar 1
Madhya Pradesh 2
Assam 3
Uttar Pradesh 4
Manipur 5
Nagaland 6
STATES ACCORDING TO CATEGORIZATION
Source: Institute for Competitiveness Analysis

NEAR TERM STATE PROSPERITY PERFORMANCE
Jammu & Kashmir
Himachal Pradesh
Punjab
Haryana
Uttar Pradesh
Rajasthan
Delhi
Uttarakhand
Bihar
Orissa
West Bengal
Assam
Meghalaya
Tripura
Mizoram
Manipur
Nagaland
Arunachal Pradesh
Sikkim
Jharkhand
Gujarat
Maharashtra
Goa
Madhya Pradesh
Chhattisgarh
Andhra Pradesh
Karnataka
Kerala
Tamil Nadu
3
4
5
6
7
8
9
0 20000 40000 60000 80000 100000 120000 140000
Gross Domestic Product per Capita, 2011
Gro
ss D
om
est
ic P
rod
uct
pe
r C
apit
a re
al g
row
th r
ate
, 20
08
-20
11
All In
dia
Average
57
.28
In
dex
Poin
ts
All India GSDP /Capita rate (CAGR) of 6.27 %
All India Average of 47,998 Rupees/capita
Highly Productive and Prosperity Rising versus India
High but declining versus India
Low but rising versus India
Low and declining versus India

COMPETITIVENESS: UNDERLYING CONCEPTS
• Competitiveness is the productivity with which a state utilizes its
human, capital, and natural resources
• Productivity determines wages and the standard of living – Productivity
growth determines sustainable economic growth
• Productivity depends on how a state competes, not what industries it
competes in
• Innovation in products and processes is necessary to drive productivity
growth
• Only productive businesses can create wealth and jobs. States compete to
offer the most productive environment for business
• The public and private sectors play different but interrelated roles in creating
a productive economy
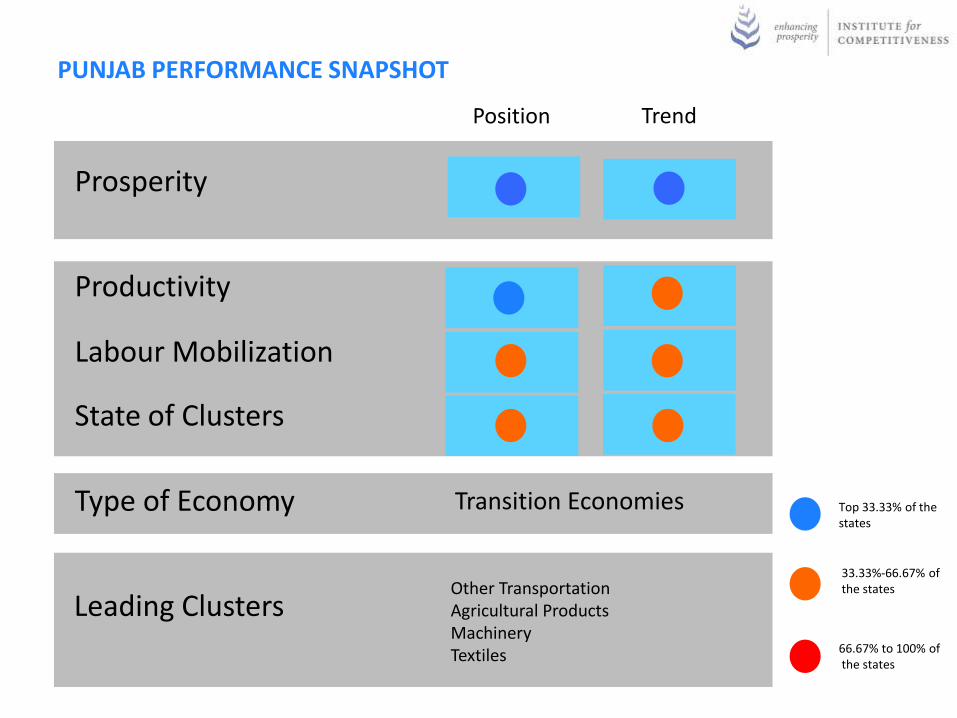
PUNJAB PERFORMANCE SNAPSHOT
Top 33.33% of the states
33.33%-66.67% ofthe states
66.67% to 100% ofthe states
Position Trend
Prosperity
Productivity
Labour Mobilization
State of Clusters
Leading ClustersOther TransportationAgricultural ProductsMachinery Textiles
Type of Economy Transition Economies
Labour Mobilization
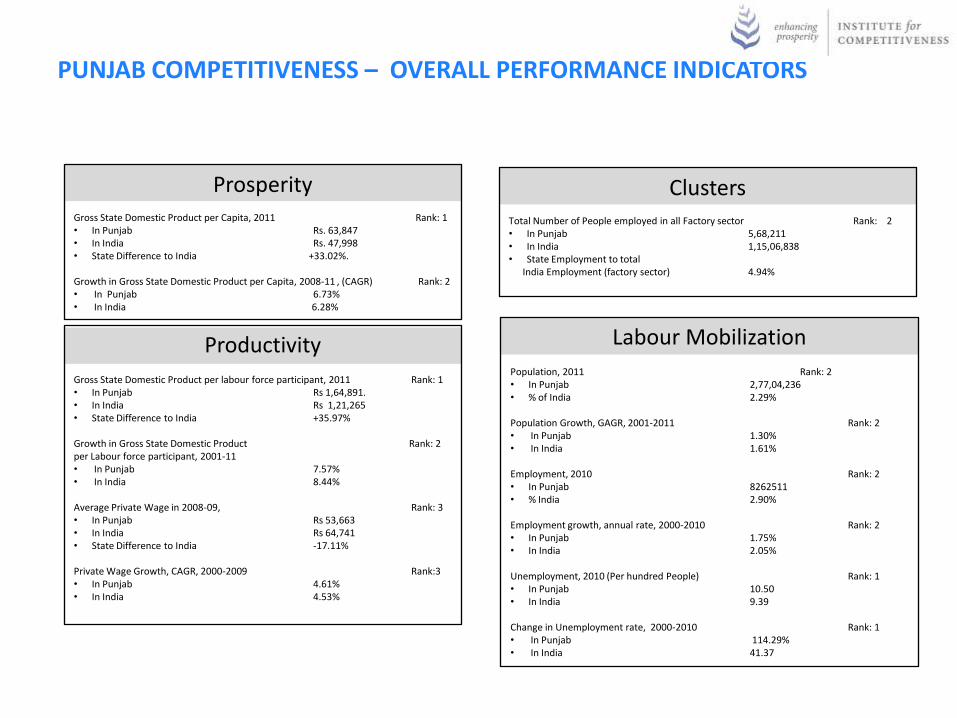
Population, 2011 Rank: 2• In Punjab 2,77,04,236• % of India 2.29%
Population Growth, GAGR, 2001-2011 Rank: 2• In Punjab 1.30%• In India 1.61%
Employment, 2010 Rank: 2• In Punjab 8262511• % India 2.90%
Employment growth, annual rate, 2000-2010 Rank: 2• In Punjab 1.75%• In India 2.05%
Unemployment, 2010 (Per hundred People) Rank: 1 • In Punjab 10.50• In India 9.39
Change in Unemployment rate, 2000-2010 Rank: 1• In Punjab 114.29%• In India 41.37
ClustersTotal Number of People employed in all Factory sector Rank: 2• In Punjab 5,68,211• In India 1,15,06,838• State Employment to total
India Employment (factory sector) 4.94%
Productivity
Gross State Domestic Product per labour force participant, 2011 Rank: 1• In Punjab Rs 1,64,891.• In India Rs 1,21,265• State Difference to India +35.97%
Growth in Gross State Domestic Product Rank: 2per Labour force participant, 2001-11• In Punjab 7.57%• In India 8.44%
Average Private Wage in 2008-09, Rank: 3• In Punjab Rs 53,663• In India Rs 64,741• State Difference to India -17.11%
Private Wage Growth, CAGR, 2000-2009 Rank:3• In Punjab 4.61%• In India 4.53%
ProsperityGross State Domestic Product per Capita, 2011 Rank: 1• In Punjab Rs. 63,847• In India Rs. 47,998• State Difference to India +33.02%.
Growth in Gross State Domestic Product per Capita, 2008-11 , (CAGR) Rank: 2• In Punjab 6.73%• In India 6.28%
PUNJAB COMPETITIVENESS – OVERALL PERFORMANCE INDICATORS
GSD
P a
t cu
rren
t p
rice
at
fact
or
cost
in R
up
ees
Cro
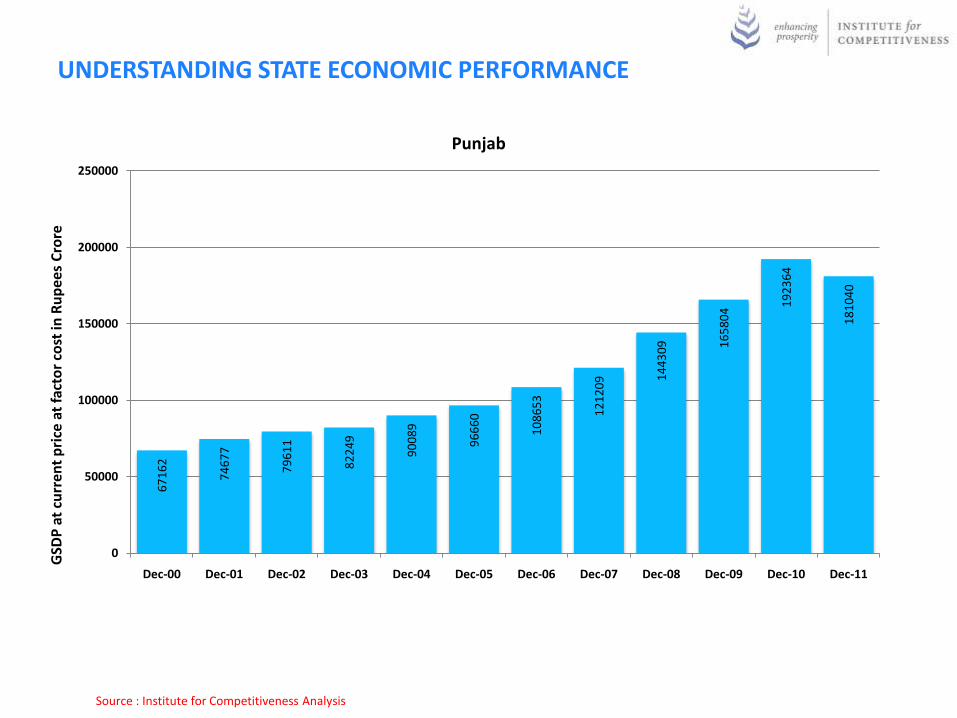
reUNDERSTANDING STATE ECONOMIC PERFORMANCE
67
16
2
74
67
7
79
61
1
82
24
9
90
08
9
96
66
0
10
86
53
12
12
09 1
44
30
9 16
58
04
19
23
64
18
10
40
0
50000
100000
150000
200000
250000
Dec-00 Dec-01 Dec-02 Dec-03 Dec-04 Dec-05 Dec-06 Dec-07 Dec-08 Dec-09 Dec-10 Dec-11
Punjab
Source : Institute for Competitiveness Analysis

GSD
P a
t cu
rren
t p
rice
at
fact
or
cost
in R
up
ees
Cro
reCONTRIBUTION OF PUNJAB’S GSDP TO INDIAN GSDP
Source : Institute for Competitiveness Analysis
Dec-00 Dec-01 Dec-02 Dec-03 Dec-04 Dec-05 Dec-06 Dec-07 Dec-08 Dec-09 Dec-10 Dec-11
Ratio of Punjab's GSDP to Indian
GDP in Percentage
Terms
3.94 4.16 4.13 3.95 3.83 3.66 3.64 3.49 3.59 3.62 3.85 3.62
0
1000000
2000000
3000000
4000000
5000000
6000000
Dec-00 Dec-01 Dec-02 Dec-03 Dec-04 Dec-05 Dec-06 Dec-07 Dec-08 Dec-09 Dec-10 Dec-11
Punjab's GDP Indian GDP
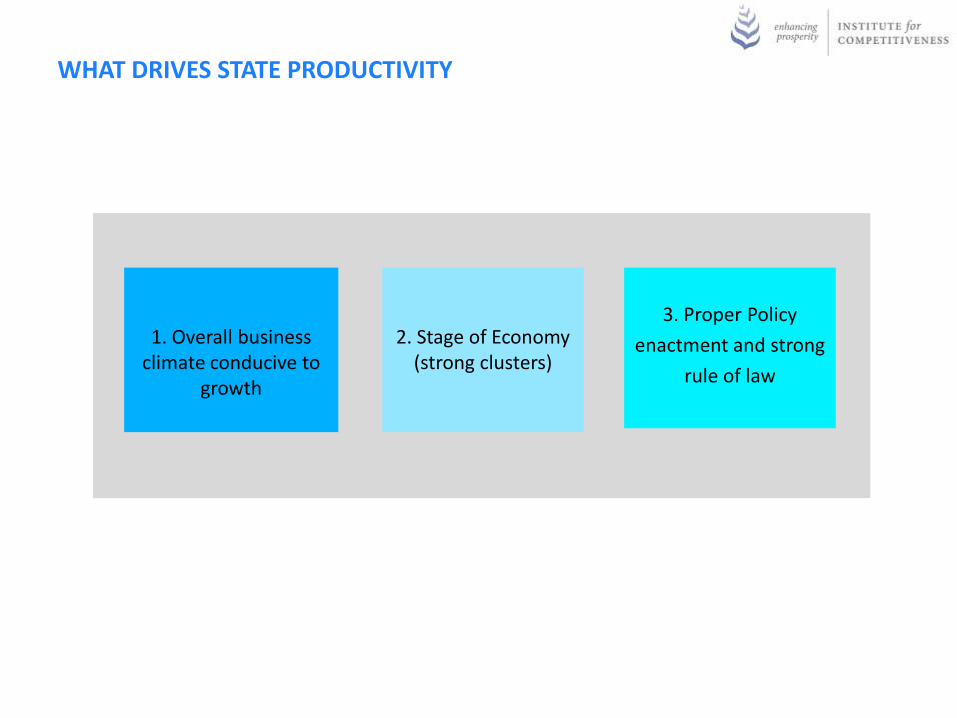
WHAT DRIVES STATE PRODUCTIVITY
1. Overall business climate conducive to
growth
2. Stage of Economy (strong clusters)
3. Proper Policy
enactment and strong
rule of law

MODEL USED FOR ANALYSIS
Climate for
Innovation based
local rivalry
Clusters of Related
and Supporting
Industries
Demand
Conditions
• Local rules and incentives that encourage investment and productivity e.g.
- salaries,- incentives for capital investments, - intellectual property protection• Vigorous local competition i.e., - Openness to foreign and local competition; - Sophistication of company operations
Local availability of suppliers and supporting industriesPresence of clusters instead of isolated firms
Sophisticated and demanding local customers and needs e.g.,- Strict quality, safety, and environmental standards– Consumer protection laws – Government procurement ofadvanced technology– Early demand for products andServices.
Access to high quality business inputsi.e.,- Natural endowments,- Human resources, - Capital availability,- Physical infrastructure,- Administrative infrastructure,- Information infrastructure, - Scientific and technological infrastructure
Factor
Conditions
Source: Michael E Porter

IMPROVING PRODUCTIVITY IN BUSINESS ENVIRONMENT
Key Issues for States
• More power in terms of tax sharing with center
• Reduce costs of doing business
• Developing training programs which meet the specific needs of the state
industrial clusters
• Focus on infrastructure investments on the most leveraged areas for
productivity and economic growth
• Implementing policies to support small growth businesses
• Enhancing the state’s skill development and training institutions for the same
• Relentlessly improve of the public education system, the essential foundation
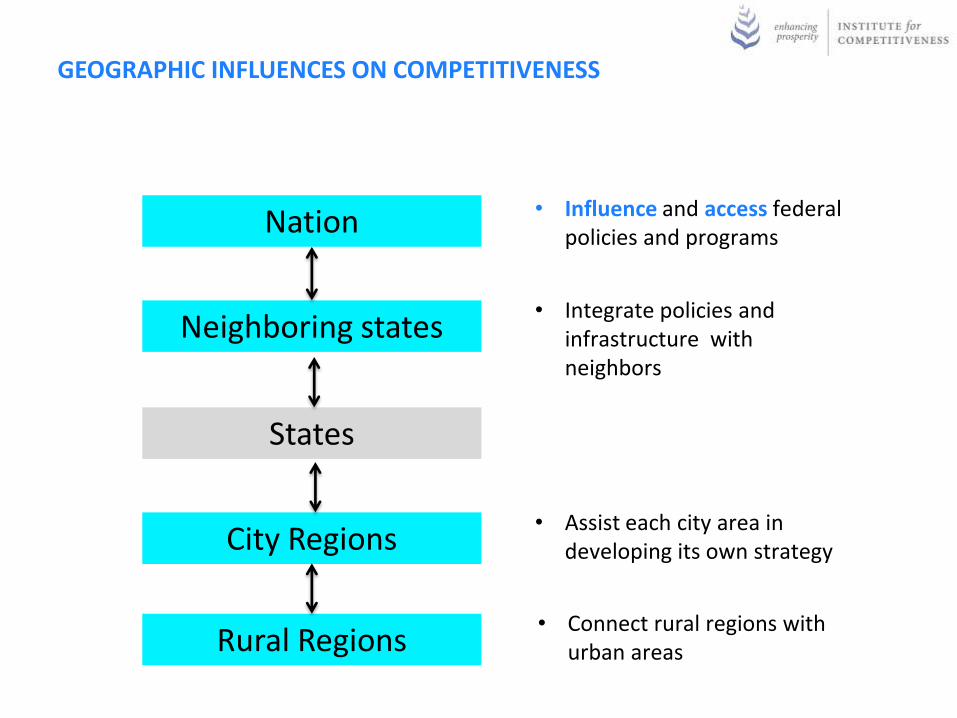
Nation
Neighboring states
States
City Regions
Rural Regions
GEOGRAPHIC INFLUENCES ON COMPETITIVENESS
• Influence and access federal policies and programs
• Integrate policies and infrastructure with neighbors
• Assist each city area in developing its own strategy
• Connect rural regions with urban areas

CONTRIBUTION OF AGRICULTURE SECTOR TO GSDP G
SDP
at
curr
ent
pri
ce a
t fa
cto
r co
st in
Ru
pee
s C
rore
Dec-00 Dec-01 Dec-02 Dec-03 Dec-04 Dec-05 Dec-06 Dec-07 Dec-08 Dec-09 Dec-10 Dec-11
Ratio of Agricultural
GSDP in Punjab to the total
GSDP in Punjab in Percentage
terms
37.53 35.90 34.97 32.93 32.77 32.18 31.32 31.94 32.42 33.16 34.14 32.52
0
50000
100000
150000
200000
250000
Dec-00 Dec-01 Dec-02 Dec-03 Dec-04 Dec-05 Dec-06 Dec-07 Dec-08 Dec-09 Dec-10 Dec-11
Source : Institute for Competitiveness Analysis

CONTRIBUTION OF MANUFACTURING SECTOR TO GSDP G
SDP
at
curr
ent
pri
ce a
t fa
cto
r co
st in
Ru
pee
s C
rore
Dec-00 Dec-01 Dec-02 Dec-03 Dec-04 Dec-05 Dec-06 Dec-07 Dec-08 Dec-09 Dec-10 Dec-11
Ratio of Manufacturing GSDP in Punjab to the total GSDP in
Punjab in Percentage
terms
14.93 14.44 13.09 13.87 13.58 13.54 13.49 14.33 13.51 13.12 12.72 13.07
0
50000
100000
150000
200000
250000
Dec-00 Dec-01 Dec-02 Dec-03 Dec-04 Dec-05 Dec-06 Dec-07 Dec-08 Dec-09 Dec-10 Dec-11
Source : Institute for Competitiveness Analysis
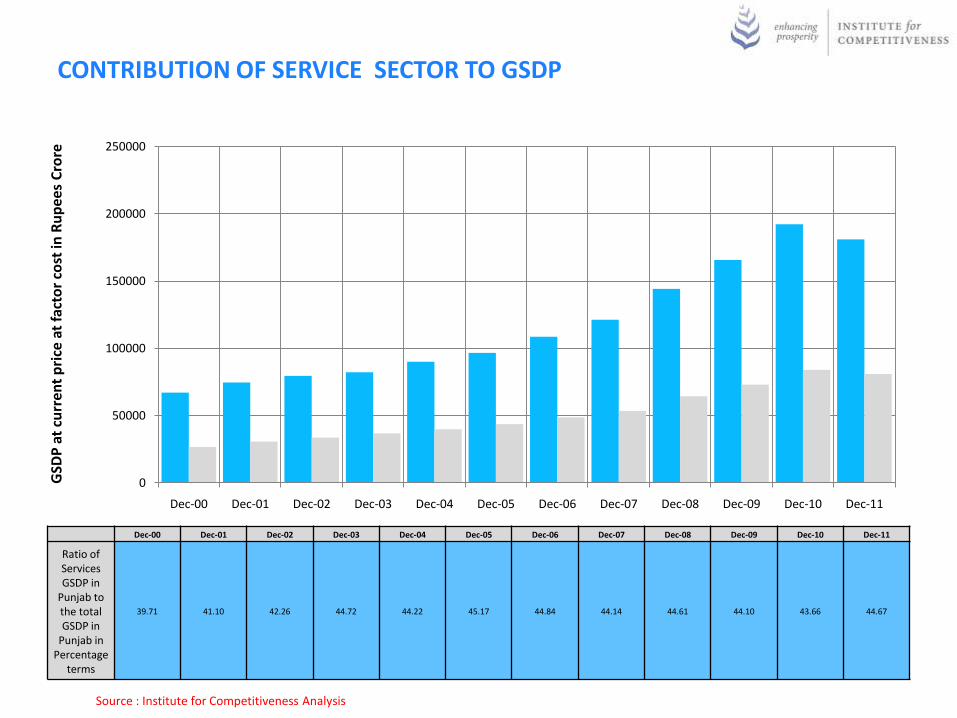
CONTRIBUTION OF SERVICE SECTOR TO GSDP G
SDP
at
curr
ent
pri
ce a
t fa
cto
r co
st in
Ru
pee
s C
rore
Dec-00 Dec-01 Dec-02 Dec-03 Dec-04 Dec-05 Dec-06 Dec-07 Dec-08 Dec-09 Dec-10 Dec-11
Ratio of Services GSDP in
Punjab to the total GSDP in
Punjab in Percentage
terms
39.71 41.10 42.26 44.72 44.22 45.17 44.84 44.14 44.61 44.10 43.66 44.67
0
50000
100000
150000
200000
250000
Dec-00 Dec-01 Dec-02 Dec-03 Dec-04 Dec-05 Dec-06 Dec-07 Dec-08 Dec-09 Dec-10 Dec-11
Source : Institute for Competitiveness Analysis
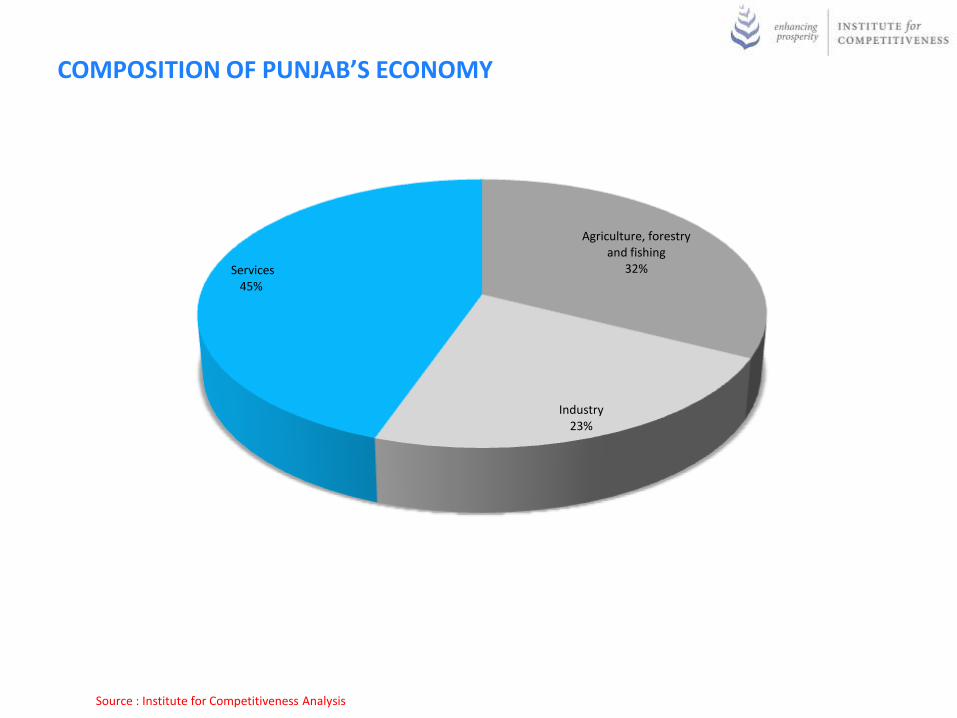
Agriculture, forestry and fishing
32%
Industry23%
Services 45%
COMPOSITION OF PUNJAB’S ECONOMY
Source : Institute for Competitiveness Analysis
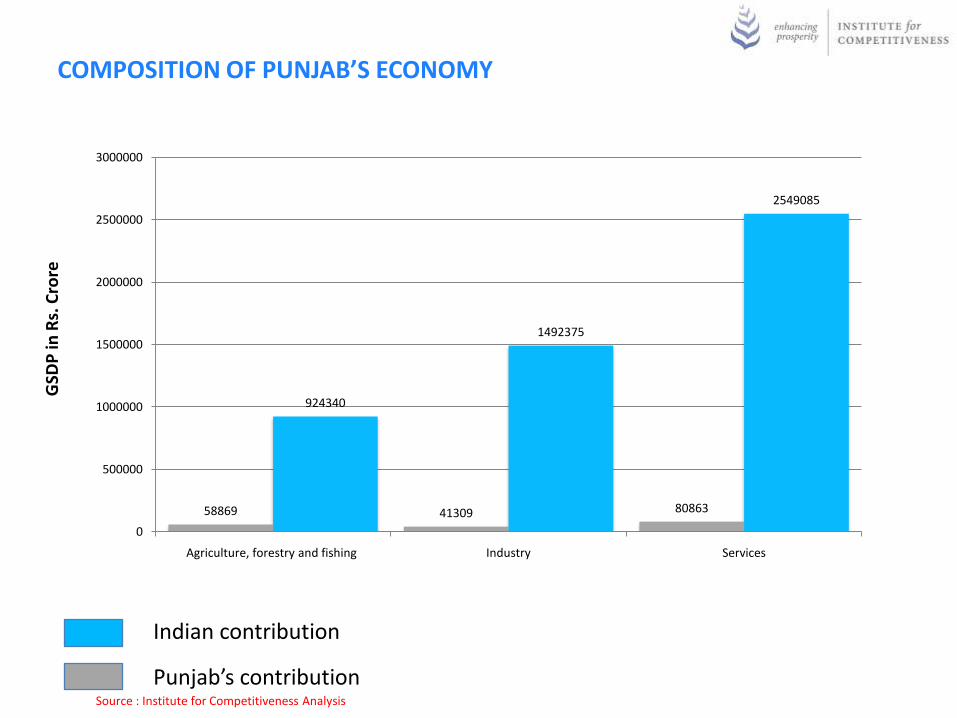
GSD
P in
Rs.
Cro
re
Indian contribution
Punjab’s contribution
58869 41309 80863
924340
1492375
2549085
0
500000
1000000
1500000
2000000
2500000
3000000
Agriculture, forestry and fishing Industry Services
COMPOSITION OF PUNJAB’S ECONOMY
Source : Institute for Competitiveness Analysis
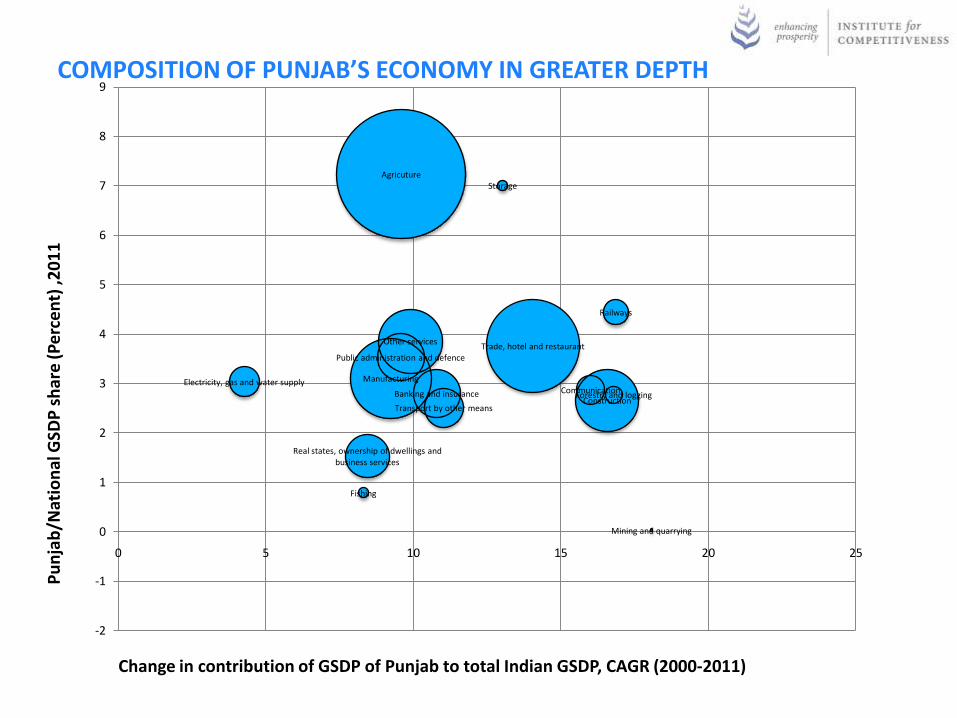
Pu
nja
b/N
atio
nal
GSD
P s
har
e (
Pe
rce
nt)
,20
11
Change in contribution of GSDP of Punjab to total Indian GSDP, CAGR (2000-2011)
Agricuture
Banking and insurance CommunicationConstruction
Electricity, gas and water supply
Fishing
Forestry and logging
Manufacturing
Mining and quarrying
Other services
Public administration and defence
Railways
Real states, ownership of dwellings and business services
Storage
Trade, hotel and restaurant
Transport by other means
-2
-1
0
1
2
3
4
5
6
7
8
9
0 5 10 15 20 25
COMPOSITION OF PUNJAB’S ECONOMY IN GREATER DEPTH

STATE PRIVATE WAGE PERFORMANCE
Jammu & Kashmir
Himachal Pradesh
Punjub
Uttaranchal
Haryana
Delhi
Rajasthan
Uttar Pradesh
Bihar
Nagaland
Manipur
Tripura
Meghalaya
Assam
West Bengal
Jharkhand
Orissa
Chhattisgarh Madhya PradeshGujarat
Maharashtra
Andhra Pradesh
Karnataka
Goa
Kerala Tamil Nadu
0
20000
40000
60000
80000
100000
120000
140000
160000
0 2 4 6 8 10 12 14Wage Growth (CAGR), 2001 to 2008
Low and declining versus India Low but rising versus India
Average Wage : Rupees 64,741
Wage Growth rate 4.53%
Ave
rage
Wag
es
in R
up
ee
s ,2
00
9
Source : Institute for Competitiveness Analysis, Data as of 2010

LABOUR PRODUCTIVITY
Andhra Pradesh
Arunachal Pradesh
Assam
Bihar
Chhattisgarh
Delhi
Goa
Gujarat
Haryana
Himachal Pradesh
Jammu & KashmirJharkhand
Karnataka
Kerala
Madhya Pradesh
Maharashtra
Manipur
MeghalayaMizoram Nagaland
Orissa
Punjab
Rajasthan
Sikkim
Tamil Nadu
Tripura
Uttar Pradesh
UttarakhandWest Bengal
0
50000
100000
150000
200000
250000
300000
350000
400000
5.00 6.00 7.00 8.00 9.00 10.00 11.00 12.00 13.00
All
Ind
ia A
verage 5
7.2
8
Ind
ex Po
ints
All India Average of of 1,21,265 Rupees/Labour force participant
All India Average of 8.44%
GSDP /Labor force participant growth rate(CAGR)
GSD
P a
t C
urr
en
t P
rice
s p
er
lab
ou
r fo
rce
par
tici
pan
t, 2
01
1
High but declining versus India Highly productive and Productivity rising versus India
Low but rising versus India Low and declining versus India
Source : Institute for Competitiveness Analysis

LONG TERM JOB GROWTH
Jammu & KashmirHimachal Pradesh
PunjabHaryana
Uttar Pradesh
Rajasthan
Delhi
Uttarakhand
Bihar
Orissa
West Bengal
Assam
MeghalayaTripura Mizoram ManipurNagaland Arunachal Pradesh
Sikkim
Jharkhand
Gujarat
Maharashtra
Goa
Madhya Pradesh
Chhattisgarh
Andhra Pradesh
Karnataka
Kerala
Tamil Nadu
0
10000000
20000000
30000000
40000000
50000000
60000000
70000000
80000000
90000000
0 0.5 1 1.5 2 2.5 3 3.5
Job growth rate CAGR, 2001-2010
Nu
mb
er
of
Job
s, 2
01
1
Losing Jobs Gaining Jobs
All India average of 1,62,99,464 Jobs /State
All India Average of 2.05%
Source : Institute for Competitiveness Analysis,
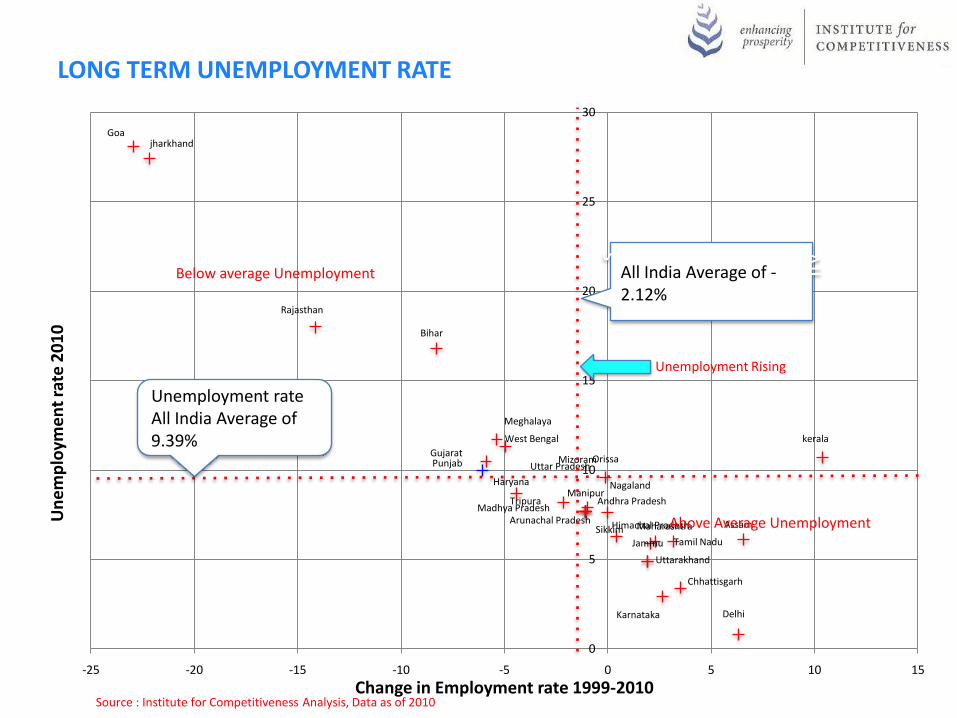
Andhra Pradesh
Arunachal Pradesh Assam
Bihar
Chhattisgarh
Goa
Gujarat
Haryana
Himachal Pradesh
Jammu
jharkhand
Karnataka
kerala
Madhya Pradesh
Maharashtra
Manipur
Meghalaya
Mizoram
Nagaland
Delhi
OrissaPunjab
Rajasthan
SikkimTamil Nadu
Tripura
Uttar Pradesh
Uttarakhand
West Bengal
0
5
10
15
20
25
30
-25 -20 -15 -10 -5 0 5 10 15
Change in Employment rate 1999-2010
Unemployment rate All India Average of 9.39%
All
Ind
ia A
verage 5
7.2
8
Ind
ex Po
int
s
All India Average of -2.12%
Unemployment Rising
Below average Unemployment
Above Average UnemploymentUn
em
plo
yme
nt
rate
20
10
LONG TERM UNEMPLOYMENT RATE
Source : Institute for Competitiveness Analysis, Data as of 2010

NEAR TERM UNEMPLOYMENT RATE
Andhra PradeshArunachal Pradesh
Assam
Bihar
Chhattisgarh
Goa
Gujarat
Haryana
Himachal PradeshJammu
jharkhand
Karnataka
kerala
Madhya Pradesh
Maharashtra
Manipur
Meghalaya
Mizoram Nagaland
Delhi
Orissa
Punjab
Rajasthan
SikkimTamil Nadu
Tripura
Uttar Pradesh
Uttarakhand
West Bengal
0
5
10
15
20
25
30
-30 -25 -20 -15 -10 -5 0 5 10
Change in Employment rate 2008 to 2010
All India Average of 9.39%
All
Ind
ia
Ave
rage
5
7.2
8
Ind
ex
Poin
tsAll India Average of -6.55%
Un
em
plo
yme
nt
rate
20
10
Source : Institute for Competitiveness Analysis, Source : Institute for Competitiveness Analysis, Data as of 2010
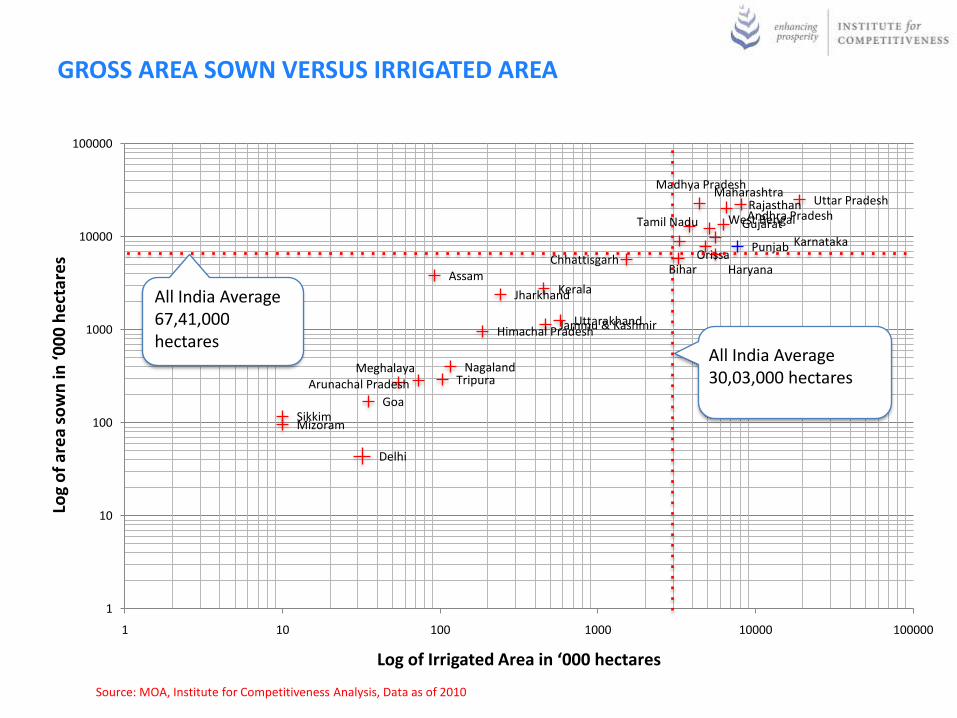
GROSS AREA SOWN VERSUS IRRIGATED AREA
Jammu & KashmirHimachal Pradesh
Punjab
Haryana
Uttar PradeshRajasthan
Delhi
Uttarakhand
BiharOrissa
West Bengal
Assam
MeghalayaTripura
Mizoram
Nagaland
Arunachal Pradesh
Sikkim
Jharkhand
Gujarat
Maharashtra
Goa
Madhya Pradesh
Chhattisgarh
Andhra Pradesh
Karnataka
Kerala
Tamil Nadu
1
10
100
1000
10000
100000
1 10 100 1000 10000 100000
Log of Irrigated Area in ‘000 hectares
Log
of
are
a so
wn
in ‘0
00
he
ctar
es
All India Average 67,41,000 hectares A
ll In
dia
All India Average 30,03,000 hectares
Source: MOA, Institute for Competitiveness Analysis, Data as of 2010
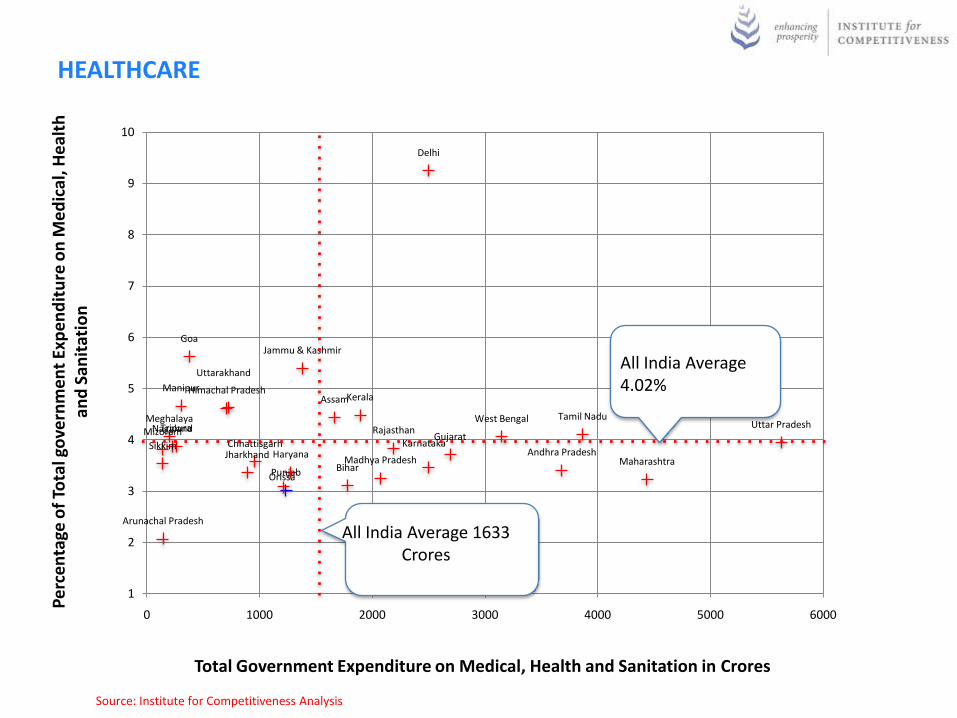
HEALTHCARE
Jammu & Kashmir
Himachal Pradesh
Punjab
Haryana
Uttar PradeshRajasthan
Delhi
Uttarakhand
BiharOrissa
West Bengal
Assam
MeghalayaTripuraMizoram
Manipur
Nagaland
Arunachal Pradesh
SikkimJharkhand
Gujarat
Maharashtra
Goa
Madhya Pradesh
ChhattisgarhAndhra Pradesh
Karnataka
Kerala
Tamil Nadu
1
2
3
4
5
6
7
8
9
10
0 1000 2000 3000 4000 5000 6000
Pe
rce
nta
ge o
f To
tal g
ove
rnm
en
t Ex
pe
nd
itu
re o
n M
ed
ical
, He
alth
an
d S
anit
atio
n
Total Government Expenditure on Medical, Health and Sanitation in Crores
All India Average 4.02%
All
Ind
iaAll India Average 1633
Crores
Source: Institute for Competitiveness Analysis
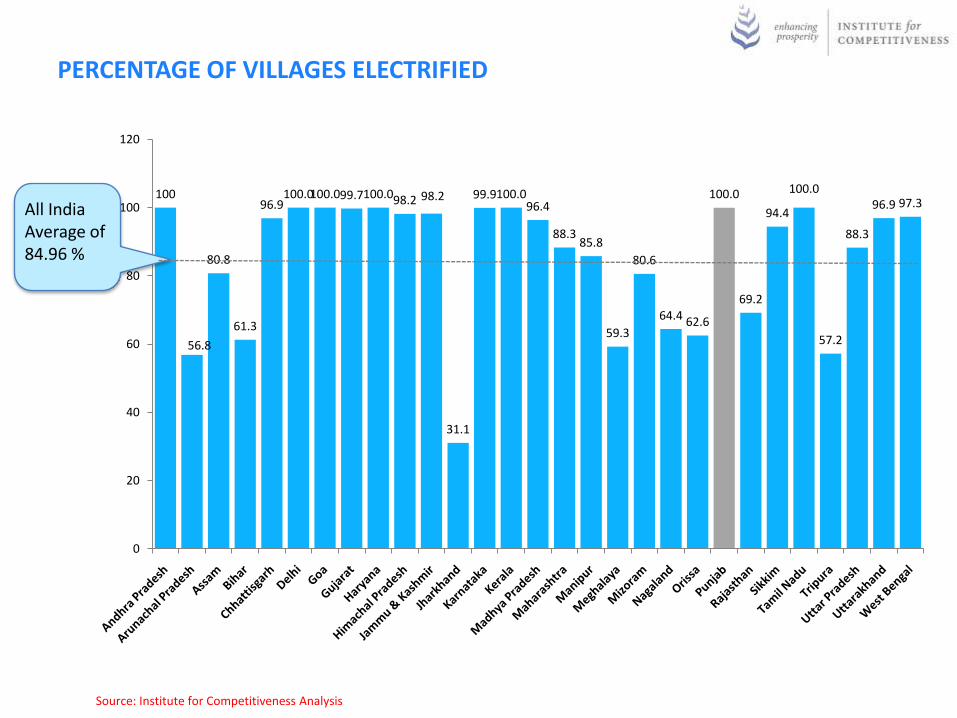
PERCENTAGE OF VILLAGES ELECTRIFIED
100
56.8
80.8
61.3
96.9100.0100.099.7100.098.2 98.2
31.1
99.9100.096.4
88.385.8
59.3
80.6
64.4 62.6
100.0
69.2
94.4
100.0
57.2
88.3
96.9 97.3
0
20
40
60
80
100
120
All India Average of 84.96 %
Source: Institute for Competitiveness Analysis
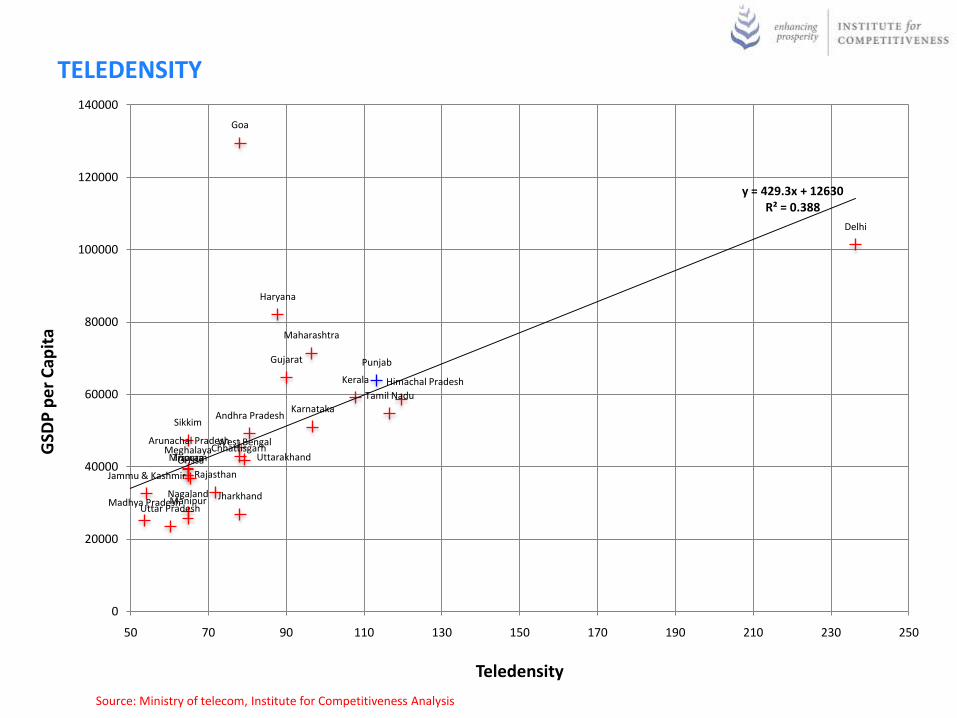
TELEDENSITY
Andhra Pradesh
Arunachal PradeshChhattisgarh
Delhi
Goa
Gujarat
Haryana
Himachal Pradesh
Jammu & Kashmir
Jharkhand
Karnataka
Kerala
Madhya Pradesh
Maharashtra
Manipur
MeghalayaMizoram
Nagaland
Orissa
Punjab
Rajasthan
Sikkim
Tamil Nadu
Tripura
Uttar Pradesh
Uttarakhand
West Bengal
y = 429.3x + 12630R² = 0.388
0
20000
40000
60000
80000
100000
120000
140000
50 70 90 110 130 150 170 190 210 230 250
Teledensity
GSD
P p
er
Cap
ita
Source: Ministry of telecom, Institute for Competitiveness Analysis

DEBT TO GDP RATIO
0 20 40 60 80 100 120
Andhra
Arunachal
Assam
Bihar
Chattisgarh
Delhi
Goa
Gujarat
Haryana
Himachal
Jammu & Kashmir
Jharkhand
Karnataka
Kerala
Madhya Pradesh
Maharashtra
Manipur
Meghalya
Mizoram
Nagaland
Orissa
Punjab
Rajasthan
Sikkim
Tamil Nadu
Tripura
Uttar Pradesh
Uttaranchal
West Bengal
30.1
115.9
28
39.7
15.2
13.8
35.5
32.1
19
55.7
70.1
33.6
24.3
34.3
34.4
25.1
77.4
37.3
109.1
59.4
30.6
35.2
41.1
80.6
25.5
42.2
43.5
41.1
42.8
Prescribed limit according to WTO for developing
economies
Prescribed limit according to the growth and stability Pact of EU
Source: Institute for Competitiveness Analysis

RURAL POPULATION VERSUS RURAL POPULATION GROWTH RATES
Andhra Pradesh
Arunachal Pradesh
Assam
Bihar
Chhattisgarh
Delhi
Goa
GujaratHaryanaHimachal Pradesh
Jammu & Kashmir Jharkhand
Karnataka
Kerala
Madhya Pradesh
Maharashtra
Manipur
Meghalaya
Mizoram
Nagaland
OrissaPunjab
Rajasthan
Sikkim
Tamil Nadu
Tripura
Uttar Pradesh
UttarakhandWest Bengal
-10.000
-8.000
-6.000
-4.000
-2.000
0.000
2.000
4.000
10 100 1,000 10,000 100,000 1,000,000
Population in Rural areas as per census (provisional Data) in Thousands
Thousands
Gro
wth
rat
e (
CA
GR
20
01
-20
11
)
Source: Census 2011, Institute for Competitiveness Analysis
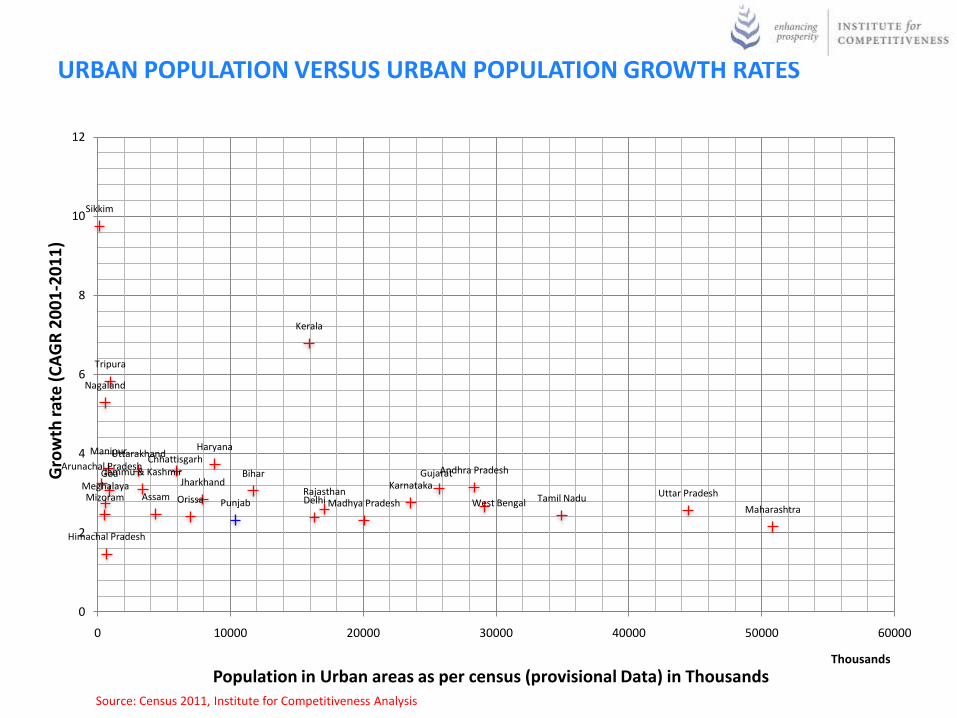
URBAN POPULATION VERSUS URBAN POPULATION GROWTH RATES
Andhra PradeshArunachal Pradesh
Assam
Bihar
Chhattisgarh
Delhi
Goa Gujarat
Haryana
Himachal Pradesh
Jammu & KashmirJharkhand Karnataka
Kerala
Madhya PradeshMaharashtra
Manipur
MeghalayaMizoram
Nagaland
Orissa PunjabRajasthan
Sikkim
Tamil Nadu
Tripura
Uttar Pradesh
Uttarakhand
West Bengal
0
2
4
6
8
10
12
0 10000 20000 30000 40000 50000 60000
Population in Urban areas as per census (provisional Data) in ThousandsThousands
Gro
wth
rat
e (
CA
GR
20
01
-20
11
)
Source: Census 2011, Institute for Competitiveness Analysis

RURAL AND URBAN POPULATION IN INDIA
15
1,7
26
56
1,9
77
31
3,4
46
90
6,3
09
57
3,7
41
82
2,1
32
59
5,0
36
96
0,9
81
68
8,7
04
3,0
91
,16
9
3,4
14
,10
6
16
,33
3,9
16
8,8
21
,58
8
5,9
36
,53
8
10
,38
7,4
36
4,3
88
,75
6
7,9
29
,29
2
15
,93
2,1
71
6,9
96
,12
4
25
,71
2,8
11
23
,57
8,1
75
17
,08
0,7
76 3
4,9
49
,72
9
20
,05
9,6
66
28
,35
3,7
45
29
,13
4,0
60
11
,72
9,6
09
50
,82
7,5
31
44
,47
0,4
55
45
5,9
62
52
90
37
10
69
16
5
55
14
14
14
06
86
1
18
99
62
4
23
68
97
1
2,7
10
,05
1
61
67
80
5
7,0
25
,58
3
91
34
82
0
41
93
19
16
53
14
93
19
60
36
58
17
,31
6,8
00
26
78
05
16
25
,03
6,9
46
17
45
55
06
34
,95
1,2
34
34
67
08
17
37
55
25
29 51
,54
0,2
36
37
,18
9,2
29 52
53
78
99
56
31
17
88
62
,21
3,6
76
92
07
50
28
61
54
54
41
15
5,1
11
,02
2
0
20,000,000
40,000,000
60,000,000
80,000,000
100,000,000
120,000,000
140,000,000
160,000,000
Urban Population in 2011 Rural Population in 2011
Source: Census 2011, Institute for Competitiveness Analysis

DEMOGRAPHIC PROFILE IN PUNJABP
op
ula
tio
n in
Nu
mb
ers
Source: Institute for Competitiveness Analysis
22
97
00
0
22
82
00
0
23
33
00
0 26
00
00
0
27
65
00
0
25
97
00
0
22
88
00
0
19
79
00
0
17
69
00
0
16
15
00
0
13
76
00
0
10
86
00
0
80
30
00
59
60
00
50
20
00
40
20
00
38
90
00
0
500000
1000000
1500000
2000000
2500000
3000000
0-4 years
5-9 years
10-14 years
15-19 years
20-24 years
25-29 years
30-34 years
35-39 years
40-44 years
45-49 years
50-54 years
55-59 year
60-64 years
65-69 years
70-74 years
75-79 years
80+ years
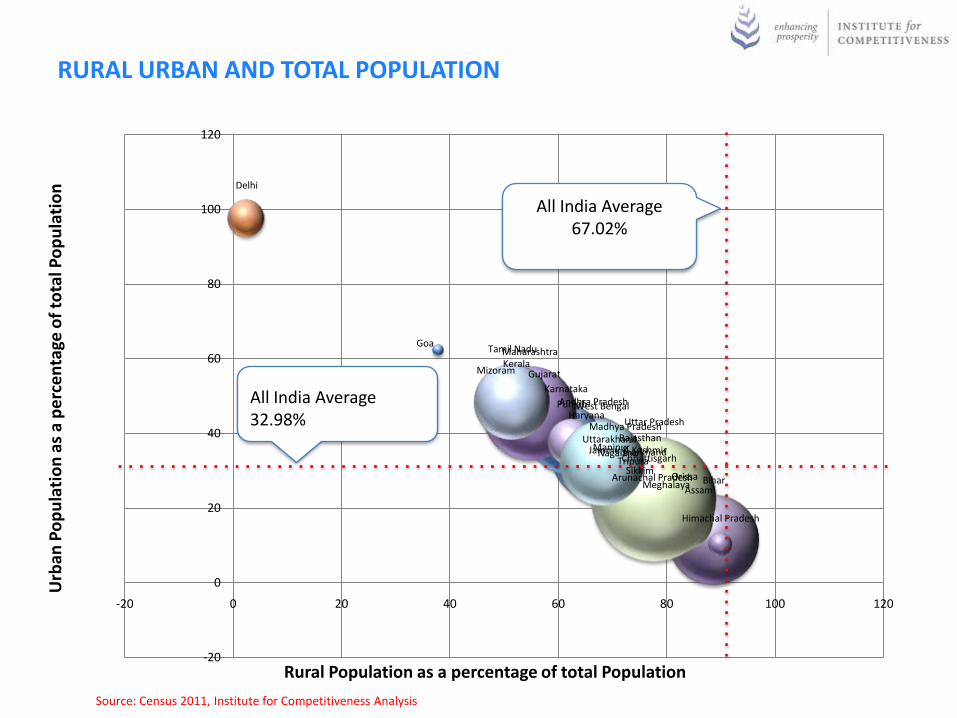
RURAL URBAN AND TOTAL POPULATION
Andhra Pradesh
Arunachal PradeshAssam
Bihar
Chhattisgarh
Delhi
Goa
Gujarat
Haryana
Himachal Pradesh
Jammu & KashmirJharkhand
Karnataka
Kerala
Madhya Pradesh
Maharashtra
Manipur
Meghalaya
Mizoram
Nagaland
Orissa
Punjab
Rajasthan
Sikkim
Tamil Nadu
Tripura
Uttar Pradesh
Uttarakhand
West Bengal
-20
0
20
40
60
80
100
120
-20 0 20 40 60 80 100 120
Urb
an P
op
ula
tio
n a
s a
pe
rce
nta
ge o
f to
tal P
op
ula
tio
n
All India Average 32.98%
All
Ind
ia
All India Average 67.02%
Source: Census 2011, Institute for Competitiveness Analysis
Rural Population as a percentage of total Population
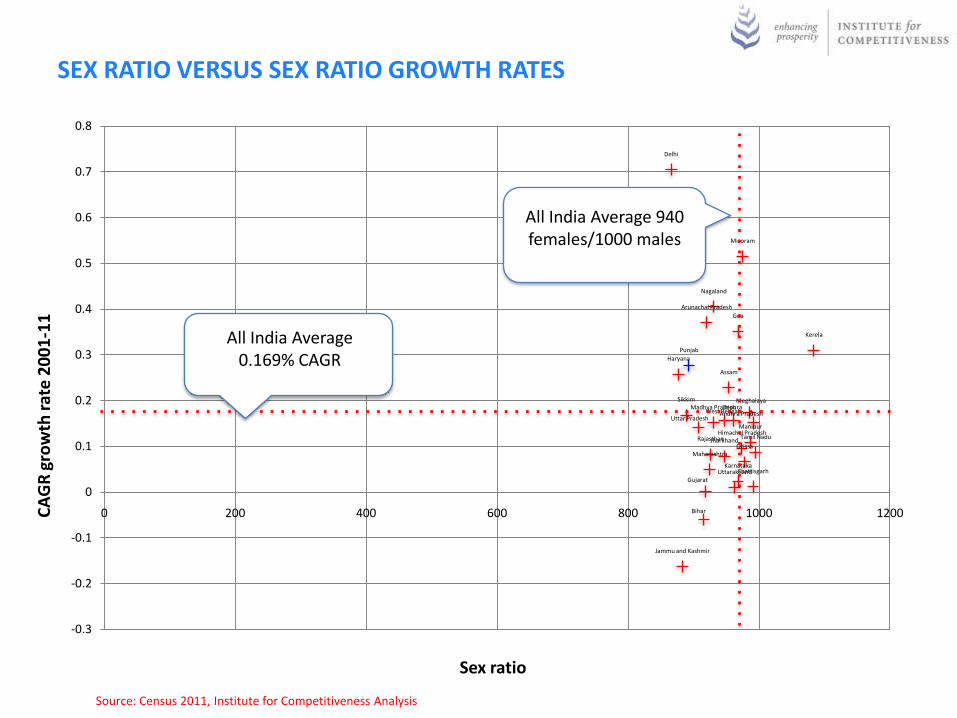
SEX RATIO VERSUS SEX RATIO GROWTH RATES
Andhra Pradesh
Arunachal Pradesh
Assam
Bihar
Chattisgarh
Delhi
Goa
Gujarat
Haryana
Himachal Pradesh
Jammu and Kashmir
Jharkhand
Karnataka
Kerela
Madhya Pradesh
Maharashtra
Manipur
Meghalaya
Mizoram
Nagaland
Orissa
Punjab
Rajasthan
Sikkim
Tamil Nadu
Tripura
Uttar Pradesh
Uttarakhand
West Bengal
-0.3
-0.2
-0.1
0
0.1
0.2
0.3
0.4
0.5
0.6
0.7
0.8
0 200 400 600 800 1000 1200
All India Average 0.169% CAGR
All
Ind
ia
All India Average 940 females/1000 males
CA
GR
gro
wth
rat
e 2
00
1-1
1
Sex ratio
Source: Census 2011, Institute for Competitiveness Analysis
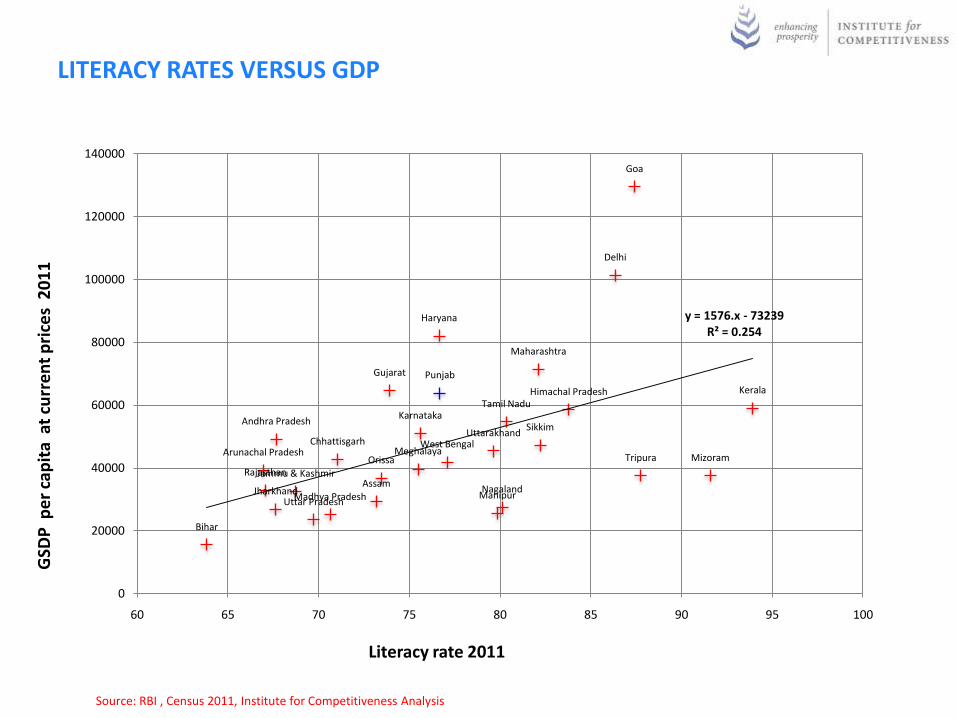
LITERACY RATES VERSUS GDP
Andhra Pradesh
Arunachal Pradesh
Assam
Bihar
Chhattisgarh
Delhi
Goa
Gujarat
Haryana
Himachal Pradesh
Jammu & Kashmir
Jharkhand
Karnataka
Kerala
Madhya Pradesh
Maharashtra
Manipur
MeghalayaMizoram
Nagaland
Orissa
Punjab
Rajasthan
Sikkim
Tamil Nadu
Tripura
Uttar Pradesh
UttarakhandWest Bengal
y = 1576.x - 73239R² = 0.254
0
20000
40000
60000
80000
100000
120000
140000
60 65 70 75 80 85 90 95 100
GSD
P p
er
cap
ita
at
curr
en
t p
rice
s 2
01
1
Literacy rate 2011
Source: RBI , Census 2011, Institute for Competitiveness Analysis

REVENUE EXPENDITURE VERSUS REVENUE RECEIPTSR
eve
nu
e E
xpe
nd
itu
re in
Rs.
Cro
res
Revenue Receipts in Rs. Crores
Jammu & Kashmir
Himachal Pradesh
Punjab
Haryana
Uttar Pradesh
Rajasthan
DelhiUttarakhand
Bihar
Orissa
West Bengal
Assam
MeghalayaTripuraMizoram
ManipurNagaland
Arunachal PradeshSikkim
Jharkhand
Gujarat
Maharashtra
Goa
Madhya Pradesh
Chhattisgarh
Andhra Pradesh
Karnataka
Kerala
Tamil Nadu
0
20000
40000
60000
80000
100000
120000
0 20000 40000 60000 80000 100000 120000
All
Ind
ia
All India Average 34757 Rs. Crores
All India Average 34190 Rs. Crores
Source: RBI , Institute for Competitiveness Analysis

LITERACY RATES VERSUS POPULATION
Andhra Pradesh
Arunachal Pradesh
Assam
Bihar
Chhattisgarh
Goa
Gujarat
Haryana
Himachal Pradesh
Jammu and Kashmir
Jharkhand
Karnataka
Kerela
Madhya Pradesh
Maharashtra
ManipurMeghalaya MizoramNagaland
Delhi
Orissa
Punjab
Rajasthan
Sikkim
Tamil Nadu
Tripura
Uttar Pradesh
Uttarakhand
West Bengal
0
50000000
10000000
15000000
20000000
25000000
0 10 20 30 40 50 60 70 80 90 100
Literacy rates in Percentage terms
All India Average 67232968 People/state
All
Ind
ia
All India Average Literacy level of
77.12%
Source: Census 2011 , Institute for Competitiveness Analysis

Jammu & Kashmir
Himachal Pradesh
Punjab
Haryana
Uttar Pradesh
Rajasthan
DelhiUttarakhand
Bihar
Orissa
West Bengal
Assam
Meghalaya
Tripura
Mizoram
Manipur
Nagaland
Arunachal Pradesh
Sikkim
Jharkhand
Gujarat
Maharashtra
Goa
Madhya Pradesh
Chhattisgarh
Andhra Pradesh
Karnataka
Kerala
Tamil Nadu
-5
0
5
10
15
20
0 5000 10000 15000 20000 25000 30000 35000 40000 45000
Outstanding commercial scheduled bank credit to Agriculture in Rs. Crores
All India Average of 9.30 % CAGR growth rate
All
Ind
ia
All India Average of 12,157 Crores/state
CA
GR
gro
wth
rat
e in
Agr
icu
ltu
re 2
00
5-1
0GROWTH RATE IN AGRICULTURE VERSUS BANK CREDIT TO AGRICULTURE
Source: MOA , Institute for Competitiveness Analysis
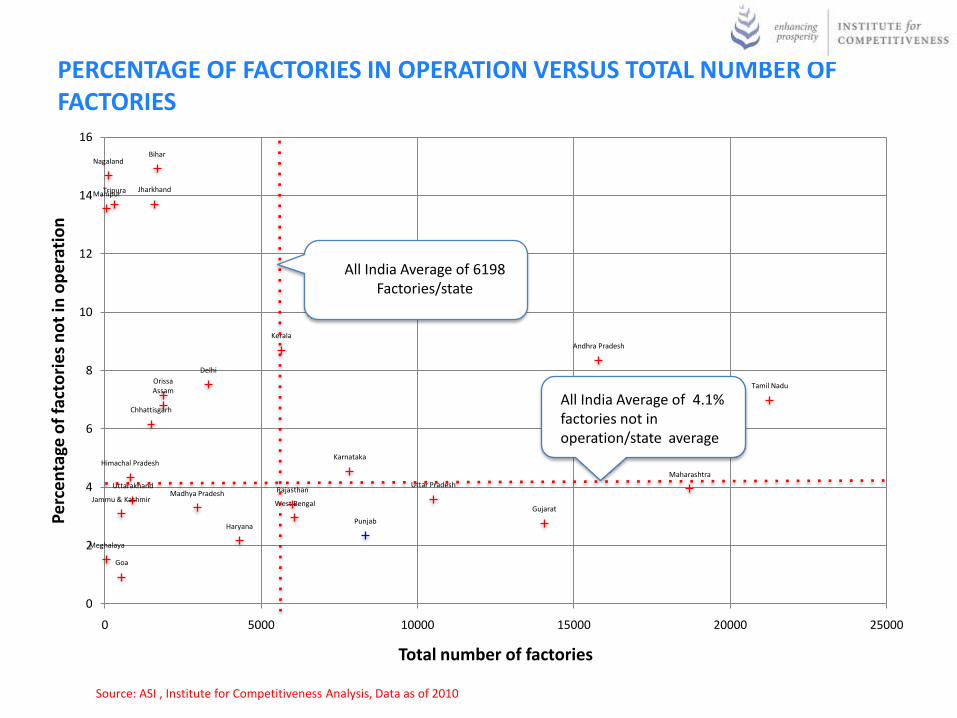
PERCENTAGE OF FACTORIES IN OPERATION VERSUS TOTAL NUMBER OF FACTORIES
Jammu & Kashmir
Himachal Pradesh
PunjabHaryana
Uttar PradeshRajasthan
Delhi
Uttarakhand
Bihar
Orissa
West Bengal
Assam
Meghalaya
TripuraManipur
Nagaland
Jharkhand
Gujarat
Maharashtra
Goa
Madhya Pradesh
Chhattisgarh
Andhra Pradesh
Karnataka
Kerala
Tamil Nadu
0
2
4
6
8
10
12
14
16
0 5000 10000 15000 20000 25000
Pe
rce
nta
ge o
f fa
cto
rie
s n
ot
in o
pe
rati
on
Total number of factories
All India Average of 4.1% factories not in operation/state average
All
Ind
ia
All India Average of 6198 Factories/state
Source: ASI , Institute for Competitiveness Analysis, Data as of 2010
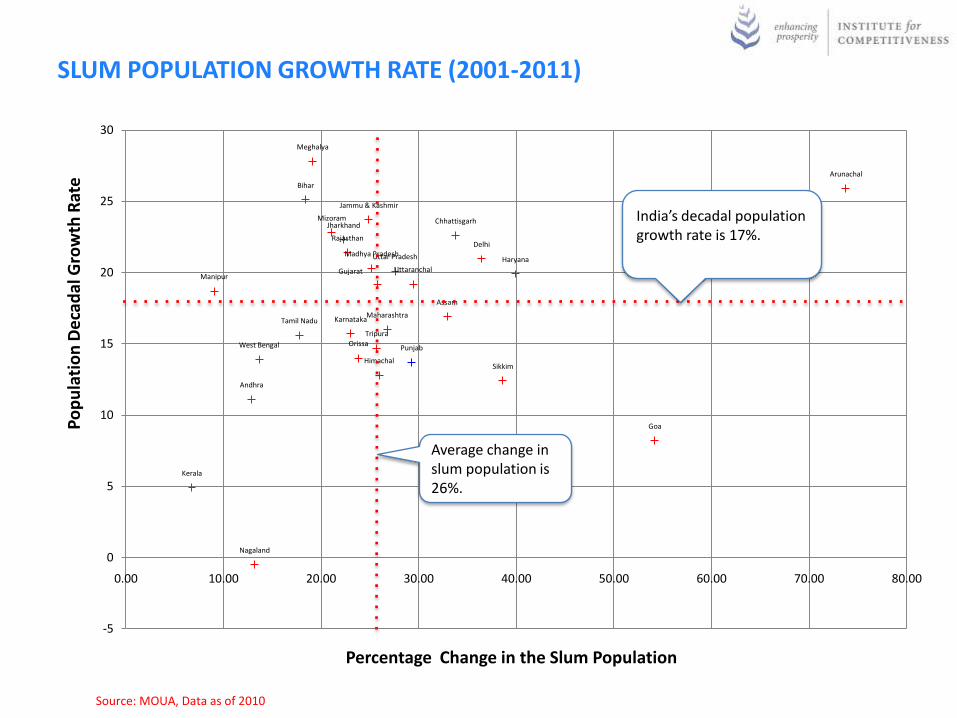
SLUM POPULATION GROWTH RATE (2001-2011)
Andhra
Arunachal
Assam
Bihar
Chhattisgarh
Delhi
Goa
Gujarat
Haryana
Himachal
Jammu & Kashmir
Jharkhand
Karnataka
Kerala
Madhya Pradesh
Maharashtra
Manipur
Meghalya
Mizoram
Nagaland
OrissaPunjab
Rajasthan
Sikkim
Tamil Nadu
Tripura
Uttar Pradesh
Uttaranchal
West Bengal
-5
0
5
10
15
20
25
30
0.00 10.00 20.00 30.00 40.00 50.00 60.00 70.00 80.00
Po
pu
lati
on
De
cad
al G
row
th R
ate
Percentage Change in the Slum Population
India’s decadal population growth rate is 17%.
Average change in slum population is 26%.
Source: MOUA, Data as of 2010

Andhra Pradesh
Assam
Bihar
Chhattisgarh
Delhi
Goa
Gujarat
Haryana
Himachal
Jharkhand
Karnataka
Kerala
Madhya Pradesh
Maharashtra
Meghalya
Mizoram
Nagaland
Orissa
Punjab
Rajasthan
Tamil Nadu
Uttar Pradesh
Uttaranchal
West Bengal
0
50
100
150
200
250
300
350
400
450
500
0 100 200 300 400 500 600
SPM
Lev
el (
Re
sid
en
tial
)
SPM Level (Industrial Area)
SPM Level above 140 is considered dangerous for residential areas
SPM Level above 400 is considered dangerous for industrial areas
SPM is Suspended Particulate matter. The above mentioned limits are are prescribed by Central Pollution Control Board (CPCB), India.
POLLUTION
Source: CPCB , Institute for Competitiveness Analysis

AIR POLLUTION
Andhra
Assam
Bihar
Chhattisgarh
Delhi
Goa
Gujarat
Haryana
Himachal
Jharkhand
Karnataka
Kerala
Madhya Pradesh
Maharashtra
Meghalya
Mizoram
Nagaland
Orissa
Punjab
Rajasthan
Tamil Nadu
Uttar Pradesh
Uttaranchal
West Bengal
0
50
100
150
200
250
300
350
400
450
500
0 100 200 300 400 500 600
SPM
Lev
el (
Re
sid
en
tial
)
SPM Level (Industrial Area)
SPM Level above 140 is considered dangerous for residential areas
SPM Level above 400 is considered dangerous for industrial areas
SPM is Suspended Particulate matter. The above mentioned limits are are prescribed by Central Pollution Control Board (CPCB), India.

CAPITAL OUTLAY BY MAJOR SECTORS
Social service46%
Economic service52%
General economic services2%
Punjab
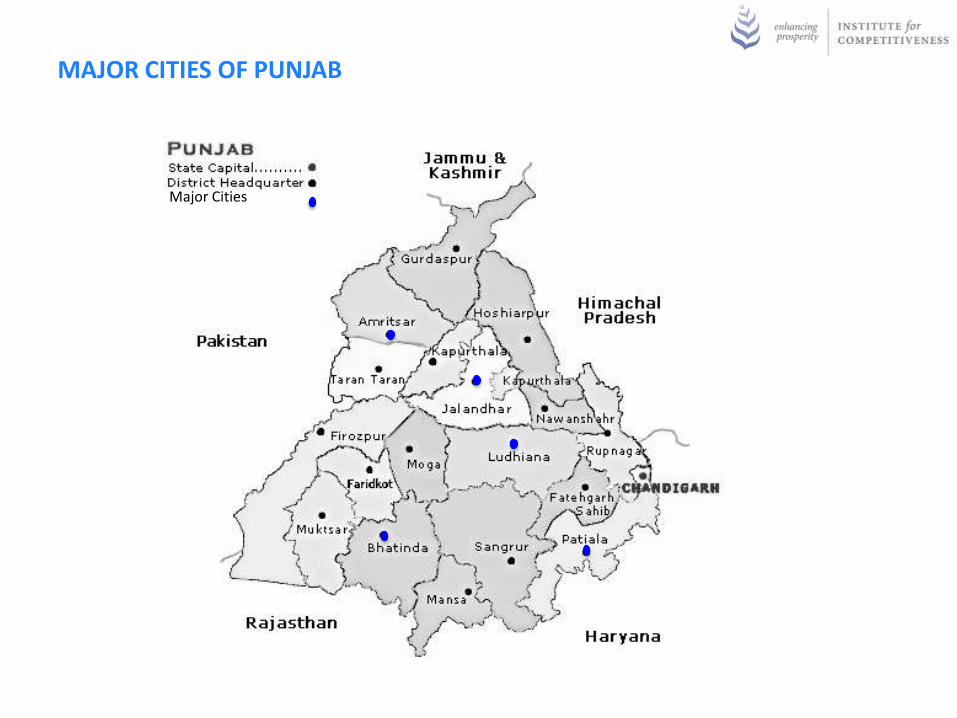
MAJOR CITIES OF PUNJAB
Major Cities

MAJOR CENTRES OF INDUSTRY IN PUNJAB
Textile and apparel, Auto and auto parts, Leather, bicycle, Rubber and sports goods
Textile and apparel, Rubber and paper, Machinery and Chemicals
Steel rolling and rerolling, Machinery, Auto parts, IT, Electronics and Pharmaceuticals Industry
Textile and Apparel, Auto parts, Machinery

POPULATION PERCENTAGES IN DISTRICTS OF PUNJAB
8.3
3.0
7.9
5.7
2.2
2.212.6
3.6
7.3
3.3
2.2
5.0 2.8
6.8
9.0
4.0
2.5
6.0
Barnala2.2
3.6
Sahibzada Ajit Singh Nagar
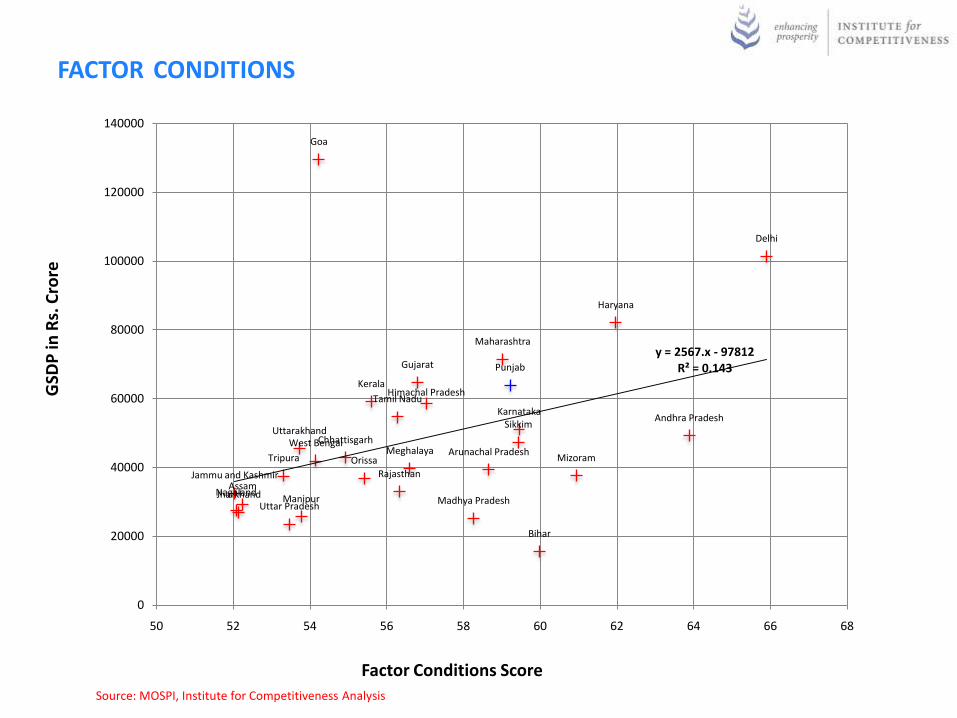
FACTOR CONDITIONSG
SDP
in R
s. C
rore
Factor Conditions Score
Andhra Pradesh
Arunachal Pradesh
Assam
Bihar
Chhattisgarh
Delhi
Goa
Gujarat
Haryana
Himachal Pradesh
Jammu and Kashmir
Jharkhand
Karnataka
Kerala
Madhya Pradesh
Maharashtra
Manipur
MeghalayaMizoram
Nagaland
Orissa
Punjab
Rajasthan
Sikkim
Tamil Nadu
Tripura
Uttar Pradesh
UttarakhandWest Bengal
y = 2567.x - 97812R² = 0.143
0
20000
40000
60000
80000
100000
120000
140000
50 52 54 56 58 60 62 64 66 68
Source: MOSPI, Institute for Competitiveness Analysis
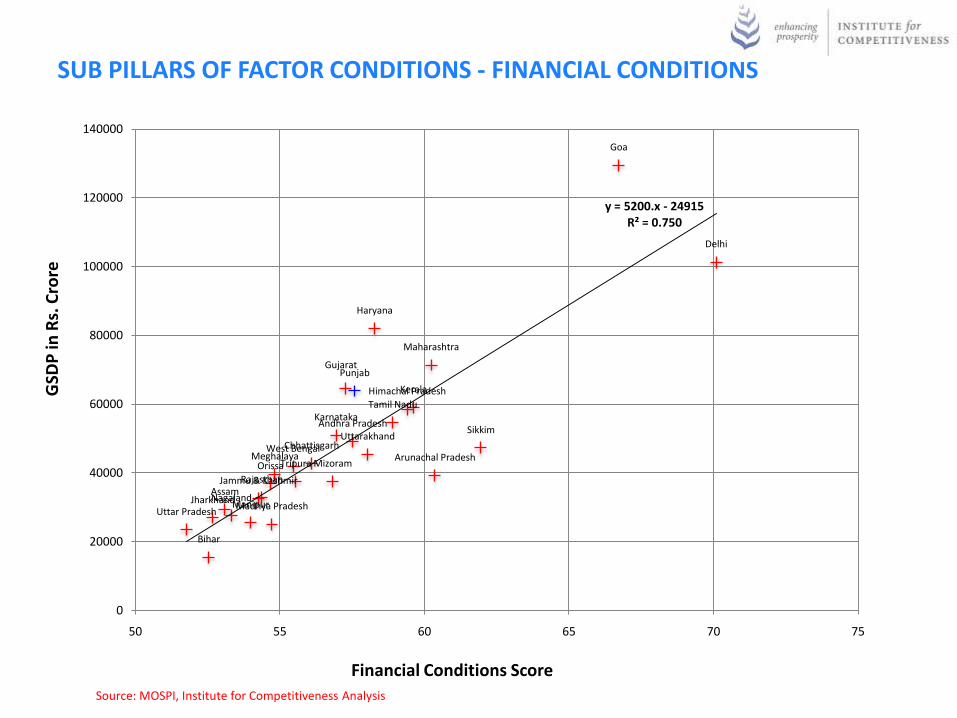
SUB PILLARS OF FACTOR CONDITIONS - FINANCIAL CONDITIONSG
SDP
in R
s. C
rore
Financial Conditions Score
Andhra Pradesh
Arunachal Pradesh
Assam
Bihar
Chhattisgarh
Delhi
Goa
Gujarat
Haryana
Himachal Pradesh
Jammu & Kashmir
Jharkhand
Karnataka
Kerala
Madhya Pradesh
Maharashtra
Manipur
MeghalayaMizoram
Nagaland
Orissa
Punjab
Rajasthan
Sikkim
Tamil Nadu
Tripura
Uttar Pradesh
UttarakhandWest Bengal
y = 5200.x - 24915R² = 0.750
0
20000
40000
60000
80000
100000
120000
140000
50 55 60 65 70 75
Source: MOSPI, Institute for Competitiveness Analysis

SUB PILLARS OF FACTOR CONDITIONS - PHYSICAL CONDITIONS R
oa
d le
ng
th p
er
on
e la
kh
of
Po
pu
lati
on
Physical Conditions Score
Andhra Pradesh
Arunachal Pradesh
Assam
Bihar
Chhattisgarh
Delhi
Goa
Gujarat
Haryana
Himachal Pradesh
Jammu & Kashmir
Jharkhand
Karnataka
Kerala
Madhya PradeshMaharashtra
Manipur
Meghalaya
Mizoram
Nagaland
Orissa
Punjab
RajasthanSikkim
Tamil Nadu
Tripura
Uttar Pradesh
Uttarakhand
West Bengal
y = 35.81x - 1554.R² = 0.254
0
500
1000
1500
2000
2500
45 50 55 60 65 70 75 80
Source: MORTH, Institute for Competitiveness Analysis
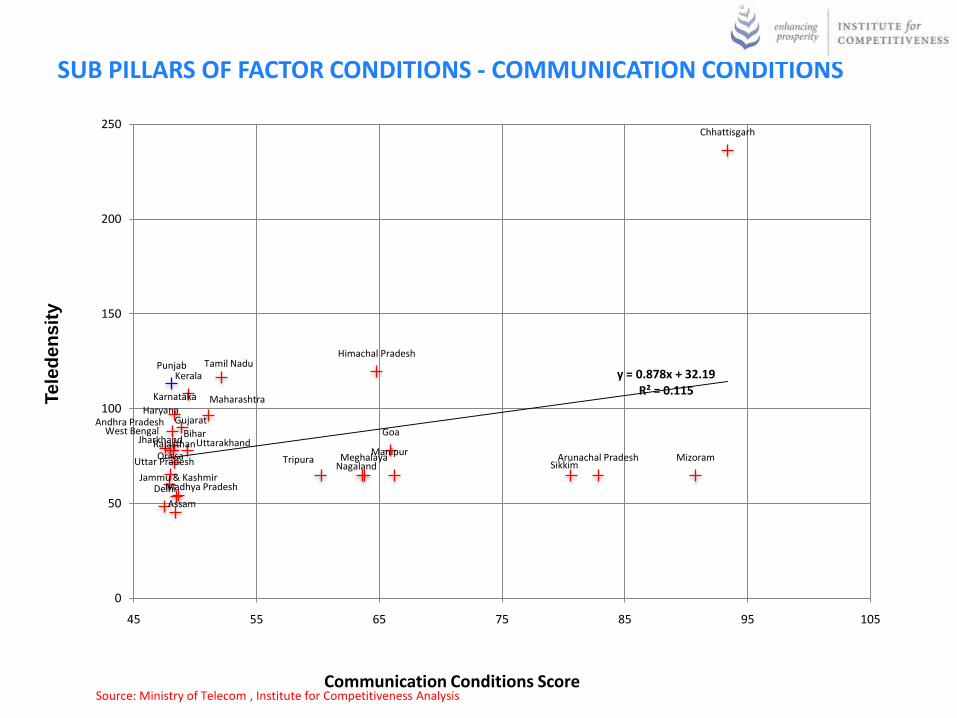
SUB PILLARS OF FACTOR CONDITIONS - COMMUNICATION CONDITIONSTe
led
en
sit
y
Communication Conditions Score
Andhra Pradesh
Arunachal Pradesh
Assam
Delhi
Bihar
Chhattisgarh
GoaGujarat
Haryana
Himachal Pradesh
Jammu & Kashmir
Jharkhand
Karnataka
Kerala
Madhya Pradesh
Maharashtra
ManipurMeghalaya Mizoram
NagalandOrissa
Punjab
Rajasthan
Sikkim
Tamil Nadu
TripuraUttar Pradesh
UttarakhandWest Bengal
y = 0.878x + 32.19R² = 0.115
0
50
100
150
200
250
45 55 65 75 85 95 105
Source: Ministry of Telecom , Institute for Competitiveness Analysis
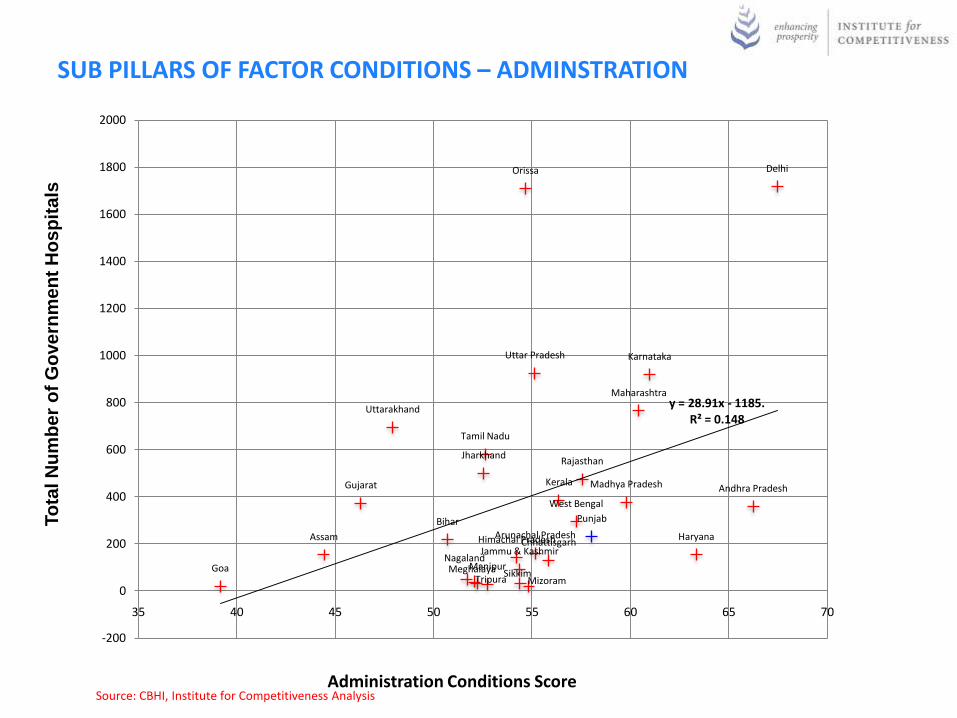
SUB PILLARS OF FACTOR CONDITIONS – ADMINSTRATIONTo
tal N
um
be
r o
f G
ove
rnm
en
t H
os
pit
als
Administration Conditions Score
Andhra Pradesh
Arunachal PradeshAssam
Delhi
Bihar
Chhattisgarh
Goa
Gujarat
HaryanaHimachal PradeshJammu & Kashmir
Jharkhand
Karnataka
Kerala Madhya Pradesh
Maharashtra
ManipurMeghalayaMizoram
Nagaland
Orissa
Punjab
Rajasthan
Sikkim
Tamil Nadu
Tripura
Uttar Pradesh
Uttarakhand
West Bengal
y = 28.91x - 1185.R² = 0.148
-200
0
200
400
600
800
1000
1200
1400
1600
1800
2000
35 40 45 50 55 60 65 70
Source: CBHI, Institute for Competitiveness Analysis
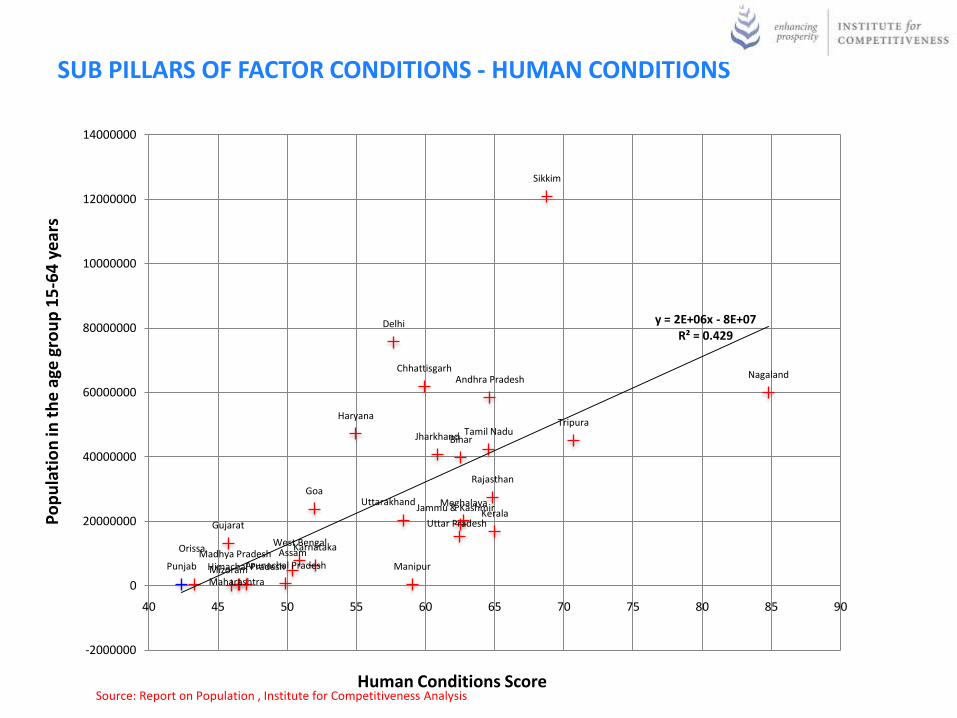
SUB PILLARS OF FACTOR CONDITIONS - HUMAN CONDITIONSP
op
ula
tio
n in
th
e a
ge g
rou
p 1
5-6
4 y
ear
s
Human Conditions Score
Andhra Pradesh
Himachal Pradesh
Meghalaya
Nagaland
Uttar PradeshGujarat
Arunachal Pradesh
Bihar
Kerala
AssamWest Bengal
Uttarakhand
Jharkhand
Goa
Tripura
Delhi
Punjab ManipurMadhya Pradesh
Orissa
Rajasthan
Jammu & Kashmir
Tamil Nadu
Mizoram
Haryana
Maharashtra
Sikkim
Karnataka
Chhattisgarh
y = 2E+06x - 8E+07R² = 0.429
-2000000
0
20000000
40000000
60000000
80000000
10000000
12000000
14000000
40 45 50 55 60 65 70 75 80 85 90
Source: Report on Population , Institute for Competitiveness Analysis
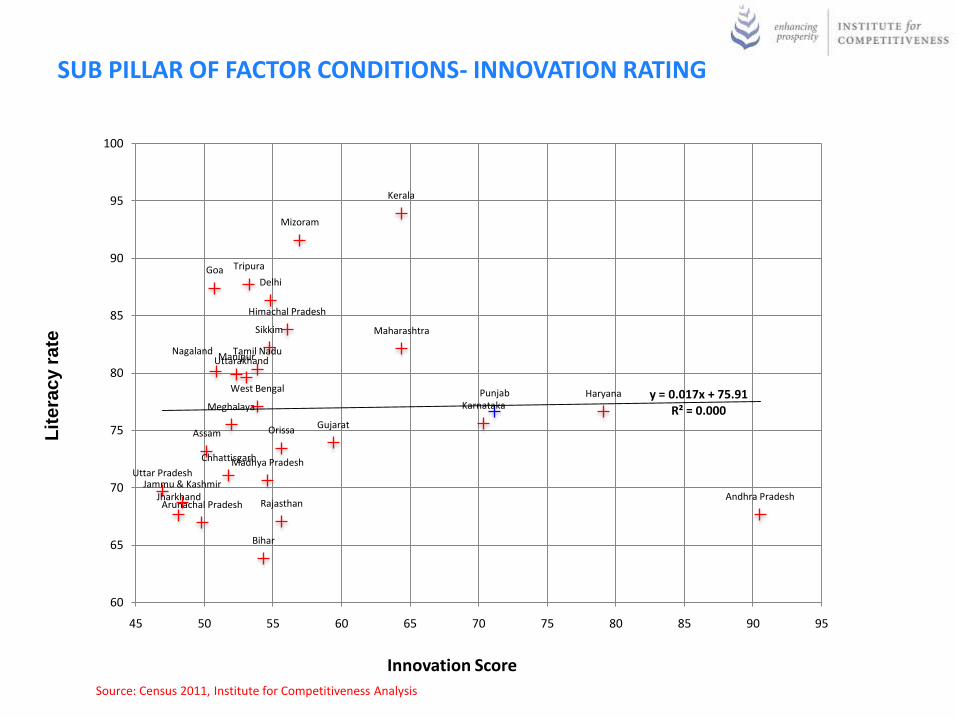
SUB PILLAR OF FACTOR CONDITIONS- INNOVATION RATING
Andhra PradeshArunachal Pradesh
Assam
Bihar
Chhattisgarh
DelhiGoa
Gujarat
Haryana
Himachal Pradesh
Jammu & KashmirJharkhand
Karnataka
Kerala
Madhya Pradesh
Maharashtra
Manipur
Meghalaya
Mizoram
Nagaland
Orissa
Punjab
Rajasthan
Sikkim
Tamil Nadu
Tripura
Uttar Pradesh
Uttarakhand
West Bengaly = 0.017x + 75.91
R² = 0.000
60
65
70
75
80
85
90
95
100
45 50 55 60 65 70 75 80 85 90 95
Lit
era
cy r
ate
Innovation Score
Source: Census 2011, Institute for Competitiveness Analysis
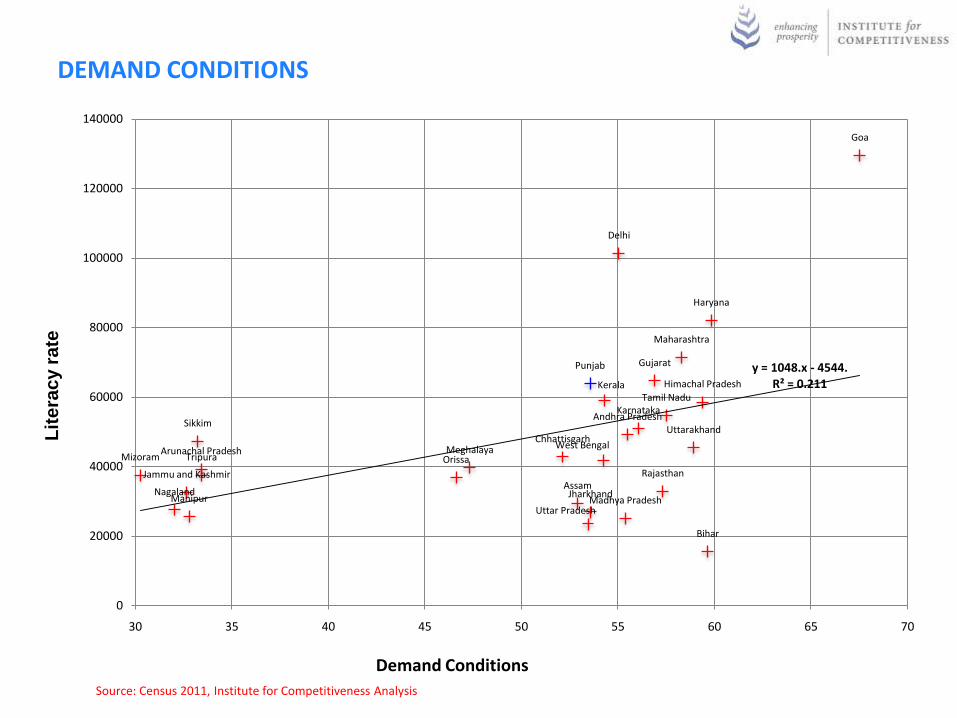
DEMAND CONDITIONS
Andhra Pradesh
Arunachal Pradesh
Assam
Bihar
Chhattisgarh
Delhi
Goa
Gujarat
Haryana
Himachal Pradesh
Jammu and Kashmir
Jharkhand
Karnataka
Kerala
Madhya Pradesh
Maharashtra
Manipur
MeghalayaMizoram
Nagaland
Orissa
Punjab
Rajasthan
Sikkim
Tamil Nadu
Tripura
Uttar Pradesh
Uttarakhand
West Bengal
y = 1048.x - 4544.R² = 0.211
0
20000
40000
60000
80000
100000
120000
140000
30 35 40 45 50 55 60 65 70
Lit
era
cy r
ate
Demand Conditions
Source: Census 2011, Institute for Competitiveness Analysis

SUB PILLAR OF DEMAND CONDITIONS- DEMOGRAPHY
Andhra Pradesh
Arunachal Pradesh
Assam
Bihar
Chhattisgarh
Delhi
Goa
Gujarat
Haryana
Himachal Pradesh
Jammu and Kashmir
Jharkhand
Karnataka
Kerala
Madhya Pradesh
Maharashtra
Manipur
MeghalayaMizoram
Nagaland
Orissa
Punjab
Rajasthan
Sikkim
Tamil Nadu
Tripura
Uttar Pradesh
Uttarakhand
West Bengal
y = 1048.x - 4544.R² = 0.211
0
20000
40000
60000
80000
100000
120000
140000
30 35 40 45 50 55 60 65 70
Pe
r c
ap
ita
GS
DP
at
sta
te le
ve
l
Demography
Source: MOSPI, Institute for Competitiveness Analysis
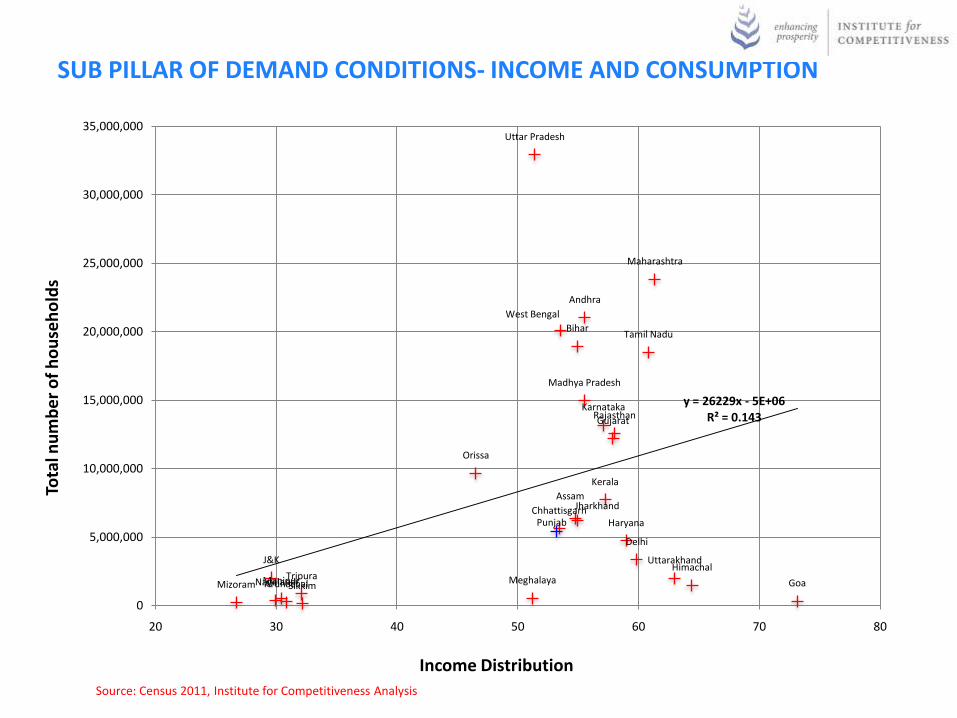
SUB PILLAR OF DEMAND CONDITIONS- INCOME AND CONSUMPTION
Income Distribution
Tota
l nu
mb
er
of
ho
use
ho
lds
Andhra
Arunachal
Assam
Bihar
Chhattisgarh
Delhi
Goa
Gujarat
Haryana
HimachalJ&K
Jharkhand
Karnataka
Kerala
Madhya Pradesh
Maharashtra
Manipur MeghalayaMizoramNagaland
Orissa
Punjab
Rajasthan
Sikkim
Tamil Nadu
Tripura
Uttar Pradesh
Uttarakhand
West Bengal
y = 26229x - 5E+06R² = 0.143
0
5,000,000
10,000,000
15,000,000
20,000,000
25,000,000
30,000,000
35,000,000
20 30 40 50 60 70 80
Source: Census 2011, Institute for Competitiveness Analysis
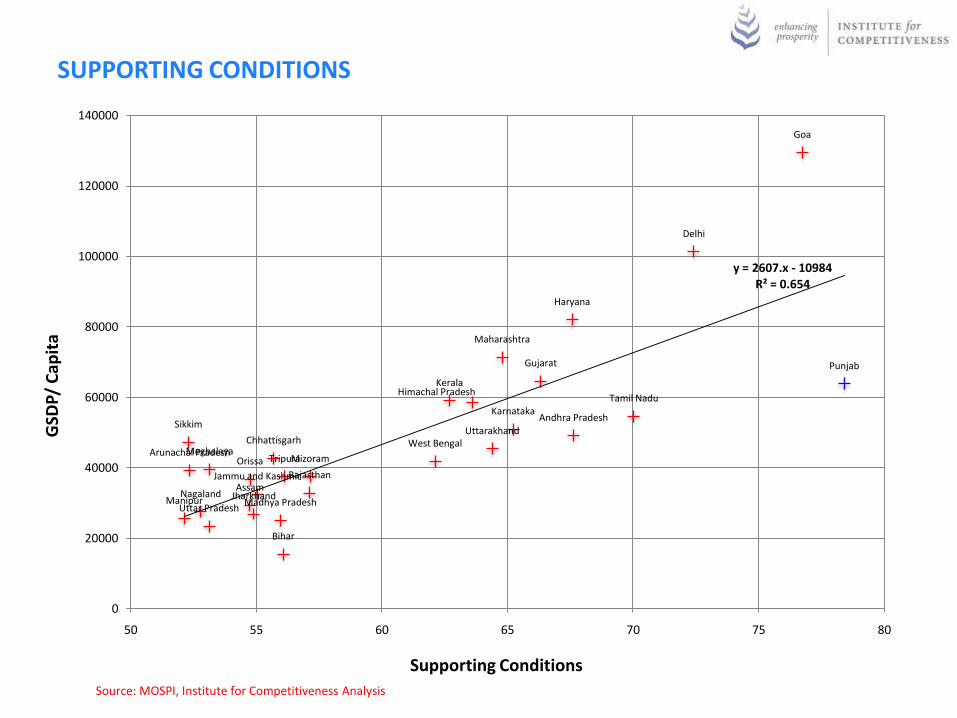
SUPPORTING CONDITIONS
Andhra Pradesh
Arunachal Pradesh
Assam
Bihar
Chhattisgarh
Delhi
Goa
Gujarat
Haryana
Himachal Pradesh
Jammu and Kashmir
Jharkhand
Karnataka
Kerala
Madhya Pradesh
Maharashtra
Manipur
MeghalayaMizoram
Nagaland
Orissa
Punjab
Rajasthan
Sikkim
Tamil Nadu
Tripura
Uttar Pradesh
UttarakhandWest Bengal
y = 2607.x - 10984R² = 0.654
0
20000
40000
60000
80000
100000
120000
140000
50 55 60 65 70 75 80
GSD
P/ C
apit
a
Supporting Conditions
Source: MOSPI, Institute for Competitiveness Analysis
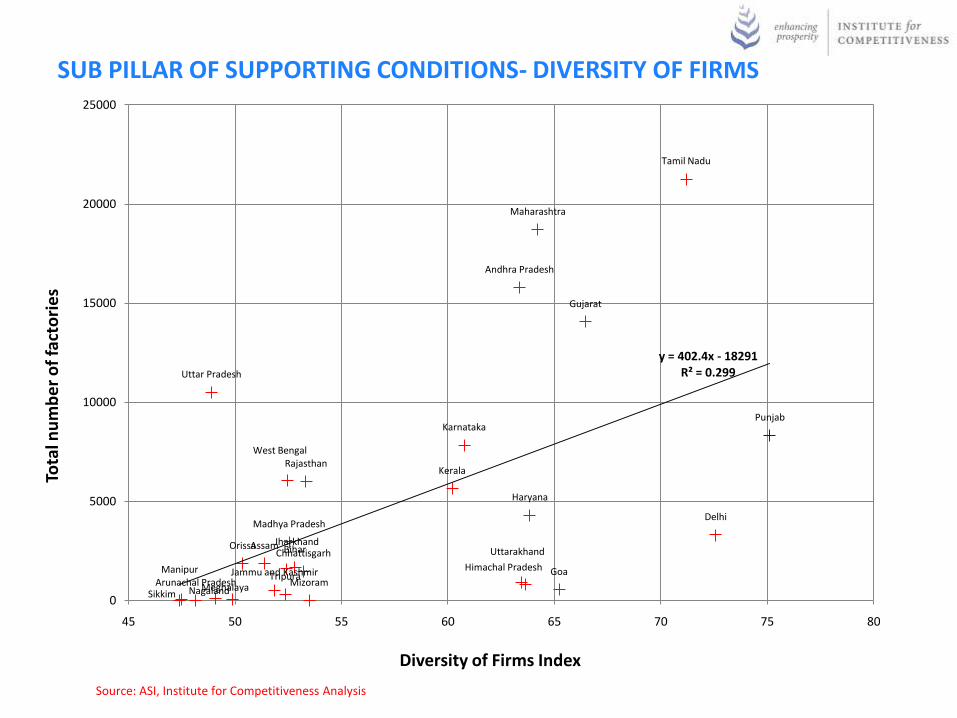
SUB PILLAR OF SUPPORTING CONDITIONS- DIVERSITY OF FIRMS
Andhra Pradesh
Arunachal Pradesh
Assam BiharChhattisgarh
Delhi
Goa
Gujarat
Haryana
Himachal PradeshJammu and Kashmir
Jharkhand
Karnataka
Kerala
Madhya Pradesh
Maharashtra
Manipur
Meghalaya MizoramNagaland
Orissa
Punjab
Rajasthan
Sikkim
Tamil Nadu
Tripura
Uttar Pradesh
Uttarakhand
West Bengal
y = 402.4x - 18291R² = 0.299
0
5000
10000
15000
20000
25000
45 50 55 60 65 70 75 80
Tota
l nu
mb
er
of
fact
ori
es
Diversity of Firms Index
Source: ASI, Institute for Competitiveness Analysis
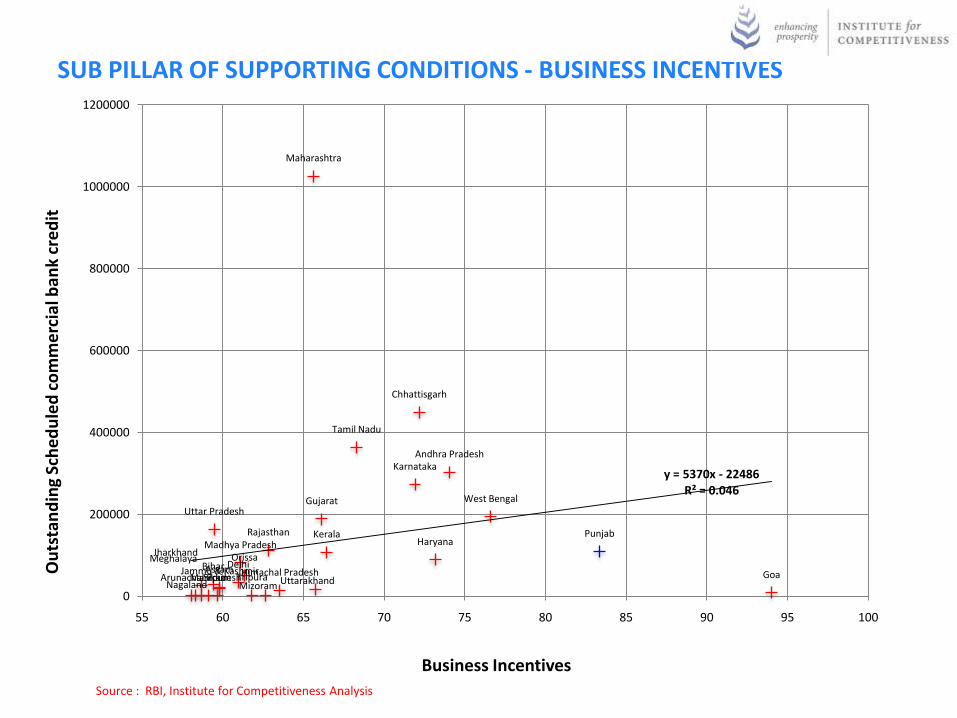
SUB PILLAR OF SUPPORTING CONDITIONS - BUSINESS INCENTIVES
Andhra Pradesh
Arunachal PradeshAssamDelhiBihar
Chhattisgarh
Goa
Gujarat
Haryana
Himachal PradeshJammu & Kashmir
Jharkhand
Karnataka
KeralaMadhya Pradesh
Maharashtra
Manipur
Meghalaya
MizoramNagaland
Orissa
PunjabRajasthan
Sikkim
Tamil Nadu
Tripura
Uttar Pradesh
Uttarakhand
West Bengal
y = 5370x - 22486R² = 0.046
0
200000
400000
600000
800000
1000000
1200000
55 60 65 70 75 80 85 90 95 100
Ou
tsta
nd
ing
Sch
ed
ule
d c
om
me
rcia
l ban
k cr
ed
it
Business Incentives
Source : RBI, Institute for Competitiveness Analysis
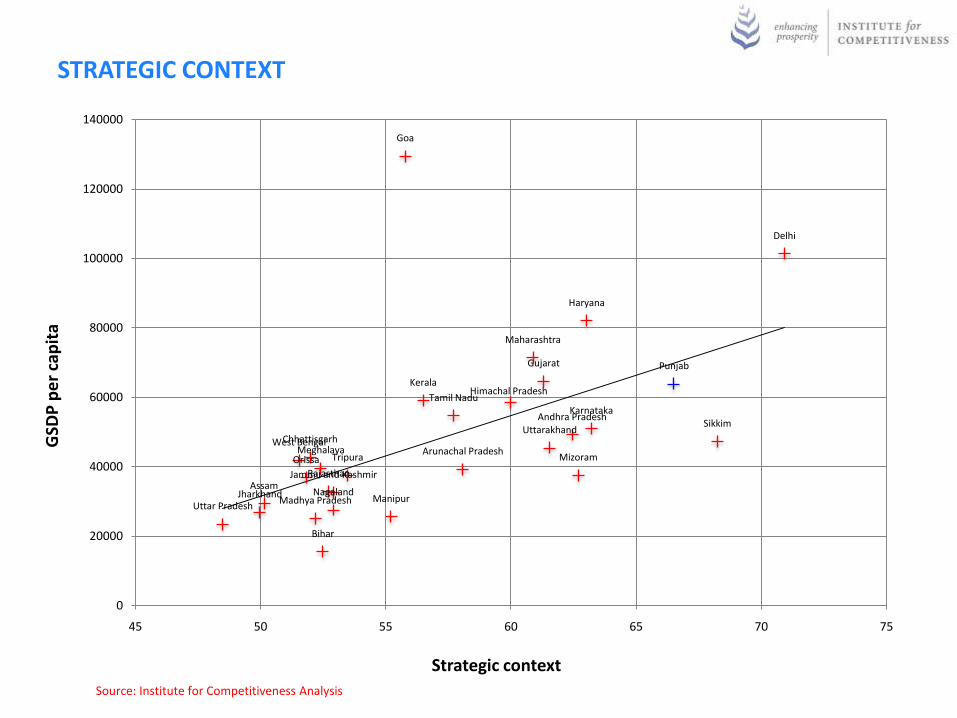
STRATEGIC CONTEXTG
SDP
pe
r ca
pit
a
Strategic context
Andhra Pradesh
Arunachal Pradesh
Assam
Bihar
Chhattisgarh
Delhi
Goa
Gujarat
Haryana
Himachal Pradesh
Jammu and Kashmir
Jharkhand
Karnataka
Kerala
Madhya Pradesh
Maharashtra
Manipur
MeghalayaMizoram
Nagaland
Orissa
Punjab
Rajasthan
Sikkim
Tamil Nadu
Tripura
Uttar Pradesh
UttarakhandWest Bengal
0
20000
40000
60000
80000
100000
120000
140000
45 50 55 60 65 70 75
Source: Institute for Competitiveness Analysis
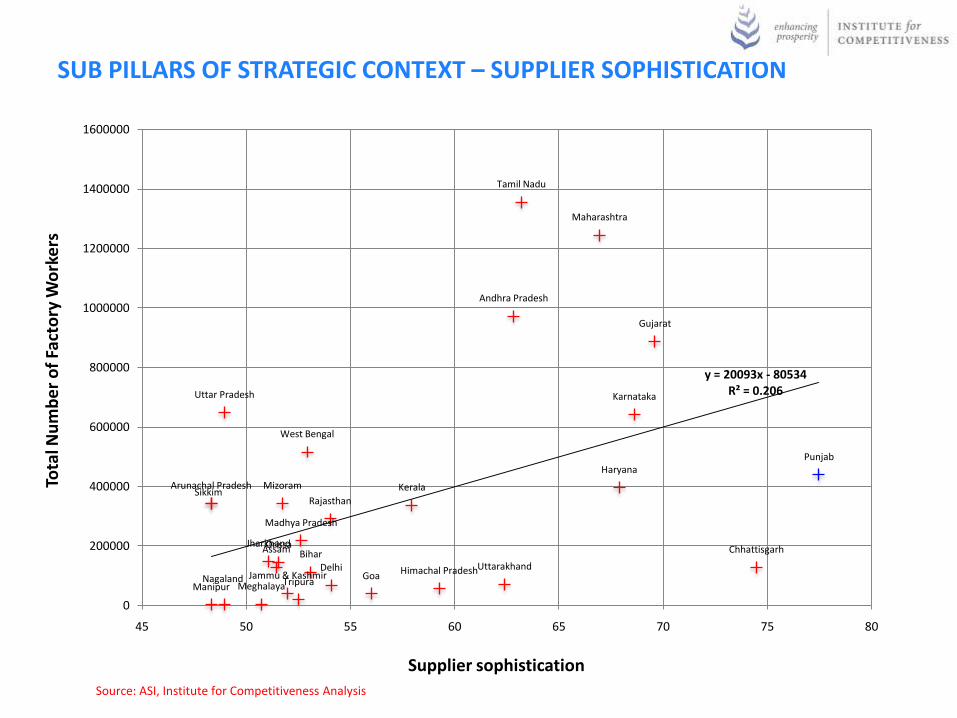
SUB PILLARS OF STRATEGIC CONTEXT – SUPPLIER SOPHISTICATION
Andhra Pradesh
Arunachal Pradesh
Assam
DelhiBihar Chhattisgarh
Goa
Gujarat
Haryana
Himachal PradeshJammu & Kashmir
Jharkhand
Karnataka
Kerala
Madhya Pradesh
Maharashtra
Manipur Meghalaya
Mizoram
Nagaland
Orissa
Punjab
RajasthanSikkim
Tamil Nadu
Tripura
Uttar Pradesh
Uttarakhand
West Bengal
y = 20093x - 80534R² = 0.206
0
200000
400000
600000
800000
1000000
1200000
1400000
1600000
45 50 55 60 65 70 75 80
Tota
l Nu
mb
er
of
Fact
ory
Wo
rke
rs
Supplier sophistication
Source: ASI, Institute for Competitiveness Analysis
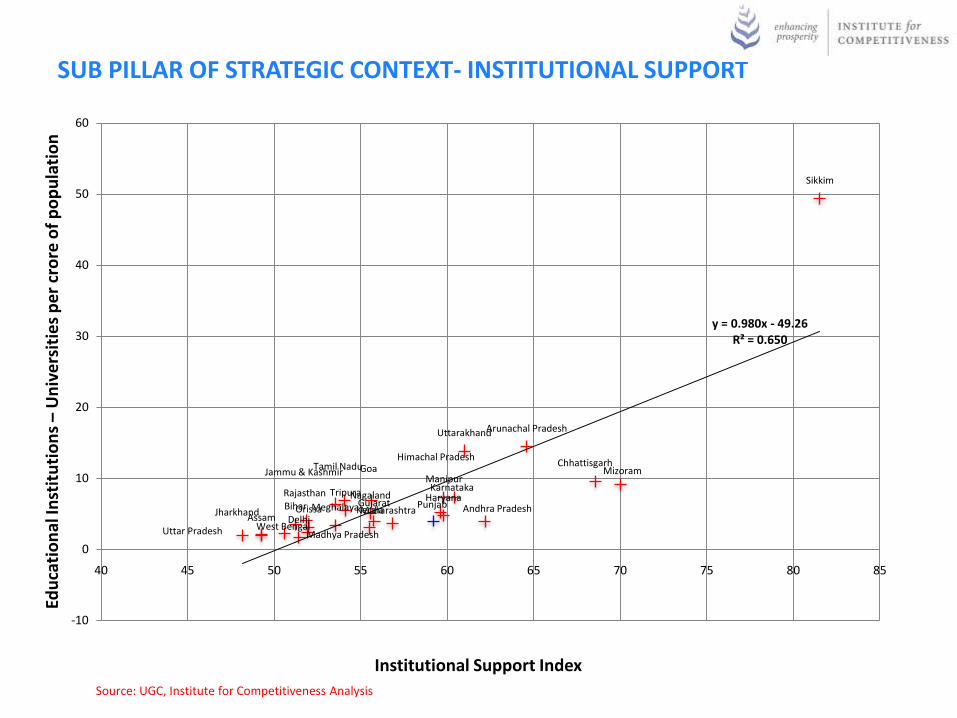
SUB PILLAR OF STRATEGIC CONTEXT- INSTITUTIONAL SUPPORT
Institutional Support Index
Edu
cati
on
al In
stit
uti
on
s –
Un
ive
rsit
ies
pe
r cr
ore
of
po
pu
lati
on
Andhra Pradesh
Arunachal Pradesh
Assam Delhi
Bihar
ChhattisgarhGoa
Gujarat Haryana
Himachal Pradesh
Jammu & Kashmir
Jharkhand
Karnataka
Kerala
Madhya Pradesh
Maharashtra
Manipur
Meghalaya
Mizoram
Nagaland
Orissa PunjabRajasthan
Sikkim
Tamil Nadu
Tripura
Uttar Pradesh
Uttarakhand
West Bengal
y = 0.980x - 49.26R² = 0.650
-10
0
10
20
30
40
50
60
40 45 50 55 60 65 70 75 80 85
Source: UGC, Institute for Competitiveness Analysis
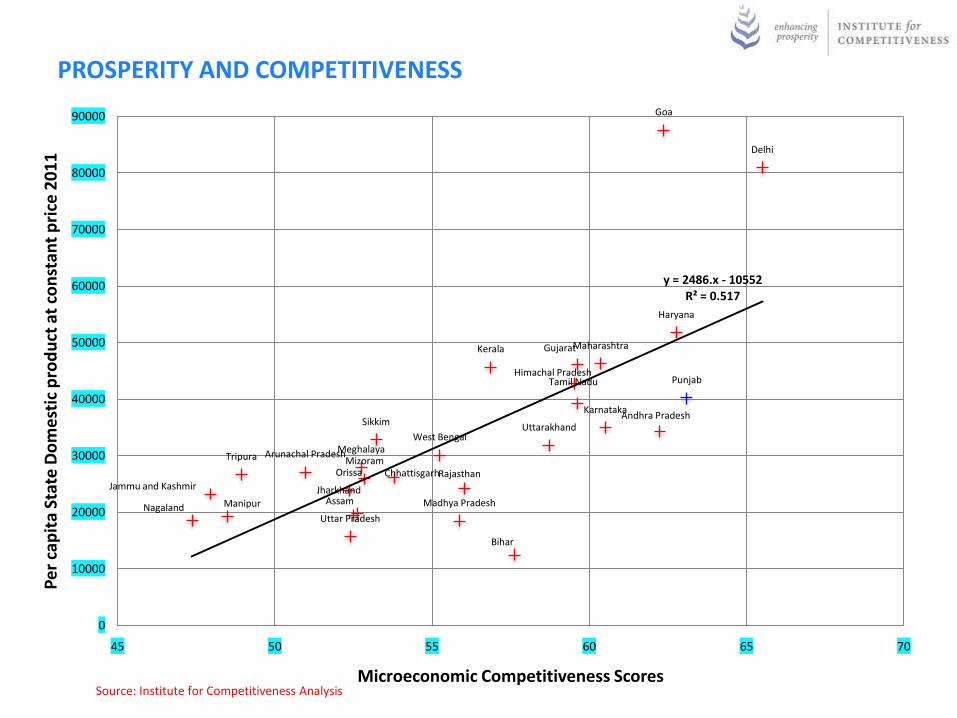
PROSPERITY AND COMPETITIVENESS
Source: Institute for Competitiveness Analysis
Andhra Pradesh
Arunachal Pradesh
Assam
Bihar
Chhattisgarh
Delhi
Goa
Gujarat
Haryana
Himachal Pradesh
Jammu and Kashmir Jharkhand
Karnataka
Kerala
Madhya Pradesh
Maharashtra
Manipur
MeghalayaMizoram
Nagaland
Orissa
Punjab
Rajasthan
Sikkim
Tamil Nadu
Tripura
Uttar Pradesh
UttarakhandWest Bengal
y = 2486.x - 10552R² = 0.517
0
10000
20000
30000
40000
50000
60000
70000
80000
90000
45 50 55 60 65 70
Pe
r ca
pit
a St
ate
Do
me
stic
pro
du
ct a
t co
nst
ant
pri
ce 2
01
1
Microeconomic Competitiveness Scores
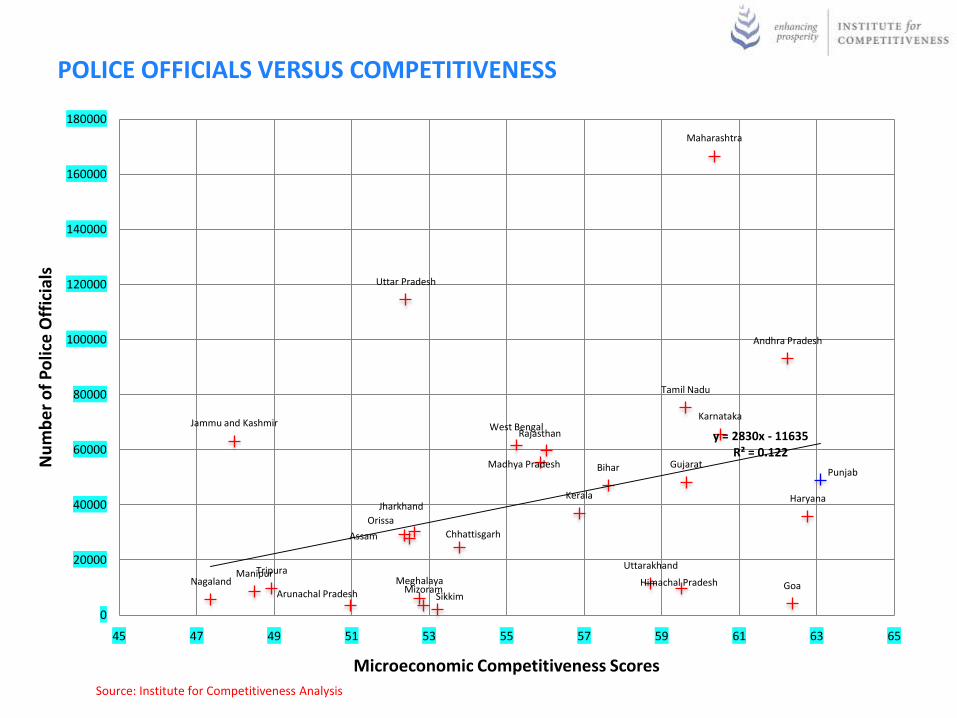
POLICE OFFICIALS VERSUS COMPETITIVENESS
Source: Institute for Competitiveness Analysis
Andhra Pradesh
Arunachal Pradesh
Assam
Bihar
Chhattisgarh
Goa
Gujarat
Haryana
Himachal Pradesh
Jammu and Kashmir
Jharkhand
Karnataka
Kerala
Madhya Pradesh
Maharashtra
ManipurMeghalaya
MizoramNagaland
Orissa
Punjab
Rajasthan
Sikkim
Tamil Nadu
Tripura
Uttar Pradesh
Uttarakhand
West Bengaly = 2830x - 11635
R² = 0.122
0
20000
40000
60000
80000
100000
120000
140000
160000
180000
45 47 49 51 53 55 57 59 61 63 65
Nu
mb
er
of
Po
lice
Off
icia
ls
Microeconomic Competitiveness Scores
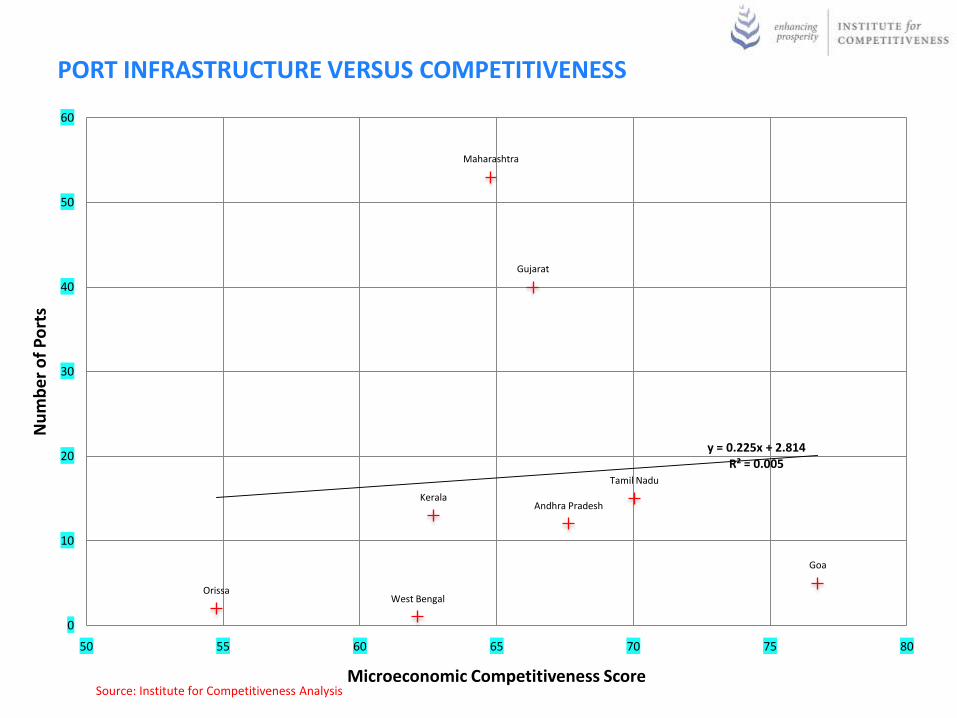
PORT INFRASTRUCTURE VERSUS COMPETITIVENESS
Source: Institute for Competitiveness Analysis
Andhra Pradesh
Goa
Gujarat
Kerala
Maharashtra
Orissa
Tamil Nadu
West Bengal
y = 0.225x + 2.814R² = 0.005
0
10
20
30
40
50
60
50 55 60 65 70 75 80
Nu
mb
er
of
Po
rts
Microeconomic Competitiveness Score
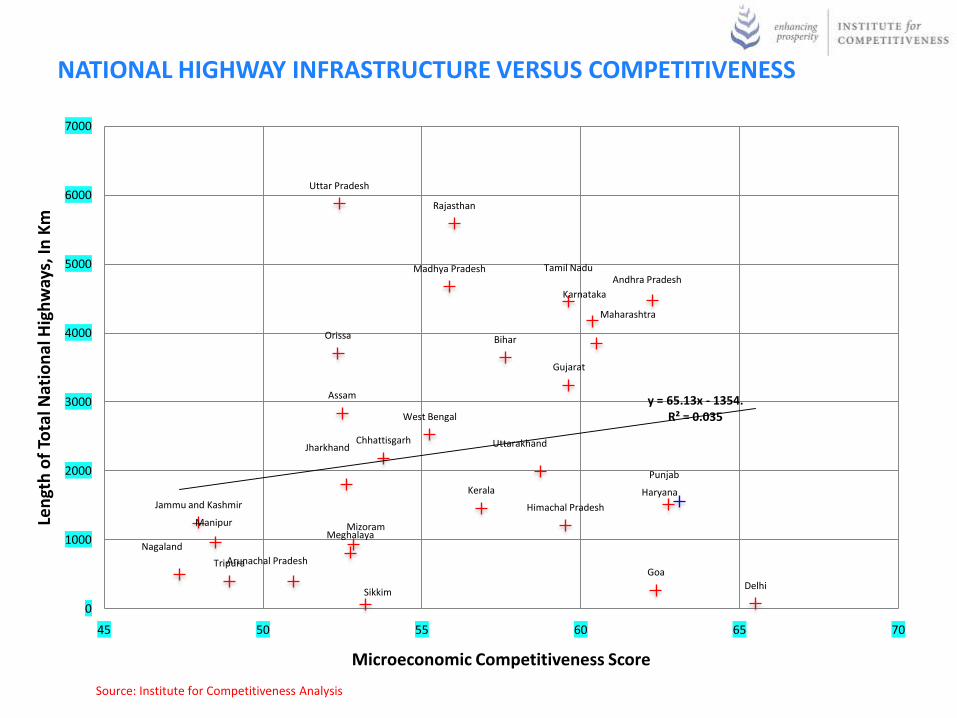
NATIONAL HIGHWAY INFRASTRUCTURE VERSUS COMPETITIVENESS
Source: Institute for Competitiveness Analysis
Andhra Pradesh
Arunachal Pradesh
Assam
Bihar
Chhattisgarh
Delhi
Goa
Gujarat
Haryana
Himachal PradeshJammu and Kashmir
Jharkhand
Karnataka
Kerala
Madhya Pradesh
Maharashtra
ManipurMeghalaya
Mizoram
Nagaland
Orissa
Punjab
Rajasthan
Sikkim
Tamil Nadu
Tripura
Uttar Pradesh
Uttarakhand
West Bengal
y = 65.13x - 1354.R² = 0.035
0
1000
2000
3000
4000
5000
6000
7000
45 50 55 60 65 70
Len
gth
of
Tota
l Nat
ion
al H
igh
way
s, In
Km
Microeconomic Competitiveness Score
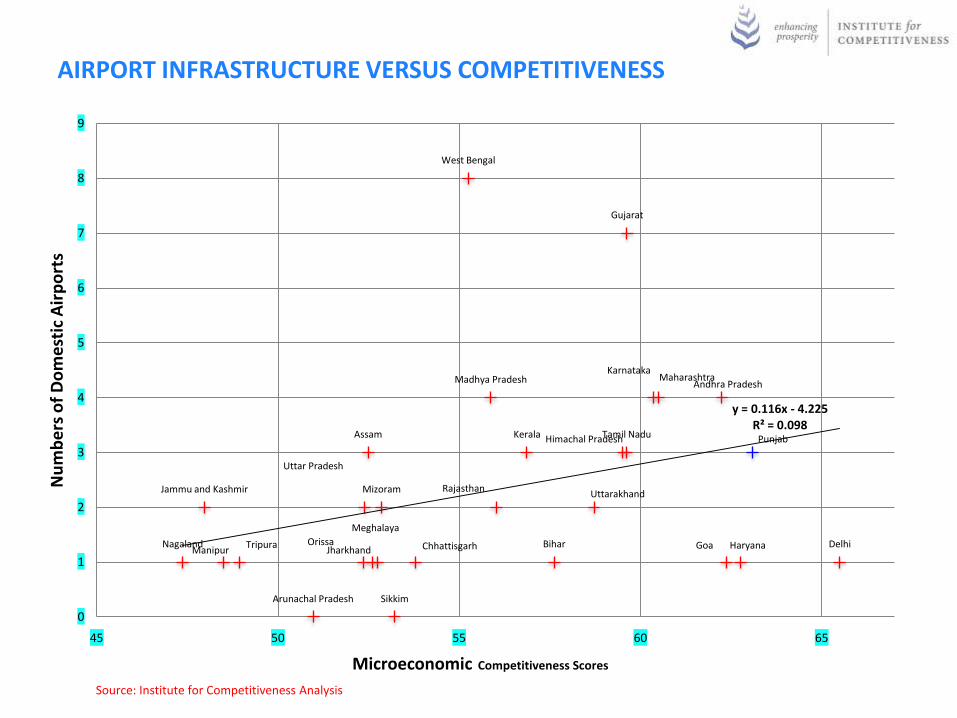
AIRPORT INFRASTRUCTURE VERSUS COMPETITIVENESS
Source: Institute for Competitiveness Analysis
Andhra Pradesh
Arunachal Pradesh
Assam
BiharChhattisgarh DelhiGoa
Gujarat
Haryana
Himachal Pradesh
Jammu and Kashmir
Jharkhand
Karnataka
Kerala
Madhya Pradesh Maharashtra
Manipur
Meghalaya
Mizoram
Nagaland Orissa
Punjab
Rajasthan
Sikkim
Tamil Nadu
Tripura
Uttar Pradesh
Uttarakhand
West Bengal
y = 0.116x - 4.225R² = 0.098
0
1
2
3
4
5
6
7
8
9
45 50 55 60 65
Nu
mb
ers
of
Do
me
stic
Air
po
rts
Microeconomic Competitiveness Scores
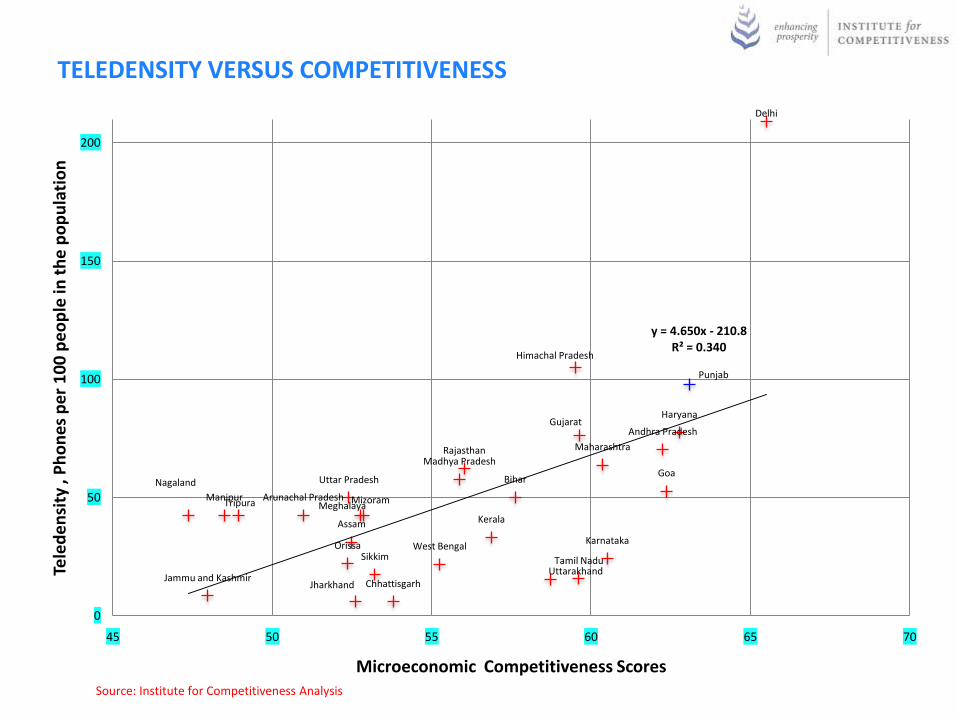
TELEDENSITY VERSUS COMPETITIVENESS
Source: Institute for Competitiveness Analysis
Andhra Pradesh
Arunachal Pradesh
Assam
Bihar
Chhattisgarh
Delhi
Goa
GujaratHaryana
Himachal Pradesh
Jammu and KashmirJharkhand
Karnataka
Kerala
Madhya Pradesh
Maharashtra
ManipurMeghalaya
Mizoram
Nagaland
Orissa
Punjab
Rajasthan
Sikkim Tamil Nadu
Tripura
Uttar Pradesh
Uttarakhand
West Bengal
y = 4.650x - 210.8R² = 0.340
0
50
100
150
200
45 50 55 60 65 70
Tele
de
nsi
ty ,
Ph
on
es
pe
r 1
00
pe
op
le in
th
e p
op
ula
tio
n
Microeconomic Competitiveness Scores
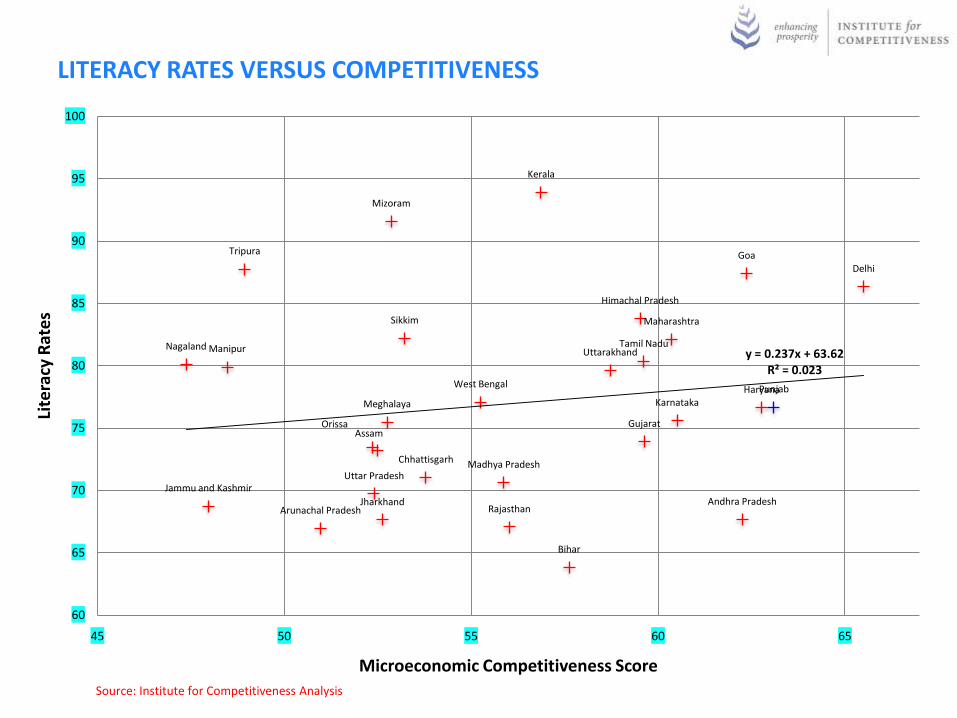
LITERACY RATES VERSUS COMPETITIVENESS
Source: Institute for Competitiveness Analysis
Andhra PradeshArunachal Pradesh
Assam
Bihar
Chhattisgarh
DelhiGoa
Gujarat
Haryana
Himachal Pradesh
Jammu and Kashmir
Jharkhand
Karnataka
Kerala
Madhya Pradesh
Maharashtra
Manipur
Meghalaya
Mizoram
Nagaland
Orissa
Punjab
Rajasthan
Sikkim
Tamil Nadu
Tripura
Uttar Pradesh
Uttarakhand
West Bengal
y = 0.237x + 63.62R² = 0.023
60
65
70
75
80
85
90
95
100
45 50 55 60 65
Lite
racy
Rat
es
Microeconomic Competitiveness Score

EDUCATION VERSUS COMPETITIVENESS
Source: Institute for Competitiveness Analysis
Andhra Pradesh
Arunachal Pradesh
Assam
Bihar
Chhattisgarh Delhi
Goa
Gujarat
Haryana
Himachal PradeshJammu and KashmirJharkhand
Karnataka
Kerala
Madhya Pradesh
Maharashtra
Manipur MeghalayaMizoramNagaland
Orissa
Punjab
Rajasthan
Sikkim
Tamil Nadu
Tripura
Uttar Pradesh
Uttarakhand
West Bengal y = 89218x - 3E+06R² = 0.014
0
2
4
6
8
10
12
14
16
18
20
45 50 55 60 65
Stu
de
nts
en
rolle
d in
hig
he
r se
con
dar
y cl
asse
sM
illio
ns
Microeconomic Competitiveness Score

RURAL TO URBAN LITERACY RATIO VERSUS COMPETITIVENESS
Source: Institute for Competitiveness Analysis
Andhra Pradesh
Arunachal Pradesh
AssamBiharChhattisgarh
Delhi
Goa
Gujarat
Haryana
Himachal Pradesh
Jammu and Kashmir
Jharkhand
Karnataka
Kerala
Madhya Pradesh
Maharashtra
Manipur
Meghalaya
Mizoram
Nagaland
Orissa
Punjab
Rajasthan
Sikkim
Tamil Nadu
Tripura
Uttar Pradesh
Uttarakhand
West Bengal
y = 0.305x + 67.33R² = 0.056
70.00
75.00
80.00
85.00
90.00
95.00
100.00
45 50 55 60 65 70
Rat
io o
f U
rban
to
ru
ral l
ite
racy
rat
es
in p
erc
en
tage
te
rms
Microeconomic Competitiveness Score
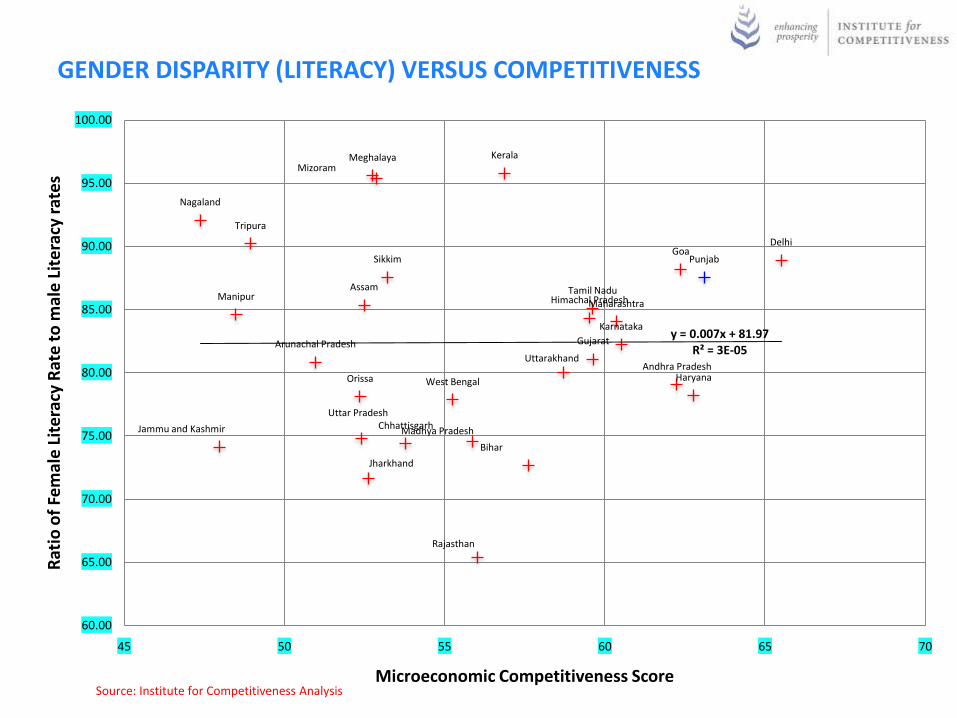
GENDER DISPARITY (LITERACY) VERSUS COMPETITIVENESS
Source: Institute for Competitiveness Analysis
Andhra Pradesh
Arunachal Pradesh
Assam
Bihar
Chhattisgarh
DelhiGoa
Gujarat
Haryana
Himachal Pradesh
Jammu and Kashmir
Jharkhand
Karnataka
Kerala
Madhya Pradesh
MaharashtraManipur
MeghalayaMizoram
Nagaland
Orissa
Punjab
Rajasthan
Sikkim
Tamil Nadu
Tripura
Uttar Pradesh
Uttarakhand
West Bengal
y = 0.007x + 81.97R² = 3E-05
60.00
65.00
70.00
75.00
80.00
85.00
90.00
95.00
100.00
45 50 55 60 65 70
Rat
io o
f Fe
mal
e L
ite
racy
Rat
e t
o m
ale
Lit
era
cy r
ate
s
Microeconomic Competitiveness Score
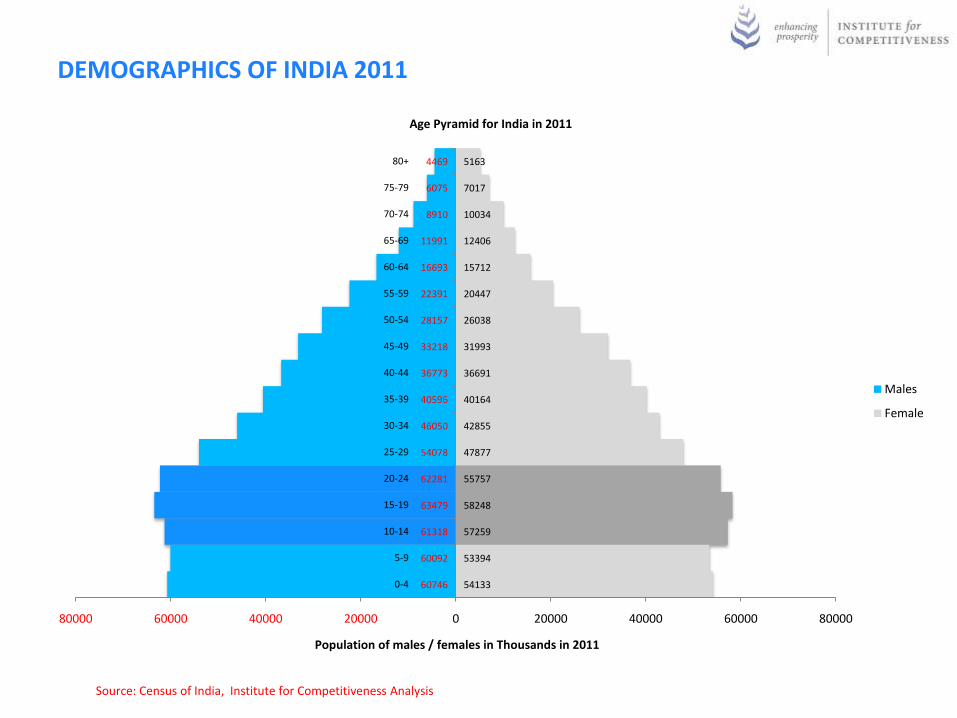
60746
60092
61318
63479
62281
54078
46050
40596
36773
33218
28157
22391
16693
11991
8910
6075
4469
54133
53394
57259
58248
55757
47877
42855
40164
36691
31993
26038
20447
15712
12406
10034
7017
5163
80000 60000 40000 20000 0 20000 40000 60000 80000
�0-4
�5-9
�10-14
�15-19
�20-24
�25-29
�30-34
�35-39
�40-44
�45-49
�50-54
�55-59
�60-64
�65-69
�70-74
�75-79
�80+
Population of males / females in Thousands in 2011
Age Pyramid for India in 2011
Males
Female
DEMOGRAPHICS OF INDIA 2011
Source: Census of India, Institute for Competitiveness Analysis

55328
58396
59500
59529
59176
60113
61859
60313
51965
43702
37704
32968
28268
22185
15820
9937
8412
49256
51790
52734
52739
52410
55998
56739
54219
46466
41361
38267
34124
28651
21982
15819
10644
11465
80000 60000 40000 20000 0 20000 40000 60000 80000
�0-4
�5-9
�10-14
�15-19
�20-24
�25-29
�30-34
�35-39
�40-44
�45-49
�50-54
�55-59
�60-64
�65-69
�70-74
�75-79
�80+
Projected Population of males / females in Thousands
Age Pyramid for India in 2026
Male
Female
DEMOGRAPHICS OF INDIA 2026
Source: Census of India, Institute for Competitiveness Analysis
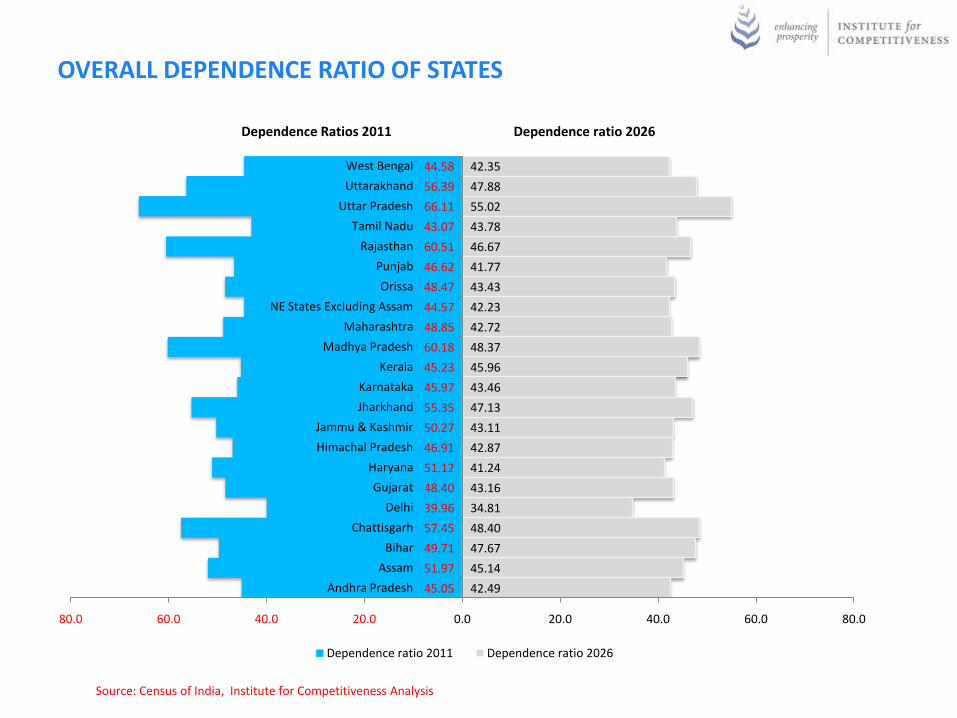
45.05
51.97
49.71
57.45
39.96
48.40
51.12
46.91
50.27
55.35
45.97
45.23
60.18
48.85
44.57
48.47
46.62
60.51
43.07
66.11
56.39
44.58
42.49
45.14
47.67
48.40
34.81
43.16
41.24
42.87
43.11
47.13
43.46
45.96
48.37
42.72
42.23
43.43
41.77
46.67
43.78
55.02
47.88
42.35
80.0 60.0 40.0 20.0 0.0 20.0 40.0 60.0 80.0
Andhra Pradesh
Assam
Bihar
Chattisgarh
Delhi
Gujarat
Haryana
Himachal Pradesh
Jammu & Kashmir
Jharkhand
Karnataka
Kerala
Madhya Pradesh
Maharashtra
NE States Excluding Assam
Orissa
Punjab
Rajasthan
Tamil Nadu
Uttar Pradesh
Uttarakhand
West Bengal
Dependence Ratios 2011 Dependence ratio 2026
Dependence ratio 2011 Dependence ratio 2026
OVERALL DEPENDENCE RATIO OF STATES
Source: Census of India, Institute for Competitiveness Analysis

GOVERNMENT HOSPITALS VERSUS COMPETITIVENESS
Source: Institute for Competitiveness Analysis
Andhra Pradesh
Arunachal PradeshAssam
Bihar
Chhattisgarh
Delhi
Goa
Gujarat
HaryanaHimachal Pradesh
Jammu and Kashmir
Jharkhand
Karnataka
KeralaMadhya Pradesh
Maharashtra
Manipur MeghalayaMizoram
Nagaland
Orissa
Punjab
Rajasthan
Sikkim
Tamil Nadu
Tripura
Uttar Pradesh
Uttarakhand
West Bengal
y = 11.66x - 253.3R² = 0.016
0
200
400
600
800
1000
1200
1400
1600
1800
45 50 55 60 65
Nu
mb
er
of
go
vern
me
nt
Ho
isp
ital
s
Microeconomic Competitiveness Score
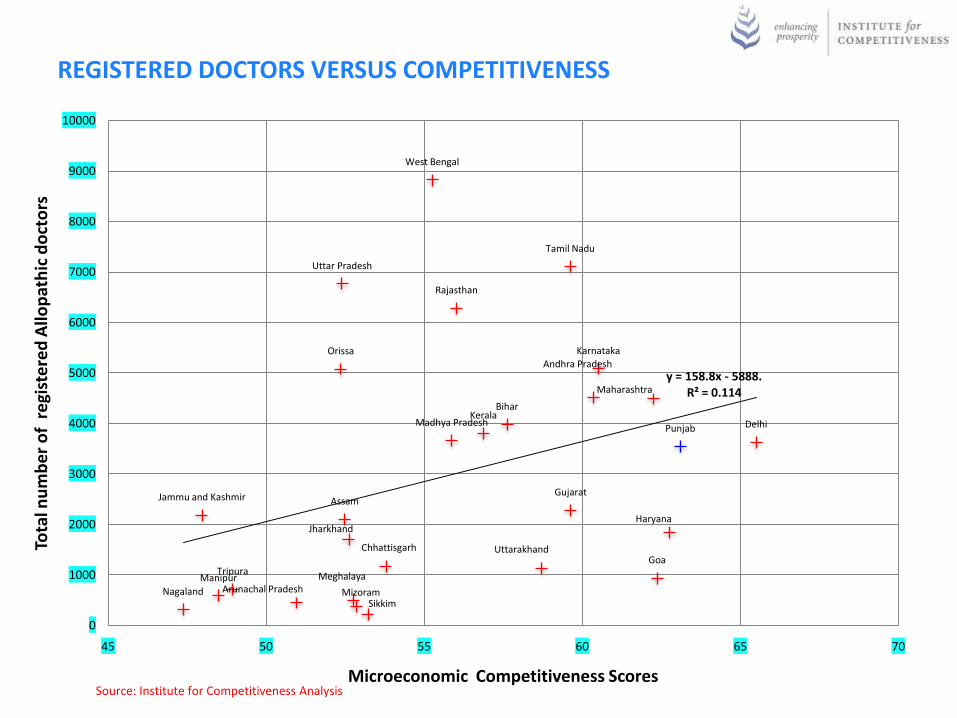
REGISTERED DOCTORS VERSUS COMPETITIVENESS
Source: Institute for Competitiveness Analysis
Andhra Pradesh
Arunachal Pradesh
Assam
Bihar
Chhattisgarh
Delhi
Goa
Gujarat
Haryana
Jammu and Kashmir
Jharkhand
Karnataka
KeralaMadhya Pradesh
Maharashtra
Manipur Meghalaya
MizoramNagaland
Orissa
Punjab
Rajasthan
Sikkim
Tamil Nadu
Tripura
Uttar Pradesh
Uttarakhand
West Bengal
y = 158.8x - 5888.R² = 0.114
0
1000
2000
3000
4000
5000
6000
7000
8000
9000
10000
45 50 55 60 65 70
Tota
l nu
mb
er
of
re
gist
ere
d A
llop
ath
ic d
oct
ors
Microeconomic Competitiveness Scores

PER CAPITA REVENUUE EXPENDITURE ON MEDICAL, HEALTH AND EXPENDITURE AND COMPETITIVENESS
Source: Institute for Competitiveness Analysis
Andhra Pradesh
Arunachal Pradesh
Assam
Bihar
Chhattisgarh
Delhi
Goa
Gujarat
Haryana
Himachal Pradesh
Jammu and Kashmir
Jharkhand
Karnataka
Kerala
Madhya PradeshMaharashtra
Manipur
Meghalaya
Mizoram
Nagaland
Orissa
Punjab
Rajasthan
Sikkim
Tamil NaduTripura
Uttar Pradesh
Uttarakhand
West Bengal
y = 6.696x + 281.1R² = 0.004
0.00
500.00
1000.00
1500.00
2000.00
2500.00
45 50 55 60 65 70
Pe
r ca
pit
a re
ven
ue
exp
en
itu
re o
n m
ed
ical
, he
alth
an
d
san
itat
ion
Microeconomic Competitiveness Scores
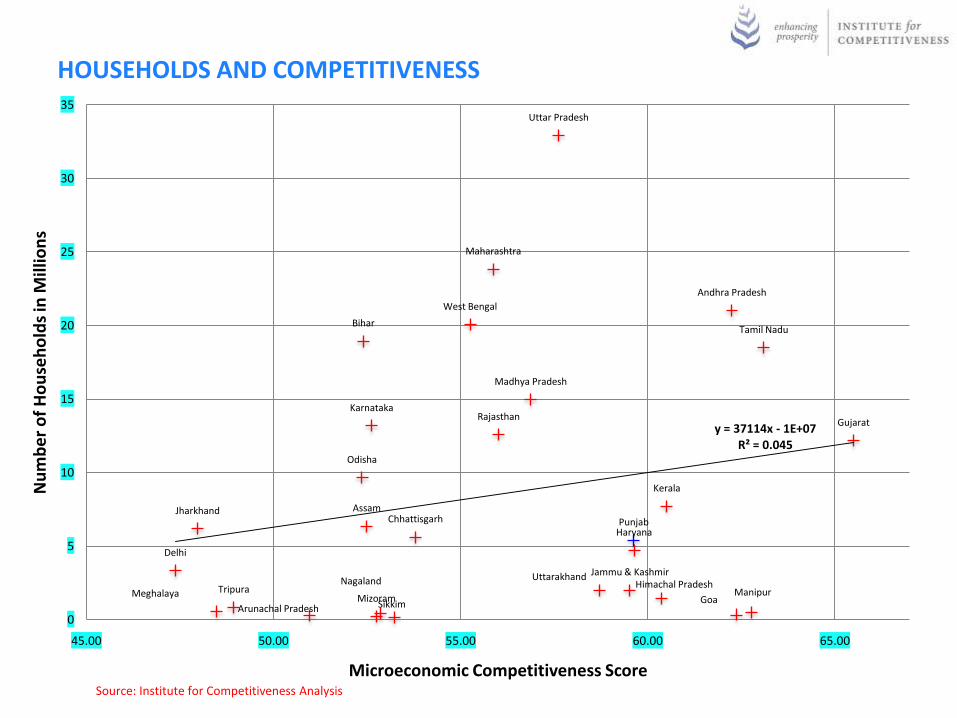
HOUSEHOLDS AND COMPETITIVENESS
Source: Institute for Competitiveness Analysis
Andhra Pradesh
Arunachal Pradesh
Assam
Bihar
Chhattisgarh
Goa
Gujarat
Haryana
Himachal PradeshJammu & Kashmir
Jharkhand
Karnataka
Kerala
Madhya Pradesh
Maharashtra
ManipurMeghalaya Mizoram
Nagaland
Delhi
Odisha
Punjab
Rajasthan
Sikkim
Tamil Nadu
Tripura
Uttar Pradesh
Uttarakhand
West Bengal
y = 37114x - 1E+07R² = 0.045
0
5
10
15
20
25
30
35
45.00 50.00 55.00 60.00 65.00
Nu
mb
er
of
Ho
use
ho
lds
in M
illio
ns
Microeconomic Competitiveness Score

AGRICULTURAL GSDP PER CAPITA AND COMPETITIVENESS
Source: Institute for Competitiveness Analysis
Andhra Pradesh
Arunachal PradeshAssam
Bihar
Chhattisgarh
Delhi
GoaGujarat
Haryana
Himachal Pradesh
Jammu and Kashmir
Jharkhand
Karnataka
Kerala
Madhya Pradesh
Maharashtra
ManipurMeghalaya
Mizoram
Nagaland
Orissa
Punjab
RajasthanSikkim
Tamil Nadu
Tripura
Uttar PradeshUttarakhand
West Bengal
y = 199.8x - 2794.R² = 0.060
0.00
5000.00
10000.00
15000.00
20000.00
25000.00
45 50 55 60 65
Agr
icu
ltu
ral
GSD
P p
er
cap
ita
in R
up
ee
s /A
nn
um
Microeconomic Competitiveness Score
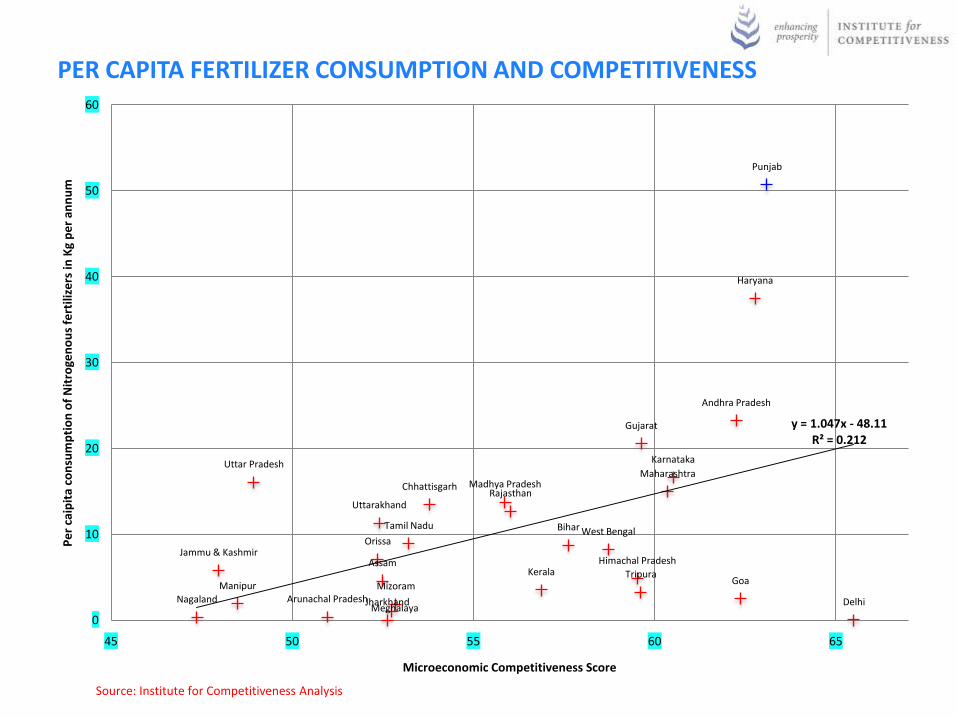
PER CAPITA FERTILIZER CONSUMPTION AND COMPETITIVENESS
Source: Institute for Competitiveness Analysis
Andhra Pradesh
Arunachal Pradesh
Assam
Bihar
Chhattisgarh
Delhi
Goa
Gujarat
Haryana
Himachal PradeshJammu & Kashmir
Jharkhand
Karnataka
Kerala
Madhya PradeshMaharashtra
Manipur
Meghalaya
MizoramNagaland
Orissa
Punjab
Rajasthan
Tamil Nadu
Tripura
Uttar Pradesh
Uttarakhand
West Bengal
y = 1.047x - 48.11R² = 0.212
0
10
20
30
40
50
60
45 50 55 60 65
Pe
r ca
ipit
a co
nsu
mp
tio
n o
f N
itro
gen
ou
s fe
rtili
zers
in K
g p
er
ann
um
Microeconomic Competitiveness Score

MANUFACTURING AND COMPETITIVENESS
Source: Institute for Competitiveness Analysis
Andhra Pradesh
Arunachal Pradesh
Assam
Bihar
ChhattisgarhDelhi
Goa
Gujarat
Haryana
Himachal Pradesh
Jammu and Kashmir
JharkhandKarnataka
Kerala
Madhya Pradesh
Maharashtra
ManipurMeghalaya
MizoramNagaland
Orissa
Punjab
Rajasthan
Sikkim
Tamil Nadu
Tripura
Uttar Pradesh
Uttarakhand
West Bengal
y = 966.5x - 47032R² = 0.295
0
5000
10000
15000
20000
25000
30000
35000
40000
45000
50000
45 50 55 60 65
Man
ufa
ctu
rin
g G
SDP
pe
r ca
pit
a in
Ru
pe
es
/An
nu
m
Microeconomic Competitiveness Score

SERVICES AND COMPETITIVENESS
Source: Institute for Competitiveness Analysis
Andhra Pradesh
Arunachal Pradesh
Assam
Bihar
Chhattisgarh
Delhi
Goa
Gujarat
Haryana
Himachal Pradesh
Jammu and Kashmir
Jharkhand
Karnataka
Kerala
Madhya Pradesh
Maharashtra
Manipur
Meghalaya
Mizoram
Nagaland
Orissa
Punjab
Rajasthan
Sikkim
Tamil Nadu
Tripura
Uttar Pradesh
UttarakhandWest Bengal
y = 2177.x - 97702R² = 0.463
0
10000
20000
30000
40000
50000
60000
70000
80000
90000
45 50 55 60 65 70
Serv
ice
s G
SDP
pe
r ca
pit
a in
Ru
pe
es
/An
nu
m
Microeconomic Competitiveness Score

16.85
0.21 4.94
13.98
4.15 0.289.64
3.53 1.24 1.55 4.86
10.236.60
10.92
19.06
0.40 0.42 0.16 0.337.87
4.27
9.340.10
14.17
0.66
25.76
1.59
15.72
21.02
0.266.37
18.94
5.62 0.32
12.18
4.72 1.48 2.026.18
13.18
7.72
14.97
23.83
0.51 0.54 0.22 0.40
9.66
5.41
12.58
0.13
18.49
0.84
32.92
2.00
20.07
Households in India (in Millions) 2001 and 2011
67.254.7
24.9 10.3
53.1
93.680.4 82.9
94.880.7
24.3
78.670.2 70.0
77.560.0
42.7
69.6 63.6
26.9
91.9
54.7
77.8 78.2
41.831.9
60.3
37.5
92.2
65.7
37.1
16.4
75.3
96.990.4 90.5
96.8
85.1
45.8
90.6 94.467.1
83.9
68.4
60.9
84.2 81.6
43
96.6
67
92.5 93.4
68.4
36.8
87
54.5
Percentage of Households in India 2001 and 2011 having electricity
Percentage of Households having electricity in India 2001 Percentage of Households having electricity in India 2011
HOUSEHOLDS IN INDIA
Source: Census of India,2011 Institute for Competitiveness Analysis
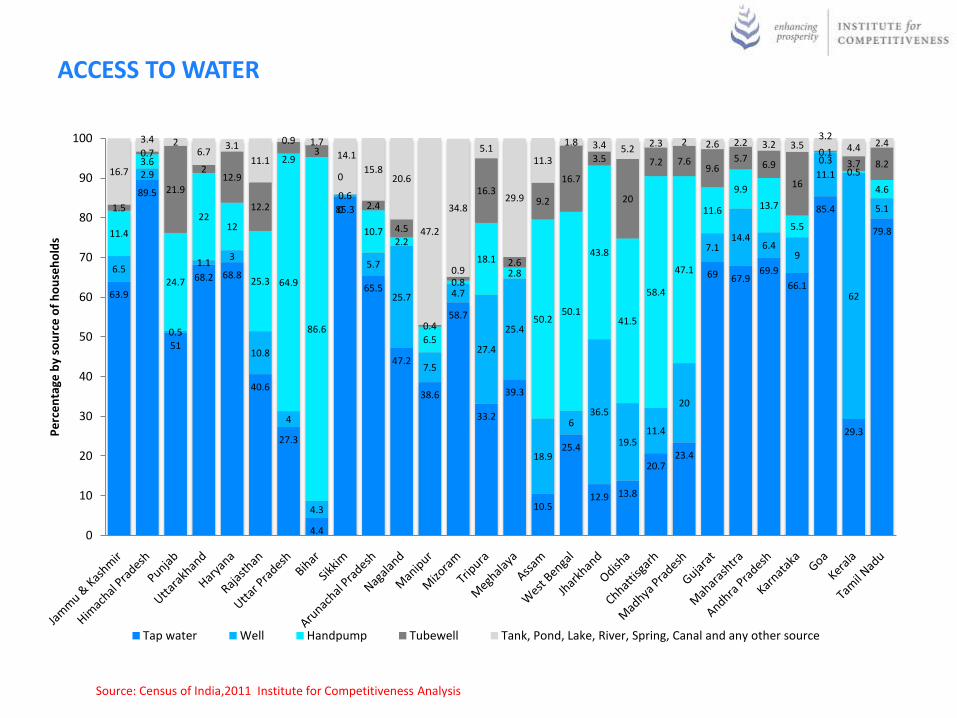
ACCESS TO WATER
63.9
89.5
51
68.2 68.8
40.6
27.3
4.4
85.3
65.5
47.2
38.6
58.7
33.2
39.3
10.5
25.4
12.9 13.8
20.723.4
69 67.969.9
66.1
85.4
29.3
79.8
6.5
2.9
0.5
1.13
10.8
4
4.3
0.6
5.7
25.7
7.5
4.7
27.4
25.4
18.9
636.5
19.511.4
20
7.114.4
6.49
11.1
62
5.1
11.4
3.6
24.7
2212
25.3 64.9
86.6
0
10.72.2
6.5
0.8
18.1
2.8
50.250.1
43.8
41.5
58.4
47.1
11.6
9.9
13.7
5.5
0.1
0.5
4.6
1.5
0.7
21.9
212.9
12.2
2.93
0
2.4
4.5
0.4
0.9
16.3
2.6
9.2
16.7
3.5
20
7.2 7.69.6
5.76.9
16
0.3 3.7 8.216.7
3.4 26.7
3.1
11.1
0.9 1.714.1
15.820.6
47.2
34.8
5.1
29.9
11.3
1.8 3.4 5.22.3 2 2.6 2.2 3.2 3.5
3.24.4 2.4
0
10
20
30
40
50
60
70
80
90
100
Pe
rce
nta
ge b
y so
urc
e o
f h
ou
seh
old
s
Tap water Well Handpump Tubewell Tank, Pond, Lake, River, Spring, Canal and any other source
Source: Census of India,2011 Institute for Competitiveness Analysis
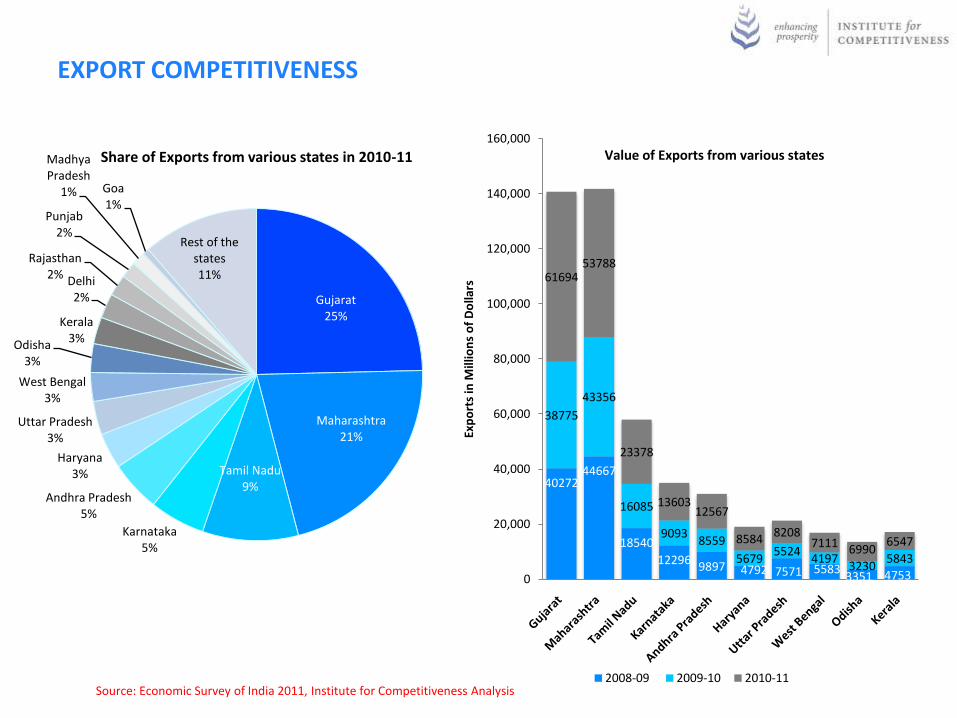
Gujarat 25%
Maharashtra 21%
Tamil Nadu 9%
Karnataka 5%
Andhra Pradesh 5%
Haryana 3%
Uttar Pradesh 3%
West Bengal 3%
Odisha 3%
Kerala 3%
Delhi 2%
Rajasthan 2%
Punjab 2%
Madhya Pradesh
1% Goa 1%
Rest of the states11%
Share of Exports from various states in 2010-11
4027244667
18540
12296 9897 4792 7571 55833351 4753
38775
43356
16085
90938559
56795524
41973230
5843
6169453788
23378
1360312567
85848208
7111 69906547
0
20,000
40,000
60,000
80,000
100,000
120,000
140,000
160,000
Exp
ort
s in
Mill
ion
s o
f D
olla
rs
Value of Exports from various states
2008-09 2009-10 2010-11
EXPORT COMPETITIVENESS
Source: Economic Survey of India 2011, Institute for Competitiveness Analysis
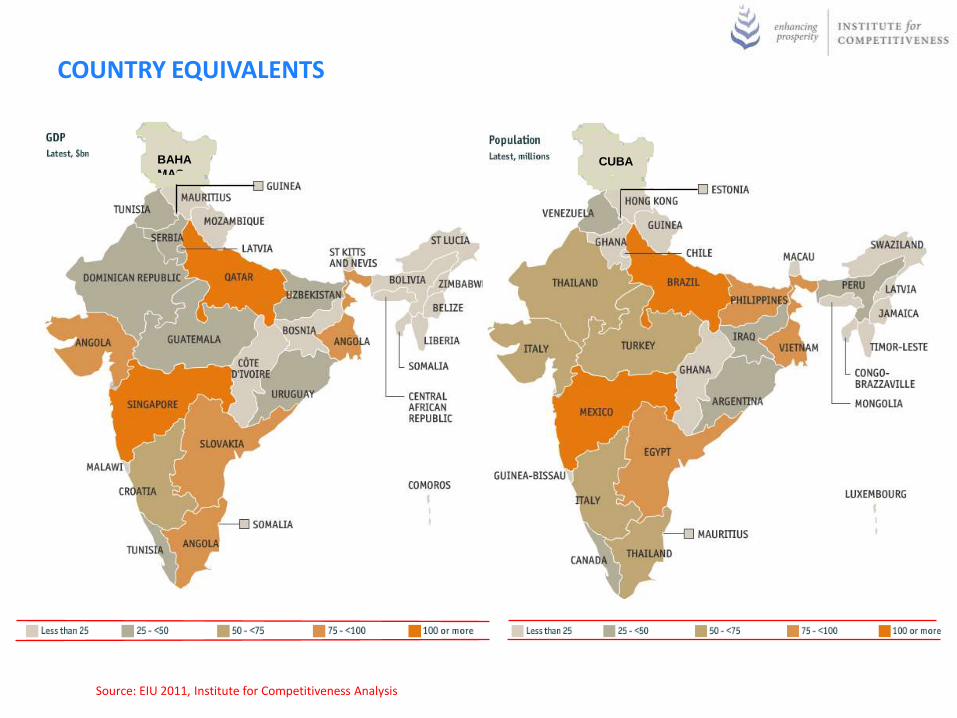
COUNTRY EQUIVALENTS
Source: EIU 2011, Institute for Competitiveness Analysis
BAHA
MASCUBA

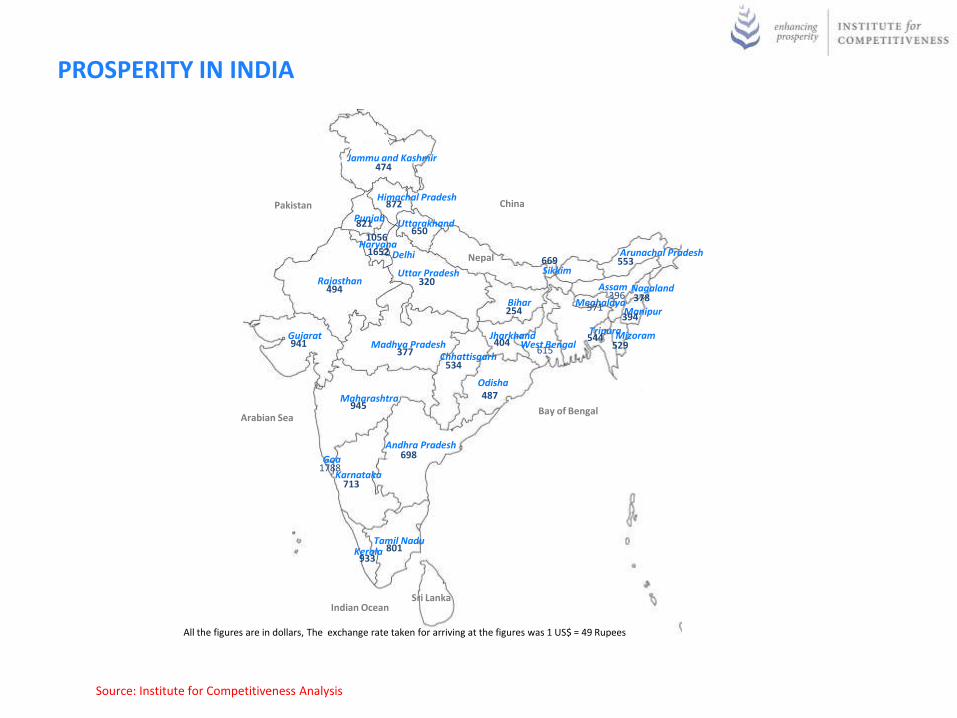
Punjab
Uttar Pradesh
Haryana
Madhya Pradesh
Bihar
Rajasthan
Maharashtra
Gujarat
Jammu and Kashmir
Uttarakhand
Andhra Pradesh
Tamil Nadu
Karnataka
Odisha
West Bengal
Kerala
Chhattisgarh
Jharkhand
Himachal Pradesh
Arunachal Pradesh
Assam
Manipur
Mizoram
Meghalaya
Nagaland
Sikkim
Delhi
Goa
ChinaPakistan
Arabian SeaBay of Bengal
Indian OceanSri Lanka
Nepal
Tripura
24.6
21.4
9.3
5.4
5.0
3.4
3.3
2.8
2.8
2.6
2.4
2.1
1.6
1.2
0.7
EXPORTS FROM THE TOP 15 STATES PERCENTAGE OF THE TOTAL
Source: Institute for Competitiveness Analysis
Punjab
Uttar Pradesh
Haryana
Madhya Pradesh
Bihar
Rajasthan
Maharashtra
Gujarat
Jammu and Kashmir
Uttarakhand
Andhra Pradesh
Tamil Nadu
Karnataka
Odisha
West Bengal
Kerala
Chhattisgarh
Jharkhand
Himachal Pradesh
Arunachal Pradesh
Assam
Manipur
Mizoram
Meghalaya
Nagaland
SikkimDelhi
Goa
ChinaPakistan
Arabian SeaBay of Bengal
Indian OceanSri Lanka
Nepal
Tripura
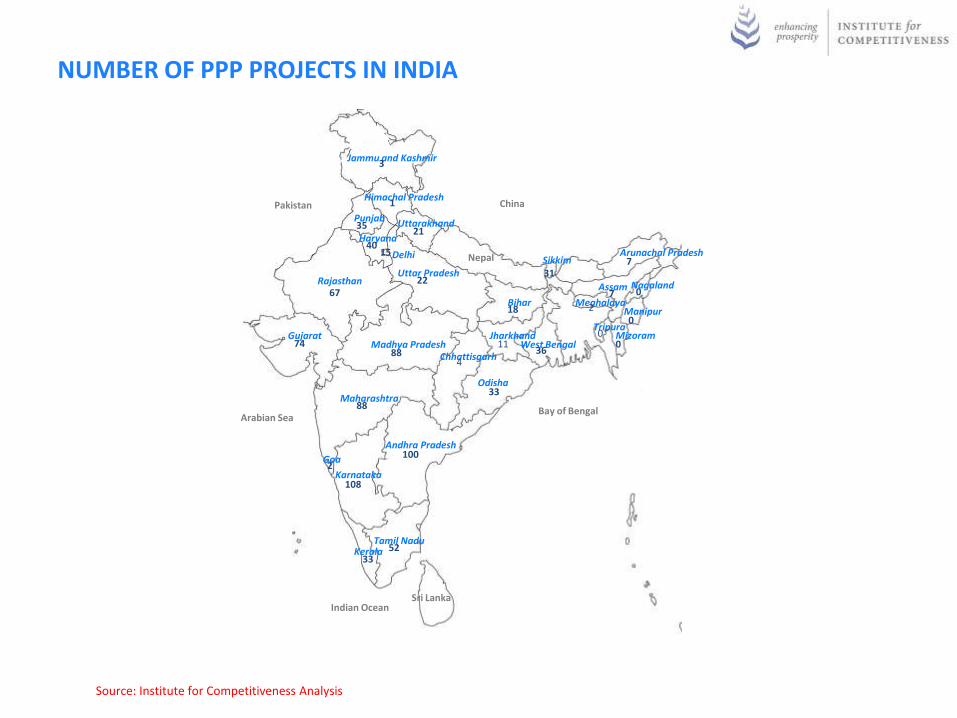
3
1
35
4015
22
18
1136
4
100
5233
108
88
74
33
21
2
67
317
88
7
2
00
0
0
NUMBER OF PPP PROJECTS IN INDIA
Source: Institute for Competitiveness Analysis

Punjab
Uttar Pradesh
Haryana
Madhya Pradesh
Bihar
Rajasthan
Maharashtra
Gujarat
Jammu and Kashmir
Uttarakhand
Andhra Pradesh
Tamil Nadu
Karnataka
Odisha
West Bengal
Kerala
Chhattisgarh
Jharkhand
Himachal Pradesh
Arunachal Pradesh
Assam
Manipur
Mizoram
Meghalaya
Nagaland
SikkimDelhi
Goa
ChinaPakistan
Arabian SeaBay of Bengal
Indian OceanSri Lanka
Nepal
Tripura
1.04
0.57
2.29
2.09
16.495.67
1.38
0.84
8.58
3.47
7.55
2.58
0.24
0.300.09
0.22
0.16
0.11
2.724.99
9.29
0.12
6.00
2.11
7.00
5.05
2.765.96
POPULATION PERCENTAGES IN STATES
Source: Institute for Competitiveness Analysis
Punjab
Uttar Pradesh
Haryana
Madhya Pradesh
Bihar
Rajasthan
Maharashtra
Gujarat
Jammu and Kashmir
Uttarakhand
Andhra Pradesh
Tamil Nadu
Karnataka
Odisha
West Bengal
Kerala
Chhattisgarh
Jharkhand
Himachal Pradesh
Arunachal Pradesh
Assam
Manipur
Mizoram
Meghalaya
Nagaland
Sikkim
Delhi
Goa
ChinaPakistan
Arabian SeaBay of Bengal
Indian OceanSri Lanka
Nepal
Tripura
1788
1652
1056
945
941
933
872
821
801
713
698
669
650
615
571
553
544
534
529
494
487
474
404
396
394
378
377
320
254
All the figures are in dollars, The exchange rate taken for arriving at the figures was 1 US$ = 49 Rupees
PROSPERITY IN INDIA
Source: Institute for Competitiveness Analysis

STATE OF INDUSTRIES
Jammu & Kashmir
Himachal Pradesh
PunjabHaryana
Uttar Pradesh
RajasthanDelhi
Uttarakhand
BiharOrissa
West Bengal
Assam
Meghalaya
Tripura
Mizoram
Manipur
NagalandArunachal Pradesh
Sikkim
Jharkhand
Gujarat Maharashtra
Goa
Madhya Pradesh
Chhattisgarh
Andhra Pradesh
KarnatakaKerala
Tamil Nadu
1
10
100
1000
10000
100000
1000000
10000000
0 20000 40000 60000 80000 100000 120000
Contribution in Rs Crores
All India Average of 18,54,826 people employed/ state
All
Ind
ia
All India Average 23816.62 Crores
Source: MSME , Institute for Competitiveness Analysis
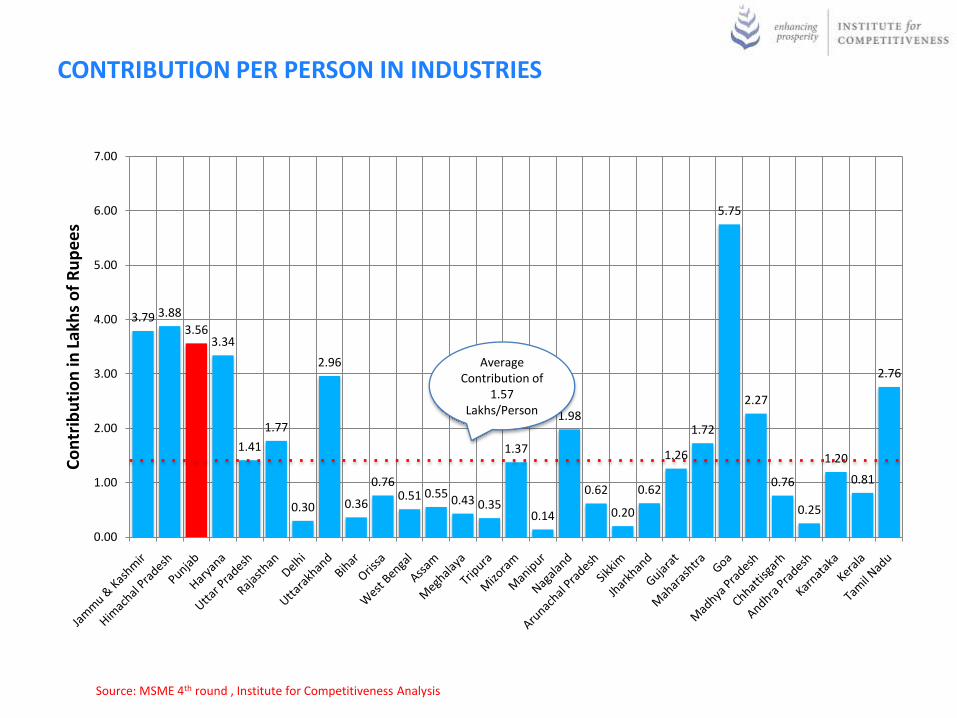
CONTRIBUTION PER PERSON IN INDUSTRIES
3.79 3.88
3.563.34
1.41
1.77
0.30
2.96
0.36
0.760.51 0.55
0.43 0.35
1.37
0.14
1.98
0.62
0.20
0.62
1.26
1.72
5.75
2.27
0.76
0.25
1.20
0.81
2.76
0.00
1.00
2.00
3.00
4.00
5.00
6.00
7.00
Co
ntr
ibu
tio
n in
Lak
hs
of
Ru
pe
es
Average Contribution of
1.57 Lakhs/Person
Source: MSME 4th round , Institute for Competitiveness Analysis
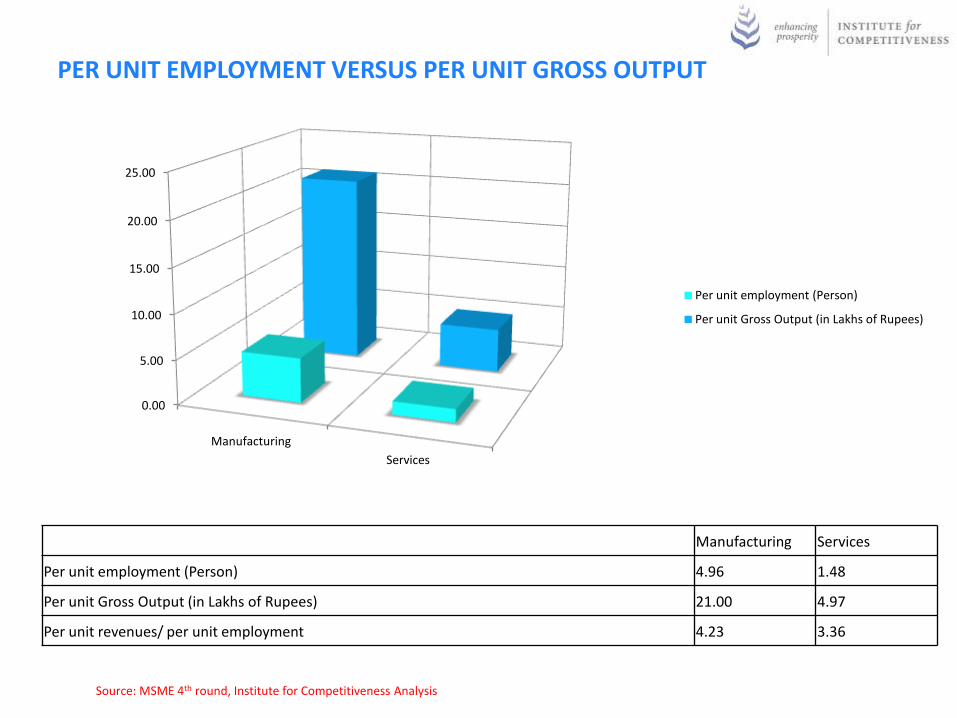
PER UNIT EMPLOYMENT VERSUS PER UNIT GROSS OUTPUT
Source: MSME 4th round, Institute for Competitiveness Analysis
0.00
5.00
10.00
15.00
20.00
25.00
Manufacturing
Services
Per unit employment (Person)
Per unit Gross Output (in Lakhs of Rupees)
Manufacturing Services
Per unit employment (Person) 4.96 1.48
Per unit Gross Output (in Lakhs of Rupees) 21.00 4.97
Per unit revenues/ per unit employment 4.23 3.36
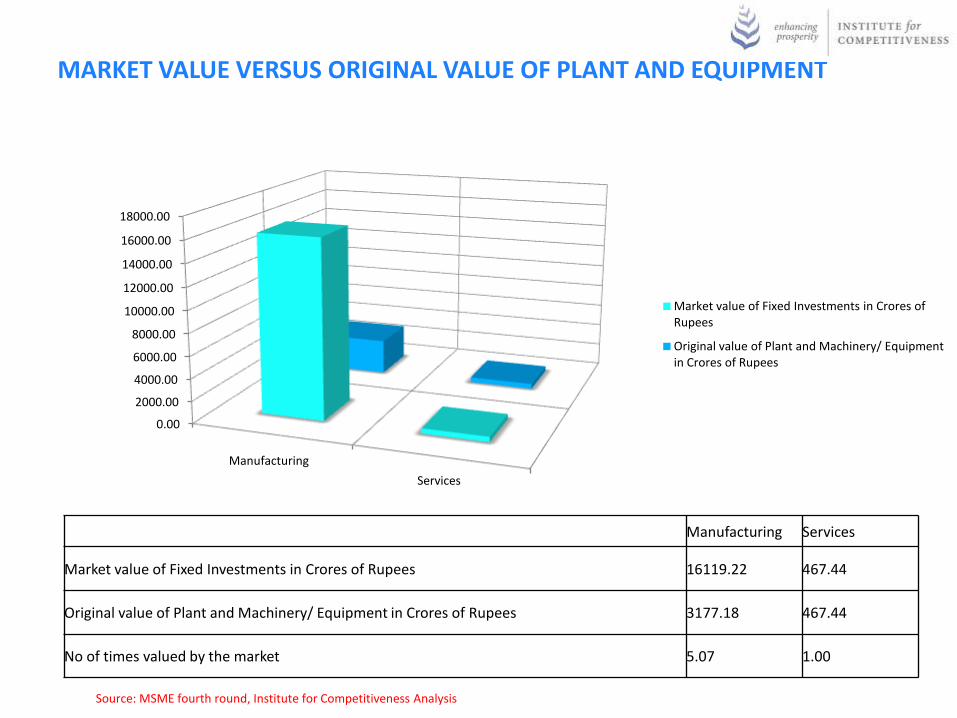
MARKET VALUE VERSUS ORIGINAL VALUE OF PLANT AND EQUIPMENT
Source: MSME fourth round, Institute for Competitiveness Analysis
Manufacturing Services
Market value of Fixed Investments in Crores of Rupees 16119.22 467.44
Original value of Plant and Machinery/ Equipment in Crores of Rupees 3177.18 467.44
No of times valued by the market 5.07 1.00
0.00
2000.00
4000.00
6000.00
8000.00
10000.00
12000.00
14000.00
16000.00
18000.00
Manufacturing
Services
Market value of Fixed Investments in Crores of Rupees
Original value of Plant and Machinery/ Equipment in Crores of Rupees
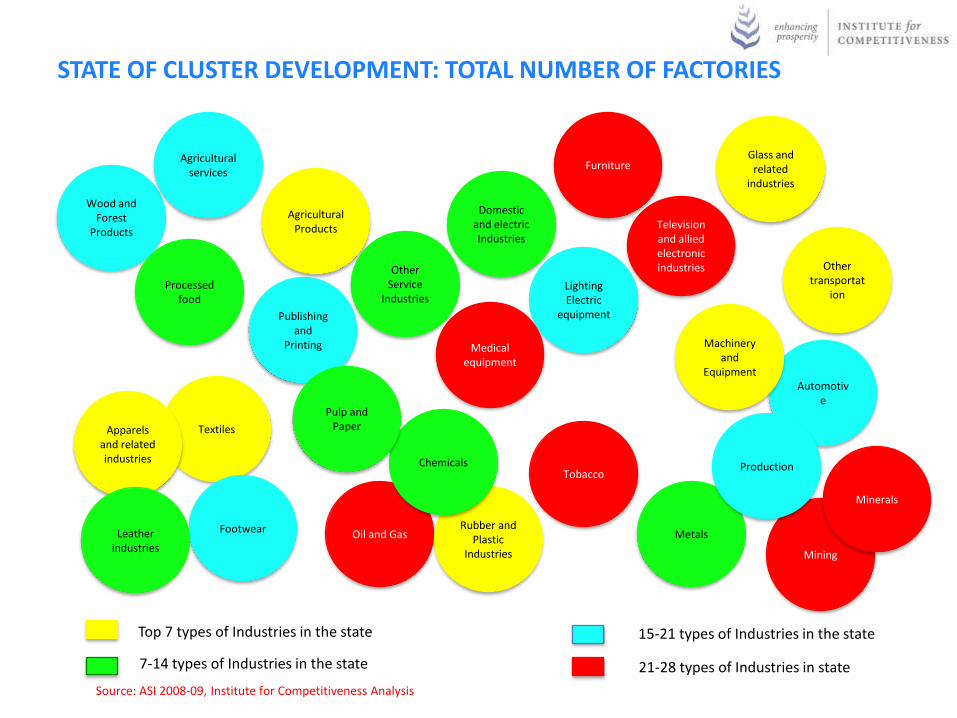
Source: ASI 2008-09, Institute for Competitiveness Analysis
Top 7 types of Industries in the state
7-14 types of Industries in the state
15-21 types of Industries in the state
21-28 types of Industries in state
STATE OF CLUSTER DEVELOPMENT: TOTAL NUMBER OF FACTORIES
Mining
TextilesApparels and related industries
Publishing and
Printing
Glass and related
industries
Footwear
Lighting Electric
equipment
Minerals
Tobacco
Automotive
Oil and Gas
Medical equipment
Furniture
Other transportat
ion
Leather industries
Wood and Forest
Products
Rubber and Plastic
Industries
Television and allied electronic industries
Processed food
Chemicals
Pulp and Paper
Agricultural Products
Agricultural services
Other Service
Industries
Machinery and
Equipment
Metals
Domestic and electric Industries
Production
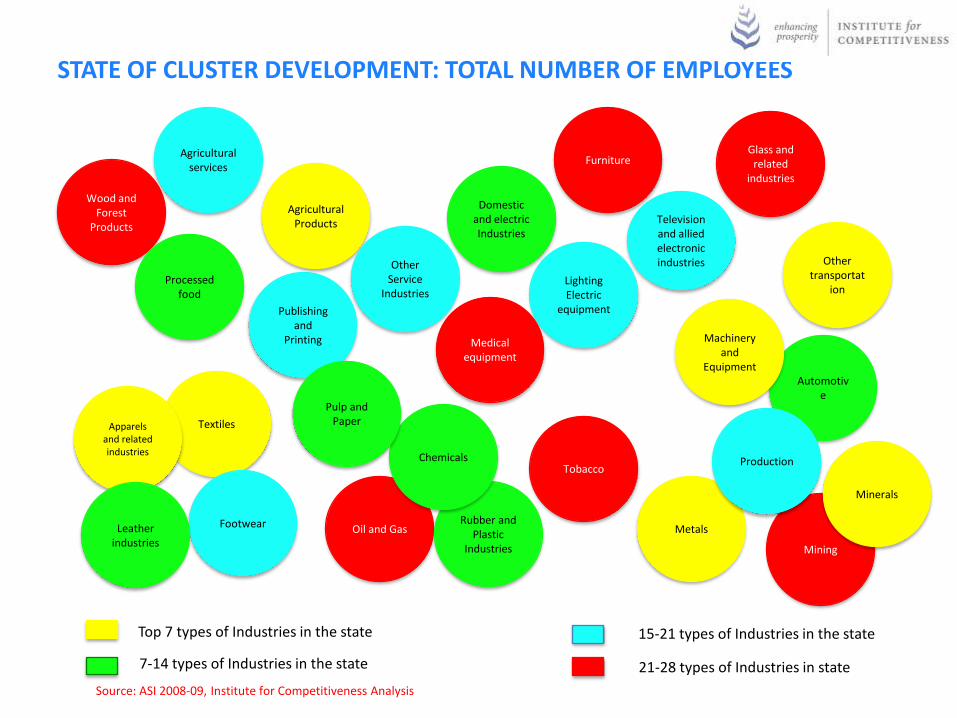
STATE OF CLUSTER DEVELOPMENT: TOTAL NUMBER OF EMPLOYEES
Top 7 types of Industries in the state
7-14 types of Industries in the state
15-21 types of Industries in the state
21-28 types of Industries in state
Source: ASI 2008-09, Institute for Competitiveness Analysis
Mining
TextilesApparels and related industries
Publishing and
Printing
Glass and related
industries
Footwear
Lighting Electric
equipment
Minerals
Tobacco
Automotive
Oil and Gas
Medical equipment
Furniture
Other transportat
ion
Leather industries
Wood and Forest
Products
Rubber and Plastic
Industries
Television and allied electronic industries
Processed food
Chemicals
Pulp and Paper
Agricultural Products
Agricultural services
Other Service
Industries
Machinery and
Equipment
Metals
Domestic and electric Industries
Production

STATE OF CLUSTER DEVELOPMENT: TOTAL NUMBER OF PEOPLE
Source: ASI 2008-09, Institute for Competitiveness Analysis
0 10000 20000 30000 40000 50000 60000 70000 80000 90000
Machinery and equipment
Textiles
other transportation
Metals
Food Processing
Automotive
Pulp and Paper
other service industries
Agriculture services
Lighting and electric equipment
Printing and Publishing
Medical
Glass Industries
Mining
80852
67911
57178
46670
41810
36432
24728
19174
14582
13691
13264
11363
9761
6677
6429
6174
5647
4053
2147
1871
1747
1737
936
332
311
220
0
0

CREATING A STATE ECONOMIC STRATEGY
State Value Proposition
Achieving and Maintaining parity with peers
Developing Unique Strengths
What are the main strengths, positive attributes, location advantage etc of the particular state in question.
• How can the state leverage on its unique capabilities and create new ones?
• Which businesses/ clusters can be made stronger?
• What are the key weaknesses which need to be taken care of while forming maintaining parity with peers?
State economic strategy requires setting clear priorities and measuring against predefined criteria.

COMPETITION AMONG STATES
Tactical (Zero Sum Competition)
Strategic (Positive Sum Competition)
• Focus on FDI investments
• Compete in every domain
• Offer tax benefits across the
spectrum
• Provide subsidies to lower / offset
business costs
• Every city and sub-region for itself
• Government is responsible for development of cluster.
• Focus on domestic and existing
companies
• Compete in specialized cluster domains
• Government incentives and support for
training, infrastructure, and institutions
• Improve the efficiency of doing
business
• Economies of scale to help benefit from
multiple geographies
• Government and the private sector
collaborate to build cluster strength
Source: Michael E Porter

HOW SHOULD STATES COMPETE WITH EACH OTHER
Old Model New Model
Competitiveness is the result of both top-down and bottom-up processes in which many companies and institutions take responsibility
• Government drives economic development through policy decisions and incentives
• Economic development is a collaborative process involving government at multiple levels, companies, teaching and research institutions, and private sector organizations
Source: Michael E Porter
COMPETITION AMONG STATES
• The purpose of a sound economic policy is to increase the overall prosperity in
the state and for that the states should focus on increasing their competitiveness.
• Improvements and productivity and technological advancement are the guiding
principles in this regard.
• Competitiveness requires a fundamental rethinking of usage of your existing
resources.
• For government has to fundamentally rethink its role, it should try to foster a spirit
of entrepreneurship in the private sector.
• The criteria for judging the merits and demerits of an economic policy should be
by outcomes and not political philosophy.
• The prosperity of India will depend largely on the states and not just the (Center)
Delhi.

INTERPRETATION CHARTS
Top 33.33% of the states
33.33%-66.67% ofthe states
66.67% to 100% ofthe states
• The snapshot chart summarizes the relative performance of a state on levels and trends in 5 key
measures. The circles in the chart show the measurement of the chart legend.
• Prosperity: State GDP per capita and 10 year trend.
• Productivity: Average Private wage and 10 year trend.
• Labour Mobilization: Total labour force as a share of civilian population and 10 year trend.
• Clusters: Total number of people employed in the cluster and total number of enterprises in the cluster.
• Type of Economy: Factor Driven economies, Changeover economies, Investment driven
economies, Transition economies, Innovation driven economies and city state economies.
Position Trend
Prosperity
Productivity
Labour Mobilization
State of Clusters
Leading ClustersOther TransportationAgricultural ProductsMachinery Textiles
Type of Economy Transition Economies

Top 7 types of Industries in the state
7-14 types of Industries in the state
15-21 types of Industries in the state
21-28 types of Industries in the state
The Chart represents the numberof factories in various types ofIndustries in state.
The position of the various typesof factories shows relativeproximity in terms of type ofIndustry. Thus, Chemical is placednext to Oil and gas, etc.
The colour coding is done toshow the importance of factorysector in terms of number ofenterprises in the state. Thusyellow shows the maximumnumber of industries in the state.
STATE OF CLUSTER DEVELOPMENT : FACTORIES
Mining
TextilesApparels
and related industries
Publishing and
Printing
Glass and related
industries
Footwear
Lighting Electric
equipment
Minerals
Tobacco
Automotive
Oil and Gas
Medical equipment
Furniture
Other transportat
ion
Leather industries
Wood and Forest
Products
Rubber and Plastic
Industries
Television and allied electronic industries
Processed food
Chemicals
Pulp and Paper
Agricultural Products
Agricultural services
Other Service
Industries
Machinery and
Equipment
Metals
Domestic and electric Industries
Production
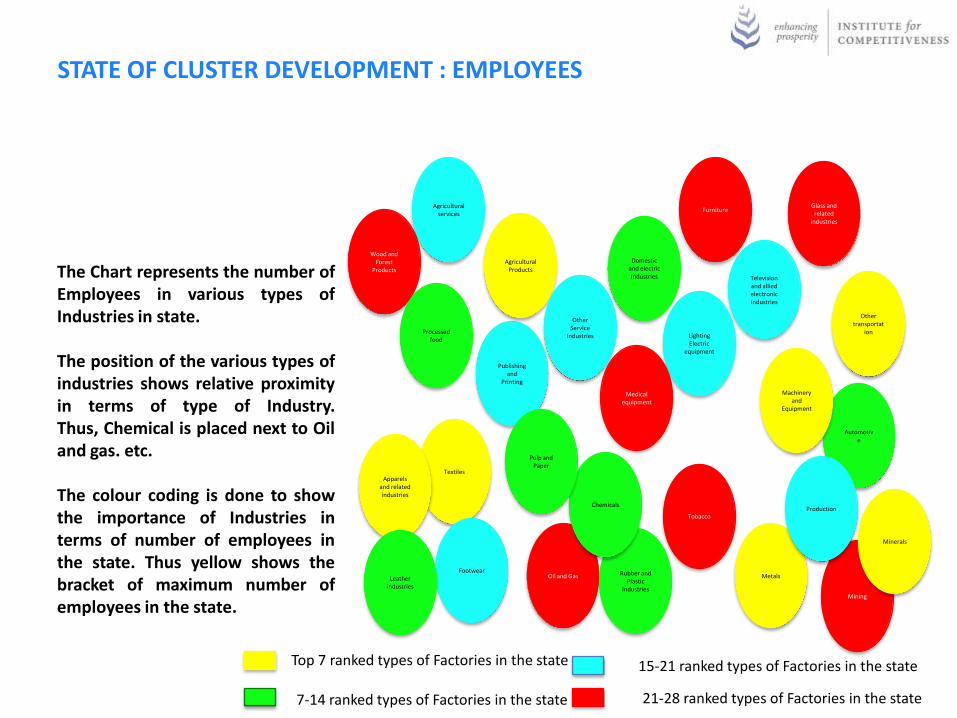
Top 7 ranked types of Factories in the state
7-14 ranked types of Factories in the state
15-21 ranked types of Factories in the state
21-28 ranked types of Factories in the state
The Chart represents the number ofEmployees in various types ofIndustries in state.
The position of the various types ofindustries shows relative proximityin terms of type of Industry.Thus, Chemical is placed next to Oiland gas. etc.
The colour coding is done to showthe importance of Industries interms of number of employees inthe state. Thus yellow shows thebracket of maximum number ofemployees in the state.
STATE OF CLUSTER DEVELOPMENT : EMPLOYEES
Mining
TextilesApparels
and related industries
Publishing and
Printing
Glass and related
industries
Footwear
Lighting Electric
equipment
Minerals
Tobacco
Automotive
Oil and Gas
Medical equipment
Furniture
Other transportat
ion
Leather industries
Wood and Forest
Products
Rubber and Plastic
Industries
Television and allied electronic industries
Processed food
Chemicals
Pulp and Paper
Agricultural Products
Agricultural services
Other Service
Industries
Machinery and
Equipment
Metals
Domestic and electric Industries
Production
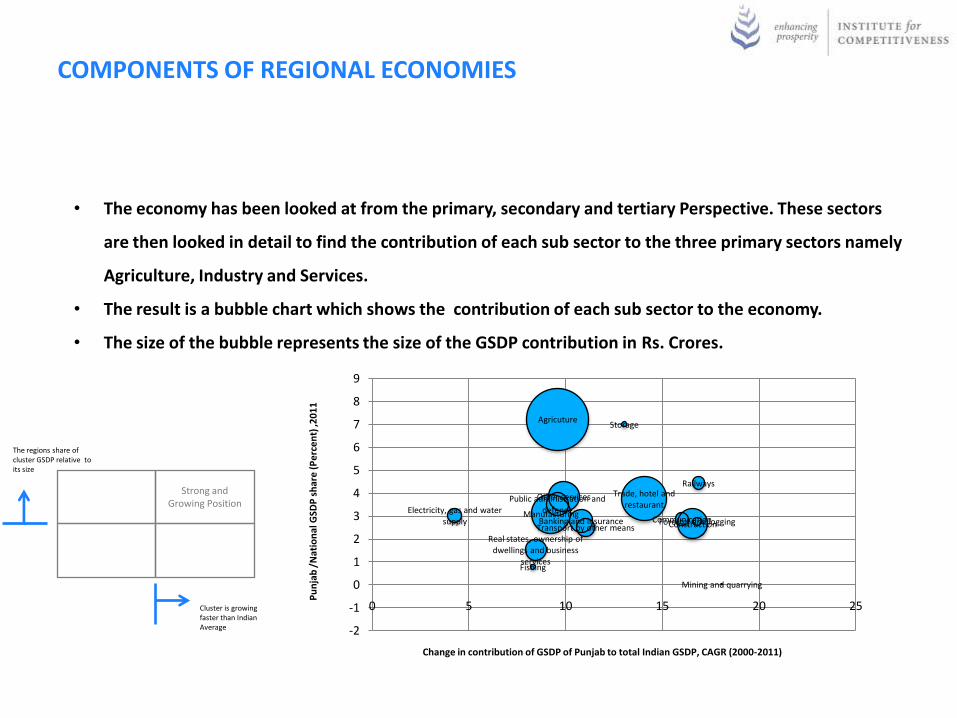
• The economy has been looked at from the primary, secondary and tertiary Perspective. These sectors
are then looked in detail to find the contribution of each sub sector to the three primary sectors namely
Agriculture, Industry and Services.
• The result is a bubble chart which shows the contribution of each sub sector to the economy.
• The size of the bubble represents the size of the GSDP contribution in Rs. Crores.
Strong and Growing Position
Cluster is growing faster than Indian Average
The regions share of cluster GSDP relative to its size
COMPONENTS OF REGIONAL ECONOMIES
Pu
nja
b /
Nat
ion
al G
SDP
sh
are
(P
erc
en
t) ,2
01
1
Change in contribution of GSDP of Punjab to total Indian GSDP, CAGR (2000-2011)
Agricuture
Banking and insurance CommunicationConstruction
Electricity, gas and water supply
Fishing
Forestry and logging Manufacturing
Mining and quarrying
Other servicesPublic administration and defence
Railways
Real states, ownership of dwellings and business
services
Storage
Trade, hotel and restaurant
Transport by other means
-2
-1
0
1
2
3
4
5
6
7
8
9
0 5 10 15 20 25

• Clusters are geographically proximate
groups of interconnected companies and
associated institutions in a particular field.
Examples include chemical and
pharmaceutical clusters in Gujarat and
apparel and diamond cluster in Surat.
Clusters and sub clusters taken for the study
are taken at the end of this report.
• Employment by cluster gives a more
detailed profile of the activities in the state
economy that make up the Job Base. It can
be used to understand the importance of
the health of various groups of Industries on
the overall prosperity of the region.
EMPLOYMENT BY A CLUSTER
0 20000 40000 60000 80000 100000
Machinery and equipment
Agriculture Products
Textiles
Minerals
other transportation
Apparels and related Industries
Metals
Rubber and Plastic Industries
Food Processing
Chemical
Automotive
Domestic and electric industries
Pulp and Paper
Leather Industries
other service industries
Television and allied electronic …
Agriculture services
Production
Lighting and electric equipment
Footwear
Printing and Publishing
Wood and forest Products
Medical
Furniture
Glass Industries
Oil and Gas
Mining
Tobacco
80852
67911
57178
46670
41810
36432
24728
19174
14582
13691
13264
11363
9761
6677
6429
6174
5647
4053
2147
1871
1747
1737
936
332
311
220
0
0

• The political boundaries of a state often encompass many distinct regional economies or portions of
large regional economies. A comprehensive approach to economic development should reflect both
the distinct economies within the state as well as strong linkages to the economies in the neighboring
states. In addition to this clusters should be mapped on areas of high economic growth. This will lead
to spillover effects in the long run.
• A state's or region’s economy can be divided
into 3 components namely
1. Primary/Agriculture sector
2. Secondary/Industry sector
3. Tertiary/Service sector
In this report we focus more on Industrial sector to bring out its components in detail.
GSD
P in
Rs.
Cro
re
A BRIEF NOTE OF THE REGIONS AND OVERALL ECONOMY OF PUNJAB
58869 41309 80863
924340
1492375
2549085
0
500000
1000000
1500000
2000000
2500000
3000000
Agriculture, forestry and fishing Industry Services
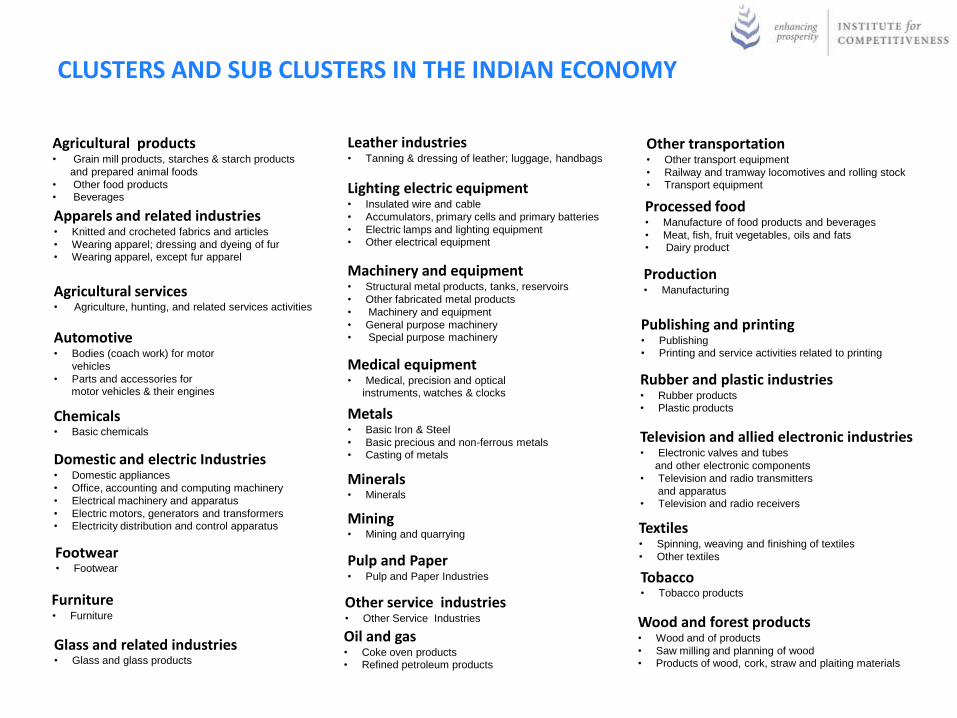
Agricultural products• Grain mill products, starches & starch products
and prepared animal foods
• Other food products• Beverages
Apparels and related industries• Knitted and crocheted fabrics and articles
• Wearing apparel; dressing and dyeing of fur• Wearing apparel, except fur apparel
Agricultural services• Agriculture, hunting, and related services activities
Automotive• Bodies (coach work) for motor
vehicles
• Parts and accessories formotor vehicles & their engines
Chemicals• Basic chemicals
Domestic and electric Industries• Domestic appliances
• Office, accounting and computing machinery
• Electrical machinery and apparatus
• Electric motors, generators and transformers• Electricity distribution and control apparatus
Footwear• Footwear
Furniture• Furniture
Glass and related industries• Glass and glass products
Leather industries• Tanning & dressing of leather; luggage, handbags
Medical equipment• Medical, precision and optical
instruments, watches & clocks
Metals• Basic Iron & Steel
• Basic precious and non-ferrous metals• Casting of metals
Lighting electric equipment• Insulated wire and cable
• Accumulators, primary cells and primary batteries
• Electric lamps and lighting equipment• Other electrical equipment
Minerals• Minerals
Machinery and equipment• Structural metal products, tanks, reservoirs
• Other fabricated metal products
• Machinery and equipment
• General purpose machinery• Special purpose machinery
Other service industries• Other Service Industries
Mining• Mining and quarrying
Processed food• Manufacture of food products and beverages
• Meat, fish, fruit vegetables, oils and fats• Dairy product
Publishing and printing• Publishing• Printing and service activities related to printing
Rubber and plastic industries• Rubber products• Plastic products
Production• Manufacturing
Pulp and Paper• Pulp and Paper Industries
Wood and forest products• Wood and of products
• Saw milling and planning of wood• Products of wood, cork, straw and plaiting materials
Textiles• Spinning, weaving and finishing of textiles
• Other textiles
Oil and gas• Coke oven products• Refined petroleum products
Tobacco• Tobacco products
Television and allied electronic industries• Electronic valves and tubes
and other electronic components
• Television and radio transmitters
and apparatus• Television and radio receivers
Other transportation• Other transport equipment
• Railway and tramway locomotives and rolling stock• Transport equipment
CLUSTERS AND SUB CLUSTERS IN THE INDIAN ECONOMY


![for [Project Name] - Punjab, Pakistan€¦ · Government of the Punjab Punjab Power Development Board Energy Department Page 6 Policy Punjab Power Generation Policy-2006 (Revised-2009)](https://static.fdocuments.in/doc/165x107/5f0703f17e708231d41adfcd/for-project-name-punjab-pakistan-government-of-the-punjab-punjab-power-development.jpg)