PUNCHING SHEAR STRENGTH AND DEFORMATION CAPACITY...
16
Al-Qadisiya Journal For Engineering Sciences, Vol. 7……No. 1 ….2014 18 PUNCHING SHEAR STRENGTH AND DEFORMATION CAPACITY OF R.C. SLABS WITH DIFFERENT PATCH LOAD AREAS Lect. Aamer Najim Abbas Dr. Husain Khalaf Jarallah Lecturer Lecturer [email protected] [email protected] Department of Civil Engineering College of Engineering Al-Mustansiriya University Baghdad-Iraq ABSTRACT The main objective of this paper was to evaluate the effect of using different supporting areas or patch loads on a reinforced concrete slab within the slab-column connections. The increasing of the punching shear strength and deformation capacity when subjected to patch load was studied here. An experimental study was carried out on reinforced concrete slabs under a central patch load with circular, square and rectangular shapes of patch areas. A single concrete mix design was used throughout the test program. All of slab specimens were reinforced with distributed mesh reinforcement with equal steel ratios in both directions. The validation of the experimental work was made by analyzing the tested slabs by finite element method under cracking load. The results obtained by the finite element method were found to compare well with those obtained experimentally. In order to calculate the ductility for the tested slabs, the punching load has been determined by applying the published failure criterion and a load-rotation relationship obtained from semi-empirical relationship for the tested slabs. Conclusions on the influence of patch area on the punching shear capacity of reinforced concrete slabs were drawn. The experimental results confirm that the strength and deformation capacity are slightly influenced by the shape of the patch area. Among all specimens, the slabs with circular shape of patch area exhibited the best performance in terms of ductility and splitting failure. KEYWORDS: concrete slabs; punching shear; patch load, ductility, finite element method. مقاومة القص وقابليةلثاقب احتمسلحة تنية اللخرسات اطالب لهطول ال تاثير البقعة حملسليط مختلفة ت وبمساحاتر نجم عباس.عام م م.د.حسين خلف جاردسة المدنيةة/قسم الهنية الهندسمستنصرية /كلمعة اللجا اصة الخ: سي الهدف الرئي من هذا البحث هو ت قييمسنادثير شكل منطقة ا تا علىمسلحةنية اللخرسا اطاتعمدة في الب ا ولمعرفة مقدارلزيادة امة التشوهلقص ومقاو في قوة احمال. عند تسليط ا العمودلخرسانية معطة ا البتصال في منطقة ا وقد أجريت دراسة
Transcript of PUNCHING SHEAR STRENGTH AND DEFORMATION CAPACITY...
Al-Qadisiya Journal For Engineering Sciences, Vol. 7……No. 1 ….2014
18
PUNCHING SHEAR STRENGTH AND DEFORMATION
CAPACITY OF R.C. SLABS WITH DIFFERENT PATCH LOAD
AREAS Lect. Aamer Najim Abbas Dr. Husain Khalaf Jarallah
Lecturer Lecturer
[email protected] [email protected]
Department of Civil Engineering
College of Engineering
Al-Mustansiriya University
Baghdad-Iraq
ABSTRACT
The main objective of this paper was to evaluate the effect of using different supporting areas or
patch loads on a reinforced concrete slab within the slab-column connections. The increasing of the
punching shear strength and deformation capacity when subjected to patch load was studied here.
An experimental study was carried out on reinforced concrete slabs under a central patch load with
circular, square and rectangular shapes of patch areas. A single concrete mix design was used
throughout the test program. All of slab specimens were reinforced with distributed mesh
reinforcement with equal steel ratios in both directions. The validation of the experimental work
was made by analyzing the tested slabs by finite element method under cracking load. The results
obtained by the finite element method were found to compare well with those obtained
experimentally. In order to calculate the ductility for the tested slabs, the punching load has been
determined by applying the published failure criterion and a load-rotation relationship obtained
from semi-empirical relationship for the tested slabs. Conclusions on the influence of patch area on
the punching shear capacity of reinforced concrete slabs were drawn. The experimental results
confirm that the strength and deformation capacity are slightly influenced by the shape of the patch
area. Among all specimens, the slabs with circular shape of patch area exhibited the best
performance in terms of ductility and splitting failure.
KEYWORDS: concrete slabs; punching shear; patch load, ductility, finite element method.
حمل البقعة تاثيرالهطول للبالطات الخرسانية المسلحة تحت الثاقب وقابلية القص مقاومة
وبمساحات تسليط مختلفة م.د.حسين خلف جارهللا م.عامر نجم عباس
الجامعة المستنصرية /كلية الهندسة/قسم الهندسة المدنية
:الخالصة
مقدار ولمعرفة االعمدة في البالطات الخرسانية المسلحة علىتاثير شكل منطقة االسناد قييمتمن هذا البحث هو الهدف الرئيسي
دراسة وقد أجريت في منطقة اتصال البالطة الخرسانية مع العمود عند تسليط االحمال.في قوة القص ومقاومة التشوه الزيادة

Al-Qadisiya Journal For Engineering Sciences, Vol. 7……No. 1 ….2014
18
حديد نسب وقد تم استخدام التسليط. منطقة من شكل مختلف مع بقعية حمالا تحت تحميل خرسانية مسلحة بالطات على تجريبية
ملك نفس المواصفات لجميع النماذج مع سمك متساوي. دقة النتائج المستحصلة من الدراسة ترسانة متساوية بكال االتجاهين مع خ
حدث ت التيال احماالالعملية جاءت معقولة ومقبولة مقارنة بالنتائج التحليلة المستحصلة من التحليل باستخدام العناصرالمحددة تحت
باستخدام معادلة تم عند تسليطهالحمل الذي يتم حساب اليونة تم تحديد .في منطقة الشد في خرسانة النماذج اول تشقق اعنده
الشكل كان .ان شكل منطقة تاثير االحمال يؤثر قليال في مقاومة القصتؤكد النتائج العملية .دراسات اخرىالحصول عليها من
وفشل الخرسانة. اليونة من حيث أفضل أداء التسليط اعطى منطقةل الدائري
1. INTRODUCTION
In flat-plate floors, slab-column connections are subjected to high shear stresses produced by the
transfer of the internal forces between the columns and the slabs (ACI-421.1R-08, 2008; ACI-
421.1-99, 1999). Normally it is desired to increase the slab thickness or using drop panels or
column capitals of exceptionally high strength for shear in reinforced concrete slab around the
supporting column. Occasionally, methods to increase punching shear resistance without modifying
the slab thickness are often preferred (Cheng and Montesinos, 2010). The ways to transfer the
force from column to the slab need to be studied to increase the shear resistance. Several
reinforcement alternatives for increasing punching shear resistance of slab-column connections,
including bent-up bars (Hawkins et al., 1974; Islam and Park, 1976), closed stirrups (Islam and
Park, 1976), shearheads (Corley and Hawkins, 1968), and shear studs (Dilger and Ghali, 1981),
have been evaluated in the past five decades. But there is a little experimental and theoretical
information about the influence of patch area or cross section area shape for supporting column in
the reinforced concrete shear resistance.
The main purpose of this paper is to introduce an experimental study about punching shear strength
and deflection behavior of the reinforced concrete slab with different patch load areas. Validity of
experimental cracking deflection results was checked by analyzing the tested slabs under cracking
load using the finite element method. Accuracy of results of cracking deflections is found to be
reasonable and acceptable. The load –rotation curve was obtained for the tested slabs by using
published semi-empirical relationship (Muttoni, 2003).
2. EXPERIMENTAL PROCEDURE
The experimental result is discussed in this paper.
2.1 Materials
A total of three reinforced concrete slab specimens with loading areas of different shapes have been
used in this study. A single concrete mix was used throughout the test program. The concrete which
is used in the specimens consists of ordinary Portland cement, natural sand and crushed stone
aggregate with maximum size of 10 mm. The water/cement ratio for concrete was 0.25. The mix
proportions for cement, aggregate and water are given in Table (1).
Deformed steel bars of diameter 5 mm were used in the slab panels. The bars are tested to
determine the yield stress, ultimate stress and elongation. The test was carried out according to
(ASTM A615 / A615M, 2003). The steel deformed bars having average yield strength and ultimate
strength of 435MPa and 601MPa respectively.
2.2 Specimen Details
Details of the slab specimens are given in Table (2). Details of slabs with reinforcement
placements and patch load areas shown in the Fig. 1.

Al-Qadisiya Journal For Engineering Sciences, Vol. 7……No. 1 ….2014
18
2.3 Compressive Strength
The code of practice assumes the punching shear resistance is proportional to the nth root of
concrete strength (ACI 318M-08, 2008; BS 8110-Part 1, 1997; NZS 3101-Part 1&2, 1982). In
present work, standard cubes (150 mm) were used according to (BS 1881: Part 116, 1983) and
they are de-molded one day after casting. Testing is carried out at (28) days age. The machine
which is used in the tests is a hydraulic type of (3000) kN capacity. The average compressive
strength of three cube samples was 41 MPa at 28 days.
3. TESTING PROCEDURE
3.1 Test Setup
The slabs are tested under one point load at mid-span as shown in Fig. (2).The four sides of slabs
were supported on bearing rollers on identical spreader plates. Four steel blocks were used at each
corner of the slab as resting supports. These blocks to keep the clear span of 400 mm of all
specimens. During testing, corner angles of each sample were properly anchored by means of
heavy joist, which was connected to structural floor as shown in Fig. (3). There was one dial gage
at the mid-span to measure the central slab deflection as shown in Fig. (4).
3.2 Test Procedure
Before testing, slabs were checked dimensionally, and detailed visual inspection made with all
information carefully recorded. After setting and reading dial gage, loading was applied to
specimen at an approximately constant rate, up to the peak load, at the same time deflections were
measured. Deflection was measured at the center of tested slabs by means of (0.01 mm) dial gage,
and readings from this gage were recorded for each load increment. Failure occurred abruptly in all
specimens and loading was stopped after failure.
4. FINITE ELEMENT MODELING
The theoretical analysis was performed by the finite element package program (SAFE, 2010) under
cracking load only. In this analysis, the shell elements are used. The stresses developed in this
element are shown in Fig. (5).The effect of membrane stresses were included in the finite element
analysis of the slabs due to large deflection before punching shear failure. The edges of the slab
were vertically restrained along four sides in the finite element model, as in the experimental setup.
Further, in the finite element model, the loading was applied within the patch load area of central
portion of slab model at the top surface to simulate actual experimental loading. For the finite
element analysis, the effective flexural rigidity EI taken equal to 0.5EcIg, in which Ec = Young’s
modulus of concrete, and Ig is the second moment of inertia of the gross section. The multiplier 0.5
is in accordance with the multiplier for beam stiffness in (ACI 318M-08, 2008). The finite element
meshed model of a typical slab is shown in Fig. (6). The comparisons between the experimental
and theoretical results of central deflection at cracking stage are shown in Table (3). The results
obtained by the finite element method are found to compare well with those obtained
experimentally.
5. DISCUSSION ON TEST RESULTS
5.1 Observed Damage
At the end of each test, all models were flipped over in order to mark cracks on the bottom
(tension) side of the slab. Fig. (7) shows the crack patterns at the failure stage for all three

Al-Qadisiya Journal For Engineering Sciences, Vol. 7……No. 1 ….2014
18
specimens. All the models underwent punching type of failure. It has also been observed that the
splitting failure with punching shear failure is more likely in slab with rectangular and square
column because of the crack pattern for the main flexural cracks developed directly above the
longitudinal reinforcement of all slabs with rectangular and square columns and that led to bond
splitting before the punching shear failure.
The initial cracking of all the tested slabs was first observed in the tension zone of the slab
near the column stub. In case of square and rectangular columns the initial crack was observed
under the corner of column. The initial cracks appear in slabs with square and rectangular column
faster than in case of circular column because high stress concentration in corners of columns. At
this stage of loading the tensile stress in concrete reached the modulus of rupture value and
cracking started in the zone of maximum tensile stress. The cracking load, failure load and failure
mechanism for all tested specimens are presented in Table (4) below. The slab with rectangular
columns gives minimum values for the cracking load because of the splitting failure.
5.2 Load versus Deflection Relationship
The punching shear load- displacement curves for all slabs are shown in Fig. (8), and the failure
punching shear loads are listed in Table (4). According to these results, when the cracks start
developing, deflections in the slabs increase at a faster rate, and continues to increase without an
appreciable increment in load. Finally the deflection increases without any additional load and the
dial gage starts to move very rapidly. The maximum deflection of slab with circular column is less
than the slab with rectangular and square column. The load-deflection curves showed a slight
difference in the deformation behavior under loading for all slabs. When a reinforced concrete slab
is subjected to a gradual increase in load, the deflection increases linearly with the load in an elastic
manner. After the cracks start developing, deflection in the slab increases at a faster rate. After
cracks have developed in the slab, the load-deflection curve is approximately linear up to the
yielding of flexural reinforcement after which the deflection continues to increase without an
appreciable increment in load.
6. MOMENT CURVATURE CURVE
Moment-curvature analyses were carried out using the usual assumption that strains vary linearly
across the depth of the section. Longitudinal reinforcement was modeled based on the measured
material properties including strain-hardening. Unconfined concrete (the cover) was modeled based
on stress-strain relations obtained from cubic tests. Moment-curvature calculations were carried out
using the software section designer for (ETABS, 2010).In the moment curvature curve, the
measured yield strength of the reinforcing steel and the cylinder compressive strength of the
concrete were used. The moment curvature relationships for tested slabs thicknesses is given in Fig.
(9).
7. YIELD-LINE ANALYSIS
The flexural strength for moment curvature curve derived at ultimate strain for concrete moment
has been used to derive the peak load in the yield line analysis. The expected flexural failure
mechanism for simply supported slab with a point load at the center is illustrated in Fig. (10).The
relationship between the moment Strength and applied central peak load estimations using yield-
line analysis is given as follow;
(3)

Al-Qadisiya Journal For Engineering Sciences, Vol. 7……No. 1 ….2014
18
where m is the nominal flexural strength moment for the slab and P is the applied load.
Table (5) shows the experimental peak load and flexural capacity calculated from a yield-line
analysis for each specimen. The load, normalized by the slab flexural capacity from the yield-line
analysis, versus deflection response for the test specimens is presented in Fig. (11).The result from
a yield-line analysis gives a lower bound estimation of the strength of the slab due to the absence of
the membrane action.
8. INFLUENCE OF PATCH LOAD AREA ON DEFLECTION CAPACITY
The effect of the patch area shape in the deflection capacity of the test specimens was evaluated
through the ratio ΔR/ΔRc, where ΔRc refers to the deflection of the specimen S1C with circular patch
load area at peak load. ΔR, on the other hand, is the deflection at peak load for each test specimen.
The calculated values of ΔR, ΔRc and ΔR/ΔRc are given in Table (6). Among all specimens,
Specimens S3R exhibited the best performance with an increase of 36% in deflection capacity
compared to Specimens S1C.
9. ENERGY ABSORPTION
Energy absorption capacity of the test specimens was evaluated based on the area under the
normalized punching shear stress versus deflection response (Cheng, 2009), where the vertical axis
was selected as the normalized shear stress, ( √ )⁄ and the horizontal axis
represents the vertical deflection (Fig. (12)), where; bo = perimeter of critical section for shear
(mm), d = distance from extreme compression fiber to centroid of longitudinal tension
reinforcement (mm) and specified compressive strength of concrete cylinder (MPa). Table (7)
summarizes the energy values were calculated according to the area under the curves shown in Fig.
(12) for each specimen. It can be noticed that the specimens with rectangular patch area had better
energy absorption ability.
10. LOAD-ROTATION RELATIONSHIP
The ductility of slabs failing in punching shear can be obtained by considering a suitable load-
rotation relationship for the slab. (Muttoni, 2003) proposed semi-empirical formal to derive the
load-rotation relationship for the slab as below;
(
) ⁄
(2)
where L is the span of the slab, mRd is the flexural capacity of the slab in the column region reduced
by the strength reduction factor, specified compressive strength of concrete cylinder ; fy is yield
strength of bending reinforcement; Vd load during testing , d = distance from extreme compression
fiber to centroid of longitudinal tension reinforcement and ψ is slab rotation.
Still further, the following failure criterion was proposed for punching shear failures in slabs
without transverse reinforcement (Muttoni, 2008):
( √ )
⁄
(
) (3)

Al-Qadisiya Journal For Engineering Sciences, Vol. 7……No. 1 ….2014
18
where dg0 is a reference diameter of the aggregate admitted as 16mm; dg is the maximum diameter
of the aggregate used in the concrete slab, in mm. Finally the ductility of the reinforced concrete
slab under punching shear can be obtained by using curvature ductility as follow;
(4)
where is the curvature at the end of the post elastic range and is curvature at the first yield.
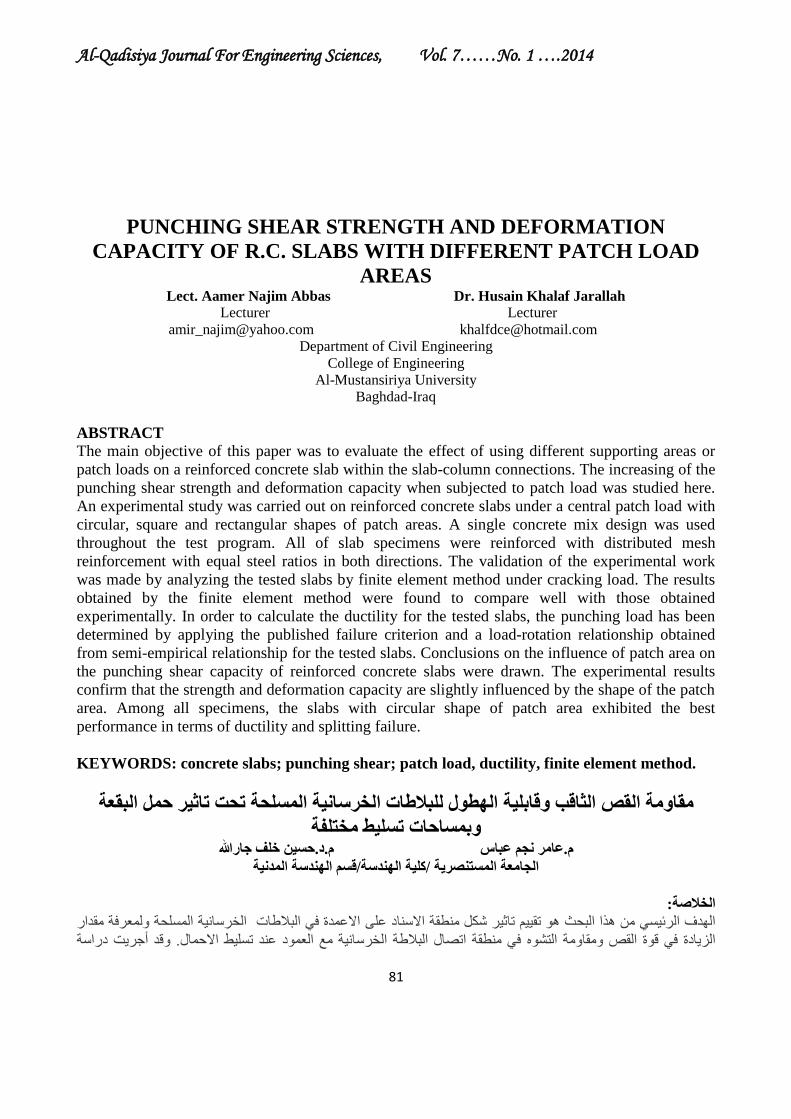
In the present study the value represents the curvature value for the intersection point between
the failure criterion from equation (2) and the load-rotation from equation (1), as define shown in
Fig.(13). The Load-rotation curves and failure criteria for tested slab have been shown in Fig.
(14).Accordingly, the ductility values calculated and show in Table (8) for tested slabs.
11. CONCLUSIONS
The results and conclusions are summarized in the following:
1. With reference to punching shear strength, the experimental results presented within this
paper confirm the influence of the patch area shape on the strength and deformation
capacity of slabs.
2. Validity of the experimental results were checked by analyzing the tested slabs by finite
element method under cracking load. The central deflection results obtained by the finite
element method are found to compare well with those obtained experimentally.
3. The published failure criterion simultaneously determines the punching load and the
rotation capacity of the slab and its ductility.
4. Circular column is needed to be use in order to preclude splitting failure in the slabs.
5. The shape of patch load area had a significant influence on the ductility for reinforced
concrete slab. Higher ductility has been observed for slab with circular shape of patch load
area.
6. The behavior of punching shear reinforcing systems is slightly influenced by the shape of
patch load area.
7. The yield analysis and experimental results shows that the flexural behavior is slightly
influenced by the shape of patch load area for reinforced concrete slab.
8. The slab with rectangular shape of patch area had better energy absorption ability because
of the larger plastic rotations sustained, since this slab has shorter the length of span in
direction that moments are being applied. This specimen showed larger deformation
capacity.
12. REFERENCES
1. American Concrete Institute, ACI 421.1R-08, 2008,"Guide to Shear Reinforcement for
Slabs”, reported by joint ACI-ASCE Committee 421.
2. American Concrete Institute, ACI 421.1R-99, 1999,"Shear Reinforcement for Slabs”,
reported by joint ACI-ASCE Committee 421.

Al-Qadisiya Journal For Engineering Sciences, Vol. 7……No. 1 ….2014
18
3. American Concrete Institute, ACI Committee 318, 2008,"Building Code Requirements
for Structural Concrete (ACI 318M-08) and Commentary", Forming ton Hill,
Michigan, 107 PP.
4. ASTM Standards: A615/A615M-03, 2003, "Standard Specification for Deformed and
Plain Billet-Steel Bars for Concrete Reinforcement", ASTM International, 100 Barr
Harbor Drive, West Conshohocken, PA 19428-2959, USA.
5. British Standards Institution, 1983, "Method for Determination of Compressive Strength
of Concrete Cubes (BS 1881: Part 116: 1983)", British Standards Institution, London.
6. British Standards Institution, 1997, "Code of Practice for Design and Construction (BS
8110: Part 1: 1997)", British Standards Institution, London.
7. Cheng, M. and Montesinos, G., 2010, "Evaluation of Steel Fiber Reinforcement for
Punching Shear Resistance in Slab-Column Connections—Part I: Monotonically
Increased Load", ACI Structural Journal, V. 107, No. 1, January-February.
8. Cheng, M., 2009,"Punching Shear Strength and Deformation Capacity of Fiber
Reinforced Concrete Slab-Column Connections under Earthquake-Type Loading",
Ph.D. thesis, Department of Civil Engineering, The University of Michigan, USA.
9. Corley, W. G., and Hawkins, N. M., 1968, "Shear Head Reinforcement for Slabs", ACI
Journal, Proceedings V. 65, No. 10, Oct., pp. 811-82.
10. Dilger, W. H., and Ghali, A., 1981, "Shear Reinforcement for Concrete Slabs", Journal
of the Structural Division, ASCE, V. 107, No. ST12, pp. 2403-2420.
11. ETABS Plus Version 9.7.1, 2010, "Extended 3-D Analysis of Building Systems",
Computer and Structures, Inc., Berkeley, CA, USA.
12. Hawkins, N. M.; Mitchell, D.; and Sheu, M. S., 1974, "Cyclic Behavior of Six Reinforced
Concrete Slab-Column Specimens Transferring Moment and Shear", Progress Report
1973-74 on NSF Project GI-38717, Department of Civil Engineering, University of
Washington, Seattle, WA, Sept.
13. Islam, S., and Park, R., 1976, "Tests of Slab-Column Connections with Shear and
Unbalanced Flexure", Journal of the Structural Division, ASCE, V. 102, No. ST3, pp.
549-569.
14. Muttoni, A., 2003, "Shear and Punching Strength of Slabs without Shear
Reinforcement", Beton-und Stahlbetonbau, V. 98, No. 2, Berlin, Germany, pp. 74-84. (in
German).

Al-Qadisiya Journal For Engineering Sciences, Vol. 7……No. 1 ….2014
11
15. Muttoni, A.,2008, "Punching Shear Strength Of Reinforced Concrete Slabs Without
Transverse Reinforcement", ACI Structural Journal, Farmington Hills, Mich., Vol. 105,
No. 4, pp.440-450.
16. SAFE Version 12.3.1, 2010, "Slab Analysis by the Finite Element Method", Produced
and Distributed by Computers & Structures, Inc. ,1995 University Avenue, Berkeley,
California 94704, USA.
17. Standards Association of New Zealand, 1982, "Code of Practice for Commentary on:
The Design of Concrete Structures (NZS 3101:1982, Part 1 and 2)", Standard Council,
New Zealand.
Table 1: Mix Proportions
Cement kg/m3 Sand kg/m
3 Gravel kg/m
3 Water kg/m
3
570 680 1040 143
Table (2): Specimen Details
Specimen
Dimensions of Slab
Specimen
(Lengthxwidthxthickness)mm
Patch Load
Shape
Patch Load
Area
Dimension
(mm)
Bottom
Reinforcement in
Each Direction
(No.-mm Ø)
S1C 450x450x30 Circular 22 dia. 4-Ø5
S2S 450x450x30 Square 25x25 4-Ø5
S3R 450x450x30 Rectangular 15x32.5 4-Ø5
Table (3): Comparison of Central Deflection at Cracking Stage
Specimens Cracking
Load(kN)
Experimental
Δcr(mm)
Theoretical
Δcr (mm) ΔExp./ ΔTheo.
S1C 5 0.74 0.72 1.03
S2S 7 0.85 1.12 0.76
S3R 4 0.56 0.51 1.10
Table (4): The Cracking Load, Failure Load and Failure Mechanism
Specimen Cracking Load(kN) Failure Load(kN) Failure Mechanism
S1C 8 17 Punching Shear
S2S 7 16.5 Punching Shear(Splitting)
S3R 4 16.5 Punching Shear(Splitting)

Al-Qadisiya Journal For Engineering Sciences, Vol. 7……No. 1 ….2014
18
Table (5) Strength Estimations using Yield-Line Analysis
Specimen Peak Load(kN)
Peak Load for
Yield-Line
Analysis(kN)
Test/Yield-Line
S1C 17 10.7 1.59
S2S 16.5 10.7 1.54
S3R 16.5 10.7 1.54
Table (6): Comparison of Deflection Capacities
Specimens ΔR (mm) ΔR/ΔRc
S1C 10 1.0
S2S 12.5 1.25
S3R 13.6 1.36
Table (7): Energy Absorption
Specimens Normalized Energy Energy/S1C Energy
S1C 6.27 1.0
S2S 6.44 1.03
S3R 6.74 1.07
Table (8): Ductility
Specimens ψm % ψy % µψ
S1C 1.215E-04 6.379E-06 19.05
S2S 1.162E-04 10.005E-06 11.61
S3R 1.162E-04 9.9234E-06 11.71
4-Ø5 each way
400 mm
450 mm
Loading block
(Patch area)
400
mm
450
mm
X X
Loading block (Patch area)
Smooth Rod
(25 mm)
30 m
m
(a) Plane View
(b) Section X-X
4-5 mm each
way
Fig. (1): Details of a Typical Model of Slab with Reinforcement.

Al-Qadisiya Journal For Engineering Sciences, Vol. 7……No. 1 ….2014
89
Fig. (2): Test Setup.
Fig.(3): Support of the Test Setup.
Fig. (4): One Dial Gauges are Below the Center of Slabs.

Al-Qadisiya Journal For Engineering Sciences, Vol. 7……No. 1 ….2014
88
g
Fig.(5): Three Dimensional Plane Shell Element ( a- Axial Stress, b- Bending Stress, c- Total
In-plane Stress, d- Shear Stress, e- Twisting Stress, f- Total Shear Stress, g- Stress
Conventions for Thin Plane Shell Element).
Simply supported edge
Sim
ply
support
ed e
dge S
imply
supported
edge
Simply supported edge
450 m
m
450 mm
Fig. (6): Mesh Modelling of a Typical Slab.
Fig. (7): Cracking Pattern on the Bottom Surface of a Model Slab.

Al-Qadisiya Journal For Engineering Sciences, Vol. 7……No. 1 ….2014
88
0 2 4 6 8 10 12 14Deflection(mm)
0
2
4
6
8
10
12
14
16
18
Load
(k
N)
Circular Shape of Patch Area
Square Shape of Patch Area
Rectangular Shape of Patch Area
Pcr for Circular Shape of Patch Area
Pcr for Square Shape of Patch Area
Pcr for Rectangular Shape of Patch Area
Fig. (8): Load-Deflection Curves of Tested Model.
0 0.0005 0.001 0.0015 0.002 0.0025Curvature
0
100
200
300
400
500
600
Mom
ent (N
.m)
Fig. (9): Moment Curvature Curves.
30 m
m
Section dimensions and properties used in
moment curvature calculations.
4-5 mm each way
450 mm

Al-Qadisiya Journal For Engineering Sciences, Vol. 7……No. 1 ….2014
88
Simply supported edge
Loading block
(Patch area)
Sim
ply
su
pp
ort
ed e
dg
e
Sim
ply
sup
po
rted ed
ge
Simply supported edge
m
45
0 m
m
450 mm
m
m
25 mm
25
mm
Fig. (10) Assumed Yield-Line Pattern for Test Specimens.
0 4 8 12 16Deflection (mm)
0
0.4
0.8
1.2
1.6
2
Pte
st/P
Yie
ld-L
ine
Circular Shape of Patch Area
Square Shape of Patch Area
Rectangular Shape of Patch Area
Fig. (11) Normalized Load versus Deflection Response.

Al-Qadisiya Journal For Engineering Sciences, Vol. 7……No. 1 ….2014
88
0 4 8 12 16Deflection (mm)
0
0.2
0.4
0.6
0.8
1
Nor
mal
ized
Pun
chin
g S
hear
Str
ess
Circular Shape of Patch Area
0 4 8 12 16Deflection (mm)
0
0.2
0.4
0.6
0.8
1
Nor
mal
ized
Pun
chin
g S
hear
Str
ess
Square Shape of Patch Area
0 4 8 12 16Deflection (mm)
0
0.2
0.4
0.6
0.8
1
Nor
mal
ized
Pun
chin
g S
hear
Str
ess
Rectangular Shape of Patch Area
Fig. (12): ( √ )⁄ and the Vertical Deflection Curve.

Al-Qadisiya Journal For Engineering Sciences, Vol. 7……No. 1 ….2014
88
Fig. (13): Design Procedure to Check The Punching Strength of a Slab (Muttoni, 2008).
Al-Qadisiya Journal For Engineering Sciences, Vol. 7……No. 1 ….2014
88
0 4E-005 8E-005 0.00012 0.00016 0.0002
ø[%]
0
4
8
12
16
20
Pu
nch
ing
Lo
ad
(kN
)
Circular Shape of Patch Area
Load-Rotation curve of the Slab
Failure Criterion
0 4E-005 8E-005 0.00012 0.00016 0.0002
ø[%]
0
4
8
12
16
20
Pu
nch
ing
Lo
ad
(kN
)
Square Shape of Patch Area
Load-Rotation curve of the Slab
Failure Criterion
0 4E-005 8E-005 0.00012 0.00016 0.0002
ø[%]
0
4
8
12
16
20
Pu
nch
ing
Lo
ad
(kN
)
Rectangular Shape of Patch Area
Load-Rotation curve of the Slab
Failure Criterion
Fig. (14): Load-Rotation Curves and Failure Criteria for Tested Slabs.