Punching Shear Behaviour of Slab-Column Edge Connections ...
220
Punching Shear Behaviour of Slab-Column Edge Connections Reinforced with Fibre-Reinforced Polymer (FRP) Composite Bars by Mohammed Galal Osman Mohammed El-Gendy A Thesis submitted to the Faculty of Graduate Studies of The University of Manitoba in partial fulfillment of the requirements of the degree of MASTER OF SCIENCE Department of Civil Engineering University of Manitoba Winnipeg, MB, Canada Copyright © 2014 by Mohammed Galal El-Gendy
Transcript of Punching Shear Behaviour of Slab-Column Edge Connections ...
Punching Shear Behaviour of Slab-Column Edge Connections Reinforced
with Fibre-Reinforced Polymer (FRP) Composite Bars
by
Mohammed Galal Osman Mohammed El-Gendy
A Thesis submitted to the Faculty of Graduate Studies of
The University of Manitoba
in partial fulfillment of the requirements of the degree of
MASTER OF SCIENCE
Department of Civil Engineering
University of Manitoba
Winnipeg, MB, Canada
Copyright © 2014 by Mohammed Galal El-Gendy

Abstract
i
ABSTRACT
Recently, the use of fibre reinforced polymers (FRP) as an alternate to conventional steel has
proved to be an effective solution to the corrosion problem. However, FRP reinforcing bars have
a relatively low axial and transverse stiffness compared to steel bars which results in a lower
shear capacity of FRP reinforced concrete (RC) elements compared to the steel-RC elements.
Flat plate systems are commonly used in structures like parking garages to take advantages of the
absence of beams. They, however, are susceptible to punching shear failure where the column
along with a surrounding part of the slab suddenly punches through the remainder of the slab.
An experimental program was conducted at the University of Manitoba to investigate the
influence of different parameters on the punching shear behaviour of slab-column edge
connections. Nine full-scale isolated slab-column edge connections were constructed and tested
to failure. One connection was reinforced with steel flexural reinforcement, six with GFRP
flexural reinforcement and two with GFRP flexural and shear reinforcement. The parameters
investigated were the flexural reinforcement type and ratio, the moment-to-shear ratio and the
spacing of the stud shear reinforcement.
The test results showed that GFRP-RC connections can undergo significant deformations leading
to an ample warning before the brittle punching failure. Also, the well-anchored shear studs
managed to control the propagation of diagonal shear cracks and transferred the mode of failure
from a brittle punching shear mode to a deformable flexural mode.

ii
To Mom and Dad,
I hope this achievement gets me a step closer to making you proud of me.

Table of Contents
iii
ACKNOWLEDGMENTS
First of all, I would like to express my sincere gratitude and appreciation to my advisor Dr. Ehab
El-Salakawy, PEng, Professor and Canada Research Chair in Durability and Modernization of
Civil Structures, Department of Civil Engineering, University of Manitoba. He has been a
tremendous mentor for me. I would like to thank him for trusting and encouraging me. His
academic and personal advices have been priceless.
I would also like to thank my colleagues for their continuous support specially Mohamed
Hasaballa and Karam Mahmoud whose comments and suggestions were remarkable.
The financial support provided by the Natural Science and Engineering Research Council of
Canada (NSERC) through Discovery and Canada Research Chair programs is gratefully
acknowledged.
My experimental program would have never been completed without the help and assistance of
the W. R. McQuade structures laboratory technical staff, Chad Klowak, PEng, Brenden Pachal
and Grant Whiteside during the construction and testing of the specimens.
A huge “thank you” to my dear friends Ahmed Hamdi Sakr, Mohammed Mady and Evan Coy
for their priceless assistance, to my friends Ahmed Radwan and Ahmed Ghazy for their support
and to my friend Khaled Ahmed, without him I wouldn’t have started my graduate studies.
At last, but definitely not least, I would like to thank my family. All the words in the world
cannot describe how grateful I am for your sacrifices. Your wishes and prayers gave me the
strength to persevere and warmed my heart.
Mohammed Galal El-Gendy, September 2014

Table of Contents
iv
TABLE OF CONTENTS
ABSTRACT ............................................................................................................... I
ACKNOWLEDGMENTS .......................................................................................III
TABLE OF CONTENTS ........................................................................................ IV
LIST OF TABLES ................................................................................................ VIII
LIST OF FIGURES ................................................................................................ IX
LIST OF NOTATIONS ........................................................................................ XIII
CHAPTER 1: INTRODUCTION .............................................................................. 1
1.1. BACKGROUND .............................................................................................................. 1
1.2. PROBLEM DEFINITION ............................................................................................... 3
1.3. SCOPE OF WORK .......................................................................................................... 5
1.4. OBJECTIVES .................................................................................................................. 6
1.5. WORK METHODOLOGY.............................................................................................. 7
1.6. THESIS ORGANIZATION ............................................................................................. 7
CHAPTER 2: LITERATURE REVIEW ................................................................... 9
2.1. INTRODUCTION ............................................................................................................ 9
2.2. PROPERTIES OF FRP COMPOSITE BARS ............................................................... 10
2.2.1. Physical Properties .................................................................................................. 10
2.2.2. Mechanical Properties ............................................................................................. 11
2.3. ONE-WAY SHEAR (BEAM ACTION) ....................................................................... 14
2.3.1. Pre-Cracking Behaviour.......................................................................................... 14
2.3.2. Post-Cracking Behaviour ........................................................................................ 16

Table of Contents
v
2.3.3. Shear Strength Provided by Concrete ..................................................................... 17
2.3.4. Shear Strength Provided by Reinforcement (The Truss Analogy) ......................... 18
2.4. TWO-WAY SHEAR (PUNCHING SHEAR) ............................................................... 20
2.4.1. Mechanism of Punching Shear Failure ................................................................... 20
2.4.2. Slab-Column Connections Transferring Shear and Unbalanced Moment .............. 24
2.4.3. Methods of Analysis ............................................................................................... 24
2.5. PUNCHING SHEAR REINFORCEMENT................................................................... 30
2.6. BUILDING CODES PROVISIONS FOR PUNCHING SHEAR ................................. 31
2.6.1. Steel-RC Slab-Column Connections....................................................................... 32
2.6.2. FRP-RC Slab-Column Connections ....................................................................... 36
2.7. RESEARCH ON STEEL-RC SLAB-COLUMN CONNECTIONS ............................. 39
2.7.1. Effect of Flexural Reinforcement Ratio .................................................................. 39
2.7.2. Effect of Shear Reinforcement (Stud Shear Reinforcement) .................................. 40
2.7.3. Effect of Moment-to-Shear Ratio ........................................................................... 40
2.8. YIELD LINE THEORY................................................................................................. 41
2.9. RESEARCH ON FRP-RC SLAB-COLUMN CONNECTIONS .................................. 44
2.9.1. Previously Proposed Design Models ...................................................................... 44
2.9.2. Effect of Different Parameters ................................................................................ 46
CHAPTER 3: EXPERIMENTAL PROGRAM .......................................................52
3.1. GENERAL ..................................................................................................................... 52
3.2. MATERIALS ................................................................................................................. 52
3.2.1. Concrete .................................................................................................................. 52
3.2.2. Flexural Reinforcement .......................................................................................... 52

Table of Contents
vi
3.2.3. Shear Reinforcement ............................................................................................... 53
3.3. TEST CONNECTIONS ................................................................................................. 54
3.4. TEST INSTRUMENTATION ....................................................................................... 63
3.4.1. Reinforcement Strain Gauges ................................................................................. 63
3.4.2. PI-Gauges and Concrete Strain Gauges .................................................................. 64
3.4.3. Load Cells ............................................................................................................... 64
3.4.4. Linear Variable Differential Transducers (LVDTs) ............................................... 65
3.5. TEST SET-UP AND PROCEDURE ............................................................................. 66
CHAPTER 4: EXPERIMENTAL RESULTS AND DISCUSSION .......................71
4.1. GENERAL ..................................................................................................................... 71
4.2. SERIES I - EFFECT OF FLEXURAL REINFORCEMENT RATIO ........................... 71
4.2.1. Cracking Pattern and Mode of Failure .................................................................... 72
4.2.2. Deflections .............................................................................................................. 77
4.2.3. Flexural Reinforcement and Concrete Strains ........................................................ 82
4.2.4. Punching Shear Capacity ........................................................................................ 86
4.2.5. Code Comparisons .................................................................................................. 88
4.3. SERIES II - EFFECT OF FLEXURAL REINFORCEMENT TYPE............................ 89
4.3.1. Cracking Pattern and Mode of Failure .................................................................... 89
4.3.2. Deflections .............................................................................................................. 91
4.3.3. Flexural Reinforcement and Concrete Strains ........................................................ 95
4.3.4. Punching Shear Capacity ........................................................................................ 97
4.3.5. Code Comparisons .................................................................................................. 99
4.4. SERIES III - EFFECT OF MOMENT-TO-SHEAR RATIO....................................... 100

Table of Contents
vii
4.4.1. Cracking Pattern and Mode of Failure .................................................................. 100
4.4.2. Deflections ............................................................................................................ 108
4.4.3. Flexural Reinforcement and Concrete Strains ...................................................... 109
4.4.4. Punching Shear Capacity ...................................................................................... 114
4.4.5. Code Comparisons ................................................................................................ 115
4.5. SERIES IV - EFFECT OF SHEAR REINFORCEMENT ........................................... 116
4.5.1. Cracking Pattern and Mode of Failure .................................................................. 116
4.5.2. Deflections ............................................................................................................ 122
4.5.3. Flexural Reinforcement and Concrete Strains ...................................................... 123
4.5.4. Shear Reinforcement Strains................................................................................. 126
4.5.5. Punching Shear Capacity ...................................................................................... 127
4.5.6. Proposed Design Equations for Shear-Reinforced Slab-Column Connections .... 130
4.5.7. Comparisons with the Proposed Equations........................................................... 131
CHAPTER 5: CONCLUSIONS AND FUTURE WORK.....................................133
5.1. SUMMARY AND CONCLUSIONS .......................................................................... 133
5.2. FUTURE WORK ......................................................................................................... 136
REFERENCES .......................................................................................................138
APPENDIX A ....................................................................................................... A-1
APPENDIX B ........................................................................................................B-1
APPENDIX C ........................................................................................................C-1
APPENDIX D ....................................................................................................... D-1

List of Tables
viii
LIST OF TABLES
Table 2.1: Densities of reinforcing bars (ACI Committee 440 2006) .......................................... 11
Table 2.2: Coefficient of thermal expansion (ACI Committee 440 2006) ................................... 11
Table 2.3: Typical tensile properties of reinforcing bars (ACI Committee 440 2006) ................. 12
Table 3.1: Mechanical properties of the used reinforcing bars ..................................................... 53
Table 3.2: Details of test connections ........................................................................................... 57
Table 4.1: Test results for Series I connections ............................................................................ 73
Table 4.2: Actual and normalized failure loads for Series I connections ..................................... 87
Table 4.3: Code comparisons for Series I connections ................................................................. 90
Table 4.4: Test results for Series II connections ........................................................................... 90
Table 4.5: Actual and normalized failure loads for Series II connections .................................... 99
Table 4.6: Code comparisons for Series II connections ............................................................. 101
Table 4.7: Test results for Series III connections ....................................................................... 101
Table 4.8: Actual and normalized failure loads for Series III connections ................................ 115
Table 4.9: Code comparisons for Series III connections ............................................................ 117
Table 4.10: Test results for Series IV connections ..................................................................... 117
Table 4.11: Actual and normalized failure loads for Series IV connections .............................. 129
Table 4.12: Code comparisons for Series IV connections .......................................................... 132

List of Figures
ix
LIST OF FIGURES
Figure 1.1: Typical stress-strain relationship .................................................................................. 2
Figure 1.2: Typical flat plate system............................................................................................... 3
Figure 2.1: One-way and two-way shear (reproduced from Wight and MacGregor 2011) ........... 9
Figure 2.2: Stresses in an uncracked Beam (reproduced from Wight and MacGregor 2011) ...... 15
Figure 2.3: Shear stresses in a cracked beam (reproduced from Wight and MacGregor 2011) ... 17
Figure 2.4: Forces in a cracked beam (reproduced from Wight and MacGregor 2011) ............... 18
Figure 2.5: Truss analogy (reproduced from Wight and MacGregor 2011) ................................. 19
Figure 2.6: In-plane forces in slabs (reproduced from ASCE-ACI Committee 426 1974) .......... 22
Figure 2.7: Forces at inclined cracks (reproduced from ASCE-ACI Committee 426 1974) ........ 23
Figure 2.8: Different punching failures (reproduced from Alexander and Simmonds 1987) ...... 24
Figure 2.9: Linear shear stress distribution (reproduced from ACI Committee 318 2011) .......... 26
Figure 2.10: Truss model (reproduced from Alexander and Simmonds 1987) ............................ 28
Figure 2.11: Shear strut vs. corbel forces (reproduced from Alexander and Simmonds 1987) ... 29
Figure 2.12: Arrangement of shear reinforcement in edge slabs (reproduced from ACI
Committee 318 2011) ............................................................................................... 31
Figure 2.13: Different yield line patterns for slab-column edge connections ............................... 42
Figure 2.14: Moment-curvature response for FRP-RC sections (reproduced from Gar et al.
2014) ........................................................................................................................ 44
Figure 3.1: Ribbed-deformed GFRP stud with headed-ends (dimensions in mm) ....................... 54
Figure 3.2: The portion of slab under consideration ..................................................................... 56
Figure 3.3: Dimensions and flexural reinforcement layout (Dimensions in mm) ........................ 58
Figure 3.4: Column details (Dimensions in mm) ......................................................................... 60

List of Figures
x
Figure 3.5: Stud shear reinforcement layout (Dimensions in mm) ............................................... 61
Figure 3.6: Reinforcement configuration ...................................................................................... 61
Figure 3.7: Strain gauges layout on the flexural reinforcement .................................................... 63
Figure 3.8: Strain gauges layout on the shear reinforcement ........................................................ 64
Figure 3.9: PI-gauges/concrete strain gauges locations ................................................................ 65
Figure 3.10: Typical arrangement of LVDTs (Dimensions in mm) ............................................. 65
Figure 3.11: Test setup (Dimensions in mm) ................................................................................ 67
Figure 4.1: Cracking on the tension face at failure for Series I connections ................................ 74
Figure 4.2: Cracking on the free edge at failure for Series I connections .................................... 77
Figure 4.3: Load-deflection relationship for Series I connections ................................................ 79
Figure 4.4: Reinforcement ratio vs. the post-cracking stiffness factor relationship ..................... 80
Figure 4.5: Load-strain relationship for Series I connections ....................................................... 82
Figure 4.6: Reinforcement strain profile perpendicular to the free edge ...................................... 84
Figure 4.7: Reinforcement strain profile parallel to the free edge ................................................ 85
Figure 4.8: Reinforcement ratio-normalized failure load relationship ......................................... 88
Figure 4.9: Cracking at failure for connection GRD-0.9-XX-0.4................................................. 91
Figure 4.10: Load-deflection relationship for Series II connections ............................................ 92
Figure 4.11: Effective reinforcement ratio vs. post-cracking stiffness ......................................... 93
Figure 4.12: Load-deflection relationship at early load stages ..................................................... 94
Figure 4.13: Load-reinforcement strain at early load stages ......................................................... 94
Figure 4.14: The formation of a crack at the inner column face in connection
GRD-0.9-XX-0.4 ..................................................................................................... 95
Figure 4.15: Load-strain relationship for Series II connections ................................................... 96

List of Figures
xi
Figure 4.16: Reinforcement strain profile for connection GRD-0.9-XX-0.4 ............................... 98
Figure 4.17: Cracking on the tension face at failure for Series III connections ......................... 102
Figure 4.18: Cracking on the free edge at failure for Series III connections .............................. 104
Figure 4.19: Internal diagonal cracks in the direction perpendicular to the free edge at
failure ..................................................................................................................... 104
Figure 4.20: Schematic drawing of the internal cracks ............................................................... 105
Figure 4.21: Shear stress distribution on the shear perimeter ..................................................... 106
Figure 4.22: Expected failure cone (reproduced from Mortin 1989) .......................................... 107
Figure 4.23: Shear stress distribution on the side face of the critical section, perpendicular to the
free edge, at the same shear load level ................................................................... 108
Figure 4.24: Load-deflection relationship for Series III connections ......................................... 108
Figure 4.25: Load-strain relationship for Series III connections ................................................ 109
Figure 4.26: Load-reinforcement strain for connection GSC-0.9-XX-0.2 ................................. 110
Figure 4.27: Load-reinforcement strain at the column face relationship .................................... 111
Figure 4.28: Reinforcement strain profile perpendicular to the free edge for Series III
connections ............................................................................................................. 113
Figure 4.29: Reinforcement strain profile parallel to the free edge for Series III connections .. 114
Figure 4.30: Effect of moment-to-shear ratio on the normalized failure load ............................ 115
Figure 4.31: Concrete crushing at the compression face of the slab for Series IV connections . 118
Figure 4.32: Cracking on the tension face at failure for Series IV connections ......................... 119
Figure 4.33: Internal cracks in the direction perpendicular to the free edge at failure ............... 120
Figure 4.34: Schematic drawing of the internal cracks ............................................................... 121
Figure 4.35: Cracking on the free edge at failure for Series IV connections .............................. 122

List of Figures
xii
Figure 4.36: Load-deflection relationship for Series IV connections ......................................... 123
Figure 4.37: Load-strain relationship for Series IV connections ................................................ 124
Figure 4.38: Reinforcement strain profile perpendicular to the free edge for Series IV
connections ............................................................................................................. 125
Figure 4.39: Reinforcement strain profile parallel to the free edge for Series IV connections .. 126
Figure 4.40: Strains in studs vs. distance from column face perpendicular to the free edge ...... 128
Figure 4.41: Strains in studs vs. distance from column face parallel to the free edge ................ 129

List of Notations
xiii
LIST OF NOTATIONS
a depth of equivalent rectangular stress block
A effective tension area of concrete surrounding the flexural tension reinforcement and
extending from the extreme tension fibre to the centroid of the flexural tension
reinforcement and an equal distance past that centroid, divided by the number of bars
Ab area of an individual reinforcing bar
Af area of longitudinal FRP reinforcement on the flexural tension side of a member
Ag gross area of section
As area of longitudinal steel reinforcement on the flexural tension side of a member
Avf area of FRP shear reinforcement within a distance s
Avs area of steel shear reinforcement within a distance s
b width of cross section
bb band width of reinforced concrete slab extending a distance 1.5h past the sides of the
column
bo perimeter of critical section for shear in slabs
b1 width of the critical section for shear in slabs measured in the direction of the span for
which unbalanced moments are determined
b2 width of the critical section for shear in slabs measured in the direction perpendicular to
b1
c distance from extreme compression fibre to neutral axis
c1 size of rectangular shear cross section in slabs measured in the direction of the span for
which moments are being determined

List of Notations
xiv
c2 size of rectangular shear cross section in slabs measured in the direction perpendicular to
c1
C compression component of the bending moment acting on a section
d distance from extreme compression fibre to centroid of tension reinforcement
db diameter of reinforcing bar
dc distance from extreme tension fibre to centre of the longitudinal bar located closest to it
D.L. dead loads
e distance from centroid of section for critical shear in slabs to the point where shear stress
is being calculated
Ec modulus of elasticity of concrete
Ef modulus of elasticity of FRP reinforcement
Es modulus of elasticity of steel reinforcement
fc’ specified compressive strength of concrete
ffu ultimate strength of FRP reinforcement
fpcd design compressive strength of concrete (according to JSCE 2007)
fr modulus of rupture of concrete
fs calculated stress in reinforcement at specified loads
fy specified yield strength of steel longitudinal reinforcement
fyv specified yield strength of steel shear reinforcement
hs overall thickness of a slab
I moment of inertia of section about centroidal axis
Icr moment of inertia of cracked section
Ie effective moment of inertia

List of Notations
xv
Ig moment of inertia of gross concrete section about centroidal axis, neglecting the
reinforcement
jd flexural lever arm (distance between tension and compression components of the bending
moment applied at a section)
J property of the critical shear section of slabs analogous to the polar moment of inertia
deformability factor for slab-column connections
k ratio of c to d
kb coefficient dependent on the reinforcing bar bond characteristics
ki pre-cracking stiffness factor
kp post-cracking stiffness factor
k1 bar location factor used for calculating development length
k2 coating factor used for calculating development length
k3 concrete density factor used for calculating development length
k4 bar size factor used for calculating development length
k5 welded deformed wire fabric factor used for calculating development length
ld development length of reinforcement
ln length of clear span in the direction that moments are being determined, measured face-
to-face of supports
L centre-to-centre spacing between columns
L.L. live load
mx bending moment per unit length on a section perpendicular to the x-axis
my bending moment per unit length on a section perpendicular to the y-axis
Mcr cracking moment

List of Notations
xvi
Mf unbalanced moment about the centroid of the critical shear section in slabs
Mn nominal flexural strength at section
Mp equivalent plastic moment used in yield line theory calculations
Mr factored moment resistance
Ms moment due to specified loads
Mu factored moment at section
n number of items
nf ratio of modulus of elasticity of FRP bars to modulus of elasticity of concrete
ns ratio of modulus of elasticity of steel bars to modulus of elasticity of concrete
Q first moment of inertia about the centroidal axis of the part of the cross section farther
from the centroidal axis than the point where the shear stresses are being calculated, used
for one-way shear calculations
s maximum centre-to-centre spacing of transverse reinforcement
spacing of headed shear reinforcement measured perpendicular to bo
T Tension component of the bending moment acting on a section
u peripheral length of the column (according to JSCE 2007)
up peripheral length of the design cross-section at d/2 from the column face (according to
JSCE 2007)
vc shear stress resistance provided by the concrete
vf factored shear stress
vn nominal shear stress
vr shear stress resistance
vs shear stress resistance provided by shear reinforcement

List of Notations
xvii
Vc nominal shear strength provided by concrete
Vf factored shear force
Vflex predicted flexural failure load of a connection
Vn nominal shear strength
Vpcd design punching shear capacity (according to JSCE 2007)
Vr shear force resistance
Vs nominal shear strength provided by shear reinforcement
VTest actual failure load of a connection
VPred predicted failure load of a connection
Vu factored shear force at section
wf factored load per unit area
x centroidal x-axis of a critical section
y centroidal y-axis of a critical section
yt distance from centroidal axis of gross section, neglecting reinforcement, to extreme fibre
in tension
z quantity limiting distribution of flexural reinforcement
α factor takes into account the eccentricity of the shearing force (according to JSCE 2007)
αs factor that adjusts vc for support dimensions
α1 ratio of average stress in rectangular compression block to the specified concrete strength
βc ratio of long side to short side of column
β1 ratio of depth of rectangular compression block to depth to the neutral axis
γb partial safety factor (according to JSCE 2007)
γc density of concrete

List of Notations
xviii
γf fraction of unbalanced moment transferred by flexure at slab-column connections
γv fraction of unbalanced moment transferred by eccentricity of shear at slab-column
connections
Δs deflection of a member at service
Δu curvature of a member at ultimate
εcu maximum strain at the extreme concrete compression fibre at ultimate
εfu ultimate strain of FRP reinforcement
εs strain in steel reinforcement
εy yield strain in steel reinforcement
λ factor to account for low-density concrete
ρ flexural reinforcement ratio
ρb balanced flexural reinforcement ratio
σ normal stress
φ resistance factor applied to a specified material property or to the resistance of a member
which for the limit state under consideration takes into account the variability of
dimensions and material properties, quality of work, type of failure and uncertainty in the
prediction of resistance (according to CAN/CSA A23.3-04)
Ψs curvature of a section at service
Ψu curvature of a section at ultimate
Chapter 1: Introduction
1
CHAPTER 1: INTRODUCTION
1.1. BACKGROUND
Reinforced concrete structures are usually reinforced with conventional steel reinforcement.
Steel, in the presence of moisture, is subjected to a significant durability problem which is
corrosion. Initially, the alkaline nature of concrete protects the steel reinforcement against
corrosion by providing a thin passive film that surrounds the steel reinforcement (Neville 1995).
However, when RC structures are subjected to aggressive conditions, e.g., wet/dry cycles,
freeze/thaw cycles and diffusion of de-icing salts through the concrete, this alkaline passive film
is destroyed and the reinforcement is vulnerable to electrochemical corrosion.
Corrosion of steel reinforcement is one of the major durability issues resulting in the
deterioration of structures which increases the number of repair cycles required for a structure to
achieve its service life and, consequently, increases the repair and maintenance costs over the
service life of the structure. In a study published by the U.S. Federal Highway Administration
(Koch et al. 2002), the total annual direct cost of corrosion in the U.S. is estimated to be $276
billion which is approximately 3.1% of the nation’s Gross Domestic Product “GDP”. Of this
cost, 16.4% is related to the corrosion of steel in infrastructures.
Many solutions have been proposed to overcome the corrosion problem such as increasing the
concrete cover, improving the quality of the concrete and the use of different kinds of steel
reinforcement (i.e., stainless steel, epoxy-coated steel and galvanised steel). However, besides
being cost-ineffective, these solutions have managed only to delay the initiation of the corrosion
process; none of them was able to completely prevent it. Recently, the use of fibre reinforced

Chapter 1: Introduction
2
polymers (FRP) composites as an alternate to the conventional steel has proved to be an effective
solution to the corrosion problem.
Corrosion resistance is not the only advantage of FRP composites over conventional steel. They
have many other advantages such as higher longitudinal tensile strength, higher fatigue
endurance, no magnetic conductivity, light-weight, low electrical and thermal conductivity for
certain types of fibres, and versatility of fabrication. On the other hand, unlike steel, FRP
composites exhibit linear-elastic behaviour up to failure, i.e., they do not undergo any ductile
phase in terms of a yielding plateau prior to the brittle rupture as shown in Figure 1.1. Moreover,
FRP reinforcing bars, especially glass (G)FRP bars, have low transverse strength and stiffness
which affects the shear strength of the bars. They also have a relatively low elastic stiffness and
compressive strength compared to steel bars (ACI Committee 440 2006). Due to these
differences, the published design codes and guidelines dealing with steel-RC structures cannot be
directly applied to FRP-RC structures. Experimental investigations must be carried out to verify
the behaviour of concrete elements reinforced with FRP composites.
Figure 1.1: Typical stress-strain relationship
0
0
Str
ess
Strain
GFRP
Steel

Chapter 1: Introduction
3
Much research have been conducted in the last two decades to investigate the behaviour of FRP-
RC members and codes and guidelines for the design of such members have been published
(Japan Society of Civil Engineering 1997; ACI Committee 440 2006; Canadian Standards
Association 2012). However, little research has been conducted to investigate the shear
behaviour of FRP-RC members in general and the punching shear behaviour of FRP-RC flat
plates in particular.
1.2. PROBLEM DEFINITION
Concrete flat plate system is the simplest in terms of formwork construction since the slab is
supported directly by columns (Figure 1.2) and its soffit is continuously flat (Lorenz and
Trygestad 2005). In addition, the absence of beams provides flexibility for partition location and
lower storey heights, which, in turn, results in an increased number of stories for the same height.
This leads to cost saving in partition walls and many other construction details especially in case
of medium and high rise buildings (Fanella 2000).
Figure 1.2: Typical flat plate system
Chapter 1: Introduction
4
Flat plate systems are commonly used in parking garage structures to take advantage of the
absence of beams to allow for more clearance for the vehicles. In North America, parking
garages are very vulnerable to corrosion of steel reinforcement because they are often subjected
to harsh conditions such as freeze/thaw cycles, wet/dry cycles and de-icing salts. As mentioned
earlier, the use of FRP reinforcement instead of the conventional steel reinforcement would
overcome the corrosion problem.
Whether the flat plate system is reinforced with steel or FRP bars, it is susceptible to punching
shear failure where the column along with a surrounding part of the slab suddenly punches
through the remainder of the slab. This type of failure is extremely dangerous because of its
brittle nature which does not give any warning to the occupants of the building before failure.
Furthermore, the failure of one joint in the system may lead to loss of the structure integrity and,
accordingly, a progressive collapse of the whole structure when the adjacent connections fail to
support the additional loads imposed on it (Swamy and Ali 1982).
Punching shear failure occurs as a result of the high shear stresses caused by the inevitable
combination of shear force and bending moment transferred between the slab and the column at
a slab-column connection. The bending moment transfer occurs due to pattern loading
conditions, different lengths of adjacent spans and/or the presence of lateral load. Precise
calculations for the shear stresses at these connections in addition to reasonable predictions of the
punching shear capacities of the connections are essential to prevent the undesirable punching
shear failure.
The effects of different parameters on the punching shear behaviour of steel-RC slab-column
connections have been extensively investigated (Richart 1948; Moe 1961; Vanderbilt 1972;

Chapter 1: Introduction
5
Zaghlool and Rawdon de Paiva 1973; Long 1975; Dilger and Ghali 1981; Swamy and Ali 1982;
Mokhtar et al. 1985; Hawkins et al. 1989; Gardner 1990; Marzouk and Hussein 1991; Alexander
and Simmonds 1992; Shaaban and Gesund 1994; Marzouk et al. 1996, 1998, 2000; Menetrey
1998; El-Salakawy et al. 1998, 2000; Ghannoum 1998; Osman et al. 2000; Dilger et al. 2005;
Ozden et al. 2006; Stein et al. 2007; Widianto et al. 2009; Rizk et al. 2011) and provisions for the
design of such connections have been included in different codes and guidelines (Canadian
Standards Association 2004; Japan Society of Civil Engineering 2007; ACI Committee 318
2011). On the other hand, information on the behaviour of FRP-RC slab-column connections is
relatively limited due to the lack of experimental and analytical studies. Little research has been
conducted to study the punching shear behaviour of FRP-RC slab-column interior connection
(Banthia et al. 1995; El-Ghandour et al. 1999, 2003; Matthys and Taerwe 2000; Ospina et al.
2003; Zaghloul and Razaqpur 2004; El-Gamal et al. 2005; Dulude et al. 2010; Hassan et al.
2013). Moreover, to the author’s best knowledge, only one research study has been done to study
the punching shear behaviour of FRP-RC slab-column edge connections using small scale
specimens reinforced with carbon (C)FRP grid reinforcement (Zaghloul 2007).
1.3. SCOPE OF WORK
There are three different types for slab-column connections depending on their location: interior,
edge and corner connections. The relatively higher moment transferred between the slab and the
column at the edge and corner connections compared to the interior ones makes them more
critical to punching shear failure.
Many solutions have been considered to prevent the punching shear failure for steel-RC slab-
column connections. One of these solutions is using stud shear reinforcement (Dilger and Ghali
1981; Mokhtar et al. 1985; El-Salakawy et al. 2000; Stein et al. 2007). The scope of this

Chapter 1: Introduction
6
experimental study is to investigate the punching shear behaviour of isolated full-scale slab-
column edge connections. The slabs are totally reinforced in flexure with GFRP longitudinal bars
with or without GFRP stud shear reinforcement. The connections are subjected to three different
moment-to-shear ratios (0.2 m, 0.4 m and 0.6 m).
1.4. OBJECTIVES
The objectives of this study are to:
Investigate the punching shear behaviour of GFRP-RC slab-column edge connections with
and without punching shear reinforcement subjected to gravity loads with different
moment-to-shear ratios.
Verify the punching shear provisions in the Canadian Standards Association code
CAN/CSA S806-12 (Canadian Standards Association 2012), the American Concrete
Institute guideline ACI 440.1R-06 (ACI Committee 440 2006) and the Japan Society of
Civil Engineering code JSCE 1997 (Japan Society of Civil Engineering 1997).
Provide recommendations for designers and researchers to predict the punching shear
capacity of GFRP-RC slab-column edge connections with and without punching shear
reinforcement.
In order to achieve these objectives, the effects of the following parameters on the punching
shear behaviour of edge-slab column connections have been studied:
The flexural reinforcement type and ratio.
The presence and spacing of stud shear reinforcement.
The moment-to-shear ratio.

Chapter 1: Introduction
7
1.5. WORK METHODOLOGY
In order to achieve the aforementioned objectives, an extensive experimental study is conducted
in the W. R. McQuade Structures Laboratory at the University of Manitoba. In this study, a total
of nine isolated full-scale GFRP-RC slab-column edge connections are constructed and tested
under gravity loads up to failure. Each connection represents an edge column stub connected to
an isolated portion of a 6500×6500×200 mm slab bounded by the slab edge and the lines of
contraflexure.
1.6. THESIS ORGANIZATION
The thesis consists of five chapters as follows:
Chapter one introduces the problem definition, the specific scope and objectives of the
research, and the methodology followed to achieve these objectives.
Chapter two provides information about FRP composites and their constituent materials, a
comparison between the behaviour of beams and slabs in shear, an overview of the existing
design provisions regarding punching shear in different codes and guidelines for both steel-
RC and FRP-RC slab-column connections, and a critical review of previous research
pertaining to punching shear behaviour of both steel-RC and FRP-RC slab-column
connections.
Chapter three provides a detailed description of the experimental program in terms of the
details of the test connections (dimensions, properties of constituent materials and
reinforcement detailing), the details of the instrumentations used to monitor the behaviour
of the connections during the test (LVDTs, reinforcement and concrete strain gauges, and
PI gauges) and the details of the test setup and test procedure (test frame and hydraulic
machines applying the loads).

Chapter 1: Introduction
8
Chapter four provides the analysis and discussion of the experimental test results in terms
of cracking patterns and mode of failure, strains in the reinforcement and concrete,
deflections, the ultimate punching capacity and comparisons to different code predictions.
Chapter five presents a summary of the work, derived conclusions and recommendations
for future research.
Chapter 2: Literature Review
9
CHAPTER 2: LITERATURE REVIEW
2.1. INTRODUCTION
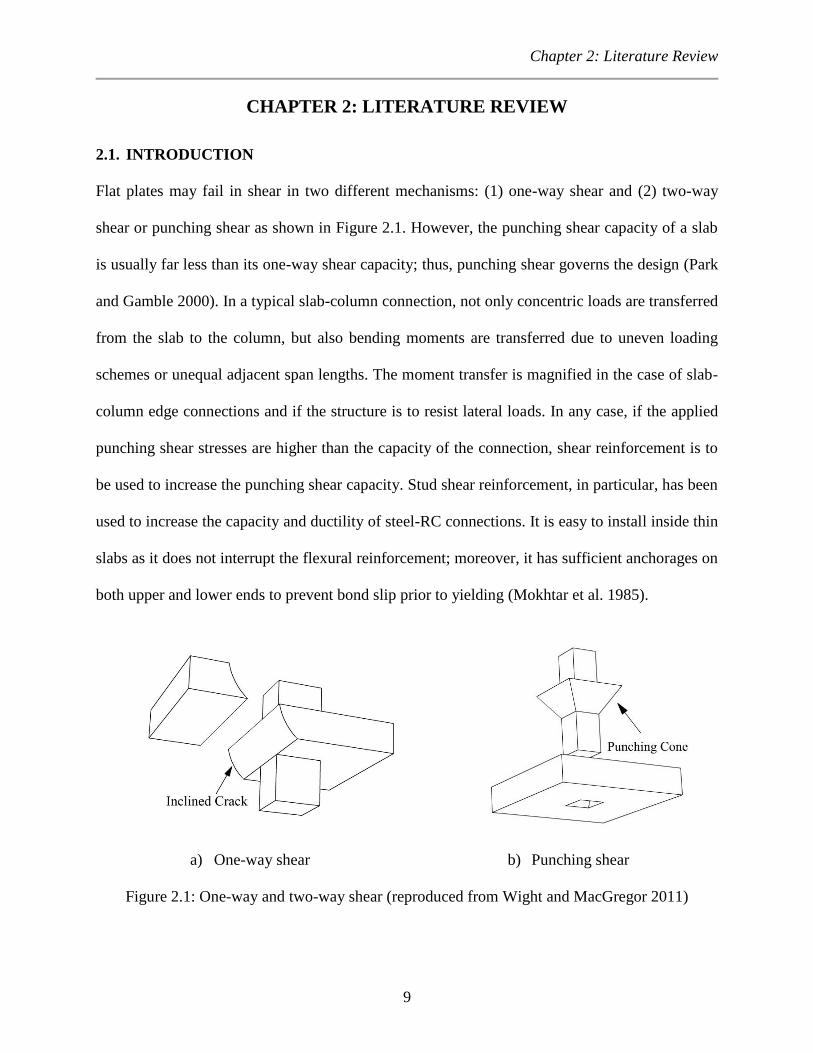
Flat plates may fail in shear in two different mechanisms: (1) one-way shear and (2) two-way
shear or punching shear as shown in Figure 2.1. However, the punching shear capacity of a slab
is usually far less than its one-way shear capacity; thus, punching shear governs the design (Park
and Gamble 2000). In a typical slab-column connection, not only concentric loads are transferred
from the slab to the column, but also bending moments are transferred due to uneven loading
schemes or unequal adjacent span lengths. The moment transfer is magnified in the case of slab-
column edge connections and if the structure is to resist lateral loads. In any case, if the applied
punching shear stresses are higher than the capacity of the connection, shear reinforcement is to
be used to increase the punching shear capacity. Stud shear reinforcement, in particular, has been
used to increase the capacity and ductility of steel-RC connections. It is easy to install inside thin
slabs as it does not interrupt the flexural reinforcement; moreover, it has sufficient anchorages on
both upper and lower ends to prevent bond slip prior to yielding (Mokhtar et al. 1985).
a) One-way shear b) Punching shear
Figure 2.1: One-way and two-way shear (reproduced from Wight and MacGregor 2011)

Chapter 2: Literature Review
10
The behaviour of FRP-RC slab-column connections has been studied starting the late 1990’s. It
was demonstrated that the punching shear capacity of FRP-RC slab-column interior connections
subjected to concentric loads is considerably less than that of steel-RC connections with a similar
flexural strength (Matthys and Taerwe 2000). This conclusion is reasonable since the axial
stiffness and the transverse strength of the FRP bars are relatively less than those of the steel
bars, which reduce the shear capacity of FRP-RC concrete members (El-Sayed et al. 2005).
This chapter presents a detailed discussion of the previous research available on both steel-RC
and FRP-RC slab-column connections with and without shear reinforcement. In addition, a
summary of the punching shear provisions in the current codes and guidelines in North America
and Japan is also presented.
2.2. PROPERTIES OF FRP COMPOSITE BARS
2.2.1. Physical Properties
The American Concrete Institute standard (ACI 440.1R-06) describes two important physical
properties of FRP composites: (1) the density and (2) the coefficient of thermal expansion.
2.2.1.1. Density
The density of the FRP composites is considerably lower than that of steel. Generally, the
specific gravity of FRPs is about one-sixth to one-fourth that of steel reinforcements. Since the
lower the density the lighter the bars are, the transportation and labor costs are considerably
reduced. The densities of different types of reinforcing bars given by the ACI 440.1R-06 are
listed in Table 2.1.

Chapter 2: Literature Review
11
Table 2.1: Densities of reinforcing bars (ACI Committee 440 2006)
Reinforcement type Steel GFRP CFRP AFRP
Density (gm/cm3) 7.9 1.25-2.1 1.5-1.6 1.25-1.4
2.2.1.2. Coefficient of thermal expansion
Unlike steel reinforcement, FRP composites have different coefficients of thermal expansion in
the longitudinal and transverse directions depending on the types of the constituents (fibres and
resin) and the fibre-volume fraction. Furthermore, while the properties of the fibres control the
longitudinal coefficient, the transverse coefficient is dependent on the properties of the resin
(Bank 1993). The coefficients of thermal expansion of different types of reinforcing bars as
given by the ACI 440.1R-06 are listed in Table 2.2. It is noted that the longitudinal coefficient of
thermal expansion for CFRP bars is close to zero, which indicates that CFRP bars are not
affected by changing the temperature. Furthermore, AFRP bars have a negative longitudinal
coefficient of thermal expansion, which means that the length of AFRP bars decreases with
increasing the temperature and increases with decreased temperature.
Table 2.2: Coefficient of thermal expansion (ACI Committee 440 2006)
Reinforcement type Steel GFRP CFRP AFRP
Coefficient
(x106/oC)
Longitudinal 11.7 6 to 10 -9 to 0 -6 to -2
Transverse 11.7 21 to 23 74 to 104 60 to 80
2.2.2. Mechanical Properties
2.2.2.1. Tensile behaviour
FRP composites are brittle in nature. Unlike steel reinforcement, they do not undergo a yielding
plateau prior to rupture when they are loaded in tension. Instead, they exhibit a linear elastic
stress-strain relationship up to failure as shown in Figure 1.1.
Chapter 2: Literature Review
12
Many parameters affect the tensile strength and modulus of an FRP bar; some of them are the
type of fibres and resin, the fibre-volume fraction and the diameter of the bar. Moreover, the
quality control of the manufacturing process also affects the mechanical characteristics (Wu
1990). Consequently, having two bars with the same diameter, made of the same constituent
materials and with the same fibre-volume fraction does not mean that they have the exact same
tensile properties. Accordingly, the tensile properties of FRP composite bars should be obtained
directly from the manufacturer for each batch.
Since most FRP composite bars are made of thermosetting resin which cannot be reshaped after
curing, they cannot be bent after being manufactured. Instead, FRP bent bars can be
prefabricated with bends. In this case, a strength reduction of 40 to 50% in the bend portion
compared with the strength of a straight bar is expected due to stress concentrations (Nanni et al.
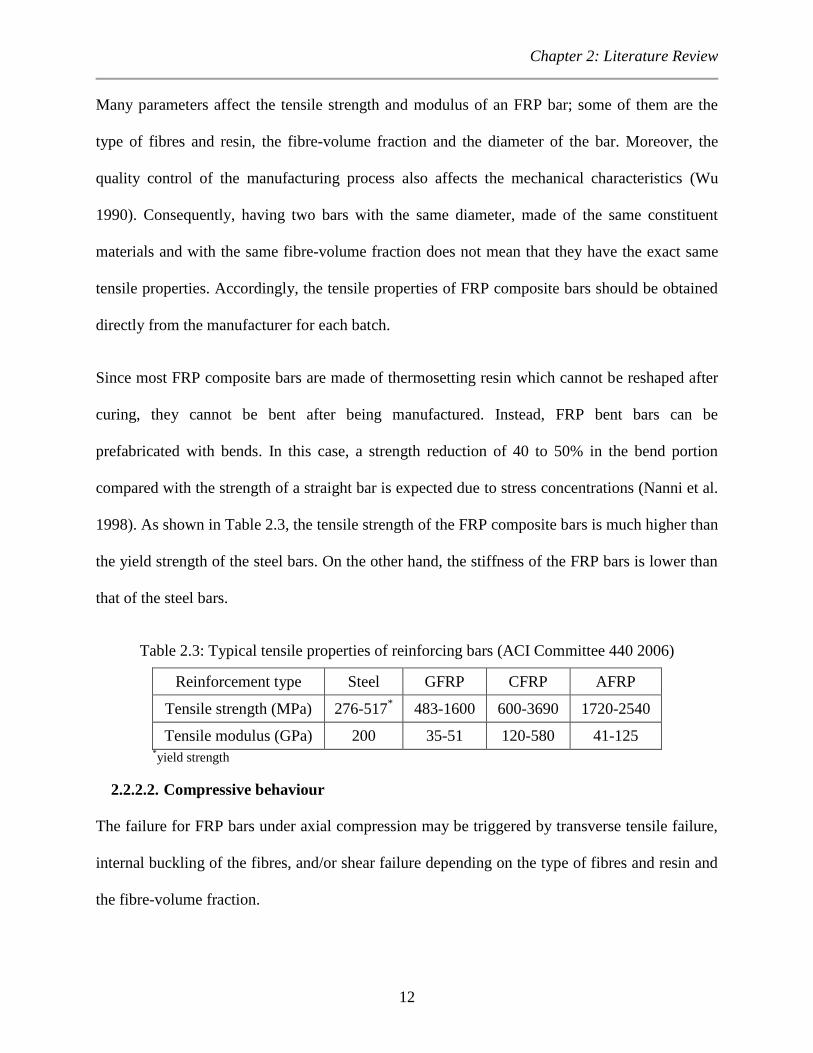
1998). As shown in Table 2.3, the tensile strength of the FRP composite bars is much higher than
the yield strength of the steel bars. On the other hand, the stiffness of the FRP bars is lower than
that of the steel bars.
Table 2.3: Typical tensile properties of reinforcing bars (ACI Committee 440 2006)
Reinforcement type Steel GFRP CFRP AFRP
Tensile strength (MPa) 276-517*
483-1600 600-3690 1720-2540
Tensile modulus (GPa)
200 35-51 120-580 41-125 *yield strength
2.2.2.2. Compressive behaviour
The failure for FRP bars under axial compression may be triggered by transverse tensile failure,
internal buckling of the fibres, and/or shear failure depending on the type of fibres and resin and
the fibre-volume fraction.

Chapter 2: Literature Review
13
The current design documents in North America (Canadian Standards Association 2012) and the
American Concrete Institute guideline (ACI Committee 440 2006) consider the FRP
reinforcement in compression zones to have zero compressive strength. In general, the
compressive strength and compressive modulus of FRP bars is less than the tensile strength and
modulus of the same product.
2.2.2.3. Shear behaviour
In general, FRP bars are weak in interlaminar shear because the resin is usually unreinforced in
the transverse direction of the bar and, consequently, interlaminar shear strength depends on the
weak resin. Placing fibres in the transverse direction across the axial fibres will increase the
shear resistance.
2.2.2.4. Bond behaviour
Bond stresses between the FRP bars and the concrete is transferred by the adhesion between the
concrete and the reinforcing bar (chemical bond), the frictional resistance due to roughness of the
FRP bar’s surface, the bearing of the bar deformations against the concrete (mechanical
bond/interlock), the hydrostatic pressure exerted on the bars due to the shrinkage of the concrete
and the expansion/swelling of the bars when subjected to high temperature (Benmokrane et al.
1996; Cosenza et al. 1997). When an FRP-RC element is tested, the chemical bond mechanism is
the dominant mechanism transferring bond stresses between the concrete and the bars until initial
pullout/slip of the bars; thereafter, frictional bond and mechanical interlock become the
governing mechanisms depending on the surface texture.
The bond behaviour of FRP bars is fairly different from that of steel bars because of the different
surface preparations and the considerable differences in the material properties in both
Chapter 2: Literature Review
14
longitudinal and transverse directions (Cosenza et al. 1997). A reduction of 40% to 10% was
found in the maximum bond strength of GFRP bars compared to steel bars with the same
diameter. This was attributed to the fact that while the main contribution to the bond strength in
case of steel reinforcement comes from the bearing of the bar rips against the concrete; the rips
of the GFRP bars do not provide enough lateral confinement since they have different geometry
and lower shear strength and stiffness than those of steel bars (Benmokrane et al. 1996).
2.3. ONE-WAY SHEAR (BEAM ACTION)
In general, flat plate systems may exhibit two different types of shear failure depending on the
type of loading (distributed load or concentrated load) and the geometry of the slab-column
connections (the size of the column, the thickness of the slab and the presence of column
capitals). These two types are: 1) One-way shear or beam action and 2) Two-way shear or
punching shear. In the one-way shear mechanism, the slab behaves as a wide rectangular beam
where the failure occurs at an inclined crack extending across the entire width of the slab. The
behaviour of beams subjected to shearing stresses can be divided into two stages: 1) pre-cracking
behaviour and 2) post-cracking behaviour.
2.3.1. Pre-Cracking Behaviour
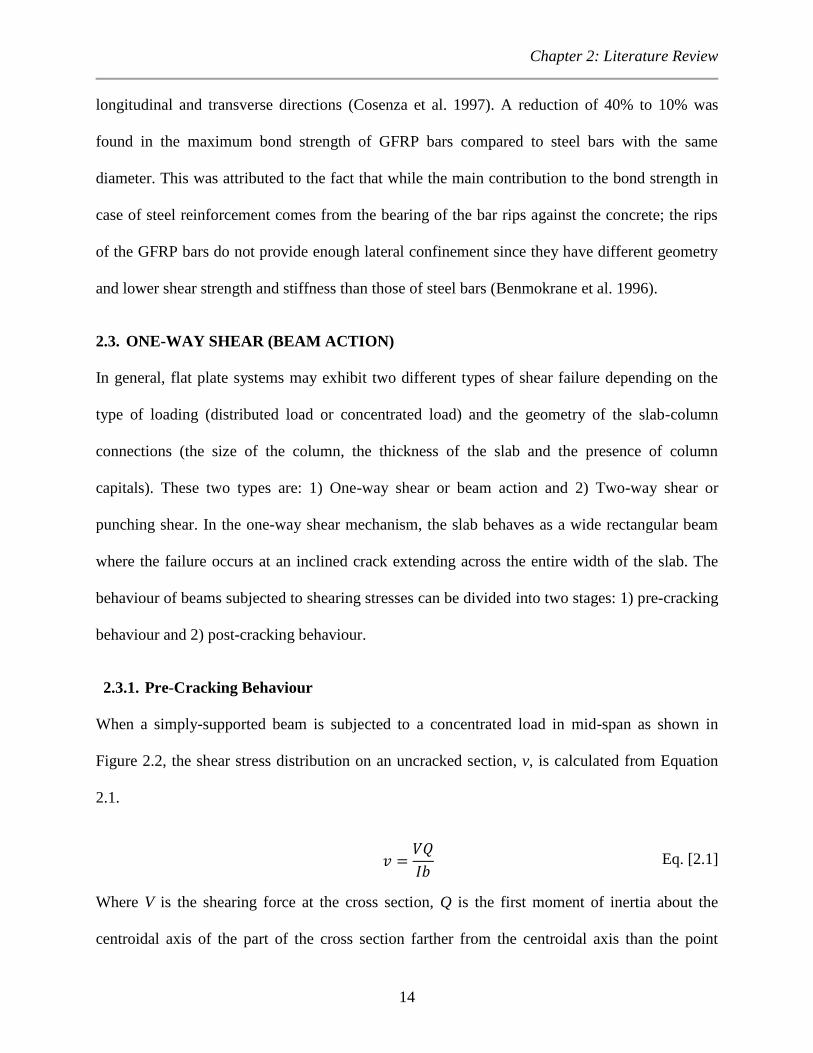
When a simply-supported beam is subjected to a concentrated load in mid-span as shown in
Figure 2.2, the shear stress distribution on an uncracked section, v, is calculated from Equation
2.1.
Eq. [2.1]
Where V is the shearing force at the cross section, Q is the first moment of inertia about the
centroidal axis of the part of the cross section farther from the centroidal axis than the point

Chapter 2: Literature Review
15
where the stresses are being calculated, I is the moment of inertia of the cross section and b is the
width of the cross section.
a) Shear stress distribution
b) Flexural, shear and principal stresses on two elements in the shear span
c) Principal compressive stresses paths in an uncracked beam
Figure 2.2: Stresses in an uncracked Beam (reproduced from Wight and MacGregor 2011)
The orientation of the principal stresses acting on two different elements in the beam is shown in
Figure 2.2b. Following the surfaces on which principal tension stresses act in adjacent elements
gives the cracking pattern shown in Figure 2.2c. The cracks are steeper at the bottom where there

Chapter 2: Literature Review
16
are no shear stresses and the principal tension stress equals the tensile flexural stress acting
parallel to the beam longitudinal axis. The diagonal shear stresses are maximum and the flexural
stresses are zero at the longitudinal axis of the beam and, thus, 45o inclined cracks appear in the
mid-height of the beam. At the top, shear stresses are zero and the flexural stresses are
compressive stresses which cause flatter cracks near the top of the beam (Wight and MacGregor
2011).
2.3.2. Post-Cracking Behaviour
After the beam is cracked, the shear stresses can be calculated from Equation 2.2 and the shear
stress distribution of a cracked section is shown in Figure 2.3. This stress distribution assumes
that about 30% of the shear stresses are transferred through the uncracked portion of the cross
section while the remaining is transferred through the crack mainly by means of aggregate
interlock and dowel action.
Eq. [2.2]
Where jd is the flexural lever arm (distance between tension and compression components of the
bending moment applied at the section).
Shear failure occurs when inclined shear cracks take place. In most cases, vertical flexural cracks
start first at the bottom of the beam and extend to form flexure-shear cracks. However, in certain
cases when the shear span-to-depth ratio is small, shear stresses in the web are considerably
higher than the flexural stresses at the bottom of the beam; thus, a diagonal shear crack occurs
prior to the occurrence of flexural cracks.
Chapter 2: Literature Review
17
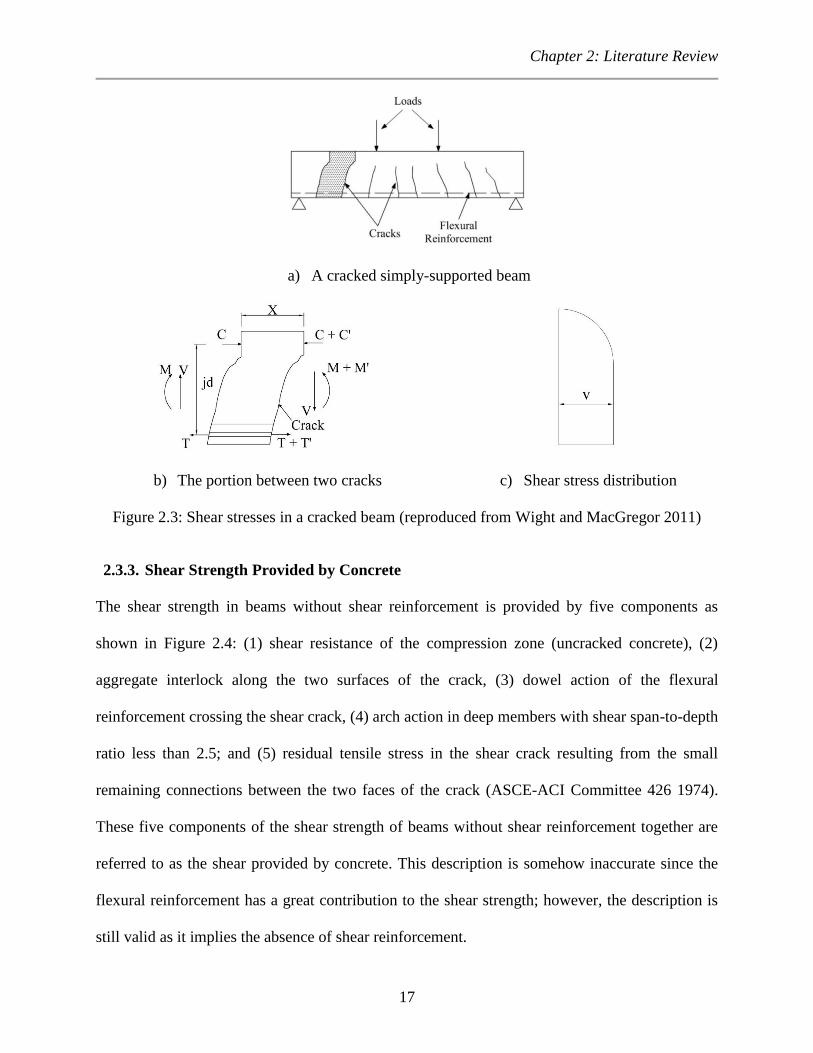
a) A cracked simply-supported beam
b) The portion between two cracks c) Shear stress distribution
Figure 2.3: Shear stresses in a cracked beam (reproduced from Wight and MacGregor 2011)
2.3.3. Shear Strength Provided by Concrete
The shear strength in beams without shear reinforcement is provided by five components as
shown in Figure 2.4: (1) shear resistance of the compression zone (uncracked concrete), (2)
aggregate interlock along the two surfaces of the crack, (3) dowel action of the flexural
reinforcement crossing the shear crack, (4) arch action in deep members with shear span-to-depth
ratio less than 2.5; and (5) residual tensile stress in the shear crack resulting from the small
remaining connections between the two faces of the crack (ASCE-ACI Committee 426 1974).
These five components of the shear strength of beams without shear reinforcement together are
referred to as the shear provided by concrete. This description is somehow inaccurate since the
flexural reinforcement has a great contribution to the shear strength; however, the description is
still valid as it implies the absence of shear reinforcement.

Chapter 2: Literature Review
18
Figure 2.4: Forces in a cracked beam (reproduced from Wight and MacGregor 2011)
The shear strength provided by concrete is affected by the following parameters: (1) the tensile
strength of concrete which determines the cracking load, (2) the flexural reinforcement ratio
which affects the stiffness of the cross section and the shear resistance provided by the dowel
action, (3) the shear span-to-depth ratio which controls the arch action, (4) the beam size which
affects the cracks widths, (5) the presence of axial loads which delay the initiation of cracks and
reduce crack widths in case of compressive forces or speed up the initiation of cracks and
increase the crack widths in case of tensile forces and (6) the size of the coarse aggregate which
controls the roughness of the crack interface.
2.3.4. Shear Strength Provided by Reinforcement (The Truss Analogy)
When the shear strength carried by the concrete is below the flexural strength of the member,
shear reinforcement is to be used to ensure that the member will reach its flexural capacity before
shear failure occurs.
When the beam is loaded, the strains in the stirrups are very low until inclined cracks start to
develop. Therefore, stirrups do not prevent inclined cracks from developing; instead, they control
the propagation and the width of the inclined cracks. As in the case of members without shear
reinforcement, the entire shear is resisted by the whole uncracked section prior to cracking. After

Chapter 2: Literature Review
19
flexural cracking and until inclined cracking, the shear is resisted by the shear strength provided
by the concrete. Once inclined cracks start to propagate, the shear stress is transferred to the
stirrup. Besides carrying shear stresses, stirrups will control the propagation of the inclined
cracks leading to an increase in the aggregate interlock component.
The truss analogy proposed by (Ritter 1899) and (Mörsch 1902) for designing RC beams in shear
provides a great conceptual model to explain the shear forces in a cracked RC beam. As shown
in Figure 2.5, a simple beam with inclined cracks develops internal forces similar to the forces of
a truss, i.e., compressive and tensile forces in the lower and upper flanges, respectively, tensile
forces in the stirrups and diagonal compressive forces in the concrete web between the inclined
cracks. In order to simplify the indeterminate system of forces shown in Figure 2.5a into the
analogous truss shown in Figure 2.5b, some assumptions have to be made. All the stirrups
passing through the inclined crack are lumped together into one vertical truss member. Similarly,
a diagonal truss member represents the diagonal concrete under compression.
a) Internal forces in a cracked beam
b) Pin-jointed truss
Figure 2.5: Truss analogy (reproduced from Wight and MacGregor 2011)
Chapter 2: Literature Review
20
2.4. TWO-WAY SHEAR (PUNCHING SHEAR)
Punching shear failure is a local failure of the slab-column connection or at the locations of
concentrated loads. In slab-column connections, the column along with a pyramid-shape part of
the slab punches through the remainder of the slab as a result of the high shear stresses caused by
the inevitable combination of shear forces and bending moments transferred between the slab
and the column.
The behaviour of slab-column connections is very complex due to the multidimensional
geometry of the connection which precludes the development of simple analysis procedures that
realistically assess the actual stresses condition. Thus, away from the European attempts to
develop models that implement a reasonable facsimile of the actual behaviour (Kinnunen and
Nylander 1960; Kinnunen 1963), most of the available analyses in North America limit the
maximum shear strength of a slab to a value determined empirically from experimental tests.
This value is highly-dependent on the assumed location of the critical section since the critical
section perimeter increases with the distance of the critical section from the column face.
2.4.1. Mechanism of Punching Shear Failure
Similar to the case of one-way shear, once the inclined cracks form in the absence of shear
reinforcement, shear stresses are resisted by the five components of the shear strength provided
by concrete (Section 2.3.3). However, when two-way bending occurs, the ultimate shear strength
of a slab is generally higher than a beam. This increase is attributed to the following five factors:
(1) the distribution of moments, (2) the lack of symmetry, (3) the inadequacy of a simple static
analysis, (4) the in-plane forces generated by restraints provided by the supports and (5) the
interaction of flexural and shear effects (ASCE-ACI Committee 426 1974).

Chapter 2: Literature Review
21
2.4.1.1. Distribution of moments
When a slab-column connection is subjected to a vertical shearing force, the first crack to form is
a tangential flexural crack at the location of maximum radial bending moments, i.e., at the
column face. Radial cracks then extend from the column face towards the supported edges due to
bending moments in the tangential direction. Additional tangential cracks a distance away from
the column face will not form until the applied load increases significantly since the radial
moment decreases rapidly with increasing the distance from the column face. On another hand,
inclined cracks must propagate in the tangential direction (perpendicular to radial cracks). Since
flexural tangential cracks are not located where they can initiate inclined cracks, inclined cracks
tend to originate at the middepth of the slabs and, accordingly, their characteristics are similar to
web-shear cracks rather than flexural-shear cracks in the case of beams.
2.4.1.2. Lack of symmetry
In most cases, orthogonal reinforcement mats are used in slabs. The use of orthogonal
reinforcement mats, rather than circular/radial reinforcement mats, creates a complex pattern of
in-plane forces in the slab (Lenschow and Sozen 1966, 1967). Figure 2.6 shows a part of a slab
with a reinforcing mat at 45o to the direction of the moment, M1. The components of the
reinforcement forces, T, in the y direction are balanced by compression forces in the concrete at
the level of that reinforcement (since the moment in the y direction is zero). This means that in-
plane forces develop in the slab wherever flexural cracks are not parallel to the reinforcing bars.
Such in-plane forces increase the loads for any cracking that develops after the initial tangential
and radial cracks.

Chapter 2: Literature Review
22
a) Moment and reinforcement orientation b) Internal forces at reinforcement level
Figure 2.6: In-plane forces in slabs (reproduced from ASCE-ACI Committee 426 1974)
2.4.1.3. Inadequacy of static analyses
Figure 2.7 shows slab and beam cross sections at the location of the inclined cracks. For the
beam, to satisfy equilibrium requirements, the tensile force, T, in the reinforcement crossing the
inclined crack must equal the compressive force, C, acting above the inclined crack. On the other
hand, for the slab, equilibrium requirements does not require the compressive force, C1, acting
below the inclined crack to equal the tensile force, T1, developed in the reinforcement crossing
the crack; instead, it requires that the summation of the compressive forces developed along the
entire width of the slab, C1+C2, to equal the summation of the tensile forces developed in the
reinforcement along the entire width of the slab, T1+T2. While maintaining equilibrium
requirements, the force C1 can be redistributed and the ratio between C1 and C2 may decrease
with decreasing the depth of the uncracked concrete in the inclined crack location. However,
there is no comparable mechanism for reducing the shear forces at that location. Concentrating
the reinforcement through the failure perimeter may be thought to increase the compressive
force, C1 through increasing the depth of uncracked concrete; however, the force, T1, in that
reinforcement can be balanced by the compressive force developed outside the failure perimeter,
C2.

Chapter 2: Literature Review
23
a) Beam b) Two-way slab
Figure 2.7: Forces at inclined cracks (reproduced from ASCE-ACI Committee 426 1974)
2.4.1.4. In-plane forces generated by restraints
In-plane outward displacements tend to occur in the cracked region of the slab at the column
vicinity. However, these displacements are restrained by the stiffness of the slab surrounding the
failure region and, in turn, in-plane compression forces are developed in the slab. These forces
increase the flexural and shear capacities of the slab-column connection. They, on the other
hand, restrict the rotations of the cross sections and, subsequently, further reduce the
ductility/deformability of the failure mode.
2.4.1.5. Interaction of shear and flexural effects
The critical sections for maximum moment and shear in a slab-column connection coincide at the
column face. Accordingly, moment-shear interaction is expected which makes it very difficult in
most cases to classify the failure as either flexural failure or punching shear failure. Generally,
the failure modes change from flexural failure to punching failure with increasing the slab
reinforcement ratio.
Chapter 2: Literature Review
24
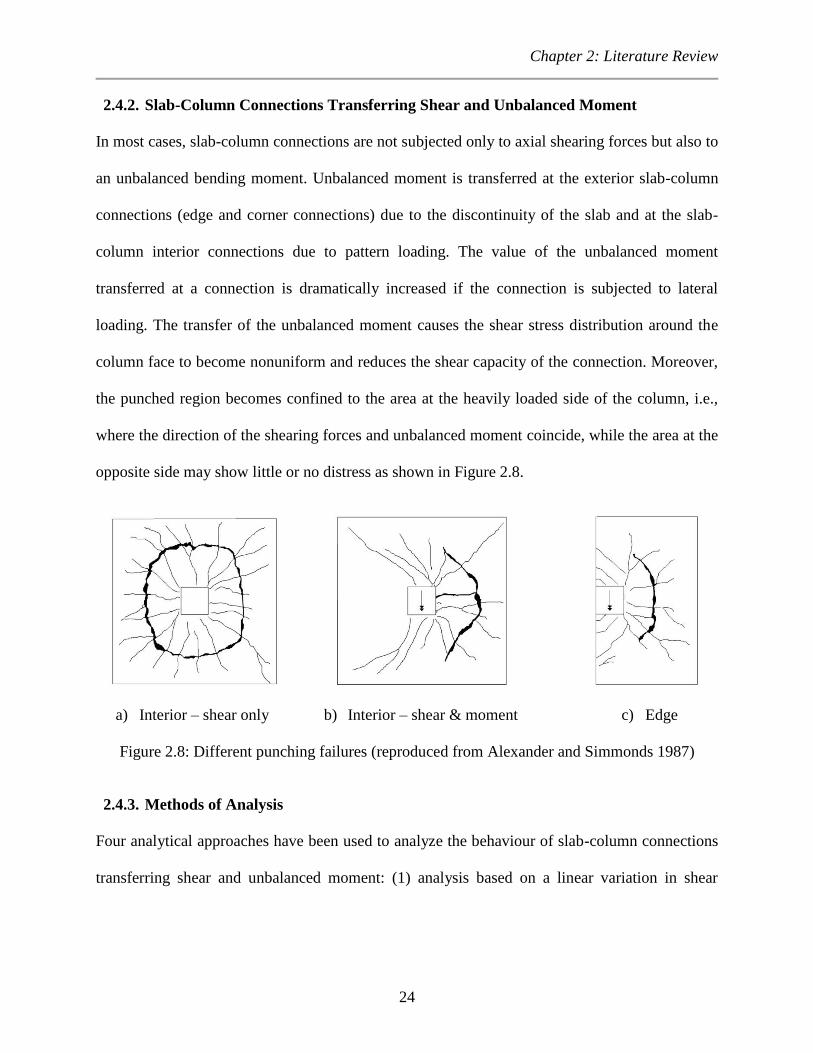
2.4.2. Slab-Column Connections Transferring Shear and Unbalanced Moment
In most cases, slab-column connections are not subjected only to axial shearing forces but also to
an unbalanced bending moment. Unbalanced moment is transferred at the exterior slab-column
connections (edge and corner connections) due to the discontinuity of the slab and at the slab-
column interior connections due to pattern loading. The value of the unbalanced moment
transferred at a connection is dramatically increased if the connection is subjected to lateral
loading. The transfer of the unbalanced moment causes the shear stress distribution around the
column face to become nonuniform and reduces the shear capacity of the connection. Moreover,
the punched region becomes confined to the area at the heavily loaded side of the column, i.e.,
where the direction of the shearing forces and unbalanced moment coincide, while the area at the
opposite side may show little or no distress as shown in Figure 2.8.
a) Interior – shear only b) Interior – shear & moment c) Edge
Figure 2.8: Different punching failures (reproduced from Alexander and Simmonds 1987)
2.4.3. Methods of Analysis
Four analytical approaches have been used to analyze the behaviour of slab-column connections
transferring shear and unbalanced moment: (1) analysis based on a linear variation in shear
Chapter 2: Literature Review
25
stress, (2) analysis based on thin plate theory, (3) analysis based on beam analogies and (4)
analysis based on truss analogies.
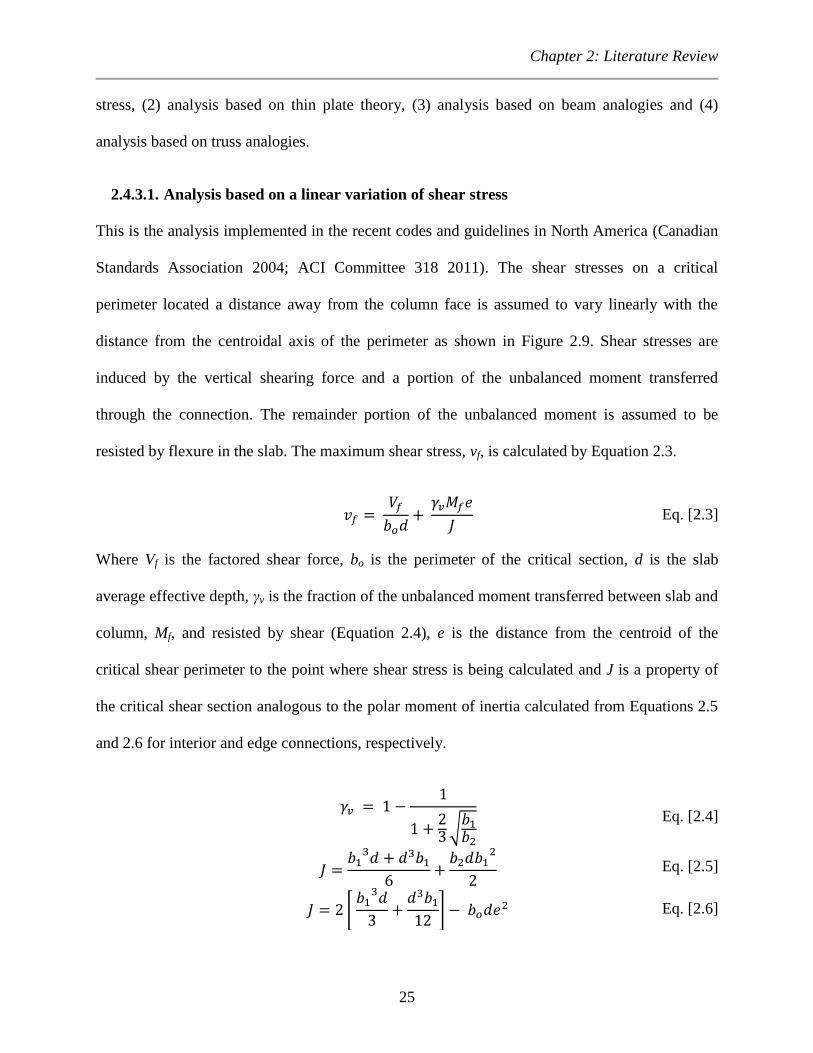
2.4.3.1. Analysis based on a linear variation of shear stress
This is the analysis implemented in the recent codes and guidelines in North America (Canadian
Standards Association 2004; ACI Committee 318 2011). The shear stresses on a critical
perimeter located a distance away from the column face is assumed to vary linearly with the
distance from the centroidal axis of the perimeter as shown in Figure 2.9. Shear stresses are
induced by the vertical shearing force and a portion of the unbalanced moment transferred
through the connection. The remainder portion of the unbalanced moment is assumed to be
resisted by flexure in the slab. The maximum shear stress, vf, is calculated by Equation 2.3.
Eq. [2.3]
Where Vf is the factored shear force, bo is the perimeter of the critical section, d is the slab
average effective depth, γv is the fraction of the unbalanced moment transferred between slab and
column, Mf, and resisted by shear (Equation 2.4), e is the distance from the centroid of the
critical shear perimeter to the point where shear stress is being calculated and J is a property of
the critical shear section analogous to the polar moment of inertia calculated from Equations 2.5
and 2.6 for interior and edge connections, respectively.
√
Eq. [2.4]
Eq. [2.5]
[
] Eq. [2.6]

Chapter 2: Literature Review
26
Where b1 and b2 are the widths of the critical perimeter measured in the direction of the span for
which moments are determined and the perpendicular direction, respectively.
a) Interior connection
b) Edge connection
Figure 2.9: Linear shear stress distribution (reproduced from ACI Committee 318 2011)
2.4.3.2. Analysis based on thin plate theory
This method was proposed in the early 1970s (Mast 1970a; b) to determine the stresses at slab-
column connections based on the flexural theory of elastic plates. Unlike the straight-line shear
stress theory, this method takes into account the shape of the column and the dimensions and
boundary conditions of the slab. The shear stress distribution predicted by this method is
nonlinear for rectangular columns. The predictions of this method are in good agreement with
Chapter 2: Literature Review
27
those of the straight-line shear stress theory for the case of wide, rather than deep, columns, i.e.,
C2 larger than C1. On the contrary, for the case of deep columns, there is a considerable
difference between the predictions of both methods.
2.4.3.3. Analysis based on beam analogies
The slab strips framing orthogonally into each column face are considered to act as beams with
constant widths of C + d or C + d/2, as appropriate. These strips are subjected to shearing force
and bending and torsional moments; thus, they are assumed to be capable of developing their
shearing force and bending and torsional moments at the critical section. The strength of the
connection is then calculated as the summation of the strengths of the four beams. Redistribution
of stresses is permitted between the beams and the failure of the connection is assumed to occur
when ultimate conditions are reached for at least three and two beams for interior and exterior
connections, respectively.
2.4.3.4. Analysis based on truss analogies
The first truss model was introduced to predict the ultimate capacity and load carrying
mechanism of slab-column interior connections without shear reinforcement and subjected to a
combination of shear and unbalanced moment (Alexander and Simmonds 1987; Simmonds and
Alexander 1987). It provides a load path for shear forces in the presence of diagonal cracking
and explains the role of flexural reinforcement in determining shear strength. As shown in Figure
2.10a, the truss model is a three dimensional space truss composed of concrete compression
struts and tension ties. There are two types of compression struts: (1) struts parallel to the plane
of the slab (anchoring struts) and (2) struts inclined at some angle to the plane of the slab (shear
struts). When a slab-column interior connection is subjected to shearing force only, no anchoring
struts develop. The gravity struts on the side faces of the column are gradually replaced by

Chapter 2: Literature Review
28
anchoring struts as the ratio of moment-to-shear increases and, eventually, uplift shear struts
develop at the back side of the column.
a) Struts in an interior connection b) Anchoring struts assembly
Figure 2.10: Truss model (reproduced from Alexander and Simmonds 1987)
Each connection comprises four anchoring struts as shown in Figure 2.10b; the force in each
strut is balanced by two perpendicular reinforcing bars lying in the horizontal plane (one bar is
passing through the column in the direction parallel to the axis about which the unbalanced
moment is acting while the other bar is some distance away from the column). This assembly
indicates that not only the bars passing through the column resist the unbalanced moment, but
also the bars some distance from the column do.
The shear struts assembly is similar to the force diagram generated in a crane corbel as shown in
Figure 2.11. The angle of the shear strut, the magnitude of the tensile force in the reinforcing bar
and the magnitude of the compression force in the concrete strut are all essential to determine the
geometry of the force system. In the case of the corbel, the angle of the shear strut is typically
known since the loading point coincides with the conjunction of the tensile and compressive
forces. On the other hand, the angle of the shear strut is a redundant since the slab is subjected to
distributed loading rather than a concentrated load. Moreover, the vertical component of the

Chapter 2: Literature Review
29
compressive force in the shear strut must be balanced by a tension field within the concrete.
There are two types of shear struts according to their orientation: (1) gravity struts which oppose
the relative downward movement of the slab and are tied by top reinforcing bars and (2) uplift
struts which oppose the relative upward movement of the slab and are tied by bottom reinforcing
bars, if any.
a) Corbel b) Shear strut
Figure 2.11: Shear strut vs. corbel forces (reproduced from Alexander and Simmonds 1987)
Tension struts tie the compression struts to the column. A portion of a tension tie can only be
used by either an anchoring or a shear strut. Thus, a complete shear-moment interaction diagram
can be generated by changing the portions of the tension ties assigned to anchoring and shear
struts. The amount of reinforcing bars participating in the tension tie is not clearly defined.
However, besides all the reinforcing bars passing through the column, it seems reasonable to
assume that the bars at a distance d from the column face are included according to their distance
from the column face, i.e., the contribution of a bar decreases linearly with increasing the
distance from the column face (Alexander and Simmonds 1987). Three failure modes may be
related to the truss analogy: (1) failure of the tension tie, (2) failure of the compression strut and
(3) failure of the vertical (out-of-plan) component of the shear strut.

Chapter 2: Literature Review
30
2.5. PUNCHING SHEAR REINFORCEMENT
If the shear capacity provided by concrete in a slab-column connection is not adequate to resist
the applied shear stress, the punching shear capacity of the connection has to be increased to
insure a ductile/deformable flexural failure rather than a brittle punching shear failure. This can
be achieved by many methods such as: (1) increasing the area of concrete resisting shear stresses,
i.e., increasing the thickness of the slab, providing a drop panel or a column head and/or
increasing the column dimensions, (2) using concrete with higher compressive strength and (3)
providing additional shear strength by placing shear reinforcement at the column vicinity.
Although all these methods provide an increase in the punching shear capacity of the
connections, only properly anchored shear reinforcement increased the ductility/deformability of
the failure mode allowing for large slab-column deformations (Megally and Ghali 2000).
Although shear Reinforcement in the shape of shearheads were introduced in the 1930s (Wheeler
1936), it was not until the 1960s and the 1970s when design provisions for shear reinforcement
were implemented in the ACI code for slabs thicker than 250 mm (ACI Committee 318 1963)
and for thin slabs (ACI Committee 318 1971), respectively.
In a slab-column connection without shear reinforcement, the major inclined crack forms at an
angle of approximately 30-35o with the plane of the slab. When shear reinforcement is present, it
controls the inclined cracks propagation and provides additional confinement to the concrete.
The crack inside the shear reinforced zone forms at a steeper angle of about 45o (Polak et al.
2005). Three main conditions have to be satisfied in order for the shear reinforcement to be
effective: (1) the radial spacing of the reinforcement should be limited to insure that inclined
cracks do not form between two adjacent reinforcing bars, (2) effective anchorage in both
tension and compression zones must be provided for the shear reinforcement especially in thin

Chapter 2: Literature Review
31
slabs and (3) the shear reinforcement should be placed without obstructing the placement of the
flexural reinforcement.
There are three main types of shear reinforcement for steel-RC slab-column connections: (1)
shear reinforcement consisting of bent bars and single- or multiple-leg stirrups (Figure 2.12a),
(2) shear reinforcement consisting of structural steel sections (shearheads) and (3) headed shear
stud reinforcement (Figure 2.12b). Strength and ductility considerations are the main criteria in
choosing the type of shear reinforcement. However, other criteria such as proper anchorage in
thin slabs, the ease of placing in the slab and economy have to be considered (Polak et al. 2005).
a) Stirrup shear reinforcement b) Headed shear stud reinforcement
Figure 2.12: Arrangement of shear reinforcement in edge slabs (reproduced from ACI
Committee 318 2011)
2.6. BUILDING CODES PROVISIONS FOR PUNCHING SHEAR
This section summarizes the provisions for punching shear of both steel-RC and GFRP-RC slab-
column connections in the codes and guidelines in North America and Japan. The discussion will
be limited to the case of slab-column edge connections with stud shear reinforcement. Unlike

Chapter 2: Literature Review
32
interior connections, the design of edge connections always has to consider the transfer of
unbalanced moment due to the discontinuity of the slab.
2.6.1. Steel-RC Slab-Column Connections
While the Japanese code (Japan Society of Civil Engineering 2007) takes into account the effect
of flexural reinforcement ratio on the punching shear capacity, both the North American codes
(Canadian Standards Association 2004; ACI Committee 318 2011) do not include this effect in
calculating the punching shear capacity.
The three codes consider the critical section for punching shear to be located at a distance d/2
from the column face. Thus, the critical section may consist of four, three or two faces in the
cases of slab-column interior, edge or corner connections, respectively. Moreover, the three
codes adopt the linear variation of shear stresses theory discussed in Section 2.4.3.1 in
calculating the applied shear stress.
2.6.1.1. CAN/CSA A23.3-04 (Canadian Standards Association 2004)
The CAN/CSA A23.3-04 requires that the maximum factored shear stress, vf, calculated from
Equations 2.3 through 2.6 should not exceed the factored shear stress resistance, vr.
2.6.1.1.1. Shear stress resistance without shear reinforcement
The factored shear stress resistance, vr, shall be the smallest of Equations 2.7 to 2.9:
(
) √ Eq. [2.7]
(
) √ Eq. [2.8]
√ Eq. [2.9]

Chapter 2: Literature Review
33
Where vc is the factored shear resistance provided by the concrete, βc is the ratio of longer to
shorter side of the column, λ is a factor takes into account the concrete density (1.0 for normal
density concrete), φc is the resistance factor for concrete (0.65), fc’ is the concrete compressive
strength (not to be taken greater than 64 MPa) and αs is a factor takes into account the support
condition (3 for edge connections).
The size factor is considered by multiplying the value obtained from the above three equations
by 1300/ (1300 + d) if the effective depth, d, exceeds 300 mm.
2.6.1.1.2. Shear stress resistance with stud shear reinforcement
In order to provide sufficient ductility, shear reinforcement shall be extended to a distance 2d
from the column face or to the section where the factored shear stress resistance outside the shear
reinforced zone, vf, is not greater than the value specified in Equation 2.10, whichever longer.
√ Eq. [2.10]
Moreover, when properly anchored headed shear reinforcement is provided, vf shall not be
greater than √ . The factored shear stress resistance within the shear reinforced zone,
vr, is the summation of the factored shear resistance provided by the concrete, vc, (Equation 2.11)
and the factored shear resistance provided by the stud shear reinforcement, vs, (Equation 2.12).
√ Eq. [2.11]
Eq. [2.12]
Where φs is the resistance factor for steel (0.85), Avs is the cross-sectional area of the headed
shear reinforcement on a concentric line parallel to the perimeter of the column, fyv is the

Chapter 2: Literature Review
34
specified yield strength of the headed shear reinforcement and s is the radial spacing between the
parallel lines of studs.
The distance between the first line of studs and the column face shall be taken as 0.4d while s
shall be taking according to vf as follows:
When √ , When √
,
2.6.1.2. ACI 318-11 (ACI Committee 318 2011)
The ACI 318-11 requires that the factored shear stress, vu, resulting from the factored shear
force, Vu, and the factored unbalanced moment, Mu, must not exceed the reduced nominal shear
strength, φvn.
2.6.1.2.1. Shear stress resistance without shear reinforcement
The nominal shear stress resistance, Vu, shall be the smallest of Equations 2.13 through 2.15:
(
) √ Eq. [2.13]
(
) √ Eq. [2.14]
√ Eq. [2.15]
Where Vc is the nominal shear strength provided by the concrete and αs is a factor takes into
account the support condition (30 for edge connections).
It is to be noted that, although slightly different in format, the provisions of the ACI 318-11
yields the exact same results as those of the CAN/CSA A23.3-04. The nominal shear strength,
Vc, calculated from Equations 2.12 to 2.14 is to be multiplied by a strength reduction factor, φ,
equals 0.75.

Chapter 2: Literature Review
35
2.6.1.2.2. Shear stress resistance with stud shear reinforcement
Shear reinforcement shall be extended to the section where vf is not greater than the value
specified in Equation 2.16.
√ Eq. [2.16]
Moreover, when properly anchored headed shear reinforcement is provided, Vc and Vn shall not
be greater than the values specified in Equations 2.17 and 2.18, respectively.
√ Eq. [2.17]
√ Eq. [2.18]
The nominal shear stress resistance provided by the stud shear reinforcement, vs, is given by
Equation 2.19:
√ Eq. [2.19]
Where Av is the cross-sectional area of the headed shear reinforcement on a concentric line
parallel to the perimeter of the column and fyv is the specified yield strength of the headed shear
reinforcement.
The distance between the first line of studs and the column face shall not exceed 0.5d while s
shall be taking according to vf as follows:
When √ , When √ ,
2.6.1.3. JSCE 2007 (Japan Society of Civil Engineering 2007)
2.6.1.3.1. Shear stress resistance without shear reinforcement
The design punching shear capacity, Vpcd, may be determined by Equations 2.20 through 2.25:

Chapter 2: Literature Review
36
Eq. [2.20]
√
Eq. [2.21]
√
Eq. [2.22]
⁄ Eq. [2.23]
√
Eq. [2.24]
√ Eq. [2.25]
where, fpcd is the design compressive strength of concrete, up is the peripheral length of the design
cross-section at d/2 from the column face, d is the average effective depth of both orthogonal
directions, γb is a partial safety factor, α is a factor takes into account the eccentricity of the
shearing force, ρ is the average flexural reinforcement ratio in both orthogonal direction, u is the
peripheral length of the column, ex and ey are the load eccentricity in the two orthogonal
directions, and bx and by are the dimensions of the critical section in the two orthogonal
directions.
2.6.2. FRP-RC Slab-Column Connections
Similar to the CAN/CSA A23.3-04 and the ACI 318-11, the recently published CAN/CSA S806-
12 (Canadian Standards Association 2012) and the ACI 440.1R-06 (ACI Committee 440 2006)
adopt the theory of the linear variation of shear stresses discussed in Section 2.4.3.1 in
calculating the applied factored shear stresses, vf. They also consider the critical section for shear

Chapter 2: Literature Review
37
to be located at a distance d/2 from the column face. Both codes do not include any provision for
designing slab-column connections with any kind of shear reinforcement.
2.6.2.1. CAN/CSA S806-12 (Canadian Standards Association 2012)
Unlike the case of steel-RC slab-column connections, the shear strength of FRP-RC slab-column
connections is more sensitive to the flexural reinforcement ratio/stiffness. This is attributed to the
relatively low modulus of elasticity of FRP which causes the depth of the neutral axis of the
cracked section to decrease significantly after cracking (El-Gamal et al. 2005). Accordingly, the
recently published CAN/CSA S806-12 accounts for the flexural reinforcement stiffness in
calculating the punching shear resistance of FRP-RC slab-column connections.
The factored shear stress resistance, vr, shall not exceed the limits specified in CAN/CSA A23.3-
04 (Section 2.6.1.1) and the smallest of the following calculated from Equations 2.26 through
2.28:
(
) (
) Eq. [2.26]
(
) (
) Eq. [2.27]
(
)
Eq. [2.28]
Where Ef and ρf are the elastic modulus and the flexural reinforcement ratio for the FRP flexural
reinforcement, respectively, fc’ is the concrete compressive strength (not to be taken greater than
60 MPa) and αs is a factor takes into account the support condition (3 for edge connections).
If the effective depth of the slab exceeds 300 mm, then the size effect should be considered by
multiplying the value of vc obtained from the above equations by ( ⁄ )
.

Chapter 2: Literature Review
38
2.6.2.2. ACI 440.1R-06 (ACI Committee 440 2006)
The nominal shear stress resistance, Vn, shall be calculated from Equation 2.29:
√ c Eq. [2.29]
Where Vc is the nominal shear strength provided by concrete and c is the cracked transformed
section neutral axis depth calculated from Equations 2.30 and 2.31:
c = kd
Eq. [2.30]
√ ( )
Eq. [2.31]
Where nf is the modular ratio (ratio of modulus of elasticity of FRP bars to modulus of elasticity
of concrete).
Equation 2.29 can be rewritten as shown in Equation 2.32 which is the equation adopted by the
ACI 318-11 for steel-RC slab-column connections modified by the factor (5k/2) to account for
the axial stiffness of the FRP reinforcement (El-Gamal et al. 2005).
(
) √ Eq. [2.32]
Equation 2.29 is a modification to the mathematical one-way shear model presented by Tureyen
and Frosch (Tureyen and Frosch 2003) to account for the increased confinement provided by the
two-way action at a slab-column connection (Ospina 2005). Tureyen and Forsch model
(Equation 2.33) assumes that the shear stress is carried solely by the uncracked concrete, i.e.,
ignoring the contributions of the aggregate interlock and dowel action. Moreover, although the
model was derived mathematically based on the stress state in the uncracked concrete region,
they assumed a conservative value for the factor multiplied by the term √ to simplify the
design calculations and to provide conservative estimates. Although the test results from the

Chapter 2: Literature Review
39
literature suggested an average value of 0.54, they used a value of 0.4 in their model. All these
conservative measures usually lead to very conservative estimates of Equation 2.29.
√ Eq. [2.33]
2.6.2.3. JSCE 1997 (Japan Society of Civil Engineering 1997)
The design punching shear capacity Vpcd is calculated in the same manner as in the case of steel-
RC connections (Eqs. 2.20 through 2.25). The only difference is that Equation 2.22 is modified
to take into account the difference in the elastic modulus between FRP and steel as shown in
Equation 2.34:
√
Eq. [2.34]
Where, Ef and Es are the elastic modulus for the FRP and steel reinforcement, respectively.
2.7. RESEARCH ON STEEL-RC SLAB-COLUMN CONNECTIONS
2.7.1. Effect of Flexural Reinforcement Ratio
Increasing the flexural reinforcement ratio has a significant effect on increasing the punching
shear capacity of slab-column connections. It also increases the post-cracking stiffness and
decreases the ductility of the connections (Marzouk and Hussein 1991; Marzouk et al. 1998,
2000; Ozden et al. 2006; Widianto et al. 2009; Rizk et al. 2011). Furthermore, increasing the
flexural reinforcement ratio changes the mode of failure from a ductile flexural mode to a brittle
punching shear mode (Osman et al. 2000; Stein et al. 2007).
The significant increase of the punching shear capacity is attributed to the role of the increased
flexural reinforcement in controlling flexural cracks. Significant yielding of the flexural
reinforcement results in large (deep and wide) cracks. Wide cracks decrease the contribution of

Chapter 2: Literature Review
40
the aggregate interlock contribution to the shear strength, while deep cracks decrease the area of
the uncracked concrete. Therefore, the amount of flexural reinforcement has a significant
influence on the punching capacity of slab-column connections (Richart 1948).
2.7.2. Effect of Shear Reinforcement (Stud Shear Reinforcement)
As mentioned in Section 2.5, there are many types of shear reinforcement for slab-column
connections. This discussion, however, will be limited to the stud shear reinforcement type. The
shear stud reinforcement was first introduced in the late 1970s at the University of Calgary
(Dilger et al. 1978). Then, it was adopted in the Canadian Code CAN3-A23.3-M84 in 1984
(Canadian Standards Association 1984).
The main advantage of stud shear reinforcement over the traditional stirrups and bent bars is
their feasibility to be installed in the congested region around columns in thin slabs while having
proper anchorage at the top and bottom to develop yield in the studs before failure (Dilger et al.
1978; Seible et al. 1980; Dilger and Ghali 1981; Mokhtar et al. 1985; Elgabry and Ghali 1987).
Furthermore, implementing stud shear reinforcement in slab-column connections increases the
ductility and ultimate capacity of the connections (El-Salakawy et al. 1998, 2000; Birkle and
Dilger 2008; Heinzmann et al. 2012). However, the ultimate capacity of the connection will
increase only if its flexural capacity is well above its punching capacity. Otherwise, the mode of
failure will change from a brittle punching mode to a ductile flexural mode (Stein et al. 2007).
2.7.3. Effect of Moment-to-Shear Ratio
The unbalanced moments transferred to a slab-column connection can be increased significantly
under the application of horizontal loads, e.g., wind or earthquake. Increasing the moment-to-
shear ratio decreases the ultimate capacity of the connection (Zaghlool and Rawdon de Paiva
1973; Marzouk et al. 1996, 2000; El-Salakawy et al. 1998; Ozden et al. 2006). Furthermore, it

Chapter 2: Literature Review
41
increases the zone of the slab affected by shear stresses (El-Salakawy et al. 1998; Marzouk et al.
2000). For slab-column edge connections, in the case of high moment-to-shear ratios, the shear
stresses at the free edge reverse their direction. Consequently, the inclined cracks at the free edge
propagate approximately perpendicular to the case of low moment-to-shear ratio (El-Salakawy et
al. 1998).
2.8. YIELD LINE THEORY
The yield line theory has been initiated by Ingerslev (1923) and then extensively developed by
Johansen (1943, 1946). It gives the values of the vertical shearing force, Vflex, and the unbalanced
moment, Mflex, which produce flexural failure in slab-column connections in terms of the bending
moment per unit width of the slab at yielding of the flexural reinforcement, my. These values
represent the upper bound of the shearing force and the unbalanced moment that can be
transferred between the column and the slab. The values are estimated by postulating a failure
pattern compatible with the boundary conditions of the slab in the test set-up. A failure pattern
consists of the lines of excessive cracking across which the tension steel has yielded, forming
plastic hinges. These lines divide the slab into segments forming the failure pattern. However,
the segments are not examined to ensure that their ultimate moment of resistance was not
exceeded; thus, the resulting ultimate capacity may be overestimating if an incorrect pattern was
used. Consequently, all the possible failure patterns should be examined (Park and Gamble
2000). The theory has been efficiently used to estimate the ultimate flexural capacities of steel-
RC slab-column connections (Mortin 1989; Mortin and Ghali 1991; El-Salakawy et al. 2000;
Ritchie et al. 2006; Stein et al. 2007) and different failure patterns were suggested as shown in
Figure 2.13.

Chapter 2: Literature Review
42
a) Pattern suggested by Park and Gamble (2000)
b) Pattern suggested by Ritchi et al. (2006) and Stein et al. (2007)
c) Pattern suggested by Mortin (1989)
Figure 2.13: Different yield line patterns for slab-column edge connections
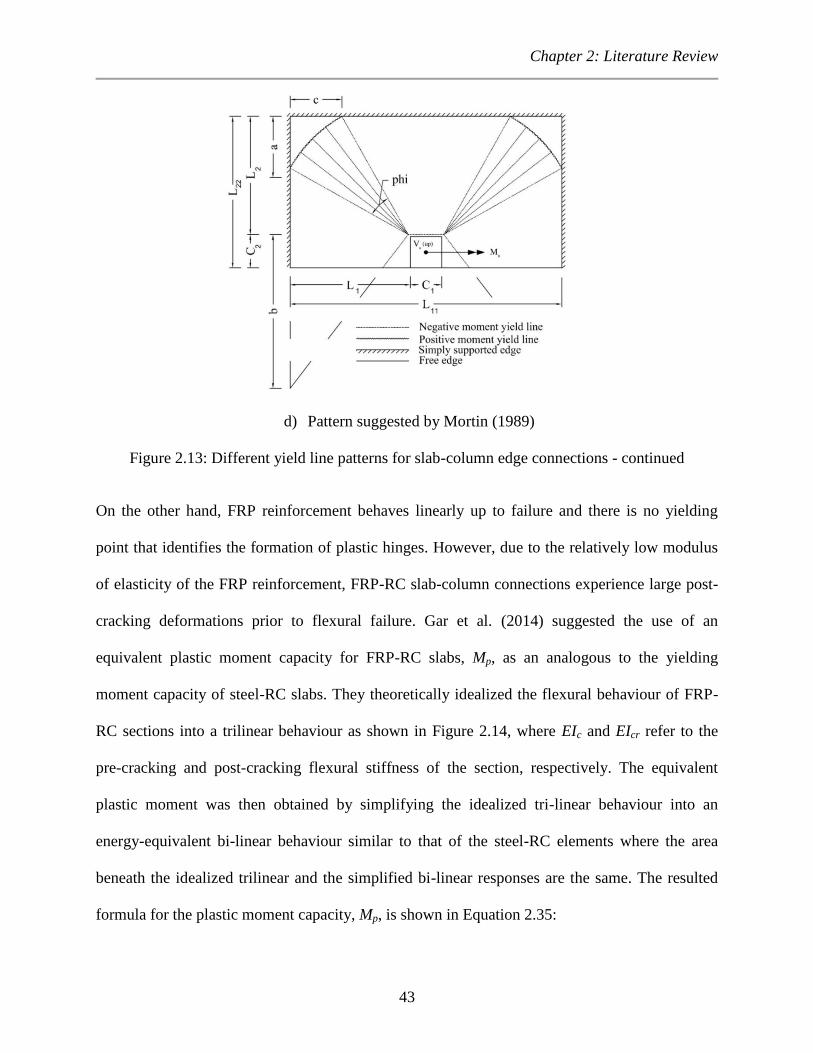
Chapter 2: Literature Review
43
d) Pattern suggested by Mortin (1989)
Figure 2.13: Different yield line patterns for slab-column edge connections - continued
On the other hand, FRP reinforcement behaves linearly up to failure and there is no yielding
point that identifies the formation of plastic hinges. However, due to the relatively low modulus
of elasticity of the FRP reinforcement, FRP-RC slab-column connections experience large post-
cracking deformations prior to flexural failure. Gar et al. (2014) suggested the use of an
equivalent plastic moment capacity for FRP-RC slabs, Mp, as an analogous to the yielding
moment capacity of steel-RC slabs. They theoretically idealized the flexural behaviour of FRP-
RC sections into a trilinear behaviour as shown in Figure 2.14, where EIc and EIcr refer to the
pre-cracking and post-cracking flexural stiffness of the section, respectively. The equivalent
plastic moment was then obtained by simplifying the idealized tri-linear behaviour into an
energy-equivalent bi-linear behaviour similar to that of the steel-RC elements where the area
beneath the idealized trilinear and the simplified bi-linear responses are the same. The resulted
formula for the plastic moment capacity, Mp, is shown in Equation 2.35:

Chapter 2: Literature Review
44
(
) (
) Eq. [2.35]
Where Mn and Mcr are the nominal and cracking moment capacities of the section, respectively,
and Ig and Icr are the gross and cracked moment of inertia of the section, respectively.
2.9. RESEARCH ON FRP-RC SLAB-COLUMN CONNECTIONS
2.9.1. Previously Proposed Design Models
Banthia et al. (1995) tested four slabs, three reinforced with CFRP grids and one with steel grid.
They came up with a conclusion that, despite the significant differences between the used CFRP
and steel, no significant changes are needed to the code equations dealing with steel-RC
connections when extending them to slabs reinforced with FRP reinforcement.
Figure 2.14: Moment-curvature response for FRP-RC sections (reproduced from Gar et al. 2014)
El-Ghandour et al. (1999) found that the ACI 318-95 code (ACI Committee 318 1995)
overestimates the concrete shear resistance of FRP-RC slabs with low reinforcement ratios as it
totally ignores the influence of flexural reinforcement. They proposed Equation 2.36 which is a
Mo
men
t
Curvature
Idealized tri-linear behaviour
Simplified bi-linear behaviour
M n
M p
M cr
cr
n
p
EI cr
EI g

Chapter 2: Literature Review
45
modification to the ACI-318-95 equation through multiplying the obtained shear strength value
by the term (
) ⁄
. Test results showed that this modification leads to accurate predictions of
the punching capacity of tested FRP-RC slabs without shear reinforcement.
(
) ⁄
√ (
) ⁄
Eq. [2.36]
Similarly, Matthys and Taerwe (2000) suggested a modification to Equation 37 of the BS 8110-
1: 1997 (British Standards Institution 1997) by introducing the equivalent reinforcement ratio ρ
to account for the relatively low modulus of elasticity of FRP reinforcement as shown in
Equation 2.38.
( ) ⁄ (
)
⁄
(
)
⁄
Eq. [2.37]
(
)
⁄
⁄ Eq. [2.38]
Where ρf is the reinforcement ratio of the tensile FRP mat and bo is the rectangular or square
control perimeter at a distance of 1.5d away from the loaded area.
Ospina et al. (2003) found that the modification of the ACI 318-95 equation introduced by El-
Ghandour et al. (1999) gives worse agreement with their test results than what the original
equation does. On the other hand, they supported the equation proposed by Matthys and Taerwe
(2000); however, they added another modification to it as shown in Equation 2.39.
( ) ⁄
√
Eq. [2.39]

Chapter 2: Literature Review
46
Zaghloul and Razaqpur (2004) proposed a new model to predict the punching shear capacity
under combination of shear force and unbalanced moment. The new model is a modification to
the expression for one-way shear given in the CAN/CSA S806-02 (Equation 2.40) as shown in
Equation 2.41.
(
)
⁄
Eq. [2.40]
(
) ⁄ Eq. [2.41]
El-Gamal et al. (2005) suggested a new model which is also a modification to the ACI 318-95
model with two new parameters: α to account for the flexural stiffness and N to account for the
continuity of the of the slab as shown in Equations 2.42 and 2.43.
√ ( )
Eq. [2.42]
( ) ( ⁄ ) Eq. [2.43]
Where N is taken as 0, 1 and 2 for one panel slabs, slabs continuous along one axis and slabs
continuous along their two axes, respectively.
2.9.2. Effect of Different Parameters
2.9.2.1. Effect of flexural reinforcement type and ratio
Matthys and Taerwe (2000) investigated the punching shear behaviour of slab-column interior
connections reinforced with CFRP grids. They tested seventeen 1000 mm square slabs with a
depth of 120 mm or 150 mm. Four connections were reinforced with steel grids while the
remaining thirteen were reinforced with CFRP grids. It was concluded that in order to obtain
Chapter 2: Literature Review
47
similar punching capacity as the steel-RC slabs, FRP-RC slabs should have sufficiently high
flexural stiffness by increasing the flexural reinforcement ratio and/or the slab depth.
Ospina et al. (2003) tested four full-scale slab-column interior connections; two reinforced with
GFRP bars, one reinforced with GFRP grid and one reinforced with steel bars. It was found that
the punching strength of a slab increases and the ultimate deflection decreases with increasing
the elastic stiffness of the reinforcing mat.
Zaghloul and Razaqpur (2004) tested seven half-scale slab-column interior connections under
eccentric loading. One connection was reinforced with steel bars and the other six were
reinforced with CFRP grids. It was found that increasing the reinforcement axial stiffness has a
more significant effect on increasing the capacity than increasing the reinforcement ratio; the
capacity decreased by 22% when a 1.33% CFRP grid was used instead of 1.4% steel grid. The
authors suggested that the punching shear capacity varies linearly with the cubic root of the axial
stiffness of the reinforcement.
Zaghloul (2007) tested ten half-scale slab-column edge connections. Three connections were
reinforced with steel bars and seven were reinforced with CFRP grids. Furthermore, two steel-
RC connections and two CFRP-RC connections were reinforced with different types of shear
reinforcement. The unbalanced moment was applied via changing the eccentricity of the vertical
load applied on the upper column stub while no loads were applied at the lower column stub. The
test variables were the flexural reinforcement ratio and type, moment-to-shear ratio, column
width-to-slab depth ratio, column aspect ratio and the presence of shear reinforcement. Two
connections were assigned to investigate the effect of the flexural reinforcement ratio. Increasing
the reinforcement ratio by 46% increased the ultimate capacity by 21%; however, it had no effect

Chapter 2: Literature Review
48
on the post-cracking stiffness. Another two connections were assigned to investigate the effect of
flexural reinforcement type (steel bars and CFRP grids). The post cracking stiffness of the
connection reinforced with steel bars was higher than that of the connections reinforced with
CFRP grid; however, both connections had the same failure load.
Lee et al. (2009) tested six full scale slab-column interior connections under concentric loading.
Two connections were reinforced with uniform and banded distributions of steel bars while the
other four were reinforced with GFRP bars (one with uniform distribution and three with
different ratios of banded distribution). The capacities of the connections reinforced with
uniform and banded GFRP bars were 26% and 22% lower than their counterparts with steel bars,
respectively. Moreover, it was found that banding the reinforcement in the column vicinity
resulted in slightly higher punching shear strength, greater post-cracking stiffness and more
uniform distribution of strains in the bars. In addition, it was observed that the failure plane for
the slabs with banded reinforcement extended to a greater distance from the column faces.
Increasing the GFRP reinforcement ratio from 1.18% to 2.15% increased the punching capacity
by 10.8%. However, a further increase of the reinforcement ratio to 3% resulted in an increase in
the capacity of 11.7% only which indicates that excessive concentrations of the slab
reinforcement is ineffective in increasing the punching capacity.
Hassan et al. (2013) tested ten full-scale interior slab column connections under concentric
loading to investigate the effects of the reinforcement type (steel and different grade of GFRP)
and ratio (0.34% to 1.66%), slab thickness (200 mm and 350 mm) and concrete compressive
strength (NSC and HSC) on the punching shear behaviour. The authors found that for the same
slab and column dimensions, increasing the reinforcement ratio increases the punching capacity.
For the 200 mm slabs with 300×300 mm columns, increasing the reinforcement ratio from

Chapter 2: Literature Review
49
0.71% to 1.56% increased the ultimate capacity by 31%. Also, increasing the flexural
reinforcement ratio decreased the deflections at the same load level, i.e., increased the post-
cracking stiffness, due to the increased effective moment of inertia of the concrete section. On
the other hand, changing the reinforcement type from steel bars to GFRP bars with maintaining
the same flexural reinforcement ratio decreased the ultimate capacity by 32% and 37% and
decreased the post-cracking stiffness by 60% and 57% for the 200 mm and 350 mm slabs,
respectively.
Nguyen-Minh and Rovňák (2013) tested six full-scale slab-column interior connections under
concentric loading. Three connections were reinforced with GFRP bars and three with steel bars.
The only parameter was the flexural reinforcement ratio being 0.2%, 0.4% and 0.6% for both
GFRP-RC and steel-RC connections. Again, increasing the GFRP flexural reinforcement ratio
increased the ultimate capacity and the post-cracking stiffness. On the other hand, the GFRP-RC
connections had lower capacity and post-cracking stiffness and wider cracks compared to their
steel-RC counterparts.
2.9.2.2. Effect of moment-to-shear ratio
Zaghloul and Razaqpur (2004) tested seven half-scale interior connections under eccentric
loading. Three connections had different moment-to-shear ratios as the only parameter (0.0 m,
0.22 m and 0.3 m). The results showed that increasing the moment-to-shear ratio decreases the
punching capacity. Increasing the moment-to-shear ratio from 0.0 m to 0.22 m and 0.3 m
decreased the ultimate capacity by 27% and 43%, respectively.
Zaghloul (2007) investigated the influence of moment-to-shear ratio on the punching shear
behaviour of half-scale CFRP-RC slab-column edge connections. The post cracking stiffness and
the capacity of the connection subjected to the higher moment-to-shear ratio were higher than
Chapter 2: Literature Review
50
those of the connection subjected to the lower moment-to-shear ratio. Increasing the moment-to-
shear ratio from 0.265 m to 0.415 m increased the ultimate capacity by 12%. This unusual
behaviour was attributed to the very huge difference in the concrete strength between both
connections. The connection subjected to high ratio had a concrete strength of 56.8 MPa while
the connection subjected to low ratio had a concrete strength of 26.7 MPa. Despite this huge
difference in the concrete strength, the results were normalized regarding the concrete strength.
The normalized results seem reasonable where the post-cracking stiffnesses for both connections
are similar and the capacity of the connection subjected to high ratio is 15% less than that of the
connection subjected to low ratio.
2.9.2.3. Effect of shear reinforcement
El-Ghandour et al. (2003) investigated the effect of CFRP shear-bands on the punching shear
behaviour of circular slab-column interior connections subjected to concentric loading. The
shear-reinforced slabs showed larger deformability compared to those without shear
reinforcement. Furthermore, implementing the shear-bands in a slab with a GFRP flexural
reinforcement of 0.38% increased the ultimate capacity by 13.9% due to the role of the shear
reinforcement in preventing the punching shear failure at lower load levels. The authors
concluded that the concrete contribution to the punching shear resistance is substantially reduced
after the initiation of the major shear crack; accordingly, they proposed that only 50% of the
concrete shear resistance can be relied upon similar to the ACI 318-95 approach (ACI
Committee 318 1995). They also recommended a strain limit of 0.0045 s for designing shear
reinforcement with a maximum spacing of 0.5d based on the results.
Zaghloul (2007) tested half-scale GFRP-RC edge and interior slab column connections to study
the effect of a type of CFRP shear reinforcement on the punching shear behaviour of such
Chapter 2: Literature Review
51
connections. Shear rails were cut from CFRP grids. A typical CFRP shear rail consisted of four
legs 90 mm apart. The rails were placed orthogonally parallel to the column faces. The proposed
shear reinforcement increased the ultimate capacity of the interior connections by 24.6% and
30.4% when the first leg of the rail was located 0.5d and 0.85d from the column face,
respectively. However, the increase was only 9% for the edge connections with the first leg of
the rail located 0.5d from the column face. In addition, the shear reinforcement increased the
deformability of the connections. The authors recommended a relatively conservative value for
the design limit strain and stress in the shear reinforcement for this specific type of reinforcement
of 3000 s and 0.25fu, respectively.
Hassan et al. (2014) tested ten full-scale slab-column interior connections under concentric
loading. All the slabs had GFRP flexural reinforcement but only seven slabs had GFRP or CFRP
closed, spiral or bundled spiral stirrups as shear reinforcement. The presence of the stirrups
enhanced the performance of the connections in terms of reducing the brittleness of the failure
and increasing the deformation capacity. The maximum strains in the stirrups were recorded at a
distance of 0.5d–1.0d from the column faces and completely diminished at 2.5d from the column
face for connections with 350-mm thick slabs. For the 200-mm thick slabs, the stirrups
developed strains as high as 1500 microstrains at 2.5d from the column face. The authors
concluded that the punching capacity was governed by the flexural reinforcement ratio rather
than the strength of the FRP stirrups. Accordingly, specimens with very low flexural
reinforcement ratios may not exhibit significant increases in punching shear capacity when FRP
stirrups are used. They also recommended that the strain limits of 0.004 and 0.005 recommended
by the ACI 440.1R-06 (ACI Committee 440 2006) and the CSA S806-12 (Canadian Standards
Association 2012), respectively, can be used in the design.

Chapter 3: Experimental Program
52
CHAPTER 3: EXPERIMENTAL PROGRAM
3.1. GENERAL
Based on the literature review, it is well demonstrated that several parameters have significant
effects on the punching shear behaviour of slab-column connections. Some of the main
parameters are the flexural reinforcement type and ratio, the moment-to-shear ratio and the shear
reinforcement ratio. This chapter presents the details of the experimental study conducted in the
W. R. McQuade Structures Laboratory at the University of Manitoba to study the effects of these
parameters on the punching shear behaviour of slab-column edge connections.
3.2. MATERIALS
3.2.1. Concrete
All test connections were constructed using normal-weight, ready-mix concrete with a target
compressive strength of 35 MPa at 28 days using a maximum aggregate size of 19 mm (except
for the shear-reinforced connections where a maximum aggregate size of 13 mm was selected).
All test prototypes were cast and wet-cured in the laboratory for 7 days. Standard 100×200 mm
and 150×300 mm cylinders were cast from each batch and tested after 3, 7, 14 and 28 days and at
the day of testing to determine the actual concrete compressive and tensile strengths,
respectively.
3.2.2. Flexural Reinforcement
Three types of reinforcing bars were used as longitudinal reinforcement for the slabs: (1) No.
15M conventional deformed steel bars, (2) No. 19 sand-coated (SC) GFRP V-RODTM
bars
(Pultrall Inc. 2013) and (3) No. 19 ribbed-deformed (RD) GFRP ComBAR® bars (Schoeck
Canada Inc. 2013). On the other hand, No. 20M and No. 10M deformed steel bars and stirrups

Chapter 3: Experimental Program
53
were used to reinforce the columns in all connections, respectively. The mechanical properties of
the deformed steel bars and the GFRP bars were obtained from standard tests carried out
according to the ASTM A370-11 (ASTM A370 - 14 2014) and the ASTM D7205/D7205M-06
(ASTM D7205 / D7205M - 06 2011), respectively. Table 3.1 shows the mechanical properties of
the used steel and GFRP bars.
Table 3.1: Mechanical properties of the used reinforcing bars
Bar
Material
Bar
Size
Effective
Diameter
(mm)
Effective
Area
(mm2)
Tensile
Strength
(MPa)
Elasticity
Modulus
(GPa)
Ultimate
Strain
(%)
Steel
(Straight and Bent) No.20M 15.9 200 419
* 182
0.23
*
SC-GFRP
(Straight)
No.19 19.1 285
1484 65
2.3
SC-GFRP
(Bent - Straight Portion) 1232 52
RD-GFRP
(Straight)
No. 19
20 314 1060 64
1.67 RD-GFRP
(Bent - Straight Portion) 19.1 287 900 54
RD-GFRP Studs No. 13 12.0 113 1060 64
*yield stress and strain for steel
3.2.3. Shear Reinforcement
Size No. 4 RD-GFRP bars with headed-ends were used as shear studs. The end head is made of a
thermo-setting polymeric concrete with a compressive strength ranging between 100 and 120
MPa. The heads were cast on the end of the straight bar and hardened at higher temperatures. As
shown in Figure 3.1, each head begins with a wide disk and then tapers in multiple steps towards
the outer bar diameter. The outer diameter of wide disk is 30 mm, i.e., 2.5 times the bar diameter.

Chapter 3: Experimental Program
54
The length of the end head is 60 mm while the length of the stem of the stud is 50 mm. The
mechanical properties of the RD-GFRP studs are listed in Table 3.1.
Figure 3.1: Ribbed-deformed GFRP stud with headed-ends (dimensions in mm)
3.3. TEST CONNECTIONS
Nine full-scale slab-column edge connections were constructed and tested to failure. The slabs
were reinforced with deformed steel bars in one connection, SC-GFRP bars in five connections
and RD-GFRP bars in three connections. Two connections of the three reinforced with RD-
GFRP bars were reinforced with stud shear reinforcement at different spacing. The designation
of the connections consists of four characters separated by dashes as follows: the first character
indicates the reinforcement type (S for steel, GSC for SC-GFRP and GRD for RD-GFRP), the
second character indicates the flexural reinforcement ratio in the direction perpendicular to the
free edge (0.9 for ρ = 0.9%, 1.35 for ρ = 1.35% and 1.8 for ρ = 1.8%), the third character
indicates the spacing of the stud shear reinforcement (XX for no shear reinforcement, 50 for S =
50 mm and 75 for S = 75 mm) and the fourth character indicates the moment-to-shear ratio
applied to the connection (0.2 for moment-to-shear ratio = 0.2 m, 0.4 for moment-to-shear ratio =
0.4 m and 0.6 for moment-to-shear ratio = 0.6 m). For example, GRD-0.9-50-0.4 denotes a

Chapter 3: Experimental Program
55
connection reinforced with RD-GFRP bars in flexure with a reinforcement ratio of 0.9% in the
direction perpendicular to the column, reinforced with shear studs spaced 50 mm centre-to-centre
and subjected to a moment-to-shear ratio of 0.4 m.
The dimensions and reinforcement ratios of the connections were defined by performing two
elastic analyses of a typical parking garage system consisting of three 6.5 m-long square bays in
both directions (Appendix A). The slab of the system was reinforced with steel reinforcing bar in
one analysis and with SC-GFRP bars in the other. Each slab-column connection simulates an
isolated portion of a 6500×6500 mm slab bounded by the slab free edge and the lines of contra-
flexure around the column which are assumed to be 0.2L away from the centerlines of the
column stub, where L is the span between the centerlines of the columns as shown in Figure 3.2.
The analyses were carried out according to the CAN/CSA A23.3-04 and the CAN/CSA S806-12
standards, when applicable (Appendix A). The system was designed to carry a specified gravity
load wf = 8.2 kN/m2, i.e., a specified dead load D.L. = 5.8 kN/m
2 and a factored live load L.L. =
2.4 kN/m2 (NBCC 2010), resulting in a moment-to-shear ratio of 0.4 m. The details of test
connections are listed in Table 3.2.
The resulting connections had dimensions of 2600×1450×200 mm; however, 2800×1550×200
mm slabs were cast to allow for a supporting clearance. The column stub extended 1000 mm
above and below the slab with cross sectional area of 300×300 mm. On the other hand, although
subjected to the same loads, the SC-GFRP flexural reinforcement ratio resulting from the
analysis (1.8%) was twice the steel flexural reinforcement ratio (0.9%). The higher
reinforcement ratio for the slabs reinforced with SC-GFRP is necessary to satisfy the
serviceability requirements. The flexural reinforcement ratios resulting from the analyses of the
steel and SC-GFRP reinforced systems have been employed in connections S-0.9-XX-0.4 and
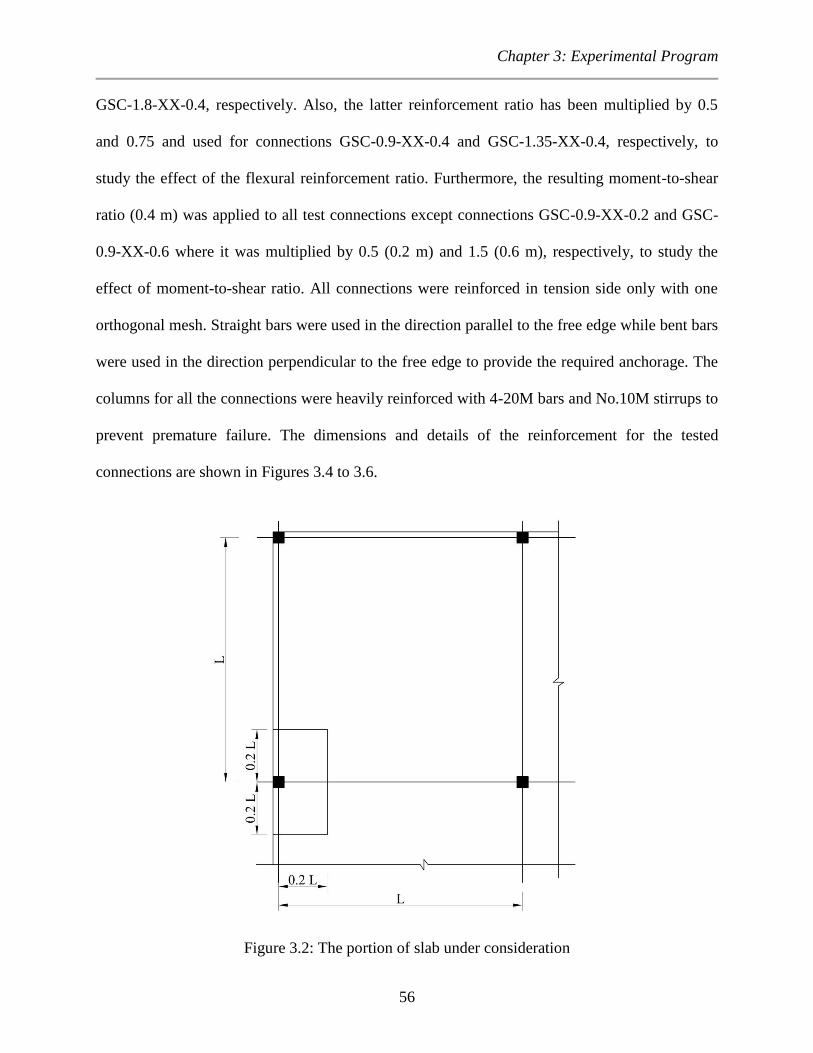
Chapter 3: Experimental Program
56
GSC-1.8-XX-0.4, respectively. Also, the latter reinforcement ratio has been multiplied by 0.5
and 0.75 and used for connections GSC-0.9-XX-0.4 and GSC-1.35-XX-0.4, respectively, to
study the effect of the flexural reinforcement ratio. Furthermore, the resulting moment-to-shear
ratio (0.4 m) was applied to all test connections except connections GSC-0.9-XX-0.2 and GSC-
0.9-XX-0.6 where it was multiplied by 0.5 (0.2 m) and 1.5 (0.6 m), respectively, to study the
effect of moment-to-shear ratio. All connections were reinforced in tension side only with one
orthogonal mesh. Straight bars were used in the direction parallel to the free edge while bent bars
were used in the direction perpendicular to the free edge to provide the required anchorage. The
columns for all the connections were heavily reinforced with 4-20M bars and No.10M stirrups to
prevent premature failure. The dimensions and details of the reinforcement for the tested
connections are shown in Figures 3.4 to 3.6.
Figure 3.2: The portion of slab under consideration
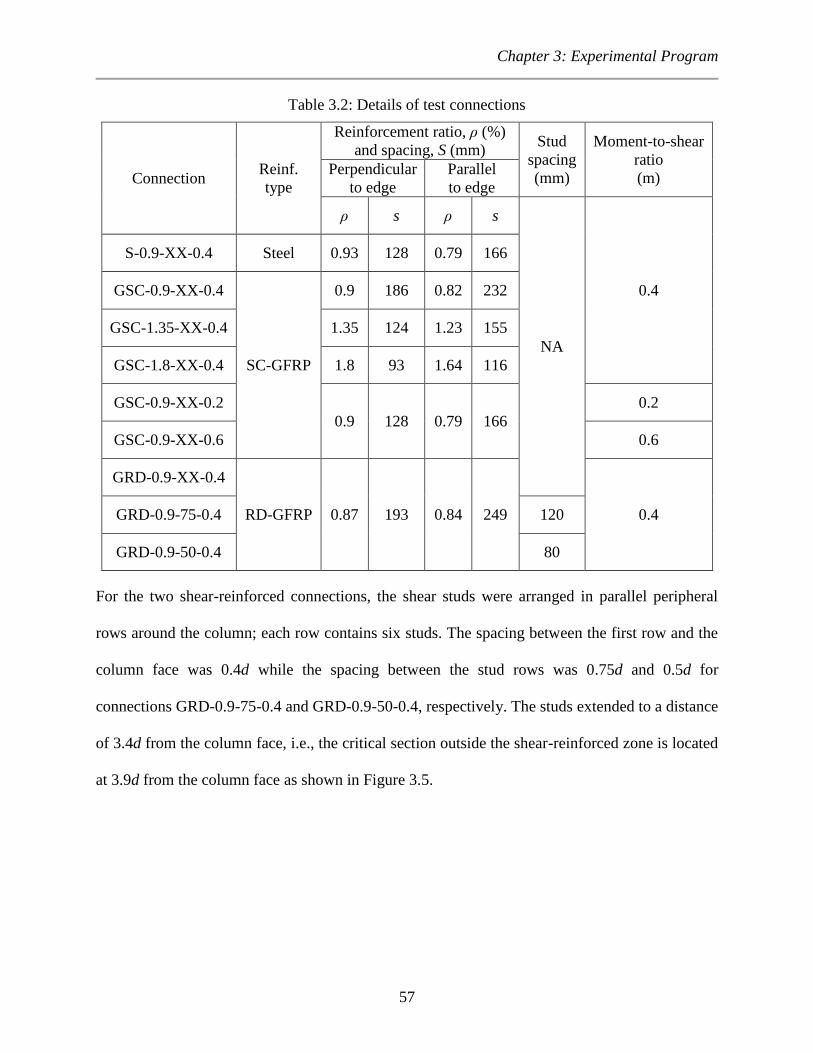
Chapter 3: Experimental Program
57
Table 3.2: Details of test connections
Connection Reinf.
type
Reinforcement ratio, ρ (%)
and spacing, S (mm) Stud
spacing
(mm)
Moment-to-shear
ratio
(m) Perpendicular
to edge
Parallel
to edge
ρ s ρ s
NA
0.4
S-0.9-XX-0.4 Steel 0.93 128 0.79 166
GSC-0.9-XX-0.4
SC-GFRP
0.9 186 0.82 232
GSC-1.35-XX-0.4 1.35 124 1.23 155
GSC-1.8-XX-0.4 1.8 93 1.64 116
GSC-0.9-XX-0.2
0.9 128 0.79 166
0.2
GSC-0.9-XX-0.6 0.6
GRD-0.9-XX-0.4
RD-GFRP 0.87 193 0.84 249 0.4 GRD-0.9-75-0.4 120
GRD-0.9-50-0.4 80
For the two shear-reinforced connections, the shear studs were arranged in parallel peripheral
rows around the column; each row contains six studs. The spacing between the first row and the
column face was 0.4d while the spacing between the stud rows was 0.75d and 0.5d for
connections GRD-0.9-75-0.4 and GRD-0.9-50-0.4, respectively. The studs extended to a distance
of 3.4d from the column face, i.e., the critical section outside the shear-reinforced zone is located
at 3.9d from the column face as shown in Figure 3.5.

Chapter 3: Experimental Program
58
a) Connection S-0.9-XX-0.4
b) Connections GSC-0.9-XX-0.2, GSC-0.9-XX-0.4 and GSC-0.9-XX-0.6
Figure 3.3: Dimensions and flexural reinforcement layout (Dimensions in mm)

Chapter 3: Experimental Program
59
c) Connection GSC-1.35-XX-0.4
d) Connection GSC-1.8-XX-0.4
Figure 3.3: Dimensions and flexural reinforcement layout – continued (Dimensions in mm)

Chapter 3: Experimental Program
60
e) Connections GRD-0.9-XX-0.4, GRD-0.9-75-0.4 and GRD-0.9-50-0.4
Figure 3.3: Dimensions and flexural reinforcement layout – continued (Dimensions in mm)
Figure 3.4: Column details (Dimensions in mm)

Chapter 3: Experimental Program
61
a) GRD-0.9-75-0.4 b) GRD-0.9-50-0.4
Figure 3.5: Stud shear reinforcement layout (Dimensions in mm)
a) Connection GSC-0.9-XX-0.4
Figure 3.6: Reinforcement configuration
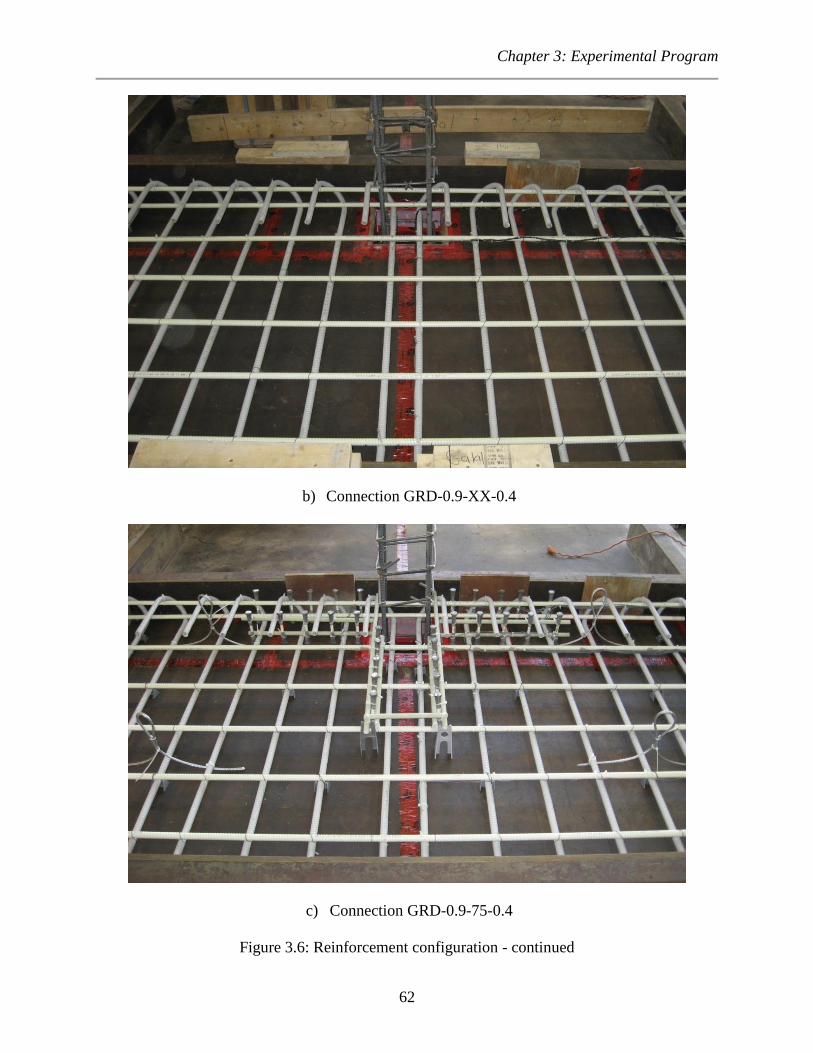
Chapter 3: Experimental Program
62
b) Connection GRD-0.9-XX-0.4
c) Connection GRD-0.9-75-0.4
Figure 3.6: Reinforcement configuration - continued

Chapter 3: Experimental Program
63
3.4. TEST INSTRUMENTATION
Both internal (reinforcement strain gauges) and external (load cells, PI-gauges, concrete strain
gauges and LVDTs) instrumentation were used to provide a real-time monitoring of the
behaviour of the connections during the test. All instrumentation was connected to a
computerized data acquisition system (DAQ) to record the readings during the test. The
propagation of cracks was carefully marked during the test.
3.4.1. Reinforcement Strain Gauges
For the flexural reinforcement, twelve electrical resistance strain gauges were attached to three
reinforcing bars passing through the column as shown in Figure 3.7. For the shear studs,
electrical resistance strain gauges were attached to the mid height of the stems at different
locations as shown in Figure 3.8.
Figure 3.7: Strain gauges layout on the flexural reinforcement

Chapter 3: Experimental Program
64
a) GRD-0.9-75-0.4 b) GRD-0.9-50-0.4
Figure 3.8: Strain gauges layout on the shear reinforcement
3.4.2. PI-Gauges and Concrete Strain Gauges
For all slabs, two PI-gauges were attached to the compression side of the slab near the column
face in order to capture the maximum concrete strains in both orthogonal directions as shown in
Figure 3.9. For connections GSC-0.9-XX-0.2, GSC-0.9-XX-0.6, GRD-0.9-75-0.4 and GRD-0.9-
50-0.4, concrete strain gauges were glued to the concrete surface at the same location to verify
the readings of the PI-gauges.
3.4.3. Load Cells
One load cell was attached to each of the hydraulic machines (two jacks and one actuator)
(Section 3.5) to measure the applied loads.
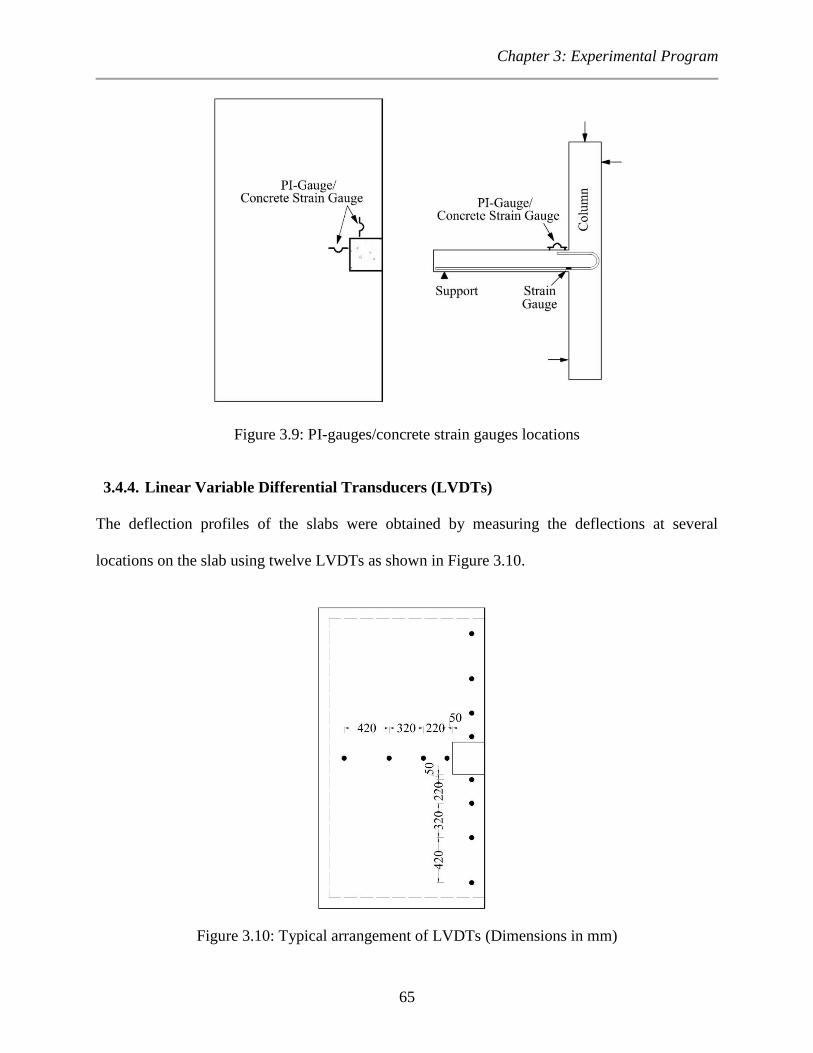
Chapter 3: Experimental Program
65
Figure 3.9: PI-gauges/concrete strain gauges locations
3.4.4. Linear Variable Differential Transducers (LVDTs)
The deflection profiles of the slabs were obtained by measuring the deflections at several
locations on the slab using twelve LVDTs as shown in Figure 3.10.
Figure 3.10: Typical arrangement of LVDTs (Dimensions in mm)

Chapter 3: Experimental Program
66
3.5. TEST SET-UP AND PROCEDURE
The connections were tested in an upside-down position with respect to the position of a real
structure. This was done due to the test setup available in the laboratory which allows the vertical
shearing force to be applied from top to bottom. Therefore, tension cracks appeared at the bottom
side of the slabs.
The slabs were simply supported on heavy steel I-beam arrangement along three of the four
edges while the fourth edge was left free. Thin 20-mm wide steel plates were used as bearing
plates between the slabs and the steel supports. In addition, neoprene strips were inserted on top
of the bearing plates to ensure a uniform distribution of the loads along the edges.
A 1000-kN hydraulic actuator was used to apply the vertical shearing force on the top of the
upper column stub. While, two hydraulic jacks were used to apply the lateral forces causing the
unbalanced moment at the tips of the upper and lower column stubs. The three hydraulic
machines were fixed to a rigid steel frame that was fixed to the laboratory strong ground. Figure
3.11 shows the details of the test setup.
Vertical and horizontal loads were applied simultaneously. Loads were monotonically applied
until failure. The hydraulic actuator applied the vertical shearing force under a displacement
control rate of 0.75 mm/min until the first crack is detected and then the rate was increased to 1.5
mm/min. On the other hand, the horizontal loads were applied under load control mode with a
rate of 4 kN/min to maintain a constant moment-to-shear ratio during the whole test.

Chapter 3: Experimental Program
67
a) Elevation View
Figure 3.11: Test setup (Dimensions in mm)

Chapter 3: Experimental Program
68
b) Section A-A
Figure 3.11: Test setup – continued (Dimensions in mm)

Chapter 3: Experimental Program
69
c) Section B-B
Figure 3.11: Test setup – continued (Dimensions in mm)

Chapter 3: Experimental Program
70
d) Photo of the set-up
Figure 3.11: Test setup – continued (Dimensions in mm)

Chapter 4: Experimental Results and Discussion
71
CHAPTER 4: EXPERIMENTAL RESULTS AND DISCUSSION
4.1. GENERAL
This chapter summarizes the experimental results for all tested connections. The behaviour of the
connections is discussed in terms of the cracking pattern and mode of failure, deflection
measurements, strain measurements, the ultimate capacity and the predictions of different codes.
It is to be noted that, for all connections, the deflections at the column face are the deflection
readings taken from the LVDT located 50 mm from the column face in the direction
perpendicular to the free edge. Also, the reinforcement strain at the column face refers to the
reinforcement strain readings taken from the strain gauge located 20 mm from the column face
on one of the bars passing through the column perpendicular to the free edge. While the concrete
strain at the column face are the concrete strain readings taken from the PI-gauge located at the
same position on the compression face of the slab. Furthermore, all the flexural reinforcement
strain profiles perpendicular and parallel to the free edge are established at increments of 20% of
the failure load for one of the bars passing through the column in each direction.
4.2. SERIES I - EFFECT OF FLEXURAL REINFORCEMENT RATIO
Three connections were assigned to investigate the effect of the GFRP flexural reinforcement
ratio on the punching shear behaviour, i.e., GSC-0.9-XX-0.4, GSC-1.35-XX-0.4 and GSC-1.8-
XX-0.4. However, connection S-0.9-XX-0.4 is included in this discussion to compare its
behaviour to that of connection GSC-1.8-XX-0.4 as they both were designed to carry the same
specified loads according to the CAN/CSA A23.3-04 (Canadian Standards Association 2004)
and the CAN/CSA S806-12 (Canadian Standards Association 2012), respectively (Appendix A).

Chapter 4: Experimental Results and Discussion
72
4.2.1. Cracking Pattern and Mode of Failure
The four connections failed in a brittle punching shear mode with no signs of flexural failure, i.e.
concrete crushing at the compression face of the slab. The failure was characterized by a drastic
drop in the vertical load when the column along with a conical portion of the slab punched
through the remainder of the slab.
The four connections showed similar cracking behaviour. On the tension face of the slab,
flexural cracks were first observed at the inner corners of the column, i.e. the location of
maximum bending moment, at a vertical load of 40, 32, 46 and 36 kN for connections S-0.9-XX-
0.4, GSC-0.9-XX-0.4, GSC-1.35-XX-0.4 and GSC-1.8-XX-0.4, respectively, as listed in Table
4.1. The relatively higher cracking load for connection GSC-1.35-XX-0.4 has affected the
connection’s behaviour as will be discussed later. These initial flexural cracks propagated around
the column periphery until they reached the free edge forming a fairly tangential crack. At the
same time, two cracks were developed from the interior face of the column towards the
supported edge of the slab in the direction perpendicular to the free edge. With increasing the
load, radial cracks started to form at the column vicinity propagating through the entire slab.
Circumferential cracks then appeared at about 50% of the failure load for the four connections.
The cracking patterns on the tension face at failure are shown in Figure 4.1. This behaviour is
similar to that reported by Matthys and Taerwe (2000) and El-Salakawy et al. (1998) for FRP-
RC interior connections and steel-RC edge connections, respectively.
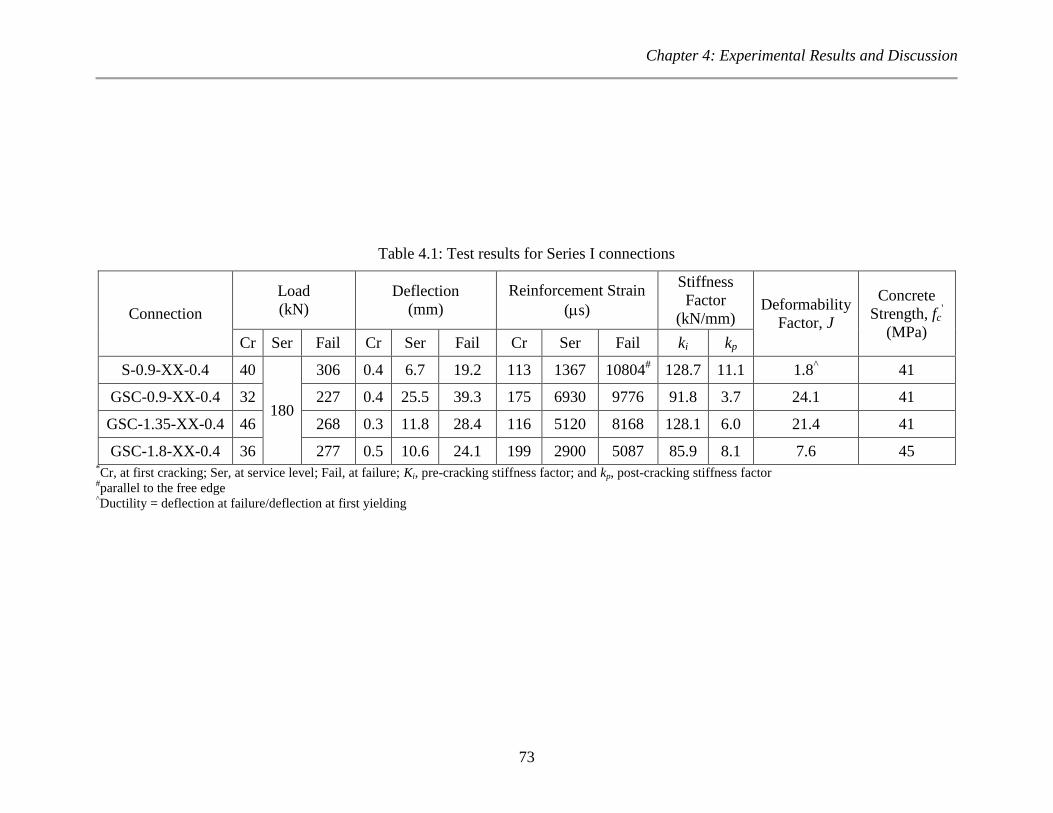
Chapter 4: Experimental Results and Discussion
73
Table 4.1: Test results for Series I connections
Connection
Load
(kN)
Deflection
(mm)
Reinforcement Strain
(s)
Stiffness
Factor
(kN/mm) Deformability
Factor, J
Concrete
Strength, fc'
(MPa) Cr Ser Fail Cr Ser Fail Cr Ser Fail ki kp
S-0.9-XX-0.4 40
180
306 0.4 6.7 19.2 113 1367 10804# 128.7 11.1 1.8
^ 41
GSC-0.9-XX-0.4 32 227 0.4 25.5 39.3 175 6930 9776 91.8 3.7 24.1 41
GSC-1.35-XX-0.4 46 268 0.3 11.8 28.4 116 5120 8168 128.1 6.0 21.4 41
GSC-1.8-XX-0.4 36 277 0.5 10.6 24.1 199 2900 5087 85.9 8.1 7.6 45 *Cr, at first cracking; Ser, at service level; Fail, at failure; Ki, pre-cracking stiffness factor; and kp, post-cracking stiffness factor
#parallel to the free edge
^Ductility = deflection at failure/deflection at first yielding

Chapter 4: Experimental Results and Discussion
74
a) Connection S-0.9-XX-0.4
b) Connection GSC-0.9-XX-0.4
Figure 4.1: Cracking on the tension face at failure for Series I connections

Chapter 4: Experimental Results and Discussion
75
c) Connection GSC-1.35-XX-0.4
d) Connection GSC-1.8-XX-0.4
Figure 4.1: Cracking on the tension face at failure for Series I connections - continued
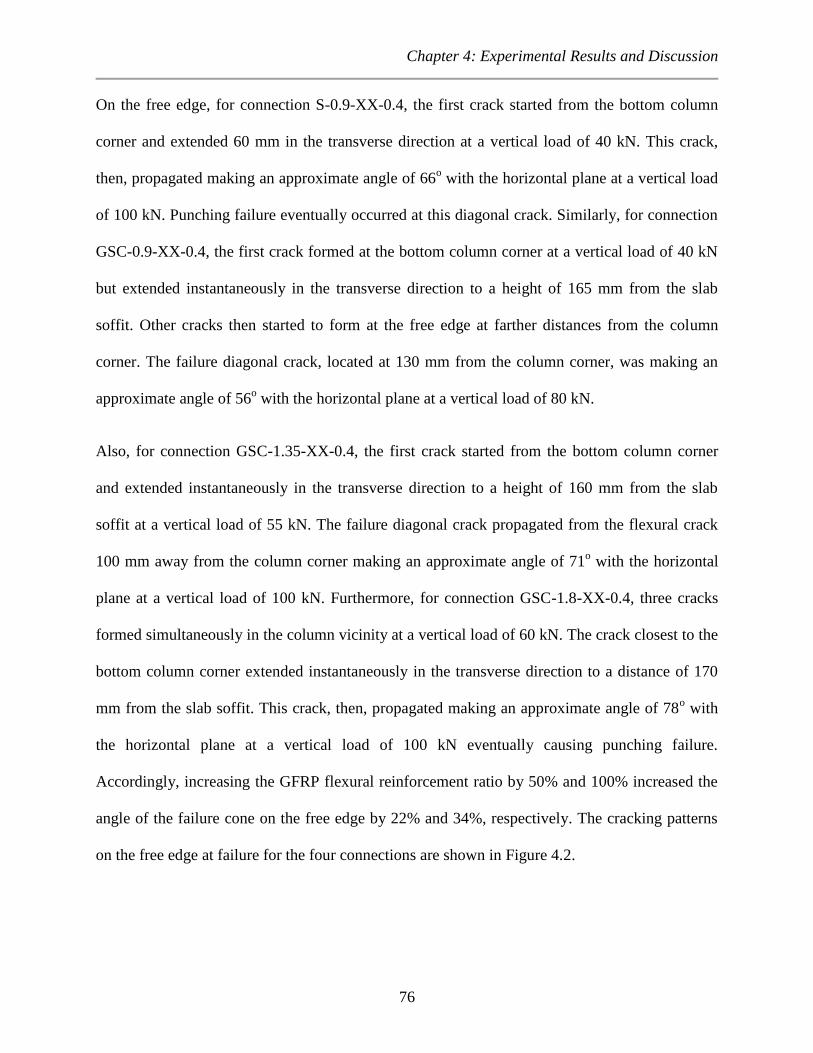
Chapter 4: Experimental Results and Discussion
76
On the free edge, for connection S-0.9-XX-0.4, the first crack started from the bottom column
corner and extended 60 mm in the transverse direction at a vertical load of 40 kN. This crack,
then, propagated making an approximate angle of 66o with the horizontal plane at a vertical load
of 100 kN. Punching failure eventually occurred at this diagonal crack. Similarly, for connection
GSC-0.9-XX-0.4, the first crack formed at the bottom column corner at a vertical load of 40 kN
but extended instantaneously in the transverse direction to a height of 165 mm from the slab
soffit. Other cracks then started to form at the free edge at farther distances from the column
corner. The failure diagonal crack, located at 130 mm from the column corner, was making an
approximate angle of 56o with the horizontal plane at a vertical load of 80 kN.
Also, for connection GSC-1.35-XX-0.4, the first crack started from the bottom column corner
and extended instantaneously in the transverse direction to a height of 160 mm from the slab
soffit at a vertical load of 55 kN. The failure diagonal crack propagated from the flexural crack
100 mm away from the column corner making an approximate angle of 71o with the horizontal
plane at a vertical load of 100 kN. Furthermore, for connection GSC-1.8-XX-0.4, three cracks
formed simultaneously in the column vicinity at a vertical load of 60 kN. The crack closest to the
bottom column corner extended instantaneously in the transverse direction to a distance of 170
mm from the slab soffit. This crack, then, propagated making an approximate angle of 78o with
the horizontal plane at a vertical load of 100 kN eventually causing punching failure.
Accordingly, increasing the GFRP flexural reinforcement ratio by 50% and 100% increased the
angle of the failure cone on the free edge by 22% and 34%, respectively. The cracking patterns
on the free edge at failure for the four connections are shown in Figure 4.2.

Chapter 4: Experimental Results and Discussion
77
a) Connection S-0.9-XX-0.4
b) Connection GSC-0.9-XX-0.4
c) Connection GSC-1.35-XX-0.4
d) Connection GSC-1.8-XX-0.4
Figure 4.2: Cracking on the free edge at failure for Series I connections
4.2.2. Deflections
In general, the load-deflection relationship for steel-RC slab-column connections can be
approximated by three straight lines defining three different stages of behaviour according to the
significant changes in the stiffness (Alexander and Simmonds 1992). Stage I represents the

Chapter 4: Experimental Results and Discussion
78
uncracked behaviour of the slab from the start of loading until the point of first cracking. At this
stage, since the slab is uncracked, the slab stiffness depends mainly on the dimensions of the
concrete cross section. Stage II represents the cracked behaviour of the connection; it begins
after cracks have stabilized and extends up to the point where reinforcement yielding takes place.
At this stage, the slab stiffness depends mainly on the axial stiffness of the flexural
reinforcement, i.e., the product of the flexural reinforcement ratio and the reinforcement modulus
of elasticity, ρ , rather than the cross-sectional dimensions. Stage III represents the extensive
plastic deformations of the slab after yielding of reinforcement (Alexander and Simmonds 1992).
On the other hand, a typical load-deflection relationship for FRP-RC slab-column connections
failing in punching shear has only the first two stages since FRP reinforcement does not yield.
Stages I and II are quantified herein using the pre-cracking and post-cracking stiffness factors, ki
and kp, respectively (Table 4.1). These factors represent the slope of the load-deflection curve
before and after cracking, respectively.
Figure 4.3 shows the relationship between the vertical load and the deflection at the column face.
The self-weight of the connections was neither included in deflection nor vertical load values. It
is obvious that connection S-0.9-XX-0.4 exhibited only the first two stages because the punching
failure occurred before extensive yielding of the reinforcement has taken place. For the GFRP-
RC connections, increasing the flexural reinforcement ratio had a considerable effect on the post-
cracking stiffness. Increasing the flexural reinforcement ratio by 50% and 100% increased the
post-cracking stiffness factor by 62% and 119%, respectively. Consequently, increasing the
flexural reinforcement ratio decreased the deflections at the same load level. However, it can be
seen that, up to a vertical load of 110 kN, connection GSC-1.8-XX-0.4 had higher deflections
than connection GSC-1.35-XX-0.4 which have a 25% less reinforcement ratio. This is attributed

Chapter 4: Experimental Results and Discussion
79
to the higher cracking load for connection GSC-1.35-XX-0.4 which delayed the initiation of
flexural cracks and, in turn, delayed the transition of the behaviour of the section from a gross
moment of inertia-dependent behaviour to an effective moment of inertia-dependent one.
Furthermore, increasing the flexural reinforcement ratio by 50% and 100% decreased the
maximum deflections 50 mm from the column face by 28% (from 39 mm to 28 mm) and 39%
(from 39 mm to 24 mm), respectively. It can be seen in Figure 4.4 that the post-cracking stiffness
factor increases approximately linearly with increasing the flexural reinforcement ratio.
Figure 4.3: Load-deflection relationship for Series I connections
The post-cracking stiffness factor for connection S-0.9-XX-0.4 was 11.1 kN/mm. This is 37%
higher than that of connection GSC 1.8-XX-0.4 (8.1 kN/mm). Moreover, the deflection at the
service level for connection S-0.9-XX-0.4 was 6.7 mm which is 37% less than that of connection
GSC-1.8-XX-0.4 (10.6 mm) although they both were designed to satisfy the serviceability
requirements relevant to each type of reinforcement. This is attributed to the more relaxed
serviceability requirement for the FRP-RC elements. The serviceability requirements of both
0
50
100
150
200
250
300
350
0 10 20 30 40 50
Ver
tica
l L
oad
(kN
)
Deflection (mm)
S-0.9-XX-0.4
G-0.9-XX-0.4
G-1.35-XX-0.4
G-1.8-XX-0.4
Service Level

Chapter 4: Experimental Results and Discussion
80
connections were governed by the crack control parameter provision (Appendix A). This
parameter implicitly limits the maximum crack width for steel-RC flexural members to 0.4 and
0.33 mm for interior and exterior exposure, respectively (Cement Association of Canada 2006).
While for FRP reinforcement, which does not corrode, these limitations are relaxed in the case
of FRP- RC elements to 0.7 and 0.5 mm, respectively (Canadian Standards Association 2006,
2012).
Figure 4.4: Reinforcement ratio vs. the post-cracking stiffness factor relationship
Ductility is the ability of a structural element to undergo substantial plastic deformations before
fracture. In steel-RC slab-column connections, ductility is quantified by a rotation or a
displacement ductility factor which is calculated as the ratio of the rotation or displacement at
ultimate to those at steel reinforcement yielding (Marzouk et al. 1996). These factors provide
means of comparison between levels of safety at ultimate and service states. Although FRP
reinforcement does not yield, FRP-RC structures exhibit substantial deflections before fracture
due to the low modulus of elasticity of FRP reinforcement. CHBDC S6-06 (Canadian Standards
Association 2006) assesses this deformable behaviour of FRP-RC structures by the deformability
factor, J, which is an analogues factor to the ductility factor and was first introduced in 1995
3
4
5
6
7
8
9
0.9 1 1.1 1.2 1.3 1.4 1.5 1.6 1.7 1.8 1.9
Po
st-C
rack
ing S
tiff
nes
s F
acto
r
(kN
/mm
)
Flexural Reinforcement Ratio (%)

Chapter 4: Experimental Results and Discussion
81
(Jaeger et al. 1995). The deformability factor is calculated using Equation 4.1 where M and Ψ are
the moment and curvature of a section, respectively, and the subscripts u and s stand for the
ultimate and service levels, respectively. The CHBDC S6-06 defines the service state as the state
corresponding to a compressive strain in the outermost concrete fibres of 1000 s, i.e., when the
extreme compression fibres of concrete reach its proportional limit.
Some of the connections tested herein did not reach a compressive strain of 1000 s in the
extreme compression fibres. This, according to the aforementioned definition of deformability,
implies that these connections did not show any ample warning before the brittle punching
failure. However, another definition for the service condition was introduced by Newhook et al.
(2002) and later adopted by ISIS Canada (2001), consider it as the state corresponding to a
tensile strain in the flexural reinforcement of 2000 s. In this study, the latter definition will be
used for comparison purposes. Moreover, in this discussion, the deformability factor will be
calculated using Equation 4.2 which incorporates vertical loads, P, and displacements, Δ, instead
of moments and curvatures at failure and service states.
Eq. [4.1]
Eq. [4.2]
The deformability factors for the three GFRP-RC connections are listed in Table 4.1. The
deformability factors were 24.1, 21.4 and 7.6 for connections GSC-0.9-XX-0.4, GSC-1.35-XX-
0.4 and GSC-1.8-XX-0.4, respectively. Increasing the reinforcement ratio by 50% and 100%
decreased the deformability factor by 11% and 68%, respectively. Yet, the three values are
considerably above the minimum limit of 4 adopted by ISIS Canada (ISIS Canada 2001).

Chapter 4: Experimental Results and Discussion
82
Therefore, using reinforcement ratios as high as 1.8%, which is 5.3 times the balanced
reinforcement ratio, still allows the connection to give ample warning before failure.
4.2.3. Flexural Reinforcement and Concrete Strains
Figure 4.5 shows the relationship between the vertical load and the reinforcement and concrete
strains at the column face. It is to be noted that the gauge in connection S-0.9-XX-0.4
malfunctioned at 88% of the failure load (269 kN). This happened before showing any signs of
yielding at this location at a reading of 2420 µs. However, yielding of steel reinforcement at the
column face was recorded on the bars parallel to the free edge at a load of 78% of the failure load
(240 kN).
Figure 4.5: Load-strain relationship for Series I connections
The reinforcement strains after cracking varied approximately linearly with increasing the load
for the four connections. For the GFRP-RC connections, increasing the flexural reinforcement
ratio decreased the reinforcement strains at the same load level. This is a direct result of
providing additional reinforcement to carry the same load/moment. However, the measured
0
50
100
150
200
250
300
350
-4000 -2000 0 2000 4000 6000 8000 10000 12000
Ver
tica
l L
oad
(kN
)
Strain (s)
S-0.9-XX-0.4GSC-0.9-XX-0.4GSC-1.35-XX-0.4GSC-1.8-XX-0.4
Service Level
Chapter 4: Experimental Results and Discussion
83
reinforcement strains in connection GSC-1.8-XX-0.4 were higher than those in connection GSC-
1.35-XX-0.4, which has 25% less reinforcement ratio, up to a load of about 110 kN. Again, this
is attributed to the higher cracking load of connection GSC-1.35-XX-0.4 compared to that of
connection GSC-1.8-XX-0.4 which delayed the onset of cracking in connection GSC-1.35-XX-
0.4 and, consequently, the development of tensile strains in the reinforcing bar in this connection.
Furthermore, increasing the flexural reinforcement ratio decreased the reinforcement strain at
failure; increasing the reinforcement ratio by 50% and 100% decreased the maximum
reinforcement strain by 16% and 48%, respectively. The maximum reinforcement strains were
recorded on the bar passing through the column perpendicular to the free edge for the three
GFRP-RC connections as listed in Table 4.1. The maximum strain in the reinforcing bars
occurred in connection GSC-0.9-XX-0.4, i.e. the one with the lowest GFRP flexural
reinforcement ratio, and was 9780 s; this is 42.5% of the ultimate tensile strain of the used
GFRP bars. Moreover, the maximum recorded concrete strains for the three connections were
well below 3500 s, i.e. the concrete crushing strain specified by the CAN/CSA S806-12. This
confirms that the failure mode was pure punching rather than a flexural failure.
The reinforcement strain at the service level for connection GSC-1.8-XX-0.4 was 2900 s. This
is 50% less than the service strain limit specified by the CAN/CSA S806-12 which is 25% of the
rupture strain of the used bars (5750 s). However, it is 112% higher than that of connection S-
0.9-XX-0.4 (1370 s). Again, this is attributed to the more relaxed crack control limitations in
the case of FRP-RC elements compared to the case of steel-RC elements.
Figures 4.6 and 4.7 show the reinforcement strain profiles in the directions perpendicular and
parallel to the free edge, respectively. The strain profiles in both orthogonal directions for the

Chapter 4: Experimental Results and Discussion
84
three connections clearly demonstrate that the strains were inversely proportional to the distance
of the strain gauge from the column face. This implies a good bond between the sand-coated
GFRP bars and the surrounding concrete. Similar behaviour of slab-column interior connections
reinforced with sand-coated GFRP bars subjected to concentric loading was reported in the
literature (Hussein et al. 2004; Dulude et al. 2013).
a) Connection GSC-0.9-XX-0.4
b) Connection GSC-1.35-XX-0.4
Figure 4.6: Reinforcement strain profile perpendicular to the free edge
0
2000
4000
6000
8000
10000
12000
035070010501400
Str
ain (
s)
Distance from Column Centre (mm)
100%80%60%40%20%
Co
lum
n F
ace
0
2000
4000
6000
8000
10000
12000
035070010501400
Str
ain (
s)
Distance from Column Centre (mm)
100%80%60%40%20%
Co
lum
n F
ace

Chapter 4: Experimental Results and Discussion
85
c) Connection GSC-1.8-XX-0.4
Figure 4.6: Reinforcement strain profile perpendicular to the free edge – continued
a) Connection GSC-0.9-XX-0.4
Figure 4.7: Reinforcement strain profile parallel to the free edge
0
2000
4000
6000
8000
10000
12000
035070010501400
Str
ain (
s)
Distance from Column Centre (mm)
100%80%60%40%20%
Co
lum
n F
ace
0
2000
4000
6000
8000
10000
12000
035070010501400
Str
ain (
s)
Distance from Column Centre (mm)
100%80%60%40%20%
Co
lum
n F
ace

Chapter 4: Experimental Results and Discussion
86
b) Connection GSC-1.35-XX-0.4
c) Connection GSC-1.8-XX-0.4
Figure 4.7: Reinforcement strain profile parallel to the free edge - continued
4.2.4. Punching Shear Capacity
The failure loads of the connections were normalized by being multiplied by √ ⁄ , where fc
’
is the actual concrete compressive strength, in MPa, of the connection at the day of testing and
40 MPa is a reference strength based on the average concrete strengths of the tested connections,
to eliminate the effect of the relative differences in the concrete strengths. The cubic root was
0
2000
4000
6000
8000
10000
12000
035070010501400
Str
ain (
s)
Distance from Column Centre (mm)
100%80%60%40%20%
Co
lum
n F
ace
0
2000
4000
6000
8000
10000
12000
035070010501400
Str
ain (
s)
Distance from Column Centre (mm)
100%80%60%40%20%
Co
lum
n F
ace

Chapter 4: Experimental Results and Discussion
87
used rather than the square root to align with the CAN/CSA S806-12 equation for punching
shear which considers the effect of the concrete compressive strength to the power of 1/3. The
actual and normalized failure loads are listed in Table 4.2.
Increasing the reinforcement ratio from 0.9% to 1.35% increased the normalized capacity by
18.2%. This is attributed to the increased reinforcement axial stiffness, ρ . Increasing the
reinforcement axial stiffness controls the propagation of cracks leading to narrower and shorter
cracks. This increases the contribution of the aggregate interlock component to the shear strength
of the section and increases the depth of the uncracked concrete. In addition, increasing the
flexural reinforcement ratio increases the contribution of the dowel action. This effect, however,
is not as significant as the earlier two because the transverse strength and stiffness of the FRP
bars is considerably small. However, further increasing the reinforcement ratio to 1.8% did not
result in a further increase in the normalized capacity. This unexpected behaviour is hard to
explain; however, having in mind the superior initial behaviour of connection GSC-1.35-XX-0.4
due to its higher cracking load, it seems that the high capacity of connection GSC-1.35-XX-0.4 is
the unusual behaviour rather than the low capacity of connection GSC-1.8-XX-0.4. Figure 4.8
shows the relationship between the flexural reinforcement ratio and the normalized failure load.
Table 4.2: Actual and normalized failure loads for Series I connections
Connection
Flexural
Reinforcement
Ratio, ρ
(%)
Concrete
Compressive
Strength, fc’
(MPa)
Actual
Failure
Loads
(kN)
Normalized
Failure
Loads
(kN)
S-0.9-XX-0.4 0.9 41.3 306.4 303.2
GSC-0.9-XX-0.4 0.9 41.1 227.1 225.1
GSC-1.35-XX-0.4 1.35 41.0 268.2 266
GSC-1.8-XX-0.4 1.8 45.6 276.9 265
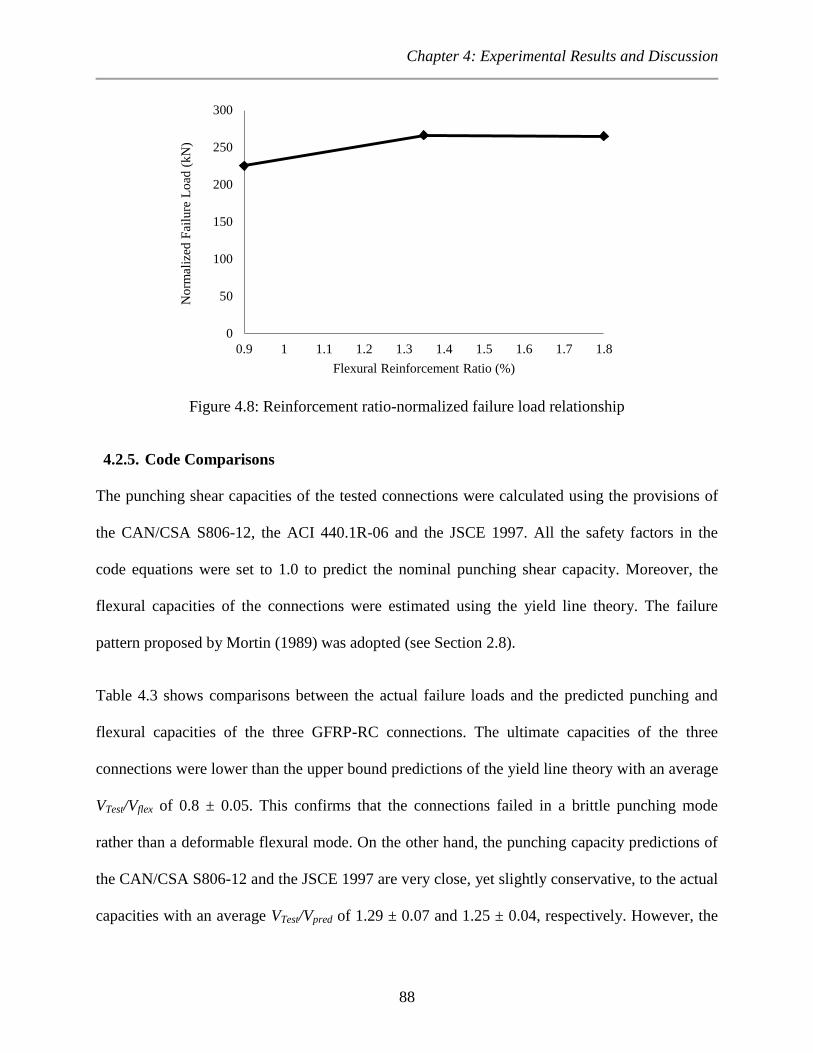
Chapter 4: Experimental Results and Discussion
88
Figure 4.8: Reinforcement ratio-normalized failure load relationship
4.2.5. Code Comparisons
The punching shear capacities of the tested connections were calculated using the provisions of
the CAN/CSA S806-12, the ACI 440.1R-06 and the JSCE 1997. All the safety factors in the
code equations were set to 1.0 to predict the nominal punching shear capacity. Moreover, the
flexural capacities of the connections were estimated using the yield line theory. The failure
pattern proposed by Mortin (1989) was adopted (see Section 2.8).
Table 4.3 shows comparisons between the actual failure loads and the predicted punching and
flexural capacities of the three GFRP-RC connections. The ultimate capacities of the three
connections were lower than the upper bound predictions of the yield line theory with an average
VTest/Vflex of 0.8 ± 0.05. This confirms that the connections failed in a brittle punching mode
rather than a deformable flexural mode. On the other hand, the punching capacity predictions of
the CAN/CSA S806-12 and the JSCE 1997 are very close, yet slightly conservative, to the actual
capacities with an average VTest/Vpred of 1.29 ± 0.07 and 1.25 ± 0.04, respectively. However, the
0
50
100
150
200
250
300
0.9 1 1.1 1.2 1.3 1.4 1.5 1.6 1.7 1.8
No
rmal
ized
Fai
lure
Lo
ad (
kN
)
Flexural Reinforcement Ratio (%)

Chapter 4: Experimental Results and Discussion
89
ACI 440.1R-06 highly underestimates the capacities with an average VTest/Vpred of 2.19 ± 0.17.
The reason behind this underestimation is that the punching shear equation in the ACI 440.1R-06
is originally derived from the one-way shear model proposed by Tureyen and Frosch (2003).
This model accounts for the uncracked concrete contribution only to resist the applied shear
stresses and ignores the aggregate interlock and the dowel action contributions as discussed in
Section 2.6.2.2.
4.3. SERIES II - EFFECT OF FLEXURAL REINFORCEMENT TYPE
Three connections were assigned to investigate the effect of flexural reinforcement type on the
punching shear behaviour, i.e., S-0.9-XX-0.4, GSC-0.9-XX-0.4 and GRD-0.9-XX-0.4.
4.3.1. Cracking Pattern and Mode of Failure
The three connections failed in a brittle punching shear mode with no signs of flexural failure.
However, connection GRD-0.9-XX-0.4 exhibited a less brittle punching failure than the other
two connections characterized by significant deflections/deformations at a steady load level just
before the drastic load drop due to the punching failure. This deformable behaviour could be
attributed to loss of bond between the reinforcing bars and the surrounding concrete a short time
before failure as will be discussed in Section 4.3.3. The test results are listed in Table 4.4. Figure
4.9 shows the cracking pattern at failure on the tension face and the free edge for connection
GRD-0.9-XX-0.4. The final cracking patterns for the three connections (Figures 4.1, 4.2 and 4.9)
and the propagation of cracks were similar despite the different reinforcement types.

Chapter 4: Experimental Results and Discussion
90
Table 4.3: Code comparisons for Series I connections
Connection
Actual
Failure
Loads, VTest
(kN)
Punching Shear Capacity Predictions, VPred
CAN/CSA S806-12 ACI 440.1R-06 JSCE 1997 Yield Line Theory
VPred VTest/VPred VPred VTest/VPred VPred VTest/VPred VPred VTest/VPred
GSC-0.9-XX-0.4 227.1 173.5 1.31 98.5 2.31 181.4 1.25 275.9 0.82
GSC-1.35-XX-0.4 268.2 198.2 1.35 118.7 2.26 207.9 1.29 321.6 0.83
GSC-1.8-XX-0.4 276.9 226.2 1.22 137.7 2.01 228.6 1.21 373 0.74
Mean 1.29
2.19
1.25 0.8
Standard Deviation 0.07 0.17 0.04 0.05
Table 4.4: Test results for Series II connections
Connection
Load
(kN)
Deflection
(mm)
Reinforcement Strain
(s)
Stiffness
Factor
(kN/mm) Deformability
Factor, J
Concrete
Strength, fc'
(MPa) Cr Fail Cr Fail Cr Fail ki kp
S-0.9-XX-0.4 40
306.4 0.4 19.2 113 10804# 128.7 11.1 1.8
^ 41.3
GSC-0.9-XX-0.4 32 227.1 0.4 39.3 175 9776 91.8 3.7 24.1 41.1
GRD-0.9-XX-0.4 36 191.2 0.5 38 138# 7979 85 3.9 19.4 41
*Cr, at first cracking; Fail, at failure; ki, pre-cracking stiffness factor; kp, post-cracking stiffness factor; and fc
', concrete compressive strength.
#parallel to the free edge
^Ductility = deflection at failure/deflection at first yielding

Chapter 4: Experimental Results and Discussion
91
a) Tension face
b) Free edge
Figure 4.9: Cracking at failure for connection GRD-0.9-XX-0.4
4.3.2. Deflections
Figure 4.10 shows the relationship between the vertical load and the deflection at the column
face. Although FRP reinforcement does not yield, connection GRD-0.9-XX-0.4 exhibited a
plateau similar to that defining the yielding of steel reinforcement in steel-RC elements before
failure. That is, while the load increased only by 2% (from 187.4 to 191.2 kN), the deflections
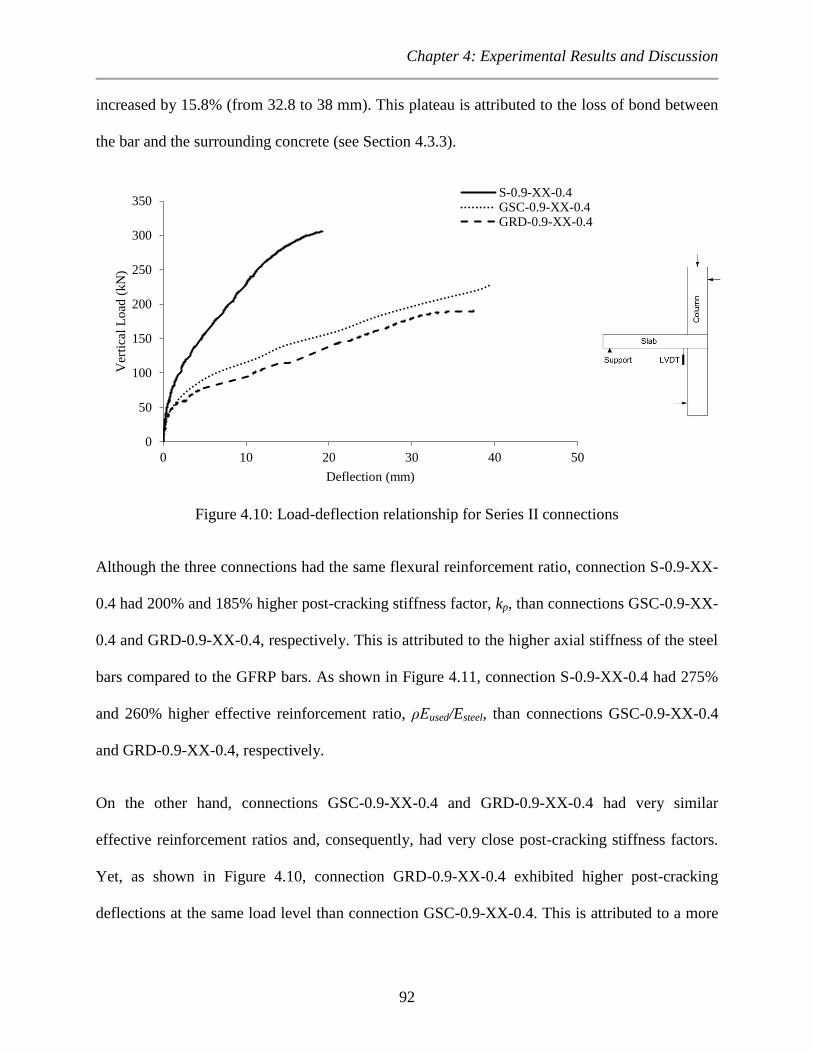
Chapter 4: Experimental Results and Discussion
92
increased by 15.8% (from 32.8 to 38 mm). This plateau is attributed to the loss of bond between
the bar and the surrounding concrete (see Section 4.3.3).
Figure 4.10: Load-deflection relationship for Series II connections
Although the three connections had the same flexural reinforcement ratio, connection S-0.9-XX-
0.4 had 200% and 185% higher post-cracking stiffness factor, kp, than connections GSC-0.9-XX-
0.4 and GRD-0.9-XX-0.4, respectively. This is attributed to the higher axial stiffness of the steel
bars compared to the GFRP bars. As shown in Figure 4.11, connection S-0.9-XX-0.4 had 275%
and 260% higher effective reinforcement ratio, ρ used/Esteel, than connections GSC-0.9-XX-0.4
and GRD-0.9-XX-0.4, respectively.
On the other hand, connections GSC-0.9-XX-0.4 and GRD-0.9-XX-0.4 had very similar
effective reinforcement ratios and, consequently, had very close post-cracking stiffness factors.
Yet, as shown in Figure 4.10, connection GRD-0.9-XX-0.4 exhibited higher post-cracking
deflections at the same load level than connection GSC-0.9-XX-0.4. This is attributed to a more
0
50
100
150
200
250
300
350
0 10 20 30 40 50
Ver
tica
l L
oad
(kN
)
Deflection (mm)
S-0.9-XX-0.4GSC-0.9-XX-0.4GRD-0.9-XX-0.4

Chapter 4: Experimental Results and Discussion
93
abrupt loss of the uncracked stiffness for connection GRD-0.9-XX-0.4 than that for connection
GSC-0.4XX-0.4. Figure 4.12 shows the relationship between the vertical load and the deflection
at the column face at early load stages. Also, Figure 4.13 shows the relationship between the
vertical load and the flexural reinforcement strain at the column face at early load stages.
Figure 4.11: Effective reinforcement ratio vs. post-cracking stiffness
As shown in Figure 4.12, while connection GSC-0.9-XX-0.4 exhibited a smooth gradual loss of
its uncracked stiffness, an abrupt loss of stiffness took place in connection GRD-0.9-XX-0.4
between vertical loads of 47 kN and 59 kN followed by a relatively high constant rate of losing
the stiffness until a vertical load of 100 kN when the crack formation stabilized and the cracked
stiffness of the section was maintained. Correspondingly, as shown in Figure 4.14, while the
reinforcement strains in connection GSC-0.9-XX-0.4 started to increase gradually after first
cracking, the bars in connection GRD-0.9-XX-0.4 did not develop any strains up to a vertical
load of 57 kN. The concrete surface at the inner column face remained uncracked until a crack
suddenly formed at a vertical load of 57 kN releasing a high amount of energy. This, in turn, led
0
2
4
6
8
10
12
0.2 0.3 0.4 0.5 0.6 0.7 0.8 0.9 1
Po
st-C
rack
ing S
tiff
nes
s F
acto
r (k
N/m
m)
Effective Flexural Reinforcement Ratio (%)

Chapter 4: Experimental Results and Discussion
94
to a sudden increase in the reinforcement strains and a sudden reduction in the stiffness of the
slab. The slope of the load-strain curve increased once the formation of the cracks stabilized at a
vertical load of 100 kN. The formation of a relatively wide crack at the inner column face in
connection GRD-0.9-XX-0.4 was visually marked during the test as shown in Figure 4.14.
Figure 4.12: Load-deflection relationship at early load stages
Figure 4.13: Load-reinforcement strain at early load stages
0
20
40
60
80
100
120
140
0 5 10 15 20 25
Ver
tica
l L
oad
(kN
)
Deflection (mm)
GSC-0.9-XX-0.4GRD-0.9-XX-0.4
0
20
40
60
80
100
120
140
0 1000 2000 3000 4000 5000 6000
Ver
tica
l L
oad
(kN
)
Strain (µs)
GSC-0.9-XX-0.4
GRD-0.9-XX-0.4

Chapter 4: Experimental Results and Discussion
95
Figure 4.14: The formation of a crack at the inner column face in connection GRD-0.9-XX-0.4
The deformability factors, J, for the GFRP-RC connections are listed in Table 4.4. The
connections showed considerable deformability with a deformability factor of 24.1 and 19.4 for
connections GSC-0.9-XX-0.4 and GRD-0.9-XX-0.4, respectively. This demonstrates the
capability of the GFRP-RC connections to provide an ample warning before failure.
4.3.3. Flexural Reinforcement and Concrete Strains
Figure 4.15 shows the relationship between the vertical load and the reinforcement and concrete
strains at the column face. The maximum reinforcement and concrete strain for connection GRD-
0.9-XX-0.4 were 7980 s and 1460 s which are 47.8% and 41.6% of the ultimate tensile strain
of the used ribbed-deformed GFRP bars and the concrete crushing strain specified by the
CAN/CSA S806-12, respectively. This indicates that the failure of the connection was pure
punching shear rather than flexural failure.

Chapter 4: Experimental Results and Discussion
96
Figure 4.15: Load-strain relationship for Series II connections
For the three connections, the strains after cracking varied linearly with increasing the vertical
load; however, there were two distinctive characters describing the behaviour of connection
GRD-0.9-XX-0.4. The first is a kink in the load-reinforcement strain curve at a load of
approximately 100 kN which depicts the stabilization of crack formation at the column face
(Section 4.3.2). The second is a plateau before failure similar to the yielding plateau that defines
the behaviour of steel-RC connections after reinforcement yielding. This plateau is characterized
by an increase in the strains from 6000 µs at a load of 187 kN to 7980 µs at a load of 191.2 kN
(at failure); this is a 33% increase in the strain with only 2% increase in the load. This sudden
increase in the strain readings before failure was evident not only at the column face but
approximately along the whole length of the reinforcing bars passing through the column in the
directions perpendicular and parallel to the free edge as shown in Figure 4.16.
Figure 4.16 shows the strain profiles for these two bars. In the direction perpendicular to the free
edge, the strains are inversely proportional to the distance from the column face up to 90% of the
0
50
100
150
200
250
300
350
-4000 -2000 0 2000 4000 6000 8000 10000 12000
Ver
tica
l L
oad
(kN
)
Strain (s)
S-0.9-XX-0.4GSC-0.9-XX-0.4GRD-0.9-XX-0.4

Chapter 4: Experimental Results and Discussion
97
failure load when the strains suddenly increased. The increase was 66%, 56%, 215% and 146%
for gauges number 1, 3, 4 and 5, respectively, while gauge number 2 malfunctioned at 70% of
the failure load. Furthermore, in the direction parallel to the free edge, the strain profile became
approximately uniform along the whole length of the bar as the strains increased at 90% of the
failure load by 30%, 97%, 57% and 82% for gauges number 22, 33, 44 and 55, respectively,
while gauge number 11 malfunctioned at 90% of the failure load. This indicates a loss of bond
between the reinforcing bar and the surrounding concrete.
Ospina et al. (2003) reported a similar behaviour of ribbed-deformed GFRP bars. They tested
four full-scale slab-column interior connections; one reinforced with conventional steel bars, one
reinforced with a two-dimensional GFRP grid and two were reinforced with ribbed-deformed
GFRP bars with flexural reinforcement ratios of 0.73% and 1.46%. They reported a uniform
strain distribution at failure in the connection reinforced with a 0.73% reinforcement ratio of
ribbed-deformed GFRP bars.
Connection GSC-0.9-XX-0.4 which had the same flexural reinforcement ratio and the same bar
diameter as connection GRD-0.9-XX-0.4 did not experience such behaviour (Figures 4.6 and
4.7). This implies that the used sand-coated bars have better bond characteristics than the used
ribbed-deformed bars. Similar conclusions were found by other researchers (Cosenza et al. 1997;
Kassem et al. 2011).
4.3.4. Punching Shear Capacity
The actual and the normalized failure loads for the three connections are listed in Table 4.5.
Connections GSC-0.9-XX-0.4 and GRD-0.9-XX-0.4 had 26% and 37% less capacity than
connection S-0.9-XX-0.4, respectively. This is attributed to the lower modulus of elasticity of the

Chapter 4: Experimental Results and Discussion
98
GFRP bars (sand-coated and ribbed-deformed) compared to that of the steel bars. However, the
decrease in the capacity was more pronounced for connection GRD-0.9-XX-0.4 than connection
GSC-0.9-XX-0.4 due to the loss of bond experienced in connection GRD-0.9-XX-0.4.
Consequently, connection GRD-0.9-XX-0.4 had 15.8% less capacity than connection GSC-0.9-
XX-0.4 although they have very similar effective flexural reinforcement ratio.
a) Perpendicular to the free edge
b) Parallel to the free edge
Figure 4.16: Reinforcement strain profile for connection GRD-0.9-XX-0.4
0
2000
4000
6000
8000
10000
12000
035070010501400
Str
ain (
s)
Distance from Column Centre (mm)
100%80%60%40%20%
Co
lum
n F
ace
0
2000
4000
6000
8000
10000
12000
035070010501400
Str
ain (
s)
Distance from Free Edge (mm)
100%80%60%40%20%
Co
lum
n F
ace

Chapter 4: Experimental Results and Discussion
99
Table 4.5: Actual and normalized failure loads for Series II connections
Connection
Effective
Flexural
Reinforcement
Ratio, ρ / s
(%)
Concrete
Compressive
Strength, fc’
(MPa)
Actual
Failure
Loads
(kN)
Normalized
Failure
Loads
(kN)
S-0.9-XX-0.4 0.9 41.3 306.4 303.2
GSC-0.9-XX-0.4 0.24 41.1 227.1 225.1
GRD-0.9-XX-0.4 0.25 41.0 191.2 189.6
4.3.5. Code Comparisons
Table 4.6 shows a comparison between the actual failure loads and the predicted punching and
flexural capacities of the three GFRP-RC connections. For the GFRP-RC connections, the
ultimate capacities were considerably lower than the predictions of the yield line theory with an
average VTest/Vflex of 0.75 ± 0.1 which confirms that the connections failed in a brittle punching
mode. On the other hand, the CAN/CSA S806-12 and the JSCE 1997 give very close
predictions; their predictions are slightly conservative with an average VTest/VPred of 1.21 ± 0.14
and 1.16 ± 0.13, respectively. This conservatism allowed both codes to provide an adequate
safety margin for the loss of bond in connection GRD-0.9-XX-0.4. On the contrary, the ACI
440.1R-06 highly underestimates the capacities with an average VTest/VPred of 2.13 ± 0.26. For
connection S-0.9-XX-0.4 reinforced with steel bars, the failure load was close to the flexural
capacity with a VTest/Vflex of 0.92. However, yielding of the steel reinforcement was localized at
the column vicinity only which indicates that a yield line pattern did not form and that the failure
mode was brittle punching shear. Furthermore, the JSCE 2007 gives very good estimates with a
VTest/VPred of 1.14. Also, although they do not consider the effect of the flexural reinforcement
ratio, the CAN/CSA A23.3-04 and the ACI 440.1R-06 give good predictions with a VTest/VPred of
1.13 and 1.34, respectively.

Chapter 4: Experimental Results and Discussion
100
For steel-RC connections, since the steel bars have a high modulus of elasticity, the depth of the
neutral axis does not vary significantly with varying the flexural reinforcement ratio; therefore,
the punching shear capacity is governed mainly by the concrete compressive strength.
Accordingly, unlike the case of the FRP-RC connections, the design formulas that do not
consider the effect of flexural reinforcement ratio or modulus will yield good results for the
steel-RC connections (El-Ghandour et al. 1999).
4.4. SERIES III - EFFECT OF MOMENT-TO-SHEAR RATIO
Three connections were assigned to investigate the effect of moment-to-shear ratio on the
punching shear behaviour, namely GSC-0.9-XX-0.2, GSC-0.9-XX-0.4 and GSC-0.9-XX-0.6.
4.4.1. Cracking Pattern and Mode of Failure
The three connections failed in a brittle punching shear mode with no signs of flexural failure,
i.e. concrete crushing at the compression face of the slab. Also, the cracking behaviour of the
three connections was similar. For connection GSC-0.9-XX-0.2, flexural cracks on the tension
face of the slab were first observed at the column face at a vertical load of 35 kN (Table 4.7).
Then, radial cracks started to propagate from all column faces towards the supported edges. The
first circumferential crack formed 290 mm from the inner column face at a vertical load of 100
kN. Similarly, for connection GSC-0.9-XX-0.6, the first crack was observed at the side face of
the column at a vertical load of 34 kN. Radial cracks then started to propagate from the column
vicinity towards the supported edges at a load of 80 kN. The first circumferential crack formed
350 mm from the inner column face at a vertical load of 100 kN. Figure 4.17 shows the cracking
pattern at failure for both connections on the tension face.
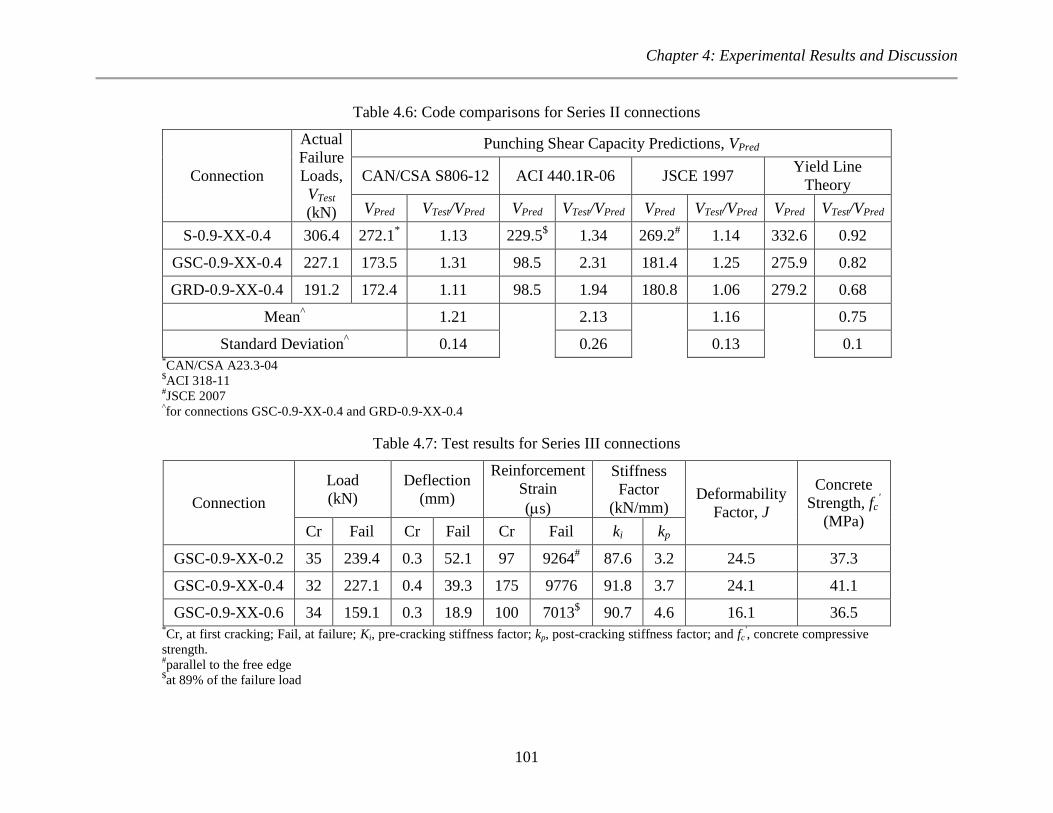
Chapter 4: Experimental Results and Discussion
101
Table 4.6: Code comparisons for Series II connections
Connection
Actual
Failure
Loads,
VTest
(kN)
Punching Shear Capacity Predictions, VPred
CAN/CSA S806-12 ACI 440.1R-06 JSCE 1997 Yield Line
Theory
VPred VTest/VPred VPred VTest/VPred VPred VTest/VPred VPred VTest/VPred
S-0.9-XX-0.4 306.4 272.1*
1.13 229.5$
1.34 269.2#
1.14 332.6 0.92
GSC-0.9-XX-0.4 227.1 173.5 1.31 98.5 2.31 181.4 1.25 275.9 0.82
GRD-0.9-XX-0.4 191.2 172.4 1.11 98.5 1.94 180.8 1.06 279.2 0.68
Mean^
1.21
2.13
1.16
0.75
Standard Deviation^
0.14 0.26 0.13 0.1 *CAN/CSA A23.3-04
$ACI 318-11
#JSCE 2007
^for connections GSC-0.9-XX-0.4 and GRD-0.9-XX-0.4
Table 4.7: Test results for Series III connections
Connection
Load
(kN)
Deflection
(mm)
Reinforcement
Strain
(s)
Stiffness
Factor
(kN/mm) Deformability
Factor, J
Concrete
Strength, fc'
(MPa) Cr Fail Cr Fail Cr Fail ki kp
GSC-0.9-XX-0.2 35 239.4 0.3 52.1 97
9264#
87.6 3.2 24.5 37.3
GSC-0.9-XX-0.4 32 227.1 0.4 39.3 175 9776 91.8 3.7 24.1 41.1
GSC-0.9-XX-0.6 34 159.1 0.3 18.9 100 7013$ 90.7 4.6 16.1 36.5
*Cr, at first cracking; Fail, at failure; Ki, pre-cracking stiffness factor; kp, post-cracking stiffness factor; and fc
', concrete compressive
strength. #parallel to the free edge
$at 89% of the failure load

Chapter 4: Experimental Results and Discussion
102
a) Connection GSC-0.9-XX-0.2
b) Connection GSC-0.9-XX-0.6
Figure 4.17: Cracking on the tension face at failure for Series III connections
Chapter 4: Experimental Results and Discussion
103
On the free edge, for connection GSC-0.9-XX-0.2, the first crack formed at the bottom corner of
the column and extended instantaneously in the transverse direction to a distance of 120 mm
from the slab soffit at a vertical load of 40 kN. Other cracks then started to form at farther
distances from the column face. At a vertical load of approximately 100 kN, diagonal cracks
started to propagate from all flexural cracks. The failure diagonal crack propagated from the
flexural crack at the bottom column corner making an approximate steep angle of 67o with the
horizontal away from the column. However, all other diagonal cracks propagated towards the
column. Similarly, for connection GSC-0.9-XX-0.6, the first crack formed at the bottom corner
of the column and extended instantaneously in the transverse direction until it approximately
reached the top surface of the slab at a height of 190 mm from the slab soffit at a vertical load of
60 kN. At a vertical load of 80 kN, the failure diagonal crack propagated from the flexural crack
located 100 mm away from the column corner and extended rapidly through the thickness of the
slab making an approximate angle of 44o with the horizontal plane. Figure 4.18 shows the
cracking pattern at failure for both connections on the free edge. In general, increasing the
moment-to-shear ratio decreased the number of cracks at failure on both the tension face and the
free edge of the slab. Increasing the moment-to-shear ratio increased the shear stresses applied to
the critical section which caused diagonal shear cracks to propagate faster and shear failure to
occur before significant flexural cracks form.
Connections GSC-0.9-XX-0.2 and GSC-0.9-XX-0.6 were saw-cut in the direction perpendicular
to the free edge after the test to investigate the propagation of diagonal cracks inside the slabs as
shown in Figures 4.19 and 4.20. The diagonal shear crack extended from the column face at the
compression face of the slab to the tension face of the slab with different inclination angles.
Increasing the moment-to-shear ratio pushed the failure surface on the tension face of the slab

Chapter 4: Experimental Results and Discussion
104
away from the column and led to a flatter angle of the diagonal crack. Increasing the ratio from
0.2 to 0.6 m decreased the diagonal crack angle with the horizontal at the tension face by 10%
(from 28.3o to 25.5
o) and at the free edge by 34%. This agrees with the findings of El-Salakawy
et al. (1998) and Marzouk et al. (2000).
a) Connection GSC-0.9-XX-0.2
b) Connection GSC-0.9-XX-0.6
Figure 4.18: Cracking on the free edge at failure for Series III connections
a) Connection GSC-0.9-XX-0.2
Figure 4.19: Internal diagonal cracks in the direction perpendicular to the free edge at failure

Chapter 4: Experimental Results and Discussion
105
b) Connection GSC-0.9-XX-0.6
Figure 4.19: Internal diagonal cracks in the direction perpendicular to the free edge at failure -
continued
a) GSC-0.9-XX-0.2 b) GSC-0.9-XX-0.6
Figure 4.20: Schematic drawing of the internal cracks

Chapter 4: Experimental Results and Discussion
106
Figure 4.21 shows the shear stress distribution on the critical shear perimeter located 0.5d from
the column face at a slab-column edge connection for different loading cases. Depending on the
value of the unbalanced moment transferred between the column and the slab, the shear stresses
on the two perimeter sides, perpendicular to the free edge, will act on either one direction or two
different directions as shown in Figure 4.21d and 4.21e, respectively. For the three connections
discussed herein, the latter case took place. Accordingly, the failure cone will form as shown in
Figure 4.22; while the diagonal cracks at the inner face of the column propagated from the
tension face towards the column, the cracks at the free edge propagated from the tension face
away from the column. The inclination angle in both cases depends on the value of the shear
stresses. Furthermore, increasing the moment-to-shear ratio will change the shear stress
distribution at the same vertical load level in the manner shown in Figure 4.23. The shear stress
on the free edge at the same load level increases with increasing the moment-to-shear ratio. As a
result, the angle of the shear cracks with the horizontal at the free edge is decreased.
a) Critical section at an edge connection
Figure 4.21: Shear stress distribution on the shear perimeter
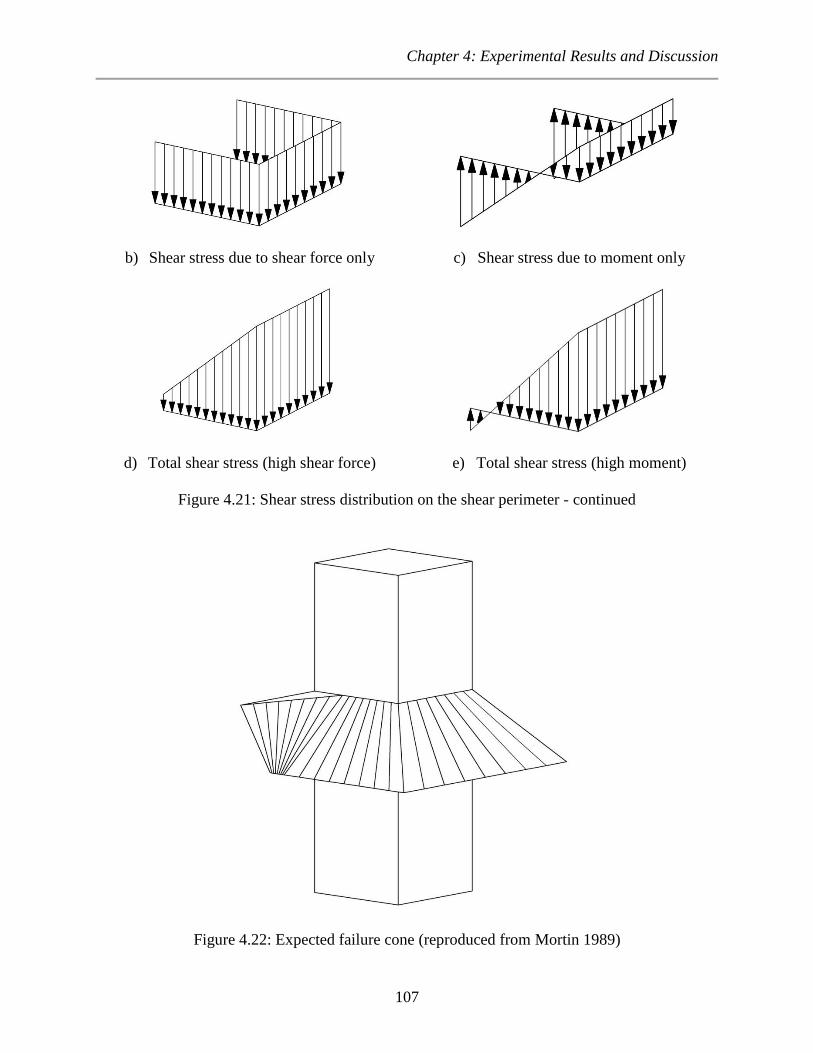
Chapter 4: Experimental Results and Discussion
107
b) Shear stress due to shear force only c) Shear stress due to moment only
d) Total shear stress (high shear force) e) Total shear stress (high moment)
Figure 4.21: Shear stress distribution on the shear perimeter - continued
Figure 4.22: Expected failure cone (reproduced from Mortin 1989)

Chapter 4: Experimental Results and Discussion
108
a) M/V=0.2 b) M/V=0.4
c) M/V=0.6
Figure 4.23: Shear stress distribution on the side face of the critical section, perpendicular to the
free edge, at the same shear load level
4.4.2. Deflections
Figure 4.24 shows the relationship between the vertical load and the deflection at the column
face. The moment-to-shear ratio has an insignificant effect on both the pre- and post-cracking
stiffness of the connections. However, increasing the moment-to-shear ratio from 0.2 m to 0.4 m
and 0.6 m decreased the maximum deflections by 21.4% and 62.2%, respectively.
Figure 4.24: Load-deflection relationship for Series III connections
0
50
100
150
200
250
300
0 10 20 30 40 50 60
Ver
tica
l L
oad
(kN
)
Deflection (mm)
GSC-0.9-XX-0.2
GSC-0.9-XX-0.4
GSC-0.9-XX-0.6

Chapter 4: Experimental Results and Discussion
109
4.4.3. Flexural Reinforcement and Concrete Strains
Figure 4.25 shows the relationship between the vertical load and the reinforcement and concrete
strains at the column face. It is to be noted that the reinforcement strain gauge in connection
GSC-0.9-XX-0.6 malfunctioned at 85.5% of the failure load at a reading of 6754 s. The
reinforcement strains after cracking varied approximately linearly with the increasing the load;
however, the rate of developing strains in connection GSC-0.9-XX-0.2 decreased abruptly at a
vertical load of 95 kN due to the formation of a second circumferential crack farther from the
column face. This is confirmed from Figure 4.26 which shows the strain distribution on the bar
passing through the column in the direction perpendicular to the free edge for connection GRD-
0.9-XX-0.4. It is obvious that gauge number 3 started to pick up strains at the same load level
when the graph of gauges number 1 and 2 started to propagate steeper.
Figure 4.25: Load-strain relationship for Series III connections
0
50
100
150
200
250
300
-4000 -2000 0 2000 4000 6000 8000 10000 12000
Ver
tica
l L
oad
(kN
)
Strain (s)
GSC-0.9-XX-0.2
GSC-0.9-XX-0.4
GSC-0.9-XX-0.6

Chapter 4: Experimental Results and Discussion
110
Figure 4.26: Load-reinforcement strain for connection GSC-0.9-XX-0.2
Increasing the moment-to-shear ratio increased the reinforcement and concrete strains at the
same load level since increasing the applied unbalanced moment increases the longitudinal
stresses applied at the slab section. The maximum recorded reinforcement strains at the column
face are 9261 s, 9776 s and 6754 s while the maximum recorded concrete strains are 736 s,
1619 s and 815 s for connections GSC-0.9-XX-0.2, GSC-0.9-XX-0.4 and GSC-0.9-XX-0.6,
respectively. These values were recorded in the direction perpendicular to the free edge for
connections GSC-0.9-XX-0.4 and GSC-0.9-XX-0.6 and in the direction parallel to the free edge
for connection GSC-0.9-XX-0.2. This indicates that applying a moment-to-shear ratio as low as
0.2 m reduced the radial moments in the strip perpendicular to the free edge compared to the
strip parallel to the free edge.
This can be noticed in Figure 4.27 which shows the relationship between the vertical load and
the reinforcement and concrete strains at the column face perpendicular and parallel to the free
edge for the three connections. It can be seen that the perpendicular strains are less than the
0
50
100
150
200
250
300
0 2000 4000 6000 8000 10000 12000
Ver
tica
l L
oad
(kN
)
Strain (s)
12345

Chapter 4: Experimental Results and Discussion
111
parallel ones at all load levels in connection GSC-0.9-XX-0.2. With increasing the moment-to-
shear ratio to 0.4 m, the perpendicular strains approaches the parallel ones and exceed them at
higher load levels. With a further increase in the moment-to-shear ratio to 0.6 m, the
perpendicular strains exceed the parallel ones at all load levels.
a) Connection GSC-0.9-XX-0.2
b) Connection GSC-0.9-XX-0.4
Figure 4.27: Load-reinforcement strain at the column face relationship
0
50
100
150
200
250
300
-4000 -2000 0 2000 4000 6000 8000 10000 12000
Ver
tica
l L
oad
(kN
)
Strain (s)
PerpendicularParallel
0
50
100
150
200
250
300
-4000 -2000 0 2000 4000 6000 8000 10000 12000
Ver
tica
l L
oad
(kN
)
Strain (s)
PerpendicularParallel

Chapter 4: Experimental Results and Discussion
112
c) Connection GSC-0.9-XX-0.6
Figure 4.27: Load-reinforcement strain at the column face relationship - continued
Figure 4.28 and 4.29 show the reinforcement strain profiles connections GSC-0.9-XX-0.2 and
GSC-0.9-XX-0.6 in the directions perpendicular and parallel to the free edge, respectively. For
both connections, the strains are inversely proportional to the distance of the gauge from the free
edge which indicates a good bond behaviour between the bars and the surrounding concrete. It is
noted that the strains in the perpendicular direction along the whole length of the bar are lower
than those in the parallel direction for connection GSC-0.9-XX-0.2 and higher for connection
GSC-0.9-XX-0.6 due to the increased moment-to-shear ratio.
0
50
100
150
200
250
300
-4000 -2000 0 2000 4000 6000 8000 10000 12000
Ver
tica
l L
oad
(kN
)
Strain (s)
Perpendicular
Parallel

Chapter 4: Experimental Results and Discussion
113
a) Connection GSC-0.9-XX-0.2
b) Connection GSC-0.9-XX-0.6
Figure 4.28: Reinforcement strain profile perpendicular to the free edge for Series III
connections
0
2000
4000
6000
8000
10000
12000
035070010501400
Str
ain (
s)
Distance from Column Centre (mm)
100%80%60%40%20%
Co
lum
n F
ace
0
2000
4000
6000
8000
10000
12000
035070010501400
Str
ain (
s)
Distance from Column Centre (mm)
100%80%60%40%20%
Co
lum
n F
ace

Chapter 4: Experimental Results and Discussion
114
a) Connection GSC-0.9-XX-0.2
b) Connection GSC-0.9-XX-0.6
Figure 4.29: Reinforcement strain profile parallel to the free edge for Series III connections
4.4.4. Punching Shear Capacity
The actual and normalized failure loads are listed in Table 4.8 and the relationship between the
moment-to-shear ratio and the normalized failure vertical load is shown in Figure 4.30.
Increasing the moment-to-shear ratio from 0.2 m to 0.4 m and 0.6 m decreased the normalized
0
2000
4000
6000
8000
10000
12000
035070010501400
Str
ain (
s)
Distance from Column Centre (mm)
100%80%60%40%20%
Co
lum
n F
ace
0
2000
4000
6000
8000
10000
12000
035070010501400
Str
ain (
s)
Distance from Column Centre (mm)
100%80%60%40%20%
Co
lum
n F
ace

Chapter 4: Experimental Results and Discussion
115
capacity by 8.1% and 33.1%, respectively. This is a result of the increased shear stresses at the
critical shear perimeter due to the increased unbalanced moment as shown in Equation 2.3
(Section 2.4.3.1).
Table 4.8: Actual and normalized failure loads for Series III connections
Connection
Moment-to-
Shear Ratio, M/V
(m)
Concrete
Compressive
Strength, fc’
(MPa)
Actual
Failure
Loads
(kN)
Normalized
Failure
Loads
(kN)
GSC-0.9-XX-0.2 0.2 37.3 239.4 245.0
GSC-0.9-XX-0.4 0.4 41.1 227.1 225.1
GSC-0.9-XX-0.6 0.6 36.5 159.1 164.0
Figure 4.30: Effect of moment-to-shear ratio on the normalized failure load
4.4.5. Code Comparisons
Table 4.9 shows comparisons between the actual failure loads and the predicted punching and
flexural capacities of the three connections. The ultimate capacities of the three connections were
considerably lower than the predictions of the yield line theory with an average VTest/Vflex of 0.74
0
50
100
150
200
250
300
0.2 0.25 0.3 0.35 0.4 0.45 0.5 0.55 0.6
No
rmal
ized
Fai
lure
Lo
ad (
kN
)
Moment-to-Shear Ratio (m)

Chapter 4: Experimental Results and Discussion
116
± 0.07 which confirms that the connections failed in a brittle punching mode rather than a
deformable flexural mode. On the other hand, the CAN/CSA S806-12 and the JSCE 1997 give
reasonable predictions with an average VTest/ VPred of 1.18 ± 0.16 and 1.11 ± 0.16, respectively.
However, the JSCE 1997 overestimates the capacity of connection GSC-0.9-XX-0.2 with a VTest/
VPred of 0.93. Furthermore, ACI 440.1R-06 highly underestimates the capacities of the
connections with an average VTest/ VPred of 2.07 ± 0.29. However, the degree of conservatism is
considerably less for connection GSC-0.9-XX-0.2.
4.5. SERIES IV - EFFECT OF SHEAR REINFORCEMENT
Three connections were assigned to investigate the effect of shear reinforcement on the punching
shear behaviour, i.e., GRD-0.9-XX-0.4, GRD-0.9-75-0.4 and GRD-0.9-50-0.4.
4.5.1. Cracking Pattern and Mode of Failure
Connection GRD-0.9-XX-0.4 (without shear reinforcement) failed in a brittle punching shear
mode with some deformability due to the loss of bond between flexural reinforcing bar and the
surrounding concrete as discussed in Section 4.3.1. On the contrary, connections GRD-0.9-75-
0.4 and GRD-0.9-50-0.4 (with shear reinforcement) failed in a deformable flexure mode with
considerable ample warning of impending failure. The flexural failure was characterized by
substantial deflections before failure along with crushing of the concrete on the compression face
of the slab at the column face as shown in Figure 4.31. The final cracking patterns on the tension
face for the three connections (Figures 4.9 and 4.32) were very similar. Also, the cracking
behaviour was similar to that described in Section 4.2.1. The only difference was that connection
GRD-0.9-XX-0.4 showed a punching cone at failure while the other two connections did not.
The test results are listed in Table 4.10.
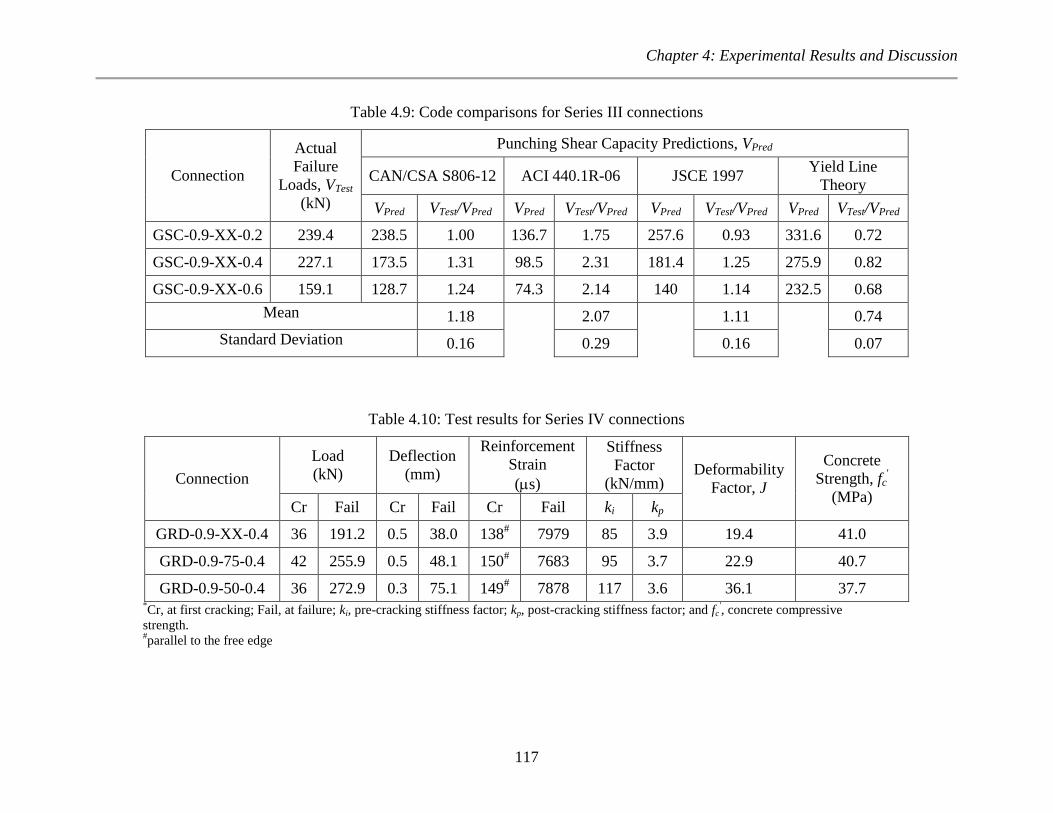
Chapter 4: Experimental Results and Discussion
117
Table 4.9: Code comparisons for Series III connections
Connection
Actual
Failure
Loads, VTest
(kN)
Punching Shear Capacity Predictions, VPred
CAN/CSA S806-12 ACI 440.1R-06 JSCE 1997 Yield Line
Theory
VPred VTest/VPred VPred VTest/VPred VPred VTest/VPred VPred VTest/VPred
GSC-0.9-XX-0.2 239.4 238.5 1.00 136.7 1.75 257.6 0.93 331.6 0.72
GSC-0.9-XX-0.4 227.1 173.5 1.31 98.5 2.31 181.4 1.25 275.9 0.82
GSC-0.9-XX-0.6 159.1 128.7 1.24 74.3 2.14 140 1.14 232.5 0.68
Mean 1.18
2.07
1.11 0.74
Standard Deviation 0.16 0.29 0.16 0.07
Table 4.10: Test results for Series IV connections
Connection
Load
(kN)
Deflection
(mm)
Reinforcement
Strain
(s)
Stiffness
Factor
(kN/mm) Deformability
Factor, J
Concrete
Strength, fc'
(MPa) Cr Fail Cr Fail Cr Fail ki kp
GRD-0.9-XX-0.4 36
191.2 0.5 38.0 138# 7979 85 3.9 19.4 41.0
GRD-0.9-75-0.4 42 255.9 0.5 48.1 150# 7683 95 3.7 22.9 40.7
GRD-0.9-50-0.4 36 272.9 0.3 75.1 149# 7878 117 3.6 36.1 37.7
*Cr, at first cracking; Fail, at failure; ki, pre-cracking stiffness factor; kp, post-cracking stiffness factor; and fc
', concrete compressive
strength.
#parallel to the free edge

Chapter 4: Experimental Analysis
118
a) Connection GRD-0.9-75-0.4
b) Connection GRD-0.9-50-0.4
Figure 4.31: Concrete crushing at the compression face of the slab for Series IV connections

Chapter 4: Experimental Analysis
119
a) Connection GRD-0.9-75-0.4
b) Connection GRD-0.9-50-0.4
Figure 4.32: Cracking on the tension face at failure for Series IV connections

Chapter 4: Experimental Analysis
120
Connections GRD-0.9-75-0.4 and GRD-0.9-50-0.4 were saw-cut in the direction perpendicular
to the free edge after the test to investigate the propagation of diagonal cracks inside the slabs as
shown in Figures 4.33 and 4.34. Although the columns did not punch in these two connections,
fine diagonal cracks can be seen in the vicinity of the column (inside the shear-reinforced zone).
The presence of the shear studs, however, controlled the propagation and prevented the widening
of these diagonal cracks which allowed the connections to reach their flexural capacity. For both
connections, the diagonal crack started from the compression face of the slab at the column face
and crossed the first line of studs (located at a distance 0.4d from the column face) at the upper
head. This crack, then, propagated making a relatively mild angle of 24o with the horizontal in
connection GRD-0.9-75-0.4 and crossed the following two lines of studs. However, in
connection GRD-0.9-50-0.4, the diagonal crack propagated making a steeper angle of 63o with
the horizontal and did not cross the second line of studs. Similar behaviour was reported in the
literature on steel-RC slab-column connections (Lips et al. 2012).
a) Connection GRD-0.9-75-0.4
Figure 4.33: Internal cracks in the direction perpendicular to the free edge at failure

Chapter 4: Experimental Analysis
121
b) Connection GRD-0.9-50-0.4
Figure 4.33: Internal cracks in the direction perpendicular to the free edge at failure - continued
a) Connection GRD-0.9-75-0.4 b) Connections GRD-0.9-50-0.4
Figure 4.34: Schematic drawing of the internal cracks

Chapter 4: Experimental Analysis
122
On the free edge, for connection GRD-0.9-75-0.4, the first crack started from the bottom column
corner and extended to a height of 140 mm in the transverse direction at a vertical load of 40 kN.
With increasing the load, other cracks started to form at farther distances from the column
corners. The main diagonal crack propagated from the flexural crack located 110 mm away from
the bottom column corner making an approximate angle of 42o with the horizontal at a vertical
load of 140 kN. However, the shear studs managed to control the widening of this crack
preventing the brittle punching shear failure. Connection GRD-0.9-50-0.4 behaved similarly;
however, the main diagonal crack propagated with a steeper angle of 71o with the horizontal.
Figure 4.35 shows the cracking patterns on the free edge at failure for both shear-reinforced
connections.
a) Connection GRD-0.9-75-0.4
b) Connection GRD-0.9-50-0.4
Figure 4.35: Cracking on the free edge at failure for Series IV connections
4.5.2. Deflections
Figure 4.36 shows the relationship between the vertical load and the deflection at the column
face. The shear reinforcement had very insignificant effect on the post-cracking stiffness. It,
however, significantly increased the deformability of the connections. Connection GRD-0.9-75-
0.4 (with shear studs spaced at 0.75d) had 18% higher deformability factor than connection

Chapter 4: Experimental Analysis
123
GRD-0.9-XX-0.4 (without shear studs). Furthermore, decreasing the spacing of the shear studs
from 0.75d in connection GRD-0.9-75-0.4 to 0.5d in connection GRD-0.9-50-0.4 increased the
deformability factor by 58% (from 22.9 to 36.1). Also, the well-anchored double-headed shear
studs substantially increased the deformation capacity of the connections. Connections GRD-0.9-
75-0.4 and GRD-0.9-50-0.4 had 27% and 98% higher deflections at failure than connection
GRD-0.9-XX-0.4.
Figure 4.36: Load-deflection relationship for Series IV connections
4.5.3. Flexural Reinforcement and Concrete Strains
Figure 4.37 shows the relationship between the vertical load and the reinforcement and concrete
strains at the column face. Again, for the three connections, the reinforcement strains after
cracking varied approximately linearly with increasing the vertical load except for connection
GRD-0.9-XX-0.4 where a plateau was experienced before failure due to the loss of bond
between the bar and the surrounding concrete at this location (Section 4.3.3). Accordingly,
although it failed at a lower load, connection GRD-0.9-XX-0.4 had higher reinforcement strain at
0
50
100
150
200
250
300
0 10 20 30 40 50 60 70 80
Ver
tica
l L
oad
(kN
)
Deflection (mm)
GRD-0.9-XX-0.4GRD-0.9-75-0.4GRD-0.9-50-0.4

Chapter 4: Experimental Analysis
124
failure (7979 s) than connections GRD-0.9-75-0.4 (7683 s) and GRD-0.9-50-0.4 (7878 s).
The maximum concrete strains were 1455 s, 2312 s and 5382 s for connections GRD-0.9-
XX-0.4, GRD-0.9-75-0.4 and GRD-0.9-50-0.4, respectively, which might indicate that only
connection GRD-0.9-50-0.4 exhibited a flexural failure mode. However, concrete crushing at the
column face on the compression face of the slab was observed for both connections with shear
reinforcement, i.e., connections GRD-0.9-75-0.4 and GRD-0.9-50-0.4), as shown in Figure 4.31.
Figure 4.37: Load-strain relationship for Series IV connections
Figures 4.38 and 4.39 show the strain profiles for the three connections in the directions
perpendicular and parallel to the free edge, respectively. Similar to connection GRD-0.9-XX-0.4
(see Section 4.3.3), connection GRD-0.9-50-0.4 exhibited a loss of bond between the bar and the
surrounding concrete before failure. This can be seen from the approximately uniform strain
distribution in both directions at failure.
0
50
100
150
200
250
300
-6000 -4000 -2000 0 2000 4000 6000 8000 10000 12000
Ver
tica
l L
oad
(kN
)
Strain (s)
GRD-0.9-XX-0.4GRD-0.9-75-0.4GRD-0.9-50-0.4

Chapter 4: Experimental Analysis
125
a) Connection GRD-0.9-75-0.4
b) Connection GRD-0.9-50-0.4
Figure 4.38: Reinforcement strain profile perpendicular to the free edge for Series IV
connections
0
2000
4000
6000
8000
10000
12000
035070010501400
Str
ain (
s)
Distance from Column Centre (mm)
100%80%60%40%20%
Co
lum
n F
ace
0
2000
4000
6000
8000
10000
12000
035070010501400
Str
ain (
s)
Distance from Column Centre (mm)
100%80%60%40%20%
Co
lum
n F
ace
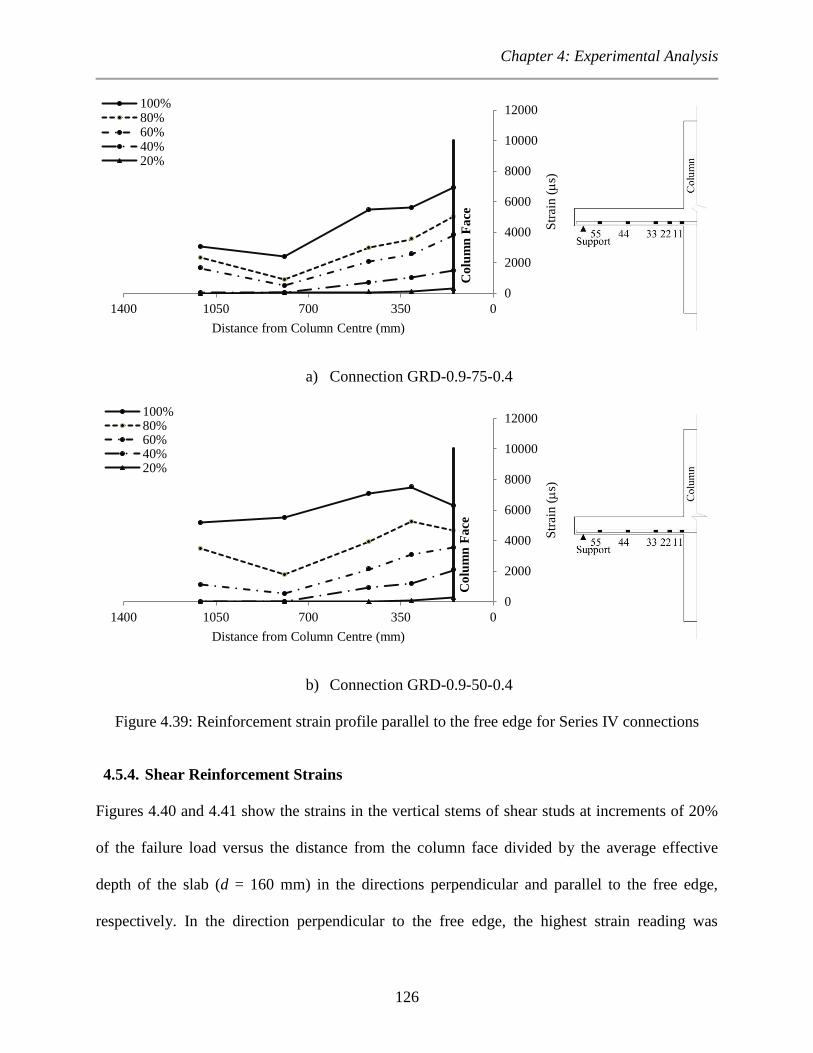
Chapter 4: Experimental Analysis
126
a) Connection GRD-0.9-75-0.4
b) Connection GRD-0.9-50-0.4
Figure 4.39: Reinforcement strain profile parallel to the free edge for Series IV connections
4.5.4. Shear Reinforcement Strains
Figures 4.40 and 4.41 show the strains in the vertical stems of shear studs at increments of 20%
of the failure load versus the distance from the column face divided by the average effective
depth of the slab (d = 160 mm) in the directions perpendicular and parallel to the free edge,
respectively. In the direction perpendicular to the free edge, the highest strain reading was
0
2000
4000
6000
8000
10000
12000
035070010501400
Str
ain (
s)
Distance from Column Centre (mm)
100%80%60%40%20%
Co
lum
n F
ace
0
2000
4000
6000
8000
10000
12000
035070010501400
Str
ain (
s)
Distance from Column Centre (mm)
100%80%60%40%20%
Co
lum
n F
ace

Chapter 4: Experimental Analysis
127
recorded from the stud at a distance 1.9d (1706 s) and 0.4d (1982 s) from the column faces for
connections GRD-0.9-75-0.4 and GRD-0.9-50-0.4, respectively. These measurements are in
good agreement with the internal cracking pattern (Section 4.5.1) where the diagonal crack
intersected with the three stud rows closest to the column face (up to a distance of 1.9d from the
column face) in connection GRD-0.9-75-0.4. While in connection GRD-0.9-50-0.4, the steeper
diagonal crack crossed only the first row of studs. Parallel to the free edge, the highest strain
reading was recorded from the stud at a distance 0.4d (2314 s) from the column face for
connections GRD-0.9-75-0.4 while other studs in this connection and all the studs in connection
GRD-0.9-50-0.4 developed relatively low strains. The CAN/CSA S806-12 and the ACI 440.1R-
06 limits the maximum strain in the vertical stem of the transverse FRP reinforcement to 5000 s
and 4000 s, respectively. The maximum strain in the studs was 2314 s and was recorded in
connection GRD-0.9-75-0.4. This value is only 46% and 58% of these two limits, respectively.
4.5.5. Punching Shear Capacity
The actual and the normalized failure loads for the three connections are listed in Table 4.11. The
ultimate capacity of the connections increased considerably with providing the stud shear
reinforcement. Connections GRD-0.9-75-0.4 and GRD-0.9-50-0.4 had 34% and 47% higher
capacity than connection GRD-0.9-XX-0.4 (without shear reinforcement), respectively. It should
be noted, however, that the full shear capacity of the latter two connections was not reached
since they failed in a deformable flexural failure mode.

Chapter 4: Experimental Analysis
128
a) Connection GRD-0.9-75-0.4
b) Connection GRD-0.9-50-0.4
Figure 4.40: Strains in studs vs. distance from column face perpendicular to the free edge
0
1000
2000
3000
4000
5000
6000
01234
Str
ain (
s)
Distance from column face divided by d
100%80%60%40%20%
CSA S806-12 strain limit
ACI 440.1R-06 strain limit
0
1000
2000
3000
4000
5000
6000
00.511.522.533.54S
trai
n (
s)
Distance from column face divided by d
100%
80%60%
40%
CSA S806-12 strain limit
ACI 440.1R-06 strain limit

Chapter 4: Experimental Analysis
129
a) Connection GRD-0.9-75-0.4
b) Connection GRD-0.9-50-0.4
Figure 4.41: Strains in studs vs. distance from column face parallel to the free edge
Table 4.11: Actual and normalized failure loads for Series IV connections
Connection
Concrete
Compressive
Strength, fc’
(MPa)
Actual
Failure
Loads
(kN)
Normalized
Failure
Loads
(kN)
GRD-0.9-XX-0.4 41.0 191.2 189.6
GRD-0.9-75-0.4 40.7 255.9 253.7
GRD-0.9-50-0.4 37.7 272.9 278.3
0
1000
2000
3000
4000
5000
6000
01234
Str
ain (
s)
Distance from column face divided by d
100%
80%
60%
40%
CSA S806-12 strain limit
ACI 440.1R-06 strain limit
0
1000
2000
3000
4000
5000
6000
01234S
trai
n (
s)
Distance from column face divided by d
100%80%60%40%
CSA S806-12 strain limit
ACI 440.1R-06 strain limit

Chapter 4: Experimental Analysis
130
4.5.6. Proposed Design Equations for Shear-Reinforced Slab-Column Connections
Neither the CAN/CSA S806-12 nor the ACI 440.1R-06 includes design provisions regarding the
design of FRP-RC slab-column connections with shear reinforcement. In this section, the
provisions regarding the design of FRP-RC slab-column connections without shear
reinforcement are modified to consider the shear reinforcement. The modifications are based on
the relationship between the provisions regarding the connections with and without shear
reinforcement in both the CAN/CSA A23.3-04 and the ACI 318-11 as follows.
4.5.6.1. Modifications of the CAN/CSA S806-12 provisions
In the CAN/CSA A23.3-04, for connections with shear reinforcement, the punching strength
provided by the concrete inside (Equation 2.11) and outside (Equation 2.10) the shear reinforced
zone is 75% and 50% of the strength of a connection without shear reinforcement (Equation 2.9),
respectively. Consequently, for FRP-RC connections, the punching equation of a connection
without shear reinforcement in the CAN/CSA S806-12 (Equation 2.28) is multiplied by the same
factors to obtain Equations 4.1 and 4.2 for the punching strength inside and outside the shear
reinforced zone, respectively.
( ) Eq. [4.1]
(
) Eq. [4.2]
Moreover, the equation of the punching strength provided by the shear studs in the CAN/CSA
A23.3-04 (Equation 2.12) is used in the case of FRP-RC connections with replacing the yield
strength of the studs, fy, by the ultimate strength of the studs with a limiting strain of 5000 s, ffu
= 0.005 Ef, as shown in Equation 4.3.

Chapter 4: Experimental Analysis
131
Eq. [4.3]
4.5.6.2. Modifications of the ACI 440.1R-06 provisions
Similarly, in the ACI 318-11, the punching strength provided by the concrete inside (Equation
2.17) and outside (Equation 2.16) the shear reinforced zone is 75% and 50% of the strength of a
connection without shear reinforcement (Equation 2.15), respectively. Consequently, the
punching equation of a connection without shear reinforcement in the ACI 440.1R-06 (Equation
2.29) is multiplied by the same factors to obtain Equations 4.4 and 4.5 for the punching strength
inside and outside the shear reinforced zone, respectively.
√ c Eq. [4.4]
√ c Eq. [4.5]
In addition, the equation of the punching strength provided by the shear studs in the ACI 318-11
(Equation 2.19) is used in the case of FRP-RC connections with replacing the yield strength of
the studs, fy, by the ultimate strength of the studs with a limiting strain of 4000 s, ffu = 0.004 Ef,
as shown in Equation 4.6.
Eq. [4.6]
4.5.7. Comparisons with the Proposed Equations
Table 4.12 shows the predictions of the two modified approaches to predict the punching
capacity of FRP-RC connections with shear reinforcement, the predictions of the yield line
theory and a comparison between the actual failure loads and these predictions. For connections
GRD-0.9-75-0.4 and GRD-0.9-50-0.4 with shear reinforcement, the actual failure loads were
0.91 and 0.86 of the failure loads predicted by the proposed models. These results are in good

Chapter 4: Experimental Analysis
132
agreement with the observed flexural failure mode of the two connections. However, since the
full punching capacities of the two connections were not reached, the proposed equations are not
completely verified. On the other hand, the predictions of the yield line theory closely match the
failure loads of the two shear-reinforced connections with an average VTest/Vflex of 0.97 ± 0.07.
Table 4.12: Code comparisons for Series IV connections
Connection
Actual
Failure
Loads,
VTest
(kN)
Punching Shear Capacity Predictions, VPred
Proposed Equations
Yield Line Theory Based on
CAN/CSA S806-12
Based on
ACI 440.1R-06
VPred VTest/VPred VPred VTest/VPred VPred VTest/VPred
GRD-0.9-XX-0.4 191.2 172.4*
1.11 98.5#
1.94 279.2 0.68
GRD-0.9-75-0.4 255.9 281.1 0.91 181.8 1.41 279.2 0.92
GRD-0.9-50-0.4 272.9 316.9 0.86 181.8 1.5 267 1.02 *calculated by the CAN/CSA S806-12 provisions
# calculated by the ACI 440.1R-06 provisions
Chapter 5: Conclusions and Future Work
133
CHAPTER 5: CONCLUSIONS AND FUTURE WORK
5.1. SUMMARY AND CONCLUSIONS
Nine full-scale slab-column edge connections were constructed and tested to failure under a
combination of a vertical shearing force and an unbalanced moment. The slab of one connection
was reinforced with steel bars while the slabs of the other eight connections were reinforced with
GFRP bars. Moreover, two of the GFRP-RC slabs were reinforced with double-headed GFRP
studs as shear reinforcement. The main objective of this investigation was to investigate the
punching shear behaviour of slab-column edge connections reinforced with different
configurations of GFRP longitudinal and transverse reinforcement and subjected to different
combinations of vertical loads and unbalanced moments.
Based on the results of the tested connections, the following conclusions can be drawn:
1. All tested connections without shear reinforcement failed in a brittle punching shear
mode with no signs of flexural failure. The punching failure was characterized by a
drastic drop in the vertical load when the column along with a conical portion of the slab
punched through the remainder of the slab.
2. The double-headed GFRP shear studs managed to control the propagation of the diagonal
shear cracks allowing the connections to reach their flexural capacity before punching
shear failure occurs. The flexural failure was characterized by substantial deflections
before failure along with crushing of the concrete on the compression side of the slab at
the column vicinity.

Chapter 5: Conclusions and Future Work
134
3. The headed-ends of the shear studs provided adequate anchorage which allowed the studs
to develop tensile strains as high as 2314 s (13.9% of their ultimate tensile strain)
without any signs of slippage. This strain value represents 46% and 58% of the strain
limits in the transverse FRP reinforcement specified in the CAN/CSA S806-12 and the
ACI 440.1R-06, respectively.
4. The used sand-coated GFRP bars had better bond performance than the used ribbed-
deformed GFRP bars. Two of the three tested connections reinforced with ribbed-
deformed GFRP bars experienced loss of bond between the reinforcing bars and the
surrounding concrete before failure.
5. For the steel-RC connection, localized reinforcement yielding was observed at the
column face. However, punching failure occurred before extensive yielding takes place.
6. The flexural reinforcement type and ratio had a significant effect on the post-cracking
stiffness of the connections. The post-cracking stiffness factor increased in approximately
linear manner with increasing the flexural reinforcement ratio; increasing the flexural
reinforcement ratio by 50% and 100% increased the post-cracking stiffness factor by 62%
and 119%, respectively. Similarly, the steel-RC connection had three times the post-
cracking stiffness factor of its counterpart reinforced with sand-coated GFRP
reinforcement due to the higher axial reinforcement stiffness of the steel bars. On the
other hand, the moment-to-shear ratio and the presence of stud shear reinforcement had
no effect on the post-cracking stiffness.
7. The shear-reinforced connections GRD-0.9-75-0.4 and GRD-0.9-50-0.4, which had failed
in a deformable flexural mode, showed a considerable ample warning before failure with

Chapter 5: Conclusions and Future Work
135
ultimate deflections of 48.1 mm and 75.1 mm and deformability factors of 22.9 and 36.1,
respectively. For the connections without shear reinforcement, increasing the flexural
reinforcement ratio by 50% and 100% decreased the deformability factor by 11% and
68%, respectively. Furthermore, increasing the moment-to-shear ratio from 0.2 m to 0.6
m decreased the deformability factor by 34%. However, all connections without shear
reinforcement had deformability factors ranging from 7.6 to 24.5, which allow for an
ample warning before failure.
8. The flexural reinforcement type and ratio had a significant effect on the punching
capacity of the connections. Doubling the GFRP flexural reinforcement ratio from 0.9%
to 1.8% increased the punching capacity of the edge connection by 18%. Similarly,
connections S-0.9-XX-0.4 reinforced with steel bars had 35% higher punching capacity
than its counterpart connection GSC-0.9-XX-0.4 reinforced with sand-coated GFRP bars
due to the increased reinforcement axial stiffness of the steel bars. Moreover, increasing
the moment-to-shear ratio from 0.2 m to 0.4 m and 0.6 m decreased the punching
capacity by 8.1% and 33.1%, respectively, due to the increased shear stresses at the
critical shear perimeter.
9. For the connections without shear reinforcement, the CAN/CSA S806-12 and the JSCE
1997 provided reasonable, but slightly conservative, predictions with an average
VTest/Vpred of 1.21 ± 0.13 and 1.15 ± 0.13, respectively. On the other hand, the ACI
440.1R-06 highly underestimated the capacities with an average VTest/Vpred of 2.07 ± 0.21.
The reason behind this underestimation is that the punching shear equation in the ACI
440.1R-06 accounts for the uncracked concrete contribution only to resist the applied
shear stresses and ignores the aggregate interlock and the dowel action contributions.
Chapter 5: Conclusions and Future Work
136
10. The application of the yield line theory on the GFRP-RC edge connections using the
equivalent plastic moment approach (Gar et al. 2014) yielded reasonable predictions with
an average Vtest/Vpred of 0.97 ± 0.07 for the connections failed in flexure.
11. Increasing the moment-to-shear ratio decreased the number of cracks at failure on both
the tension side and the free edge of the slabs. This was due to the increased shear
stresses applied to the critical section which caused shear failure to occur before
significant flexural cracks form.
12. Increasing the moment-to-shear ratio pushed the failure surface on the tension side of the
slab away from the column face and led to a flatter angle of the diagonal crack with the
horizontal plane. Increasing the moment-to-shear ratio from 0.2 m in connection GSC-
0.9-XX-0.2 to 0.6 m in connection GSC-0.9-XX-0.6 decreased the diagonal crack angle
with the horizontal on the tension face of the slab by 10% (from 28.3o to 25.5
o).
13. The proposed design equations for the shear-reinforced GFRP-RC slab-column
connections seems to yield good predictions; however, further investigation on
connections with high flexural reinforcement ratios is required.
5.2. FUTURE WORK
The following are suggestions for further studies on the punching shear behaviour of GFRP-RC
slab-column edge connections:
1. Studying the seismic response of FRP-RC slab-column edge connections.
2. Studying the influence of different anchorage types in the direction perpendicular to the
free edge, i.e., bent bars and headed-end bars.

Chapter 5: Conclusions and Future Work
137
3. Studying the performance of the headed-end shear studs in slab-column edge connections
with higher flexural reinforcement ratios (between four and six times the balanced
reinforcement ratio).
4. Investigating the influence of different parameters on the punching shear behaviour of
slab-column edge connections such as, but not limited to:
a. The effect of high strength concrete.
b. The size effect (e.g., slab thickness, column size, column aspect ratio and column
width-to-slab depth ratio).
c. The configuration of the transverse reinforcement.
5. Studying the punching shear behaviour of slab-column corner connections.

References
138
REFERENCES
ACI Committee 318. (1963). Building Code Requirements for Reinforced Concrete (ACI 318-
63). American Concrete Institute, Detroit, Michigan, 144.
ACI Committee 318. (1971). Building Code Requirements for Reinforced Concrete (ACI 318-
71). American Concrete Institute, Detroit, Michigan, 78.
ACI Committee 318. (1995). Building Code Requirements for Structural Concrete (ACI 318-95).
American Concrete Institute, Detroit, Michigan.
ACI Committee 318. (2011). Building Code Requirements for Structural Concrete (ACI 318-11)
and Commentary. American Concrete Institute, Detroit, Michigan, 509.
ACI Committee 440. (2006). Guide for the Design and Construction of Structural Concrete
Reinforced with FRP Bars. American Concrete Institute, Farmington Hills, Michigan, 44.
Alexander, S. B., and Simmonds, S. H. (1987). “Ultimate Strength of Slab-Column
Connections.” ACI Structural Journal, 84(3), 255–261.
Alexander, S. B., and Simmonds, S. H. (1992). “Punching Shear Tests of Concrete Slab-Column
Joints Containing Fiber Reinforcement.” ACI Structural Journal, 89(4), 425–432.
ASCE-ACI Committee 426. (1974). “The Shear Strength of Reinforced Concrete Members -
Slabs.” Journal of the Structural Division, 100(8), 1543–1590.
ASTM A370 - 14. (2014). “Standard Test Methods and Definitions for Mechanical Testing of
Steel Products.” American Society for Testing and Materials, ASTM International, West
Conshohocken, PA, 1(1), 50.
ASTM D7205 / D7205M - 06. (2011). “Standard Test Method for Tensile Properties of Fiber
Reinforced Polymer Matrix Composite Bars.” American Society for Testing and Materials,
ASTM International, West Conshohocken, PA, 15(3), 12.

References
139
Bank, L. C. (1993). “Properties of FRP Reinforcements for Concrete.” Fiber-Reinforced-Plastic
(FRP) Reinforcement for Concrete StructuresProperties and Applications, Elsevier, 59–86.
Banthia, N., Al-Asaly, M., and Ma, S. (1995). “Behavior of Concrete Slabs Reinforced with
Fiber-Reinforced Plastic Grid.” Journal of materials in civil engineering, 7(4), 252–257.
Benmokrane, B., Tighiouart, B., and Chaallal, O. (1996). “Bond Strength and Load Distribution
of Composite GFRP Reinforcing Bars in Concrete.” ACI Materials Journal, 93(3), 254–
259.
Birkle, G., and Dilger, W. H. W. (2008). “Influence of slab thickness on punching shear
strength.” ACI Structural Journal, 105(2), 180–188.
British Standards Institution. (1997). Structural Use of Concrete - Code of Practice for Design
and Construction. BSI, 168.
Canadian Standards Association. (1984). Design of Concrete Structures for Buildings, CAN3-
A23.3-M84. Canadian Standards Association, Toronto, Ontario, 281.
Canadian Standards Association. (2004). Design of Concrete Structures, CAN/CSA-A23.3-04.
Canadian Standards Association, Toronto, Ontario, 240.
Canadian Standards Association. (2006). Canadian Highway Bridge Design Code.
Canadian Standards Association. (2012). Design and Construction of Building structurSs with
Fibre-Reinforced Polymer, CAN/CSA S806-12. Canadian Standards Association, Toronto,
Ontario, 198.
Cement Association of Canada. (2006). Concrete design handbook. Ottawa, ON.
Cosenza, E., Manfredi, G., and Realfonzo, R. (1997). “Behavior and Modeling of Bond of FRP
Rebars to Concrete.” Journal of Composites for Construction, 1(2), 40–51.

References
140
Dilger, W., Birkle, G., and Mitchell, D. (2005). “Effect of Flexural Reinforcement on Punching
Shear Resistance.” ACI Special Publication, 232, 57–74.
Dilger, W., Elmasri, M., and Ghali, A. (1978). “Flat Plates with Special Shear Reinforcement
Subjected to Static Dynamic Moment Transfer.” ACI Journal Proceedings, 75(10), 543–
549.
Dilger, W., and Ghali, A. (1981). “Shear Reinforcement for Concrete Slabs.” Journal of the
Structural Division, 107(12), 2403–2420.
Dulude, C., Ahmed, E., and Benmokrane, B. (2010). “Punching Shear Strength of Concrete Flat
Slabs Reinforced with GFRP Bars.” 2nd International Structures Specialty Conference,
Winnipeg, Manitoba, 1–9.
Dulude, C., Hassan, M., Ehab, A., and Benmokrane, B. (2013). “Punching Shear Behavior of
Flat Slabs Reinforced with Glass Fiber-Reinforced Polymer Bars.” ACI Structural Journal,
110(5), 723–734.
Elgabry, A., and Ghali, A. (1987). “Tests on Concrete Slab-Column Connections with Stud-
Shear Reinforcement Subjected to Shear-Moment Transfer.” ACI Structural Journal, 84(5),
433–442.
El-Gamal, S., El-Salakawy, E. F., and Benmokrane, B. (2005). “A New Punching Shear
Equation for Two-Way Concrete Slabs Reinforced with FRP Bars.” ACI Special
Publication, 230, 877–894.
El-Ghandour, A. W., Pilakoutas, K., and Waldron, P. (1999). “New Approach for Punching
Shear Capacity Prediction of Fiber Reinforced Polymer Reinforced Concrete Flat Slabs.”
ACI Special Publication, 188, 135–144.

References
141
El-Ghandour, A. W., Pilakoutas, K., and Waldron, P. (2003). “Punching Shear Behavior of Fiber
Reinforced Polymers Reinforced Concrete Flat Slabs: Experimental Study.” Journal of
Composites for Construction, 7(3), 258–265.
El-Salakawy, E. F., Polak, M. A., and Soliman, M. H. (1998). “Slab-Column Edge Connections
Subjected to High Moments.” Canadian Journal of Civil Engineering, 25(3), 526–538.
El-Salakawy, E., Polak, M., and Soliman, M. (2000). “Reinforced Concrete Slab-Column Edge
Connections with Shear Studs.” Canadian Journal of Civil Engineering, 27(2), 338–348.
El-Sayed, A., El-Salakawy, E. F., and Benmokrane, B. (2005). “Shear Strength of One-Way
Concrete Slabs Reinforced With Fiber-Reinforced Polymer Composite Bars.” Journal of
Composites for Construction, 9(2), 147–157.
Fanella, D. A. (2000). Concrete Floor Systems: Guide to Estimating and Economizing. Portland
Cement Association, Illinois, USA, 41.
Gar, S. P., Mander, J., Head, M., and Hurlebaus, S. (2014). “FRP Slab Capacity Using Yield
Line Theory.” Journal of Composites for Construction.
Gardner, N. (1990). “Relationship of the Punching Shear Capacity of Reinforced Concrete Slabs
with Concrete Strength.” ACI Structural Journal, 87(1), 66–71.
Ghannoum, C. M. (1998). “Effect of High-Strength Concrete on the Performance of Slab-column
Specimens.” McGill University.
Hassan, M., Ahmed, E., and Benmokrane, B. (2013). “Punching-Shear Strength of Normal and
High-Strength Two-Way Concrete Slabs Reinforced with GFRP Bars.” Journal of
Composites for Construction, 17(6).

References
142
Hassan, M., Ahmed, E., and Benmokrane, B. (2014). “Punching Shear Behavior of Two-Way
Slabs Reinforced with FRP Shear Reinforcement.” Journal of Composites for Construction,
04014030(13).
Hawkins, N. M., Bao, A., and Yamazaki, J. (1989). “Moment Transfer From Concrete Slabs to
Columns.” ACI Structural Journal, 86(6), 705–716.
Heinzmann, D., Etter, S., Villiger, S., and Jaeger, T. (2012). “Punching Tests on Reinforced
Concrete Slabs with and without Shear Reinforcement.” ACI Structural Journal, 109(6),
787–794.
Hussein, A., Rashid, I., and Benmokrane, B. (2004). “Two-way concrete slabs reinforced with
GFRP bars.” Advanced Compo ite Material in Bridge and …, Calgary, Alberta, 1–8.
Ingerslev, A. (1923). “The Strength of Rectangular Slabs.” Journal of the Institution of Civil
Engineers, 1(1), 3–14.
ISIS Canada. (2001). Reinforcing Concrete Structures with Fibre Reinforced Polymers.
Winnipeg, Manitoba, 158.
Jaeger, L. G., Mufti, A. A., and Tadros, G. (1995). Balanced Section, Ductility and
Deformability in Concrete with FRP Reinforcement. Halifax, NS, 50.
Japan Society of Civil Engineering. (1997). Recommendation for Design and Construction of
Concrete Structures using Continuous Fibre Reinforcing Materials. Concrete Engineering
Series 23, Tokyo, Japan, 325.
Japan Society of Civil Engineering. (2007). Standard Specifications for Concrete Structures.
Tokyo, Japan, 469.
Johansen, K. W. (1943). Yield Line Theory. London, UK, 189.
Johansen, K. W. (1946). Yield Line Formula for Slabs. London, UK, 186.
References
143
Kassem, C., Farghaly, A. S., and Benmokrane, B. (2011). “Evaluation of Flexural Behavior and
Serviceability Performance of Concrete Beams Reinforced with FRP Bars.” Journal of
Composites for Construction, 15(5), 682–695.
Kinnunen, S. (1963). Punching of Concrete Slabs with Two-Way Reinforcement: With Special
Reference to Dowel Effect and Deviation of Reinforcement from Polar Symmetry. Henrik
Lindståhls bokhandel, distr, 108.
Kinnunen, S., and Nylander, H. S. E. (1960). Punching of Concrete Slabs without Shear
Reinforcement. Stockholm : KTH, Stockholm, Sweden, 112.
Koch, G. H., Brongers, M., Thompson, N. G., Virmani, Y. P., and Payer, J. H. (2002). Corrosion
Cost and Preventive Strategies in the United States. 773.
Lee, J. H., Yoon, Y. S., Cook, W. D., and Mitchell, D. (2009). “Improving Punching Shear
Behavior of Glass Fiber-Reinforced Polymer Reinforced Slabs.” ACI Structural journal,
106(4), 427–434.
Lenschow, R. J., and Sozen, M. A. (1966). A Yield Criterion for Reinforced Concrete Under
Biaxial Moments and Forces. Urbana, Illinois, 590.
Lenschow, R. J., and Sozen, M. A. (1967). “A Yield Criterion for Reinforced Concrete Slabs.”
ACI Journal Proceedings, 64(5), 266–273.
Lips, S., Ruiz, M., and Muttoni, A. (2012). “Experimental Investigation on Punching Strength
and Deformation Capacity of Shear-Reinforced Slabs.” ACI Structural Journal, (109), 889–
900.
Long, A. E. (1975). “A two-phase approach to the prediction of the punching strength of slabs.”
ACI Journal Proceedings, 72(2), 37–45.

References
144
Lorenz, E. B., and Trygestad, A. R. (2005). “Formwork Considerations for Economical Concrete
Projects.” Concrete International, 61–64.
Marzouk, H., Emam, M., and Hilal, M. (1996). “Effect of High-Strength Concrete Columns on
the Behavior of Slab-Column Connections.” ACI structural journal, 93(5), 545–552.
Marzouk, H., Emam, M., and Hilal, M. S. (1998). “Effect of High-Strength Concrete Slab on the
Behavior of Slab-Column Connections.” ACI Structural Journal, 95(3), 227–236.
Marzouk, H., and Hussein, A. (1991). “Experimental Investigation on the Behavior of High-
Strength Concrete Slabs.” ACI Structural Journal, 88(6), 701–713.
Marzouk, H., Osman, M., and Helmy, S. (2000). “Behavior of High-Strength Lightweight
Aggregate Concrete Slabs under Column Load and Unbalanced Moment.” ACI Structural
Journal, 97(6), 860–866.
Mast, P. E. (1970a). “Stresses in Flat Plates near Columns.” ACI Journal Proceedings, 67(10),
761–768.
Mast, P. E. (1970b). “Plate Stresses at Columns near the Free Edge.” ACI Journal Proceedings,
67(11), 898–902.
Matthys, S., and Taerwe, L. (2000). “Concrete Slabs Reinforced with FRP Grids. II: Punching
Resistance.” Journal of Composites for Construction, 4(3), 154–161.
Megally, S., and Ghali, A. (2000). “Seismic Behavior of Edge Column-Slab Connections with
Stud Shear Reinforcement.” ACI Structural Journal, 97(1), 53–60.
Menetrey, P. (1998). “Relationships between Flexural and Punching Failure.” ACI Structural
journal, 93(4), 412–419.
Moe, J. (1961). Shearing Strength of Reinforced Concrete Slabs and Footings under
Concentrated Loads. Illinois, USA, 139.
References
145
Mokhtar, A. S., Ghali, A., and Dilger, W. H. (1985). “Stud Shear Reinforcement for Flat
Concrete Plates.” ACI Journal Proceedings, 82(5), 676–683.
Mörsch, E. (1902). Reinforced Concrete, Theory and Application. Beton-und Stahlbetonbau,
Stuttgart, Germany.
Mortin, J. D. (1989). “Connections of Concrete Slabs with Edge Columns.” University of
Calgary.
Mortin, J., and Ghali, A. (1991). “Connection of flat plates to edge columns.” ACI Structural
Journal, (88), 191–198.
Nanni, A., Rizkalla, S., Bakis, C. E., Conrad, J. O., and Abdelrahman, A. A. (1998).
“Characterization of GFRP Ribbed Rod Used for Reinforced Concrete Construction.”
Proceedings of the International Composites Exhibition (ICE-98), Nashville, Tennessee, 1–
6.
NBCC. (2010). National Building Code of Canada. National Research Council of Canada,
Ottawa, Ontario, 1222.
Neville, A. (1995). “Chloride Attack of Reinforced Concrete: An Overview.” Materials and
Structures, 28(176), 63–70.
Newhook, J., Ghali, A., and Tadros, G. (2002). “Concrete Flexural Members Reinforced with
Fiber Reinforced Polymer: Design for Cracking and Deformability.” Canadian Journal of
Civil Engineering, 29(1), 125–134.
Nguyen-Minh, L., and Rovňák, M. (2013). “Punching Shear Resistance of Interior GFRP
Reinforced Slab-Column Connections.” Journal of Composites for Construction, 17(1), 2–
13.

References
146
Osman, M., Marzouk, H., and Helmy, S. (2000). “Behavior of High-Strength Lightweight
Concrete Slabs under Punching Loads.” ACI Structural Journal, 97(3), 492–498.
Ospina, C. (2005). “Alternative for Concentric Punching Capacity Evaluation of Reinforced
Concrete Two-Way Slabs.” Concrete International, 53–57.
Ospina, C. E., Alexander, S. D. B., and Cheng, J. J. R. (2003). “Punching of Two-Way Concrete
Slabs with Fiber-Reinforced Polymer Reinforcing Bars or Grids.” ACI structural Journal,
100(5), 589–598.
Ozden, S., Ersoy, U., and Ozturan, T. (2006). “Punching Shear Tests of Normal- and High-
Strength Concrete Flat Plates.” Canadian Journal of Civil Engineering, 33(11), 1389–1400.
Park, R., and Gamble, W. L. (2000). Reinforced Concrete Slabs. John Wiley & Sons, Inc., New
York, USA, 736.
Polak, M. A., El-Salakawy, E. F., and Hammill, N. (2005). “Shear Reinforcement for Concrete
Flat Slabs.” ACI Special Publication, 232, 75–96.
Pultrall Inc. (2013). “V-ROD Technical Data Sheet.” <http://www.vrod.ca/en/downloads.asp>.
Richart, F. E. (1948). “Reinforced Concrete Wall and Column Footings.” ACI Journal
Proceedings, 45(10), 97–127.
Ritchie, M., Ghali, A., Dilger, W., and Gayed, R. (2006). “Unbalanced moment resistance by
shear in slab-column connections: experimental assessment.” ACI structural journal, (103).
Ritter, W. (1899). “Construction Techniques of Hennebique.” Swiss Bauzeitung, 33(5), 41–43.
Rizk, E., Marzouk, H., Hussein, A., and Hossin, M. (2011). “Effect of Reinforcement Ratio on
Punching Capacity of RC Plates.” Canadian Journal of Civil Engineering, 38(7), 729–740.
Schoeck Canada Inc. (2013). “Schock ComBAR - Technical Information.”
<http://www.schoeck.ca/en_ca/downloads?product=4&type=7&filter=1>.
References
147
Seible, F., Ghali, A., and Dilger, W. (1980). “Preassembled Shear Reinforcing Units for Flat
Plates.” ACI Journal Proceedings, 77(1), 28–35.
Shaaban, A. M., and Gesund, H. (1994). “Punching Shear Strength of Steel Fiber Reinforced
Concrete Flat Plates.” ACI Structural Journal, 91(4), 406–414.
Simmonds, S. H., and Alexander, S. B. (1987). “Truss Model for Edge Column-Slab
Connections.” ACI Structural Journal, 84(4), 296–303.
Stein, T., Ghali, A., and Dilger, W. (2007). “Distinction between Punching and Flexural Failure
Modes of Flat Plates.” ACI structural journal, 104(3), 357–365.
Swamy, R. N., and Ali, S. A. R. (1982). “Punching Shear Behavior of Reinforced Slab-Column
Connections Made with Steel Fiber Concrete.” ACI Journal Proceedings, 79(5), 392–406.
Tureyen, A., and Frosch, R. (2003). “Concrete Shear Strength: Another Perspective.” ACI
Structural Journal, 100(5), 609–615.
Vanderbilt, M. (1972). “Shear Strength of Continuous Plates.” Journal of the Structural
Division, 98(5), 961–973.
Wheeler, W. H. (1936). “Thin Flat-Slab Floors Prove Rigid Under Test.” Engineering News-
Record, 116(2), 49–50.
Widianto, Bayrak, O., and Jirsa, J. O. (2009). “Two-Way Shear Strength of Slab-Column
Connections: Reexamination of ACI 318 Provisions.” ACI Structural Journal, 106(2), 160–
170.
Wight, J. K., and MacGregor, J. G. (2011). Reinforced Concrete: Mechanics and Design.
Prentice Hall, 1177.
Wu, W. P. (1990). “Design of Slabs, Beams and Foundations.” West Virginia University.

References
148
Zaghlool, E. R. F., and Rawdon de Paiva, A. (1973). “Tests of Flat-Plate Corner Column-Slab
Connections.” Journal of the Structural Division, 99(3), 551–572.
Zaghloul, A. (2007). “Punching Shear Strength of Interior and Edge Column-Slab Connections
in CFRP Reinforced Flat Plate Structures Transferring Shear and Moment.” Carlton
University.
Zaghloul, A., and Razaqpur, A. (2004). “Punching Shear Strength of Concrete Flat Plates
Reinforced with CFRP Grids.” Proceedings of the 4th Conference on Advanced Composite
Materials in Bridges and Structures, Calgary, Alberta, 1–8.

Appendix A: Analyses of a Parking Garage Flat Plate
A-1
APPENDIX A
Analyses of a Parking Garage Flat Plate
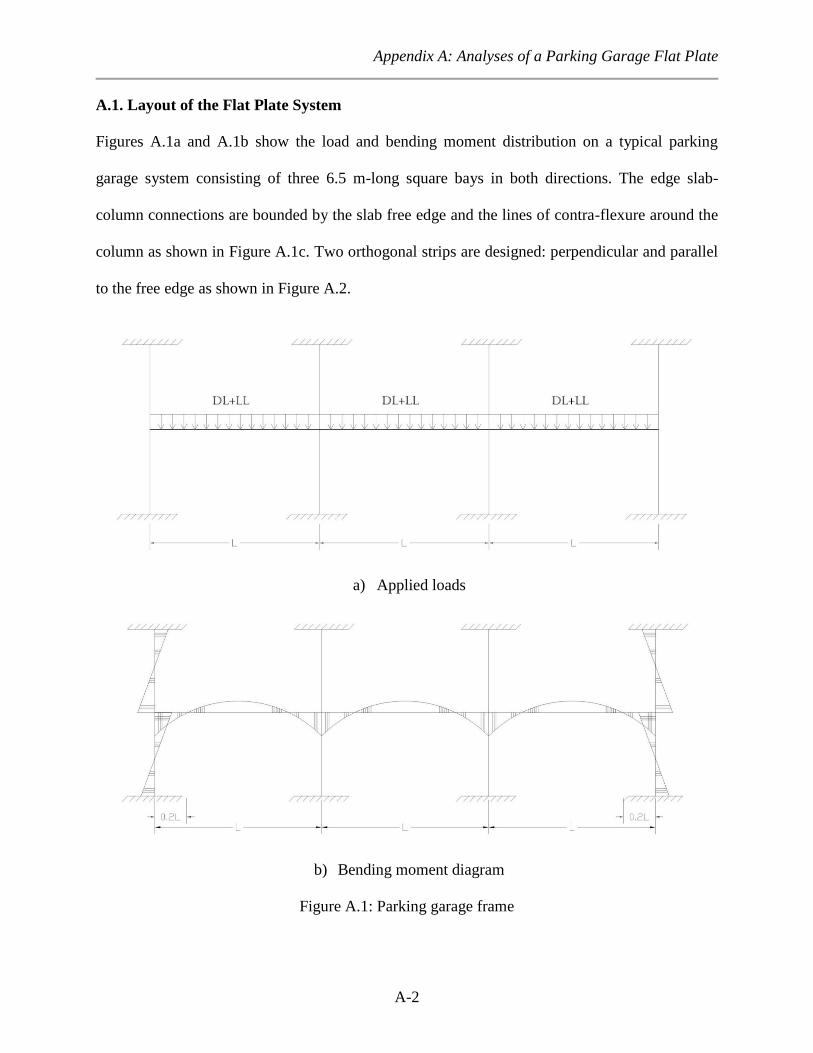
Appendix A: Analyses of a Parking Garage Flat Plate
A-2
A.1. Layout of the Flat Plate System
Figures A.1a and A.1b show the load and bending moment distribution on a typical parking
garage system consisting of three 6.5 m-long square bays in both directions. The edge slab-
column connections are bounded by the slab free edge and the lines of contra-flexure around the
column as shown in Figure A.1c. Two orthogonal strips are designed: perpendicular and parallel
to the free edge as shown in Figure A.2.
a) Applied loads
b) Bending moment diagram
Figure A.1: Parking garage frame

Appendix A: Analyses of a Parking Garage Flat Plate
A-3
c) Lines of contra-flexure
Figure A.1: Parking garage frame - continued
a) The strip perpendicular to the free edge
Figure A.2: Design strips

Appendix A: Analyses of a Parking Garage Flat Plate
A-4
b) The strip parallel to the free edge
Figure A.2: Design strips - continued
A.2. Properties of Concrete
Compressive strength of concrete
Material resistance factor c

Appendix A: Analyses of a Parking Garage Flat Plate
A-5
Ultimate compressive strain for concrete Clause 10.1.3 (A23.3-04)
( ) Clause 10.1.7 (A23.3-04)
( ) Clause 10.1.7 (A23.3-04)
A.3. Loads
(NBCC 2010)
(NBCC 2010)
Factored load (NBCC 2010)
or
(Governs)
A.4. Slab Thickness
Minimum slab thickness (
)
Clause 13.2.3 (A23.3-04)
(
)
Take
A.5. Analysis of a steel-RC Parking Garage Flat Plate (According to CSA A23.3-04)
A.5.1. Properties of Reinforcement
Use No. 15M bars 200 mm2
Yield strength of steel
Material resistance factor
Yield strain for steel
A.5.2. The Strip Perpendicular to the Free Edge
A.5.2.1. Effective Depth
Take concrete clear cover

Appendix A: Analyses of a Parking Garage Flat Plate
A-6
Effective depth
–
A.5.2.2. Design Moments
Clause 13.9.2
Table A.1: Moment distribution in a design strip perpendicular to the free edge
Axis A B C Units Clause
6200 6200
26 52 70 65 35 65 %
13.9.3 88.1 176.2 237.2 220.3 118.6 20.3 kN.m
100 60 70-90 70-90 55-65 70-90 %
13.11.2 88.1 105.7
166.1-
213.5
154.2-
198.2
65.2-
77.1
154.2-
198.2 kN.m
0 40 30-10 30-10 45-35 30-10 %
13.11.2 0 70.5
71.2-
23.7
66.1-
22
53.4-
41.5
66.1-
22 kN.m
A.5.2.3. Reinforcement
Reinforcement for the total factored negative moment transferred to the exterior columns shall
be placed within a band width Clause 13.10.3
For the Band Width :
Figure A.3: Strain distribution and equivelant stress block
(
)
(
)
Appendix A: Analyses of a Parking Garage Flat Plate
A-7
Use 15M @ 128 mm c/c
Check for the Balanced Reinforcement Ratio :
Under-reinforced Ok
For the Rest of the Column Strip:
Use minimum reinforcement Clause 13.10.9
( ) Clause 7.8.1
Maximum spacing Clause 13.10.4
Or (Governs) Use 15M @ 475 mm c/c
A.5.2.4. Development Length Clause 12.2
√ Clause 12.2.3

Appendix A: Analyses of a Parking Garage Flat Plate
A-8
√
Use bent bars
√
√ Clause 12.5
Figure A.4: Typical deformed steel bent bar dimensions
A.5.2.5. Serviceability Check
A.5.2.5.1. Service Stress Calculations
Specified load (NBCC 2010)
Service moment
Clause 13.9.2
Service moment at the edge connection
Clause 13.10.3
√ ( ) √ ( )
Service stress
A.5.2.5.2. Crack Control Parameter

Appendix A: Analyses of a Parking Garage Flat Plate
A-9
√ √
OK
Clause 10.6.1 (A23.3-04)
Summary:
Place 15M @ 128 mm c/c in a band 900 mm wide centered on the column.
Place 15M @ 475 mm c/c for the rest of the strip.
A.5.3. The Strip Parallel to the Free Edge
A.5.3.1. Effective Depth
A.5.3.2. Design Moments
Clause 13.9.2
Table A.2: Moment distribution in a design strip parallel to the free edge
Axis 1 2 3 Units Clause
6200 6200
26 52 70 65 35 65 %
13.9.3 46.1 92.2 124.1 115.2 62.04 115.2 kN.m
100 60 70-90 70-90 55-65 70-90 %
13.11.2 46.1 55.3
86.9-
111.7
80.7-
103.7
34.1-
40.3
80.7-
103.7 kN.m
0 40 30-10 30-10 45-35 30-10 %
13.11.2 0 36.9
37.2-
12.4
34.6-
11.5
27.9-
21.7
34.6-
11.5 kN.m
A.5.3.3. Reinforcement
At interior columns, the band width shall be designed to resist at least one-third of the total
factored negative moment in the entire design strip. Clause 13.11.2.7

Appendix A: Analyses of a Parking Garage Flat Plate
A-10
For the Band Width :
Figure A.5: Strain distribution and equivelant stress block
⁄
(
)
(
)
Use 15M @ 166 mm c/c
Check for the Unbalanced Moment: Clause 13.9.4
[( )
(
) ]
[( ) ]
The fraction to be carried by flexure within width is Clause 13.10.2
√
√
Clause 13.3.5.3

Appendix A: Analyses of a Parking Garage Flat Plate
A-11
( ) OK
Check for the Balanced Reinforcement Ratio :
Under-reinforced OK
For the Rest of the Strip:
(
)
(
)
Use 15M @ 193 mm c/c
A.5.3.4. Development Length Clause 12.2
√ Clause 12.2.3

Appendix A: Analyses of a Parking Garage Flat Plate
A-12
√ OK
A.5.3.5. Serviceability Check
A.5.3.5.1. Service Stress Calculations
Specified load (NBCC 2010)
Service moment
Clause 13.9.2
Service moment at the edge connection
√ ( ) √ ( )
Service stress
A.5.3.5.2. Crack Control Parameter
√ √
OK
Clause 10.6.1 (A23.3-04)
Summary:
Place 15M @ 166 mm c/c in a band 600 mm wide beneath the column.
Place 15M @ 193 mm c/c for the rest of the strip.

Appendix A: Analyses of a Parking Garage Flat Plate
A-13
A.6. Analysis of a sand-coated GFRP-RC Parking Garage Flat Plate (According to CSA
A23.3-04 and CSA S806-12)
A.6.1. Properties of Reinforcement:
Material resistance factor
A.6.1.1. Bent Bars
Use No. 19 bars
Ultimate tensile strength of GFRP
Ultimate tensile strain for GFRP
Modulus of elasticity for GFRP
A.6.1.2. Straight Bars
Use No. 19 bars
Ultimate tensile strength of GFRP
Ultimate tensile strain for GFRP
Modulus of elasticity for GFRP
A.6.2. The Strip Perpendicular to the Free Edge
A.6.2.1. Effective Depth
Take concrete clear cover
Effective depth
–
A.6.2.2. Design Moments
Clause 13.9.2 (A23.3-04)

Appendix A: Analyses of a Parking Garage Flat Plate
A-14
Table A.3: Moment distribution in a design strip perpendicular to the free edge
Axis A B C Units Clause
6200 6200
26 52 70 65 35 65 %
13.9.3 88.1 176.2 237.2 220.3 118.6 20.3 kN.m
100 60 70-90 70-90 55-65 70-90 %
13.11.2 88.1 105.7
166.1-
213.5
154.2-
198.2
65.2-
77.1
154.2-
198.2 kN.m
0 40 30-10 30-10 45-35 30-10 %
13.11.2 0 70.5
71.2-
23.7
66.1-
22
53.4-
41.5 66.1-22 kN.m
A.6.2.3. Reinforcement
Reinforcement for the total factored negative moment transferred to the exterior columns shall
be placed within a band width Clause 13.10.3 (A23.3-04)
For the Band Width :
Figure A.6: Strain distribution and equivelant stress block
(
)
(
)

Appendix A: Analyses of a Parking Garage Flat Plate
A-15
From strain compatibility:
(
) (
)
( ) (Governs) Clause 8.4.2.3 (S806-12)
Use No. 19 @ 186 mm c/c
Check for the Balanced Reinforcement Ratio :
Over-Reinforced OK
For the Rest of the Strip:
Use minimum reinforcement
( ) (Governs)
Clause 8.4.2.3 (S806-12)
Or ( )
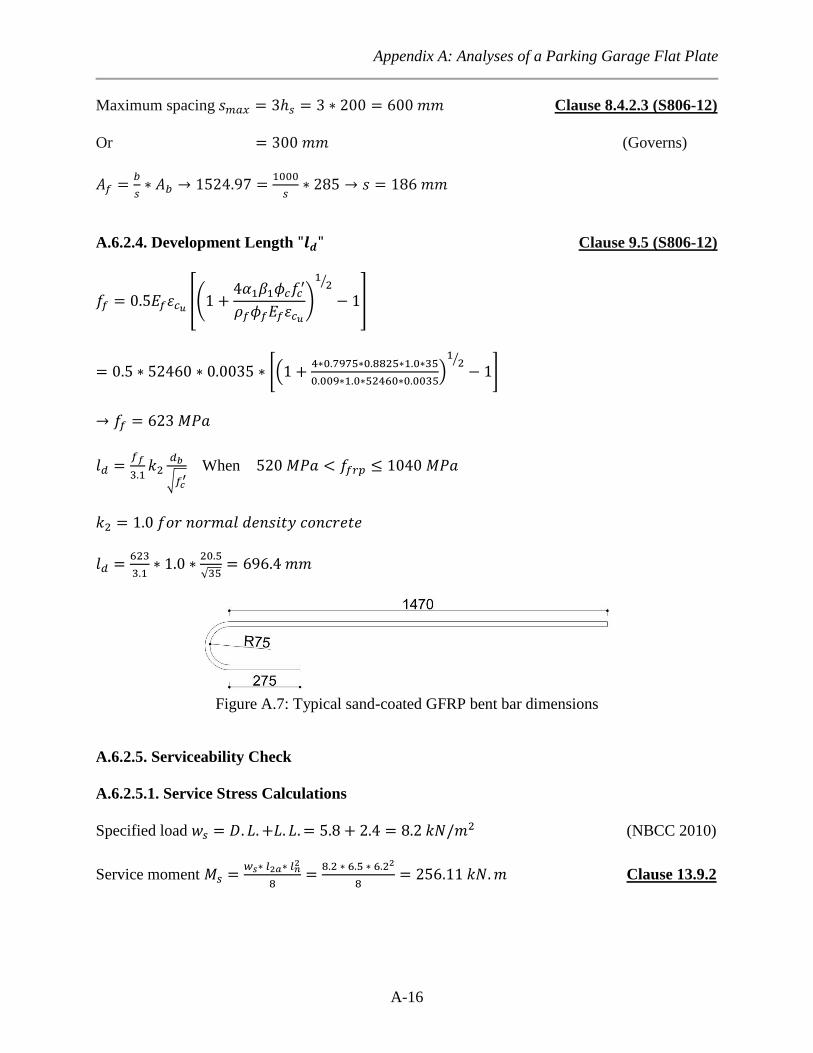
Appendix A: Analyses of a Parking Garage Flat Plate
A-16
Maximum spacing Clause 8.4.2.3 (S806-12)
Or (Governs)
A.6.2.4. Development Length Clause 9.5 (S806-12)
[(
)
⁄
]
[(
) ⁄
]
√ When
√
Figure A.7: Typical sand-coated GFRP bent bar dimensions
A.6.2.5. Serviceability Check
A.6.2.5.1. Service Stress Calculations
Specified load (NBCC 2010)
Service moment
Clause 13.9.2

Appendix A: Analyses of a Parking Garage Flat Plate
A-17
Service moment at the edge connection
Clause 13.10.3
√ ( ) √ ( )
Service stress
A.6.2.5.2. Crack Control Parameter
√
√
Clause 8.3.1.1. (S806-12)
Try No. 19 @ 93 mm c/c for the whole specimen
√ ( ) √ ( )
Service stress
√
√
ok
A.6.2.5.3. Reinforcement Strain Limit Clause 7.1.2.2. (S806-12)
OK

Appendix A: Analyses of a Parking Garage Flat Plate
A-18
Summary:
Place No. 19 @ 93 mm c/c for the whole specimen.
A.6.3. The Strip Parallel to the Free Edge
A.6.3.1. Effective Depth
A.6.3.2. Design Moments
Clause 13.9.2 (A23.3-04)
Table A.4: Moment distribution in a design strip parallel to the free edge
Axis 1 2 3 Units Clause
6200 6200
26 52 70 65 35 65 %
13.9.3 46.1 92.2 124.1 115.2 62.04 115.2 kN.m
100 60 70-90 70-90 55-65 70-90 %
13.11.2 46.1 55.3
86.9-
111.7
80.7-
103.7
34.1-
40.3
80.7-
103.7 kN.m
0 40 30-10 30-10 45-35 30-10 %
13.11.2 0 36.9
37.2-
12.4
34.6-
11.5
27.9-
21.7
34.6-
11.5 kN.m
A.6.3.3. Reinforcement
At interior columns, the band width shall be designed to resist at least one-third of the total
factored negative moment in the entire design strip. Clause 13.11.2.7 (A23.3-04)

Appendix A: Analyses of a Parking Garage Flat Plate
A-19
For the Band Width :
Figure A.8: Strain distribution and equivelant stress block
⁄
(
)
(
)
From strain compatibility:
(
) (
)
Try
( )
(
) (
)

Appendix A: Analyses of a Parking Garage Flat Plate
A-20
(
) (
)
Use No. 19 @ 232 mm c/c
For the Rest of the Strip:
Use Use No. 19 @ 232 mm c/c
A.6.3.4. Development Length Clause 9.3.2 (S806-12)
√
√ OK
A.6.3.5. Serviceability Check
A.6.3.5.1. Service Stress Calculations
Specified load (NBCC 2010)
Service moment
Clause 13.9.2
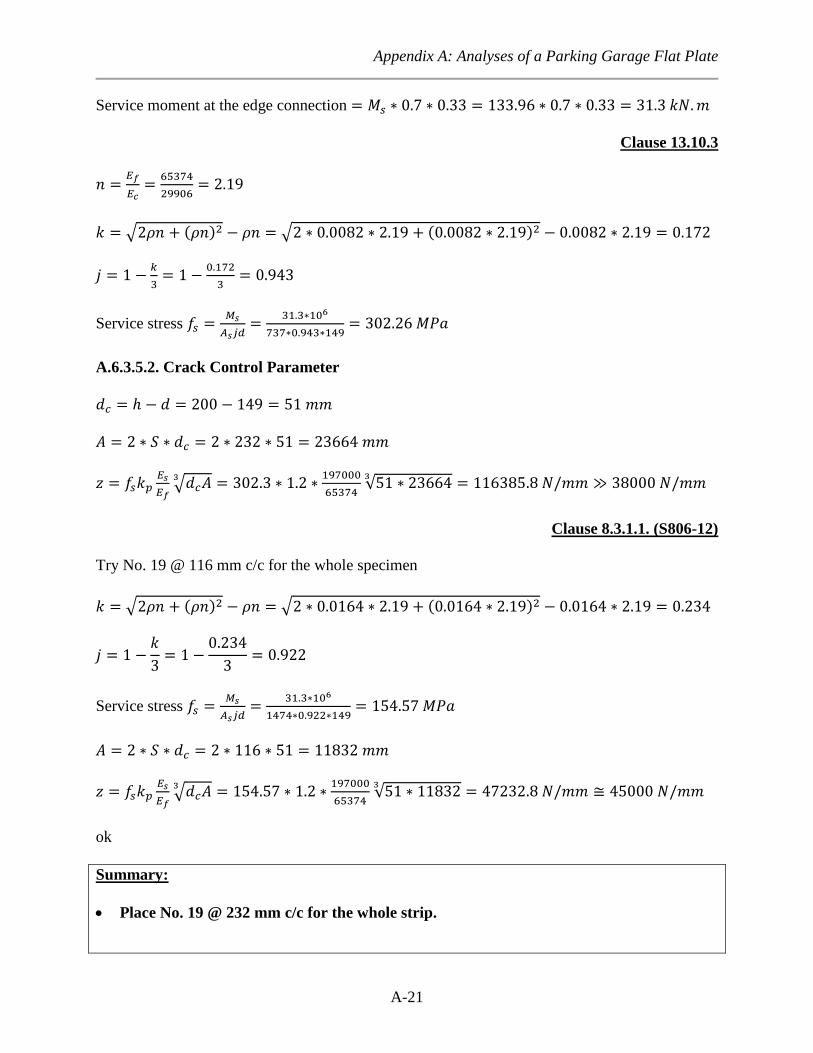
Appendix A: Analyses of a Parking Garage Flat Plate
A-21
Service moment at the edge connection
Clause 13.10.3
√ ( ) √ ( )
Service stress
A.6.3.5.2. Crack Control Parameter
√
√
Clause 8.3.1.1. (S806-12)
Try No. 19 @ 116 mm c/c for the whole specimen
√ ( ) √ ( )
Service stress
√
√
ok
Summary:
Place No. 19 @ 232 mm c/c for the whole strip.

Appendix B: Shear Capacity of Connections without Shear Reinforcement
B-1
APPENDIX B
Shear Capacity of Connections without Shear Reinforcement

Appendix B: Shear Capacity of Connections without Shear Reinforcement
B-2
B.1. Properties of the Critical Section
(
)
(
)
Figure B.1: Critical section at d/2 from
column face
Where e is the distance between the centroid and the inner side of the critical section and J is a
property of the critical shear section analogous to the polar moment of inertia
√
√
(
) (
) when
(
) (
) when
(
) (
) when

Appendix B: Shear Capacity of Connections without Shear Reinforcement
B-3
B.2. Connection S-0.9-XX-0.4
B.2.1. Material Properties
B.2.1.1. Concrete
Actual compressive strength of concrete
Material resistance factor c
Concrete density factor
B.2.1.2. Flexural Reinforcement
Reinforcement ratio perpendicular to the free edge, ρp = 0.0093
Reinforcement ratio parallel to the free edge, ρl = 0.0079
Average reinforcement ratio,
B.2.2. Shear Capacity according to CAN/CSA A23.3-04 Clause 13.3
(
) √ (
) √
(
) √ (
) √
√ √ (Governs)
(
)⁄
(
)
⁄
B.2.3. Shear Capacity according to ACI 318-11 Clause 11.11
(
) √ (
) √
(
) √ (
) √
√ √ (Governs)
(
)⁄
(
)
⁄
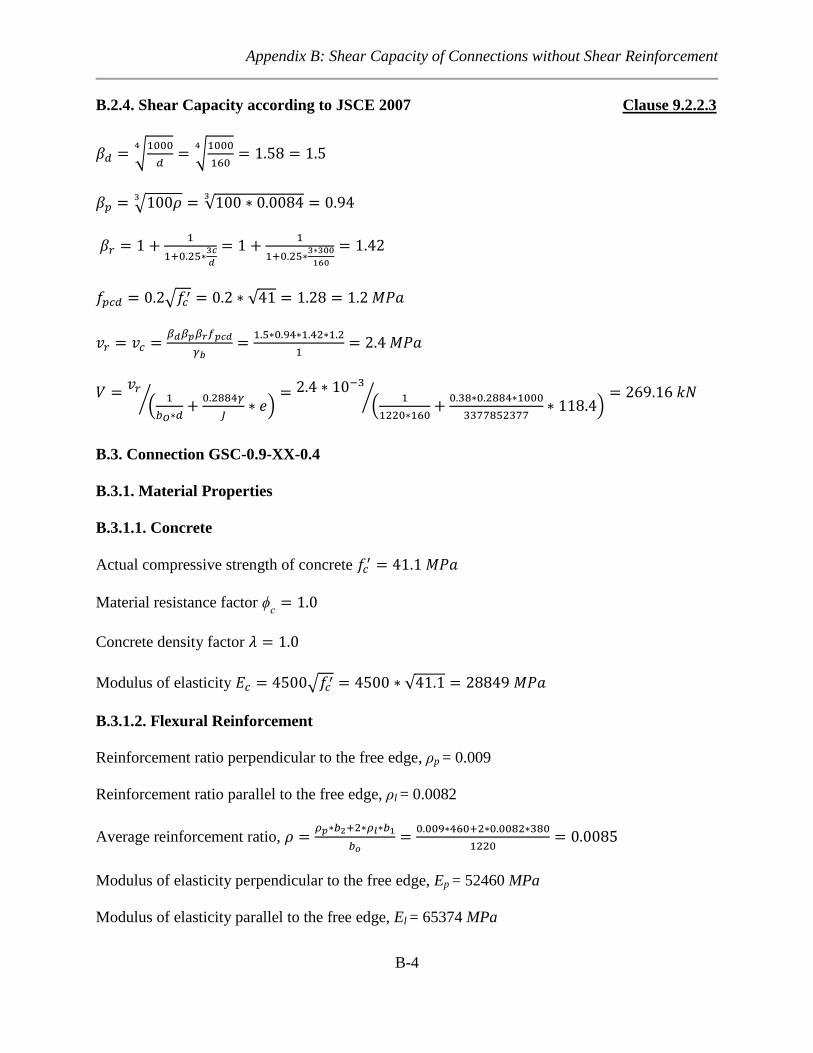
Appendix B: Shear Capacity of Connections without Shear Reinforcement
B-4
B.2.4. Shear Capacity according to JSCE 2007 Clause 9.2.2.3
√
√
√ √
√ √
(
)⁄
(
)
⁄
B.3. Connection GSC-0.9-XX-0.4
B.3.1. Material Properties
B.3.1.1. Concrete
Actual compressive strength of concrete
Material resistance factor c
Concrete density factor
Modulus of elasticity √ √
B.3.1.2. Flexural Reinforcement
Reinforcement ratio perpendicular to the free edge, ρp = 0.009
Reinforcement ratio parallel to the free edge, ρl = 0.0082
Average reinforcement ratio,
Modulus of elasticity perpendicular to the free edge, Ep = 52460 MPa
Modulus of elasticity parallel to the free edge, El = 65374 MPa

Appendix B: Shear Capacity of Connections without Shear Reinforcement
B-5
Average modulus of elasticity,
Modular ratio,
B.3.2. Shear Capacity according to CAN/CSA S806-12 Clause 8.7
(
) [ (
) ⁄ ] (
) [ (
) ⁄ ]
(
) (
) ⁄ (
)
( ) ⁄
( ) ⁄ ( )
⁄
(Governs)
(
)⁄
(
)
⁄
B.3.3. Shear Capacity according to ACI 440.1R-06 Clause 9.4
√ ( ) √ ( )
√
√
(
)⁄
(
)
⁄
B.3.4. Shear Capacity according to JSCE 1997 Clause 6.3.4
√
√
√
√

Appendix B: Shear Capacity of Connections without Shear Reinforcement
B-6
√ √
(
)⁄
(
)
⁄
B.4. Connection GSC-1.35-XX-0.4
B.4.1. Material Properties
B.4.1.1. Concrete
Actual compressive strength of concrete
Material resistance factor c
Concrete density factor
Modulus of elasticity √ √
B.4.1.2. Flexural Reinforcement
Reinforcement ratio perpendicular to the free edge, ρp = 0.0135
Reinforcement ratio parallel to the free edge, ρl = 0.0123
Average reinforcement ratio,
Modulus of elasticity perpendicular to the free edge, Ep = 52460 MPa
Modulus of elasticity parallel to the free edge, El = 65374 MPa
Average modulus of elasticity,
Modular ratio,

Appendix B: Shear Capacity of Connections without Shear Reinforcement
B-7
B.4.2. Shear Capacity according to CAN/CSA S806-12 Clause 8.7
(
) [ (
) ⁄ ] (
) [ (
) ⁄ ]
(
) (
) ⁄ (
)
( ) ⁄
( ) ⁄ ( )
⁄
(Governs)
(
)⁄
(
)
⁄
B.4.3. Shear Capacity according to ACI 440.1R-06 Clause 9.4
√ ( ) √ ( )
√
√
(
)⁄
(
)
⁄
B.4.4. Shear Capacity according to JSCE 1997 Clause 6.3.4
√
√
√
√
√ √

Appendix B: Shear Capacity of Connections without Shear Reinforcement
B-8
(
)⁄
(
)
⁄
B.5. Connection GSC-1.8-XX-0.4
B.5.1. Material Properties
B.5.1.1. Concrete
Actual compressive strength of concrete
Material resistance factor c
Concrete density factor
Modulus of elasticity √ √
B.5.1.2. Flexural Reinforcement
Reinforcement ratio perpendicular to the free edge, ρp = 0.018
Reinforcement ratio parallel to the free edge, ρl = 0.0164
Average reinforcement ratio,
Modulus of elasticity perpendicular to the free edge, Ep = 52460 MPa
Modulus of elasticity parallel to the free edge, El = 65374 MPa
Average modulus of elasticity,
Modular ratio,
B.5.2. Shear Capacity according to CAN/CSA S806-12 Clause 8.7
(
) [ (
) ⁄ ] (
) [ (
) ⁄ ]

Appendix B: Shear Capacity of Connections without Shear Reinforcement
B-9
(
) (
) ⁄ (
)
( ) ⁄
( ) ⁄ ( )
⁄
(Governs)
(
)⁄
(
)
⁄
B.5.3. Shear Capacity according to ACI 440.1R-06 Clause 9.4
√ ( ) √ ( )
√
√
(
)⁄
(
)
⁄
B.5.4. Shear Capacity according to JSCE 1997 Clause 6.3.4
√
√
√
√
√ √
(
)⁄
(
)
⁄
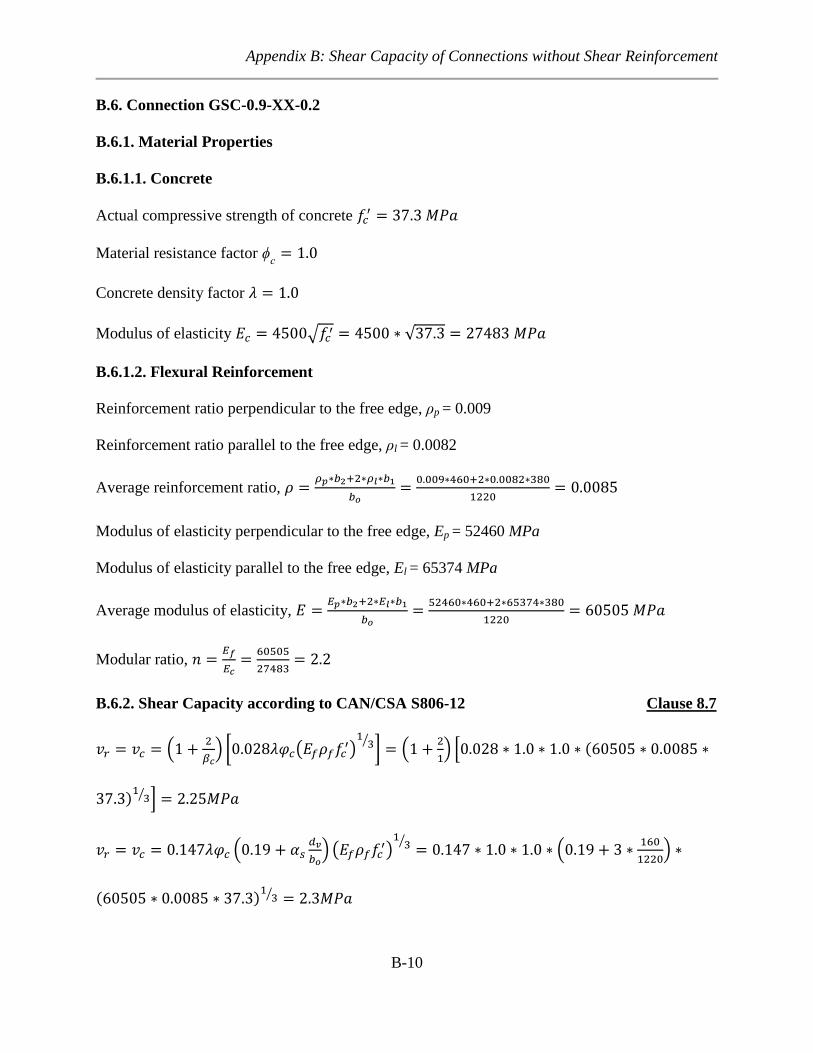
Appendix B: Shear Capacity of Connections without Shear Reinforcement
B-10
B.6. Connection GSC-0.9-XX-0.2
B.6.1. Material Properties
B.6.1.1. Concrete
Actual compressive strength of concrete
Material resistance factor c
Concrete density factor
Modulus of elasticity √ √
B.6.1.2. Flexural Reinforcement
Reinforcement ratio perpendicular to the free edge, ρp = 0.009
Reinforcement ratio parallel to the free edge, ρl = 0.0082
Average reinforcement ratio,
Modulus of elasticity perpendicular to the free edge, Ep = 52460 MPa
Modulus of elasticity parallel to the free edge, El = 65374 MPa
Average modulus of elasticity,
Modular ratio,
B.6.2. Shear Capacity according to CAN/CSA S806-12 Clause 8.7
(
) [ (
) ⁄ ] (
) [ (
) ⁄ ]
(
) (
) ⁄ (
)
( ) ⁄

Appendix B: Shear Capacity of Connections without Shear Reinforcement
B-11
( ) ⁄ ( )
⁄
(Governs)
(
)⁄
(
)
⁄
B.6.3. Shear Capacity according to ACI 440.1R-06 Clause 9.4
√ ( ) √ ( )
√
√
(
)⁄
(
)
⁄
B.6.4. Shear Capacity according to JSCE 1997 Clause 6.3.4
√
√
√
√
√ √
(
)⁄
(
)
⁄
B.7. Connection GSC-0.9-XX-0.6
B.7.1. Material Properties
B.7.1.1. Concrete
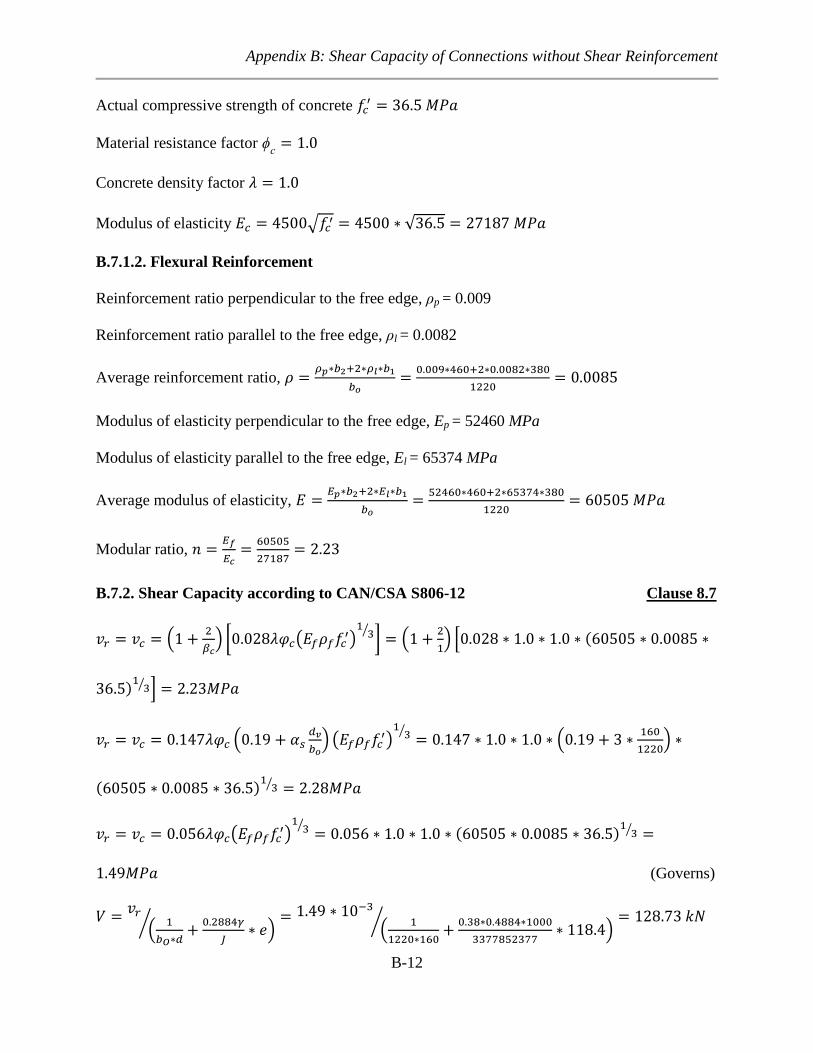
Appendix B: Shear Capacity of Connections without Shear Reinforcement
B-12
Actual compressive strength of concrete
Material resistance factor c
Concrete density factor
Modulus of elasticity √ √
B.7.1.2. Flexural Reinforcement
Reinforcement ratio perpendicular to the free edge, ρp = 0.009
Reinforcement ratio parallel to the free edge, ρl = 0.0082
Average reinforcement ratio,
Modulus of elasticity perpendicular to the free edge, Ep = 52460 MPa
Modulus of elasticity parallel to the free edge, El = 65374 MPa
Average modulus of elasticity,
Modular ratio,
B.7.2. Shear Capacity according to CAN/CSA S806-12 Clause 8.7
(
) [ (
) ⁄ ] (
) [ (
) ⁄ ]
(
) (
) ⁄ (
)
( ) ⁄
( ) ⁄ ( )
⁄
(Governs)
(
)⁄
(
)
⁄

Appendix B: Shear Capacity of Connections without Shear Reinforcement
B-13
B.7.3. Shear Capacity according to ACI 440.1R-06 Clause 9.4
√ ( ) √ ( )
√
√
(
)⁄
(
)
⁄
B.7.4. Shear Capacity according to JSCE 1997 Clause 6.3.4
√
√
√
√
√ √
(
)⁄
(
)
⁄
B.8. Connection GRD-0.9-XX-0.4
B.8.1. Material Properties
B.8.1.1. Concrete
Actual compressive strength of concrete
Material resistance factor c
Concrete density factor
Modulus of elasticity √ √

Appendix B: Shear Capacity of Connections without Shear Reinforcement
B-14
B.8.1.2. Flexural Reinforcement
Reinforcement ratio perpendicular to the free edge, ρp = 0.0087
Reinforcement ratio parallel to the free edge, ρl = 0.0084
Average reinforcement ratio,
Modulus of elasticity perpendicular to the free edge, Ep = 53892 MPa
Modulus of elasticity parallel to the free edge, El = 63500 MPa
Average modulus of elasticity,
Modular ratio,
8
B.8.2. Shear Capacity according to CAN/CSA S806-12 Clause 8.7
(
) [ (
) ⁄ ] (
) [ (
) ⁄ ]
(
) (
) ⁄ (
)
( ) ⁄
( ) ⁄ ( )
⁄
(Governs)
(
)⁄
(
)
⁄
B.8.3. Shear Capacity according to ACI 440.1R-06 Clause 9.4
√ ( ) √ ( )

Appendix B: Shear Capacity of Connections without Shear Reinforcement
B-15
√
√
(
)⁄
(
)
⁄
B.8.4. Shear Capacity according to JSCE 1997 Clause 6.3.4.
√
√
√
√
√ √
(
)⁄
(
)
⁄

Appendix C: Shear Capacity of Connections with Shear Reinforcement
C-1
APPENDIX C
Shear Capacity of Connections with Shear Reinforcement

Appendix C: Shear Capacity of Connections with Shear Reinforcement
C-2
C.1. Introduction
There are no provisions in the CAN/CSA S806-12 or the ACI 440.1R-06 for designing shear
reinforcement for slab-column connections; therefore, the provisions of the CAN/CSA A23.3-04
and the ACI 318-11were used with proper modifications, whenever applicable (Section 2.7). It is
assumed that the critical section outside the shear reinforced zone is located at a distance 3.9d
away from the face of the column. Also, the spacing between stud lines is taken as 0.75d and
0.5d for connections GRD-0.9-75-0.4 and GRD-0.9-50-0.4, respectively.
Figure C.1: Typical Arrangement of Headed Shear Reinforcement and Critical Sections

Appendix C: Shear Capacity of Connections with Shear Reinforcement
C-3
C.2. Properties of Critical Sections
C.2.1. Critical Section at a distance d/2 from the column face
(
)
(
)
Figure C.2: Critical section at d/2 from
column face
Where e is the distance between the centroid and the inner side of the critical section and J is a
property of the critical shear section analogous to the polar moment of inertia
√
√
(
) (
) when

Appendix C: Shear Capacity of Connections with Shear Reinforcement
C-4
C.2.2. Critical Section at a distance 3.9d from the column face (for shear-reinforced
connections)
( ) ( )
Taking the summation of the moments of the critical section
segments about the free edge to get X:
(
)
(
)
Figure C.3: Critical section
outside the shear reinforced
zone
Calculating J:
∑
(
)
For segment 1:
For segment 2:
For segment 3:

Appendix C: Shear Capacity of Connections with Shear Reinforcement
C-5
{ [( ) ( ) ( ) ( ) ]
[( ) ( ) ( ) ( ) ] [( ) ( ) ( )
( ) ]}
√
√
(
) (
) when
C.3. Reinforcement Properties
C.3.1. Properties of Headed Shear Studs
Use No. 13bars
Ultimate tensile strength
Ultimate tensile strain
Modulus of elasticity
C.3.2. Flexural Reinforcement Properties
Reinforcement ratio perpendicular to the free edge, ρp = 0.0087
Reinforcement ratio parallel to the free edge, ρl = 0.0084
Average reinforcement ratio,
Modulus of elasticity perpendicular to the free edge, Ep = 53892 MPa
Modulus of elasticity parallel to the free edge, El = 63500 MPa
Average modulus of elasticity,
C.4. Connection GRD-0.9-75-0.4
C.4.1. Concrete Properties
Actual compressive strength of concrete
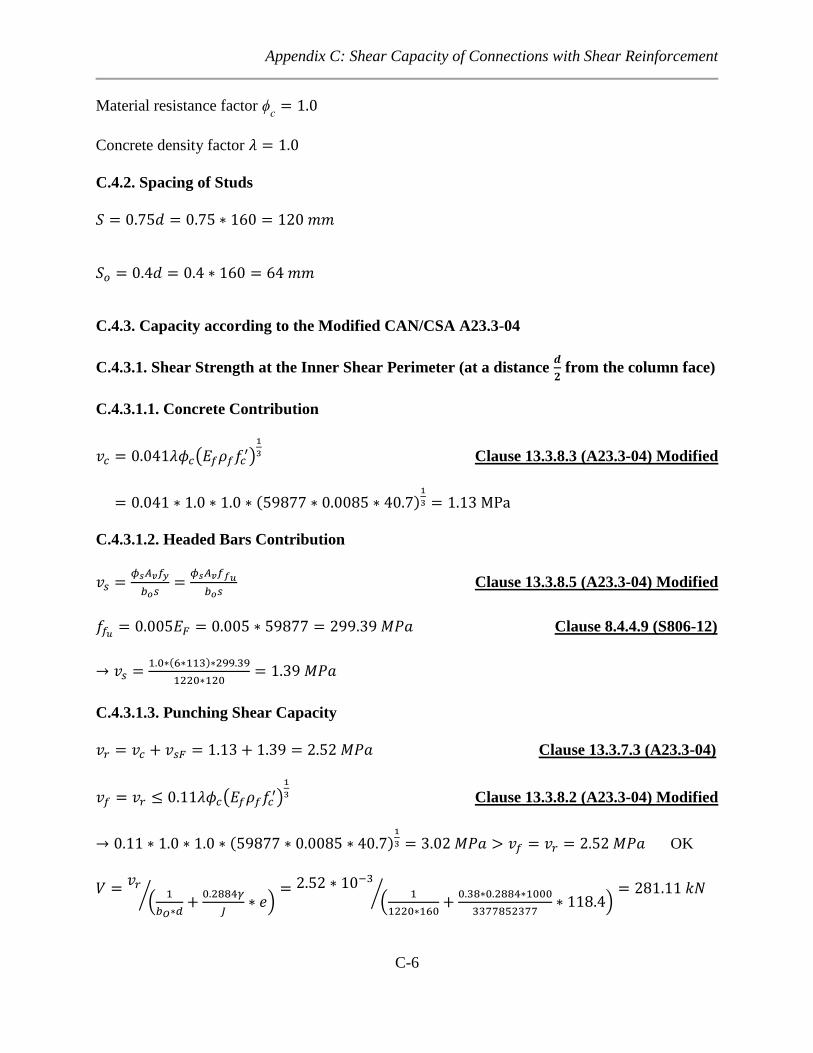
Appendix C: Shear Capacity of Connections with Shear Reinforcement
C-6
Material resistance factor c
Concrete density factor
C.4.2. Spacing of Studs
C.4.3. Capacity according to the Modified CAN/CSA A23.3-04
C.4.3.1. Shear Strength at the Inner Shear Perimeter (at a distance
from the column face)
C.4.3.1.1. Concrete Contribution
( )
Clause 13.3.8.3 (A23.3-04) Modified
( )
C.4.3.1.2. Headed Bars Contribution
Clause 13.3.8.5 (A23.3-04) Modified
Clause 8.4.4.9 (S806-12)
( )
C.4.3.1.3. Punching Shear Capacity
Clause 13.3.7.3 (A23.3-04)
( )
Clause 13.3.8.2 (A23.3-04) Modified
( )
OK
(
)⁄
(
)
⁄
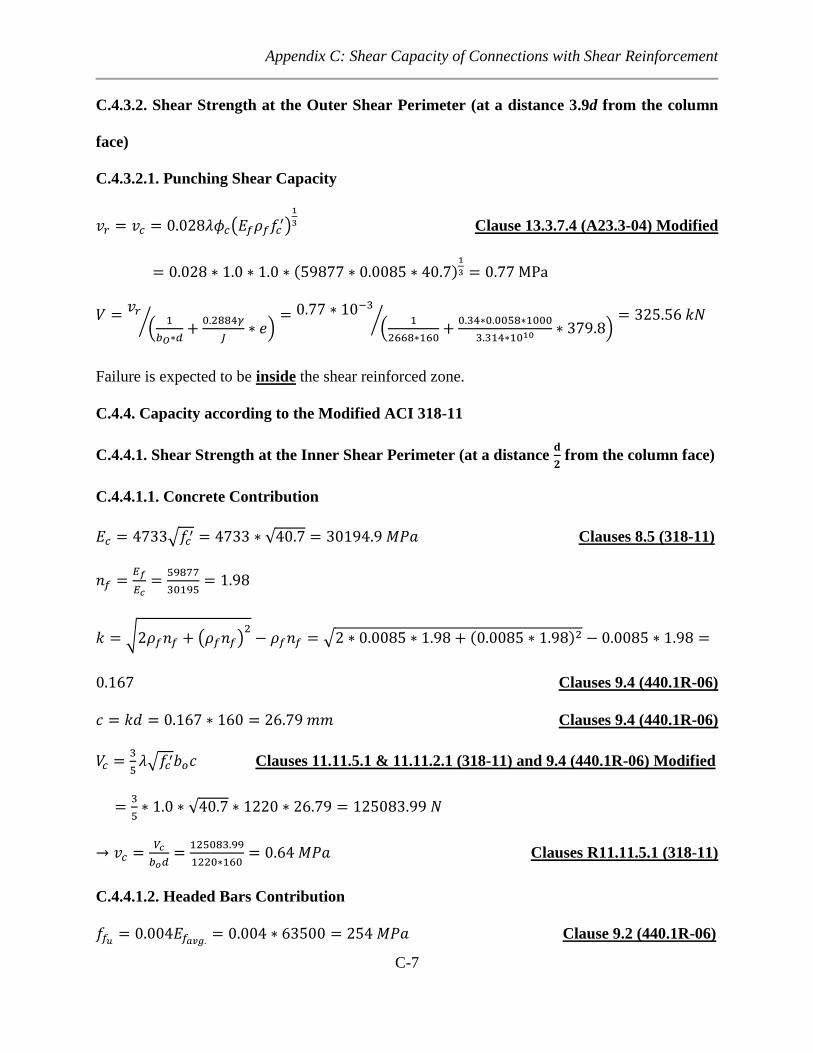
Appendix C: Shear Capacity of Connections with Shear Reinforcement
C-7
C.4.3.2. Shear Strength at the Outer Shear Perimeter (at a distance 3.9d from the column
face)
C.4.3.2.1. Punching Shear Capacity
( )
Clause 13.3.7.4 (A23.3-04) Modified
( )
(
)⁄
(
)
⁄
Failure is expected to be inside the shear reinforced zone.
C.4.4. Capacity according to the Modified ACI 318-11
C.4.4.1. Shear Strength at the Inner Shear Perimeter (at a distance
from the column face)
C.4.4.1.1. Concrete Contribution
√ √ Clauses 8.5 (318-11)
√ ( ) √ ( )
Clauses 9.4 (440.1R-06)
Clauses 9.4 (440.1R-06)
√ Clauses 11.11.5.1 & 11.11.2.1 (318-11) and 9.4 (440.1R-06) Modified
√
Clauses R11.11.5.1 (318-11)
C.4.4.1.2. Headed Bars Contribution
Clause 9.2 (440.1R-06)

Appendix C: Shear Capacity of Connections with Shear Reinforcement
C-8
( )
Clause 11.11.5.1 (318-11) Modified
√
Clauses 11.11.5.1 & 11.11.2.1 (318-11) and 9.4 (440.1R-06) Modified
√
√
OK
C.4.4.1.3. Punching Shear Capacity
Clause 11.11.5.1 (318-11)
(
)⁄
(
)
⁄
C.4.4.2. Shear Strength at the Outer Shear Perimeter (at a distance 3.9d from the column
face)
C.4.4.2.1. Punching Shear Capacity
√ Clauses 11.11.5.4 & 11.11.2.1 (318-11) and 9.4 (440.1R-06) Modified
√
Clauses R11.11.2.1 (318-11)
(
)⁄
(
)
⁄
Failure is expected to be outside the shear reinforced zone.
C.5. Connection GRD-0.9-50-0.4
C.5.1. Concrete Properties
Actual compressive strength of concrete
Material resistance factor c
Concrete density factor

Appendix C: Shear Capacity of Connections with Shear Reinforcement
C-9
C.5.2. Spacing of Studs
C.5.3. Capacity according to the Modified CAN/CSA A23.3-04
C.5.3.1. Shear Strength at the Inner Shear Perimeter (at a distance
from the column face)
C.5.3.1.1. Concrete Contribution
( )
Clause 13.3.8.3 (A23.3-04) Modified
( )
C.5.3.1.2. Headed Bars Contribution
Clause 13.3.8.5 (A23.3-04) Modified
Clause 8.4.4.9 (S806-12)
( )
C.5.3.1.3. Punching Shear Capacity
Clause 13.3.7.3 (A23.3-04)
(
)⁄
(
)
⁄
C.5.3.2. Shear Strength at the Outer Shear Perimeter (at a distance 3.9d from the column
face)
C.5.3.2.1. Punching Shear Capacity
( )
Clause 13.3.7.4 (A23.3-04) Modified
( )

Appendix C: Shear Capacity of Connections with Shear Reinforcement
C-10
(
)⁄
(
)
⁄
Failure is expected to be outside the shear reinforced zone
C.5.4. Capacity according to the Modified ACI 318-11
C.5.4.1. Shear Strength at the Inner Shear Perimeter (at a distance
from the column face)
C.5.4.1.1. Concrete Contribution
√ √ Clauses 8.5 (318-11)
√ ( ) √ ( )
Clauses 9.4 (440.1R-06)
Clauses 9.4 (440.1R-06)
√ Clauses 11.11.5.1 & 11.11.2.1 (318-11) and 9.4 (440.1R-06) Modified
√
Clauses R11.11.5.1 (318-11)
C.5.4.1.2. Headed Bars Contribution
Clause 9.2 (440.1R-06)
( )
Clause 11.11.5.1 (318-11) Modified
√
Clauses 11.11.5.1 & 11.11.2.1 (318-11) and 9.4 (440.1R-06) Modified
√
√
OK
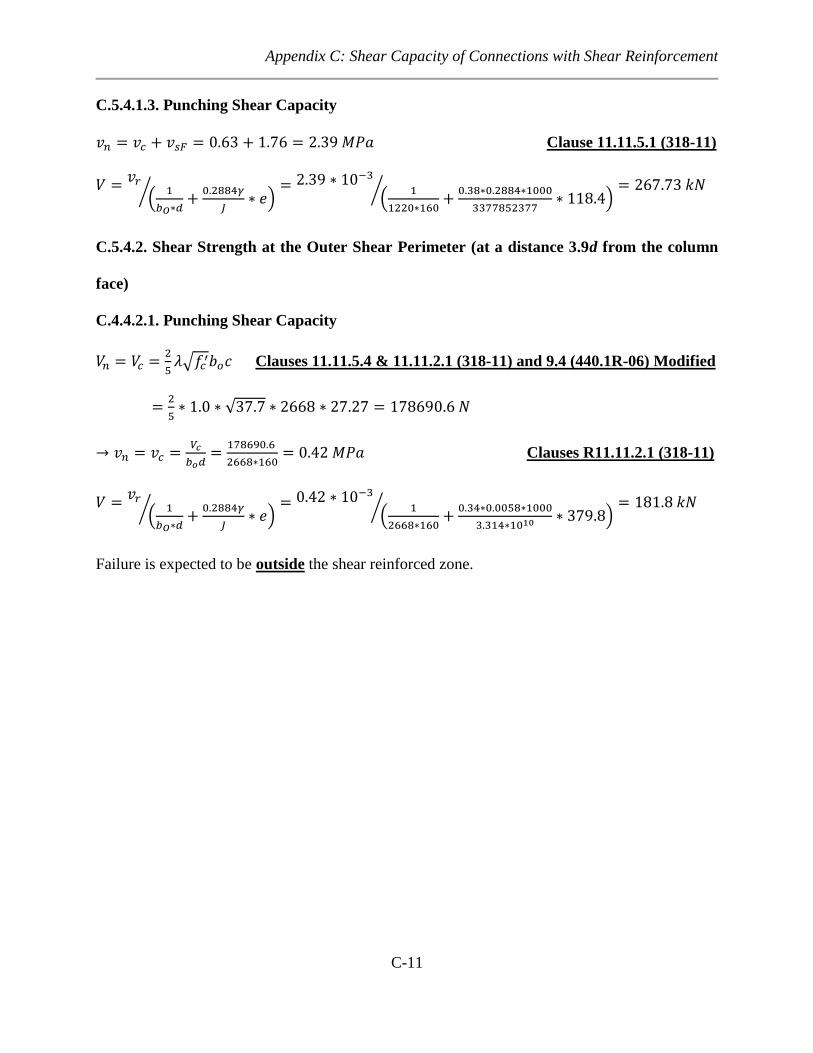
Appendix C: Shear Capacity of Connections with Shear Reinforcement
C-11
C.5.4.1.3. Punching Shear Capacity
Clause 11.11.5.1 (318-11)
(
)⁄
(
)
⁄
C.5.4.2. Shear Strength at the Outer Shear Perimeter (at a distance 3.9d from the column
face)
C.4.4.2.1. Punching Shear Capacity
√ Clauses 11.11.5.4 & 11.11.2.1 (318-11) and 9.4 (440.1R-06) Modified
√
Clauses R11.11.2.1 (318-11)
(
)⁄
(
)
⁄
Failure is expected to be outside the shear reinforced zone.
Appendix D: Yield Line Analysis
D-1
APPENDIX D
Yield Line Analysis

Appendix D: Yield Line Analysis
D-2
D.1. Yield Line Pattern
The yield line pattern shown in Figure D.1 was proposed by Mortin (1989). It consists of six
plane segments and two fan-shape segments. The pattern is defined by three parameters, a, b and
c, since the angle of the fan shape,, is a function of a only. The principal of virtual work is
being used to analyze the pattern.
Figure D.1: Yield Line Pattern (reproduced from Mortin 1989)
The line of maximum deflection, XY, is given a unit displacement, , in the direction of the
shearing force, V. Plates number 4 do not move while plates number 1, 2, and 3 and the two fan-
shape segments move up a distance ranging from zero at their ends to where they intersect with
line XY. The end of plate number 1, where the displacement is zero, is the imaginary line AA if
the plate was continued.
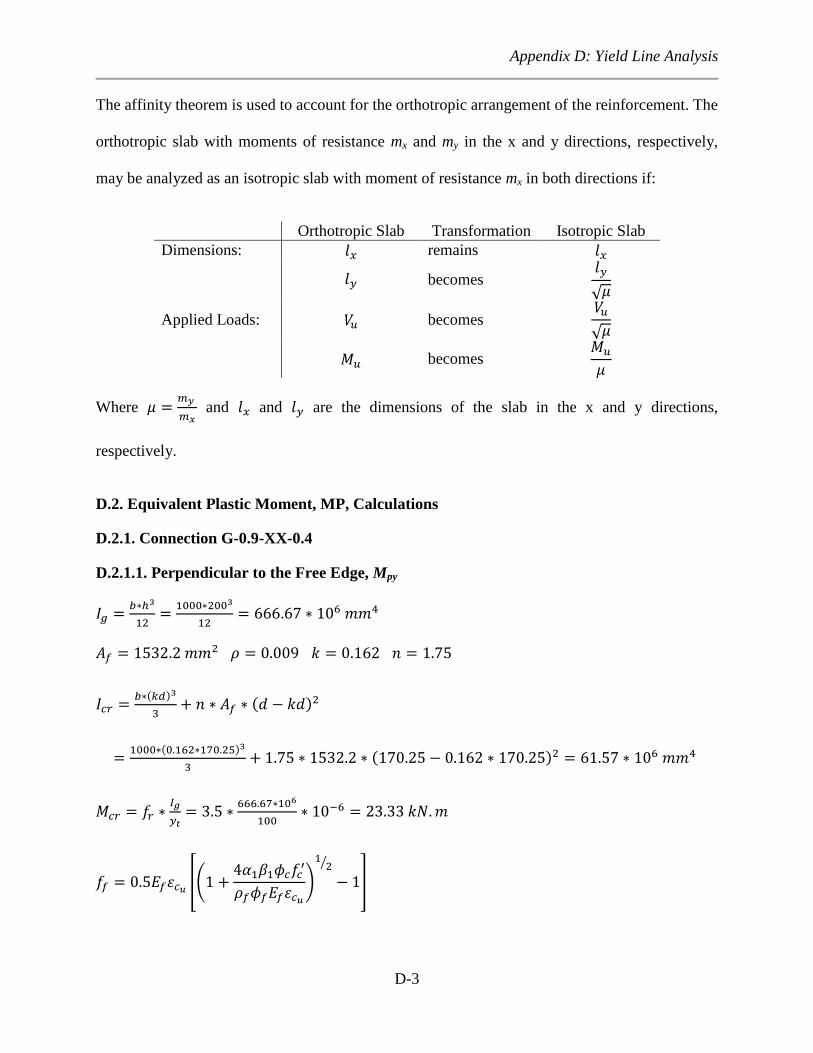
Appendix D: Yield Line Analysis
D-3
The affinity theorem is used to account for the orthotropic arrangement of the reinforcement. The
orthotropic slab with moments of resistance mx and my in the x and y directions, respectively,
may be analyzed as an isotropic slab with moment of resistance mx in both directions if:
Orthotropic Slab Transformation Isotropic Slab
Dimensions: remains
becomes
√
Applied Loads: becomes
√
becomes
Where
and and are the dimensions of the slab in the x and y directions,
respectively.
D.2. Equivalent Plastic Moment, MP, Calculations
D.2.1. Connection G-0.9-XX-0.4
D.2.1.1. Perpendicular to the Free Edge, Mpy
( )
( )
( )
( )
[(
)
⁄
]

Appendix D: Yield Line Analysis
D-4
[(
)
⁄
]
(
) (
)
(
) (
) (
) (
)
D.2.1.2. Parallel to the Free Edge, Mpx
( )
( )
( )
(
)
[(
)
⁄
]
[(
)
⁄
]
(
) (
)
(
) (
) (
) (
)

Appendix D: Yield Line Analysis
D-5
D.3. Virtual Work Calculations
D.3.1. Internal Work, I
The internal work done by the plane segments is calculated from Equation D.1 as listed in Table
D.1.
Eq. [D.1]
Where I is the internal work done along the yield line, m is the moment of resistance per unit
width of the slab, θ is the relative rotation of the two segments about the yield line, and l is the
length of the yield line.
Table D.1: Work done by the plane segments
Segment mx θx Ly my θy Lx
1 0 0 0 mx
√
√
⁄
√ ⁄
√ ⁄
2 mx
√ 0 0 0
3 0 0 0 mx
√ L11-2a
4 0 0 0 0 0 0
The work done by the two fan shape segments is calculated as follows:
Ifan [
(
√ ) (
√ )]
Accordingly, the total internal work done is:
√
√
( )
( ) √
[
(
√ ) (
√ )]
D.3.2. Internal Work, E
√ ( ) √
√
√

Appendix D: Yield Line Analysis
D-6
√ ( )
√
√
Internal work done = External work done
√
√
√
( )
( )
√ [
(
√ ) (
√ )]
{
( )
( )
[ (
√ ) (
√ )]√ }
This equation gives the vertical load applied to the connection as a function of a, b and c. In
order to obtain the minimum value of Vu, the following optimization problem was formulated:
{ }
( )
subject to
Then, MATLAB® was used to solve this problem using its built-in function “fmincon” and the
following results were obtained:
Connection Flexural Capacity, Vflex (kN)
S-0.9-XX-0.4 332.6
GSC-0.9-XX-0.4 275.9
GSC-1.35-XX-0.4 321.6
GSC-1.8-XX-0.4 373
GSC-0.9-XX-0.2 331.6
GSC-0.9-XX-0.6 232.5
GRD-0.9-XX-0.4 353.4
GRD-0.9-75-0.4 353.4
GRD-0.9-50-0.4 337.9