
Pulses Monthly Research Report: April-2021
69
Pulses Monthly Report April, 2021 Pulses Monthly Research Report: April-2021
Transcript of Pulses Monthly Research Report: April-2021

Pulses Monthly Report April, 2021
Pulses Monthly Research Report: April-2021

Pulses Monthly Report April, 2021
Contents:
Pulses Sector-Highlights
Domestic & Global
Supply & Demand
Area & Yield Estimates (Kharif)
Kharif Progressive Sowing
Pulses-Wise Analysis
Chana (Chick Pea)
Matar (Dried peas)
Masoor (Lentils)
Tur (Pigeon Pea)
Urad (Black Matpe)
Moong (Green Gram)
Appendix:
Agri Commodity Indices Oct -2020:
Indian Pulses- Wise Import- Monthly Analysis
Price Trend ( Seasonality)
Indicative Pulses & Processed Pulses Prices (Domestic; Imported; Cnf) & Arrivals
India
Australia
Canada
US

Pulses Monthly Report April, 2021
Pulses Sector-Highlights
As per the latest update by BoM-bureau of Meteorology (Australia) has forecast normal monsoon
season in India. This means Indian farmers will receive good rains in June, July, Aug & Sep. There is no
chance of La Nina or Al-Nino. If it happens, it would be good for Kharif crops in general and India &
Indian farmers in particular. Indian farmers are waiting for the IMD forecast, likely in the first-second
week of April-2021. Urad & Moong including paddy is the main Kharif crops. The IMD will come with its
own forecast soon, likely by the end of this month.
The govt. has made it compulsory for new importers, exporters & customs brokers to verify their
identity under the customs (Verification of Identity & Compliance) Regulations,2021. This includes
verification of incorporation document, PAN, Aadhaar, and place of business. The regulation also gives
customs authorities the power to undertake identity verification for existing traders.
Chana production estimates for the crop year 2020-21 have been revised down from 110.63 lakh MT
(preliminary estimates) to 95.58 lakh MT. The downward revision is due to lower yield in the major
producing states like Rajasthan, M.P., Karnataka, U.P.., except Maharashtra and Gujarat. The major
loss has been recorded in Rajasthan, followed by M.P. & Karnataka. Lower production and stockiest
buying at the current price may continue to support the cash chana market. Chana cash market may
move to Rs 5500 in May. However, if COVID cases increase, lockdown is imposed & pulses are
distributed free of cost, it may cap the uptrend. Good monsoon rains too may help to reign one-way
momentum.
The poor yield of tur this year and stockists' strong holding power amid no hope for immediate import
due to unrest in Myanmar may push up tur price again. Crop in UP is in good condition and we expect
around 2.50 lakh MT crop soon from this state. It may meet the immediate requirements of mills. In
June import may take place. So, any big jump in the tur market unlikely. It may move up by 200 to 300.
Apart from it mango season is about to start and it may check the price. In Maharashtra, mills are
buying. Fundamental for tur market is firm and it may recover in coming weeks. It may continue to
move in the range of 6900-7500 in April. Import may start from June despite early submission (online)
of import application.
Despite an extended timeline for urad import from backlog quota (31st March to 30th April-2021,
and another import quota of 4 lakh MT for the ongoing financial year, the Urad market continues to
trade firm. Some downward correction was seen in March, but it could not sustain due to short supply
in the domestic market and the slower pace of import flow from Myanmar. Political unrest in Myanmar
& the disrupted supply side there too may remain supportive for the cash urad market. Import from the
new quota would not take place before June, while new big crop would not be available before August-
September. So, the cash market may move up by 200-300 by the end of April. With increasing
temperature demand too is bound to increase.
Arrival from the summer moong crop is expected to hit the market from April. The crop condition of
moong in Odisha, M.P. & Bihar is normal to good. Arrival from the rabi crop is decreasing now. Demand
is weak and prices are expected to decrease in the coming weeks. As there is a shortage of quality crops,
prices are ruling around MSP. Stockists too have started offloading stock just ahead of the summer
crop. Steady to slight weak tone may be seen during the next two three weeks. Thereafter, monsoon
rains in June and July would be the driving force for prices. Prices may come down below MSP.

Pulses Monthly Report April, 2021
As lentil prices are ruling at the higher level, above MSP, Nafed may plan to buy lentils at market
price as prices are unlikely to decrease. The arrival pace may increase in the coming weeks as prices
may cool down by Rs 250-300 from the current level. The crop size (11.73 lakh MT) is lower and import
will continue despite 30 % duty and cess. Right now lentil is ruling at Rs 5700-5800, which may come
down to Rs 5300-5400. With the rising temperature and likely marriage season demand may improve
and it will not allow the market to decrease beyond a certain level.
Global Market:
According to the Pulses, Guidance Note issued last week by Pulse Australia (PA) and the Grains
Industry Market Access Forum (GIMAF) right now the monsoon season and India’s political climate were
being watched closely India’s and Pakistan’s production from rabi, or winter crop is slightly lower than
expectations due to drier conditions. Despite low production expectations India is still blocking most
pulses imports, hope existed that India would drop its tariff on Australian lentils from the current 30
percent. India would normally be the driver for Australia’s pulse outlook, but tariffs and biosecurity
challenges are currently keeping volume exports of Australian pulses out of the market. With Australian
2020 production at around 800,000t, it is debatable whether these markets can absorb the 2020 crop,
so some growers are reporting to be holding stocks, waiting to see how the subcontinent production
eventuates.
Bangladesh and Pakistan continue to buy Chickpeas from Australia and so prices hinge around $660-670 per MT basis CiF at destinations. Pakistan has been a regular buyer of the containerized Australian chickpeas, and its peak figure of recent years is believed to be 37,759t in December 2020, the biggest volume seen since 34,805t in April 2018. The February 2021 export figure could well be above that to reflect containerized exports as well as the 25,000t of bulk to Pakistan, and further bulk sales to Bangladesh.
Prices for Mung beans stayed steady at the previous month level at around $1300/t for No. 1 grade,
$1200/t for processing, and $1100/t for manufacturing. Harvesting is expected to begin soon in
Queensland. Recent rains are beneficial to standing crops in the field. Production prospects have
improved a lot. Chinese buyers are active and most of the Mung beans booked for shipment from April
onward. Containers are readily available for China right now.
Major pulses in Australia traded slightly firm as export demand is likely to continue in the second half of 2021. Apart from it, freight for some destinations in the Middle East &South Asia too moved up and it too has helped to keep prices up of chickpeas & lentils for bulk exports volume. On the production front, most of Australia's moong growing areas in New South Wales & Queensland received good rains in recent days, and more rains are expected in northern South Wales, Victoria. The crop would be ready for harvest in April-May. It has increased better sowing prospects for winter crops like Chickpeas, Lentils, and Fava beans.
Lentils production in Canada is expected to decrease from 28.68 in 2020-21 to 2.7 MMT in 2021-22 due to slightly lower area & yield. Export too are expected to decrease by 2 lakh MT to 25 lakh MT in 2021-22. Total supply is expected to decrease from 31.77 to 29.25 lakh MT due to likely lower production in 2021-22.Against it domestic usage. However, domestic use would decrease from 3.27 to 2.75 lakh MT in 2021-22. To carry out stock would stay at same las last year at 1.5 MT. The average yearly price is expected to be in the range of $ 585 per MT. For 2002-21 it is $ 600 per MT.

Pulses Monthly Report April, 2021
Dry peas production in Canada is expected to decrease from 45.94 lakh Mt in 2020-21 to 44.00 lakh
MT in 2021-22 due to the lower expected yield from 2.73 to 2.57 tonne in 2021-22. The total supply too
would decrease from 49.22(2020-21) to 47.90 lakh MT in 2021-22. The export fig too is expected to
decrease from 38 to 37 lakh MT in 2021-22. However, domestic usage may increase from 8.22 to
8.40lakhMT in 2021-22. The carry out would decrease from 3 to 2.5 lakh MT. The yearly average price
may hover at $300 per MT in 2021-22 against 4330 in 2020-21.
Lentils export from Australia increased sharply in Dec-2020 as per data released by the Australia
Bureau of Statistics. Total movement in Dec increased to 101,148 MT up by189% from the previous
month's total of 34,974. So far export sales have totaled 136,121 MT, up from 135,053 in the same
period the last marketing year. India purchased 42,154 MT, Bangladesh 15,256 MT & Sri Lanka 14,970
MT.
Chickpeas production in Australia is expected to increase from 2.81 to 7.55 lakh mt in 2020-21. Even
field peas production would increase from 2.19 to 2.94 lakh MT-n 2020-21. Even lentils production may
increase from 5.34 to 6.34 lakh Mt in 2020-21.
Lentils production in US for 2020 has been pegged at 336,201 MT based on 514,000 acres.Lentil
production is up by 40% from last year with a USDA production estimate of 7.41 million cwt. Planted
acreage was up 9% from 2019 with 528,000 acres in 2020, and harvested acreage was up even more,
21% at 514,000 acres.
Pulses Supply & Demand:
(*All quantities in Lakh tonnes)AW Est. Urad Moong
Tur Chana Masur
(Kha-Rabi)
(Kha- Rabi)
Marketing Year (March to February)
2019-20
2020-21 *
2019-20
2020-21*
2019-20
2020-21
2019-20
2020-21*
2019-20
2020-21*
Opening Stocks 8.75 2.37 5.52 2.10 7.87 7.06 18.2
2 21.32 3.59 7.32
Production /Fresh arrival 19.39 24.19 19.06 21.42 37.1
9 37.2
8 106.10 95.58
12.85 11.73
Imports 3.95 3.50 0.59 1.65 4.5 3.80 4.0 3 10.6
1 7.0
Total Supply (O S+ Production+ Imports) 32.09 30.06 25.17 25.17
49.56
48.14
128.32
119.90
27.05 26.05
Exports 1.72 0.5 0.07 0.1 0.5 0.3 2.0 3.5 0.23 0.55
Consumption 28 27.5 23 22.5 42 43 105 100 19.5
0 20.00
Total Use( Export + Consumption) 29.72 28 23.07 22.6 42.5 43.3 107 103.5
19.73 20.55
Ending Stocks (Total Supply - Total Use) 2.37 2.06 2.10 2.57 7.06 4.84
21.32 16.40 7.32 5.50
*AW estimates
Note (for chana and Masur crop year is 2020-21 and it will be marketed in FY 2021-22

Pulses Monthly Report April, 2021
Kharif Pulses:
Urad:
MY 2020-21 started with 2.37 lakh MT carry in stock while production is up by 4.89 lakh MT to 24.19 lakh
MT this year. It would increase supply to 30.06 lakh MT including imports. Supply side is hence expected to
remain slightly tight. Crop condition is normal to good except some pockets of Maharashtra, Madhya
Pradesh and Gujarat, so far. Rabi sowing passed the half way mark.
Moong:
The new season started with2.10 lakh MT carry in while production is up by around 2.36 lakh MT to 21.42
lakh MT this year. Despite higher production total supply would increase slightly to 25.17 lakh MT due to
lower carry in stock. So the prices should remain on the higher side in 2021 too
Tur:
Production of Tur is likely to increase from37.19 to 37.28 lakh MT this year due to lower yield despite higher
area coverage. Total supply would decrease from 49.56 to 48.14 lakh MT this year. Supply side seems
contracting in the ongoing season in comparison to last year.
Rabi Pulses: Chana: Agriwatch has revised Chana production down from 110.63 lakh MT to 95.58 lakh MT
for crop year 2020-21,to be marketed in 2021-22. Supply side would decrease from 128.32 to 119.90 this
year. Carryout would decrease from 21.32 lakh MT to 16.40 lakh MT this year. It may keep price well
supported throughout the year.
Masur: AW has revised its lentils production down from 13.49 lakh MT to 11.73 lakh MT.As new crop is
expected to hit market from May, price should soften, but unlikely to come near MSP. Carryout would
decrease from 7.32 to 5.50 lakh MT. Lower carryout stock may encourage import this year too.
Area & Yield Estimates For Kharif Tur, Urad & Moong-2020-21:
Agriwatch APY Estimates Of Tur For 2020-21
State Harvested Area (‘000’ Ha) Yield (kg /ha) Production (‘000’ MT)
AP 209 518.95 108
Gujarat 226 1142.40 258
Karnataka 1254 641.25 804
M P 408 665.00 271
MH 1247 832.50 1038
Odisha 1.28 836.00 107
Raj 009 765.00 007
UP 354 1035.15 366
Telangana 423 577.20 244
Others 529 988.80 523
All India 4787 778.74 3728
Agriwatch APY Estimate For kharif Urad-2020-21

Pulses Monthly Report April, 2021
State Area (000 ha) Yield (kg/ ha) Production(ooo'MT)
Madhya Pradesh 1594 414.78 661
Maharashtra 396 455.16 180
Rajasthan 380 513.03 195
Uttar Pradesh 695 558.27 319
Others 815 470.40 384
All-India 3880 1738
Area as on 25th Sep-20 taken from govt. data, considering the end of the sowing season
Agriwatch APY estimate for Kharif Moong 2020-21
States Area ('000')ha Yield(000') /kg Production Lakh MT
A P 016 585.42 0.09
Bihar 024 721.89 0.17
Chhattisgarh 044 291.76 0.13
Gujarat 092 475.81 0.44
Karnataka 431 255.00 1.10
Madhya Pradesh 153 321.75 0.49
Maharashtra 389 536.04 2.09
Odisha 091 241.47 0.22
Rajasthan 2074 429.27 8.90
Tamil Nadu 020 545.79 0.11
Uttar Pradesh 040 469.40 0.19
West Bengal 030 800.00 0.24
Telangana 012 622.50 0.07
Others 134 523.18 0.70
All India 3551 421.01 14.95
Source: Private Trades
Rabi Chana Revised APY :
2020-21
Chana Revised APY (Production fig '000',Area '000'ha)
States Harvetsed Area Revised Yield(kg
ha) Production
Andhra Pradesh 401.8 869.51 349.37
Chhattisgarh 427.68 985.70 421.56
Gujarat 775.68 1234.67 957.71
Jharkhand 254.475 1102.45 280.55
Karnataka 1145.625 546.94 626.59
Madhya Pradesh 2497.75 1062.68 2654.31
Maharashtra 2403.94 775.45 1864.14
Rajasthan 2036.16 720.53 1467.11
Telangana 117.81 1255.84 147.95
Uttar Pradesh 569.38 1016.09 578.54
Others 217.037 969.51 210.42
All India 10847.337 9558.26
Note: Production includes Kabuli chana too. If we deduct retention (8 to 10 lakh MT) for seed, availability for the market would be 82 lakh MT would be around 82 lakh MT from the new crop. It may keep prices well supported at the current level and may move up once demand starts increasing.

Pulses Monthly Report April, 2021
AW Urad Rabi Production Estimate For Crop Year 2020-21
State/ UT
Area-(000ha)(2020-21) Production Yield/kg ha
2020-21 000' MT 5 years ave
Andhra Pradesh 373.04 331.54 888.74
Assam 57.40 38.26 666.62
Tamil Nadu 362.47 241.37 665.92
Uttar Pradesh 47.60 32.71 687.11
Others 50.57 37.54 742.42
All India 891.07 681.42 764.72
AW Rabi Moong Production Estimate-2020-21
States Area (000 ha) Production (000/Mt) Yield (kg /ha)
Andhra Pradesh 134.37 91.07 677.79
Bihar 164.36 110.29 671.04
Tamil Nadu 147.29 60.84 413.09
M.P. 228.80 181.88 794.92
Uttar Pradesh 47.25 34.40 728.02
West Bengal 60.42 40.65 672.80
Others 246.15 127.72 518.89
All India 1028.6 646.86 628.85
States Area (000 ha) Yield (k.g /ha) Production(‘000’ ha)
Lentils 2021-22(AW Pre Est) Crop year 2020-21
Bihar 217.33 1223.60 265.93
M. P. 496.46 606.06 300.89
U. P. 621.09 845.95 525.41
Others 320.33 802.83 257.17
All India 1655 815.23 1349.39

Pulses Monthly Report April, 2021
Chana (Chickpeas /Bengal Gram): Market Recap: Cash chana market traded up in March by 7.21 % from Rs 4700 to 5039 in comparison to February-2021.Australian chana too traded up by 3 % to 5646 per qtl. Lower crop size in Rajasthan, Madhya Pradesh and Maharashtra amid ongoing procurement drive under price support scheme and lower arrivals have lent support to cash chana market. Prices of chana may move further up and may cross 5600-5700 level in April. Govt. wants to procure over 2 MMT chana in 2021.Arrival pace is not up to the mark. Crop condition in Karnataka and Gujarat is average to good. AW has revised its chana production estimate down by 15 lakh MT from its preliminary estimates of 11 MMT. New season started with 21.31 MMT carry in stock. However, total availability would decrease from 128 to119 lakh MT. It would keep price well supported. If demand improves, price may go further up. Import flow would remain restricted as duty plus cess is 60%.Import flow may continue from least developed countries as they enjoys benefit of zero duty. Following graph illustrates chana price movement in different markets:
Price Dynamics: Prices are likely to trade firm in April-2021 due to:
Low crop size including chickpeas(95.58 lakh MT)
Major loss in Rajasthan, around 40%
Target to procure over 2MMT under price support scheme
Buying by stockists and mills in bulk volume
Restricted import&
Likely good demand in marriage season
Seasonality Index: hints slightly firm movement for spot market for April-2021.
2500
2800
3100
3400
3700
4000
4300
4600
4900
5200
5500
5800
6100
6400
03
-Ap
r-1
7
03
-Ju
n-1
7
03
-Au
g-1
7
03
-Oct
-17
03
-Dec
-17
03
-Feb
-18
03
-Ap
r-1
8
03
-Ju
n-1
8
03
-Au
g-1
8
03
-Oct
-18
03
-Dec
-18
03
-Feb
-19
03
-Ap
r-1
9
03
-Ju
n-1
9
03
-Au
g-1
9
03
-Oct
-19
03
-Dec
-19
03
-Feb
-20
03
-Ap
r-2
0
03
-Ju
n-2
0
03
-Au
g-2
0
03
-Oct
-20
03
-Dec
-20
03
-Feb
-21
03
-Ap
r-2
1
Rs/
Qu
inta
l
Chana Price Movement
Rajasthana Chana at Delhi MP Chana at Delhi Chana at IndoreChana at Jaipur Chana at Bikaner Australian Chana at Mumbai

Pulses Monthly Report April, 2021
Chana Future Market Analysis:
Technical Commentary:
Increasing price & OI hint market to trade firm in the medium term.
RSI is moving up in neutral region, hints caution to bears.
Prices closed above 9 and 18 days EMAs
Strategy: Buy on Dip
Supports & Resistances S1 S2 PCP R1 R2
Chana NCDEX Jun 5214 5110 5402 5650 5750
Monthly Trade Call* Call Entry T1 T2 SL
Chana NCDEX Jun Buy above 5350 5600 5750 5265
.*Don’t carry forward position for the next month

Pulses Monthly Report April, 2021
Field Pea (Matar/Dry Pea): Fundamental Analysis and Outlook:
Availability of imported stocks at ports are almost negligible and prices are ruling higher despite new
arrivals from domestic crop. In Kanpur market peas is ruling at Rs 5200 while green peas is hovering at Rs
7000-7400.As prices of pulses in domestic market is ruling higher than normal expectation, govt. may allow
1.5 lakh MT import quota for this financial year, starting from April-2021 soon.As of now no decision has
been made. As prices of other pulses is going up,pea too can recover after downward correction.
Despite stable demand for peas and daal, prices are expected to trade steady to slightly weak. Consumers
have shifted from pea daal to other cheaper options. So govt.’s move is very crucial from pea price point of
view. Following chart shows price movement in various markets:
For 2020-21, exports are forecast to rise to 3.8 million tonnes (Mt), with China and Bangladesh ranking as
Canada’s top three markets. Canadian dry pea exports to India are expected to fall sharply to marginal
levels. Through August to January of this crop year, Canadian dry pea exports total 2.1 Mt, 0.2 Mt higher
than the same period in 2019-20. Carry-out stocks are expected to rise, despite firm export demand and
increased domestic use. The average price is expected to be higher than 2019-20, with higher yellow and
feed pea prices offsetting lower green pea prices.
Price Dynamics:
Pea market is expected to trade steady to slightly firm in April due to:-
15002000250030003500400045005000550060006500700075008000850090009500
10000105001100011500120001250013000
03-A
pr-
1803
-Ma
y-1
803
-Ju
n-1
803
-Ju
l-1
803
-Au
g-1
803
-Sep
-18
03-O
ct-1
80
3-N
ov-
18
03-D
ec-1
803
-Ja
n-1
903
-Feb
-19
03-M
ar-
1903
-Ap
r-19
03-M
ay-
19
03-J
un
-19
03-J
ul-
19
03-A
ug
-19
03-S
ep-1
903
-Oct
-19
03
-No
v-1
903
-Dec
-19
03-J
an
-20
03-F
eb-2
003
-Ma
r-20
03-A
pr-
2003
-Ma
y-2
003
-Ju
n-2
003
-Ju
l-2
003
-Au
g-2
003
-Sep
-20
03-O
ct-2
00
3-N
ov-
20
03-D
ec-2
003
-Ja
n-2
103
-Feb
-21
03-M
ar-
2103
-Ap
r-21
De
si a
nd
Ye
llow
Pe
as P
rice
s (i
n R
s./Q
tl.)
Pea Price Movement
Desi Pea at Kanpur Canadian Yellow Peas Canadian Green Peas

Pulses Monthly Report April, 2021
Poor arrival from domestic crop
Increasing price of other pulses
Import restriction and
Firm international market
Spread With Chana:
Gap has decreased from Rs 1070 to Rs 25 in March over February-2021, based on monthly average of the
price. Spread is expected to remain in positive zone in April on relative movement in Chana prices.
Market Outlook For April: Steady to slightly firm movement is expected in April-2021.
Masoor (Lentils):
Lentils prices are ruling higher than our normal expectation despite new arrivals in MP, UP and Bihar.
Production size is below expectation. Agriwatch has revised its production estimates down from 13.49 to
11.73 lakh MT. Demand is expected to cool down and arrival too may increase in May. So, any jump in
lentils market is unlikely. However, price would not decrease to Rs5100 in any case. So Nafed, state
procurement agency may start buying masoor at market price to build up its stock.
Lentils production in Canada is expected to decrease from 28.68 in 2020-21 to 2.7 MMT in 2021-22 due
to slightly lower area & yield. Export too are expected to decrease by 2 lakh MT to 25 lakh MT in 2021-22.
Total supply is expected to decrease from 31.77 to 29.25 lakh MT due to likely lower production in 2021-22.
-2200
-1950
-1700
-1450
-1200
-950
-700
-450
-200
50
300
550
800
3-A
pr-
18
3-M
ay-1
83
-Ju
n-1
83
-Ju
l-1
83
-Au
g-1
83
-Se
p-1
83
-Oct
-18
3-N
ov-
18
3-D
ec-1
83
-Jan
-19
3-F
eb
-19
3-M
ar-1
93
-Ap
r-1
93
-May
-19
3-J
un
-19
3-J
ul-
19
3-A
ug-
19
3-S
ep
-19
3-O
ct-1
93
-No
v-1
93
-Dec
-19
3-J
an-2
03
-Fe
b-2
03
-Mar
-20
3-A
pr-
20
3-M
ay-2
03
-Ju
n-2
03
-Ju
l-2
03
-Au
g-2
03
-Se
p-2
03
-Oct
-20
3-N
ov-
20
3-D
ec-2
03
-Jan
-21
3-F
eb
-21
3-M
ar-2
13
-Ap
r-2
1
De
si C
han
a an
d Y
ello
w P
eas
Pri
ces
(in
Rs.
/Qtl
.)
Spread in Kanpur Market
Spread in Kanpur market

Pulses Monthly Report April, 2021
Price Trend In Cash Market:
Price Dynamics:
In March-2021, average price in key market Kanpur was up by 5.19 % from Rs 5471 to Rs 5557 per qtl. MoM
basis. Prices are likely to trade sideways in April-2021.
2700290031003300350037003900410043004500470049005100530055005700590061006300
03
-04
-20
18
03
-05
-20
18
03
-06
-20
18
03
-07
-20
18
03
-08
-20
18
03
-09
-20
18
03
-10
-20
18
03
-11
-20
18
03
-12
-20
18
03
-01
-20
19
03
-02
-20
19
03
-03
-20
19
03
-04
-20
19
03
-05
-20
19
03
-06
-20
19
03
-07
-20
19
03
-08
-20
19
03
-09
-20
19
03
-10
-20
19
03
-11
-20
19
03
-12
-20
19
03
-01
-20
20
03
-02
-20
20
03
-03
-20
20
03
-04
-20
20
03
-05
-20
20
03
-06
-20
20
03
-07
-20
20
03
-08
-20
20
03
-09
-20
20
03
-10
-20
20
03
-11
-20
20
03
-12
-20
20
03
-01
-20
21
03
-02
-20
21
03
-03
-20
21
03
-04
-20
21
Masoor Kanpur
2500
3000
3500
4000
4500
5000
5500
6000
6500
7000
03
-Ap
r-1
60
3-M
ay-1
60
3-J
un
-16
03
-Ju
l-1
60
3-A
ug-
16
03
-Se
p-1
60
3-O
ct-1
60
3-N
ov-
16
03
-De
c-1
60
3-J
an-1
70
3-F
eb
-17
03
-Mar
-17
03
-Ap
r-1
70
3-M
ay-1
70
3-J
un
-17
03
-Ju
l-1
70
3-A
ug-
17
03
-Se
p-1
70
3-O
ct-1
70
3-N
ov-
17
03
-De
c-1
70
3-J
an-1
80
3-F
eb
-18
03
-Mar
-18
03
-Ap
r-1
80
3-M
ay-1
80
3-J
un
-18
03
-Ju
l-1
80
3-A
ug-
18
03
-Se
p-1
80
3-O
ct-1
80
3-N
ov-
18
03
-De
c-1
80
3-J
an-1
90
3-F
eb
-19
03
-Mar
-19
03
-Ap
r-1
90
3-M
ay-1
90
3-J
un
-19
03
-Ju
l-1
90
3-A
ug-
19
03
-Se
p-1
90
3-O
ct-1
90
3-N
ov-
19
03
-De
c-1
90
3-J
an-2
00
3-F
eb
-20
03
-Mar
-20
03
-Ap
r-2
00
3-M
ay-2
00
3-J
un
-20
03
-Ju
l-2
00
3-A
ug-
20
03
-Se
p-2
00
3-O
ct-2
00
3-N
ov-
20
03
-De
c-2
00
3-J
an-2
10
3-F
eb
-21
03
-Mar
-21
03
-Ap
r-2
1
Pri
ce(R
s./Q
tl.)
Canadian Masur at Mumbai

Pulses Monthly Report April, 2021
Sideways movement is expected in April due to:
Arrival is yet to increase
Higher quotes for imported stock at ports
Nafed has low stock
Outlook for April: Sideways tone may prevail
Tur (Toor/Arhar/Red Gram/Pigeon Pea/Aware): Fundamental Analysis and Outlook: Tur cash market my move further up as pace of arrival is comparatively lower even in April while import is
not possible before June. Private trades are active and buying continues at increased price .Cash market is
ruling Rs 1000 higher than MSP of Rs6000.Even farmers are unwilling to sell at prevailing price as they
expect market to go up further. New crop is coming into markets of Karnataka and Maharashtra, Gujarat,
MP and expected soon from Uttar Pradesh. So any downward correction is unlikely immediately. Even
import from overseas market would not exceed above 4 lakh MT due to low availability. Nafed would have
to face difficulty to get bulk quantity at MSP this year. It may hardly procure 0.25 to 0.30 lakh MT this year.
In brief, overall outlook remains firm. Political unrest in Myanmar would continue to hamper cargo
movement from Myanmar.
Market Recap: Tur market continues to trade firm despite weak demand for daal at current price. Private trades have purchased around 15 to 20 % of crop this year while Nafed purchase is only 13,000 to 14,000 MT so far. Crop size is lower and experts have pegged it in the range of 34 to 37.00 lakh MT. Import flow is limited and cargo would remain disturbed from Myanmar due to political unrest there. Govt . has allocated 4 lakh MT quota for next financial year while 2.0 lakh MT import through G to G channel. However, lower availability in Myanmar and ongoing disturbance there, may restrict volume of import. Even in south Africaln countries import may be in limited volume due to lower crop size there too. So , uptrend may continue once demand for daal improves. Tur in Gulberga market traded at Rs 6900-7100 per qtl and may cross Rs 7500 soon. If yield loss is seen in U.P. crop too, prices may move further up. Crop from UP is expected in April. Nafed too has less than 1 lakh MT old stock.It shows tight supply side in the second quarter of this calendar year.

Pulses Monthly Report April, 2021
2500
3000
3500
4000
4500
5000
5500
6000
6500
7000
7500
8000
8500
90000
3-0
4-2
01
70
3-0
5-2
01
70
3-0
6-2
01
70
3-0
7-2
01
70
3-0
8-2
01
70
3-0
9-2
01
70
3-1
0-2
01
70
3-1
1-2
01
70
3-1
2-2
01
70
3-0
1-2
01
80
3-0
2-2
01
80
3-0
3-2
01
80
3-0
4-2
01
80
3-0
5-2
01
80
3-0
6-2
01
80
3-0
7-2
01
80
3-0
8-2
01
80
3-0
9-2
01
80
3-1
0-2
01
80
3-1
1-2
01
80
3-1
2-2
01
80
3-0
1-2
01
90
3-0
2-2
01
90
3-0
3-2
01
90
3-0
4-2
01
90
3-0
5-2
01
90
3-0
6-2
01
90
3-0
7-2
01
90
3-0
8-2
01
90
3-0
9-2
01
90
3-1
0-2
01
90
3-1
1-2
01
90
3-1
2-2
01
90
3-0
1-2
02
00
3-0
2-2
02
00
3-0
3-2
02
00
3-0
4-2
02
00
3-0
5-2
02
00
3-0
6-2
02
00
3-0
7-2
02
00
3-0
8-2
02
00
3-0
9-2
02
00
3-1
0-2
02
00
3-1
1-2
02
00
3-1
2-2
02
00
3-0
1-2
02
10
3-0
2-2
02
10
3-0
3-2
02
10
3-0
4-2
02
1
Red Tur At Gulberga( Rs /Qtl.)
2500
3000
3500
4000
4500
5000
5500
6000
6500
7000
7500
8000
8500
03
-04
-20
17
03
-06
-20
17
03
-08
-20
17
03
-10
-20
17
03
-12
-20
17
03
-02
-20
18
03
-04
-20
18
03
-06
-20
18
03
-08
-20
18
03
-10
-20
18
03
-12
-20
18
03
-02
-20
19
03
-04
-20
19
03
-06
-20
19
03
-08
-20
19
03
-10
-20
19
03
-12
-20
19
03
-02
-20
20
03
-04
-20
20
03
-06
-20
20
03
-08
-20
20
03
-10
-20
20
03
-12
-20
20
03
-02
-20
21
03
-04
-20
21
Rs/
Qtl
Tur Lemon (Mumbai)
Pulses Monthly Report April, 2021
Price Dynamics:
In March-2021, average price in Gulberga market decreased by 0.03 % from 6781 to Rs 6767 per qtl. due
to weak offtake of daal from mills. However, with improved demand for daal prices are bound to go
up.Apart from it low availability in global market too has lent support.
. Tur price in April is likely to trade firm due to:
Lower crop size in Karnataka, Maharashtra
Slower release by farmers/stockists/mills buying
Lower availability in global market
Higher quotes in Myanmar($710 per Mt)
Seasonality Index-depicts steady to slightly firm tone.
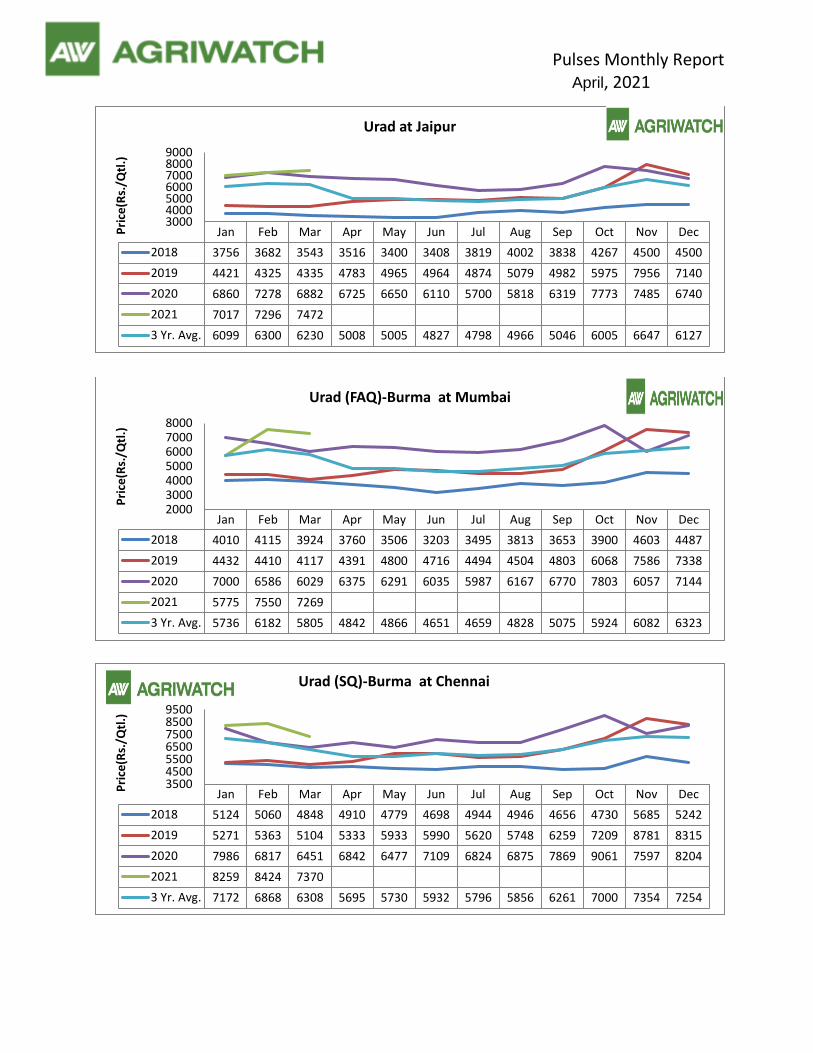
Market Outlook for April: Fundamental remains supportive for Tur cash market in the near to medium term. Urad (Black Matpe/Black Gram) Fundamental Analysis and Outlook: Market Recap: Short supply of urad in domestic market due to lower availability in domestic as well as in Myanmar market would not allow market to cool down until new kharif crop hits market in Aug-Sep-2021.Import flow too would be limited due to political unrest in Myanmar. Sensing the short supply govt has allocated 4 lakhMT import quota one month earlier for next financial year. Besides, South Indian Pulses exporters and importers association has requested DGFT to extend import time line for back log quota from 31st March to 30th April-2021.Import would not take place before June.New crop in Myanmar is almost ready buy disturbance may disturb import cargo from there. It would take two months time to issue licenses after plant and capacity verification of the applicant. Arrival from rabi crop has stared drying now. The crop size too is small and so it would be consumed locally in Andhra Pradesh and Tamil Nadu. From other states, crop would hit market in April in limited quantity. So , any major decline in urad market is unlikely at this point of time .Major urad crop comes in kharif season. In Indian market urad is being traded at Rs 7400-7500. It may move up to Rs7700-8000,if demand improves in local market.

Pulses Monthly Report April, 2021
Seasonality Index depicts steady to firm movement in April-2021.
3000
3500
4000
4500
5000
5500
6000
6500
7000
7500
8000
8500
9000
9500
03
-Ap
r-1
80
3-M
ay-
18
03
-Ju
n-1
80
3-J
ul-
18
03
-Au
g-1
8
03
-Se
p-1
80
3-O
ct-1
8
03
-No
v-1
80
3-D
ec-
18
03
-Ja
n-1
9
03
-Fe
b-1
90
3-M
ar-
19
03
-Ap
r-1
90
3-M
ay-
19
03
-Ju
n-1
90
3-J
ul-
19
03
-Au
g-1
9
03
-Se
p-1
90
3-O
ct-1
9
03
-No
v-1
90
3-D
ec-
19
03
-Ja
n-2
0
03
-Fe
b-2
00
3-M
ar-
20
03
-Ap
r-2
00
3-M
ay-
20
03
-Ju
n-2
00
3-J
ul-
20
03
-Au
g-2
0
03
-Se
p-2
00
3-O
ct-2
0
03
-No
v-2
00
3-D
ec-
20
03
-Ja
n-2
1
03
-Fe
b-2
10
3-M
ar-
21
03
-Ap
r-2
1
RS
PER
QTL
.URAD FAQ
Urad FAQ At Mumbai Urad FAQ At Chennai
3000
4000
5000
6000
7000
8000
9000
10000
3-A
pr-
17
3-M
ay-1
73
-Ju
n-1
73
-Ju
l-1
73
-Au
g-1
73
-Se
p-1
73
-Oct
-17
3-N
ov-
17
3-D
ec-1
73
-Jan
-18
3-F
eb
-18
3-M
ar-1
83
-Ap
r-1
83
-May
-18
3-J
un
-18
3-J
ul-
18
3-A
ug-
18
3-S
ep
-18
3-O
ct-1
83
-No
v-1
83
-Dec
-18
3-J
an-1
93
-Fe
b-1
93
-Mar
-19
3-A
pr-
19
3-M
ay-1
93
-Ju
n-1
93
-Ju
l-1
93
-Au
g-1
93
-Se
p-1
93
-Oct
-19
3-N
ov-
19
3-D
ec-1
93
-Jan
-20
3-F
eb
-20
3-M
ar-2
03
-Ap
r-2
03
-May
-20
3-J
un
-20
3-J
ul-
20
3-A
ug-
20
3-S
ep
-20
3-O
ct-2
03
-No
v-2
03
-Dec
-20
3-J
an-2
13
-Fe
b-2
13
-Mar
-21
3-A
pr-
21
Urad Polished at Vijaywada
Urad Polished at Vijaywada market Prices
Pulses Monthly Report April, 2021
Price Dynamics:
In March-2021, average prices in key markets including Mumbai/was down by 4.85 % percent to 7350. In
Chennai it was was ruling at 7500. Prices may stay steady to slightly firm in April due to:
Lower rabi crop size and delayed arrivals
Short supply in domestic market
Vacant pipeline and limited volume of import
Lower availability in global market&
Delayed import from Myanmar.
Market Outlook for April : Prices are likely to trade steady to slightly firm . Fundamental Analysis and Outlook For Moong: Market Recap: Moong cash market is likely to trade range bound as supply demand side is almost balanced. Pressure
might be felt when new arrivals from summer crop would start hitting market from Odisha in-April. Crop
condition of moong is good in AP, Tamil Nadu, Orisha. Import flow would remain restricted as there is no
parity at current level. Apart from it availability in Myanmar is weak this year. Prices in the market like
Gannavaram traded down at 7400-7500 during the month. In north and central India, prices have decreased
below MSP for low quality crop. Sideways movement is expected in March in Moong market. Arrival from
rabi crop has started decreasing .In Jaipur market it is being traded at Rs 7200-7300.
Price Dynamics:
Pressure from the summer crop may be felt only from mid April- 2021. Agriwatch expects 14.95 lakh MT
kharif production as per revised estimates after discounting the flood and higher rains generated loss. Total
production including Rabi is expected to move up by 2.39 lakh Mt to 21.45 lakh Mt this year. As demand is
weak , moong cash market may trade steady to slight weak.
Price Trend:

Pulses Monthly Report April, 2021
Market is expected to trade weak in April due to:
Arrival in markets is about to start from summer crop
Weak demand
Availability of old stock in central pool and
Good summer crop condition.
Market Outlook for April: Steady to slightly weak movement is expected.
3500
4000
4500
5000
5500
6000
6500
7000
7500
8000
8500
03
-Apr-
17
03
-May-1
703
-Jun
-17
03
-Jul-
17
03
-Aug
-17
03
-Sep
-17
03
-Oct-
17
03
-Nov-1
703
-Dec-1
703
-Jan
-18
03
-Fe
b-1
803
-Mar-
18
03
-Apr-
18
03
-May-1
803
-Jun
-18
03
-Jul-
18
03
-Aug
-18
03
-Sep
-18
03
-Oct-
18
03
-Nov-1
803
-Dec-1
803
-Jan
-19
03
-Fe
b-1
903
-Mar-
19
03
-Apr-
19
03
-May-1
903
-Jun
-19
03
-Jul-
19
03
-Aug
-19
03
-Sep
-19
03
-Oct-
19
03
-Nov-1
903
-Dec-1
903
-Jan
-20
03
-Fe
b-2
003
-Mar-
20
03
-Apr-
20
03
-May-2
003
-Jun
-20
03
-Jul-
20
03
-Aug
-20
03
-Sep
-20
03
-Oct-
20
03
-Nov-2
003
-Dec-2
003
-Jan
-21
03
-Fe
b-2
103
-Mar-
21
03
-Apr-
21
Rs/
Qu
inta
lMoong
At Jaipur Poly. (At Jaipur)

Pulses Monthly Report April, 2021
Agri Commodity Indices Feb -2021:
Pulses WPI: Pulses WPI increased by 2.6 points from 166.3 in Jan to 168.9 in Feb-2021
https://www.eaindustry.nic.in/ Source: Eaindustry.nic.in
-9.00
-7.00
-5.00
-3.00
-1.00
1.00
3.00
5.00
Dec-20 Jan-21 Feb-21
Annual Rate Of Inflation Based On Monthly WPI
All Commodities Primary Articles Food Articles PulsesGram Arhar Moong MasurUrad Gram Powder (Besan)
50
75
100
125
150
175
200
225
250
275
300
Feb
-17
Mar
-17
Ap
r-1
7M
ay-1
7Ju
n-1
7Ju
l-1
7A
ug-
17
Sep
-17
Oct
-17
No
v-1
7D
ec-
17
Jan
-18
Feb
-18
Mar
-18
Ap
r-1
8M
ay-1
8Ju
n-1
8Ju
l-1
8A
ug-
18
Sep
-18
Oct
-18
No
v-1
8D
ec-
18
Jan
-19
Feb
-19
Mar
-19
Ap
r-1
9M
ay-1
9Ju
n-1
9Ju
l-1
9A
ug-
19
Sep
-19
Oct
-19
No
v-1
9D
ec-
19
Jan
-20
Feb
-20
Mar
-20
Ap
r-2
0M
ay-2
0Ju
n-2
0Ju
l-2
0A
ug-
20
Sep
-20
Oct
-20
No
v-2
0D
ec-
20
Jan
-21
Feb
-21
Wholesale Price Index-Monthly
ALL COMMODITIES FOOD ARTICLESFOOD GRAINS(CEREALS+PULSES) PULSESGram (Chana) Arhar (Tur)Moong Masur
Pulses Monthly Report April, 2021
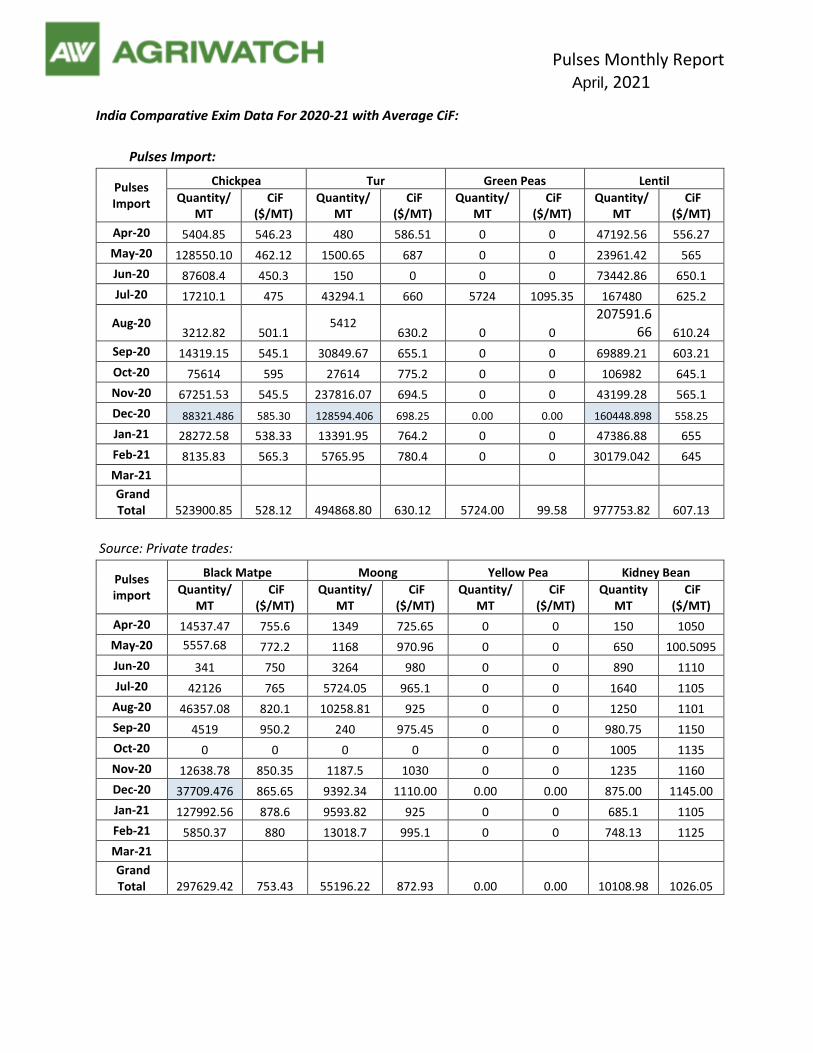
India Comparative Exim Data For 2020-21 with Average CiF:
Pulses Import:
Pulses Import
Chickpea Tur Green Peas Lentil
Quantity/MT
CiF ($/MT)
Quantity/MT
CiF ($/MT)
Quantity/MT
CiF ($/MT)
Quantity/MT
CiF ($/MT)
Apr-20 5404.85 546.23 480 586.51 0 0 47192.56 556.27
May-20 128550.10 462.12 1500.65 687 0 0 23961.42 565
Jun-20 87608.4 450.3 150 0 0 0 73442.86 650.1
Jul-20 17210.1 475 43294.1 660 5724 1095.35 167480 625.2
Aug-20 3212.82 501.1
5412 630.2 0 0
207591.666 610.24
Sep-20 14319.15 545.1 30849.67 655.1 0 0 69889.21 603.21
Oct-20 75614 595 27614 775.2 0 0 106982 645.1
Nov-20 67251.53 545.5 237816.07 694.5 0 0 43199.28 565.1
Dec-20 88321.486 585.30 128594.406 698.25 0.00 0.00 160448.898 558.25
Jan-21 28272.58 538.33 13391.95 764.2 0 0 47386.88 655
Feb-21 8135.83 565.3 5765.95 780.4 0 0 30179.042 645
Mar-21
Grand Total 523900.85 528.12 494868.80 630.12 5724.00 99.58 977753.82 607.13
Source: Private trades:
Pulses import
Black Matpe Moong Yellow Pea Kidney Bean
Quantity/MT
CiF ($/MT)
Quantity/MT
CiF ($/MT)
Quantity/MT
CiF ($/MT)
QuantityMT
CiF ($/MT)
Apr-20 14537.47 755.6 1349 725.65 0 0 150 1050
May-20 5557.68 772.2 1168 970.96 0 0 650 100.5095
Jun-20 341 750 3264 980 0 0 890 1110
Jul-20 42126 765 5724.05 965.1 0 0 1640 1105
Aug-20 46357.08 820.1 10258.81 925 0 0 1250 1101
Sep-20 4519 950.2 240 975.45 0 0 980.75 1150
Oct-20 0 0 0 0 0 0 1005 1135
Nov-20 12638.78 850.35 1187.5 1030 0 0 1235 1160
Dec-20 37709.476 865.65 9392.34 1110.00 0.00 0.00 875.00 1145.00
Jan-21 127992.56 878.6 9593.82 925 0 0 685.1 1105
Feb-21 5850.37 880 13018.7 995.1 0 0 748.13 1125
Mar-21
Grand Total 297629.42 753.43 55196.22 872.93 0.00 0.00 10108.98 1026.05

Pulses Monthly Report April, 2021
Price Trend In Various Markets:
Jan Feb Mar Apr May Jun Jul Aug Sep Oct Nov Dec
2018 4122 4113 3826 3747 3713 3658 4163 4304 4181 4248 4501 4495
2019 4319 4240 4189 4340 4519 4422 4331 4285 4218 4477 4500 4459
2020 4409 4115 4175 4212 4144 4218 4155 4515 5156 5354 5151 5650
2021 4636 4709 5049
3 Yr. Avg. 4455 4355 4471 4100 4125 4099 4216 4368 4518 4693 4717 4868
3000350040004500500055006000
Pri
ce(R
s./Q
tl.)
Kantewala Chana(M.P.) At Delhi
Jan Feb Mar Apr May Jun Jul Aug Sep Oct Nov Dec
2018 3842 3908 3718 3637 3493 3370 3961 4138 3974 4105 4544 4527
2019 4254 4149 4044 4278 4480 4400 4256 4210 4224 4305 4350 4251
2020 4306 4759 4900 5350 5786 5706 5458 5398 5481 5399 5242 5066
2021 4737 5493 5762
3 Yr. Avg. 4432 4800 4902 4422 4586 4492 4558 4582 4560 4603 4712 4615
3000350040004500500055006000
Pri
ce(R
s./Q
tl.)
Australian Chana at Mumbai
Jan Feb Mar Apr May Jun Jul Aug Sep Oct Nov Dec
2018 4068 3948 3667 3680 3557 3534 4041 4225 3967 4156 4479 4430
2019 4239 4207 4156 4319 4474 4325 4268 4155 4080 4356 4438 4383
2020 4289 4050 4000 4180 4006 4145 4108 4450 5040 5279 5088 4614
2021 4440 4492 4939
3 Yr. Avg. 4323 4250 4365 4060 4012 4001 4139 4277 4362 4597 4668 4476
3300355038004050430045504800505053005550
Pri
ce(R
s./Q
tl.)
Chana at Bikaner

Pulses Monthly Report April, 2021
Jan Feb Mar Apr May Jun Jul Aug Sep Oct Nov Dec
2018 2946 2924 2995 3325 3626 3627 4302 4466 4381 4870 4989 4841
2019 4948 4554 4127 4658 4960 5126 5194 5604 5493 5284 4909 5251
2020 5761 5557 4490 4767 4742 4810 5243 5968 6494 6359 6837 6649
2021 6398 6183 5257
3 Yr. Avg. 5702 5431 4625 4250 4443 4521 4913 5346 5456 5504 5578 5580
2500300035004000450050005500600065007000
Pri
ce(R
s./Q
tl.)
Desi Peas at Kanpur
Jan Feb Mar Apr May Jun Jul Aug Sep Oct Nov Dec
2018 2736 2784 2930 3241 3364 3410 4080 4326 4222 4685 4711 4644
2019 4660 4903 4556 4707 4825 4750 4869 5186 5110 4908 4700 5162
2020 6000 5400 5250 5560 5695 6000 5991 6180 7172 7223 6456 6839
2021 7772 8400 7600
3 Yr. Avg. 6144 6234 5802 4503 4628 4720 4980 5231 5501 5605 5289 5548
20003000400050006000700080009000
Pri
ce(R
s./Q
tl.)
Canadian Yellow Peas in Mumbai
Jan Feb Mar Apr May Jun Jul Aug Sep Oct Nov Dec
2018 2843 2874 3026 3343 3450 3442 4201 4414 4443 4936 4844 4764
2019 4866 4939 4877 4946 5110 5099 5239 5448 5447 5190 5039 5504
2020 5863 5772 5580 5595 5687 5607 5741 6405 6740 7205 6585 7336
2021 7742 8500 6900
3 Yr. Avg. 6157 6403.675785.67 4628 4749 4716 5060 5422 5543 5777 5489 5868
2000300040005000600070008000
Pri
ce(R
s./Q
tl.)
Canadian Yellow Pea at Kolkatta

Pulses Monthly Report April, 2021
Jan Feb Mar Apr May Jun Jul Aug Sep Oct Nov Dec
2018 3572 3518 3479 3650 3526 3600 3992 3957 3892 3888 3991 4076
2019 4363 4196 4063 4253 4379 4397 4409 4381 4337 4441 4647 4822
2020 5165 4890 4687 4845 5311 5837 5759 5773 5943 5855 5694 5443
2021 5414 5472 5771
3 Yr. Avg. 4981 4853 4840 4249 4405 4611 4720 4704 4724 4728 4777 4780
250030003500400045005000550060006500
Pri
ce(R
s./Q
tl.)
Masoor (mill quality) at Kanpur
Jan Feb Mar Apr May Jun Jul Aug Sep Oct Nov Dec
2018 3790 3563 3513 3830 3818 3811 4020 3882 3866 3975 4050 4162
2019 4318 4215 4052 4113 4152 4159 4069 4060 4010 4160 4389 4642
2020 5051 4811 4735 5440 5586 5657 5398 5347 5406 5415 5150 4971
2021 5173 5397 5699
3 Yr. Avg. 4847 4808 4829 4461 4519 4542 4496 4430 4427 4517 4530 4592
3000350040004500500055006000
Pri
ce(R
s./Q
tl.)
Canadian Red Lentils at Mumbai
Jan Feb Mar Apr May Jun Jul Aug Sep Oct Nov Dec
2018 3654 3657 3688 3768 3679 3720 3974 3994 3935 3890 4042 4116
2019 4319 4211 4121 4286 4458 4471 4482 4413 4358 4495 4655 4857
2020 5165 4920 4767 5570 5582 5821 5782 5905 6033 5934 5696 5463
2021 5457 5587 5847
3 Yr. Avg. 4980 4906 4912 4541 4573 4671 4746 4771 4775 4773 4798 4812
2000250030003500400045005000550060006500
Pri
ce(R
s./Q
tl.)
Masur In Delhi at Kota Line

Pulses Monthly Report April, 2021
Jan Feb Mar Apr May Jun Jul Aug Sep Oct Nov Dec
2018 4422 4333 3955 3926 4050 3874 3932 3896 3853 3823 4446 4871
2019 5190 5350 5111 5285 5941 5792 5889 5885 5558 5521 5695 5383
2020 4955 5017 5525 5383 5335 5602 5944 6063 6703 7810 6484 6093
2021 5943 6747 6798
3 Yr. Avg. 5363 5705 5811 4865 5109 5089 5255 5281 5371 5718 5542 5449
3000400050006000700080009000
Pri
ce(R
s./Q
tl.)
Red Tur (FAQ) at Gulbarga
Jan Feb Mar Apr May Jun Jul Aug Sep Oct Nov Dec
2018 3967 4071 3937 3846 3809 3454 3511 3459 3346 3377 4103 4345
2019 4727 4916 4706 4970 5502 5390 5343 5217 4876 4903 5137 4906
2020 4945 4887 4902 5085 5058 5153 5411 5658 6142 7181 6057 5659
2021 5775 6461 6406
3 Yr. Avg. 5149 5421 5338 4634 4790 4666 4755 4778 4788 5154 5099 4970
3000350040004500500055006000650070007500
Pri
ce(R
s./Q
tl.)
Tur- Lemon (Burma) at Mumbai
Jan Feb Mar Apr May Jun Jul Aug Sep Oct Nov Dec
2018 4345 4498 4306 4179 4176 3971 3986 3946 3879 3858 4236 4771
2019 5237 5379 5265 5575 5994 5953 5852 5976 5841 5695 5710 5417
2020 5131 4949 5056 5290 5391 5567 5671 5908 6453 7885 6460 5896
2021 5950 6698 6902
3 Yr. Avg. 5439 5675 5741 5015 5187 5164 5170 5277 5391 5813 5469 5361
3500
4500
5500
6500
7500
8500
Pri
ce(R
s./Q
tl.)
Tur at Indore

Pulses Monthly Report April, 2021
Jan Feb Mar April May Jun Jul Aug Sep Oct Nov Dec
2018 4364 4343 4099 3891 3945 3612 3743 3705 4032 3711 4516 4590
2019 5238 5279 5155 5414 5855 5671 5767 5675 5515 5473 5685 5323
2020 5234 5149 5121 5317 5222 5482 5778 5886 6512 7762 6306 5954
2021 6046 6853 6782
3 Yr. Avg. 5506 5760 5686 4874 5007 4922 5096 5089 5353 5649 5502 5289
2800
3800
4800
5800
6800
7800
Pri
ce(R
s./Q
tl.)
Tur (Red) at Amaravati
Jan Feb Mar Apr May Jun Jul Aug Sep Oct Nov Dec
2018 3916 4073 3893 3807 3811 3454 3504 3422 3270 3290 3997 4303
2019 4664 4839 4599 4903 5521 5387 5245 5226 4867 4881 5157 4856
2020 4853 4787 4740 4925 5200 5094 5102 5993 6061 6501 5857 5592
2021 5772 6365 6422
3 Yr. Avg. 5096 5330 5254 4545 4844 4645 4617 4880 4733 4891 5004 4917
2500300035004000450050005500600065007000
Pri
ce(R
s./Q
tl.)
Tur Lemon at Vijaywada
Jan Feb Mar Apr May Jun Jul Aug Sep Oct Nov Dec
2018 3975 4000 4050 4000 4000 4000 4000 4115 4350 4296 5194 4771
2019 4500 4500 4350 4521 4833 4809 5046 5105 5364 6495 8029 7852
2020 7161 6523 6356 6750 6919 6836 6615 6458 6942 7800 7580 7165
2021 7150 7804 7967
3 Yr. Avg. 6270 6276 6224 5090 5251 5215 5220 5226 5552 6197 6934 6596
3000
4000
5000
6000
7000
8000
Pri
ce(R
s./Q
tl.)
Urad at Jalgaon
Pulses Monthly Report April, 2021
Jan Feb Mar Apr May Jun Jul Aug Sep Oct Nov Dec
2018 3756 3682 3543 3516 3400 3408 3819 4002 3838 4267 4500 4500
2019 4421 4325 4335 4783 4965 4964 4874 5079 4982 5975 7956 7140
2020 6860 7278 6882 6725 6650 6110 5700 5818 6319 7773 7485 6740
2021 7017 7296 7472
3 Yr. Avg. 6099 6300 6230 5008 5005 4827 4798 4966 5046 6005 6647 6127
3000400050006000700080009000
Pri
ce(R
s./Q
tl.)
Urad at Jaipur
Jan Feb Mar Apr May Jun Jul Aug Sep Oct Nov Dec
2018 4010 4115 3924 3760 3506 3203 3495 3813 3653 3900 4603 4487
2019 4432 4410 4117 4391 4800 4716 4494 4504 4803 6068 7586 7338
2020 7000 6586 6029 6375 6291 6035 5987 6167 6770 7803 6057 7144
2021 5775 7550 7269
3 Yr. Avg. 5736 6182 5805 4842 4866 4651 4659 4828 5075 5924 6082 6323
2000300040005000600070008000
Pri
ce(R
s./Q
tl.)
Urad (FAQ)-Burma at Mumbai
Jan Feb Mar Apr May Jun Jul Aug Sep Oct Nov Dec
2018 5124 5060 4848 4910 4779 4698 4944 4946 4656 4730 5685 5242
2019 5271 5363 5104 5333 5933 5990 5620 5748 6259 7209 8781 8315
2020 7986 6817 6451 6842 6477 7109 6824 6875 7869 9061 7597 8204
2021 8259 8424 7370
3 Yr. Avg. 7172 6868 6308 5695 5730 5932 5796 5856 6261 7000 7354 7254
3500450055006500750085009500
Pri
ce(R
s./Q
tl.)
Urad (SQ)-Burma at Chennai

Pulses Monthly Report April, 2021
Jan Feb Mar Apr May Jun Jul Aug Sep Oct Nov Dec
2018 4992 4855 4800 5050 5026 5000 5185 5028 5014 5313 5515 5608
2019 5688 5529 5750 6122 6348 6224 6263 6300 5923 6170 6814 6964
2020 7752 7735 7788 7958 8323 7207 6541 6847 6827 7809 7640 7314
2021 7425 7271 7212
3 Yr. Avg. 6955 6845 6917 6377 6566 6144 5996 6058 5921 6431 6656 6629
400050006000700080009000
Pri
ce(R
s./Q
tl.)
Moong at Jaipur
Jan Feb Mar Apr May Jun Jul Aug Sep Oct Nov Dec
2018 5500 5850 5775 6000 5900 5850 5805 5850 6000 6100 6250 6205
2019 6250 6175 6375 6680 6875 6650 6730 6513 6495 6590 6995 7010
2020 7780 7556 7650 8250 8450 7775 7690 7826 8420 8610 8546 8615
2021 8710 8421 8100
3 Yr. Avg. 7580 7384 7375 6977 7075 6758 6742 6730 6972 7100 7264 7277
450050005500600065007000750080008500
Pri
ce(R
s./Q
tl.)
Moong Pedishava at Mumbai
Jan Feb Mar Apr May Jun Jul Aug Sep Oct Nov Dec
2018 5145 5295 5167 5371 5388 5057 4981 4896 4881 5065 5146 5208
2019 5509 5305 5412 5700 5983 5795 5754 5995 5598 6345 6890 7146
2020 7892 7648 7750 7975 8000 6775 6519 6655 6950 7915 7425 7271
2021 7278 7778 7782
3 Yr. Avg. 6893 6910 6981 6349 6457 5876 5751 5849 5810 6442 6487 6542
35004000450050005500600065007000750080008500
Pri
ce(R
s./Q
tl.)
Moong Chamki at Indore

Pulses Monthly Report April, 2021
Indicative Pulses & Processed Pulses Prices (Domestic; Imported; Cnf) & Arrival
Pulses State Market Pulses Variety/Origin (Rs in
Qtl) 31-
Mar-21 27-
Feb-21 31-
Mar-20
Chana Delhi Delhi Chana (Australia) 5175 5050 4850
Chana Maharashtra Mumbai Chana (Australia) 6000 5700 Closed
Chana West Bengal Kolkatta Chana (Australia) 6100 5800 Closed
Chana Maharashtra Mumbai Chana (Australia) in $/t NA NA Closed
Chana Maharashtra Mumbai Chana (Tanzania) in $/t NA NA Closed
Chana Maharashtra Mumbai Kabuli Chana (Russia) in $/t 630 630 Closed
Chana Delhi Delhi Chana Kantewala/Katawala
(M.P. Origin) 5075 4950 4700
Chana Rajasthan Ramganj Chana (Both Desi and
Kantewala) 4650 4740 Closed
Chana Madhya Pradesh
Indore Chana kantewala/katawala 5050 5050 Closed
Chana Madhya Pradesh
Dewas Chana Kantewala/Katawala Closed Closed Closed
Chana Madhya Pradesh
Neemuch Chana Kantewala/Katawala Closed Closed Closed
Chana Madhya Pradesh
Rajgarh Chana Kantewala/Katawala NR Closed Closed
Chana Maharashtra Nanded Chana Kantewala/Katawala Closed 4900 Closed
Chana Maharashtra Barshi Chana Kantewala/Katawala Closed 4400 Closed
Chana Maharashtra Mumbai Chana (Ethiopia) NA NA Closed
Chana Delhi Delhi Chana Rajasthan 5100 4975 4800
Chana Maharashtra Mumbai Chana (Tanzania) 4700 4550 Closed
Chana Maharashtra Akola Chana Annagiri 5150 4900 Closed
Chana Maharashtra Latur Chana Annagiri Closed Closed Closed
Chana Maharashtra Nagpur Chana Annagiri Closed 4800 Closed
Chana Maharashtra Nanded Chana Annagiri Closed 5000 Closed
Chana Maharashtra Udgir Chana Annagiri Closed Closed Closed
Chana Karnataka Gulbarga Chana Annagiri 4825 4800 Closed
Chana Delhi Delhi Chana Besan 6514 6286 6071
Chana Maharashtra Akola Chana Chapa 5100 4875 Closed
Chana Maharashtra Nagpur Chana chapa Closed 4700 Closed
Chana Maharashtra Barshi Chana Chapa Closed 4700 Closed
Chana Madhya Pradesh
Gwalior Chana Desi Closed Closed Closed
Chana Madhya Pradesh
Harda Chana Desi Closed Closed Closed

Pulses Monthly Report April, 2021
Pulses State Market Pulses Variety/Origin (Rs in
Qtl) 31-
Mar-21 27-
Feb-21 31-
Mar-20
Chana Madhya Pradesh
Ganjbasoda
Chana Desi Closed Closed Closed
Chana Madhya Pradesh
Katni Chana Desi Closed Closed Closed
Chana Madhya Pradesh
Pipariya Chana Desi Closed Closed Closed
Chana Madhya Pradesh
Morena Chana Desi Closed Closed Closed
Chana Madhya Pradesh
Bina Chana Desi Closed NA Closed
Chana Madhya Pradesh
Dabra Chana Desi 5000 Closed Closed
Chana Madhya Pradesh
Ashok Nagar
Chana Desi Closed Closed Closed
Chana Madhya Pradesh
Bhind Chana Desi Closed 4600 Closed
Chana Maharashtra Ahmednag
ar Chana Desi 4700 4600 Closed
Chana Maharashtra Barshi Chana Desi Closed 4400 Closed
Chana Maharashtra Nagpur Chana Desi Closed 4600 Closed
Chana Maharashtra Hinganghat Chana Desi 4750 4700 Closed
Chana Rajasthan Jaipur Chana Desi 5000 4900 Closed
Chana Rajasthan Srigangana
gar Chana Desi NA NA Closed
Chana Rajasthan Kekri Chana Desi 4700 4450 Closed
Chana Rajasthan Bundi Chana Desi 5050 4300 Closed
Chana Rajasthan Ajmer Chana Desi 4750 4400 Closed
Chana Rajasthan Alwar Chana Desi NA NA Closed
Chana Andhra Pradesh
Vijaywada Chana Desi Closed 4800 Closed
Chana Andhra Pradesh
Banaganapalli
Chana Desi 4700 NA NA
Chana Uttar Pradesh Jhansi Chana Desi NA NA Closed
Chana Uttar Pradesh Kanpur Chana Desi 5175 5025 Closed
Chana Gujarat Dahod Chana Desi 4800 4850 Closed
Chana Rajasthan Bikaner Chana Closed closed Closed
Chana Maharashtra Jalgoan Chana 4750 4800 Closed
Chana Maharashtra Solapur Chana 5000 4900 Closed
Chana Maharashtra Amaravati Chana Closed Closed Closed
Chana Chhattisgarh Raipur Chana 5200 4900 Closed
Chana Karnataka Sedam Chana NA NA Closed

Pulses Monthly Report April, 2021
Pulses State Market Pulses Variety/Origin (Rs in
Qtl) 31-
Mar-21 27-
Feb-21 31-
Mar-20
Chana Maharashtra Jalna Chana Gauran Closed 4700 Closed
Chana Maharashtra Latur Chana Gauran Closed Closed Closed
Chana Madhya Pradesh
Ujjain Chana Dollar Closed Closed Closed
Chana Maharashtra Jalna Chana Pila Closed 4850 Closed
Chana Maharashtra Latur Chana G 12/Vijay Closed Closed Closed
Chana Maharashtra Udgir Chana Vijay Closed Closed Closed
Chana Madhya Pradesh
Indore Kabuli Chana 58-60 Export
Quality 8400 6800 Closed
Chana Madhya Pradesh
Indore Kabuli Chana 44-46 Mill
Quality 9000 7200 Closed
Chana Maharashtra Mumbai Kabuli Chana (Russia) 5200 4750 Closed
Chana Madhya Pradesh
Indore Raw Kabuli Chana Quality NA NA Closed
Chana Madhya Pradesh
Dabra Kabuli Chana NA Closed Closed
Chana Maharashtra Latur Chana Mixed (Mill) Closed Closed Closed
Chana Maharashtra Akola Chana Mixed 5050 4825 Closed
Chana Maharashtra Ahmednag
ar Chana Vishal 4900 4800 Closed
Chana Karnataka Gulbarga Chana Dall (Branded) 6050 6000 Closed
Chana Madhya Pradesh
Indore Chana Dall (Average Quality) 6300 6300 Closed
Chana Delhi Delhi Chana Dall 5900 5650 5900
Chana Maharashtra Jalgoan Chana Dall 6100 5900 Closed
Chana Maharashtra Latur Chana Dall Closed Closed Closed
Chana Madhya Pradesh
Gwalior Chana Dall Closed Closed Closed
Chana Rajasthan Bikaner Chana Dall Closed Closed Closed
Chana Maharashtra Nagpur Chana Dall Closed NA Closed
Chana Madhya Pradesh
Dabra Chana Dall NA Closed Closed
Chana Karnataka Gulbarga Chana Dall 5900 5900 Closed
Chana Madhya Pradesh
Pipariya Chana Dall Closed Closed Closed
Chana Uttar Pradesh Kanpur Chana Dall 6000 5600 Closed
Chana Jharkhand Jamshedpu
r Chana Dall NR NR Closed
Chana Maharashtra Akola Chana Dall 6200 6000 Closed
Chana Maharashtra Barshi Chana Dall Closed 6700 Closed
Pulses Monthly Report April, 2021
Pulses State Market Pulses Variety/Origin (Rs in
Qtl) 31-
Mar-21 27-
Feb-21 31-
Mar-20
Chana Madhya Pradesh
Bhind Chana Dall Closed 5600 Closed
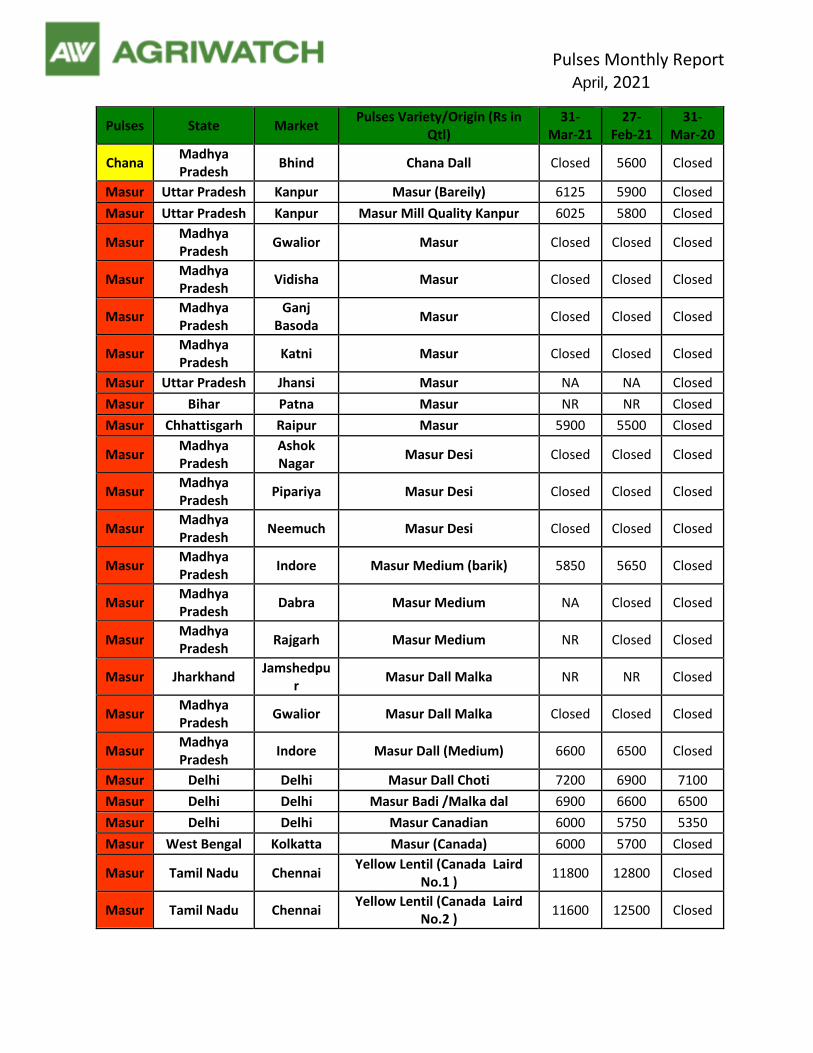
Masur Uttar Pradesh Kanpur Masur (Bareily) 6125 5900 Closed
Masur Uttar Pradesh Kanpur Masur Mill Quality Kanpur 6025 5800 Closed
Masur Madhya Pradesh
Gwalior Masur Closed Closed Closed
Masur Madhya Pradesh
Vidisha Masur Closed Closed Closed
Masur Madhya Pradesh
Ganj Basoda
Masur Closed Closed Closed
Masur Madhya Pradesh
Katni Masur Closed Closed Closed
Masur Uttar Pradesh Jhansi Masur NA NA Closed
Masur Bihar Patna Masur NR NR Closed
Masur Chhattisgarh Raipur Masur 5900 5500 Closed
Masur Madhya Pradesh
Ashok Nagar
Masur Desi Closed Closed Closed
Masur Madhya Pradesh
Pipariya Masur Desi Closed Closed Closed
Masur Madhya Pradesh
Neemuch Masur Desi Closed Closed Closed
Masur Madhya Pradesh
Indore Masur Medium (barik) 5850 5650 Closed
Masur Madhya Pradesh
Dabra Masur Medium NA Closed Closed
Masur Madhya Pradesh
Rajgarh Masur Medium NR Closed Closed
Masur Jharkhand Jamshedpu
r Masur Dall Malka NR NR Closed
Masur Madhya Pradesh
Gwalior Masur Dall Malka Closed Closed Closed
Masur Madhya Pradesh
Indore Masur Dall (Medium) 6600 6500 Closed
Masur Delhi Delhi Masur Dall Choti 7200 6900 7100
Masur Delhi Delhi Masur Badi /Malka dal 6900 6600 6500
Masur Delhi Delhi Masur Canadian 6000 5750 5350
Masur West Bengal Kolkatta Masur (Canada) 6000 5700 Closed
Masur Tamil Nadu Chennai Yellow Lentil (Canada Laird
No.1 ) 11800 12800 Closed
Masur Tamil Nadu Chennai Yellow Lentil (Canada Laird
No.2 ) 11600 12500 Closed

Pulses Monthly Report April, 2021
Pulses State Market Pulses Variety/Origin (Rs in
Qtl) 31-
Mar-21 27-
Feb-21 31-
Mar-20
Masur Tamil Nadu Chennai Yellow Lentil (Canada Laird
No.3 ) 11400 12400 Closed
Masur Madhya Pradesh
Indore Masur Mota Masra 5900 5700 Closed
Masur Madhya Pradesh
Indore Masur Chota (FAQ) 5875 5675 Closed
Masur Maharashtra Mumbai Masur (Canada)(Container) 5900 5600 Closed
Masur Maharashtra Mumbai Masur Vessel 5500 5525 Closed
Masur Delhi Delhi Masur (Kotaline) 6125 5850 5400
Masur Delhi Delhi Masur (Sikri Line) 6500 6150 6200
Masur Delhi Delhi Masur Chanti-Export Quality 7800 7800 7700
Masur Madhya Pradesh
Bina Masur Kali Closed 5500 Closed
Moong
Maharashtra Mumbai Moong Annaseva (Burma) in
$/t 1050 1100 Closed
Moong
Maharashtra Mumbai Moong
Pedishewa/Pedisheva/(Burma) in $/t
1080 1200 Closed
Moong
Maharashtra Mumbai Moong Pokako/Pakaku
(Burma) in $/t 1200 1200 Closed
Moong
Maharashtra Mumbai Moong (Tanzania) NA NA Closed
Moong
Delhi Delhi Moong (Kanpur-U.P.) NA NA Closed
Moong
Delhi Delhi Moong Desi (Merta City-Raj) 7200 7200 Closed
Moong
Delhi Delhi Moong (Mertacity Polish-Raj) NA 9000 Closed
Moong
Karnataka Gulbarga Moong FAQ NA NA Closed
Moong
Uttar Pradesh Kanpur Moong (UP line) 7500 7400 Closed
Moong
Maharashtra Akola Moong 7800 7500 Closed
Moong
Maharashtra Barshi Moong Closed 7500 Closed
Moong
Maharashtra Ahmednag
ar Moong 7500 8200 Closed
Moong
Madhya Pradesh
Harda Moong Closed Closed Closed
Moong
Rajasthan Kekri Moong 6800 6700 Closed

Pulses Monthly Report April, 2021
Pulses State Market Pulses Variety/Origin (Rs in
Qtl) 31-
Mar-21 27-
Feb-21 31-
Mar-20
Moong
Maharashtra Latur Moong Closed Closed Closed
Moong
Madhya Pradesh
Dabra Moong NA Closed Closed
Moong
Rajasthan Srigangana
gar Moong 6700 NA Closed
Moong
Andhra Pradesh
Vijaywada Moong Closed 7200 Closed
Moong
Rajasthan Ajmer Moong Desi 6900 7000 Closed
Moong
Uttar Pradesh Hathras Moong Desi NA NA Closed
Moong
Madhya Pradesh
Pipariya Moong Desi Closed Closed Closed
Moong
Maharashtra Udgir Moong Desi Closed Closed Closed
Moong
Gujarat Dahod Moong (Chamki) 7000 7000 Closed
Moong
Karnataka Gulbarga Moong (Chamki) 7400 7400 Closed
Moong
Madhya Pradesh
Indore Moong (Chamki) 7500 7800 Closed
Moong
Maharashtra Jalgoan Moong (Chamki) 8000 7800 Closed
Moong
Maharashtra Jalna Moong (Chamki) Closed 6500 Closed
Moong
Rajasthan Jaipur Moong (Chamki) 7200 7300 Closed
Moong
Rajasthan Merta Moong Chilka Closed 7300 Closed
Moong
Rajasthan Merta Moong Mogar Closed 7000 Closed
Moong
Rajasthan Merta Moong Polish Closed 7300 Closed
Moong
Karnataka Yadgir Moong Polish NA NA Closed
Moong
Karnataka Gulbarga Moong Dall Mogar (Colourful
Branded) 9200 9400 Closed
Moong
Rajasthan Bikaner Moong Dall Split (Average) Closed Closed Closed
Moong
Delhi Delhi Moong (Chilka Dal-Raj) 9000 8800 Closed

Pulses Monthly Report April, 2021
Pulses State Market Pulses Variety/Origin (Rs in
Qtl) 31-
Mar-21 27-
Feb-21 31-
Mar-20
Moong
Delhi Delhi Moong Mogar Dall 9100 8800 Closed
Moong
Maharashtra Akola Moong Dall Mogar (bold) 10000 9700 Closed
Moong
Madhya Pradesh
Indore Moong Dall Mogar 9800 9800 Closed
Moong
Jharkhand Jamshedpu
r Moong Dall Mogar NR NR Closed
Moong
Jharkhand Jamshedpu
r Moong Dal Mogar (Sortex) NR NR Closed
Moong
Maharashtra Mumbai Moong Kenya NA NA Closed
Moong
Maharashtra Mumbai Moong Pokako/Pakkaku NA NA Closed
Moong
Maharashtra Jalna Moong Gauran Closed 6000 Closed
Moong
Karnataka Sedam Moong Green NA NA Closed
Moong
West Bengal Kolkatta Moong Pedishewa/Pedisheva NA NA Closed
Moth Rajasthan Jaipur Moth 6900 6900 Closed
Moth Rajasthan Nokha Moth 7000 7000 Closed
Moth Rajasthan Bhilwara Moth NA NA Closed
Pea Maharashtra Mumbai Peas White/Yellow (America) NA NA Closed
Pea Maharashtra Mumbai Peas Green (America) NA NA Closed
Pea Uttar Pradesh Kanpur Peas White (Canada) 5050 5800 Closed
Pea Maharashtra Mumbai Peas White/Yellow (Canada) NA NA Closed
Pea West Bengal Kolkatta Peas Yellow/White (Canada) NA NA Closed
Pea Maharashtra Mumbai Peas Green (Canada) NA NA Closed
Pea West Bengal Kolkatta Peas Green (Canada) NA NA Closed
Pea West Bengal Kolkatta Peas Yellow/White (Russia) NA NA Closed
Pea Maharashtra Mumbai Peas Yellow (Russia) NA NA Closed
Pea Uttar Pradesh Kanpur Peas Desi 5250 6000 Closed
Pea Madhya Pradesh
Gwalior Peas White Closed Closed Closed
Pea Madhya Pradesh
Harpalpur Peas White 5000 5500 Closed
Pea Uttar Pradesh Jhansi Peas White NA NA Closed
Pea Madhya Pradesh
Dabra Peas White NA Closed Closed
Pea Delhi Delhi Peas Green 11200 11500 12000

Pulses Monthly Report April, 2021
Pulses State Market Pulses Variety/Origin (Rs in
Qtl) 31-
Mar-21 27-
Feb-21 31-
Mar-20
Pea Madhya Pradesh
Dabra Peas Green 4800 Closed Closed
Pea Delhi Delhi Peas Yellow 8600 9000 6500
Pea Jharkhand Jamshedpu
r Peas Dall NR NR Closed
Pea Madhya Pradesh
Gwalior Peas White Dall Closed Closed Closed
Tur Maharashtra Mumbai Tur Lemon (Burma) in $/t 710 750 Closed
Tur Tamil Nadu Chennai Tur Lemon (Burma) in $/t NA NA 0
Tur Uttar Pradesh Kanpur Tur (MP) 6625 6550 Closed
Tur Uttar Pradesh Kanpur Tur (UP Line) 6725 6650 Closed
Tur Maharashtra Nagpur Tur (Mah.) Closed 6800 Closed
Tur Madhya Pradesh
Indore Tur Mah. Origin 6900 6900 Closed
Tur Maharashtra Jalna Tur BDM Closed 6900 Closed
Tur Maharashtra Hinganghat Tur 7000 7300 Closed
Tur Maharashtra Solapur Tur 7010 7025 Closed
Tur Madhya Pradesh
Katni Tur Closed Closed Closed
Tur Madhya Pradesh
Bhind Tur Closed 4800 Closed
Tur Madhya Pradesh
Dabra Tur NA Closed Closed
Tur Chhattisgarh Raipur Tur 7300 7200 Closed
Tur Telangana Warangal Tur Desi NA NA NA
Tur Andhra Pradesh
Dhone Tur Desi NA NA NA
Tur Madhya Pradesh
Morena Tur Desi Closed Closed Closed
Tur Madhya Pradesh
Pipariya Tur Desi Closed Closed Closed
Tur Karnataka Gulbarga Tur Red FAQ 6908 6850 Closed
Tur Uttar Pradesh Hathras Tur Red Desi NA NA Closed
Tur Maharashtra Jalna Tur Red (Variety-Maruti) Closed 6700 Closed
Tur Karnataka Sedam Tur Red 6600 NA Closed
Tur Karnataka Yadgir Tur Red 6915 6900 Closed
Tur Maharashtra Latur Tur Red Closed Closed Closed
Tur Maharashtra Udgir Tur Red Closed Closed Closed
Tur Maharashtra Akola Tur Red 7125 7100 Closed
Tur Maharashtra Amaravati Tur Red Closed Closed Closed

Pulses Monthly Report April, 2021
Pulses State Market Pulses Variety/Origin (Rs in
Qtl) 31-
Mar-21 27-
Feb-21 31-
Mar-20
Tur Maharashtra Ahmednag
ar Tur Red 6600 6500 Closed
Tur Maharashtra Barshi Tur Red Closed 6700 Closed
Tur Gujarat Dahod Tur Red 5800 5900 Closed
Tur Karnataka Yadgir Tur White 7060 7200 Closed
Tur Gujarat Dahod Tur White 6000 6200 Closed
Tur Maharashtra Ahmednag
ar Tur White 6700 6600 Closed
Tur Maharashtra Barshi Tur White Closed 6900 Closed
Tur Maharashtra Jalgoan Tur White Desi 6350 6450 Closed
Tur Maharashtra Ahmednag
ar Tur Black 6500 6400 Closed
Tur Maharashtra Jalna Tur Black Closed 6000 Closed
Tur Maharashtra Barshi Tur Black Closed 6200 Closed
Tur Maharashtra Latur Tur White Closed Closed Closed
Tur Maharashtra Jalna Tur White Closed 6750 Closed
Tur Andhra Pradesh
Vijaywada Tur Lemon Closed 6400 Closed
Tur Tamil Nadu Chennai Tur Lemon 6400 6600 Closed
Tur West Bengal Kolkatta Tur Lemon (Burma) NA NA Closed
Tur Delhi Delhi Tur Lemon (Burma) 6750 6850 5650
Tur Maharashtra Mumbai Tur Lemon (Burma) 6500 6525 Closed
Tur Jharkhand Jamshedpu
r Tur Dall NR NR Closed
Tur Maharashtra Jalgoan Tur Dall 9600 9800 Closed
Tur Madhya Pradesh
Bhind Tur Dall Closed 10500 Closed
Tur Madhya Pradesh
Pipariya Tur Dall (Non-Sortex) Closed Closed Closed
Tur Maharashtra Akola Tur Dall Sava no. 9200 9200 Closed
Tur Maharashtra Barshi Tur Dall Sava no. Closed 8900 Closed
Tur Karnataka Gulbarga Tur Sava No. Dall 8700 8800 Closed
Tur Maharashtra Akola Tur Dall Phatka 10000 10000 Closed
Tur Maharashtra Barshi Tur Dall Phatka Closed 10200 Closed
Tur Maharashtra Latur Tur Dall Phatka Closed Closed Closed
Tur Madhya Pradesh
Indore Tur Dall Phatka (General) 10000 10200 Closed
Tur Karnataka Gulbarga Tur Dall Pathka (Sortex) 10700 11200 Closed
Tur Karnataka Gulbarga Tur Dall Phatka (Non Sortex) 10200 10800 Closed
Tur Maharashtra Latur Tur Sava Dall Closed Closed Closed

Pulses Monthly Report April, 2021
Pulses State Market Pulses Variety/Origin (Rs in
Qtl) 31-
Mar-21 27-
Feb-21 31-
Mar-20
Urad Maharashtra Mumbai Urad FAQ (Burma) in $/t 750 770 Closed
Urad Tamil Nadu Chennai Urad FAQ (Burma) in $/t NA NA 0
Urad Tamil Nadu Chennai Urad SQ (Burma) in $/t NA NA 0
Urad Maharashtra Mumbai Urad SQ (Burma) in $/t 885 920 Closed
Urad West Bengal Kolkatta Urad FAQ (Burma) 7450 7600 Closed
Urad Maharashtra Mumbai Urad FAQ (Burma) 7350 7500 Closed
Urad Madhya Pradesh
Indore Urad (Mah. origin) 7500 8000 Closed
Urad Madhya Pradesh
Indore Urad 7500 8000 Closed
Urad Madhya Pradesh
Harpalpur Urad NA 6200 Closed
Urad Madhya Pradesh
Ganjbasoda
Urad Closed Closed Closed
Urad Rajasthan Jaipur Urad 7500 7500 Closed
Urad Rajasthan Kekri Urad 6800 6600 Closed
Urad Rajasthan Bundi Urad 6536 6634 Closed
Urad Maharashtra Ahmednag
ar Urad 7400 7700 Closed
Urad Maharashtra Barshi Urad Closed 7600 Closed
Urad Maharashtra Jalna Urad Closed 6800 Closed
Urad Maharashtra Latur Urad Closed Closed Closed
Urad Uttar Pradesh Jhansi Urad NA NA Closed
Urad Karnataka Sedam Urad NA NA Closed
Urad Gujarat Dahod Urad 6500 7000 Closed
Urad Madhya Pradesh
Ashok Nagar
Urad Desi Closed Closed Closed
Urad Madhya Pradesh
Neemuch Urad Desi Closed Closed Closed
Urad Madhya Pradesh
Pipariya Urad Desi Closed Closed Closed
Urad Rajasthan Ramganj Urad Desi 6550 6500 Closed
Urad Rajasthan Bhilwara Urad Desi NA NA Closed
Urad Maharashtra Jalgoan Urad Desi 7900 8000 Closed
Urad Maharashtra Udgir Urad Desi Closed Closed Closed
Urad Maharashtra Akola Urad Desi 7300 7500 Closed
Urad Uttar Pradesh Kanpur Urad Desi 7200 6800 Closed
Urad Telangana Adilabad Urad Desi NA NA NA
Urad Telangana Warangal Urad Desi NA NA NA
Urad Delhi Delhi Urad Desi 7200 7000 7000

Pulses Monthly Report April, 2021
Pulses State Market Pulses Variety/Origin (Rs in
Qtl) 31-
Mar-21 27-
Feb-21 31-
Mar-20
Urad Karnataka Gulbarga Urad FAQ 7350 7600 Closed
Urad Delhi Delhi Urad FAQ 7600 7500 7100
Urad Tamil Nadu Chennai Urad FAQ (Chota Dana) 7300 7350 Closed
Urad Delhi Delhi Urad SQ 8300 8500 7500
Urad Tamil Nadu Chennai Urad SQ 8150 8150 Closed
Urad Andhra Pradesh
Vijaywada Urad (Polish) Closed 7500 Closed
Urad Andhra Pradesh
Guntur Urad (Polish) 7600 7400 Closed
Urad Andhra Pradesh
Guntur Urad (Unpolish) 7300 7100 Closed
Urad Andhra Pradesh
Vijaywada Urad Sada(Bada) Closed 7300 Closed
Urad Andhra Pradesh
Guntur Urad Gota Branded 10800 10500 Closed
Urad Madhya Pradesh
Dabra Urad Kali NA Closed Closed
Urad Madhya Pradesh
Dabra Urad Lal NA Closed Closed
Urad Madhya Pradesh
Dabra Urad Rangoli NA Closed Closed
Urad Madhya Pradesh
Bina Urad (Black and Brown) Closed NA Closed
Urad Madhya Pradesh
Indore Urad Dall Mogar (General-
Average) 10000 10800 Closed
Urad Rajasthan Bikaner Urad Dall Split (Average) Closed Closed Closed
Urad Jharkhand Jamshedpu
r Urad Dall Mogar NR NR Closed
Urad Karnataka Gulbarga Urad Dall Mogar (Local
branded) 11500 11600 Closed
Urad Andhra Pradesh
Guntur Urad Dall (Branded) 10800 10500 Closed
Pulses State Market Pulses Arrivals 31-
Mar-21 27-
Feb-21 31-
Mar-20
Chana Delhi Delhi Chana Both(MP and Raj. Origin) in Motors/trucks
611 332 313
Chana Rajasthan Ramgan
j Chana (Both Desi and
kantewala) in Qtls. 33266 3800 5650
Chana Madhya Pradesh
Indore Chana Kantewala/Katawala in
Qtls. 27800 24200 26100
Chana Madhya Pradesh
Dewas Chana Kantewala/Katawala in
Qtls. 12600 18300 10750

Pulses Monthly Report April, 2021
Pulses State Market Pulses Arrivals 31-
Mar-21 27-
Feb-21 31-
Mar-20
Chana Madhya Pradesh
Neemuch
Chana Kantewala/Katawala in Qtls.
49600 7450 8350
Chana Madhya Pradesh
Rajgarh Chana Kantewala/Katawala in
Qtls. 0 0 0
Chana Madhya Pradesh
Dabra Kabuli Chana in Qtls. 0 0 0
Chana Madhya Pradesh
Bhind Chana Desi in Qtls. 690 720 445
Chana Madhya Pradesh
Bina Chana Desi in Qtls. 1800 2300 2250
Chana Madhya Pradesh
Dabra Chana Desi in Qtls. 6000 1400 0
Chana Madhya Pradesh
Dabra Chana Dall in Qtls. 0 0 0
Chana Madhya Pradesh
Ganjbasoda
Chana Desi in Qtls. 25500 11600 12900
Chana Madhya Pradesh
Gwalior Chana Desi in Qtls. 0 0 0
Chana Madhya Pradesh
Harda Chana Desi in Qtls. 48900 0 9000
Chana Madhya Pradesh
Morena Chana Desi in Qtls. 0 0 0
Chana Madhya Pradesh
Pipariya Chana Desi in Qtls. 55200 20400 12700
Chana Madhya Pradesh
AsokNagar
Chana Desi in Qtls. 20900 9400 3050
Chana Madhya Pradesh
Katni Chana Desi in Qtls. 27200 11000 11800
Chana Rajasthan Bundi Chana Desi in Qtls. 28495 1392 4019
Chana Rajasthan Ajmer Chana Desi in Qtls. 20200 1600 3590
Chana Rajasthan Alwar Chana Desi in Qtls. 505 435 447
Chana Rajasthan Kekri Chana Desi in Qtls. 21400 8000 6450
Chana Rajasthan Sriganga
nagar Chana Desi in Qtls. 0 0 355
Chana Maharashtra Amarav
ati Chana Desi in Qtls. 111500 45400 122500
Chana Maharashtra Barshi Chana Desi in Qtls. 120000 8700 19400
Chana Maharashtra Jalgoan Chana Desi in Qtls. 14300 9950 6200
Chana Uttar Pradesh Jhansi Chana Desi in Qtls. 6300 2100 3150
Chana Andhra Pradesh
Vijaywada
Chana Desi in Qtls. 12500 6600 7200

Pulses Monthly Report April, 2021
Pulses State Market Pulses Arrivals 31-
Mar-21 27-
Feb-21 31-
Mar-20
Chana Maharashtra Hingang
hat Chana Desi in Qtls. 145500 61015 42500
Chana Madhya Pradesh
Ujjain Chana in Qtls. 4850 5900 4625
Chana Maharashtra Amedna
gar Chana in Qtls. 17800 15500 16000
Chana Maharashtra Akola Chana in Qtls. 32500 23000 20700
Chana Maharashtra Nagpur Chana in Qtls. 97000 47800 19500
Chana Karnataka Sedam Chana in Qtls. 0 9700 1792
Chana Chhattisgarh Raipur Chana in Qtls. 19500 13300 7300
Chana Maharashtra Jalna Chana Gauran in Qtls. 28800 8750 27500
Chana Maharashtra Jalna Chana Pila in Qtls. 9400 3500 7500
Chana Maharashtra Latur Chana Mixed (Mill) in Qtls. 385000 13600
0 185000
Chana Maharashtra Nanded Chana Annagri in Qtls. 63000 16800 46000
Chana Maharashtra Solapur Chana Annagiri in Qtls. 53500 31400 19800
Chana Maharashtra Udgir Chana Annagiri in Qtls. 25600 3850 9400
Chana Karnataka Gulbarg
a Chana Annagiri in Qtls. 42335 38789 8459
Masur Uttar Pradesh Jhansi Masur in Qtls. 4600 0 2180
Masur Bihar Patna Masur in Qtls. 0 0 500
Masur Chhattisgarh Raipur Masur in Qtls. 23100 11600 7500
Masur Madhya Pradesh
Gwalior Masur in Qtls. 0 0 0
Masur Madhya Pradesh
Bina Masur Kali in Qtls. 14000 7200 19900
Masur Madhya Pradesh
Dabra Masur Medium in Qtls. 0 0 0
Masur Madhya Pradesh
Rajgarh Masur Medium in Qtls. 0 0 0
Masur Madhya Pradesh
Indore Masur Medium (Barik) in Qtls. 21400 11300 13500
Masur Madhya Pradesh
AsokNagar
Masur Desi in Qtls. 37950 3425 20475
Masur Madhya Pradesh
Pipariya Masur Desi in Qtls. 3900 920 1230
Masur Madhya Pradesh
GanjBasoda
Masur Desi in Qtls. 83700 9500 50000
Masur Madhya Pradesh
Vidisha Masur Desi in Qtls. 37400 1635 7420
Masur Madhya Pradesh
Katni Masur Desi in Qtls. 12050 2350 7000

Pulses Monthly Report April, 2021
Pulses State Market Pulses Arrivals 31-
Mar-21 27-
Feb-21 31-
Mar-20
Masur Madhya Pradesh
Neemuch
Masur Desi in Qtls. 3355 1835 3350
Masur Rajasthan Bhilwar
a Masur Desi in Qtls. 0 0 270
Moong Rajasthan Ajmer Moong Desi in Qtls. 17000 17400 2750
Moong Rajasthan Merta
City Moong Desi in Qtls. 48000 98000 10800
Moong Maharashtra Udgir Moong Desi in Qtls. 0 0 600
Moong Madhya Pradesh
Pipariya Moong Desi in Qtls. 37000 26900 3250
Moong Uttar Pradesh Hathras Moong Desi in Qtls. 0 0 0
Moong Rajasthan Sriganga
nagar Moong in Qtls. 8960 9300 1005
Moong Rajasthan Kekri Moong in Qtls. 12800 23000 5500
Moong Andhra Pradesh
Vijaywada
Moong in Qtls. 19800 6500 18400
Moong Maharashtra Akola Moong in Qtls. 1200 1150 2150
Moong Maharashtra Barshi Moong in Qtls. 525 630 890
Moong Maharashtra Latur Moong in Qtls. 0 0 0
Moong Madhya Pradesh
Harda Moong in Qtls. 25100 35100 1315
Moong Maharashtra Jalgoan Moong Chamki in Qtls. 1200 1050 1050
Moong Maharashtra Jalna Moong Chamki in Qtls. 1050 1000 750
Moong Karnataka Gulbarg
a Moong Chamki in Qtls. 2900 6600 750
Moong Madhya Pradesh
Indore Moong Chamki in Qtls. 6100 7700 10400
Moong Maharashtra Amedna
gar Moong (Polish) in Qtls. 4600 6900 4800
Moong Karnataka Yadgir Moong Polish in Qtls. 815 180 40
Moong Maharashtra Jalna Moong Gauran in Qtls. 1050 1000 750
Moong Karnataka Sedam Moong Green in Qtls. 0 0 0
Moong Karnataka Gulbarg
a Moong FAQ in Qtls. 237 1419 334
Moong Uttar Pradesh Kanpur Moong (UP line) in Qtls. 0 0 0
Moth Rajasthan Nokha Moth in Qtls. 56000 56500 26000
Peas Madhya Pradesh
Dabra Peas White in Qtls. 600 1500 26750
Peas Madhya Pradesh
Harpalpur
Peas White in Qtls. 13800 2800 2800
Peas Uttar Pradesh Jhansi Peas White in Qtls. 7000 0 6315

Pulses Monthly Report April, 2021
Pulses State Market Pulses Arrivals 31-
Mar-21 27-
Feb-21 31-
Mar-20
Tur Karnataka Sedam Tur Red in Qtls. 3739 900 6596
Tur Karnataka Yadgir Tur Red in Qtls. 19141 24910 18923
Tur Uttar Pradesh Hathras Tur Red in Qtls. 0 0 0
Tur Maharashtra Akola Tur Red in Qtls. 33400 11950
0 45200
Tur Maharashtra Amarav
ati Tur Red in Qtls. 84000
133000
57500
Tur Maharashtra Latur Tur Red in Qtls. 97500 18900
0 140000
Tur Maharashtra Udgir Tur Red in Qtls. 41000 27000 42000
Tur Karnataka Yadgir Tur White in Qtls. 1660 20337 1037
Tur Maharashtra Jalgoan Tur white in Qtls. 11200 40000 8300
Tur Maharashtra Jalna Tur White in Qtls. 7700 29400 20300
Tur Maharashtra Latur Tur White in Qtls. 0 0 0
Tur Maharashtra Jalna Tur BDM in Qtls. 2650 10100 6000
Tur Maharashtra Jalna Tur Red (Variety-Maruti) in
Qtls. 1850 4900 4800
Tur Madhya Pradesh
Indore Tur Mah. Origin in Qtls. 21500 21600 9400
Tur Madhya Pradesh
Morena Tur Desi in Qtls. 285 290 570
Tur Madhya Pradesh
Pipariya Tur Desi in Qtls. 26300 29400 20800
Tur Madhya Pradesh
Katni Tur Desi in Qtls. 3300 4300 2550
Tur Madhya Pradesh
Bhind Tur in Qtls. 1150 1200 800
Tur Madhya Pradesh
Dabra Tur in Qtls. 0 0 0
Tur Maharashtra Amedna
gar Tur in Qtls. 25000 47500 27500
Tur Maharashtra Barshi Tur in Qtls. 12800 73900 15400
Tur Maharashtra Solapur Tur in Qtls. 72500 99000 54700
Tur Maharashtra Hingang
hat Tur in Qtls. 72500
174000
38200
Tur Chhattisgarh Raipur Tur in Qtls. 15600 32400 17200
Urad Madhya Pradesh
AsokNagar
Urad Desi in Qtls. 3650 3100 3325
Urad Madhya Pradesh
Neemuch
Urad Desi in Qtls. 2475 5950 2360
Urad Maharashtra Akola Urad Desi in Qtls. 1200 1150 2600

Pulses Monthly Report April, 2021
Pulses State Market Pulses Arrivals 31-
Mar-21 27-
Feb-21 31-
Mar-20
Urad Maharashtra Jalgoan Urad Desi in Qtls. 1450 1150 830
Urad Maharashtra Udgir Urad Desi in Qtls. 0 0 500
Urad Rajasthan Bhilwar
a Urad Desi in Qtls. 0 0 0
Urad Rajasthan Ramgan
j Urad Desi in Qtls. 1275 5103 4700
Urad Madhya Pradesh
Bina Urad in Qtls. 0 0 0
Urad Madhya Pradesh
Ganjbasoda
Urad in Qtls. 3350 2250 3750
Urad Madhya Pradesh
Harpalpur
Urad in Qtls. 460 1760 0
Urad Madhya Pradesh
Pipariya Urad in Qtls. 0 0 0
Urad Rajasthan Bundi Urad in Qtls. 933 1254 786
Urad Rajasthan Kekri Urad in Qtls. 10550 18900 5950
Urad Maharashtra Amedna
gar Urad in Qtls. 7700 13800 5900
Urad Maharashtra Barshi Urad in Qtls. 5800 5900 2730
Urad Maharashtra Jalna Urad in Qtls. 1050 1950 750
Urad Maharashtra Latur Urad in Qtls. 0 0 0
Urad Uttar Pradesh Jhansi Urad in Qtls. 200 800 8900
Urad Karnataka Sedam Urad in Qtls. 0 0 34
Urad Madhya Pradesh
Dabra Urad Kali in Qtls. 0 0 0
Urad Madhya Pradesh
Dabra Urad Lal in Qtls. 0 0 0
Urad Madhya Pradesh
Dabra Urad Rangoli in Qtls. 0 0 0
Urad Madhya Pradesh
Indore Urad (Mah. origin) in Qtls. 6100 6000 14800
Urad Karnataka Gulbarg
a Urad FAQ in Qtls. 1750 3000 400
Urad Andhra Pradesh
Vijaywada
Urad (Polis) in Qtls. 34000 18700 56000
Gram Dal Wholesale Prices (Rs./Qtl.)
Date 31-Mar-21 27-Feb-21
Centre Gram Dal Gram Dal
NORTH ZONE
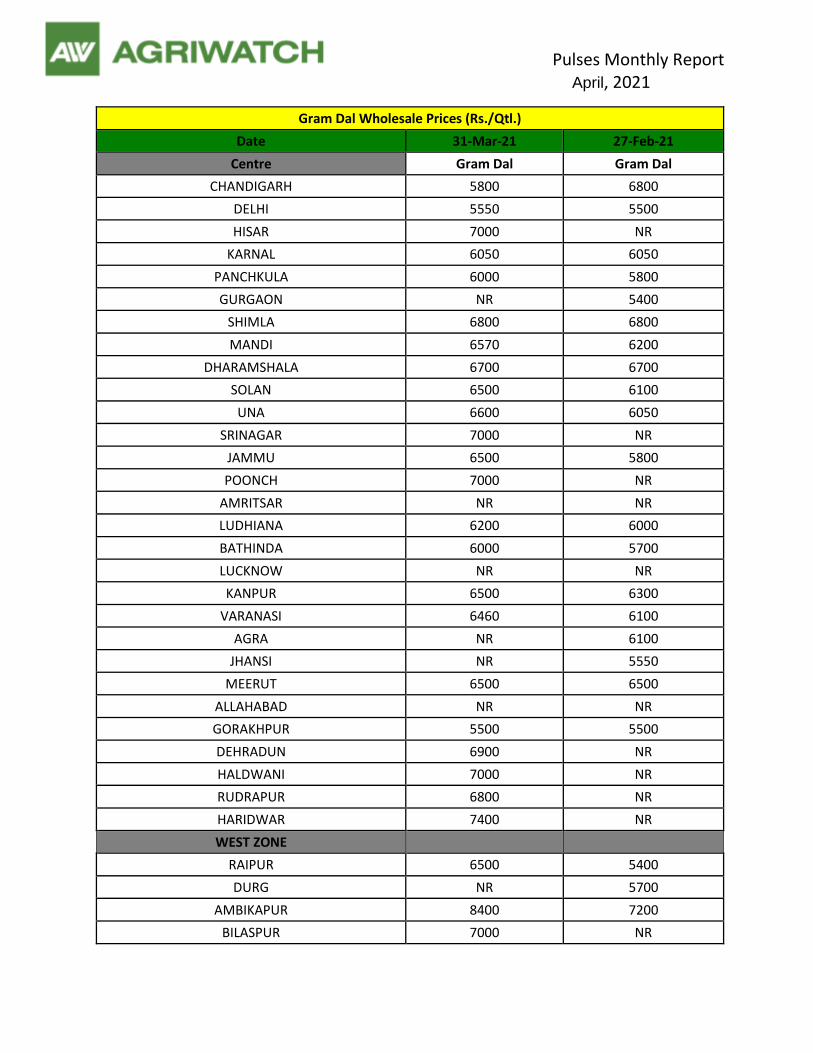
Pulses Monthly Report April, 2021
Gram Dal Wholesale Prices (Rs./Qtl.)
Date 31-Mar-21 27-Feb-21
Centre Gram Dal Gram Dal
CHANDIGARH 5800 6800
DELHI 5550 5500
HISAR 7000 NR
KARNAL 6050 6050
PANCHKULA 6000 5800
GURGAON NR 5400
SHIMLA 6800 6800
MANDI 6570 6200
DHARAMSHALA 6700 6700
SOLAN 6500 6100
UNA 6600 6050
SRINAGAR 7000 NR
JAMMU 6500 5800
POONCH 7000 NR
AMRITSAR NR NR
LUDHIANA 6200 6000
BATHINDA 6000 5700
LUCKNOW NR NR
KANPUR 6500 6300
VARANASI 6460 6100
AGRA NR 6100
JHANSI NR 5550
MEERUT 6500 6500
ALLAHABAD NR NR
GORAKHPUR 5500 5500
DEHRADUN 6900 NR
HALDWANI 7000 NR
RUDRAPUR 6800 NR
HARIDWAR 7400 NR
WEST ZONE
RAIPUR 6500 5400
DURG NR 5700
AMBIKAPUR 8400 7200
BILASPUR 7000 NR

Pulses Monthly Report April, 2021
Gram Dal Wholesale Prices (Rs./Qtl.)
Date 31-Mar-21 27-Feb-21
Centre Gram Dal Gram Dal
JAGDALPUR 6200 NR
PANAJI 6700 6400
AHMEDABAD 6200 6200
RAJKOT 5710 5800
SURAT 6600 NR
BHUJ 6100 NR
BHOPAL 6650 6640
INDORE 6740 6700
GWALIOR 6300 6000
JABALPUR NR 8700
REWA 5500 6000
SAGAR 7000 7000
JHABUA 7000 6500
HOSHANGABAD NR 5400
SHAHDOL 5500 6000
UJJAIN 5500 5800
MUMBAI 6100 NR
NAGPUR 6200 NR
PUNE NR NR
NASHIK 6000 6000
JAIPUR 6000 5800
JODHPUR NR NR
KOTA NR 6000
UDAIPUR NR NR
EAST ZONE
PATNA NR 5800
BHAGALPUR 5800 5700
PURNIA 6100 5700
DARBHANGA 6100 5400
GAYA NR 6200
MUZZAFARPUR NR 6370
RANCHI 6300 6000
BHUBANESHWAR 6400 6000
CUTTACK NR NR

Pulses Monthly Report April, 2021
Gram Dal Wholesale Prices (Rs./Qtl.)
Date 31-Mar-21 27-Feb-21
Centre Gram Dal Gram Dal
SAMBALPUR 6200 NR
ROURKELA NR 5800
BERHAMPUR 6200 NR
JEYPORE 6000 6000
BALASORE 6000 6050
BARIPADA 6500 NR
BALANGIR NR NR
KOLKATA 6300 5700
SILIGURI 7850 5750
PURULIA 6350 NR
KHARAGPUR NR NR
RAMPURHAT 6255 6255
MALDA 7800 7800
RAIGANJ 6600 6000
NORTH EAST ZONE
PORT BLAIR 7300 7200
MAYABUNDER 7880 7500
ITANAGAR NR NR
GUWAHATI 6200 5900
IMPHAL NR NR
SHILLONG 7000 7000
TURA 6800 6800
JOWAI 7000 7600
AIZAWL NR NR
DIMAPUR 7000 NR
GANGTOK 7000 7000
AGARTALA 6400 6000
SOUTH ZONE
VIJAYWADA 6500 NR
VISAKHAPATNAM 6350 6000
KURNOOL 6200 NR
TIRUPATHI 6800 NR
BENGALURU 6200 6500
DHARWAD 6500 6100

Pulses Monthly Report April, 2021
Gram Dal Wholesale Prices (Rs./Qtl.)
Date 31-Mar-21 27-Feb-21
Centre Gram Dal Gram Dal
MANGALORE 6500 6500
MYSORE 7100 NR
T.PURAM 6800 7400
ERNAKULAM 6700 6300
KOZHIKODE 6900 7300
THRISSUR 6500 6500
PALAKKAD NR 6700
WAYANAD 6200 6200
PUDUCHERRY NR 6000
CHENNAI 6200 5900
DINDIGUL 6950 6800
THIRUCHIRAPALLI 6600 6300
COIMBATORE 6600 6300
TIRUNELVELI 7000 7000
CUDDALORE NR 6500
DHARMAPURI 6200 6200
VELLORE 6800 6800
RAMANATHAPURAM NR 5900
HYDERABAD NR NR
KARIMNAGAR 6000 6000
WARANGAL 6900 6800
ADILABAD 6000 5700
SURYAPET 5900 6500
JADCHERLA NR 6800
Tur Arhar Wholesale Prices (Rs./Qtl.)
Date 31-Mar-21 27-Feb-21
Centre Tur/ Arhar Dal Tur/ Arhar Dal
NORTH ZONE
CHANDIGARH 9400 9400
DELHI 8800 9300
HISAR 9000 NR
KARNAL 10000 9820
PANCHKULA 9200 9200
GURGAON 9000 9000

Pulses Monthly Report April, 2021
Tur Arhar Wholesale Prices (Rs./Qtl.)
Date 31-Mar-21 27-Feb-21
Centre Tur/ Arhar Dal Tur/ Arhar Dal
SHIMLA 9900 9100
MANDI 9948 10000
DHARAMSHALA 10700 10700
SOLAN 9800 10000
UNA 10500 10500
SRINAGAR 11000 NR
JAMMU 10000 10000
POONCH 10500 NR
AMRITSAR NR NR
LUDHIANA 9200 9000
BATHINDA 9700 9800
LUCKNOW NR NR
KANPUR 10300 10300
VARANASI 9700 9200
AGRA NR 9600
JHANSI NR 9650
MEERUT 9850 9500
ALLAHABAD NR NR
GORAKHPUR 8000 8000
DEHRADUN 9800 NR
HALDWANI 10000 NR
RUDRAPUR 9900 NR
HARIDWAR 10200 NR
WEST ZONE
RAIPUR 9500 9000
DURG NR 6800
AMBIKAPUR 9800 8400
BILASPUR 11000 NR
JAGDALPUR 6700 NR
PANAJI 9750 9700
AHMEDABAD 8900 8900
RAJKOT 8300 8300
SURAT 9300 9300
BHUJ 8700 NR

Pulses Monthly Report April, 2021
Tur Arhar Wholesale Prices (Rs./Qtl.)
Date 31-Mar-21 27-Feb-21
Centre Tur/ Arhar Dal Tur/ Arhar Dal
BHOPAL 9425 9465
INDORE 9440 9200
GWALIOR 10200 10100
JABALPUR NR 10700
REWA 9000 8700
SAGAR 10050 10050
JHABUA 10400 10500
HOSHANGABAD NR 9200
SHAHDOL 9200 9500
UJJAIN 9350 9800
MUMBAI 9000 NR
NAGPUR 9800 NR
PUNE NR NR
NASHIK 9000 8500
JAIPUR 10100 9900
JODHPUR NR NR
KOTA NR 9000
UDAIPUR 9500 9500
EAST ZONE
PATNA NR 9400
BHAGALPUR 9500 9500
PURNIA 9700 9000
DARBHANGA 8600 8200
GAYA NR 9200
MUZZAFARPUR NR 9800
RANCHI 9300 9000
BHUBANESHWAR 9600 9600
CUTTACK NR NR
SAMBALPUR 9600 NR
ROURKELA NR 9300
BERHAMPUR 9300 NR
JEYPORE 9900 9000
BALASORE 9400 10600
BARIPADA 9700 NR

Pulses Monthly Report April, 2021
Tur Arhar Wholesale Prices (Rs./Qtl.)
Date 31-Mar-21 27-Feb-21
Centre Tur/ Arhar Dal Tur/ Arhar Dal
BALANGIR NR NR
KOLKATA 9300 9600
SILIGURI 6500 8560
PURULIA 8300 NR
KHARAGPUR NR NR
RAMPURHAT 10070 NR
MALDA 11500 11500
RAIGANJ 9600 9600
NORTH EAST ZONE
PORT BLAIR 10200 10000
MAYABUNDER 10700 10200
ITANAGAR NR NR
GUWAHATI 9500 9500
IMPHAL NR NR
SHILLONG 10700 10700
TURA 10000 10000
JOWAI 10500 10500
AIZAWL NR NR
DIMAPUR 9000 NR
GANGTOK 10700 10000
AGARTALA 9400 9000
SOUTH ZONE
VIJAYWADA 9000 NR
VISAKHAPATNAM 9000 9000
KURNOOL 9200 NR
TIRUPATHI 9200 NR
BENGALURU 9700 9000
DHARWAD 9000 9400
MANGALORE 9000 9500
MYSORE 10800 NR
T.PURAM 9800 9600
ERNAKULAM 10400 10500
KOZHIKODE 10000 10200
THRISSUR 8900 9000

Pulses Monthly Report April, 2021
Tur Arhar Wholesale Prices (Rs./Qtl.)
Date 31-Mar-21 27-Feb-21
Centre Tur/ Arhar Dal Tur/ Arhar Dal
PALAKKAD NR 9700
WAYANAD 9500 9500
PUDUCHERRY NR 9800
CHENNAI 9100 8800
DINDIGUL 9900 9300
THIRUCHIRAPALLI 10300 10300
COIMBATORE 10400 10100
TIRUNELVELI 10000 9200
CUDDALORE NR 10500
DHARMAPURI 9500 9800
VELLORE 10000 10000
RAMANATHAPURAM NR 9800
HYDERABAD NR NR
KARIMNAGAR 9500 9500
WARANGAL 10100 9900
ADILABAD 9900 10000
SURYAPET 10000 10300
JADCHERLA 10000 10500
Urad Dal Wholesale Prices (Rs./Qtl.)
Date 31-Mar-21 27-Feb-21
Centre Urad Dal Urad Dal
NORTH ZONE
CHANDIGARH 9500 9350
DELHI 9100 8900
HISAR 8800 NR
KARNAL 9500 9990
PANCHKULA 9000 9000
GURGAON 9000 9000
SHIMLA 10500 9900
MANDI 9544 9390
DHARAMSHALA 10700 10700
SOLAN 10200 10000
UNA 9700 9750
SRINAGAR 9000 NR

Pulses Monthly Report April, 2021
Urad Dal Wholesale Prices (Rs./Qtl.)
Date 31-Mar-21 27-Feb-21
Centre Urad Dal Urad Dal
JAMMU 10300 10200
POONCH 11000 NR
AMRITSAR NR NR
LUDHIANA 10000 9500
BATHINDA 9600 10000
LUCKNOW NR NR
KANPUR 9800 9500
VARANASI 9080 9200
AGRA NR 9020
JHANSI NR 8750
MEERUT 10000 10000
ALLAHABAD NR NR
GORAKHPUR 9000 9000
DEHRADUN 9900 NR
HALDWANI 10100 NR
RUDRAPUR 9800 NR
HARIDWAR 10300 NR
WEST ZONE
RAIPUR 8200 9000
DURG NR 8000
AMBIKAPUR 9500 6300
BILASPUR 11200 NR
JAGDALPUR 6600 NR
PANAJI 10100 10500
AHMEDABAD 8800 8800
RAJKOT 8525 8525
SURAT NR 9800
BHUJ 9500 NR
BHOPAL 9410 9440
INDORE 9680 9300
GWALIOR 8500 8200
JABALPUR NR 9800
REWA 7000 6500
SAGAR 9000 NR

Pulses Monthly Report April, 2021
Urad Dal Wholesale Prices (Rs./Qtl.)
Date 31-Mar-21 27-Feb-21
Centre Urad Dal Urad Dal
JHABUA 9500 9500
HOSHANGABAD NR 8700
SHAHDOL 8500 9000
UJJAIN 9250 9300
MUMBAI 10300 NR
NAGPUR NR NR
PUNE NR NR
NASHIK 9200 8400
JAIPUR 8700 8800
JODHPUR NR NR
KOTA NR 8000
UDAIPUR 8500 8500
EAST ZONE
PATNA NR 10200
BHAGALPUR 9000 9500
PURNIA 10000 9700
DARBHANGA 10100 9000
GAYA NR 9400
MUZZAFARPUR NR 9700
RANCHI 9600 9300
BHUBANESHWAR 10000 10000
CUTTACK NR NR
SAMBALPUR 9500 NR
ROURKELA NR 9700
BERHAMPUR 10500 NR
JEYPORE 10000 9500
BALASORE 9800 9750
BARIPADA 9800 NR
BALANGIR NR NR
KOLKATA 9500 9400
SILIGURI 7455 9550
PURULIA 9760 NR
KHARAGPUR NR NR
RAMPURHAT 10200 10200

Pulses Monthly Report April, 2021
Urad Dal Wholesale Prices (Rs./Qtl.)
Date 31-Mar-21 27-Feb-21
Centre Urad Dal Urad Dal
MALDA 9500 9500
RAIGANJ 9600 9400
NORTH EAST ZONE
PORT BLAIR 11400 11800
MAYABUNDER 11900 13000
ITANAGAR NR NR
GUWAHATI 8500 8500
IMPHAL NR NR
SHILLONG 10000 10000
TURA 10500 10500
JOWAI 10500 10500
AIZAWL NR NR
DIMAPUR 8000 NR
GANGTOK 11000 10500
AGARTALA 9500 9200
SOUTH ZONE
VIJAYWADA 9800 NR
VISAKHAPATNAM 10500 10500
KURNOOL 12000 NR
TIRUPATHI 10500 NR
BENGALURU 10000 11000
DHARWAD 11000 11000
MANGALORE 10400 10400
MYSORE 11500 NR
T.PURAM 11500 11500
ERNAKULAM 10500 11000
KOZHIKODE 11000 11200
THRISSUR 10000 10500
PALAKKAD NR 9800
WAYANAD 10600 10600
PUDUCHERRY NR 11700
CHENNAI 10800 11200
DINDIGUL 11900 11200
THIRUCHIRAPALLI 10800 11900

Pulses Monthly Report April, 2021
Urad Dal Wholesale Prices (Rs./Qtl.)
Date 31-Mar-21 27-Feb-21
Centre Urad Dal Urad Dal
COIMBATORE 10800 11500
TIRUNELVELI 11000 11700
CUDDALORE NR 11700
DHARMAPURI 10500 11200
VELLORE 11000 11000
RAMANATHAPURAM NR 10800
HYDERABAD NR NR
KARIMNAGAR 10000 10000
WARANGAL 11200 10600
ADILABAD 10500 10500
SURYAPET 10300 10400
JADCHERLA NR 10800
Moong Dal Wholesale Prices (Rs./Qtl.)
Date 31-Mar-21 27-Feb-21
Centre Moong Dal Moong Dal
NORTH ZONE
CHANDIGARH 9800 9700
DELHI 9050 9250
HISAR 9500 NR
KARNAL 9220 9510
PANCHKULA 10000 10000
GURGAON 9100 9100
SHIMLA 10400 9600
MANDI 10135 10350
DHARAMSHALA 10700 10700
SOLAN 9800 9600
UNA 9600 9800
SRINAGAR 9000 NR
JAMMU 9800 9700
POONCH 10000 NR
AMRITSAR NR NR
LUDHIANA 9200 9300
BATHINDA 9600 9600
LUCKNOW NR NR

Pulses Monthly Report April, 2021
Moong Dal Wholesale Prices (Rs./Qtl.)
Date 31-Mar-21 27-Feb-21
Centre Moong Dal Moong Dal
KANPUR 8600 9000
VARANASI 9030 9000
AGRA NR 9200
JHANSI NR 8850
MEERUT 9850 9800
ALLAHABAD NR NR
GORAKHPUR 10000 11000
DEHRADUN 10100 NR
HALDWANI 9800 NR
RUDRAPUR 9900 NR
HARIDWAR 10500 NR
WEST ZONE
RAIPUR 8500 8300
DURG NR 9500
AMBIKAPUR 10200 11200
BILASPUR NR NR
JAGDALPUR NR NR
PANAJI 9850 9950
AHMEDABAD 9200 9200
RAJKOT 7850 7850
SURAT NR NR
BHUJ 8700 NR
BHOPAL 9390 9420
INDORE 9590 9300
GWALIOR 9300 9200
JABALPUR NR 8800
REWA 7500 7500
SAGAR 7400 6400
JHABUA 9500 9500
HOSHANGABAD NR 8200
SHAHDOL 9000 10000
UJJAIN 9200 9200
MUMBAI 10500 NR
NAGPUR 10200 NR

Pulses Monthly Report April, 2021
Moong Dal Wholesale Prices (Rs./Qtl.)
Date 31-Mar-21 27-Feb-21
Centre Moong Dal Moong Dal
PUNE NR NR
NASHIK 9000 8900
JAIPUR 9000 8900
JODHPUR NR NR
KOTA NR 7800
UDAIPUR 8500 8500
EAST ZONE
PATNA NR 9500
BHAGALPUR 9000 9500
PURNIA 9500 9500
DARBHANGA 9700 9100
GAYA NR 9500
MUZZAFARPUR NR 9565
RANCHI 9300 9200
BHUBANESHWAR 9800 9500
CUTTACK NR NR
SAMBALPUR 9300 NR
ROURKELA NR 9000
BERHAMPUR 10000 NR
JEYPORE 9400 9400
BALASORE 9200 10600
BARIPADA 9400 NR
BALANGIR NR NR
KOLKATA 9500 9500
SILIGURI 8500 9580
PURULIA 10200 NR
KHARAGPUR NR NR
RAMPURHAT 10490 10490
MALDA 10500 10500
RAIGANJ 10000 10000
NORTH EAST ZONE
PORT BLAIR 10200 10000
MAYABUNDER 11300 11200
ITANAGAR NR NR

Pulses Monthly Report April, 2021
Moong Dal Wholesale Prices (Rs./Qtl.)
Date 31-Mar-21 27-Feb-21
Centre Moong Dal Moong Dal
GUWAHATI 9500 9500
IMPHAL NR NR
SHILLONG 9900 9900
TURA 9600 9600
JOWAI 10600 10600
AIZAWL NR NR
DIMAPUR 9500 NR
GANGTOK 10200 10200
AGARTALA 9100 9100
SOUTH ZONE
VIJAYWADA 9900 NR
VISAKHAPATNAM 9600 NR
KURNOOL 10000 NR
TIRUPATHI 11000 NR
BENGALURU 9600 10000
DHARWAD 9600 9900
MANGALORE 9600 9600
MYSORE 10800 NR
T.PURAM 10000 9600
ERNAKULAM 10000 10300
KOZHIKODE 10200 10200
THRISSUR 9700 9700
PALAKKAD NR 10500
WAYANAD 9500 9500
PUDUCHERRY NR 9800
CHENNAI 9600 9800
DINDIGUL 9950 9800
THIRUCHIRAPALLI 10200 10200
COIMBATORE 10400 10200
TIRUNELVELI 10500 10500
CUDDALORE NR 10500
DHARMAPURI 9700 9800
VELLORE 10000 9800
RAMANATHAPURAM NR 9900

Pulses Monthly Report April, 2021
Moong Dal Wholesale Prices (Rs./Qtl.)
Date 31-Mar-21 27-Feb-21
Centre Moong Dal Moong Dal
HYDERABAD NR NR
KARIMNAGAR 9400 9400
WARANGAL NR 9100
ADILABAD 9850 10100
SURYAPET 10400 10300
JADCHERLA NR NR
Masoor Dal Wholesale Prices (Rs./Qtl.)
Date 31-Mar-21 27-Feb-21
Centre Masoor Dal Masoor Dal
NORTH ZONE
CHANDIGARH 7900 6800
DELHI 6800 6900
HISAR 7800 NR
KARNAL 7000 7000
PANCHKULA 8000 8000
GURGAON 6000 6100
SHIMLA 7000 6500
MANDI 7017 6700
DHARAMSHALA 7100 7100
SOLAN 6700 6500
UNA 7350 7250
SRINAGAR 7000 NR
JAMMU 7600 7100
POONCH 7600 NR
AMRITSAR NR NR
LUDHIANA 7000 7000
BATHINDA 6900 7000
LUCKNOW NR NR
KANPUR 6500 6600
VARANASI 8250 7600
AGRA NR 6300
JHANSI NR 6350
MEERUT 7250 7000
ALLAHABAD NR NR

Pulses Monthly Report April, 2021
Masoor Dal Wholesale Prices (Rs./Qtl.)
Date 31-Mar-21 27-Feb-21
Centre Masoor Dal Masoor Dal
GORAKHPUR 6000 6000
DEHRADUN 7800 NR
HALDWANI 7600 NR
RUDRAPUR 7200 NR
HARIDWAR 7900 NR
WEST ZONE
RAIPUR 8200 6000
DURG NR 7000
AMBIKAPUR 6500 7000
BILASPUR 7500 NR
JAGDALPUR 6500 NR
PANAJI 7150 7100
AHMEDABAD 6900 6900
RAJKOT 6380 6555
SURAT NR 8000
BHUJ 6900 NR
BHOPAL 6845 6830
INDORE 6870 6700
GWALIOR 6500 6000
JABALPUR NR 7600
REWA 6000 6500
SAGAR 6070 6070
JHABUA 7000 7500
HOSHANGABAD NR 6000
SHAHDOL 6600 7500
UJJAIN 6750 6700
MUMBAI 6600 NR
NAGPUR NR NR
PUNE NR NR
NASHIK 6700 6300
JAIPUR 6800 6200
JODHPUR NR NR
KOTA NR 6000
UDAIPUR 7500 7500

Pulses Monthly Report April, 2021
Masoor Dal Wholesale Prices (Rs./Qtl.)
Date 31-Mar-21 27-Feb-21
Centre Masoor Dal Masoor Dal
EAST ZONE
PATNA NR 6600
BHAGALPUR 6800 6500
PURNIA 6800 6400
DARBHANGA 6600 6300
GAYA NR 6600
MUZZAFARPUR NR 6340
RANCHI 6600 6200
BHUBANESHWAR 6800 6200
CUTTACK NR NR
SAMBALPUR 6600 NR
ROURKELA NR 6300
BERHAMPUR 7100 NR
JEYPORE 6300 6300
BALASORE 6100 6900
BARIPADA 6400 NR
BALANGIR NR NR
KOLKATA 6700 6400
SILIGURI 6475 8850
PURULIA 6900 NR
KHARAGPUR NR NR
RAMPURHAT 7140 7140
MALDA 11000 11000
RAIGANJ 8800 8600
NORTH EAST ZONE
PORT BLAIR 8000 7500
MAYABUNDER 8400 7900
ITANAGAR NR NR
GUWAHATI 7100 6500
IMPHAL NR NR
SHILLONG 8800 8800
TURA 7600 7000
JOWAI 7000 7500
AIZAWL NR NR

Pulses Monthly Report April, 2021
Masoor Dal Wholesale Prices (Rs./Qtl.)
Date 31-Mar-21 27-Feb-21
Centre Masoor Dal Masoor Dal
DIMAPUR 7000 NR
GANGTOK 7700 7700
AGARTALA 8400 8200
SOUTH ZONE
VIJAYWADA 7500 NR
VISAKHAPATNAM 6700 6500
KURNOOL 8000 NR
TIRUPATHI NR NR
BENGALURU 7000 8200
DHARWAD 7150 7000
MANGALORE 7200 7000
MYSORE 7200 NR
T.PURAM 7200 7200
ERNAKULAM 7500 7500
KOZHIKODE 7100 7000
THRISSUR 7200 7000
PALAKKAD NR 7300
WAYANAD 8300 7900
PUDUCHERRY NR 7700
CHENNAI 7000 6500
DINDIGUL 7050 6700
THIRUCHIRAPALLI 6800 6800
COIMBATORE 7000 6800
TIRUNELVELI 7000 7000
CUDDALORE NR 9500
DHARMAPURI 7300 7000
VELLORE 7000 6800
RAMANATHAPURAM NR NR
HYDERABAD NR NR
KARIMNAGAR 6900 6900
WARANGAL 5200 5600
ADILABAD 7100 7100
SURYAPET 7400 7300
JADCHERLA 6500 6800

Pulses Monthly Report April, 2021
MSP For Pulses:
MSP (Rs/Quintal) For Crop Year From 2014-15 To 2020-21
MSP (Rs/Quintal) 2014-15 2015-16 2016-17 2017-18 2018-19 2019-20 2020-21
Tur (Arhar) 4350 4625 5050 5450 5675 5800 6000
Moong 4600 4850 5225 5575 6975 7050 7196
Urad 4350 4625 5000 5400 5600 5700 6000
Gram 3175 3425 4000 4400 4620 4875 -
Lentil (Masur) 3075 3325 3950 4250 4475 4800 -
Source:CACP Indian Pulses/Snap Shot/Govt.’s historical data/Adv estimate:
Pulses
2nd Advance Estimate For 2020-21 released on 24.02.2021 2020-21
Season
2010-11
2011-12
2012-13
2013-14
2014-15
2015-16
2016-17
2017-18
2018-19
2019-20
Target
2nd Adv Est
Tur Kharif 2.86 2.65 3.02 3.17 2.81 2.56 4.87 4.29 3.32 3.89 4.82 3.88
Gram Rabi 8.22 7.7 8.83 9.53 7.33 7.06 9.38
11.38 9.94
11.08 11 11.62
Urad Kharif 1.4 1.23 1.43 1.15 1.28 1.25 2.18 2.75 2.36 1.33 2.90 1.77
Rabi 0.36 0.53 0.47 0.55 0.68 0.7 0.66 0.74 0.7 0.75 0.70 0.68
Total 1.76 1.76 1.9 1.7 1.96 1.95 2.84 3.49 3.06 2.08 3.60 2.45
Moong Kharif 1.53 1.24 0.79 0.96 0.87 1 1.64 1.43 1.78 1.83 1.88 2.02
Rabi 0.27 0.4 0.4 0.65 0.64 0.59 0.52 0.59 0.67 0.68 0.60 0.60
Total 1.8 1.64 1.19 1.61 1.51 1.59 2.16 2.02 2.45 2.51 2.48 2.62
Lentil Rabi 0.94 1.06 1.13 1.02 1.04 0.98 1.22 1.62 1.23 1.1 1.35
Other Pulses Kharif 1.33 0.93 0.62 0.71 0.77 0.72 0.89 0.83 0.63 0.87
1.00 0.79
Other Pulses Rabi 1.33 1.34 1.6 1.51 1.74 1.5 1.77 1.78 1.45 1.49
2.70 1.70
Total 2.66 2.27 2.22 2.22 2.51 3.19 3.88 2.61 2.08 2.36 3.70 2.49
Total Pulses Kharif 7.12 6.05 5.86 5.99 5.73 5.53 9.58 9.3 8.09 7.92
10.60 8.46
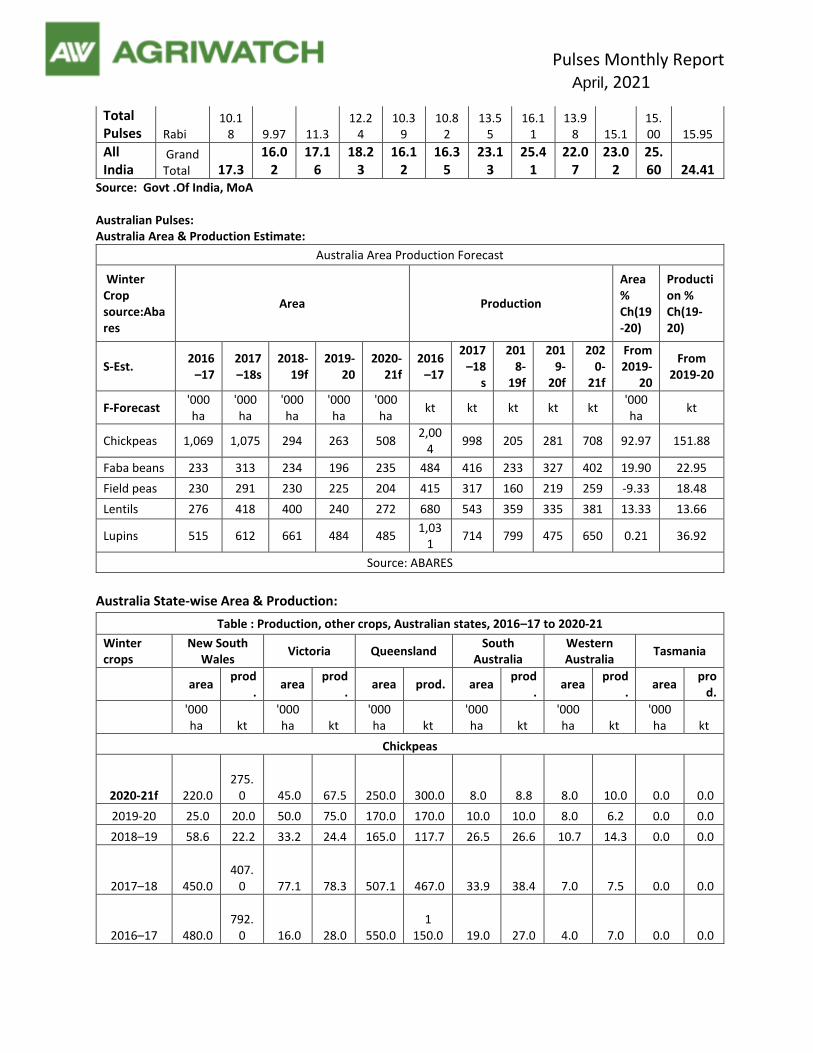
Pulses Monthly Report April, 2021
Total Pulses Rabi
10.18 9.97 11.3
12.24
10.39
10.82
13.55
16.11
13.98 15.1
15.00 15.95
All India
Grand Total 17.3
16.02
17.16
18.23
16.12
16.35
23.13
25.41
22.07
23.02
25.60 24.41
Source: Govt .Of India, MoA Australian Pulses: Australia Area & Production Estimate:
Australia Area Production Forecast
Winter Crop source:Abares
Area Production
Area % Ch(19-20)
Production % Ch(19-20)
S-Est. 2016
–17 2017–18s
2018-19f
2019-20
2020-21f
2016–17
2017–18
s
2018-
19f
2019-
20f
2020-
21f
From 2019-
20
From 2019-20
F-Forecast '000 ha
'000 ha
'000 ha
'000 ha
'000 ha
kt kt kt kt kt '000 ha
kt
Chickpeas 1,069 1,075 294 263 508 2,00
4 998 205 281 708 92.97 151.88
Faba beans 233 313 234 196 235 484 416 233 327 402 19.90 22.95
Field peas 230 291 230 225 204 415 317 160 219 259 -9.33 18.48
Lentils 276 418 400 240 272 680 543 359 335 381 13.33 13.66
Lupins 515 612 661 484 485 1,03
1 714 799 475 650 0.21 36.92
Source: ABARES
Australia State-wise Area & Production:
Table : Production, other crops, Australian states, 2016–17 to 2020-21
Winter crops
New South Wales
Victoria Queensland South
Australia Western Australia
Tasmania
area prod
. area
prod.
area prod. area prod
. area
prod.
area pro
d.
'000 ha kt
'000 ha kt
'000 ha kt
'000 ha kt
'000 ha kt
'000 ha kt
Chickpeas
2020-21f 220.0
275.
0 45.0 67.5 250.0 300.0 8.0 8.8 8.0 10.0 0.0 0.0
2019-20 25.0 20.0 50.0 75.0 170.0 170.0 10.0 10.0 8.0 6.2 0.0 0.0
2018–19 58.6 22.2 33.2 24.4 165.0 117.7 26.5 26.6 10.7 14.3 0.0 0.0
2017–18 450.0
407.
0 77.1 78.3 507.1 467.0 33.9 38.4 7.0 7.5 0.0 0.0
2016–17 480.0
792.
0 16.0 28.0 550.0 1
150.0 19.0 27.0 4.0 7.0 0.0 0.0

Pulses Monthly Report April, 2021
5 Yrs Ave 282.3
346.
1 37.9 41.8 328.7 455.1 20.1 21.8 6.6 7.8 0.0 0.0
Field peas
2020-21f 37.0 49.2 47.0 58.4 0.0 0.0 85.0
106.
3 35.0 45.0 0.0 0.0
2019-20s 35.0 31.5 55.0 55.0 0.0 0.0 105.0
100.
0 30.0 32.0 0.0 0.0
2018–19 45.6 18.5 83.0 42.8 0.0 0.0 74.1 53.1 26.9 45.1 0.0 0.0
2017–18 74.5 46.4 84.2 91.4 0.0 0.0 101.8
137.
1 31.0 42.3 0.0 0.0
2016–17 50.0 85.0 49.0
100.
0 0.0 0.0 100.0
175.
0 31.0 55.0 0.2 0.2
5 Yrs Ave 50.6 50.8 65.0 62.0 0.0 0.0 99.0
109.
5 28.2 40.7 0.0 0.0
Lentils
2020-21f 7.0 8.3 130.0
151.4
0.1 0.2 120.0
204.0
15.0 17.0 0.0 0.0
2019-20 6.0 4.9 110.0
155.0
0.1 0.2 110.0
160.0
14.0 15.0 0.0 0.0
2018–19 8.4 3.4 207.5
128.3
0.1 0.1 169.4
212.6
14.8 14.8 0.0 0.0
2017–18 2.0 1.3 210.4
261.1
0.2 0.2 197.9
274.3
8.0 6.0 0.0 0.0
2016–17 5.0 10.0 110.0
200.0
0.2 0.5 160.0
470.0
0.4 0.0 0.0 0.0
5 Yrs Ave 4.6 4.5 149.0
156.
9 0.2 0.3 150.5
250.
8 7.6 7.4 0.0 0.0
Lupins
2020-21f 60.0 71.3 35.0 38.1 0.0 0.0 40.0 50.0 350.0
490.0
0.2 0.5
2019-20 55.0 41.3 34.0 37.0 0.0 0.0 45.0 46.0 350.0
350.0
0.2 0.4
2018–19 58.6 23.8 49.8 24.4 0.0 0.0 42.3 37.2 510.2
712.8
0.2 0.4

Pulses Monthly Report April, 2021
2017–18 94.9 46.4 49.1 52.2 0.0 0.0 65.6 82.3 402.0
532.4
0.4 0.9
2016–17 51.0 66.3 33.0 60.0 0.0 0.0 70.0
100.0
360.5
805.0
0.1 0.1
5 Yrs Ave 70.8 57.7 42.3 41.0 0.0 0.0 57.0 63.7 390.8
571.
5 0.2 0.4
fABARES forecast. s ABARES estimate. Note: Zero is used to denote nil or less than 500 tonnes or 500 hectares.
Sources: ABARES; Australian Bureau of Statistics; Pulse Australia
Canadian Pulses:
Canadian Pulses Supply & Demand With Forecast For 2020-21
Pulses & Crop year
Area Seeded
Area Harvested Yield
Production
Imports
Totalsupply Exports
Total domestic use
Carry out stock
Stock to use ratio Ave price
Year
--------- thousand ha ------- t.ha
---------------------------------------------------- thousand tonnes ------------------------------------------------------ $/t
Dry Pea
2015-16 1,489 1,470 2.18 3,201 15 3,900 2,647 1,077 176 5 365
2016-17 1,733 1,677 2.88 4,836 32 5,042 3,944 797 300 6 300
2017-18 1,656 1,642 2.50 4,112 12 4,424 3,083 691 650 17 265
2018-19 1,463 1,431 2.50 3,581 62 4,291 3,270 708 312 8 240-270
2019-20 1,753 1,711 2.48 4,237 70 4,619 3,700 669 250 6 255-285
2020-21F 1,722 1,690 2.51 4,250 60 4,560 3,400 710 450 11 250-280
Lentils
2015-16 1,633 1,630 1.56 2,541 16 2,922 2,145 704 73 3 965
2016-17 2,254 2,221 1.44 3,194 98 3,365 2,455 595 315 10 575
2017-18 1,783 1,774 1.44 2,559 35 2,908 1,537 495 876 43 475
2018-19 1,525 1,499 1.40 2,092 51 3,016 2,033 352 631 26 350-380
2019-20 1,530 1,489 1.46 2,167 85 2,883 2,400 383 100 4 430-460
2020-21F 1,713 1,685 1.47 2,475 50 2,625 2,100 350 175 7 500-530
Dry Beans
2015-16 124 119 2.20 234 81 342 330 18 2 0 865
2016-17 129 118 2.11 249 91 355 335 19 1 0 885
2017-18 133 131 2.45 322 86 409 351 23 35 9 760
2018-19 143 137 2.49 341 98 464 348 37 80 21 815-845
2019-20 160 150 2.11 317 78 474 365 34 75 19 800-830
2020-21F 156 151 2.28 345 85 505 345 40 120 31 790-820

Pulses Monthly Report April, 2021
Chickpeas
2015-16 50 50 1.80 90 14 229 151 63 15 7 815
2016-17 62 44 1.86 82 27 129 108 20 1 1 1,000
2017-18 68 68 1.49 102 48 151 116 34 1 1 950
2018-19 179 176 1.77 311 51 376 147 129 100 36 450-480
2019-20 159 156 1.61 252 45 397 105 132 160 68 520-550
2020-21F 121 118 1.69 200 50 410 125 135 150 58 455-485
Source: Agriculture & Agri-food, Canada
USA 2019-20 Production Report- NASS
USA Pulses Updates:
NASS Planted Acreage-2019-20 ( Area in'000' Acres)
Pulses crop by state,2019 actual pulses acreage NASS
2020,projected acreage(NAAS)*
Actual acreage( NASS)*
% Difference(2019 to 2020)
ID Total Dry Peas 29000 25,000 29,000 0
MT Total Dry Peas 530000 495,000 450,000 -15
NE Dry Pea 31000 28000 36000 16
ND Total Dry Peas 425000 325000 325000 -23
SD Total Dry Peas 16000 11000 12000 -25
WA Total Dry Peas 72000 87000 95000 32
Total Dry Pea/AWP Ac. ** 1103000 971000 947000 -14
ID Total Lentils 34000 32000 32000 -6
MT Total Lentils 295000 31500 330,000 12
ND Total Lentils 95000 85,000 85000 -11
WA Total Lentils 62000 42000 45000 -27
Total Lentil Ac 486000 474,000 492,000 1
ID Small Chickpea 20,000 12000 8000 -60
ID Large Chickpea 68000 50000 65000 -4
ID Total Chickpea 88000 62000 74000 -16
MT Small Chickpea 51000 56000 41000 -20
MT Large Chickpea 148000 83000 70000 -43
MT Total Chickpea 199000 139000 111000 -44
WA Small Chickpea 25000 22000 22000 -12
WA Large Chickpea 85000 54000 68000 -20
WA Total Chickpea 110000 76000 90000 -18
ND Total Chickpea 41000 17000 20000 -51
CA Total Chickpea 13400 12000 10000 -25

Pulses Monthly Report April, 2021
Total Chickpea Ac. 451400 306000 305000 -32
Total Pulse (CSP) Ac*** 2040400 1751000 1744000 -15
Updated on 31st August-2020 , *As reported by growers.
**Beginning in 2019, total pea projections include Austrian winter peas and wrinkled seed peas.
***Dry peas, lentils, & chickpeas Source: USA Dry Pea& Lentil Council
Disclaimer
The information and opinions contained in the document have been compiled from sources believed to be reliable. The company does not warrant its accuracy, completeness and correctness. Use of data and information contained in this report is at your own risk. This document is not, and should not be construed as, an offer to sell or solicitation to buy any commodities. This document may not be reproduced, distributed or published, in whole or in part, by any recipient hereof for any purpose without prior permission from the Company, IASL and its affiliates and/or their officers, directors and employees may have positions in any commodities mentioned in this document (or in any related investment) and may from time to time add to or dispose of any such commodities (or investment).Please see the detailed disclaimer at http://www.agriwatch.com/Disclaimer.php © 2021 Indian Agribusiness Systems Ltd.


![Practicum 5, Spring 2015 Selective pulses: long pw90s ...€¦ · Selective pulses: long pw90s, presaturation and shaped pulses ! ... experiment"![4] ... Figure'18! [1]) ...](https://static.fdocuments.in/doc/165x107/5ac559387f8b9aa0518df036/practicum-5-spring-2015-selective-pulses-long-pw90s-selective-pulses-long.jpg)