Pulse of the industry - Home - MedTech · 2015-10-21 · Source: Ernst & Young, Capital IQ and...
27
The MedTech Conference October 2015 Pulse of the industry Medical technology report 2015
Transcript of Pulse of the industry - Home - MedTech · 2015-10-21 · Source: Ernst & Young, Capital IQ and...
The MedTech ConferenceOctober 2015
Pulse ofthe industry
Medical technology report 2015
Page 2 Pulse of the industry| Medical technology report 2015
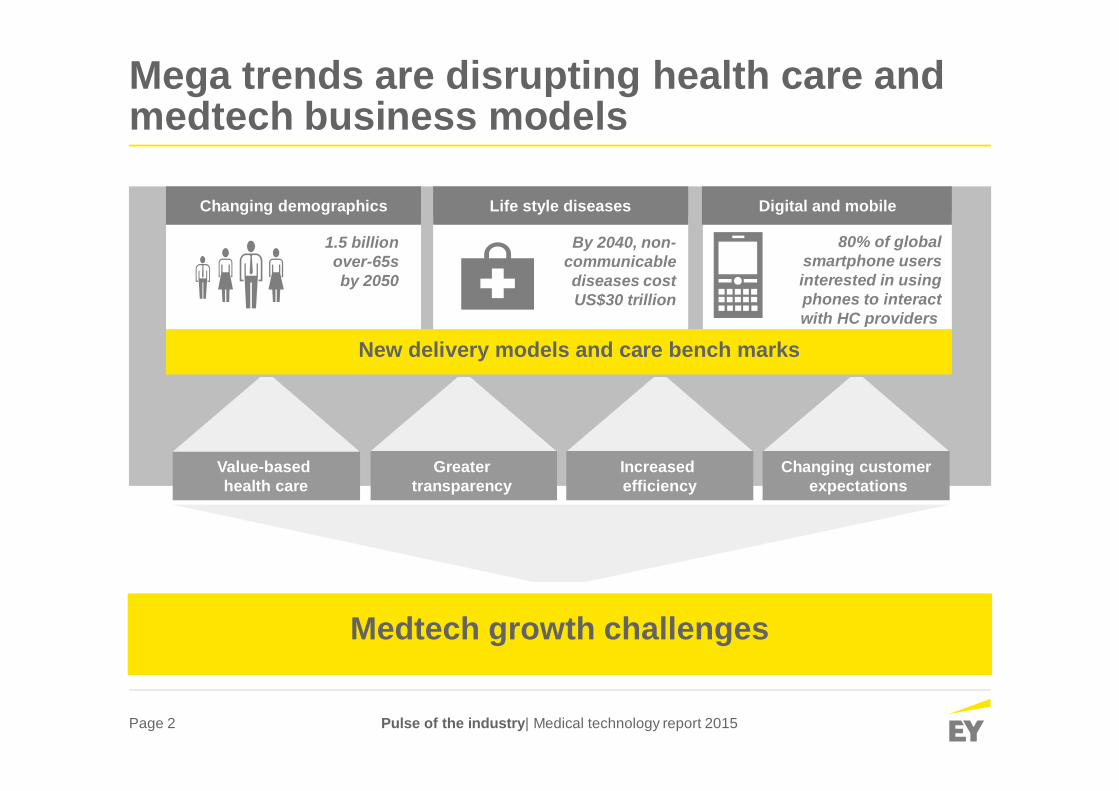
Mega trends are disrupting health care andmedtech business models
Value-basedhealth care
1.5 billionover-65sby 2050
By 2040, non-communicablediseases costUS$30 trillion
Greatertransparency
Changing customerexpectations
Increasedefficiency
► New delivery models and care bench marks
Medtech growth challenges
Changing demographics Life style diseases Digital and mobile
80% of globalsmartphone usersinterested in usingphones to interactwith HC providers

Page 3 Pulse of the industry| Medical technology report 2015
The pace of change is accelerating…
5yearsago
Today3-5
yearsfromnow
Debate and uncertaintyabout move to value
Most people had neverheard of “big data”
Digital and mobiletechnologies werenovelties
Data opacity is the norm
Sweeping health carereforms balance costand access
Growing number ofanalytics initiatives
Digital and mobile helpengage patient
Transparency is the newbuzz word
New payment, financingmodels enable access
Analytics drive deviceusage, Dx priorities
Shift from engagementto outcomes
Trust a source ofcompetitive advantage

Page 4 Pulse of the industry| Medical technology report 2015
…but medtech revenue growth is not.
Source: EY, Capital IQ and company filings.
$-
$50
$100
$150
$200
$250
$300
$350
2007 2008 2009 2010 2011 2012 2013 2014
US$b
Non Conglomerate Conglomerate
US and European revenue growth, 2007-14
2%4%2%1%2%5%11%

Page 5 Pulse of the industry| Medical technology report 2015
Looking for growthPulse of the industry

Page 6 Pulse of the industry| Medical technology report 2015
Storm clouds are emerging…
►A new normal of single-digit top & bottom line growth
►Dwindling interest from a shrinking venture capitalcommunity
►Eroding early-stage venture capital threatens thefuture of medtech’s innovation ecosystem
► Innovation capital drops

Page 7 Pulse of the industry| Medical technology report 2015
…but there are reasons for optimism.
►Smaller medtechs deliver stronger performance
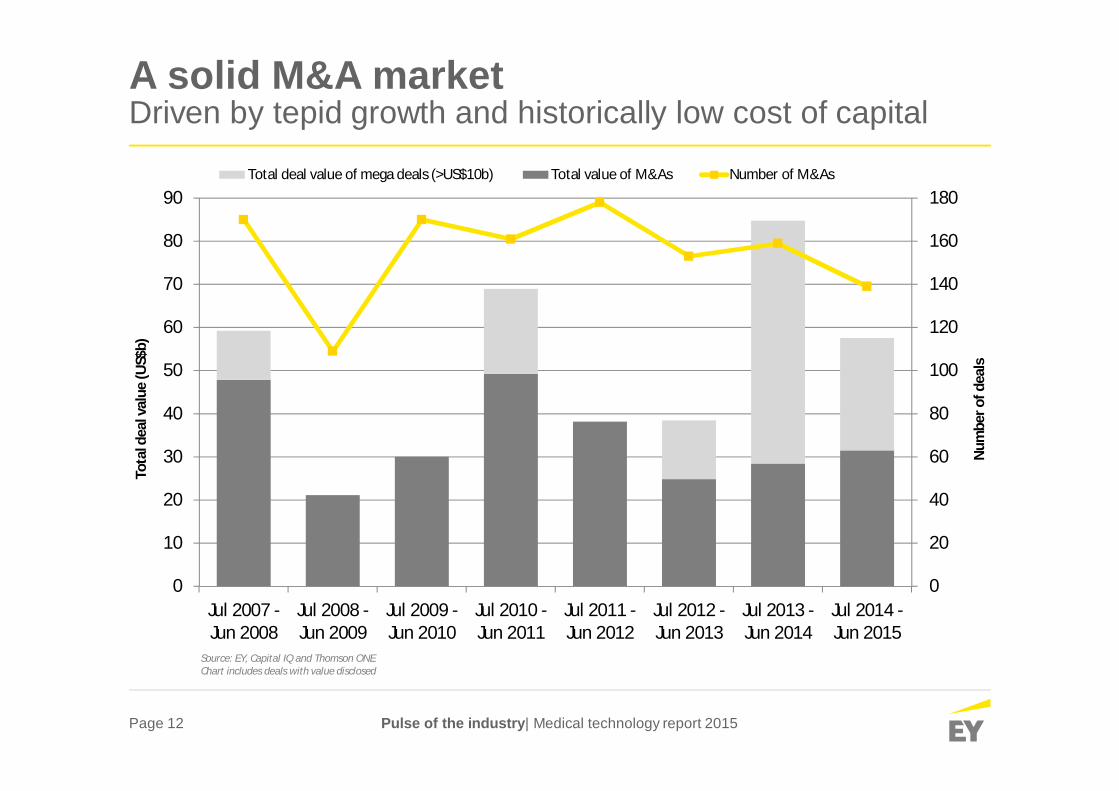
►Booming M&A market: Result of tepid growth &historically low cost capital
►A blockbuster year in financing: IPOs & debtofferings deliver all-time highs
►R&D investment rises for 5th straight year while cashreturned to shareholders decreases
►Medtechs once again outperform the broader publicmarkets

Page 8 Pulse of the industry| Medical technology report 2015
0
250
500
750
2013 2014
Market cap (US$b) +21%
Looking for growthUS and European pure-play performance – 2014
0
5
10
15
2013 2014
R&D expense (US$b) +6%
0
50
100
150
200
2013 2014
Revenues (US$b) +5%
0
5
10
15
20
2013 2014
Net income(US$b) +4%
Source: Ernst & Young, Capital IQ and company financial statement data.

Page 9 Pulse of the industry| Medical technology report 2015
A blockbuster year for US & European IPOs43 medtechs raised US$2.3 billion
0
10
20
30
40
50
0.0
0.5
1.0
1.5
2.0
2.5
Jul 2014 -Jun 2015
Jul 2013 -Jun 2014
Jul 2012 -Jun 2013
Jul 2011 -Jun 2012
Jul 2010 -Jun 2011
Jul 2009 -Jun 2010
Jul 2008 -Jun 2009
Jul 2007 -Jun 2008
Jul 2006 -Jun 2007
Jul 2005 -Jun 2006
Jul 2004 -Jun 2005
Jul 2003 -Jun 2004
Jul 2002 -Jun 2003
Jul 2001 -Jun 2002
Jul 2000 -Jun 2001
Num
bero
fdea
ls
Capi
talr
aise
din
IPO
s(U
S$b)
Capital raised Number of deals
Source: EY, Capital IQ, BioCenutry and VentureSource.
Page 10 Pulse of the industry| Medical technology report 2015
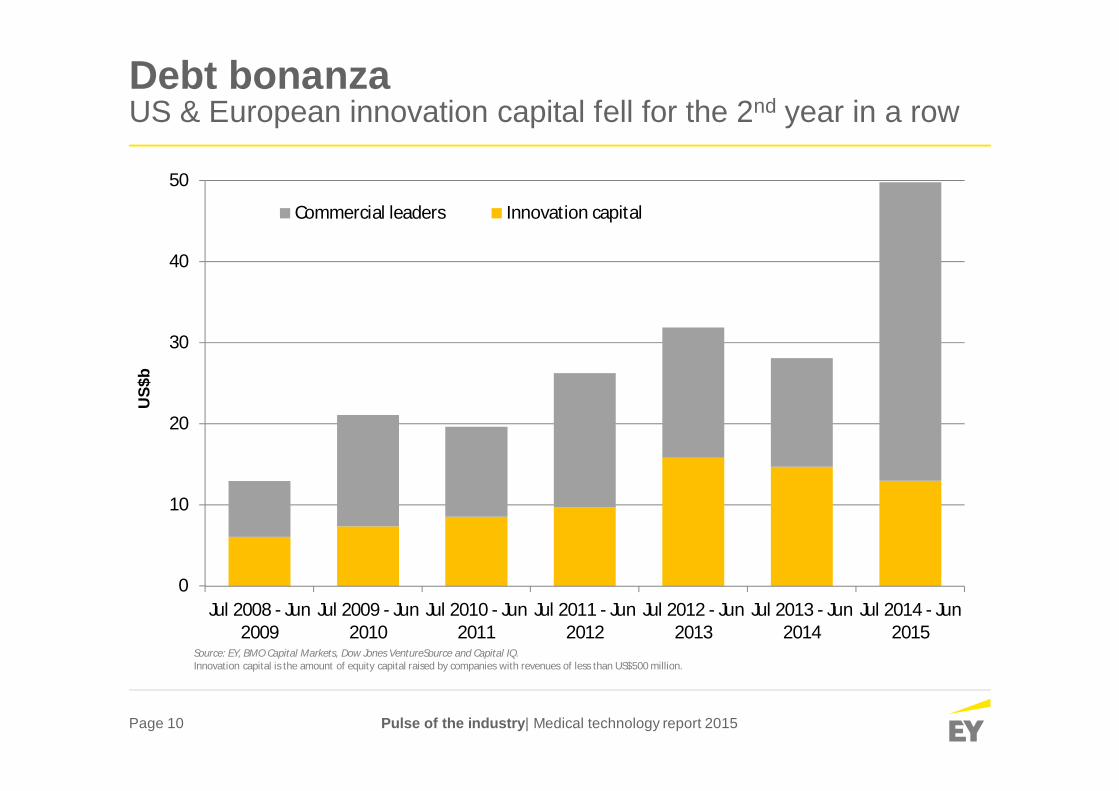
Debt bonanzaUS & European innovation capital fell for the 2nd year in a row
0
10
20
30
40
50
Jul 2008 - Jun2009
Jul 2009 - Jun2010
Jul 2010 - Jun2011
Jul 2011 - Jun2012
Jul 2012 - Jun2013
Jul 2013 - Jun2014
Jul 2014 - Jun2015
Commercial leaders Innovation capital
US$
b
Source: EY, BMO Capital Markets, Dow Jones VentureSource and Capital IQ.Innovation capital is the amount of equity capital raised by companies with revenues of less than US$500 million.
Page 11 Pulse of the industry| Medical technology report 2015
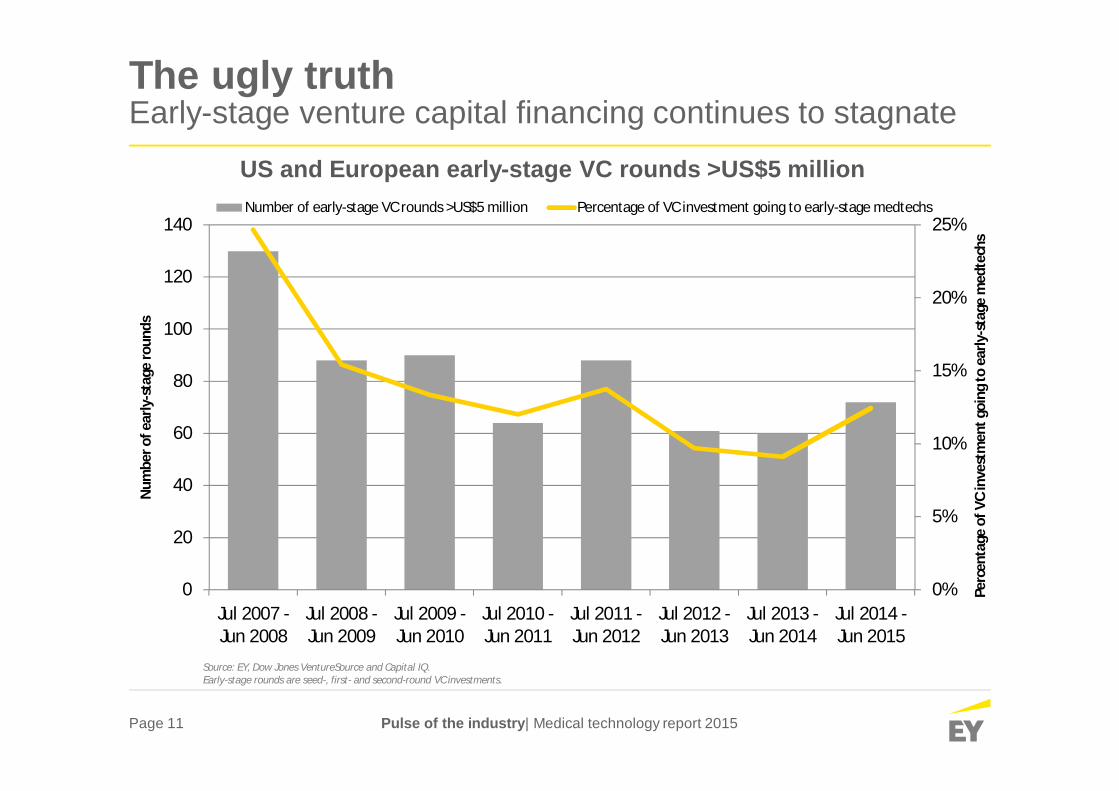
The ugly truthEarly-stage venture capital financing continues to stagnate
0%
5%
10%
15%
20%
25%
0
20
40
60
80
100
120
140
Jul 2007 -Jun 2008
Jul 2008 -Jun 2009
Jul 2009 -Jun 2010
Jul 2010 -Jun 2011
Jul 2011 -Jun 2012
Jul 2012 -Jun 2013
Jul 2013 -Jun 2014
Jul 2014 -Jun 2015
Perc
enta
geof
VCin
vest
men
tgoi
ngto
early
-sta
gem
edte
chs
Num
bero
fear
ly-s
tage
roun
ds
Number of early-stage VC rounds >US$5 million Percentage of VC investment going to early-stage medtechs
Source: EY, Dow Jones VentureSource and Capital IQ.Early-stage rounds are seed-, first- and second-round VC investments.
US and European early-stage VC rounds >US$5 million
Page 12 Pulse of the industry| Medical technology report 2015
A solid M&A marketDriven by tepid growth and historically low cost of capital
0
20
40
60
80
100
120
140
160
180
0
10
20
30
40
50
60
70
80
90
Jul 2007 -Jun 2008
Jul 2008 -Jun 2009
Jul 2009 -Jun 2010
Jul 2010 -Jun 2011
Jul 2011 -Jun 2012
Jul 2012 -Jun 2013
Jul 2013 -Jun 2014
Jul 2014 -Jun 2015
Num
bero
fdea
ls
Tota
ldea
lval
ue(U
S$b)
Total deal value of mega deals (>US$10b) Total value of M&As Number of M&As
Source: EY, Capital IQ and Thomson ONEChart includes deals with value disclosed

Page 13 Pulse of the industry| Medical technology report 2015
The capital allocation balancing actHow US & European medtechs have deployed their cash
0
5
10
15
20
25
30
35
40
2009 2010 2011 2012 2013 2014
Cash acquisitions Cash returned to shareholders R&D expenses
Annu
alsp
end
(US$
b)
Data shown for US and European public pure-play companies for which data were publicly disclosed. Cash returned to shareholders includes total dividends paid and stock repurchased.Source: EY, Capital IQ and Thomson ONE.

Differentiating differently

Page 15
CommoditizationHow does it play out in medtech?
Shifting customer perception
Lower barriers to market entry
Full-on price competition
► Move downstream or upstream► Create stickiness by rebranding
Strategies against commoditization

Page 16
What do medtech purchasers value?
Procurement► Hospital managers and administrators — not physicians — are key influencers► Centralized procurement models
Research and development► Real-world data, beyond-the-product services important to purchasers► Iterative innovations matter less
Contracting models► Value-based purchasing, pay-for-performance are more important► Simple cost-cutting is less important
Pharmacoeconomic outcomes► Total cost of care the most important outcome► Reduced hospital stays, improved surgical efficiency less important

Page 17
What’s on medtech purchasers’ minds?Pressure points are shifting
44%
41%
37%
33%
22%
37%40%
38%
27%
12%
Cost-cutting Cost ofupgrading/maintaining IT
systems
High-end medicaltechnology costs (non-
imaging)
Rising drug costs Imaging costs
Today In three years
21%
34%
Healthcare reforminitiatives (e.g. value-based
purchasing, pay-for-performance)
Declining: simple cost-cutting Increasing: value/outcomes
Source: EY Hospital survey 2014.
Page 18
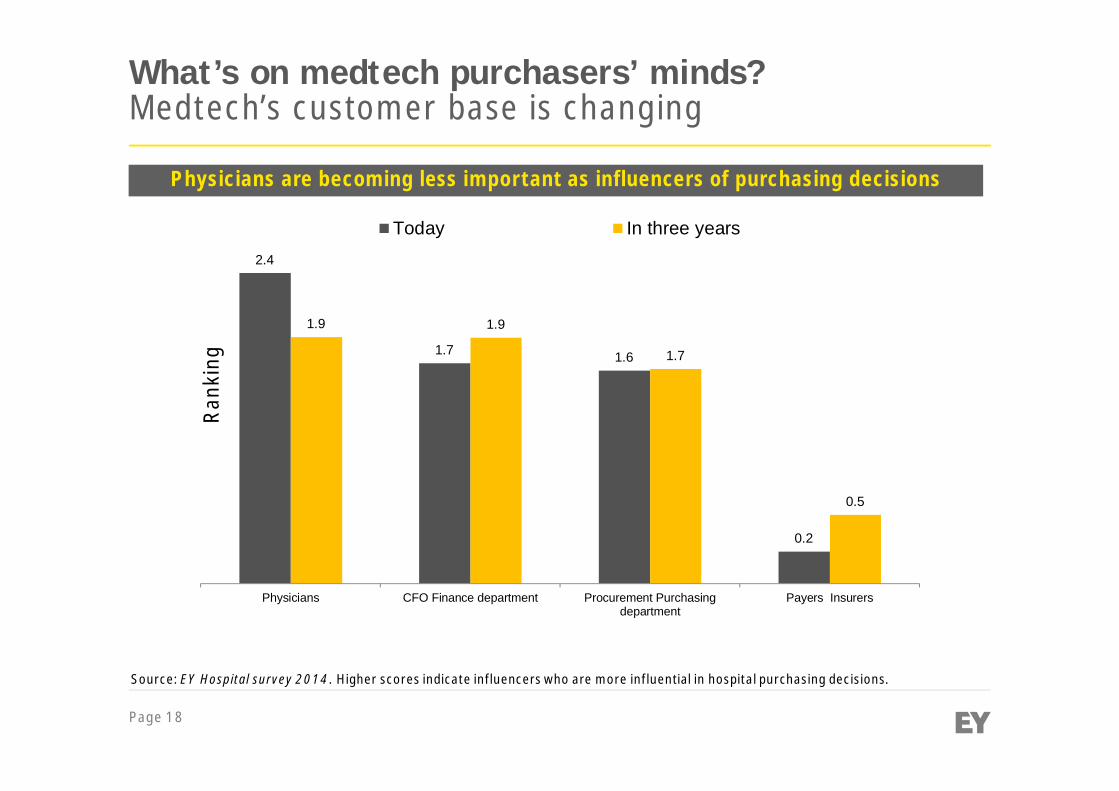
What’s on medtech purchasers’ minds?Medtech’s customer base is changing
Physicians are becoming less important as influencers of purchasing decisions
2.4
1.7 1.6
0.2
1.9 1.9
1.7
0.5
Physicians CFO Finance department Procurement Purchasingdepartment
Payers Insurers
Today In three yearsR
anki
ng
Source: EY Hospital survey 2014. Higher scores indicate influencers who are more influential in hospital purchasing decisions.

Page 19
What’s on medtech purchasers’ minds?The old rules count for less
Priceremainsthe topfactor
Old ways of differentiationare losing relevance
55%
32%
22%27%
22%18%
Physician preferencefor specific device
User-friendly design Training in use
Today In three years
51%
27%31%
6%
62%
35% 35%
25%
Data demonstratingclinical outcomes
Data demonstratingvalue
“Beyond the product”services (e.g. patient
support)
Risk-sharingagreement
Differentiation will have to bebased on data and value
Price of device
77% 77%
Source: EY Hospital survey 2014.

Page 20
Implications for medtechNew bases for competition
Achieve superior outcomes via technological advances► Buyers care less about iterative innovations► New product R&D can catalyze new standards of care
Increase scope through services and solutions► Medtechs can “own” more of the bundle► Solutions must focus on health care buyers’ needs
Increase scope by adding product offerings► End-to-end solutions have an edge in value-driven care► Opportunity for contracts around total cost of care
Take costs out of the health care system► Demonstrate that products result in cost offsets that
reduce total cost of care
2
1
3
4

Page 21
Achieve superior outcomes via technologicaladvances1
Look for areas where R&D can catalyze new care standards
STRATEGY 1:Traditional medtech innovation
► Highly specialized, sophisticated devices (e.g.,EndoChoice)
► Superior outcomes
► Novel approaches to unmet medical needs can appeal topayers

Page 22
Achieve superior outcomes via technologicaladvances1
Look for areas where R&D can catalyze new care standards
STRATEGY 2:Leveraging the internet of things
► Patient-empowering, information-leveraging (PI)technology
► Regulator-approved products that can be bought byconsumers (e.g., AliveCor)
► Change care delivery paradigm

Page 23
Increase scope through services andsolutions2
As bundled payments become increasingly common in health care,companies can try to own more of the bundle
► Successful components:► Customer-centric► Focused on partnerships – not transactions► Emphasis on improving patient outcomes
► May require new capabilities or technologies► e.g., data analytics, remote monitoring, etc.
► Examples:► Philips/Georgia Regents Medical Center► Medtronic/Diabeter/Cardiocom► Fresenius/Several acquisitions in the provider space

Page 24
Increase scope by adding product offerings3Companies that offer end-to-end solutions may have an edge in
value-driven health care settings
STRATEGY 1:Create scope in a disease area
► Example: Zimmer/Biomet
STRATEGY 2:Create scope in multiple disease areas
► Example: Medtronic/Covidien

Page 25
Take costs out of the health care system4If commoditization is a fait accompli… recognize that medtechs can
provide value with products that take costs out of the system
STRATEGY:Reduce cost of production &pass savings on to customers
► Engineer simpler, lower-tech devices► Manufacture more cheaply
► Example: Smith & Nephew’s Syncera pilot

Page 26
Moving forwardKey questions for medtech companies
How do you think about your contracting and commercialcapabilities?
How do you allocate your R&D spending to create products that willhave value in the marketplace?
How can you boost your data/analytics capabilities to better provevalue to health care buyers?
How do you develop truly customer-centric solutions?
How do you create a brand that extends beyond the product?

Page 27 Pulse of the industry| Medical technology report 2015
Thank you and stay tuned!
ey.com/vitalsignsey.com/medtech http://ow.ly/NTufL