
Published Strategic Communications & Media...
86
Transcript of Published Strategic Communications & Media...


Information and Communication Technology Agency of Sri LankaAll rights reserved. No parts of this document may be reproduced or
transmitted in any form or by any meanswithout prior written permission from ICTA.
PublishedStrategic Communications & Media Unit
Information and Communication Technology Agency of Sri Lanka#160/24, Kirimandala Mawatha, Colombo 05, Sri Lanka.
Tel.: +94 11 2369099, e-mail: [email protected], Web: www.icta.lk
NATIONAL ICT WORKFORCE SURVEY - 2013
2

Positive domestic developments in post-conflict era and gradual recovery of the global economic situa-tion have created conducive environment for growth of the ICT workforce. As a result, the overall workforce has grown from 50,159 in 2010 to 75,107 in 2013–a rise of 50% at compound annual growth rate (CAGR) of 14.4%. The projection figure of 82,854 for 2014 suggests that this mo-mentum is likely to continue in the future also. Respective contributions by four subsectors to the total workforce 2013 are 40.8% from ICT companies, 47.1% from non-ICT private sector users, 7.8% from government organi-zations and 4.2% from BPO companies.
The profile of ICT workforce has undergone some changes since the last workforce survey. The program-ming/software engineering category still has the highest share among job categories but it has reduced to 21% in 2013 from 26% in 2009. However, its share remains as high as 36.7% in ICT companies followed by software quality assurance (16%), jointly occupying more than half of the workforce in ICT companies. The most important job categories for non-ICT companies in private sector are systems and network administration (19.7%), data- base administration and development (17.9%), and tech-nical support (15.3%).
The female participation of the workforce has im-proved from 21% in 2009 to 29.0% in 2013. BPO compa-nies have significantly contributed to improve the gender balance in ICT workforce. The gender composition with-out BPO companies drops down to 24.8%.
In 2013, the share of employees with a degree or above has increased up to 63%, an improvement in the qualifi-cations profile of the ICT workforce. The highest share of graduates is in ICT companies (70%) and in other sub sectors; it remains around 30-35%.
Demand for number of graduates in 2014 is 6246. Compared with the demand projection for 2010 in the last survey, this represents a 57% increase, implying a 16.3% of CAGR. The respective shares of demand origi-nated from ICT companies, non-ICT companies, govern-ment and BPO companies are 41.5%, 38.5%, 12.1% and 7.9%.
The survey reported a rise in the total number of grad-uates supplied from training organizations from 5610 in 2010 to 6611 in 2013. This implies a 5.6 % CAGR. The survey further shows that in all sub sectors, Bachelor’s degree has become the standard entry level qualification for recruitment in many job categories.
NATIONAL ICT WORKFORCE SURVEY - 2013
NATIONAL ICT WORKFORCE SURVEY - 2013
3

Skills offered by training courses are highly import-ant as they determine the quality of the workforce. Ac-cording to analysis of skills in demand, system analysis and programming are the top priority skills demand-ed by employers. Interestingly, this is followed by cre-ative thinking skills and team working which are two soft skills. This shows high value placed by employers on soft skills even above certain core skills. Analysis of skills taught by training courses at different levels suggests that closely similar profiles of essential skills are taught in all types of courses whereas some varia-tion could be identified in the case of complementary skills taught in different courses.
Demand and supply projections for 2014 indicate a situation of short supply of graduates. The magni-tude of the gap is 458. This can be considered more of a result due to boost in the demand for workforce than due to any factor affecting the growth in supply.
A mismatch of skills in demand and supply can be identified in all three categories of skills; core, soft and technical skills. Mismatch implies the existence of less-supplied skills in demand and less-demand-ed skills in supply. Particularly, high un-met demand from employers for soft skills in job seekers and exist-ing employees deserve special attention.
Private sector companies in ICT, non-ICT and BPO sub sectors offer better salaries than government or-ganization nearly in all job categories. As far as pri-vate sector companies are concerned, comparatively better salaries are offered by ICT companies for all job categories. Private sector companies also offer more contrasting salary hikes for employees with high experience that is more pronounced in the case of demanding job categories. The most demanding job categories, as indicated by higher level of remunera-tion, vary among different sub sectors.
NATIONAL ICT WORKFORCE SURVEY - 2013
4

Several IT, non-IT, BPO and government organizations, IT training institutes and individuals contributed, in numerous ways, in conducting this fourth successive National ICT Workforce Survey. We gratefully acknowledge all of them for their valuable contributions, commitment and kind co-operation.
In particular we are grateful to Mr. Lalith Weeratunga, Secretary to His Excellency the Presi-dent, for his proficient guidance; and encouraging the respondents to furnish timely and accu-rate information for the survey.
We express our sincere gratitude to Mr. Reshan Dewapura - Chief Executive Officer, ICTA, and Mr. Jayantha Fernando, Program Director/Legal Advisor for offering the opportunity for undertaking this study and providing overall leadership. Mr. Fayaz Hudah – Programme Head, ICTA and Mr. Sachindra Samararatne – Project Development Executive & Business Ana-lyst, ICTA are acknowledged for their valuable insights regarding the ICT sector.
A special note of thanks is due to Mr. Jagath Seneviratne - Programme Head (Monitoring & Evaluation), ICTA for his unstinted professional support, expert guidance and kind cooper-ation, throughout the study. Under his close supervision, Monitoring & Evaluation team facili-tated all activities of the survey.
Workforce Survey Consultant TeamMG Consultants (Pvt.) Ltd.
NATIONAL ICT WORKFORCE SURVEY - 2013
NATIONAL ICT WORKFORCE SURVEY - 2013
5

NATIONAL ICT WORKFORCE SURVEY - 2013
6

EXECUTIVE SUMMARY 3ACKNOWLEDGEMENTS 5TABLE OF CONTENTS 6LIST OF ACRONYMS 10LIST OF FIGURES 11LIST OF TABLES 12
1. INTRODUCTION 141.1 Aim and Objectives 171.2 Definitions of Terminology 171.3 Overview of the Methodology 181.4 Organization of the Report 18
2. AN OVERVIEW OF THE ICT SECTOR AND THE ICT WORKFORCE IN SRI LANKA 202.1 Key Players in the ICT Sector 212.1.1 Suppliers of ICT Products (ICT Companies) 222.1.2. ICT Users 232.1.3. IT enabled Services (ITeS; BPO Companies) 252.1.4 ICT Training Organizations 272.2 Trends Highlighted by the Previous ICT Workforce Surveys: 2004-2009 28
3. ICT WORKFORCE: GROWTH AND THE PROFILE 323.1 Overall Growth of the ICT Workforce 333.2 Growth in the Workforce by Sub-Sectors 343.3 ICT Workforce by Job Categories 363.4 Non-ICT Workforce in BPOs 373.5 Profile of ICT Workforce: Gender, Qualifications and Experience 39
NATIONAL ICT WORKFORCE SURVEY - 2013
NATIONAL ICT WORKFORCE SURVEY - 2013
7

3.5.1 Gender Composition of Workforce 403.5.2 Qualifications Profile of Workforce 413.5.3 Experience of Workforce 433.5.4 Attrition of the Workforce 44
4. DEMAND FOR THE ICT WORKFORCE 464.1 Demand for Number of Graduates 474.2 Demand for Skills 474.3 Demand for Workforce by Qualifications: Entry Level Qualifications 49
5. SUPPLY OF THE ICT WORKFORCE 525.1 Overall Supply of the ICT Graduates 535.2 Supply of the ICT Workforce by Levels of Qualification 545.3 Supply of Major Skills 555.4 Strength and Quality of Training Staff 575.4.1 Qualifications of Staff 575.4.2 Experience of staff 585.4.3 Staff Engagement: full-time and part-time 59
6. DEMAND-SUPPLY GAP IN THE ICT WORKFORCE 626.1. Gap between Demand and Supply for Graduates 636.2 Gap between Demand and Supply of Skills 64
7. REMUNERATION FOR THE ICT WORKFORCE 687.1 Remuneration by sub sectors 697.2 Remuneration by Job Categories and Experience 69
NATIONAL ICT WORKFORCE SURVEY - 2013
8

8. CONCLUSIONS 77
A. APPENDIX 1 – SURVEY METHODOLOGY 78A.1. Sample Frame Development and Sample Selection 78A.2. Design of the Questionnaires 81A.3 Data Collection, Field Monitoring and Quality Assurance 81A.4. Data Processing and Analysis 82A.5. Limitations of the Survey 83A.6. Recommendations for Future Improvements 84
NATIONAL ICT WORKFORCE SURVEY - 2013
NATIONAL ICT WORKFORCE SURVEY - 2013
9

ACTOS Association of Computer Training Organization in Sri LankaBOI Board of InvestmentBPO Business Process OutsourcingCAGR Compound Annual Growth RateCEO Chief Executive Officer FAO Finance and Accounting OutsourcingGLSI Global Service Location IndexICT Information and Communication TechnologyICTA Information and Communication Technology Agency of Sri LankaITeS IT-enabled servicesKPO Knowledge Process OutsourcingLGN Lanka Government NetworkLPO Legal Process OutsourcingMIS Management Information SystemNA Not ApplicableNOA National Outsourcing AgencyPhD Doctor of PhilosophyPG PostgraduateSLICTA Sri Lanka Information and Communication Technology AssociationSLASI Sri Lanka Association of Software IndustrySLASSCOM Sri Lanka Association of Software and Service CompaniesSLT Sri Lanka TelecomToT Train the TrainersTVEC Tertiary and Vocational Education CommissionUK United KingdomUS United StatesUSAID United States Agency for International Development
NATIONAL ICT WORKFORCE SURVEY - 2013
10

Figure 3.1: Growth of ICT Workforce Figure 3.2: Growth of ICT Workforce by sub sectors Figure 3.3: Profile of ICT workforce by job categories Figure 3.4: Shares of job categories in sub sectors Figure 3.5: Growth of non-ICT workforce of BPOs Figure 3.6: Female participation in ICT workforce Figure 3.7: Profile of qualifications of ICT workforce Figure 3.8: Qualifications of ICT workforce by sub sector Figure 3.9: Experience profile of ICT workforce Figure 3.10: Experience of ICT workforce by sub sectors Figure 4.1: Demand for graduates Figure 5.1: Supply of graduates Figure 5.2: Supply of graduates by level of qualifications Figure 5.3: Qualifications of training staff Figure 5.4: Experience of training staff Figure 5.5: Fulltime and part-time engagement of training staff Figure 6.1: Demand and supply gap of graduates
NATIONAL ICT WORKFORCE SURVEY - 2013
NATIONAL ICT WORKFORCE SURVEY - 2013
11

Table 2.1: Information Profile of ICT Companies in the Sample Table 2.2: Global recognition of Sri Lanka’s BPO industry Table 2.3: Information Profile of BPO Companies in the Sample Table 4.1: Skills in demand Table 4.2: Entry level qualifications for different job categories Table 5.1: Essential and complementary skills taught in different courses Table 6.1: Gaps in demand for and supply of skills Table 7.1: Compensation for ICT workforce in the government Table 7.2: Compensation for ICT workforce in ICT companies Table 7.3: Compensation for ICT workforce in non-ICT private companies Table 7.4: Compensation for non-ICT workforce in BPO companies Table A1: Information Sources for Developing the Sample Frame Table A2: Sample size Table A3: Questionnaires for Different Organization Categories
NATIONAL ICT WORKFORCE SURVEY - 2013
12

01
NATIONAL ICT WORKFORCE SURVEY - 2013
NATIONAL ICT WORKFORCE SURVEY - 2013
13

NATIONAL ICT WORKFORCE SURVEY - 2013
14
Since the first report appeared in 2004, the ICT Workforce Survey has firmly established its position as a vital source of information to all stakeholders in the ICT industry. It furnishes various stakeholders of the ICT industry with essential decision making information. It’s readership include suppliers and users of IT products and services, students and trainers, policy makers, development analysts and in-vestors on ICT ventures in Sri Lanka. It is published by the Information and Communication Technology Agency (ICTA) that implements ‘e-Sri Lanka’, the national ICT development initiative of Sri Lanka. The e-Sri Lanka aims to foster social integration, peace and economic growth of the nation through innova-tive application of information and communication technology. The anticipated development outcomes of e-Sri Lanka include: effective, citizen-centered, transparent government; empowerment of the rural poor, women and youth through increased and affordable access to information and communication tools; development of leadership and skills in ICT; employment creation through ICT industry and IT-en-abled services (ITeS); and, enhancing competitiveness of user industries and services.
To fulfil its mandate, ICTA implements following programmes under the e-Sri Lanka initiative
Re-engineering Government - This programme focuses on 3 main areas: i) Lanka Government Network (LGN), ii) Lanka Gate and iii) E-Services which will scale up, rollout and improve ac-cess to government e-services resulting in efficiency improvements in service delivery to citizens throughout the country
Common Enabling Environment and Integrated Communication - The aim of this component is to enhance and develop necessary laws and policy to enable improved usage of ICT in all sectors of the economy. It also implements strategic communication activities to communicate benefits of ICT to the citizens, effectively.
Telecenters & e-Society - This component aims to empower civil society through providing in-creased and affordable access to ICT and promoting relevant digital content and innovative ICT applications. In addition, telecenters will also be used to rolling out of e-Government services and high impact services/applications in collaboration with the private sector.
NATIONAL ICT WORKFORCE SURVEY - 2013
NATIONAL ICT WORKFORCE SURVEY - 2013
15

Improving IT/ITES sector competitiveness -This component aims to promote local ICT products and services to the global market and promote Sri Lanka as an attractive location for global invest-ment. The key activities under this component will include (i) de-velopment of skills certification program for IT/ITES; (ii) provision of industry statistics and information on industry needs; (iii) Train the Trainer (ToT) Program in selected certifications; and (iv) mar-keting and promotion of the industry.
The ICT Workforce Survey plays a pivotal role in planning and designing of all activities relating to the above programmes of e-Sri Lanka. Until the first national ICT workforce survey was carried out, the quantity and quality of information about the ICT workforce in Sri Lanka has been limited and fragmented. Sri Lanka ICT Association (SLICTA) initiated ICT Workforce Survey in 2004, with the cooperation of USAID.
In 2006, the second survey was implemented by SLICTA with the finan-cial support of USAID and technical/financial support of ICTA. The survey was conducted in 2009 for the third time enabling comparisons with the previous surveys. As a source of longitudinal information, it helps to iden-tify the nature of changes undergone by the ICT workforce over time.
ICT Workforce survey 2013 is a continuation of this worthy initiative aimed at fulfilling essential information needs of the ICT sector in Sri Lan-ka. The general scope of the survey covers the growth of the ICT workforce over time, its composition by major job categories, overall demand for and supply of the ICT workforce, jobs in demand, technical and soft skills required to perform different job categories and the state of the supply pipeline of IT professionals. It has been realized that the demand for sur-vey information is high among:
• Universities and other IT training institutions to improve their cur-ricula and courses by aligning them in line with the market require-ments,
• Students to make better course selections that will lead to employ-ment in the Industry,
• Potential investors to gain an idea about the availability of IT work-force that will make their investment decisions profitable and,
• Policy makers and donors to evaluate impacts of their development projects/programmes.
The government aims to reach new heights in ICT industry in Sri Lanka,
focusing on innovation, transformation, entrepreneurship and inclusion. It is expected that demand for and value of information from the ICT Work-force survey 2013 would increase further with the implementation of new initiatives towards this direction.
NATIONAL ICT WORKFORCE SURVEY - 2013
16

1.1 Aim and Objectives
The key objectives of the survey are: • Bridging the information gap between demand and supply of ICT
workforce by enhancing access to necessary information by all rele-vant stakeholders
• Gaining a better understanding of the strength and the composi-tion of IT workforce in Sri Lanka
• Assessing the demand from the industry against the flow of supply of skilled personnel
The survey intends to produce essential information for stakeholders concerned with ICT industry such as growth of employment opportunities, a profile of ICT workforce, demand and supply predictions for the coming year, types of skills needed to obtain IT jobs and, compensation to differ-ent job categories.
1.2 Definitions of Terminology
Following definitions and terminology are used in this report to present the survey findings. They are consistent with definitions used by previous rounds of ICT Workforce Surveys.
ICT worker: A person involved in producing ICT related output as his/her primary job function
BPO worker: A person employed in a IT-enabled services (ITeS) orga-nization whose main job function involve carrying out tasks out-sourced by other clients using IT services
IT job categories: These include fourteen categories that classify diverse range of IT job titles grouped according to key technical functions. It is a technical classification of job categories without considering the order of seniority or experience.
ICT job skills: These include a list of fifty three skills classified under core (20), soft (7) and technical (26) skills. These are the skills de-manded by employers and offered by training organizations in their training courses.
ICT companies: The sub sector comprised of business entities that of-fer hardware, software and a variety of other products such as net-working solutions and consultancy services.
Non-ICT companies: These include business entities that use ICT for supplying non-ICT goods and services to their customers/clients. They maintain own ICT staffs creating job opportunities for ICT workforce.
Government organizations: These include public sector organizations with in-house ICT staffs to offer services to their clients.
BPO companies: Business entities that offer IT enabled services (ITeS). They are widely known as business process outsourcing (BPO) companies that involve undertaking specific business operations contracted by large companies to a third-party service provider.
Training organizations: This include government and private training institutes that offer courses to students who wish to enter careers in ICT sector.
NATIONAL ICT WORKFORCE SURVEY - 2013
NATIONAL ICT WORKFORCE SURVEY - 2013
17

1.3 Overview of the Methodology
ICT Workforce Survey is a sample survey that provides estimates about ICT workforce in Sri Lanka. Target population of the survey was employers of ICT workforce. In addition to estimates about the workforce, it presents a profile of overall ICT workforce and major subsectors of it based on the analysis of sample data. It has used statistical procedures of random sam-pling to capture the diversity of players in the ICT industry. It is based on a sampling frame that has been progressively improved and updated in the every round of survey, gathering information from a variety of stakeholders of the industry. In addition, information from sources such as business di-rectories and web resources published by various organizations also were used to update the sampling frame. Given the variations found in ICT workforce, separate questionnaires have been developed to capture data from employers in different sub sectors. Data collection was done by inter-viewing heads of ICT divisions or human resource managers of respective organizations by the enumerators of the survey team. To ensure the ac-curacy and reliability of data, a strict quality checking procedure has been maintained throughout the process of data collection and processing.
ICT Workforce Survey is a periodic survey. Therefore, it offers a longitu-dinal information base that captures changes taken place in the workforce over time. To ensure the longitudinal validity of data, consistency of ques-tionnaires were maintained across different rounds of survey even though some modifications have been made to capture the emerging changes in the ICT workforce. The details of the survey methodology are presented in the Appendix 2 of the report.
1.4 Organization of the Report
The report begins with an overview of the ICT sector and the workforce. It is followed by a chapter that presents survey findings about size and growth of the workforce. A profile of workforce covering occupation in dif-ferent job categories, gender composition, qualifications and experience also is provided in this section. The next two chapters present projections of demand for and supply of ICT graduates. They cover aspects concern-ing demand and supply for different types of skills also. The subsequent chapter analyses the gaps in demand and supply. This includes an anal-ysis of mismatch in supply of skills relative to demand for them. In the penultimate chapter, survey findings on remuneration of the workforce are presented. An overall conclusion of the findings of the survey is presented in the final chapter of the report.
NATIONAL ICT WORKFORCE SURVEY - 2013
18

02
NATIONAL ICT WORKFORCE SURVEY - 2013
NATIONAL ICT WORKFORCE SURVEY - 2013
19

NATIONAL ICT WORKFORCE SURVEY - 2013
20

ICT sector has become a key driver of economic growth, generating a diverse range of benefits to the people of the country. ICT creates job opportunities for youth and women. It enhances universal access to information thereby fostering social inclusion and justice. It also helps the economy by increasing the efficiency of markets, connecting communities to global value chains, raising the productivity of economic activities and stimulating innovation. Re-alizing the potential of ICT sector to contribute the goals of sustainable development; Mahinda Chintana—the fore-most national policy statement and planning document of Sri Lanka—has given it a vital position in the country’s development agenda. Mahinda Chintana envisions a strategy of five key economic hubs to capitalize on the strategic geo-political location of the country, namely: naval hub, aviation hub, commercial hub, knowledge hub, and power and energy hub. The ICT sector necessarily has to play the central role in converting Sri Lanka into a knowledge hub. The role it has to play in achieving the hub status in other areas of interest also cannot be overemphasized. Overall, expectations that are placed upon the ICT sector for the future development of the nation are quite high.
2.1 Key Players in the ICT Sector
The ICT sector in Sri Lanka comprises a diverse range of actors that offer variety of products and services. They can broadly be categorised into:
• Suppliers of ICT products and services (ICT companies)• Suppliers of IT-enabled services (ITeS; BPO companies) • ICT training organizations
The first two categories are sometimes known as ‘IT-BPO’ sector by industry analysts.
However, ICT plays a large role in production and delivery of numerous other goods and services also. A large number of non-ICT companies and public sector organizations use IT facilities for offering goods and services to their customers/clients and they can be considered as ‘users’ of ICT products and services.
• UsersofICTproductsandservices - Private sector organizations (Non-ICT companies) - Government organizations
NATIONAL ICT WORKFORCE SURVEY - 2013
NATIONAL ICT WORKFORCE SURVEY - 2013
21

Both types of players–suppliers as well as users of ICT products–provide job opportunities for ICT workforce in Sri Lanka. Together, they offer a wide range of employment opportunities for skilled workforce trained on ICT thereby jointly constituting the sample frame for the ICT Workforce Survey. According to the findings of previous ICT Work-force Surveys, number of employees recruited by ICT, BPO and Non-ICT companies and government organizations in IT jobs has increased steadily from 15,000 in 2003 to 50,000 in 2010. This indicates the tremendous capacity of the ICT sector for creation of jobs for Sri Lankans. The mandate of e-Sri Lanka initiative covers addressing the needs of suppliers as well as users of ICT together with workforce employed by them. One of the key objectives of the pro-gramme is increasing employment opportunities and enhancing competitiveness of ICT industry through human resource development an capacity building interventions. A brief overview of major players of the ICT sector is useful here to understand the structure and composition of the industry.
2.1.1 Suppliers of ICT Products (ICT Companies)
ICT suppliers are comprised of business entities that offer a variety of hardware, software and networking solutions and other supportive services. The total number of business entities involved in this category is not known exactly and according to some estimates it could be high as over one thousand. However, a considerable number of small business entities are not registered with the government, industry related bodies or business directories. Therefore, information about such players is scarce and can be considered as a kind of ‘informal sub sector’ within the industry.
The number of ‘formal’ business entities that are registered with industry related bodies, government or busi-ness directories under specialized categories is much lower. Progressively updated sampling frame of ICT Workforce Surveys lists over three hundred such companies. They offer a diverse range of ICT products that cater needs of cus-tomers in Sri Lanka and abroad. Their clientele include large scale users of ICT products such as major companies, public sector organizations and educational institutes while some companies cater to retail market of hardware and software products also. An information profile on ICT companies developed out of data collected in ICTA Workforce Survey 2013 is given in Table 2.1.
NATIONAL ICT WORKFORCE SURVEY - 2013
22

Table 2.1: Information Profile of ICT Companies in the Sample
Major business operations
Software product development (75.8%)
IT consulting services (59.7%)
Software manufacturing (45.4%)
Software reselling (24.2%)
Hardware reselling (22.6%)
Market Local + Export (50%)
Local only (35%)
Export only (15%)
Major exporting countries USA, UK, Australia, Canada, Malaysia
Location All companies - head office located in the Western Pro ince Few companies with
offices in other provinces (Central and Southern Provinces are the main areas)
No reliable statistics on market value of products offered by ICT companies are available. One indicator of the per-formance of ICT suppliers is the growth of ICT workforce employed by business entities coming under this category. According to previous ICT Workforce Surveys, the workforce in ICT companies had grown from around 7,500 in 2003 to 22,000 in 2010, recording an impressive compound annual growth rate (CAGR) of 17%.
2.1.2. ICT Users
ICT users in Sri Lanka include a large number of private sector companies and public organizations. Growth re-corded in all sectors of the economy–agriculture, industry and services–has led to increase the number of business entities, their operational scale and customer/client bases of these organizations. Use of ICT has become widespread in all stages of production, delivery and marketing of outputs. As a result, usage of ICT products in the economy has grown over time. Many user organizations maintain an in-house ICT staff in addition to services obtained from spe-cialized ICT companies.
NATIONAL ICT WORKFORCE SURVEY - 2013
NATIONAL ICT WORKFORCE SURVEY - 2013
23

2 .1.2.1. Private Sector Users (Non-ICT companies)
A large number of companies in all major sectors in the economy use ICT facilities to supply goods and services to their customers. As a result, many user companies need the support of dedicated ICT staffs to maintain their in-house facilities thereby offering numerous job opportunities to skilled ICT workforce in the country. In addition, they regularly obtain services of ICT companies to establish new facilities or upgrade the existing ones, offering business opportunities for IT-BPO companies also. The ICT Workforce Survey has continuously covered a cross section of companies from major business sectors that have been identified as major users of ICT. This cross section includes companies in eight sub sectors of the economy, namely: apparels, finance-insurance-banking, agriculture, manufac-turing, shipping and freight forwarding, hotel services and tour operators, construction and architecture, and whole-sale and retail trade. Three previous ICT Workforce Surveys reported that ICT workforce in these companies has grown from 6,500 in 2003 to 23,000 in 2010 indicating a rapid increase in use of ICT in business operations by an ever increasing number of companies.
2.1.2.2. Government Organizations
Public sector organizations represent another important category of ICT users. They include organizations com-ing under the central government and provincial councils. The central government organizations include several line ministries and line agencies that are dedicated to different subjects. Line agencies include a number of departments and statutory bodies. There are number of public enterprises also. In addition, the central government has a network of regional administration bodies comprised of 25 district secretariats and 327 divisional secretariats. Besides the central government organizations are nine provincial councils, provincial ministries and line agencies coming under them. Hence the public sector organizations together constitute a major category of ICT users.
Nearly all government organizations use ICT facilities for their in-house operations at varied degrees of sophis-tication. A number of government organizations also offer services to citizens and business using ICT facilities at different levels including online services. The number of organizations that offer e-services is gradually increasing as e-governance programme of e-Sri Lanka initiative is facilitating this process. This programme has taken steps
NATIONAL ICT WORKFORCE SURVEY - 2013
24

to establish crucial infrastructure systems such as the Lanka Government Network, the Lanka Gate and the Lanka Government Cloud which is aimed at connecting all government institutions in one cohesive and dedicated network thereby enhancing the capacity of the government organizations to offer e-services. As these developments increase the usage of ICT facilities in government organizations, they become an important source of job opportunities for skilled ICT workforce in the country. Taking this fact in to consideration, the government has taken steps to strength-en the ICT cadre in public sector. One important step is establishing the Sri Lanka IT Service–a parallel public service in line with other services such as Sri Lanka Administration Service or Sri Lanka Scientific Service–in 2011. Employees who undertook IT related job functions in ministries and departments have been absorbed into this service based on their qualifications and experience. The ICT Workforce Survey has covered public sector ICT employees from the first survey in 2003. According to that the size of the ICT workforce in government organizations has increased from 1,500 in 2003 to 3,000 in 2010.
2.1.3. IT enabled Services (ITeS; BPO Companies)
IT enabled services (ITeS), widely known as business process outsourcing (BPO) companies, involves the con-tracting of specific business operations in supply chains of large companies to a third-party service provider. Such out-sourced operations include back office operations such as human resource management, finance and accounting as well as customer-related front office operations such as call centres. A variety of business opportunities have emerged in BPO sub sector that include finance and accounting outsourcing (FAO), legal process outsourcing (LPO) and other knowledge process outsourcing (KPO) operations. They involve both offshore as well as on-shore outsourcing. When-ever companies supply their services to overseas clients they earn foreign exchange for the country. BPO companies offer job opportunities to both ICT and non-ICT workforce.
BPO sub sector has emerged as an important source of foreign exchange to the country during the last few years. According to the Central Bank Report – 2012, Sri Lanka has earned over 600 million US$ from supply of IT and BPO services to overseas clients that recorded an impressive growth of 22.9 %. Sri Lanka has emerged as a leading outsourcing destination in the world during the recent years and AT Kearny’s report on country’s BPO industry has identified Sri Lanka as the ‘hidden gem’ in the global IT,BPO and KPO industry. Recognition of Sri Lanka’s position as
NATIONAL ICT WORKFORCE SURVEY - 2013
NATIONAL ICT WORKFORCE SURVEY - 2013
25

an outsourcing destination was marked by rankings and awards related to the global BPO industry (Table 2.2). Many established global companies, including some Fortune 500 companies, have initiated outsourcing operations in Sri Lanka. Industry analysts have assessed Sri Lanka’s strengths and identified quality workforce as an important factor that enhances Sri Lanka’s position as an outsourcing destination. For instance, Sri Lanka has the highest number of accountants qualified in British accounting system outside the Britain that hugely raises Sri Lanka’s potential as a financial and accounting outsourcing destination (FAO).
Table 2.2: Global recognition of Sri Lanka’s BPO industry
Type of Recognition (Award/Ranking) Organization Sri Lanka’s Position
Global Services Location Index (GSLI) – 2011 A T Kearny Sri Lanka ranked in 21st place
Gartner ranking of top 30 countries for offshore services:
2010-2011Gartner Inc. Sri Lanka raked among top 30
Top 100 outsourcing destinations- 2013 Tholons Colombo ranked in the 20th place
Outsourcing Destination of the Year AwardNational Outsourcing Agency
(NOA), UK
Sri Lanka awarded the prestigious ‘Outsourcing
Destination of the Year’ for 2013
BPO sub sector was not covered in the first two rounds of ICT Workforce Survey. However, considering its high growth potential, ICT Workforce Survey in 2010 surveyed both ICT and non-ICT workforces in BPO companies for the first time. According to that, BPO companies in Sri Lanka have employed 2,200 in ICT jobs and 13,700 in non-ICT jobs in 2010. Table 2.3 provides an information profile developed from data collected in the ICTA Workforce Survey.
NATIONAL ICT WORKFORCE SURVEY - 2013
26

Table 2.3: Information Profile of BPO Companies in the Sample
Major services offered
Accounting (44.4%)
Call centre (38.9%)
Transactions (33.3%)
Document management (27.8%)
Data research (27.8%)
Market
Onshore + Offshore (55.6%)
Onshore only (33.3%)
Offshore only (11.1%)
Types of business operations
Captive + Non-captive (55.6%)
Captive only (33.3%)
Non-captive only (11.1%)
2.1.4 ICT Training Organizations
ICT sector is essentially a knowledge-based industry and technical knowledge and other complementary skills are essential preconditions for employability and career success in ICT jobs. Hence, ICT training organizations are an important stakeholder in the industry, primarily as the supply source of ICT skills. In addition, they offer job oppor-tunities for skilled persons with advanced academic qualifications on ICT as trainers and researchers. ICT training institutes in Sri Lanka can be categorized into four major types of organizations:
NATIONAL ICT WORKFORCE SURVEY - 2013
NATIONAL ICT WORKFORCE SURVEY - 2013
27

• Government universities• Private degree awarding institutes • Government vocational and tertiary training institutes • Private non-degree awarding training institutes
Government universities are the largest source of supply of ICT graduates and post graduate scholars so far. A desk study based on university websites informed that 26 faculties in 15 universities offer 45 degree courses related to computer science and information technology. These programmes are supported by resources available in 29 departments and schools having staffs with expertise on ICT. In addition, some faculties and graduate schools offer post-graduate diplomas and masters’ courses. Few universities also offer diploma and certificate courses below the level of degree courses. The sampling frame also included 27 private degree awarding institutes. They offer large number of diploma and higher diploma courses that lead up to degree courses in the same institutes or others. These courses can be completed in Sri Lanka or in affiliated institutes abroad. Besides there is a wide network of govern-ment vocational and tertiary education institutes that offer courses leading to IT diplomas and certificates. The ICT Workforce Survey has covered the supply of ICT graduates in three previous surveys and figures indicate that supply of graduates into the workforce has doubled from 2,200 to 4,400 during the period of 2005-2010.
2.2 Trends Highlighted by the Previous ICT Workforce Surveys: 2004-2009
Previous ICT Workforce Surveys conducted in 2004, 2006 and 2009 recorded a steady growth in the overall work-force and in all sub categories of it. Beginning from 2003, the overall workforce has more than trebled in 2010 (from 15,000 to 50,000). This implies a compound annual growth rate (CAGR) of 18%. During the period from 2004-2006 growth rate remained around 25% which slowed down to 12.5% during the period from 2006-2009. During this period also, however, ICT workforce in BPO companies had grown at the rate of 17%. As far as the composition of workforce is concerned, ‘programming/software engineering’ has been the dominant job category employing about one fourth of the total workforce. Its position remained stable during the last two surveys while relative positions of other job categories changed over time. Among others, ‘technical support’ has emerged as an important job catego-ry. Position of job categories varied among types of employers (sub sectors) also.
NATIONAL ICT WORKFORCE SURVEY - 2013
28

First two surveys conducted in 2004 and 2006 reported negative balances in supply and demand, indicating a scarcity of skilled workforce. However, according to 2009 survey, situation seems to have improved, having overall supply of graduates exceeding the overall demand for them. Consecutive surveys have reported that share of gradu-ates in the total workforce have increased progressively from 2003 to 2009 indicating a gradual rise in the depth of knowledge of country’s ICT workforce. While some improvements in numbers of supply have been achieved, employ-ers appear to be concerned about the quality of the workforce in terms of skills in demand. Many respondents have identified the necessity of improving the complementary soft skills of ICT workers along with core knowledge and technical skills. Among others, soft skills such as communications skills, team working and creative thinking abilities were emphasized by the employers. Attrition rates reported by three workforce surveys have fluctuated significantly, rising from 6.6% in 2004 to 13% in 2006 and subsequently coming down to 7% in 2009.
Information about the situation of compensation to ICT workforce provided by the previous surveys has been limited. One reason was low response rates for questions asking salaries in the questionnaires. It provides only a very general picture about the compensation to ICT workforce. Overall, it appears that salaries to ICT workers are relatively better compared with other sectors in the economy. However, this cannot be generalized to ICT workforce in the public sector. Respondents have identified that a good compensation plan as the best possible strategy to retain the existing workforce.
NATIONAL ICT WORKFORCE SURVEY - 2013
NATIONAL ICT WORKFORCE SURVEY - 2013
29

NATIONAL ICT WORKFORCE SURVEY - 2013
30

03
NATIONAL ICT WORKFORCE SURVEY - 2013
NATIONAL ICT WORKFORCE SURVEY - 2013
31

NATIONAL ICT WORKFORCE SURVEY - 2013
32
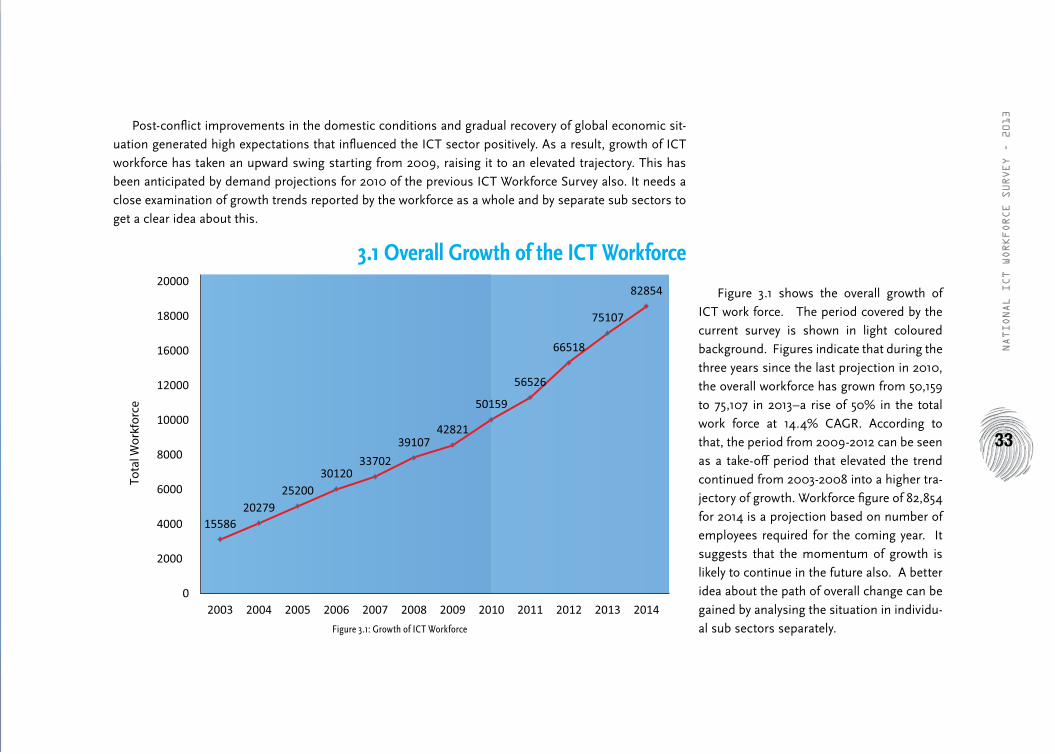
Post-conflict improvements in the domestic conditions and gradual recovery of global economic sit-uation generated high expectations that influenced the ICT sector positively. As a result, growth of ICT workforce has taken an upward swing starting from 2009, raising it to an elevated trajectory. This has been anticipated by demand projections for 2010 of the previous ICT Workforce Survey also. It needs a close examination of growth trends reported by the workforce as a whole and by separate sub sectors to get a clear idea about this.
3.1 Overall Growth of the ICT Workforce
Figure 3.1: Growth of ICT Workforce
Figure 3.1 shows the overall growth of ICT work force. The period covered by the current survey is shown in light coloured background. Figures indicate that during the three years since the last projection in 2010, the overall workforce has grown from 50,159 to 75,107 in 2013–a rise of 50% in the total work force at 14.4% CAGR. According to that, the period from 2009-2012 can be seen as a take-off period that elevated the trend continued from 2003-2008 into a higher tra-jectory of growth. Workforce figure of 82,854 for 2014 is a projection based on number of employees required for the coming year. It suggests that the momentum of growth is likely to continue in the future also. A better idea about the path of overall change can be gained by analysing the situation in individu-al sub sectors separately.
NATIONAL ICT WORKFORCE SURVEY - 2013
NATIONAL ICT WORKFORCE SURVEY - 2013
33
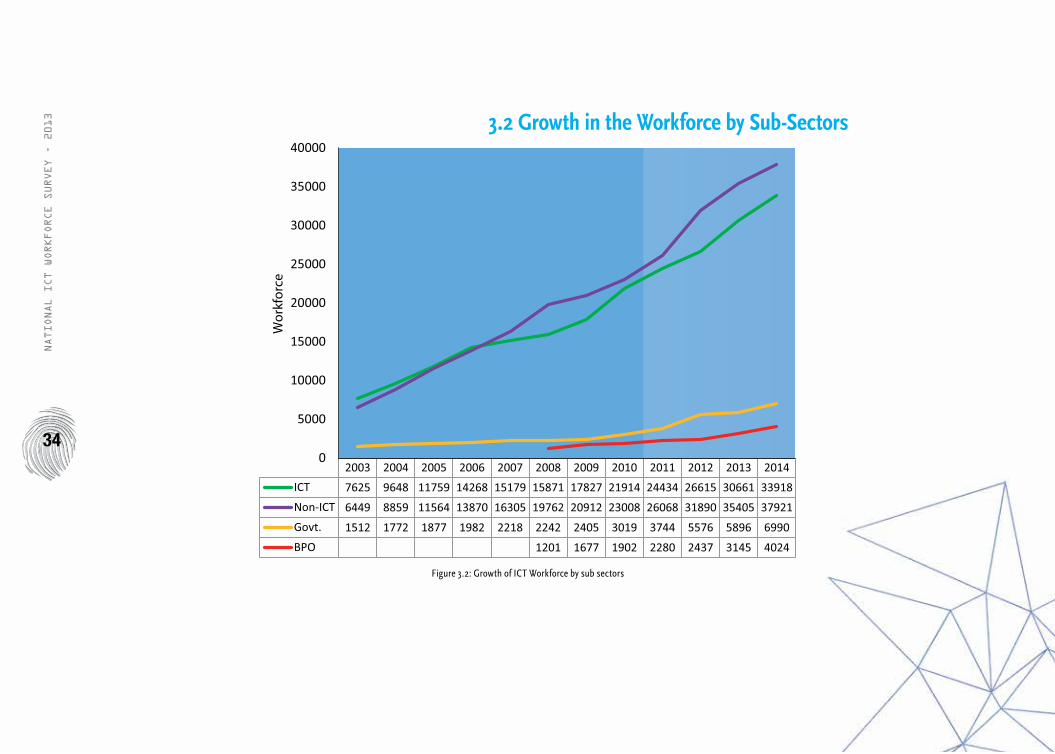
3.2 Growth in the Workforce by Sub-Sectors
Figure 3.2: Growth of ICT Workforce by sub sectors
NATIONAL ICT WORKFORCE SURVEY - 2013
34

Respective shares of total workforce in four subsectors in 2013 are 40.8% in ICT companies, 47.1% in non-ICT private sector users, 7.8% in government organizations and 4.2% in BPO companies. Ac-cording to Figure 3.2, overall growth in the workforce is spearheaded by the growth in workforce employed by private sector ICT users. Looking back from 2003 onwards, a stable growth in workforce can be observed in non-ICT private sector users. It slowed down for a while from 2008-2010, apparently due to unfavourable local and ex-ternal conditions, but pulled off since 2010 onwards back to the natu-ral path of acceleration–an encouraging sign from the perspective of overall progress of the economy. On the other hand, growth of work-force of ICT suppliers seems to pursuing a somewhat irregular path with fluctuations indicating a higher level of sensitivity to domestic and external shocks. This can be explained by the fact that workforce in ICT companies is concentrated in a single industry whereas the workforce in non-ICT private sector users is scattered over a diverse range of industries. Hence, growth in non-ICT companies is more resilient since losses in one sector offset by gains in another unless for a global economic downturn that affects all. Comparatively, being concentrated in a single industry, workforce of ICT suppliers is more susceptible to domestic and external shocks. It may result in high attrition, low recruitment and even layoffs when faced with perceived signs of shocks. Such a slowdown in growth can be observed during 2006-2008 that could be explained given the domestic and external conditions prevailed in that period. Since then, the growth of work-force in ICT companies shows a take-off in the period 2009-2011 and continuation thereafter at a high rate of acceleration.
Apart from two large employers of workforce–ICT companies and non-ICT private sector users–growth trends in workforces in gov-ernment organizations and BPOs have also been stable from 2009. Growth in government can be credited to favourable climate created to government policy, especially the initiatives taken by e-Sri Lanka to transform the system into e-governance. Some organizations have begun to offer e-services to clients and use of ICT in internal op-erations has also increased. As a result demand for ICT workforce has increased. Government organizations have responded using three strategies: recruitment of new cadre in places where major im-provements has come; streamlining the ICT cadre in ministries and department by establishing the Sri Lanka IT Service; and, internal allocation of graduate assistants into ICT related tasks. There has been a large periodic recruitment of graduates into the government in past several years. Even though many of them are still in Graduate Assistant ranks, some of them have internally been allocated to ICT related tasks.
NATIONAL ICT WORKFORCE SURVEY - 2013
NATIONAL ICT WORKFORCE SURVEY - 2013
35

Figure 3.3: Profile of ICT workforce by job categories
The profile of ICT workforce has undergone changes since the last workforce survey. The programming/software engineering category still has the highest share among job categories but it has reduced from 26% in 2009 to 21% in 2013. Technical support and systems/network administration categories that were the second and third categories earlier, still hold the same positions with equal shares of 12% each again with a decline from their shares in 2009. Da-tabase administration and development and software quality assurance are the next larg-est categories. IT research and development, solutions and technical architect, technical writing and digital media and animation are the job categories with the least shares in the workforce. However, this overall composition changes significantly in sub sectors.
3.3 ICT Workforce by Job Categories
NATIONAL ICT WORKFORCE SURVEY - 2013
36

3.4 Non-ICT Workforce in BPOs
Figure 3.4: Share of job categories in sub sectors
NATIONAL ICT WORKFORCE SURVEY - 2013
NATIONAL ICT WORKFORCE SURVEY - 2013
37

Figure 3.5 shows that the share of programming/soft-ware engineering category is as high as 36.7% followed by software quality assurance (16%) category, jointly occupying more than half of the workforce in ICT companies. These fig-ures correspond with the fact that 75% of ICT companies in the sample have reported software product development as one of their business operations. In the case of ICT users, shares of workforce occupied in the programming/software engineering category were 10% and 11% for non-ICT private sector companies and government organizations, respective-ly. The most important job categories for ICT users were data base administration and development, systems and network administration and technical support. Tasks undertaken by 21% of ICT workers in government could not be matched with any of the 14 categories and therefore listed under other cat-egory. Some respondents in the government organizations have suggested the necessity of identifying a different list of job categories for public sector ICT employees.
BPO companies have both ICT and non-ICT professionals in their workforce. Since the last survey in 2009, ICT Work-force Survey collects information about both categories of workforce in BPO companies. Figure 3.2 presents the growth pattern of non-ICT workforce in BPO companies from 2006. As in the case of ICT workforce, the last figure is a projec-tion based on workforce requirements identified by respon-dents for the coming year (2014). According to the figure, marked decline in the rate of growth of non-ICT employees
can be observed from 2010. This seems to be culmination of a trend observed from 2006 onwards. Since 2010, growth has been maintained at the same rate until 2013 and slight upward swing is indicated according to the demand projec-tions towards 2014. Taking together with the clear upward trend observed in ICT workforce in BPO companies (Figure 3.2) and growing status of Sri Lanka as a BPO destination, this indicates that some kind of structural changes are tak-ing place in the BPO sub sector. A plausible explanation is that Sri Lanka’s BPO sector is moving away from basic level services such as data entry and call centre facilities that need bulk recruitments of non-ICT operational staff to technically more sophisticated services that need more IT qualified staff and lesser numbers of qualified non-ICT professionals.
NATIONAL ICT WORKFORCE SURVEY - 2013
38

Figure 3.5: Growth of BPO workforce
3.5 Profile of ICT Workforce:
Gender, Qualifications and Experience
Differences can also be observed in the profile of ICT workforce in four sub sectors in gender composition, qual-ifications and experience. These variations give some idea about the specific circumstances faced by workforce in respective sub sectors. Moreover, examining them with reference to past survey findings help to understand nature of transformation taking place in the ICT workforce as a whole and in respective sub sectors.
NATIONAL ICT WORKFORCE SURVEY - 2013
NATIONAL ICT WORKFORCE SURVEY - 2013
39

3.5.1 Gender Composition of Workforce
As far as the gender composition of the workforce is concerned, female participation has improved from 21% (as reported in earlier surveys) to 29.7% in 2013. However, this is not directly comparable as the first two surveys did not include BPO workforce and 2009 survey counted only the ICT workforce of BPO companies to assess the gender composition. The gender composition without BPO companies drops down to 25.6%, still a significant improvement. As in the case of previous surveys, the lowest share of female workforce was recorded from non-ICT private user companies. Female participation in the government usually remained over 35% and it reached closer to 40% in 2013. BPO companies had very high ratio of female workers, coming closer to the number of male workers. This reveals that the BPO companies have significantly contributed to improve the gender balance in ICT workforce.
Figure 3.6: Female participation in ICT workforce
NATIONAL ICT WORKFORCE SURVEY - 2013
40
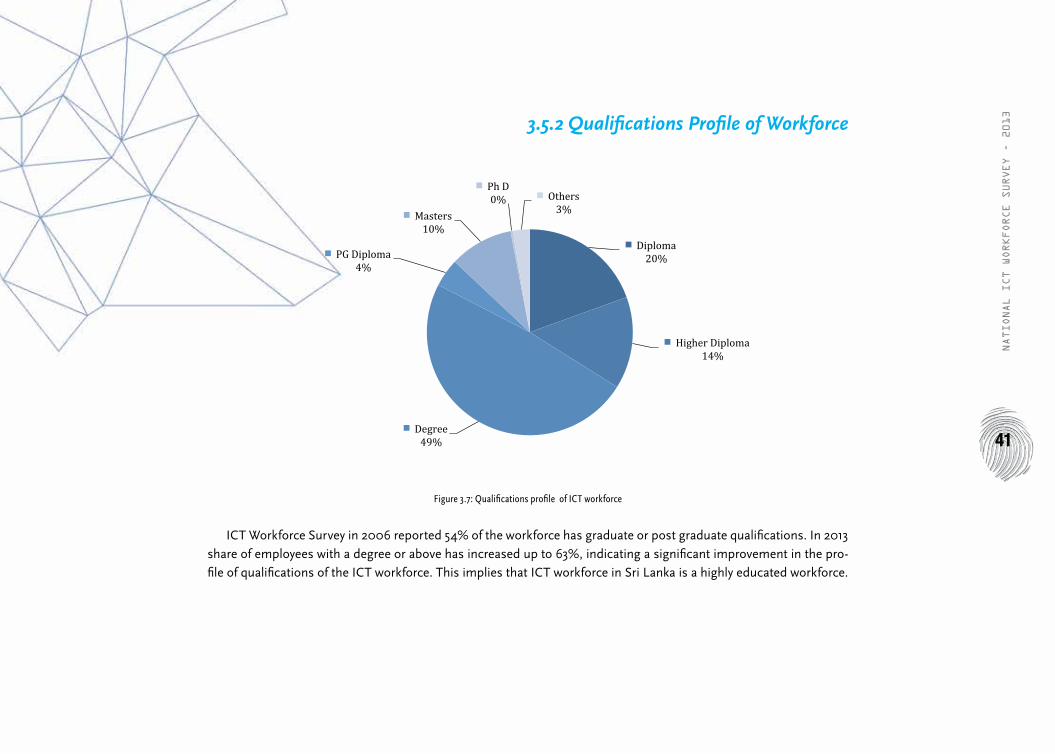
3.5.2 Qualifications Profile of Workforce
Figure 3.7: Qualifications profile of ICT workforce
ICT Workforce Survey in 2006 reported 54% of the workforce has graduate or post graduate qualifications. In 2013 share of employees with a degree or above has increased up to 63%, indicating a significant improvement in the pro-file of qualifications of the ICT workforce. This implies that ICT workforce in Sri Lanka is a highly educated workforce.
NATIONAL ICT WORKFORCE SURVEY - 2013
NATIONAL ICT WORKFORCE SURVEY - 2013
41

Figure 3.8: Qualifications of ICT workforce by sub sector
According to Figure 3.9, the qualification profile varies across sub sectors. The share of graduates is highest in the ICT companies (70%) whereas it still remains around 30-35% in other sub sectors. This im-plies that the standard qualification to join an ICT company has now become a bachelor’s or first degree. A notable point however is the limited number of employees with post graduate qualifications. In the case of non-ICTprivate sector users, employees with diplomas and higher diplomas still occupy a significant share (47%). Similar situa-tion can be observed in BPO companies too. However, in the govern-ment sector, situation is somewhat mixed. While a higher share of employees with post graduate qualifications have been reported, it is not clear whether they all possess qualifications in ICT related fields.
NATIONAL ICT WORKFORCE SURVEY - 2013
42

3.5.3 Experience of Workforce
Figure 3.9: Experience profile of ICT workforce
ICT workforce in Sri Lanka is relatively young, with workforce with 67% of employees having five or less number of years of experience (Figure 3.10). Only a slight maturing of the workforce can be observed since 2006 when the corresponding figure was 72%. Here again situation varies across sub sectors. Figure 3.11 shows the profile of experience by sub sectors. The least experienced workforce is reported from BPO com-panies with over 85% having five or less number of years of experience. This is followed by ICT companies (77%). Corresponding figures for non-ICT private sector users and government organizations are 60% and 36%, respectively. This implies that BPO companies and ICT suppliers are carrying on with regular flow of new recruits compared with ICT users.
NATIONAL ICT WORKFORCE SURVEY - 2013
NATIONAL ICT WORKFORCE SURVEY - 2013
43

Figure 3.10: Experience of ICT workforce by sub sectors
3.5.4 Attrition of the Workforce
A slight decrease in attrition has been reported in ICT (9.9% from 11% in 2009) and non-ICT (1.3% from 4% in 2009) companies. In case of government organizations (2.6% from 2% in 2009) and BPO companies (18.2% from 17% in 2009) it has slightly increased. Overall rate of attrition has come down to 6% from 7% in 2009.
As expected from positive growth trends reported in the ICT workforce, demand for graduates from all cate-gories of employers have increased significantly. As a result, increased number of employers have expressed their willingness to recruit graduates in 2014.
NATIONAL ICT WORKFORCE SURVEY - 2013
44

NATIONAL ICT WORKFORCE SURVEY - 2013
NATIONAL ICT WORKFORCE SURVEY - 2013
45

NATIONAL ICT WORKFORCE SURVEY - 2013
46

4.1 Demand for Number of Graduates
Overall number of ICT graduates in demand–a projection based on required numbers of re-cruits given by respondents in the sample for the year 2014–is 6246. Compared with the demand projection of the last survey for 2010, this represents a 57% increase, implying a 16.3% of CAGR. This can be considered as a significant growth in demand within a relatively short period of time.
Figure 4.1: Demand for graduates
The respective shares of demand from ICT companies, non-ICT companies, government and BPO companies for total number of graduates in demand are 41.5%, 38.5%, 12.1% and 7.9%. Ac-cording to that the highest demand for ICT work-force is expected from ICT companies. The lowest demand is expected from the BPO sector.
4.2 Demand for Skills
Employers are demanding not only for numbers but also for the quality. Quality of the workforce has to be measured in terms of skills possessed by employees. Accordingly, Table 4.1 presents a pro-file of skills in demand by four types of employers. The list of skills considered in the survey are given in the Appendix 4.
NATIONAL ICT WORKFORCE SURVEY - 2013
NATIONAL ICT WORKFORCE SURVEY - 2013
47

Table 4.1: Skills in demand
Skills reported with the highest frequency
Core skills Soft skills Technical skills
ICT companies
ProgrammingSystems AnalysisSales and marketingSystems designCustomer service
Creative thinking skillsTeam workingCommunication and presentation skillsInterpersonal skills
.NETC#JavaSQL server
Non-ICT private companies
Systems AnalysisSystems designNetwork designProgrammingDatabase design and administration
Communication and presentation skillsProficiency in English Professional ethicsInterpersonal skillsCreative thinking skills
Router configurationSAPJava
Government organizations
Database design and administrationHardware engineering and maintenanceNetwork designSystems analysisProgrammingNetwork implementation
Team workingCreative thinking skills
MySQLLinuxJava
BPO companies
Customer serviceSystems/application testingSystems analysisHardware engineering and maintenanceSystems application supportInternet and systems security
Team workingInterpersonal SkillsProfessional ethicsProficiency in English
Linux.NET
Overall
Systems analysis (1)Programming (2)Systems design (5)Network design (10)Database design and administration (11)Sales and marketing (12)Hardware engineering and maintenance (13)Customer service (14)Technical writing (17)Systems/application testing (19)Network implementation (20)Project management (22)
Creative thinking skills (3)Team working (4)Communication and presentation skills (7)Interpersonal skills (8)Professional ethics (16)Proficiency in English (18)
.NET (6)Java (9)C# (15)SQL server (21)Router configuration (23)
NATIONAL ICT WORKFORCE SURVEY - 2013
48

In the Table 4.1, rows allocated for respective sub sectors present lists of skills identified by respondents as the key skills required by their organizations in the order of priority set on the basis of frequency of responses. Skills were classified under core, soft and technical skills categories. Up to six skills were listed under each category subject to the condition that at least a minimum of 5% respondents in respective sub sectors have identified them. According to the Table, significant variations can be observed in the core skills demanded by employers in four sub sectors. Systems analysis is the only core skill that was identified by respondents from all sub sectors among the top six skills in demand. However, its order of priority varies among employers. Pro-gramming is the priority skill demanded by ICT companies. Although non-ICT companies and government organizations also identified programming among the top skills required, the priority assigned is low. ICT companies have identified sales and marketing and customer services among the top skills whereas BPO companies identified cus-tomer services as a high priority. Soft skills–creative thinking and team working have been identified among top skills by three sub sectors each. As far as technical skills are concerned demand from respective sub sectors varied and Java is the only technical skill demanded by three sub sectors.
The final row of the Table presents the overall demand for core, soft and technical skills. Twelve core skills, six soft skills and five technical skills were identified in the order of priority computed based on the fre-quencies weighted by the shares of respective sub sectors in the total workforce. The estimated order of priority is given in the brackets with each listed skill. According to that system analysis and programming
are the top priority skills demanded by employers. Interestingly, this is followed by creative thinking skills and team working which are two soft skills. This shows high value placed by employers on soft skills even above certain core skills such as systems design. Only four out of top ten positions are occupied by core skills whereas four soft skills and two technical skills occupy the rest. This suggests that employers demand for a mixed bundle of skills of which soft skills have an import-ant place.
4.3 Demand for Workforce by Qualifications: Entry Level Qualifications
Another indicator for demand for skills is qualifications required for entry level recruitment in different job categories. Table 4.2 pres-ents the entry level qualifications sought by majority of employers for recruitment in different in job categories in respective sub sectors. It shows that in all sub sectors, Bachelor’s degree has become the stan-dard entry level qualification for recruitment in many job categories. In ICT companies, higher opportunities for non-graduates are available only in sales and marketing and technical support categories. In the government organizations also, technical support is the only category which has higher share of recruits with non-graduate qualifications. Comparatively, high number of job categories in non-ICT companies is still available for employees with diploma or higher diploma qualifica-tions. In case of BPO companies, opportunities are available in digital media and animation, IT sales and marketing, technical support and web development.
NATIONAL ICT WORKFORCE SURVEY - 2013
NATIONAL ICT WORKFORCE SURVEY - 2013
49

Table 4.2: Entry level qualifications for different job categories
ICT Non-ICT Government BPO
Database administration and development Bachelors Bachelors Bachelors Bachelors
Digital media and animation Bachelors Diploma Bachelors Higher Diploma
Business analysis and systems integration Bachelors Bachelors Bachelors Bachelors
Systems and network administration Bachelors Bachelors Bachelors Bachelors
Programming/software engineering Bachelors Bachelors Bachelors Bachelors
Project and program management Bachelors Bachelors Bachelors Bachelors
Software quality assurance Bachelors Bachelors NA Bachelors
IT sales and marketing Diploma Diploma NA Higher Diploma
Technical support Diploma Higher Dip Diploma Diploma
Technical writing Bachelors Diploma Bachelors Bachelors/Higher Diploma
Web development Bachelors Diploma Bachelors Higher Diploma
Management information system/IT management Bachelors Bachelors Bachelors Bachelors
Solutions and technical architect Bachelors Bachelors Bachelors Bachelors
IT research and development Bachelors Bachelors Bachelors Bachelors
Compared with the situation in 2009, an overall raise in entry level qualifications can be observed in all job categories. In 2009, five job catego-ries–business analysis and systems integration, project and programme management, MIS/IT management, solutions and technical architect and IT research and development–required degree level qualifications for entry in all sub sectors. In 2013, three additional job categories have been included to this category, namely; database administration and development, systems and network administration and programming/software engineering where majority employers seek for graduates.
NATIONAL ICT WORKFORCE SURVEY - 2013
50

NATIONAL ICT WORKFORCE SURVEY - 2013
NATIONAL ICT WORKFORCE SURVEY - 2013
51

NATIONAL ICT WORKFORCE SURVEY - 2013
52

Supply source of the ICT workforce is training organizations. Training organizations in Sri Lanka offer variety of courses on ICT that are leading to different levels of job qualifications. Since the first survey in 2004, the ICT Workforce Survey provided estimates of supply of graduates in the country with projections for forthcoming periods. The current Workforce Survey has estimated the supply of graduates for the period 2011-2013 and the projection for 2014.
5.1 Overall Supply of the ICT Graduates
According to the last workforce survey in 2009 the total number of graduates projected for 2010 was 5610. Estimates of the current survey indicate a gradual increase in this number to 6611 in 2013. This implies a 5.6 % CAGR. This total supply figure is inclusive of number of degrees, post graduate diplomas and masters qualified trainees.
NATIONAL ICT WORKFORCE SURVEY - 2013
NATIONAL ICT WORKFORCE SURVEY - 2013
53

Figure 5.1: Supply of graduates
5.2 Supply of the ICT Workforce by Levels of Qualification
Figure 5.2 shows the supply situation of graduates by respective qualification levels. According to that number of graduates supplied have increased rapidly from 2009-2012 and a slight slowdown in growth can be observed thereafter. This indicates an overall increase in the capacity of intake of students in the period concerned both in government universities and private degree awarding institutes. This has led to quick rise in supply of graduates from 3941 in 2009 to 5390 in 2012 and maintaining the level thereafter. Supply projection suggests a slight increase output of graduates in 2014.
NATIONAL ICT WORKFORCE SURVEY - 2013
54

5.3 Supply of Major Skills
Skills offered by training courses are highly important as they determine the quality of the work-force. Table 5.2 provides a profile of skills offered by training courses at different qualification levels. Listed in the table are skills identified by the highest percentage of respondents from training organiza-tions under the categories of essential and complementary skills.
Figure 5.2: Supply of graduates by level of qualifications
NATIONAL ICT WORKFORCE SURVEY - 2013
NATIONAL ICT WORKFORCE SURVEY - 2013
55

Table 5.1: Essential and complementary skills taught in different courses
Type of courses Top essential skills taught Top complementary skills taught
Diploma courses
Systems analysisProgrammingHardware engineering & maintenanceDatabase design & admin.Internet & systems security
Visual BasicTeam workingTrainingProfessional ethicsMS Windows
Advanced diploma courses
Systems analysisProgrammingHardware engineering & maintenanceProject managementSQL Server
Professional ethicsSQL ServerSystems/applications testingSales and marketingVisual Basic
Degree courses
Systems analysisProgrammingSystems designDatabase design & admin.Project management
JavaMySQLSQL ServerPHPVisual Basic
Post graduate diploma courses
Systems analysisProgrammingSystems designNetwork designInternet and systems security
Customer servicePeople and organizational change TrainingSystems/application supportCreative thinking skills
Masters courses
Systems analysisSystems designProject managementCreative thinking skills Programming
MySQLCustomer serviceTeam WorkingJavaC#
According to the table, essential skills offered by all types of courses come under the category of core skills. System analysis and pro-gramming have been identified as essential skills taught in all levels of courses. Project management has also been identified as an essential skill in all courses except in post graduate diplomas. From the degree level upwards, systems design is also included as an essential skill. Overall, closely similar profiles of essential skills are taught in all types of courses and they mainly cover core skills.
NATIONAL ICT WORKFORCE SURVEY - 2013
56
Some variation could be identified in the case of complementary skills taught in different courses. Except in post graduate diploma courses, they mainly cover soft and technical skills. This brings in some balance to the course profiles. However, coverage of complementary skills is dominated more by technical skills. Overall, coverage of soft skills is limited in all levels of courses. It needs to compare these skills taught in courses with skills demand-ed by employers. Section 6.2 presents a comparison of demand and supply of skills.
5.4 Strength and Quality of Training Staff
Another important aspect that determines the quality of the workforce is qualifications and experience of teaching staff in training organizations.
5.4.1 Qualifications of Staff
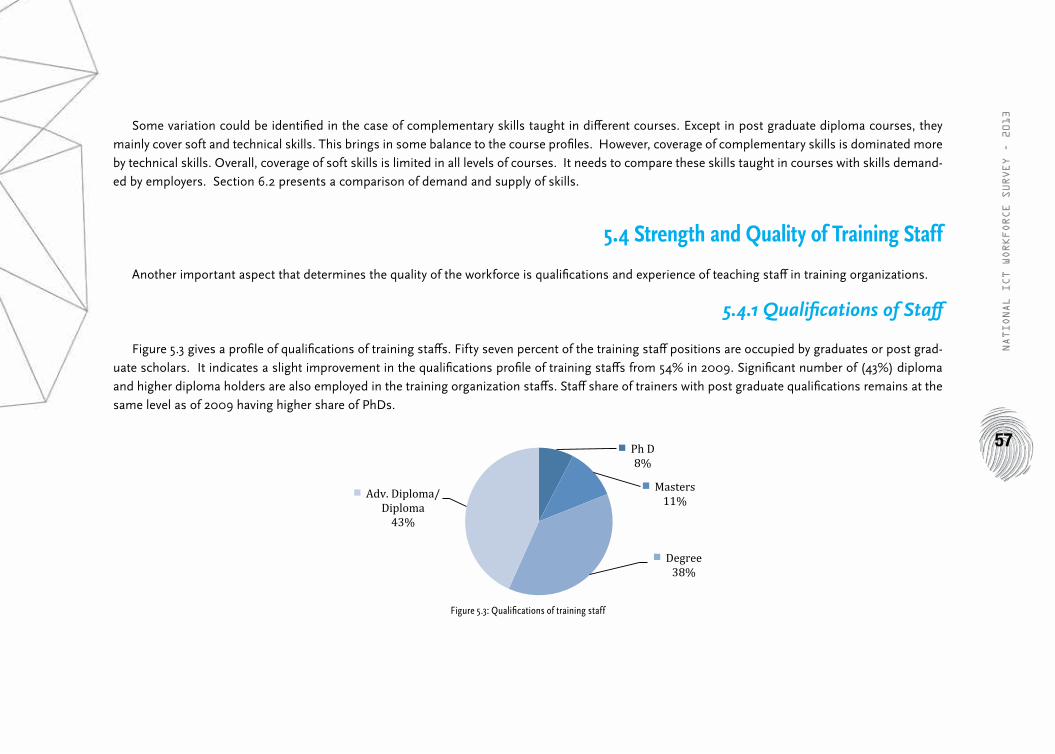
Figure 5.3 gives a profile of qualifications of training staffs. Fifty seven percent of the training staff positions are occupied by graduates or post grad-uate scholars. It indicates a slight improvement in the qualifications profile of training staffs from 54% in 2009. Significant number of (43%) diploma and higher diploma holders are also employed in the training organization staffs. Staff share of trainers with post graduate qualifications remains at the same level as of 2009 having higher share of PhDs.
Figure 5.3: Qualifications of training staff
NATIONAL ICT WORKFORCE SURVEY - 2013
NATIONAL ICT WORKFORCE SURVEY - 2013
57

5.4.2 Experience of staffExperience profile of training staffs is as follows:Instructors - 38%Lecturers with 1-3 years’ experience – 17.4%Lecturers with 4-7 years’ experience – 19.4%Lecturers with over 8 years’ experience - 25%
Figure 5.4: Experience of training staff
It indicates a reasonably balanced profile of experience in training staffs. As far as qualification of respective experience categories are concerned, diploma and higher diploma holders occupy the majority of instructor positions. In case of lecturer positions, the highest share is occupied by degree holders in all experience categories. The share of post-graduate scholars increases with the number of years of experience.
NATIONAL ICT WORKFORCE SURVEY - 2013
58

5.4.3 Staff Engagement: full-time and part-time
Figure 5.5: Fulltime and part-time engagement of training staff
A significant proportion of staff positions are covered by part-timers. Positions covered by part-time trainers are relatively high in Lecturer positions, especially with middle level experience. Compared with the situation in 2009, the share of part-time staff has increased in Lecturer positions with 1-7 years’ experience categories. However, respective shares of part-timers are low among Instructors and Lecturers with over 8 years’ experi-ence. There are only 6% part-time staff members in Instructor positions.
NATIONAL ICT WORKFORCE SURVEY - 2013
NATIONAL ICT WORKFORCE SURVEY - 2013
59

NATIONAL ICT WORKFORCE SURVEY - 2013
60

NATIONAL ICT WORKFORCE SURVEY - 2013
NATIONAL ICT WORKFORCE SURVEY - 2013
61

NATIONAL ICT WORKFORCE SURVEY - 2013
62

A key objective ICT Workforce Survey is to find ways to match the gap between the demand for and supply of ICT workforce, especially graduates. According to past work-force surveys, in more number of years, a negative balance has been reported indicating a shortage of ICT graduates relative to the demand for them. However, during the period 2008-2010 a positive balance of supply was reported, apparently a result of decline in demand for workforce due to economic conditions prevailed at the time.
6.1. Gap between Demand and Supply for GraduatesDemand and supply projections for 2014 indicate a situation of short supply of grad-
uate workforce. The magnitude of the gap is 458. This can be considered more a result of favourable conditions that led to boost the demand for ICT workforce than due to any factor relating to growth in supply of graduates. Sri Lanka has made significant gains from exporting ICT products and the country is being recognized as an important BPO destination. As shown in the Section 4.1, the main source of demand for graduates is ICT companies. The government, in its drive towards e-governance, is also making additional demand for ICT graduates. Besides, many other sectors in the economy also are expe-riencing a drive towards growth that creates demand for ICT workforce. Figures given in Table 4.2 suggest that many employers are seeking for graduates at the entry level for many job categories. Overall, it looks negative balance in the demand and supply is realistic situation.
NATIONAL ICT WORKFORCE SURVEY - 2013
NATIONAL ICT WORKFORCE SURVEY - 2013
63

Figure 6.1: Demand and supply gap of graduates
Even though it appears that output of postgraduate diplomas and mas-ter’s degree holders can fill this gap, quite possibly many of the postgraduate students are already in the workforce. Discussions with industry stakehold-ers have informed that the latent demand for graduates could be even high due to unrealized potential, especially in the export sector for supplying ICT products and BPO services. Many seem to be convinced that shortage of good quality graduates could be a bottleneck for the future growth of the in-dustry. Hence, increasing the capacity of training institutes to produce more number of graduates is the only long-term solution.
6.2 Gap between Demand and Supply of Skills
Not only matching the numbers but matching the quality of the grad-uates also is highly important. Findings of the survey regarding the skills in demand and supply of them by training courses allow for making a comparative assessment about the skills gap. Necessary information for this comparison was discussed in Sections 4.1 and 5.1 with correspond-ing data given in Tables 4.1 and 5.1, respectively. Information from these tables is used in Table 6.1 to make a comparative assessment of skills in demand and supply. Here the matching involves overall demand for skills in Table 4.1 and skills taught in degree and postgraduate level courses (Table 5.1).
According to Table 6.1, mismatch of skills in demand and supply can be identified in all three categories of skills; core, soft and technical skills. Mismatch implies the existence of less-supplied skills in demand and less-demanded skills in supply. Information given in the table, es-pecially regarding the mismatch of skills, provides an overall guide for making necessary adjustments in training courses. In the first place, it suggests the necessity of aligning the focus of training programs to cater the demand made by employers. Secondly, it provides some hints about the areas and skills that may need to be considered in such adjust-ments. Particularly, high un-met demand from employers for soft skills in job seekers and existing employees deserve special attention. So are the necessary adjustments required in profile of core and technical skills taught in training courses.
NATIONAL ICT WORKFORCE SURVEY - 2013
64

Table 6.1: Gaps in the demand and supply of skills
Types of skills
Skills in demand Skills in Supply Mismatch of Skills
Degree PG Diploma Masters Less-supplied skills in demand
Less-demanded skills in supply
Core skills Systems analysis (1)Programming (2)Systems design (5)Network design (10)Database design and administra-tion (11)Sales and marketing (12)Hardware engineering and maintenance (13)Customer service (14)Technical writing (17)Systems/application testing (19)Network implementation (20)Project management (22)
Systems analysisProgrammingSystems designDatabase design & admin.Project management
Systems analysisProgrammingSystems designNetwork designInternet and systems security Customer servicePeople and organizational change TrainingSystems/application support
Systems analysisSystems designProject managementProgrammingCustomer service
Sales and marketingHardware engineering and maintenanceTechnical writingSystems/application testing Network implemen-tation
Internet and systems securityPeople and organiza-tional change TrainingSystems/application support
Soft skills Creative thinking skills (3)Team working (4)Communication and presentation skills (7)Interpersonal skills (8)Professional ethics (16)Proficiency in English (18)
Creative thinking skills Creative thinking skills Team Working
Communication and presentation skills Interpersonal skills Professional ethics Proficiency in English
Technical skills
.NET (6)Java (9)C# (15)SQL server (21)Router configuration (23)
JavaMySQLSQL ServerPHPVisual Basic
MySQLJavaC#
.NET Router configuration
MySQLPHPVisual Basic
NATIONAL ICT WORKFORCE SURVEY - 2013
NATIONAL ICT WORKFORCE SURVEY - 2013
65

NATIONAL ICT WORKFORCE SURVEY - 2013
66

NATIONAL ICT WORKFORCE SURVEY - 2013
NATIONAL ICT WORKFORCE SURVEY - 2013
67

NATIONAL ICT WORKFORCE SURVEY - 2013
68

Remuneration is the key motivational force that drives any workforce and ICT work-force is not an exception. Taking this matter into consideration, the ICT Workforce Survey has gathered information on salaries of ICT workforce in all previous workforce surveys. However, it has been observed that divulging information about remuneration has been considered by many respondents as a sensitive matter. As a result, a low re-sponse rate has generally been observed for questions on remuneration. In addition, it was also felt that salary scale categories given in the questionnaires were somewhat outdated. Therefore, some revisions have been made in salary categories in the ques-tionnaires. Despite that the problem of low response on remuneration was experienced this time also.
7.1 Remuneration by sub sectors
Validity of salary information has limitations due to low response rates. Disregard of limitations, information on remuneration gathered in the survey are presented in tables 7.1-7.4 considering its usefulness as an additional source of information about the de-mand and supply relationships exist in the ICT job market with direct and in-direct im-plications towards demand and supply of specific job categories and associated skills.
According to information given in tables 7.1-7.4, private sector companies in ICT,
non-ICT and BPO sub sectors offer better salaries than government organizations, nearly in all job categories. In many cases, remuneration drew by private sector employ-ees with 1-4 years of experience is higher than government employees with over 8 years of experience. As far as private sector companies are concerned, comparatively, the best structure of salaries is offered by ICT companies. Remuneration in ICT companies is generally better for all job categories compared with non-ICT and BPO companies. This is followed by BPO companies. Even though remuneration in non-ICT companies is somewhat compatible with BPO companies they differ in specific job categories.
7.2 Remuneration by Job Categories and Experience
When the relationship between remuneration and experi-ence is concerned, again the poorest matching of remunera-tion with experience is shown in government organizations. They offer generally low, uniform salary structures which are slightly improved with experience. In contrast, private sector companies offer more contrasting salary hikes for employ-ees with high experience which is more pronounced in the case of demanding job categories. Job categories with high demand, as indicated by better remuneration, vary among different sub sectors. In case of ICT companies, the most demanding job categories include project and program man-agement, IT research and development, solutions and techni-cal architect. BPO companies offer relatively better salaries for project and program management, technical writing, da-tabase administration and development. The best paid job category in non-ICT companies is management information system/IT management. There is no particular difference in remuneration among job categories in government sector yet some significantly high maximum salaries were indicated for experienced employees in management information system/IT management.
NATIONAL ICT WORKFORCE SURVEY - 2013
NATIONAL ICT WORKFORCE SURVEY - 2013
69

Table 7.1: Compensation for ICT workforce in the government
Less than 1 year Experience 1 to 4 years' Experience 4 to 8 years' Experience Over 8 years' Experience
Min Mode Max Min Mode Max Min Mode Max Min Mode Max
Digital media and animation <20,000 <20,000 40,000 <20,000 <20,000 40,000 <20,000 <20,000 40,000 <20,000 <20,000 40,000
Systems and network administration <20,000 20,000-
30,000 60,000 <20,000 20,000-30,000 50,000 <20,000 31,000-
40,000 50,000 <20,000 31,000-40,000 90,000
Programming/software engineering <20,000 <20,000 60,000 <20,000 31,000-
40,000 40,000 <20,000 31,000-40,000 50,000 <20,000 41,000-
50,000 60,000
Software quality assurance <20,000 <20,000 60,000 <20,000 20,000-30,000 30,000 <20,000 <20,000 40,000 <20,000 <20,000 40,000
IT sales and marketing <20,000 <20,000 <20,000 <20,000 <20,000 30,000 <20,000 <20,000 30,000 <20,000 <20,000 30,000
Technical support <20,000 <20,000 60,000 <20,000 <20,000 40,000 <20,000 <20,000 50,000 <20,000 20,000-30,000 60,000
Technical writing <20,000 <20,000 30,000 <20,000 <20,000 40,000 <20,000 31,000-40,000 40,000 <20,000 <20,000 40,000
Web development <20,000 <20,000 40,000 <20,000 31,000-40,000 40,000 <20,000 31,000-
40,000 50,000 <20,000 31,000-40,000 60,000
IT research and development <20,000 <20,000 40,000 31,000 31,000-40,000 40,000 31,000 31,000-
40,00050,000 <20,000 <20,000 60,000
NATIONAL ICT WORKFORCE SURVEY - 2013
70

Table 7.2: Compensation for ICT workforce in ICT companies
Less than 1 year Experience 1 to 4 years' Experience 4 to 8 years' Experience Over 8 years' Experience
Min Mode Max Min Mode Max Min Mode Max Min Mode Max
Digital media and animation <20,000 <20,000 60,000 <20,000 20,000-30,000 70,000 20,000 20,000-
30,000 150,000 31,000 31,000-40,000 200,000
Systems and network administration <20,000 <20,000 70,000 20,000 20,000-
30,000 90,000 31,000 51,000-60,000 150,000 41,000 61,000-
70,000 200,000
Programming/software engineering <20,000 20,000-
30,000 70,000 20,000 31,000-40,000 150,000 31,000 51,000-
60,000 200,000+ 51,000 150,001-200,000 200,000
Software quality assurance <20,000 <20,000 70,000 20,000 31,000-40,000 150,000 31,000 41,000-
50,000 200,000 41,000 41,000-50,000 200,000
IT sales and marketing <20,000 <20,000 70,000 <20,000 31,000-40,000 90,000 20,000 31,000-
40,000 150,000 20,000 71,000-80,000 200,000
Technical support <20,000 <20,000 70,000 <20,000 20,000-30,000 70,000 20,000 31,000-
40,000 150,000 20,000 41,000-50,000 200,000
Technical writing <20,000 <20,000 50,000 <20,000 20,000-30,000 70,000 20,000 31,000-
40,000 150,000 20,000 61,000-70,000 200,000
Web development <20,000 <20,000 70,000 20,000 20,000-30,000 80,000 20,000 31,000-
40,000 150,000 31,000 41,000-50,000 200,000
IT research and development <20,000 <20,000 80,000 20,000 20,000-30,000 150,000 31,000 101,000-
150,000 200,000+ 41,000 81,000-90,000 200,000
NATIONAL ICT WORKFORCE SURVEY - 2013
NATIONAL ICT WORKFORCE SURVEY - 2013
71

Table 7.3: Compensation for ICT workforce in non-ICT private companies
Less than 1 year Experience 1 to 4 years' Experience 4 to 8 years' Experience Over 8 years' Experience
Min Mode Max Min Mode Max Min Mode Max Min Mode Max
Digital media and animation <20,000 <20,000 30,000 20,000 20,000-30,000 40,000 41,000 41,000-
50,000 70,000 51,000 51,000-60,000 70,000
Systems and network administration <20,000 <20,000 80,000 <20,000 31,000-
40,000 100,000 31,000 41,000-50,000 200,000 31,000 51,000-
60,000 200,000
Programming/software engineering <20,000 20,000-
30,000 70,000 20,000 31,000-40,000 70,000 31,000 41,000-
50,000 70,000 51,000 51,000-60,000 100,000
Software quality assurance <20,000 <20,000 60,000 20,000 31,000-40,000 70,000 41,000 41,000-
50,000 80,000 51,000 61,000-70,000 100,000
IT sales and marketing <20,000 <20,000 30,000 <20,000 20,000-30,000 60,000 <20,000 <20,000 40,000 51,000 51,000-
60,000 60,000
Technical support <20,000 <20,000 60,000 <20,000 20,000-30,000 70,000 <20,000 41,000-
50,000 80,000 <20,000 51,000-60,000 90,000
Technical writing - - - 20,000 20,000-30,000 30,000 <20,000 <20,000 60,000 61,000 61,000-
70,000 70,000
Web development <20,000 <20,000 70,000 20,000 31,000-40,000 50,000 31,000 31,000-
40,000 70,000 41,000 51,000-60,000 100,000
IT research and development <20,000 <20,000 50,000 20,000 20,000-30,000 60,000 31,000 31,000-
40,000 70,000 51,000 51,000-60,000 150,000
NATIONAL ICT WORKFORCE SURVEY - 2013
72

Table 7.4: Compensation for non-ICT workforce in BPO companies
Less than 1 year Experience 1 to 4 years' Experience 4 to 8 years' Experience Over 8 years' Experience
Min Mode Max Min Mode Max Min Mode Max Min Mode Max
Digital media and animation <20,000 <20,000 <20,000 20,000 20,000-30,000 90,000 20,000 20,000-
30,000 30,000 31,000 31,000-40,000 40,000
Systems and network administration <20,000 <20,000 40,000 20,000 31,000-
40,000 50,000 31,000 31,000-40,000 60,000 41,000 61,000-
70,000 70,000
Programming/software engineering <20,000 20,000-
30,000 40,000 20,000 20,000-30,000 60,000 31,000 31,000-
40,000 80,000 41,000 41,000-50,000 100,000
Software quality assurance <20,000 20,000-30,000 40,000 <20,000 31,000-
40,000 50,000 <20,000 <20,000 70,000 20,000 20,000-30,000 100,000
IT sales and marketing 20,000 20,000-30,000 50,000 31,000 31,000-
40,000 60,000 71,000 71,000-80,000 80,000 71,000 71,000-
80,000 80,000
Technical support <20,000 <20,000 30,000 20,000 20,000-30,000 40,000 31,000 31,000-
40,000 40,000 41,000 41,000-50,000 50,000
Technical writing 20,000 20,000-30,000 50,000 51,000 51,000-
60,000 60,000 61,000 61,000-70,000 70,000 71,000 71,000-
80,000 80,000
Web development 20,000 20,000-30,000 30,000 31,000 31,000-
40,000 40,000 31,000 31,000-40,000 40,000 41,000 41,000-
50,000 50,000
NATIONAL ICT WORKFORCE SURVEY - 2013
NATIONAL ICT WORKFORCE SURVEY - 2013
73

IT research and development 41,000 41,000-50,000 50,000 71,000 71,000-
80,000 150,000 71,000 71,000-80,000 80,000 81,000 81,000-
90,000 90,000
NATIONAL ICT WORKFORCE SURVEY - 2013
74

NATIONAL ICT WORKFORCE SURVEY - 2013
NATIONAL ICT WORKFORCE SURVEY - 2013
75

NATIONAL ICT WORKFORCE SURVEY - 2013
76

Information gathered in the survey presented a comprehensive picture about the current situation of ICT workforce in Sri Lanka. The key overall conclusion that can be reached from the findings is the ICT workforce in Sri Lanka is currently experiencing a period of rapid growth supported by favourable domestic conditions and slowly recovering global economic situation. The ICT workforce has recorded a 50% increase in total workforce since the last survey conducted in 2009 at a healthy CAGR of 14.4%. This situation is clearly visible in all sub sectors of ICT workforce. Growth has been particularly impressive in ICT companies and non-ICT private sector companies. Hence, the growth in the ICT workforce can be interpreted as a joint outcome of overall improvements in the economy and specific developments in ICT and BPO sectors.
This growth momentum has increased the demand for graduates qualified in ICT. The level of de-
mand has been unmatched by the supply. As a result, the oversupply of graduates reported by the last survey has been reversed, giving rise to a situation of short supply. Growth observed in supply of graduates is not unhealthy overall but calls for capacity improvements to match the rising demand. This should be given special attention. It appears that there is a latent demand that may be converted into real demand if the full potential indicated by brightening prospects is to be realized. In such a scenario the supply of graduates could act as a bottleneck against the growth of the entire industry.
Matching the numbers alone is not sufficient to face the challenge. Analysis of demand- supply mis-match in skills conducted in the study suggests that there are less-supplied skills in demand and less-de-manded skills in supply. The analysis shows that there are mismatches in supply of all major categories of skills; core, technical and soft skills. Hence, aligning the training programs for supplying skills that are in high demand from the industry also is of utmost importance. The survey has provided certain clues that may offer guide to make necessary adjustments. An area that may need special attention is developing soft skills that have been ranked high among the skills in demand by employers. Among others, supply situation of soft skills seems to be the unhealthiest. This is a message from the survey that training or-ganizations need to give serious attention.
NATIONAL ICT WORKFORCE SURVEY - 2013
NATIONAL ICT WORKFORCE SURVEY - 2013
77

A. APPENDIX 1 – SURVEY METHODOLOGY
The methodology followed by ICT Workforce Survey 2013 is consistent with the previous ICT workforce surveys conducted in 2004, 2006 and 2009.
A.1. Sample Frame Development and Sample Selection
ICT Workforce Survey is a sample survey that uses sample data to make es-timates and projections on the entire workforce. Therefore, development of a comprehensive sampling frame was one of the key tasks of the survey. Sampling frame was developed for the following categories of organizations.
• ICT companies - Organizations providing ICT products including software and hardware and various IT services
• Business Process Outsourcing (BPO) companies• Non-ICT companies - Private sector users of ICT other than ICT-BPO com-
panies• Government organizations - Ministries, departments, statutory bodies
and other government organizations• ICT Training Organizations - Universities, degree awarding and non-de-
gree awarding private institutions, government technical colleges.
The sampling frame used for the previous workforce survey in 2009 was used as the base list for developing the new sample frame. Information sources used for updating the sampling frame is given in Table A1.
NATIONAL ICT WORKFORCE SURVEY - 2013
78

Categories of Organizations/Sub Populations Information Sources
ICT companies
• Database-NationalICTWorkforceSurvey2009,ICTA• ListofICTcompaniesfromtheregistrarofcompanies• SriLankaAssociationforTheSoftwareIndustry(SLASI)• SriLankaAssociationofSoftwareandServiceCompanies(SLASSCOM)• SriLankaExportDevelopmentBoard• Newspapers• Surveyonwebresourcesavailablefromseveralwebsitesonbusinessandindustry(e.g.www.list.lk)
BPO companies • Sri Lanka Association of Software and Service Companies (SLASSCOM)
Non-ICT companies
• Database-NationalICTWorkforceSurvey2009,ICTA• CeylonChamberofCommerce• SriLankaExportDevelopmentBoard• BoardofInvestment(BOI)• ShippingAssociation• KOMPASSDirectory• Surveyonwebresourcesavailablefromseveralwebsitesonbusinessandindustry ( e.g. www.list.lk; www.mbendi.com; www.hotelsinsrilanka.og.uk; www.asiatours.net; www.slaito.com)
Government organizations • Government Website (www.gov.lk)
IT Training Institutes
• Database-NationalICTWorkforceSurvey2009,ICTA• AssociationofComputerTrainingOrganizationinSriLanka(ACTOS)• TertiaryandVocationalEducationCommission(TVEC)• SLTRainbowPages• Newspapers• Surveyonwebresourcesavailablefromseveralgovernmentuniversitiesandprivatetrainingorganizationswebsites
Table A1: Information Sources for Developing the Sample Frame
NATIONAL ICT WORKFORCE SURVEY - 2013
NATIONAL ICT WORKFORCE SURVEY - 2013
79

Since the results of the survey need to be generalized into the entire population of workforce and total demand and supply have to be project-ed on the basis of sample data, selecting a representative sample was a key element of the survey design. Sample was selected using the stratified random sampling method. The procedure adopted in the sample selection included the following steps.
• Target population of the survey was employers of ICT workforce. As described above, this is a heterogeneous population with at least four major sub sectors.
• Accordingly, sampling frame was stratified into four non-overlap-ping categories of employers (sub sectors)–ICT companies, non-ICT companies, government organizations and BPO companies
• Organizations were drawn randomly from each stratum using a ran-dom number table.
The above sampling strategy was adopted to improve the precision of estimates based on the sample data and maintain the longitudinal consis-tency with the previous workforce surveys. The details of the final sample are given in the Table A2.
Survey sub Samples Categories of Organizations Actual No.Respondents
Employer Organizations ICT Suppliers – Organizations providing ICT products and services including software, hardware and telecom companies
62
Business Process Outsourcing (BPO) sector companies 181
ICT Users - Private organizations outside the ICT sector 85
Public sector - Ministries, departments, corporations and other government owned organizations
75
Training Organizations Universities, degree awarding and non-degree awarding private institutions, government technical colleges.
27
Total 267
Table A2: Sample size
NATIONAL ICT WORKFORCE SURVEY - 2013
80

A.2. Design of the Questionnaires
Three comprehensive questionnaires were used to gather data from the above mentioned sub samples (Table A2). The questionnaires used for the previous survey in 2009 were taken as the base to maintain the longitudinal validity of information and slight modifications were made to capture new changes in the industry with the approval of ICTA.
Organization Categories Questionnaire
ICT suppliers, private sector ICT users and public sector ICT users Questionnaire for Human Resources in IT suppliers, IT users and Government Organizations
BPO companies Questionnaire for Human Resources in BPO Sector
IT Training Organizations Questionnaire for Human Resources in Training Organizations
Table A3: Questionnaires for Different Organization Categories
A.3 Data Collection, Field Monitoring and Quality Assurance
Respondents in the selected organizations were made aware of the study and its objectives prior to the field data collection. In order to achieve this, questionnaires were sent via e-mail to the respondents together with an official letter from the ICTA that communicate the purpose of the survey. Prior appointments for interviews were taken and data collection was done by a team of enumerators by conducting face to face interviews. All interviews were conducted in working places of respondents. Respondents included CEOs, IT/Human Resource Managers or other senior level executives who are responsible for supervising IT staffs in respective organizations. The data collection process was closely monitored by a Project Manager appointed by the consultant and ICTA staff to ensure completeness and accuracy of the survey. Random quality checks were done to ensure the quality of interview process. All completed questionnaires were checked for completeness, clearness and accuracy. Responses to open-ended questions were coded before entering. All questionnaires were given serial numbers to safeguard the confidentiality of information. Missing data and incompatible data were cor-rected by referring to the respective respondents and data was cleaned and coded to ensure accuracy and efficiency in data entry process. Data entry process was monitored throughout and checked by comparing entered data with questionnaires.
NATIONAL ICT WORKFORCE SURVEY - 2013
NATIONAL ICT WORKFORCE SURVEY - 2013
81

A.4. Data Processing and Analysis
Data analysis was carried out using SPSS software. The data was an-alyzed mainly using descriptive statistical methods and cross tabulation. Descriptive statistics of (e.g. frequencies, percentage, means and variabili-ty) of key variables was calculated and results were presented using differ-ent forms of graphs and tables.
Survey findings include estimates, projections and sample statistics. Estimates: An estimate is a value that is computed for the total work-force based on the data collected from the sample: E.g. Total work force; sub totals of respective sub sectors; total number of graduates in supply.
Projections: A projection is a value that indicates the future changes in the workforce which is computed on the basis of responses regarding future expectations/plans: E.g. demand for and supply of ICT graduates in 2014.
Sample statistics: A sample statistics were used to describe certain aspects of the workforce without extrapolating them into higher level aggregates: E.g. gender, experience profiles of sub sectors
Estimates and projections involved extrapolation of sample data into higher levels of aggregates such as the total workforce and workforce in sub sectors. Extrapolation is a procedure of estimation that systematically adjusts the sample data to determine values of those higher level aggre-gates. A systematic estimation procedure was followed to generate values of estimates and projections. The essential features of the complex estima-tion procedure can be described as follows.
• Sample statistics; i.e. average numbers of workforce for respective categories of employers, were computed for the smallest possible randomly selected sampling units
• Based on the averages, workforce estimates were computed for rel-evant sub units separately
• Workforce estimates for sub units were summed to estimate work-force sub totals of each stratum
• Total workforce was estimated by summation of subtotals of four strata
• The same general procedure was followed to generate projections of demand for and supply of graduates in 2014
• Given the sensitivity of final estimates to the sample statistics, they were validated by discussing the preliminary estimates with indus-try stakeholders before generating the final estimates.
The above procedure of estimation was adopted to improve precision of the estimates and projections of the survey
NATIONAL ICT WORKFORCE SURVEY - 2013
82

A.5. Limitations of the Survey
The figures from the survey are relevant only to relatively large business entities that are represented in the sample frame of the survey compiled from various available sources. They do not cover workforce employed by numerous small business entities that serve localized bases of customers. A considerable number of such small entities that are not registered with the government, industry related bodies or business directories exist and infor-mation about such players is scarce.
Given the numbers of diploma and below degree-level courses offered and institutes that undertake such courses are quite large, ICT Workforce Survey so far has not reported information on such courses. The main rea-son is possible biases that could occur due to limited sample size. Hence, the information available on such training courses and organization is lim-ited.
Following issues were reported by enumerators as problems faced by re-spondents in answering questions.
Job categories in government organizations: Some respondents from government organizations found it difficult to match 15 job categories with primary responsibilities of ICT employees in their organizations. Key skills in demand: Some, respondents suggested that skills cate-gories listed in the questionnaires are outdated and needs revision.
These issues can be identified as limitations of the questionnaires that need improvements in future undertakings of the survey.
NATIONAL ICT WORKFORCE SURVEY - 2013
NATIONAL ICT WORKFORCE SURVEY - 2013
83

A.6. Recommendations for Future Improvements
During the survey and in interactions with key stakeholders, it was understood that structures of ICT and BPO sectors are constituted of few major companies with large number of employees and numerous small companies. This can led to biases in a sample survey since there is no complete sampling frame. Therefore, in future undertakings of the survey, it is recommended to follow a mixed approach that include total enumeration of few number of major players and a sample survey for small companies to improve the precision of estimates and projections.
Total supply of graduates comes from about 25 faculties of government univer-sities and closely similar number of private degree-awarding institutes. It is rec-ommended to conduct a total enumeration of these institutes to get more precise estimates of the supply of graduates.
Questionnaires have not been designed to get an estimate of the staff recruited by training organizations. However, they constitute an important category of ICT workforce in the country. Therefore, recommendations are made to cover them as a part of the ICT workforce by making appropriate changes in the data gathering tools.
Following improvements are suggested to update the questionnaires.
• Revision of list of skills and job categories with the participation industry stakeholders for better reflection of the present condition in ICT industry
• Developing a separate questionnaire for government organizations as the situation of ICT workforce In public sector is quite different from the situa-tion in private companies
NATIONAL ICT WORKFORCE SURVEY - 2013
84

Notes
NATIONAL ICT WORKFORCE SURVEY - 2013
NATIONAL ICT WORKFORCE SURVEY - 2013
85

NotesNATIONAL ICT WORKFORCE SURVEY - 2013
86