Published by OpenTask, Republic of Ireland 00011518 ImageSize: 00008000 Translations: 0000.04b0...
30
Transcript of Published by OpenTask, Republic of Ireland 00011518 ImageSize: 00008000 Translations: 0000.04b0...

2
Published by OpenTask, Republic of Ireland Copyright © 2016 by OpenTask
Copyright © 2016 by Software Diagnostics Services
Copyright © 2016 by Dmitry Vostokov
All rights reserved. No part of this book may be reproduced, stored in a retrieval system, or
transmitted, in any form or by any means, without the prior written permission of the
publisher.
You must not circulate this book in any other binding or cover, and you must impose the same
condition on any acquirer.
Product and company names mentioned in this book may be trademarks of their owners.
OpenTask books and magazines are available through booksellers and distributors worldwide.
For further information or comments send requests to [email protected].
This book is an exerprt from ISBN-l3: 978-1-908043-46-7 (Paperback)
Revision 1.00 (July 2016)

3
Contents
About the Author.............................................................................................................................................................. 5
Minidump Analysis ........................................................................................................................................................... 7
Scripts and WinDbg Commands ................................................................................................................................... 7
Component Identification .......................................................................................................................................... 10
Raw Stack Data Analysis ............................................................................................................................................. 15
Symbols and Images ................................................................................................................................................... 24
Wait Chain (Executive Resources) .................................................................................................................................. 27

4

5
About the Author

6
Dmitry Vostokov is an internationally recognized expert, speaker, educator, scientist and author. He is the founder of pattern-oriented software diagnostics, forensics and prognostics discipline and Software Diagnostics Institute (DA+TA: DumpAnalysis.org + TraceAnalysis.org). Vostokov has also authored more than 30 books on software diagnostics, forensics, problem-solving, memory dump analysis, debugging, software trace and log analysis, reverse engineering, and malware analysis. He has more than 20 years of experience in software architecture, design, development and maintenance in a variety of industries including leadership, technical and people management roles. Dmitry also founded DiaThings,
Logtellect, OpenTask Iterative and Incremental Publishing (OpenTask.com), Software Diagnostics Services (former Memory Dump Analysis Services) PatternDiagnostics.com and Software Prognostics. In his spare time, he presents various topics on Debugging.TV and explores Software Narratology, an applied science of software stories that he pioneered, and its further development as Narratology of Things and Diagnostics of Things (DoT).

7
Minidump Analysis Reprinted from Memory Dump Analysis Anthology, Volume 1, pages 43 – 67
Scripts and WinDbg Commands
Small Memory Dumps, also referred to as minidumps because they are stored in %SystemRoot% \ Minidump folder, contain only
bugcheck information, kernel mode stack data, and the list of loaded drivers. They can be used to transmit system crash
information to a vendor or a 3rd-party for an automated crash dump analysis. Another use is to keep system crash history. In
this part, I discuss the scripting approach to extract information from all minidumps stored on a particular system. The script
processes all minidump files and creates text log files containing the following information:
1. Crash dump name and type.
2. OS information, crash time and system uptime.
3. Processor context (r) and the verbose stack trace (kv) prior to applying !analyze -v. This is useful sometimes when
WinDbg reconstructs a different stack trace after changing a processor context to the execution context at the time of a
trap, exception or fault.
4. The output of !analyze -v command.
5. Processor context (r) and verbose stack trace (kv) after !analyze -v command.
6. Code disassembly for the current execution pointer (EIP or x64 RIP). This includes forward (u) and backward (ub)
disassembly, and we also try to disassemble the whole function (uf) which should succeed if we have symbolic
information.
7. Raw stack dump with symbol information (dps).
8. The same raw stack data but interpreted as pointers to Unicode zero-terminated strings (dpu). Some pointers on the
stack might point to local string buffers located on the same stack. This can be a slow operation, and WinDbg may tem-
porarily hang.
9. The same raw stack data but interpreted as pointers to ASCII zero-terminated strings (dpa). This can be a slow
operation, and WinDbg may temporarily hang.
10. Verbose information about loaded drivers (lmv).
11. CPU, machine ID, machine-specific registers, and verbose SMBIOS information like motherboard and devices (!sysinfo).

8
Here is listing of our WinDbg script:
$$
$$ MiniDmp2Txt: Dump information from minidump into log
$$
.logopen /d /u
.echo "command> ||"
||
.echo "command> vertarget"
vertarget
.echo "command> r (before analysis)"
r
.echo "command> kv (before analysis)"
kv 100
.echo "command> !analyze -v"
!analyze -v
.echo "command> r"
r
.echo "command> kv"
kv 100
.echo "command> ub eip"
ub eip
.echo "command> u eip"
u eip
.echo "command> uf eip"
uf eip
.echo "command> dps esp-3000 esp+3000"
dps esp-3000 esp+3000
.echo "command> dpu esp-3000 esp+3000"
dpu esp-3000 esp+3000
.echo "command> dpa esp-3000 esp+3000"
dpa esp-3000 esp+3000
.echo "command> lmv"
lmv
.echo "command> !sysinfo cpuinfo"
!sysinfo cpuinfo
.echo "command> !sysinfo cpuspeed"
!sysinfo cpuspeed
.echo "command> !sysinfo cpumicrocode"
!sysinfo cpumicrocode
.echo "command> !sysinfo gbl"
!sysinfo gbl
.echo "command> !sysinfo machineid"
!sysinfo machineid
.echo "command> !sysinfo registers"
!sysinfo registers
.echo "command> !sysinfo smbios -v"
!sysinfo smbios -v
.logclose
$$
$$ MiniDmp2Txt: End of File
$$
9
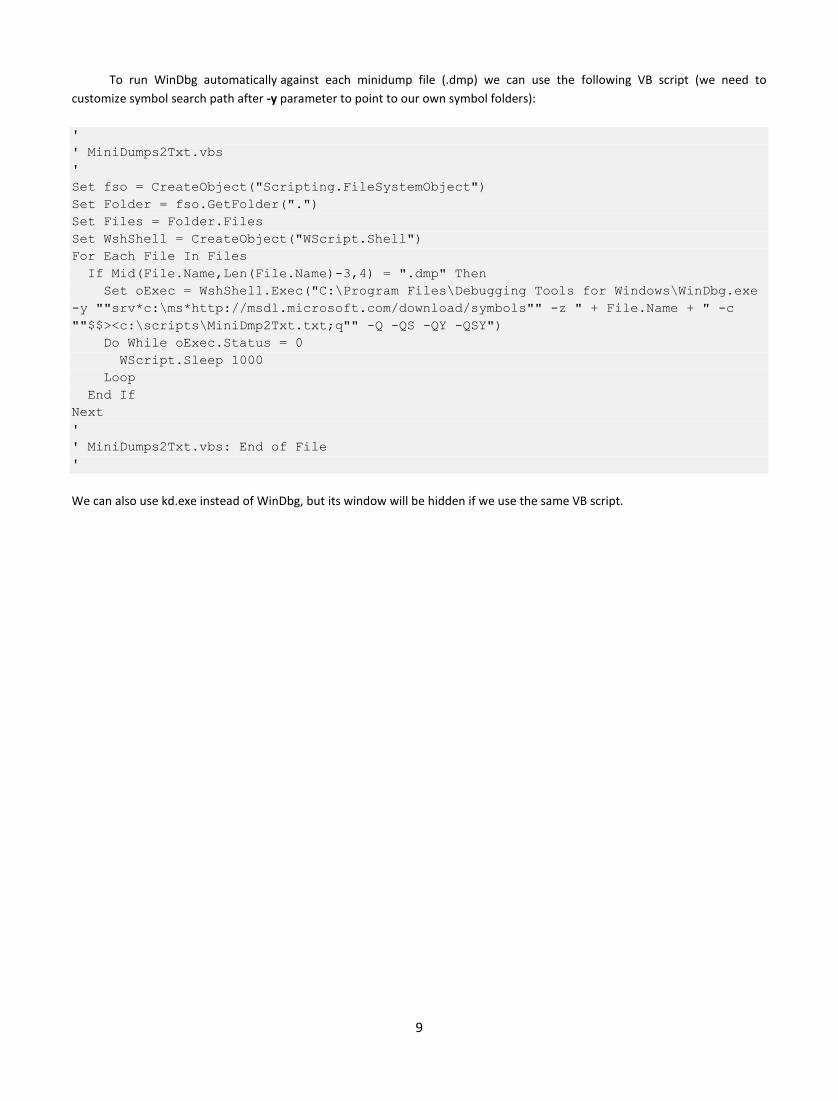
To run WinDbg automatically against each minidump file (.dmp) we can use the following VB script (we need to
customize symbol search path after -y parameter to point to our own symbol folders):
'
' MiniDumps2Txt.vbs
'
Set fso = CreateObject("Scripting.FileSystemObject")
Set Folder = fso.GetFolder(".")
Set Files = Folder.Files
Set WshShell = CreateObject("WScript.Shell")
For Each File In Files
If Mid(File.Name,Len(File.Name)-3,4) = ".dmp" Then
Set oExec = WshShell.Exec("C:\Program Files\Debugging Tools for Windows\WinDbg.exe
-y ""srv*c:\ms*http://msdl.microsoft.com/download/symbols"" -z " + File.Name + " -c
""$$><c:\scripts\MiniDmp2Txt.txt;q"" -Q -QS -QY -QSY")
Do While oExec.Status = 0
WScript.Sleep 1000
Loop
End If
Next
'
' MiniDumps2Txt.vbs: End of File
'
We can also use kd.exe instead of WinDbg, but its window will be hidden if we use the same VB script.
10
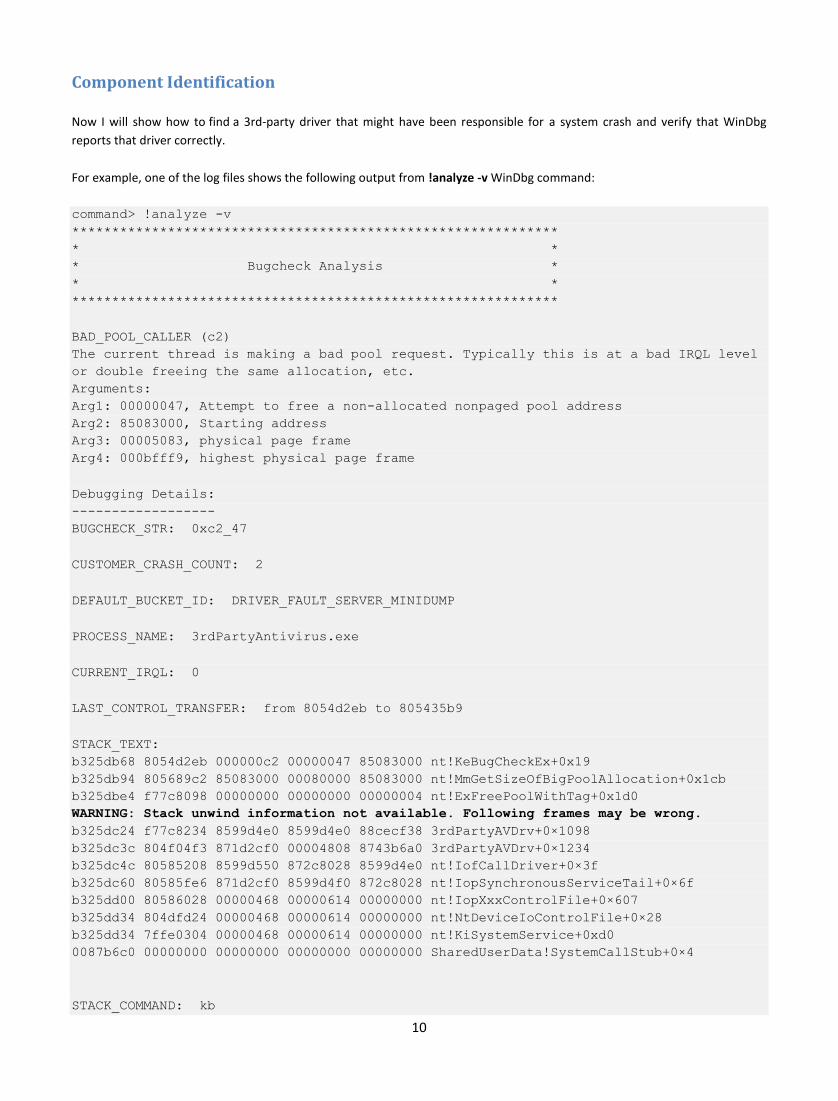
Component Identification
Now I will show how to find a 3rd-party driver that might have been responsible for a system crash and verify that WinDbg
reports that driver correctly.
For example, one of the log files shows the following output from !analyze -v WinDbg command:
command> !analyze -v
*************************************************************
* *
* Bugcheck Analysis *
* *
*************************************************************
BAD_POOL_CALLER (c2)
The current thread is making a bad pool request. Typically this is at a bad IRQL level
or double freeing the same allocation, etc.
Arguments:
Arg1: 00000047, Attempt to free a non-allocated nonpaged pool address
Arg2: 85083000, Starting address
Arg3: 00005083, physical page frame
Arg4: 000bfff9, highest physical page frame
Debugging Details:
------------------
BUGCHECK_STR: 0xc2_47
CUSTOMER_CRASH_COUNT: 2
DEFAULT_BUCKET_ID: DRIVER_FAULT_SERVER_MINIDUMP
PROCESS_NAME: 3rdPartyAntivirus.exe
CURRENT_IRQL: 0
LAST_CONTROL_TRANSFER: from 8054d2eb to 805435b9
STACK_TEXT:
b325db68 8054d2eb 000000c2 00000047 85083000 nt!KeBugCheckEx+0x19
b325db94 805689c2 85083000 00080000 85083000 nt!MmGetSizeOfBigPoolAllocation+0x1cb
b325dbe4 f77c8098 00000000 00000000 00000004 nt!ExFreePoolWithTag+0x1d0
WARNING: Stack unwind information not available. Following frames may be wrong.
b325dc24 f77c8234 8599d4e0 8599d4e0 88cecf38 3rdPartyAVDrv+0×1098
b325dc3c 804f04f3 871d2cf0 00004808 8743b6a0 3rdPartyAVDrv+0×1234
b325dc4c 80585208 8599d550 872c8028 8599d4e0 nt!IofCallDriver+0×3f
b325dc60 80585fe6 871d2cf0 8599d4f0 872c8028 nt!IopSynchronousServiceTail+0×6f
b325dd00 80586028 00000468 00000614 00000000 nt!IopXxxControlFile+0×607
b325dd34 804dfd24 00000468 00000614 00000000 nt!NtDeviceIoControlFile+0×28
b325dd34 7ffe0304 00000468 00000614 00000000 nt!KiSystemService+0xd0
0087b6c0 00000000 00000000 00000000 00000000 SharedUserData!SystemCallStub+0×4
STACK_COMMAND: kb

11
FOLLOWUP_IP:
3rdPartyAVDrv+1098
f77c8098 ?? ???
SYMBOL_STACK_INDEX: 3
SYMBOL_NAME: 3rdPartyAVDrv+1098
FOLLOWUP_NAME: MachineOwner
MODULE_NAME: 3rdPartyAVDrv
IMAGE_NAME: 3rdPartyAVDrv.sys
DEBUG_FLR_IMAGE_TIMESTAMP: 410752c5
FAILURE_BUCKET_ID: 0xc2_47_3rdPartyAVDrv+1098
BUCKET_ID: 0xc2_47_3rdPartyAVDrv+1098
Followup: MachineOwner
---------
MODULE_NAME and IMAGE_NAME fields report 3rd-party antivirus driver 3rdPartyAVDrv.sys as responsible for BSOD.
However, the top lines from STACK_TEXT field report nt module, Windows NT kernel, and system. We can get information about
all loaded drivers from the output of lmv command:
command> lmv
start end module name
804de000 80744000 nt # (pdb symbols)
c:\...\ntkrnlmp.pdb\...\ntkrnlmp.pdb
Loaded symbol image file: ntkrnlmp.exe
Mapped memory image file: c:\...\ntkrnlmp.exe\...\ntkrnlmp.exe
Image path: ntkrnlmp.exe
Image name: ntkrnlmp.exe
Timestamp: Tue Mar 25 08:39:34 2003 (3E8015C6)
CheckSum: 00254553
ImageSize: 00266000
File version: 5.2.3790.0
Product version: 5.2.3790.0
File flags: 0 (Mask 3F)
File OS: 40004 NT Win32
File type: 1.0 App
File date: 00000000.00000000
Translations: 0415.04b0
CompanyName: Microsoft Corporation
ProductName: Microsoft® Windows® Operating System
InternalName: ntkrnlmp.exe
OriginalFilename: ntkrnlmp.exe
ProductVersion: 5.2.3790.0
FileVersion: 5.2.3790.0 (srv03_rtm.030324-2048)
FileDescription: NT Kernel & System
LegalCopyright: © Microsoft Corporation. All rights reserved.

12
...
...
...
f77c7000 f77cf000 3rdPartyAVDrv 3rdPartyAVDrv.sys
Loaded symbol image file: 3rdPartyAVDrv.sys
Symbol file: 3rdPartyAVDrv.sys
Image path: 3rdPartyAVDrv.sys
Timestamp: Wed Jul 28 07:15:21 2004 (410752C5)
CheckSum: 00011518
ImageSize: 00008000
Translations: 0000.04b0 0000.04e0 0409.04b0 0409.04e0
...
...
...
Why does WinDbg skip Microsoft modules and point to the 3rd-party one? Because, when WinDbg encounters a non-
Microsoft driver it always shows it as the possible cause. If drivers are Microsoft it looks at triage.ini file located in triage folder
under Debugging Tools for Windows installation folder where certain modules and functions are listed with appropriate actions
for WinDbg, for example:
nt!KeBugCheck*=ignore
nt!ExAllocatePool=Pool_corruption
Let’s add the following entry at the end of that INI file:
3rdPartyAVDrv!*=ignore
Now, if we load the dump in WinDbg, set the symbols and run the analysis, we get different results:
3: kd> .symfix
No downstream store given, using C:\Program Files\Debugging Tools for Windows\sym
3: kd> !analyze -v
...
...
...
FOLLOWUP_NAME: MachineOwner
MODULE_NAME: nt
DEBUG_FLR_IMAGE_TIMESTAMP: 3e8015c6
SYMBOL_NAME: nt!MmGetSizeOfBigPoolAllocation+1cb
IMAGE_NAME: memory_corruption
FAILURE_BUCKET_ID: 0xc2_47_nt!MmGetSizeOfBigPoolAllocation+1cb
BUCKET_ID: 0xc2_47_nt!MmGetSizeOfBigPoolAllocation+1cb
Followup: MachineOwner
---------

13
Because nt!MmGetSizeOfBigPoolAllocation is not listed in triage.ini WinDbg reports nt module and memory corruption.
The latter cause is probably inferred from either BAD_POOL_CALLER bugcheck name or Mm function prefix.
Let’s add more lines to tiage.ini:
3rdPartyAVDrv!*=ignore
nt!MmGetSizeOfBigPoolAllocation=ignore
nt!ExFreePoolWithTag=Dynamic memory corruption detected when freeing memory
Now the analysis reports our custom follow up message:
3: kd> !analyze -v
...
...
...
FOLLOWUP_IP:
nt!ExFreePoolWithTag+1d0
805689c2 e9c8f0ffff jmp nt!ExFreePoolWithTag+0x1d0 (80567a8f)
SYMBOL_STACK_INDEX: 2
FOLLOWUP_NAME: Dynamic memory corruption detected when freeing memory
MODULE_NAME: nt
IMAGE_NAME: ntkrnlmp.exe
DEBUG_FLR_IMAGE_TIMESTAMP: 3e8015c6
SYMBOL_NAME: nt!ExFreePoolWithTag+1d0
FAILURE_BUCKET_ID: 0xc2_47_nt!ExFreePoolWithTag+1d0
BUCKET_ID: 0xc2_47_nt!ExFreePoolWithTag+1d0
Followup: Dynamic memory corruption detected when freeing memory
---------
Let’s look at STACK_TEXT data:
STACK_TEXT:
b325db68 8054d2eb 000000c2 00000047 85083000 nt!KeBugCheckEx+0x19
b325db94 805689c2 85083000 00080000 85083000 nt!MmGetSizeOfBigPoolAllocation+0x1cb
b325dbe4 f77c8098 00000000 00000000 00000004 nt!ExFreePoolWithTag+0×1d0
WARNING: Stack unwind information not available. Following frames may be wrong.
b325dc24 f77c8234 8599d4e0 8599d4e0 88cecf38 3rdPartyAVDrv+0×1098
b325dc3c 804f04f3 871d2cf0 00004808 8743b6a0 3rdPartyAVDrv+0×1234
b325dc4c 80585208 8599d550 872c8028 8599d4e0 nt!IofCallDriver+0×3f
b325dc60 80585fe6 871d2cf0 8599d4f0 872c8028 nt!IopSynchronousServiceTail+0×6f
b325dd00 80586028 00000468 00000614 00000000 nt!IopXxxControlFile+0×607
b325dd34 804dfd24 00000468 00000614 00000000 nt!NtDeviceIoControlFile+0×28
b325dd34 7ffe0304 00000468 00000614 00000000 nt!KiSystemService+0xd0
0087b6c0 00000000 00000000 00000000 00000000 SharedUserData!SystemCallStub+0×4
14
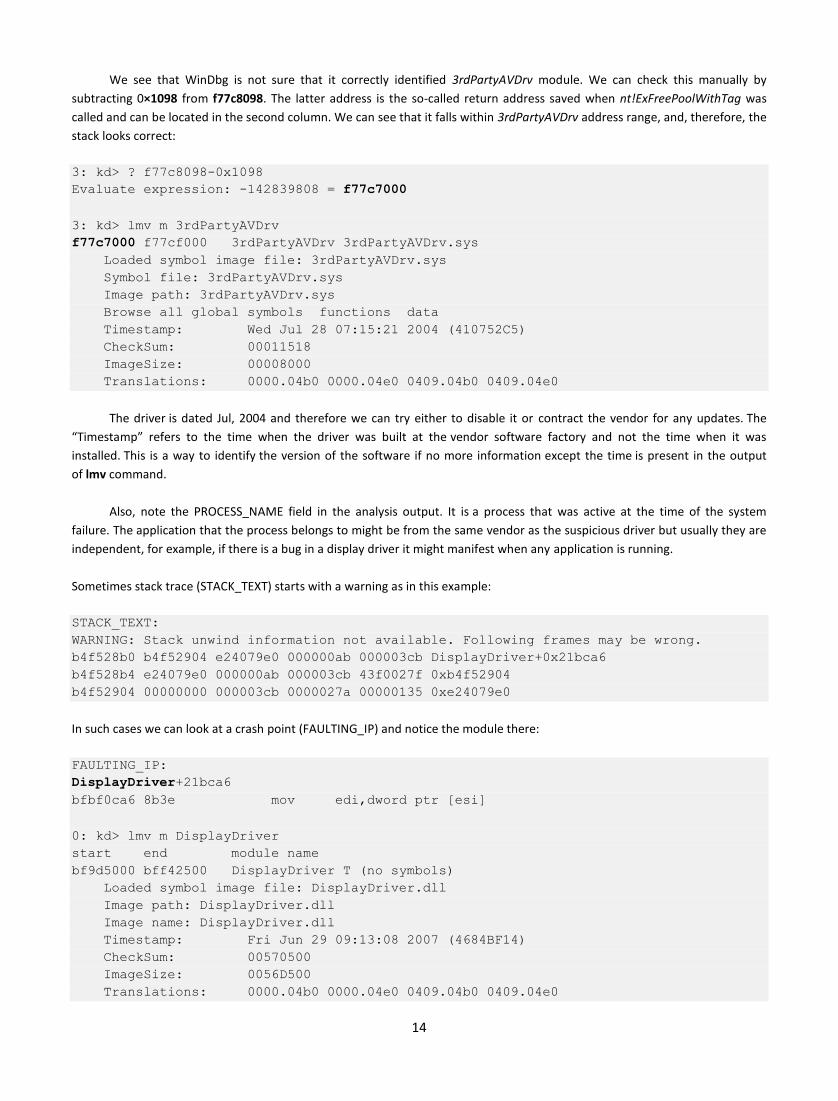
We see that WinDbg is not sure that it correctly identified 3rdPartyAVDrv module. We can check this manually by
subtracting 0×1098 from f77c8098. The latter address is the so-called return address saved when nt!ExFreePoolWithTag was
called and can be located in the second column. We can see that it falls within 3rdPartyAVDrv address range, and, therefore, the
stack looks correct:
3: kd> ? f77c8098-0x1098
Evaluate expression: -142839808 = f77c7000
3: kd> lmv m 3rdPartyAVDrv
f77c7000 f77cf000 3rdPartyAVDrv 3rdPartyAVDrv.sys
Loaded symbol image file: 3rdPartyAVDrv.sys
Symbol file: 3rdPartyAVDrv.sys
Image path: 3rdPartyAVDrv.sys
Browse all global symbols functions data
Timestamp: Wed Jul 28 07:15:21 2004 (410752C5)
CheckSum: 00011518
ImageSize: 00008000
Translations: 0000.04b0 0000.04e0 0409.04b0 0409.04e0
The driver is dated Jul, 2004 and therefore we can try either to disable it or contract the vendor for any updates. The
“Timestamp” refers to the time when the driver was built at the vendor software factory and not the time when it was
installed. This is a way to identify the version of the software if no more information except the time is present in the output
of lmv command.
Also, note the PROCESS_NAME field in the analysis output. It is a process that was active at the time of the system
failure. The application that the process belongs to might be from the same vendor as the suspicious driver but usually they are
independent, for example, if there is a bug in a display driver it might manifest when any application is running.
Sometimes stack trace (STACK_TEXT) starts with a warning as in this example:
STACK_TEXT:
WARNING: Stack unwind information not available. Following frames may be wrong.
b4f528b0 b4f52904 e24079e0 000000ab 000003cb DisplayDriver+0x21bca6
b4f528b4 e24079e0 000000ab 000003cb 43f0027f 0xb4f52904
b4f52904 00000000 000003cb 0000027a 00000135 0xe24079e0
In such cases we can look at a crash point (FAULTING_IP) and notice the module there:
FAULTING_IP:
DisplayDriver+21bca6
bfbf0ca6 8b3e mov edi,dword ptr [esi]
0: kd> lmv m DisplayDriver
start end module name
bf9d5000 bff42500 DisplayDriver T (no symbols)
Loaded symbol image file: DisplayDriver.dll
Image path: DisplayDriver.dll
Image name: DisplayDriver.dll
Timestamp: Fri Jun 29 09:13:08 2007 (4684BF14)
CheckSum: 00570500
ImageSize: 0056D500
Translations: 0000.04b0 0000.04e0 0409.04b0 0409.04e0
15
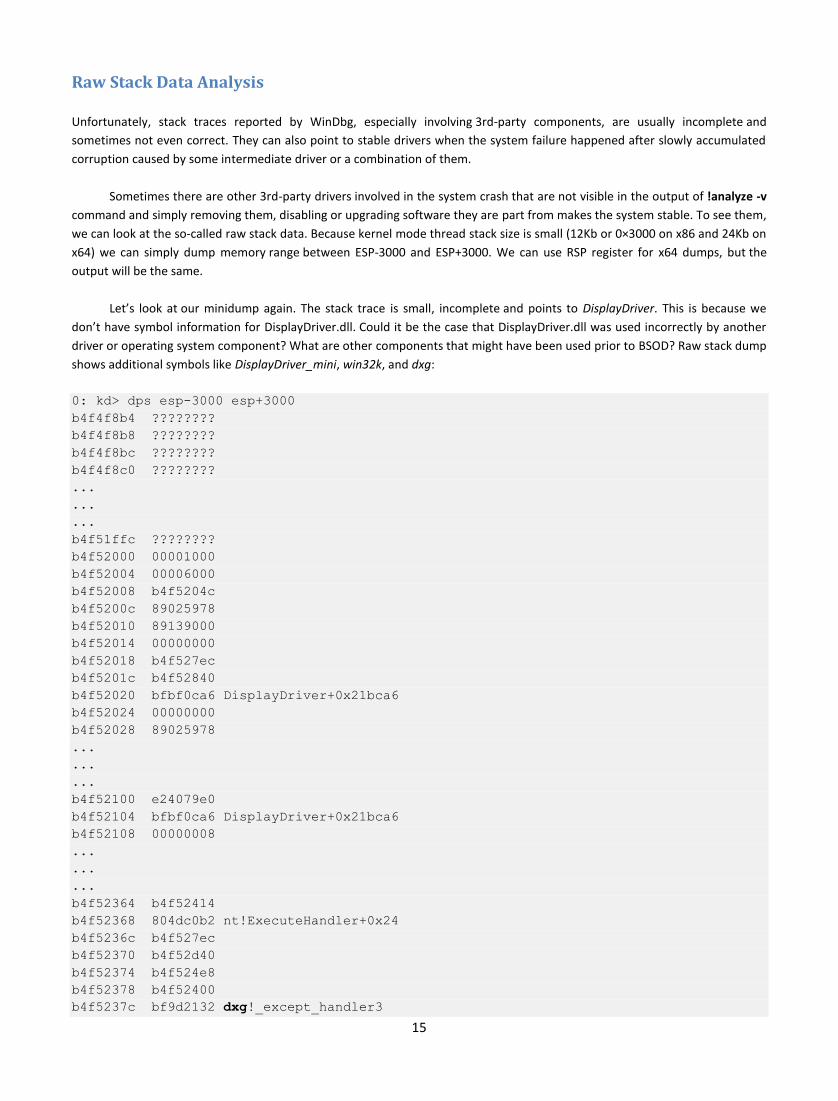
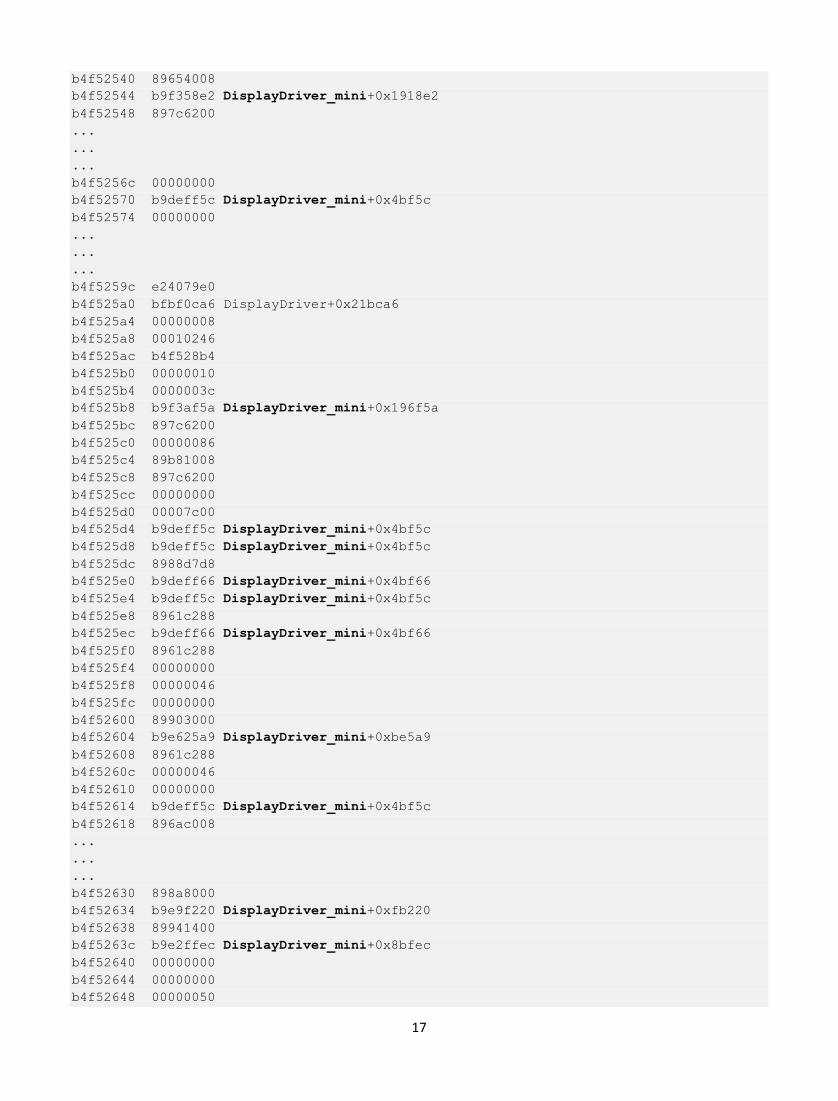
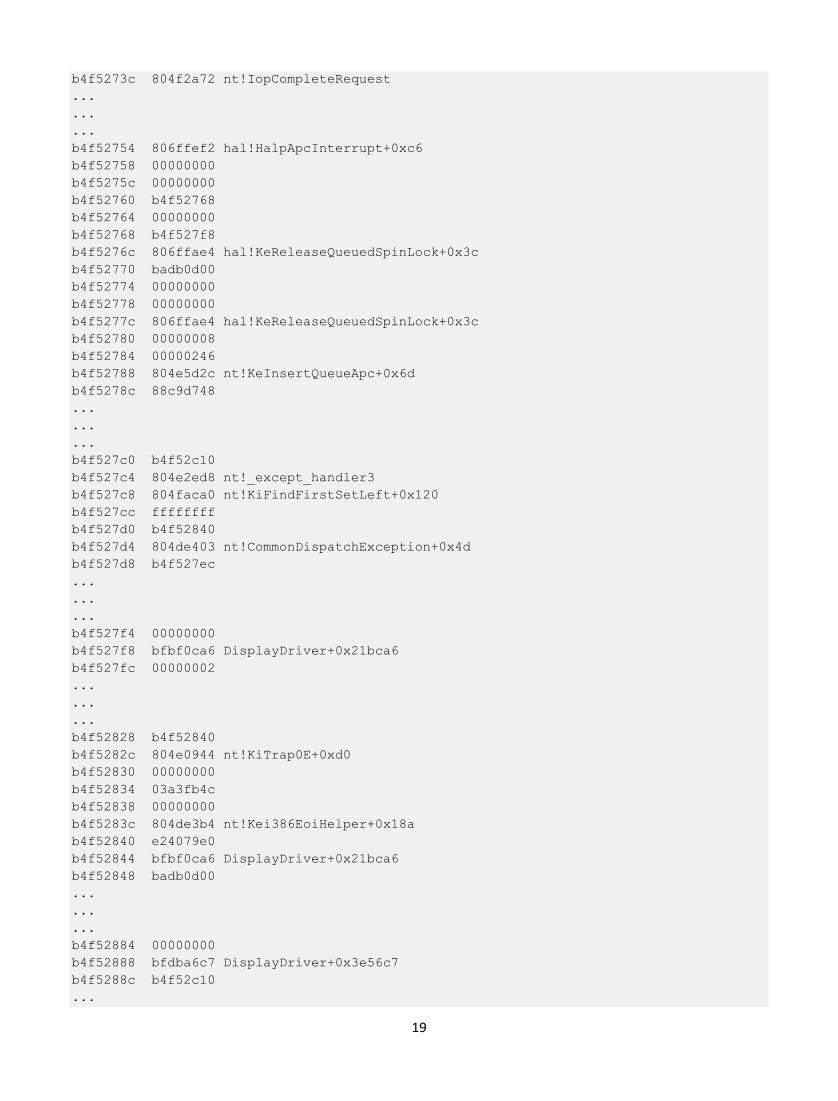
Raw Stack Data Analysis
Unfortunately, stack traces reported by WinDbg, especially involving 3rd-party components, are usually incomplete and
sometimes not even correct. They can also point to stable drivers when the system failure happened after slowly accumulated
corruption caused by some intermediate driver or a combination of them.
Sometimes there are other 3rd-party drivers involved in the system crash that are not visible in the output of !analyze -v
command and simply removing them, disabling or upgrading software they are part from makes the system stable. To see them,
we can look at the so-called raw stack data. Because kernel mode thread stack size is small (12Kb or 0×3000 on x86 and 24Kb on
x64) we can simply dump memory range between ESP-3000 and ESP+3000. We can use RSP register for x64 dumps, but the
output will be the same.
Let’s look at our minidump again. The stack trace is small, incomplete and points to DisplayDriver. This is because we
don’t have symbol information for DisplayDriver.dll. Could it be the case that DisplayDriver.dll was used incorrectly by another
driver or operating system component? What are other components that might have been used prior to BSOD? Raw stack dump
shows additional symbols like DisplayDriver_mini, win32k, and dxg:
0: kd> dps esp-3000 esp+3000
b4f4f8b4 ????????
b4f4f8b8 ????????
b4f4f8bc ????????
b4f4f8c0 ????????
...
...
...
b4f51ffc ????????
b4f52000 00001000
b4f52004 00006000
b4f52008 b4f5204c
b4f5200c 89025978
b4f52010 89139000
b4f52014 00000000
b4f52018 b4f527ec
b4f5201c b4f52840
b4f52020 bfbf0ca6 DisplayDriver+0x21bca6
b4f52024 00000000
b4f52028 89025978
...
...
...
b4f52100 e24079e0
b4f52104 bfbf0ca6 DisplayDriver+0x21bca6
b4f52108 00000008
...
...
...
b4f52364 b4f52414
b4f52368 804dc0b2 nt!ExecuteHandler+0x24
b4f5236c b4f527ec
b4f52370 b4f52d40
b4f52374 b4f524e8
b4f52378 b4f52400
b4f5237c bf9d2132 dxg!_except_handler3

16
b4f52380 2a2a2a0a
...
...
...
b4f523e8 b4f52408
b4f523ec 8053738a nt!KeBugCheckEx+0x1b
b4f523f0 0000008e
b4f523f4 c0000005
b4f523f8 bfbf0ca6 DisplayDriver+0x21bca6
b4f523fc b4f52840
b4f52400 00000000
b4f52404 00000000
b4f52408 b4f527d0
b4f5240c 80521fed nt!KiDispatchException+0x3b1
b4f52410 0000008e
b4f52414 c0000005
b4f52418 bfbf0ca6 DisplayDriver+0x21bca6
b4f5241c b4f52840
b4f52420 00000000
b4f52424 03a3fb4c
b4f52428 03a3fb4c
b4f5242c b4f52800
b4f52430 00000000
b4f52434 00000000
b4f52438 00000000
b4f5243c b9deffc6 DisplayDriver_mini+0x4bfc6
b4f52440 897c621c
b4f52444 00000086
b4f52448 0000003c
b4f5244c b9f3af5a DisplayDriver_mini+0x196f5a
b4f52450 897c6200
b4f52454 00000086
b4f52458 897c6200
b4f5245c 00000000
b4f52460 00000000
b4f52464 00000000
b4f52468 b9f38b4e DisplayDriver_mini+0x194b4e
b4f5246c 00000000
...
...
...
b4f5250c 00002800
b4f52510 b9f3ac10 DisplayDriver_mini+0x196c10
b4f52514 897c6200
b4f52518 00002504
b4f5251c 00000010
b4f52520 897c6200
b4f52524 b9f2d194 DisplayDriver_mini+0x189194
b4f52528 897c6200
b4f5252c 00002504
b4f52530 00000010
b4f52534 897c6200
b4f52538 898cca80
b4f5253c 00000080
17
b4f52540 89654008
b4f52544 b9f358e2 DisplayDriver_mini+0x1918e2
b4f52548 897c6200
...
...
...
b4f5256c 00000000
b4f52570 b9deff5c DisplayDriver_mini+0x4bf5c
b4f52574 00000000
...
...
...
b4f5259c e24079e0
b4f525a0 bfbf0ca6 DisplayDriver+0x21bca6
b4f525a4 00000008
b4f525a8 00010246
b4f525ac b4f528b4
b4f525b0 00000010
b4f525b4 0000003c
b4f525b8 b9f3af5a DisplayDriver_mini+0x196f5a
b4f525bc 897c6200
b4f525c0 00000086
b4f525c4 89b81008
b4f525c8 897c6200
b4f525cc 00000000
b4f525d0 00007c00
b4f525d4 b9deff5c DisplayDriver_mini+0x4bf5c
b4f525d8 b9deff5c DisplayDriver_mini+0x4bf5c
b4f525dc 8988d7d8
b4f525e0 b9deff66 DisplayDriver_mini+0x4bf66
b4f525e4 b9deff5c DisplayDriver_mini+0x4bf5c
b4f525e8 8961c288
b4f525ec b9deff66 DisplayDriver_mini+0x4bf66
b4f525f0 8961c288
b4f525f4 00000000
b4f525f8 00000046
b4f525fc 00000000
b4f52600 89903000
b4f52604 b9e625a9 DisplayDriver_mini+0xbe5a9
b4f52608 8961c288
b4f5260c 00000046
b4f52610 00000000
b4f52614 b9deff5c DisplayDriver_mini+0x4bf5c
b4f52618 896ac008
...
...
...
b4f52630 898a8000
b4f52634 b9e9f220 DisplayDriver_mini+0xfb220
b4f52638 89941400
b4f5263c b9e2ffec DisplayDriver_mini+0x8bfec
b4f52640 00000000
b4f52644 00000000
b4f52648 00000050

18
b4f5264c b9e790d3 DisplayDriver_mini+0xd50d3
b4f52650 897c6200
...
...
...
b4f5266c 89bf6200
b4f52670 805502fa nt!ExFreePoolWithTag+0x664
b4f52674 00000000
b4f52678 88f322e0
b4f5267c 88c9d708
b4f52680 00000001
b4f52684 898cf918
b4f52688 ffdff538
b4f5268c 804dc766 nt!KiUnlockDispatcherDatabase+0x1c
b4f52690 b4f52901
b4f52694 b4f526ac
b4f52698 00000001
b4f5269c 804eaf06 nt!IopFreeIrp+0xed
b4f526a0 00000000
b4f526a4 00000000
b4f526a8 88c9d708
b4f526ac b4f52700
b4f526b0 804f2b9f nt!IopCompleteRequest+0x319
b4f526b4 804f2bb5 nt!IopCompleteRequest+0x32f
b4f526b8 88c9d748
b4f526bc 89025978
b4f526c0 890259ac
b4f526c4 897752e8
b4f526c8 89025978
b4f526cc b4f52910
b4f526d0 b4f527c8
b4f526d4 00000000
b4f526d8 b9e0d300 DisplayDriver_mini+0x69300
b4f526dc 88c9d708
b4f526e0 00000000
b4f526e4 00000086
b4f526e8 b4f526b8
b4f526ec b9f3ad28 DisplayDriver_mini+0x196d28
b4f526f0 ffffffff
b4f526f4 804e2ed8 nt!_except_handler3
b4f526f8 804f2bb8 nt!GUID_DOCK_INTERFACE+0x424
b4f526fc ffffffff
b4f52700 804f2bb5 nt!IopCompleteRequest+0x32f
b4f52704 804f2db5 nt!KiDeliverApc+0xb3
b4f52708 88c9d748
b4f5270c b4f5274c
b4f52710 b4f52728
b4f52714 890259ac
b4f52718 804dce74 nt!KiDeliverApc+0x1e0
b4f5271c 806ffae4 hal!KeReleaseQueuedSpinLock+0x3c
...
...
...
b4f52738 88e775c8
19
b4f5273c 804f2a72 nt!IopCompleteRequest
...
...
...
b4f52754 806ffef2 hal!HalpApcInterrupt+0xc6
b4f52758 00000000
b4f5275c 00000000
b4f52760 b4f52768
b4f52764 00000000
b4f52768 b4f527f8
b4f5276c 806ffae4 hal!KeReleaseQueuedSpinLock+0x3c
b4f52770 badb0d00
b4f52774 00000000
b4f52778 00000000
b4f5277c 806ffae4 hal!KeReleaseQueuedSpinLock+0x3c
b4f52780 00000008
b4f52784 00000246
b4f52788 804e5d2c nt!KeInsertQueueApc+0x6d
b4f5278c 88c9d748
...
...
...
b4f527c0 b4f52c10
b4f527c4 804e2ed8 nt!_except_handler3
b4f527c8 804faca0 nt!KiFindFirstSetLeft+0x120
b4f527cc ffffffff
b4f527d0 b4f52840
b4f527d4 804de403 nt!CommonDispatchException+0x4d
b4f527d8 b4f527ec
...
...
...
b4f527f4 00000000
b4f527f8 bfbf0ca6 DisplayDriver+0x21bca6
b4f527fc 00000002
...
...
...
b4f52828 b4f52840
b4f5282c 804e0944 nt!KiTrap0E+0xd0
b4f52830 00000000
b4f52834 03a3fb4c
b4f52838 00000000
b4f5283c 804de3b4 nt!Kei386EoiHelper+0x18a
b4f52840 e24079e0
b4f52844 bfbf0ca6 DisplayDriver+0x21bca6
b4f52848 badb0d00
...
...
...
b4f52884 00000000
b4f52888 bfdba6c7 DisplayDriver+0x3e56c7
b4f5288c b4f52c10
...

20
...
...
b4f528a4 00000000
b4f528a8 bfbf0ca6 DisplayDriver+0x21bca6
b4f528ac 00000008
...
...
...
b4f528d8 000000f3
b4f528dc bfb6269f DisplayDriver+0x18d69f
b4f528e0 9745d083
b4f528e4 00000001
b4f528e8 e9a18d4c
b4f528ec ffffffff
b4f528f0 bfb268e7 DisplayDriver+0x1518e7
b4f528f4 000000ab
...
...
...
b4f52960 0000027a
b4f52964 bfb2696c DisplayDriver+0x15196c
b4f52968 00000000
...
...
...
b4f5298c e2004308
b4f52990 bfab8ce4 DisplayDriver+0xe3ce4
b4f52994 000000ab
...
...
...
b4f52bd0 00000000
b4f52bd4 bf804779 win32k!GreReleaseFastMutex+0x14
b4f52bd8 b4f52be8
b4f52bdc bf8a04e3 win32k!dhpdevRetrieveNode+0x32
b4f52be0 89b20128
b4f52be4 b4f52c50
b4f52be8 b4f52c20
b4f52bec bf907d15 win32k!WatchdogDdBlt+0x38
b4f52bf0 b4f52c50
...
...
...
b4f52c10 b4f52d40
b4f52c14 bf9877ae win32k!_except_handler3
b4f52c18 bf995380 win32k!`string'+0x2b4
b4f52c1c 00000000
b4f52c20 b4f52d50
b4f52c24 bf9cdd78 dxg!DxDdBlt+0x374
b4f52c28 b4f52c50
b4f52c2c b4f52d64
b4f52c30 038dfaf4
b4f52c34 bf907ca3 win32k!NtGdiDdBlt
b4f52c38 00000001

21
...
...
...
b4f52c90 000000b0
b4f52c94 bf805b42 win32k!AllocateObject+0xaa
b4f52c98 00000001
b4f52c9c 00000006
b4f52ca0 b4f52cb0
b4f52ca4 32040ddf
b4f52ca8 bf805734 win32k!HANDLELOCK::vLockHandle+0x75
b4f52cac 00000ff4
b4f52cb0 00000000
b4f52cb4 bc40ddf0
b4f52cb8 b4f52cd0
b4f52cbc 00000001
b4f52cc0 804da3ee nt!ExAcquireResourceExclusiveLite+0x67
b4f52cc4 00000008
...
...
...
b4f52ce8 80004005
b4f52cec 804dc605 nt!ExReleaseResourceLite+0x8d
b4f52cf0 00000000
...
...
...
b4f52d08 b4f52d18
b4f52d0c bf8018bf win32k!GreReleaseSemaphore+0xa
b4f52d10 bf803d1e win32k!GreUnlockDisplay+0x24
b4f52d14 00000000
...
...
...
b4f52d40 ffffffff
b4f52d44 bf9d2132 dxg!_except_handler3
b4f52d48 bf9d2928 dxg!GUID_MiscellaneousCallbacks+0x42c
b4f52d4c ffffffff
b4f52d50 b4f52d64
b4f52d54 804dd99f nt!KiFastCallEntry+0xfc
b4f52d58 02400002
...
...
...
b4f52ddc 00000023
b4f52de0 804ec781 nt!KiThreadStartup+0x16
b4f52de4 f7849b85 NDIS!ndisWorkerThread
b4f52de8 88c9d4d0
b4f52dec 00000000
b4f52df0 0020027f
b4f52df4 011c0000
b4f52df8 bfdb97b7 DisplayDriver+0x3e47b7
b4f52dfc 00000008
...
...

22
...
b4f52e70 00000000
b4f52e74 f7800000 InCDPass+0x1000
b4f52e78 00004026
...
...
...
b4f52ff8 00000000
b4f52ffc 00000000
b4f53000 ????????
b4f53004 ????????
Some are coincidental like InCDPass and NDIS. Obviously DisplayDriver, DisplayDriver_mini, dxg, and win32k should be
related due to their functional purpose: Display, DirectX, GDI (Graphics Device Interface). Now we can check their module
information:
0: kd> lmv m DisplayDriver
start end module name
bf9d5000 bff42500 DisplayDriver T (no symbols)
Loaded symbol image file: DisplayDriver.dll
Image path: DisplayDriver.dll
Image name: DisplayDriver.dll
Timestamp: Fri Jun 29 09:13:08 2007 (4684BF14)
CheckSum: 00570500
ImageSize: 0056D500
Translations: 0000.04b0 0000.04e0 0409.04b0 0409.04e0
0: kd> lmv m DisplayDriver_mini
start end module name
b9da4000 ba421f20 DisplayDriver_mini T (no symbols)
Loaded symbol image file: DisplayDriver_mini.sys
Image path: DisplayDriver_mini.sys
Image name: DisplayDriver_mini.sys
Timestamp: Fri Jun 29 09:16:41 2007 (4684BFE9)
CheckSum: 00680F20
ImageSize: 0067DF20
Translations: 0000.04b0 0000.04e0 0409.04b0 0409.04e0
0: kd> lmv m dxg
start end module name
bf9c3000 bf9d4580 dxg (pdb symbols)
Loaded symbol image file: dxg.sys
Mapped memory image file: c:\websymbols\dxg.sys\41107B9311580\dxg.sys
Image path: dxg.sys
Image name: dxg.sys
Timestamp: Wed Aug 04 07:00:51 2004 (41107B93)
CheckSum: 0001D181
ImageSize: 00011580
File version: 5.1.2600.2180
Product version: 5.1.2600.2180
File flags: 0 (Mask 3F)
File OS: 40004 NT Win32
File type: 3.7 Driver
File date: 00000000.00000000

23
Translations: 0409.04b0
CompanyName: Microsoft Corporation
ProductName: Microsoft® Windows® Operating System
InternalName: dxg.sys
OriginalFilename: dxg.sys
ProductVersion: 5.1.2600.2180
FileVersion: 5.1.2600.2180 (xpsp_sp2_rtm.040803-2158)
FileDescription: DirectX Graphics Driver
LegalCopyright: © Microsoft Corporation. All rights reserved.
0: kd> lmv m win32k
start end module name
bf800000 bf9c2180 win32k # (pdb symbols)
Loaded symbol image file: win32k.sys
Mapped memory image file: c:\websymbols\win32k.sys\45F013F61c2180\win32k.sys
Image path: win32k.sys
Image name: win32k.sys
Timestamp: Thu Mar 08 13:47:34 2007 (45F013F6)
CheckSum: 001C4886
ImageSize: 001C2180
File version: 5.1.2600.3099
Product version: 5.1.2600.3099
File flags: 0 (Mask 3F)
File OS: 40004 NT Win32
File type: 3.7 Driver
File date: 00000000.00000000
Translations: 0406.04b0
CompanyName: Microsoft Corporation
ProductName: Microsoft® Windows® Operativsystem
InternalName: win32k.sys
OriginalFilename: win32k.sys
ProductVersion: 5.1.2600.3099
FileVersion: 5.1.2600.3099 (xpsp_sp2_gdr.070308-0222)
FileDescription: Win32-flerbrugerdriver
LegalCopyright: © Microsoft Corporation. Alle rettigheder forbeholdes.
24
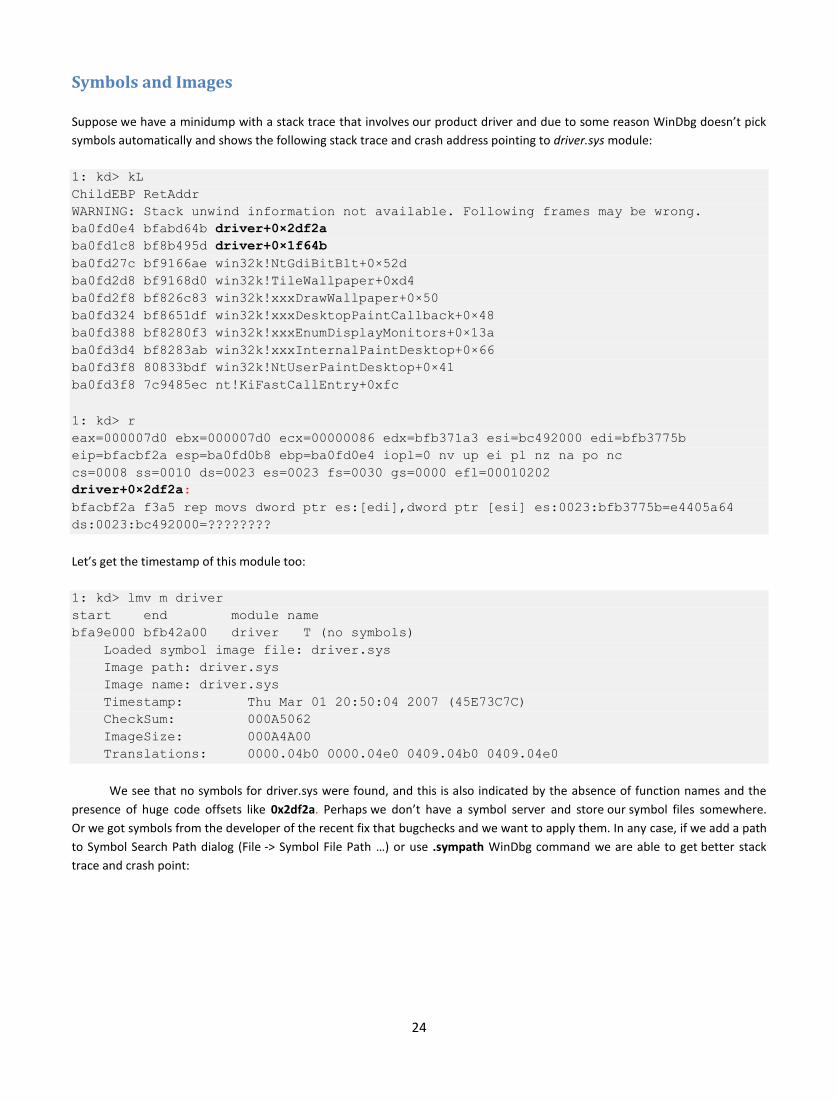
Symbols and Images
Suppose we have a minidump with a stack trace that involves our product driver and due to some reason WinDbg doesn’t pick
symbols automatically and shows the following stack trace and crash address pointing to driver.sys module:
1: kd> kL
ChildEBP RetAddr
WARNING: Stack unwind information not available. Following frames may be wrong.
ba0fd0e4 bfabd64b driver+0×2df2a
ba0fd1c8 bf8b495d driver+0×1f64b
ba0fd27c bf9166ae win32k!NtGdiBitBlt+0×52d
ba0fd2d8 bf9168d0 win32k!TileWallpaper+0xd4
ba0fd2f8 bf826c83 win32k!xxxDrawWallpaper+0×50
ba0fd324 bf8651df win32k!xxxDesktopPaintCallback+0×48
ba0fd388 bf8280f3 win32k!xxxEnumDisplayMonitors+0×13a
ba0fd3d4 bf8283ab win32k!xxxInternalPaintDesktop+0×66
ba0fd3f8 80833bdf win32k!NtUserPaintDesktop+0×41
ba0fd3f8 7c9485ec nt!KiFastCallEntry+0xfc
1: kd> r
eax=000007d0 ebx=000007d0 ecx=00000086 edx=bfb371a3 esi=bc492000 edi=bfb3775b
eip=bfacbf2a esp=ba0fd0b8 ebp=ba0fd0e4 iopl=0 nv up ei pl nz na po nc
cs=0008 ss=0010 ds=0023 es=0023 fs=0030 gs=0000 efl=00010202
driver+0×2df2a:
bfacbf2a f3a5 rep movs dword ptr es:[edi],dword ptr [esi] es:0023:bfb3775b=e4405a64
ds:0023:bc492000=????????
Let’s get the timestamp of this module too:
1: kd> lmv m driver
start end module name
bfa9e000 bfb42a00 driver T (no symbols)
Loaded symbol image file: driver.sys
Image path: driver.sys
Image name: driver.sys
Timestamp: Thu Mar 01 20:50:04 2007 (45E73C7C)
CheckSum: 000A5062
ImageSize: 000A4A00
Translations: 0000.04b0 0000.04e0 0409.04b0 0409.04e0
We see that no symbols for driver.sys were found, and this is also indicated by the absence of function names and the
presence of huge code offsets like 0x2df2a. Perhaps we don’t have a symbol server and store our symbol files somewhere.
Or we got symbols from the developer of the recent fix that bugchecks and we want to apply them. In any case, if we add a path
to Symbol Search Path dialog (File -> Symbol File Path …) or use .sympath WinDbg command we are able to get better stack
trace and crash point:

25
1: kd> .reload
Loading Kernel Symbols
...
Loading User Symbols
Loading unloaded module list
...
Unable to load image driver.sys, Win32 error 0n2
*** WARNING: Unable to verify timestamp for driver.sys
1: kd> kL
ChildEBP RetAddr
ba0fd0c0 bfabc399 driver!ProcessBytes+0×18
ba0fd0e4 bfabd64b driver!ProcessObject+0xc9
ba0fd1c8 bf8b495d driver!CacheBitBlt+0×13d
ba0fd27c bf9166ae win32k!NtGdiBitBlt+0×52d
ba0fd2d8 bf9168d0 win32k!TileWallpaper+0xd4
ba0fd2f8 bf826c83 win32k!xxxDrawWallpaper+0×50
ba0fd324 bf8651df win32k!xxxDesktopPaintCallback+0×48
ba0fd388 bf8280f3 win32k!xxxEnumDisplayMonitors+0×13a
ba0fd3d4 bf8283ab win32k!xxxInternalPaintDesktop+0×66
ba0fd3f8 80833bdf win32k!NtUserPaintDesktop+0×41
ba0fd3f8 7c9485ec nt!KiFastCallEntry+0xfc
1: kd> r
eax=000007d0 ebx=000007d0 ecx=00000086 edx=bfb371a3 esi=bc492000 edi=bfb3775b
eip=bfacbf2a esp=ba0fd0b8 ebp=ba0fd0e4 iopl=0 nv up ei pl nz na po nc
cs=0008 ss=0010 ds=0023 es=0023 fs=0030 gs=0000 efl=00010202
driver!ProcessBytes+0×18:
bfacbf2a f3a5 rep movs dword ptr es:[edi],dword ptr [esi] es:0023:bfb3775b=e4405a64
ds:0023:bc492000=????????
Because WinDbg reports that it was unable to verify timestamp for driver.sys we might want to double check the return
address saved when ProcessBytes function was called. If symbols are correct then disassembling the return address backward
will most likely show ProcessObject function code and “call” instruction with ProcessBytes address. Unfortunately, minidumps
don’t have executable code regions except for the currently executing function:
1: kd> ub bfabc399
^ Unable to find valid previous instruction for 'ub bfabc399'
1: kd> uf driver!ProcessObject
No code found, aborting

26
Therefore, we need to point WinDbg to our driver.sys which contains executable code. This can be done by specifying a
path in Executable Image Search Path dialog (File -> Image File Path …) or using .exepath WinDbg command.
Now we get a complete stack trace, and we are able to double check the return address:
1: kd> .reload
Loading Kernel Symbols
...
Loading User Symbols
Loading unloaded module list
...
1: kd> kL
ChildEBP RetAddr
ba0fd0c0 bfabc399 driver!ProcessBytes+0×18
ba0fd0e4 bfabd64b driver!ProcessObject+0xc9
ba0fd104 bfac5aac driver!CacheBitBlt+0×13d
ba0fd114 bfac6840 driver!ProcessCommand+0×150
ba0fd140 bfac1878 driver!CheckSurface+0×258
ba0fd178 bfaba0ee driver!CopyBitsEx+0xfa
ba0fd1c8 bf8b495d driver!DrvCopyBits+0xb6
ba0fd27c bf9166ae win32k!NtGdiBitBlt+0×52d
ba0fd2d8 bf9168d0 win32k!TileWallpaper+0xd4
ba0fd2f8 bf826c83 win32k!xxxDrawWallpaper+0×50
ba0fd324 bf8651df win32k!xxxDesktopPaintCallback+0×48
ba0fd388 bf8280f3 win32k!xxxEnumDisplayMonitors+0×13a
ba0fd3d4 bf8283ab win32k!xxxInternalPaintDesktop+0×66
ba0fd3f8 80833bdf win32k!NtUserPaintDesktop+0×41
ba0fd3f8 7c9485ec nt!KiFastCallEntry+0xfc
1: kd> ub bfabc399
driver!ProcessObject+0xb7:
bfabc387 57 push edi
bfabc388 40 inc eax
bfabc389 50 push eax
bfabc38a e861fb0000 call driver!convert (bfacbef0)
bfabc38f ff7508 push dword ptr [ebp+8]
bfabc392 57 push edi
bfabc393 50 push eax
bfabc394 e879fb0000 call driver!ProcessBytes (bfacbf12)
27
Wait Chain (Executive Resources) Reprinted from Memory Dump Analysis Anthology, Volume 2, pages 147 – 150
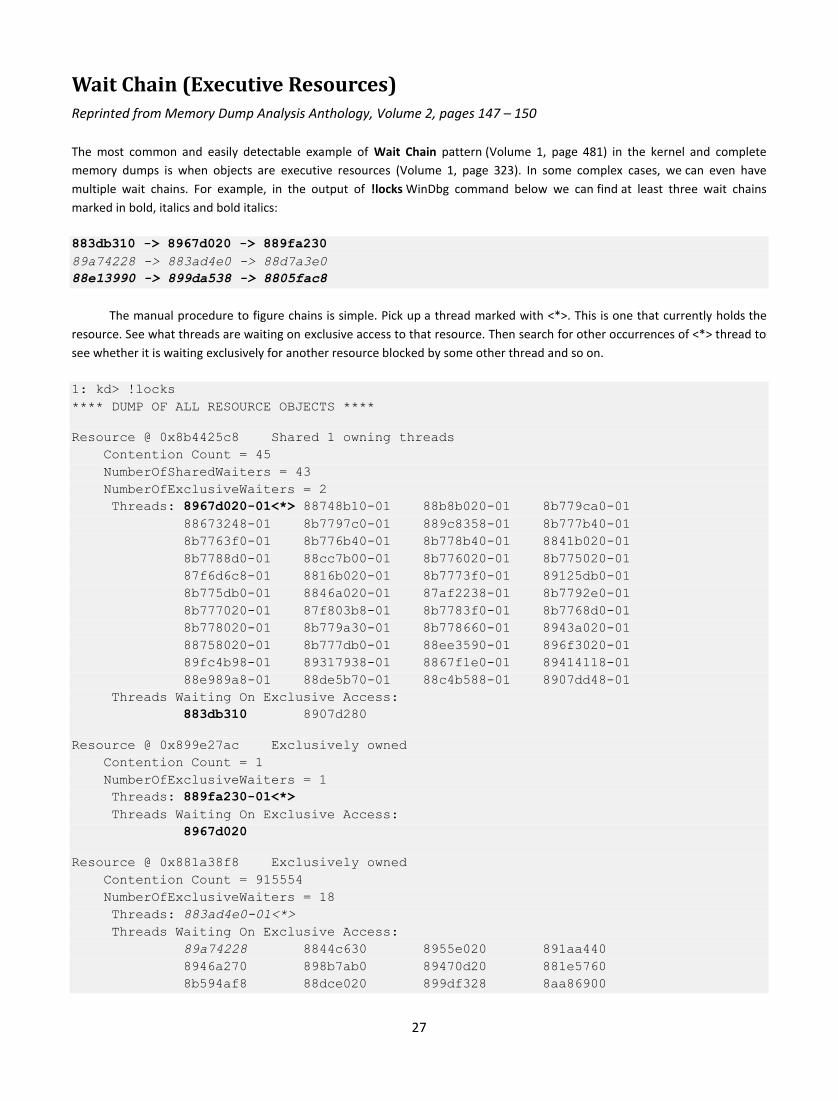
The most common and easily detectable example of Wait Chain pattern (Volume 1, page 481) in the kernel and complete
memory dumps is when objects are executive resources (Volume 1, page 323). In some complex cases, we can even have
multiple wait chains. For example, in the output of !locks WinDbg command below we can find at least three wait chains
marked in bold, italics and bold italics:
883db310 -> 8967d020 -> 889fa230
89a74228 -> 883ad4e0 -> 88d7a3e0
88e13990 -> 899da538 -> 8805fac8
The manual procedure to figure chains is simple. Pick up a thread marked with <*>. This is one that currently holds the
resource. See what threads are waiting on exclusive access to that resource. Then search for other occurrences of <*> thread to
see whether it is waiting exclusively for another resource blocked by some other thread and so on.
1: kd> !locks
**** DUMP OF ALL RESOURCE OBJECTS ****
Resource @ 0x8b4425c8 Shared 1 owning threads
Contention Count = 45
NumberOfSharedWaiters = 43
NumberOfExclusiveWaiters = 2
Threads: 8967d020-01<*> 88748b10-01 88b8b020-01 8b779ca0-01
88673248-01 8b7797c0-01 889c8358-01 8b777b40-01
8b7763f0-01 8b776b40-01 8b778b40-01 8841b020-01
8b7788d0-01 88cc7b00-01 8b776020-01 8b775020-01
87f6d6c8-01 8816b020-01 8b7773f0-01 89125db0-01
8b775db0-01 8846a020-01 87af2238-01 8b7792e0-01
8b777020-01 87f803b8-01 8b7783f0-01 8b7768d0-01
8b778020-01 8b779a30-01 8b778660-01 8943a020-01
88758020-01 8b777db0-01 88ee3590-01 896f3020-01
89fc4b98-01 89317938-01 8867f1e0-01 89414118-01
88e989a8-01 88de5b70-01 88c4b588-01 8907dd48-01
Threads Waiting On Exclusive Access:
883db310 8907d280
Resource @ 0x899e27ac Exclusively owned
Contention Count = 1
NumberOfExclusiveWaiters = 1
Threads: 889fa230-01<*>
Threads Waiting On Exclusive Access:
8967d020
Resource @ 0x881a38f8 Exclusively owned
Contention Count = 915554
NumberOfExclusiveWaiters = 18
Threads: 883ad4e0-01<*>
Threads Waiting On Exclusive Access:
89a74228 8844c630 8955e020 891aa440
8946a270 898b7ab0 89470d20 881e5760
8b594af8 88dce020 899df328 8aa86900
28
897ff020 8920adb0 8972b1c0 89657c70
88bcc868 88cb0cb0
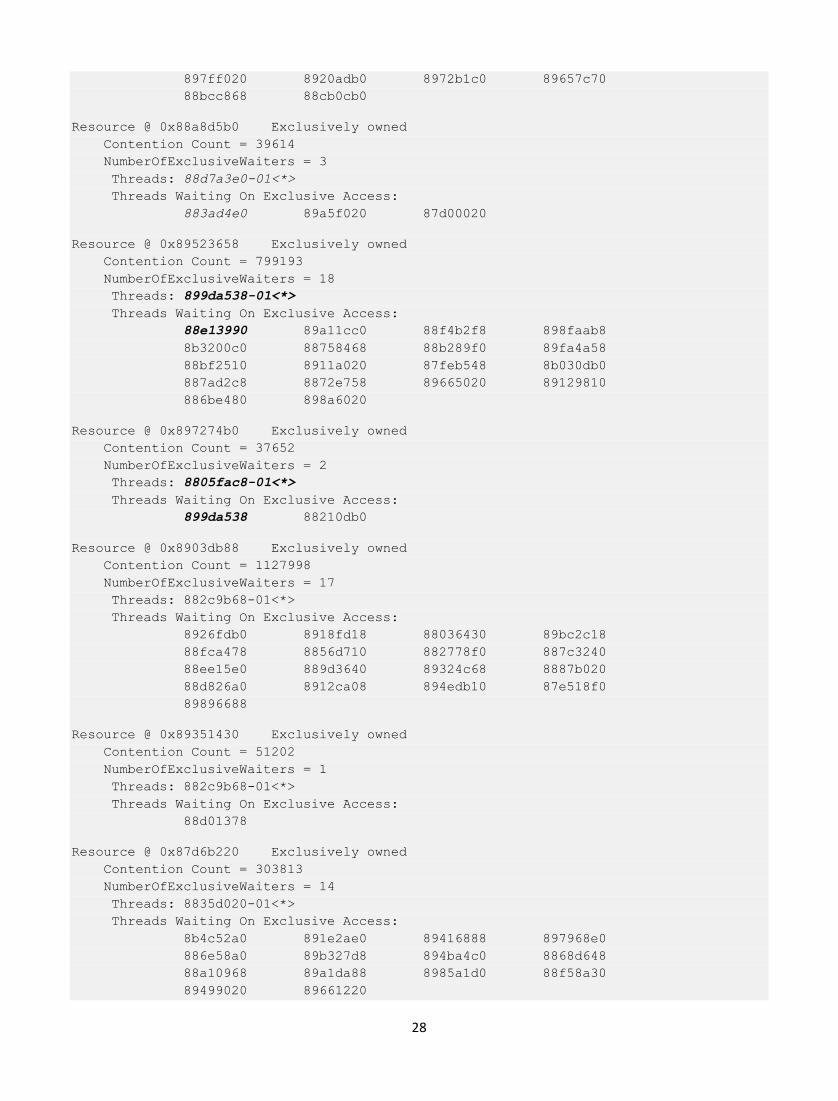
Resource @ 0x88a8d5b0 Exclusively owned
Contention Count = 39614
NumberOfExclusiveWaiters = 3
Threads: 88d7a3e0-01<*>
Threads Waiting On Exclusive Access:
883ad4e0 89a5f020 87d00020
Resource @ 0x89523658 Exclusively owned
Contention Count = 799193
NumberOfExclusiveWaiters = 18
Threads: 899da538-01<*>
Threads Waiting On Exclusive Access:
88e13990 89a11cc0 88f4b2f8 898faab8
8b3200c0 88758468 88b289f0 89fa4a58
88bf2510 8911a020 87feb548 8b030db0
887ad2c8 8872e758 89665020 89129810
886be480 898a6020
Resource @ 0x897274b0 Exclusively owned
Contention Count = 37652
NumberOfExclusiveWaiters = 2
Threads: 8805fac8-01<*>
Threads Waiting On Exclusive Access:
899da538 88210db0
Resource @ 0x8903db88 Exclusively owned
Contention Count = 1127998
NumberOfExclusiveWaiters = 17
Threads: 882c9b68-01<*>
Threads Waiting On Exclusive Access:
8926fdb0 8918fd18 88036430 89bc2c18
88fca478 8856d710 882778f0 887c3240
88ee15e0 889d3640 89324c68 8887b020
88d826a0 8912ca08 894edb10 87e518f0
89896688
Resource @ 0x89351430 Exclusively owned
Contention Count = 51202
NumberOfExclusiveWaiters = 1
Threads: 882c9b68-01<*>
Threads Waiting On Exclusive Access:
88d01378
Resource @ 0x87d6b220 Exclusively owned
Contention Count = 303813
NumberOfExclusiveWaiters = 14
Threads: 8835d020-01<*>
Threads Waiting On Exclusive Access:
8b4c52a0 891e2ae0 89416888 897968e0
886e58a0 89b327d8 894ba4c0 8868d648
88a10968 89a1da88 8985a1d0 88f58a30
89499020 89661220
29
Resource @ 0x88332cc8 Exclusively owned
Contention Count = 21214
NumberOfExclusiveWaiters = 3
Threads: 88d15b50-01<*>
Threads Waiting On Exclusive Access:
88648020 8835d020 88a20ab8
Resource @ 0x8986ab80 Exclusively owned
Contention Count = 753246
NumberOfExclusiveWaiters = 13
Threads: 88e6ea60-01<*>
Threads Waiting On Exclusive Access:
89249020 87e01d50 889fb6c8 89742cd0
8803b6a8 888015e0 88a89ba0 88c09020
8874d470 88d97db0 8919a2d0 882732c0
89a9eb28
Resource @ 0x88c331c0 Exclusively owned
Contention Count = 16940
NumberOfExclusiveWaiters = 2
Threads: 8b31c748-01<*>
Threads Waiting On Exclusive Access:
896b3390 88e6ea60
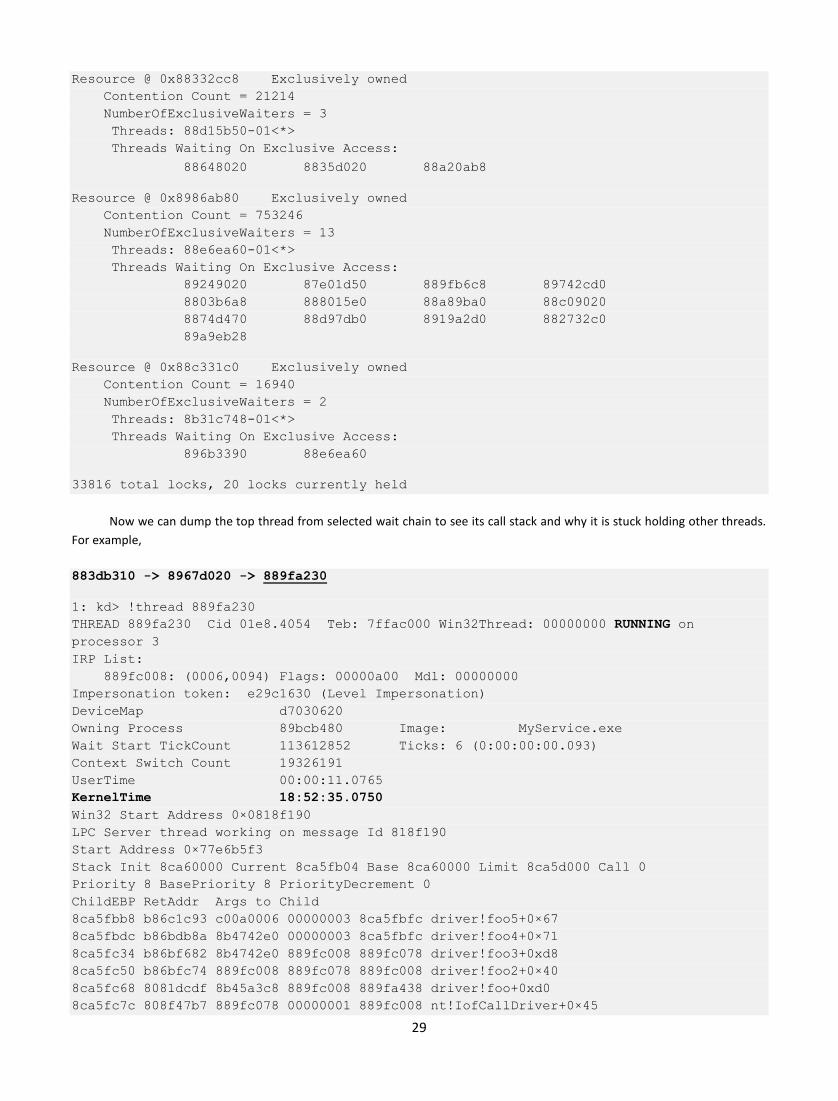
33816 total locks, 20 locks currently held
Now we can dump the top thread from selected wait chain to see its call stack and why it is stuck holding other threads.
For example,
883db310 -> 8967d020 -> 889fa230
1: kd> !thread 889fa230
THREAD 889fa230 Cid 01e8.4054 Teb: 7ffac000 Win32Thread: 00000000 RUNNING on
processor 3
IRP List:
889fc008: (0006,0094) Flags: 00000a00 Mdl: 00000000
Impersonation token: e29c1630 (Level Impersonation)
DeviceMap d7030620
Owning Process 89bcb480 Image: MyService.exe
Wait Start TickCount 113612852 Ticks: 6 (0:00:00:00.093)
Context Switch Count 19326191
UserTime 00:00:11.0765
KernelTime 18:52:35.0750
Win32 Start Address 0×0818f190
LPC Server thread working on message Id 818f190
Start Address 0×77e6b5f3
Stack Init 8ca60000 Current 8ca5fb04 Base 8ca60000 Limit 8ca5d000 Call 0
Priority 8 BasePriority 8 PriorityDecrement 0
ChildEBP RetAddr Args to Child
8ca5fbb8 b86c1c93 c00a0006 00000003 8ca5fbfc driver!foo5+0×67
8ca5fbdc b86bdb8a 8b4742e0 00000003 8ca5fbfc driver!foo4+0×71
8ca5fc34 b86bf682 8b4742e0 889fc008 889fc078 driver!foo3+0xd8
8ca5fc50 b86bfc74 889fc008 889fc078 889fc008 driver!foo2+0×40
8ca5fc68 8081dcdf 8b45a3c8 889fc008 889fa438 driver!foo+0xd0
8ca5fc7c 808f47b7 889fc078 00000001 889fc008 nt!IofCallDriver+0×45
30
8ca5fc90 808f24ee 8b45a3c8 889fc008 89507e90 nt!IopSynchronousServiceTail+0×10b
8ca5fd38 80888c7c 0000025c 0000029d 00000000 nt!NtWriteFile+0×65a
8ca5fd38 7c82ed54 0000025c 0000029d 00000000 nt!KiFastCallEntry+0xfc
Because of huge kernel time, contention count and RUNNING status it is most probably the instance of Spiking Thread
pattern (Volume 1, page 305) involving driver.sys called in the context of MyService.exe process.


![WinDbg: trivial examining of the stack - Alexandre Borges · April 13, 2017 [WINDBG: TRIVIAL EXAMINING OF THE STACK] 6 2. IF the function2 was called using three arguments, so they](https://static.fdocuments.in/doc/165x107/5c65d47a09d3f2f91c8b5dc1/windbg-trivial-examining-of-the-stack-alexandre-borges-april-13-2017-windbg.jpg)