The Quantile Framework for Mathematics - Quantile · Created Date: 2/16/2016 4:50:36 PM
RESEARCH ARTICLE10.1002/2014WR016267
Projected changes in snowfall extremes and interannualvariability of snowfall in the western United StatesA. C. Lute1, J. T. Abatzoglou2, and K. C. Hegewisch2
1Water Resources Program, University of Idaho, Moscow, Idaho, USA, 2Department of Geography, University of Idaho,Moscow, Idaho, USA
Abstract Projected warming will have significant impacts on snowfall accumulation and melt, with impli-cations for water availability and management in snow-dominated regions. Changes in snowfall extremesare confounded by projected increases in precipitation extremes. Downscaled climate projections from 20global climate models were bias-corrected to montane Snowpack Telemetry stations across the westernUnited States to assess mid-21st century changes in the mean and variability of annual snowfall waterequivalent (SFE) and extreme snowfall events, defined by the 90th percentile of cumulative 3 day SFEamounts. Declines in annual SFE and number of snowfall days were projected for all stations. Changes inthe magnitude of snowfall event quantiles were sensitive to historical winter temperature. At climatologi-cally cooler locations, such as in the Rocky Mountains, changes in the magnitude of snowfall events mir-rored changes in the distribution of precipitation events, with increases in extremes and less change inmore moderate events. By contrast, declines in snowfall event magnitudes were found for all quantiles inwarmer locations. Common to both warmer and colder sites was a relative increase in the magnitude ofsnowfall extremes compared to annual SFE and a larger fraction of annual SFE from snowfall extremes. Thecoefficient of variation of annual SFE increased up to 80% in warmer montane regions due to projecteddeclines in snowfall days and the increased contribution of snowfall extremes to annual SFE. In addition todeclines in mean annual SFE, more frequent low-snowfall years and less frequent high-snowfall years wereprojected for every station.
1. Introduction
Snow is a particularly sensitive component of the hydrologic cycle in a warming climate due to its code-pendence on precipitation and temperature. Warmer temperatures resulting from anthropogenic climatechange will decrease the portion of precipitation falling as snow and increase snowmelt [e.g., Collins et al.,2013; Kapnick and Delworth, 2013], whereas changes in precipitation are less certain and more regionallyand seasonally dependent [e.g., Collins et al., 2013]. In the western United States (U.S.), the implications ofthese changes for snow metrics have already been observed in the form of less precipitation falling assnow, decreased 1 April snow water equivalent (SWE), earlier snowmelt, decreased spring snow coverextent, and shortened snow cover duration [Mote et al., 2005; Stewart et al., 2005; Knowles et al., 2006; Kap-nick and Hall, 2012]. Changes in western U.S. hydrology in the latter half of the 20th century, includingsnowpack, have been largely attributed to human-induced climate change [Barnett et al., 2008].
Hydroclimatic changes in the western U.S. are expected to accelerate in the coming decades as human-induced changes in climate become more profound [Ashfaq et al., 2013]. Changes in snow metrics areprojected to be strongly temperature-dependent, though complicated by regionally and seasonally spe-cific changes in precipitation [Pierce and Cayan, 2013; Ashfaq et al., 2013; Kapnick and Delworth, 2013]. Forexample, decreases in the proportion of precipitation falling as snow at lower elevations including theCascade Mountains are projected to result in declines in 1 April SWE of up to 60% by midcentury withmore modest declines in climatologically cooler regions including the Wasatch Range and ColoradoRockies [Ashfaq et al., 2013; Pierce and Cayan, 2013]. Changes in snowfall accumulation combined withwarmer spring temperatures are projected to result in earlier snowmelt and subsequent runoff, anddecreased summer streamflow [Hamlet and Lettenmaier, 1999; Stewart et al., 2004]. These developmentshave serious implications for water resources, agriculture, and ecosystems [e.g., Barnett et al., 2004; Millyet al., 2008; Brekke et al., 2009].
Key Points:� Extreme snowfall changes sensitive
to current temperature of snowfallextremes� Increase in snowfall extremes relative
to light and moderate snowfall� Increased interannual snowfall
variability with fewer snow days
Supporting Information:� Readme� Table S1� Figure S1� Figure S2� Figure S3
Correspondence to:A. C. Lute,[email protected]
Citation:Lute, A. C., J. T. Abatzoglou, andK. C. Hegewisch (2015), Projectedchanges in snowfall extremes andinterannual variability of snowfall inthe western United States, WaterResour. Res., 51, 960–972, doi:10.1002/2014WR016267.
Received 11 AUG 2014
Accepted 27 DEC 2014
Accepted article online 7 JAN 2015
Published online 18 FEB 2015
LUTE ET AL. VC 2015. American Geophysical Union. All Rights Reserved. 960
Water Resources Research
PUBLICATIONS

Projected hydroclimatic change is complicated by shifts in the distribution of precipitation events resultingfrom the intensification of the hydrologic cycle [e.g., Giorgi et al., 2011]. The moisture holding capacity ofthe atmosphere increases at a rate of approximately 7% per degree Celsius, in accordance with theClausius-Clapeyron relationship, suggesting that the globally averaged intensity of heavy precipitationevents should increase at roughly the same rate, with somewhat heightened sensitivity in the tropics andlesser changes in midlatitudes [O’Gorman, 2012]. Observations, theoretical arguments, and modeling stud-ies support the conclusion that this will result in an increase in heavy precipitation events at the expense oflight and moderate precipitation events, albeit with distinct geographic variability [e.g., Karl and Knight,1998; Meehl et al., 2005; Giorgi et al., 2011; Singh et al., 2013]. Detecting trends in such metrics at regionalscales can, however, be complicated by large variability [e.g., Duliere et al., 2013].
Extreme snowfall events contribute 20–38% of annual SFE and contribute significantly to interannual vari-ability in annual SFE [Lute and Abatzoglou, 2014] and 1 April SWE [Guan et al., 2010, 2013]. Changes in snow-fall extremes resulting from anthropogenic climate change thus may have a disproportionate impact onwater resources. The potential coupled impact of warming and changing precipitation on heavy snowfallevents in the montane regions of the western United States remains largely unexamined. O’Gorman [2014]contrasted changes in extreme and mean snowfall at elevations below 1000 m using an ensemble of globalclimate model outputs and found changes varied most according to climatological temperature. In thewestern U.S., however, persistent snowpack typically forms above 1000 m; thus, consideration of higher-elevation snowpack is more relevant to snow water resources. The largest snowfall events typically occur atnear-freezing temperatures due to enhanced atmospheric moisture at warmer temperatures, making thesesnowfall events particularly vulnerable to warming [O’Gorman, 2014; Bales et al., 2006]. However, theincreased atmospheric moisture accompanying warming may increase the size of heavy snowfall events,partially or entirely counteracting the decreases in the ratio of precipitation falling as snow. In the soleknown study to consider the effects of climate change on extreme snowfall events in mountain watersheds,L�opez-Moreno et al. [2011] projected decreases (increases) in event frequency and intensity at the lowest(highest) elevations of the Pyrenees.
Interannual variability in snowfall accumulation presents one of the largest sources of uncertainty in con-temporary water resource management [Raff et al., 2013], challenging water management, infrastructure,society, and ecosystems. Understanding the impact of climate change on interannual snowfall variabilityhas been identified as a high priority by western U.S. water management agencies [Brekke, 2011], yet thebulk of studies have focused on changes in the means of snow metrics rather than changes in variability[e.g., Pierce and Cayan, 2013; Ashfaq et al., 2013]. Extreme climate events, such as very high or low-snowfallyears, typically have the biggest impacts on society and ecosystems and are more sensitive to changes invariability than changes in the mean [Katz and Brown, 1992]. Analogous to the findings of Polade et al.[2014] who showed that more dry days promote increased annual precipitation variability, fewer snowfalldays resulting from warming are hypothesized to increase interannual variability in snowfall. Given the sig-nificant role snowfall extremes play in shaping contemporary interannual snowfall variability [Lute and Abat-zoglou, 2014], changes in snowfall extremes may compound or counteract changes in snowfall variabilitydue to fewer snowfall days alone.
In this study, we explore the effects of climate change on extreme snowfall events and interannual snowfallvariability in the western U.S. using 20 global climate model projections downscaled to montane SnowpackTelemetry (SNOTEL) stations. We seek to answer two primary questions: (1) How will climate change impactthe magnitude of extreme snowfall events? (2) How will these changes be manifest in terms of bothchanges in the mean and variance of annual SFE?
2. Data and Methods
Daily minimum and maximum temperature and precipitation from 20 global climate models (GCMs; Table1) participating in the fifth phase of the Climate Model Intercomparison Project (CMIP5) [Taylor et al., 2012]were statistically downscaled using the Multivariate Adaptive Constructed Analogs (MACA) method [Abatzo-glou and Brown, 2012] for the historical experiment (1950–2005) and future experiment (2006–2099) usingRepresentative Concentration Pathway 8.5 (RCP 8.5). We focus on changes realized by the mid-21st century(2040–2069) and thus justify the use of a single scenario (RCP 8.5) since model uncertainty generally
Water Resources Research 10.1002/2014WR016267
LUTE ET AL. VC 2015. American Geophysical Union. All Rights Reserved. 961

exceeds scenario uncertainty during the first half of the 21st century, particularly at regional scales [Hawkinsand Sutton, 2009]. We used the MACA approach over other statistical downscaling methods for its ability tocapture daily meteorology as simulated by GCMs that is critical to assessing changes in extremes, and itsskill in regions of complex terrain. We modified the MACA method by applying joint bias correction to tem-perature and precipitation [e.g., Zhang and Georgakakos, 2013], enabling a more realistic derivation of tem-peratures coincident with precipitation and thus snowfall (supporting information). Although regionalclimate modeling (RCM) arguably is better suited for simulating the dynamics of precipitation extremes[e.g., Salath�e et al., 2014], limited availability of RCM output across a range of GCMs and the additional needto bias correct such output justifies our usage of statistical downscaling.
Downscaling was trained using the gridded surface meteorological data set of Livneh et al. [2013] (down-scaled outputs last accessed April 2014), and then further bias-corrected to 513 Natural Resources Conserva-tion Service SNOTEL stations in the 11 westernmost states in the contiguous U.S. SNOTEL stations areregularly used in water resource management decision-making tools and hydrologic models and thus arerelevant to the water resource management community. A set of quality control procedures were appliedto observed SNOTEL data before bias correction following Lute and Abatzoglou [2014]. We bias-correctedcolocated gridded data to each of the stations using the nonparametric equidistant cumulative distributionfunction quantile-mapping method (EDCDFm) [Li et al., 2010] for temperature with a comparable ratio-preserving bias correction approach for precipitation. Bias-corrected temperature and precipitation werediscretized to the resolution of SNOTEL data (0.1�C and 2.54 mm, respectively).
We estimated daily SFE by extending the empirically based precipitation phase probability function of Dai[2008] to daily timescales [following Lute and Abatzoglou, 2014]. Daily precipitation and SFE values less than2.54 mm were set to 0. We compared the historical experiments and observations to assess uncertainty aris-ing from downscaling and historical GCMs (supporting information). Historical and future experiments werecompared using several metrics (Table 2), including total water year (annual) SFE, the coefficient of variation(CV) of annual SFE, the standard deviation of annual SFE, and the number of snow days, defined as thenumber of days per year with daily SFE� 2.54 mm. We defined high and low-snowfall years as years withannual SFE exceeding the 75th percentile and below the 25th percentile of historical modeled annual SFE,respectively. Projected changes in annual SFE for the mid-21st century were subsequently compared to thishistorical modeled return period of 4 years.
Table 1. List of CMIP5 Models Used in This Studya
Model Expansion
bcc-csm1.1 Beijing Climate Center, Climate System Model, version 1.1, course resolutionbcc-csm1.1 (m) Beijing Climate Center, Climate System Model, version 1.1, moderate resolutionBNU-ESM Beijing Normal University, Earth System ModelCanESM2 Second Generation Canadian Earth System ModelCCSM4 Community Climate System Model, version 4CNRM-CM5 Centre National de Recherches M�et�eorologiques Coupled Global Climate Model, version 5CSIRO-Mk3.6.0 Commonwealth Scientific and Industrial Research Organisation Mark, version 3.6.0GFDL-ESM2G Geophysical Fluid Dynamics Laboratory Earth System Model with Generalized Ocean
Layer Dynamics (GOLD) component (ESM2G)GFDL-ESM2M Geophysical Fluid Dynamics Laboratory Earth System Model with Modular Ocean
Model 4 (MOM4) component (ESM2M)HadGEM2-ES Hadley Centre Global Environmental Model, version 2 (Earth System)HadGEM2-CC Hadley Centre Global Environmental Model, version 2 (Carbon Cycle)INM-CM4 Institute of Numerical Mathematics Coupled Model, version 4IPSL-CM5A-LR L’Institut Pierre-Simon Laplace Coupled Model, version 5, Earth System Model, standard physics, low resolutionIPSL-CM5A-MR L’Institut Pierre-Simon Laplace Coupled Model, version 5, Earth System Model, standard physics, midresolutionIPSL-CM5B-LR L’Institut Pierre-Simon Laplace Coupled Model, version 5, new physics, low resolutionMIROC5 Model for Interdisciplinary Research on Climate, version 5MIROC-ESM Model for Interdisciplinary Research on Climate, Earth System ModelMIROC-ESM-CHEM Model for Interdisciplinary Research on Climate, Earth System Model, Chemistry CoupledMRI-CGCM3 Meteorological Research Institute Coupled Atmosphere-Ocean General Circulation Model, version 3NorESM1-M Norwegian Earth System Model, version 1
aModels were selected that provided all daily variables that MACA downscaled for RCP 4.5 and RCP 8.5. One ensemble run, r1i1p1,was downscaled for each model except CCSM4 for which we used r6i1p1 since this was the only run containing daily data for all neces-sary variables.
Water Resources Research 10.1002/2014WR016267
LUTE ET AL. VC 2015. American Geophysical Union. All Rights Reserved. 962
Snowfall events were defined by nonoverlapping 3 day periods with positive SFE, based on the finding ofSerreze et al. [2001] that a 3 day span comprises 75–89% of snowfall events in the western U.S. Snowfallevent SFE is the cumulative SFE of the 3 day period. Precipitation events were defined similarly. Theextreme snowfall event metric considered here, SFE90, was defined separately for each period as the 90thpercentile of nonoverlapping snowfall events, analogous to extreme precipitation metrics used by Diffen-baugh et al. [2005] and the extreme snowfall metric of Lute and Abatzoglou [2014]. In addition to calculatingSFE90, we computed the 25th, 50th, 75th, 90th, 95th, and 99th quantiles for snowfall events and repeatedthis process for cold season (October–April) precipitation events defined in the same manner. The averageSFE of an extreme snowfall event, SFE 90, was computed as the mean SFE of snowfall events exceedingSFE90.
Observations from SNOTEL stations were used to provide climatological context for mid-21st centurychanges in the aforementioned metrics. We calculated the average observed temperature coincident withsnow days (Tavgsnow) and extreme snowfall events (Tavg90) and compared them using two-sided t-tests(a 5 0.05). The observed mean winter (November through March) temperature was calculated and used todivide stations into six 2�C temperature bins between 29 and 13�C (e.g., stations between 29 and 27�Cwere in the 28�C bin). Although temperature binning groups together diverse climates (such as the Cas-cades and Arizona in the warmest bin), the groupings are useful for examining the differential temperaturesensitivities of snowfall events.
Results are generally presented through the multimodel mean difference between the historical and mid-21st century periods. The multimodel mean has been shown to be superior to any single model in regionalclimate change studies [Pierce et al., 2009]. For variables defined on an annual basis (all variables except CVand high and low-snow year return periods), we quantify uncertainty following Tebaldi et al. [2011] wherebyrobust changes are denoted where a majority of models project a significant change (using a t-test,a 5 0.05) and at least 80% of these models project a change of the same sign. Since there is only one valueof CV of annual SFE for the historic and future periods for each model, we employed a bootstrap resamplingwith replacement approach (n 5 1000). For each sample, the change in CV between the two periods wascomputed. The change was considered significant when more than 95% of samples showed a change ofthe same sign. We applied a similar bootstrap resampling approach to evaluate significant changes in thereturn period of high and low-snow years. Robust changes were evaluated using the method outlinedabove for the other metrics.
3. Results
Observed mean winter (November–March) temperatures were above freezing at stations in the Cascadesand Arizona, whereas the coldest stations were located in the high-elevation continental mountains (Figure1a). A similar pattern was observed for temperatures coincident with extreme snowfall events, Tavg90, withwarmer temperatures in the Sierra Nevada, Cascades, and Arizona and cooler temperatures in the Southern
Table 2. List of Metric Abbreviations, Descriptions, Definitions, and Unitsa
Metric Description Definition Units
Annual SFE Annual SFE Cumulative snowfall water equivalent (SFE) over the water year mm SFECV of annual SFE Coefficient of variation
of annual SFEStandard deviation of annual SFE divided by the
mean of Annual SFESnow days Number of snowfall days Number of days per water year with positive daily SFE DaysSnowfall event Snowfall event Three day period with positive SFE. Snowfall event SFE is the
cumulative SFE over the 3 days centered on the eventSFE90 Extreme snowfall
event thresholdThe 90th percentile of all snowfall events during
the historical periodmm SFE
SFE 90 Mean SFE of extremesnowfall events
Average SFE of snowfall events greater than SFE90 mm SFE
Tavgsnow Temperature coincidentwith snow days
Mean average temperature on snow days �C
Tavg90 Temperature coincident withextreme snowfall events
Mean average temperature over the 3 day period of snowfallevents greater than SFE90
�C
aAll metrics are calculated as the multimodel mean of the downscaled GCM data with the exception of Tavgsnow and Tavg90 whichuse historical SNOTEL observations.
Water Resources Research 10.1002/2014WR016267
LUTE ET AL. VC 2015. American Geophysical Union. All Rights Reserved. 963
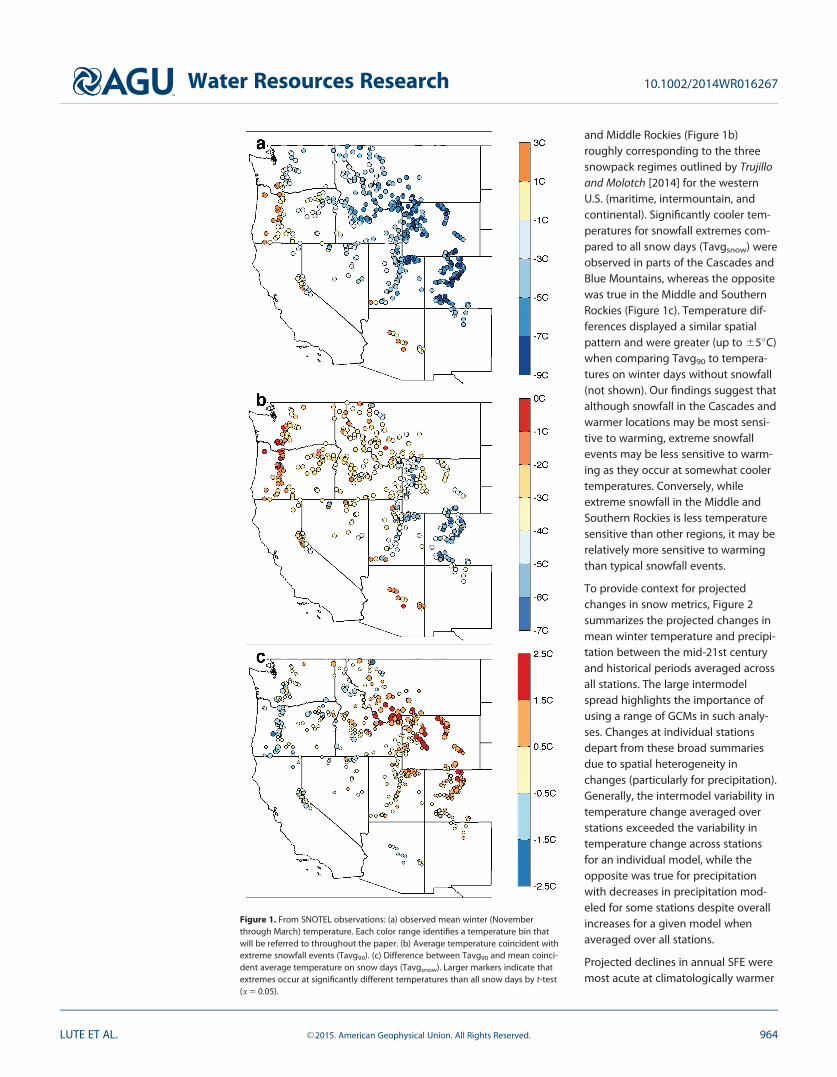
and Middle Rockies (Figure 1b)roughly corresponding to the threesnowpack regimes outlined by Trujilloand Molotch [2014] for the westernU.S. (maritime, intermountain, andcontinental). Significantly cooler tem-peratures for snowfall extremes com-pared to all snow days (Tavgsnow) wereobserved in parts of the Cascades andBlue Mountains, whereas the oppositewas true in the Middle and SouthernRockies (Figure 1c). Temperature dif-ferences displayed a similar spatialpattern and were greater (up to 65�C)when comparing Tavg90 to tempera-tures on winter days without snowfall(not shown). Our findings suggest thatalthough snowfall in the Cascades andwarmer locations may be most sensi-tive to warming, extreme snowfallevents may be less sensitive to warm-ing as they occur at somewhat coolertemperatures. Conversely, whileextreme snowfall in the Middle andSouthern Rockies is less temperaturesensitive than other regions, it may berelatively more sensitive to warmingthan typical snowfall events.
To provide context for projectedchanges in snow metrics, Figure 2summarizes the projected changes inmean winter temperature and precipi-tation between the mid-21st centuryand historical periods averaged acrossall stations. The large intermodelspread highlights the importance ofusing a range of GCMs in such analy-ses. Changes at individual stationsdepart from these broad summariesdue to spatial heterogeneity inchanges (particularly for precipitation).Generally, the intermodel variability intemperature change averaged overstations exceeded the variability intemperature change across stationsfor an individual model, while theopposite was true for precipitationwith decreases in precipitation mod-eled for some stations despite overallincreases for a given model whenaveraged over all stations.
Projected declines in annual SFE weremost acute at climatologically warmer
Figure 1. From SNOTEL observations: (a) observed mean winter (Novemberthrough March) temperature. Each color range identifies a temperature bin thatwill be referred to throughout the paper. (b) Average temperature coincident withextreme snowfall events (Tavg90). (c) Difference between Tavg90 and mean coinci-dent average temperature on snow days (Tavgsnow). Larger markers indicate thatextremes occur at significantly different temperatures than all snow days by t-test(a 5 0.05).
Water Resources Research 10.1002/2014WR016267
LUTE ET AL. VC 2015. American Geophysical Union. All Rights Reserved. 964

stations including stations in the Cascades and Arizona where reductions of 35–70% were projected (Figure3a). Both declines and the spread of model projections in annual SFE were largest for the warmest stations(Figure 4a). By contrast, declines in annual SFE were 5–20% in the coldest locations, including the Middleand Southern Rockies. Declines in annual SFE were significant for all but a few of the coldest stations wherethe impacts of warming were largely offset by increased precipitation. Only one model (MRI-CGCM3) pro-jected increased annual SFE for the coldest temperature bins and the smallest reductions in annual SFE inall other temperature bins, which can be attributed to the relatively small warming (11.5�C) and relativelylarge precipitation increase (112%) in the station-wide average (Figure 2).
Decreases in snow days were significant at all stations and showed a similar spatial pattern to changes inannual SFE, with the smallest declines (10–20%) in the Middle and Southern Rockies and parts of Utah andthe largest declines (up to 50%) in the Cascades and Arizona (Figure 3b). As with changes in annual SFE, themagnitude and intermodel range of the percent decline in snow days were largest for the warmest stations(Figure 4b).
Figure 2. Station-averaged projected change in mean winter (November through March) average temperature (�C, x axis) and percentchange in cumulative winter precipitation (%, y axis) between the historical (1950–2005) and midcentury (2040–2069) periods under RCP8.5.
Figure 3. Percent change in (a) annual SFE and (b) number of snow days between historical and midcentury periods. Larger (smaller) markers indicate significant (insignificant) changes.
Water Resources Research 10.1002/2014WR016267
LUTE ET AL. VC 2015. American Geophysical Union. All Rights Reserved. 965

Percent change in the mean SFE of extreme snowfall events, SFE90 , was characterized by the longitudinalgradient evident in Tavg90 (Figure 5). At many warmer stations in the Cascades, Sierra Nevada, and themountains of Arizona, SFE 90 declined 20–50%. In contrast, increases in SFE 90 were found in the coldestlocales, including the Middle and Southern Rockies. All models projected increases or no change in SFE 90
for stations in the coldest temperature bin (Figure 4c).
Projected changes in 25th, 50th, 75th, 90th, 95th, and 99th percentile snowfall and winter precipitationevents are shown in Figure 6. With the exception of small to moderate precipitation events (25th and 50thpercentiles) in the warmest locations, precipitation events intensified with the largest increases (near120%) noted for the 99th percentile events in the coldest bins. However, the number of snowfall eventsdecreased substantially in all bins, with nominal change in the number of precipitation events. Small to
Figure 4. Model spread by temperature bin as indicated in Figure 1a for percent change in (a) annual SFE, (b) number of snow days, and (c) mean SFE of extreme snowfall events, SFE 90,between historical and midcentury periods. Dark gray lines represent the multimodel mean value and light gray areas are delimited by the 25th and 75th percentiles of modelprojections.
Water Resources Research 10.1002/2014WR016267
LUTE ET AL. VC 2015. American Geophysical Union. All Rights Reserved. 966

moderate snowfall events decreasedin every temperature bin, whereasthe largest increases in the colderbins and smallest decreases in thewarmer bins were found for 99th per-centile snowfall events. Increasedcontrast between changes in the99th and 25th percentile of snowfallevents was found in warmer bins, elu-cidating the differential temperaturesensitivities of snowfall event percen-tiles. These results are indicative of ashift toward a greater portion ofannual SFE coming from the heaviestsnowfall events, particularly in clima-tologically warmer regions. SFE 90 wasprojected to contribute a larger por-tion of annual SFE by midcentury atevery station, with significantincreases at 75% of stations (notshown).
Figure 5. Percent change in mean SFE of extreme snowfall events, SFE 90, betweenhistorical and midcentury periods. Larger (smaller) markers indicate significant(insignificant) changes.
Figure 6. Changes in the 25th, 50th, 75th, 90th, 95th, and 99th percentiles of precipitation events (blue) and snowfall events (black) between historical and midcentury periods groupedby temperature bin as indicated in Figure 1a and labeled in the upper left of each subplot. Text below the temperature bin label indicates the percent change in mean annual numberof precipitation events (blue) and snowfall events (black) between the historical and midcentury periods. The station-averaged and model-averaged percentile ratios of precipitationevents (snowfall events) are represented by the blue lines (black lines). The 10th and 90th percentiles of model precipitation (snowfall) percentile ratios averaged over stations are repre-sented by the shaded blue (gray) areas. The vertical-dashed line in each subplot represents no change in the percentiles between historical and midcentury periods.
Water Resources Research 10.1002/2014WR016267
LUTE ET AL. VC 2015. American Geophysical Union. All Rights Reserved. 967

The CV of annual SFE increased at all stations (Figure 7a). While in some regions increases were modest(10–20%) and not statistically significant, a 50–80% increase was noted for parts of the Cascades and North-ern Rockies. With fewer snow days (Figure 3b), annual SFE will be composed of a smaller sample of snowfallevents that promotes increased variability about the mean. This effect is reinforced by increasing contribu-tions to annual SFE from extreme snowfall events. Increases in the standard deviation of annual SFE of upto 15% were projected at the coldest stations in the Middle and Southern Rockies despite overall declinesin annual SFE and snow days (Figure 7b). While the standard deviation of annual SFE decreased in the Cas-cades and other warmer regions by 15–45%, this decline was modest relative to the overall decline inannual SFE.
Changes in both the mean and standard deviation of annual SFE control changes in the frequency of highand low-snowfall years. Low-snowfall years were projected to occur more frequently at every station (Figure8a) relative to the historical return period of 4 years. At many stations in the Cascades, Northern Rockies,and Arizona, low-snow years were projected to occur nearly every year in the midcentury period (returninterval of 1–1.5 years). High-snowfall years were projected to occur less frequently at every station (Figure8b) relative to the historical return period of 4 years. At many stations in the Middle and Southern Rockies,
Figure 7. Percent change in (a) CV of annual SFE and (b) the standard deviation of annual SFE between historical and midcentury periods. Larger (smaller) markers indicate significant(insignificant) changes.
Figure 8. Midcentury return intervals of (a) low-snowfall years and (b) high-snowfall years. Larger (smaller) markers indicate significant (insignificant) changes. Stations are marked withan ‘‘x’’ in Figure 8b if at least 70% of models did not project a high-snowfall year to occur in the midcentury period. No stations were found where at least 70% of models projected low-snowfall years to occur every year in the midcentury period.
Water Resources Research 10.1002/2014WR016267
LUTE ET AL. VC 2015. American Geophysical Union. All Rights Reserved. 968

the return interval for high-snowfall years increased from 4 years in the historical experiment to 5–10 yearsby midcentury. Stations in Arizona, the Cascades, and the Northern Rockies had 20–100 year return periodsfor high-snowfall years, while at several stations in the Cascades more than 70% of models failed to simulatea high-snowfall year for the midcentury period. We caution that the underrepresentation of interannual SFEvariability from GCMs may magnify modeled changes in CV of annual SFE and low and high-snowfall yearsresulting in some discrepancies relative to observed records (supporting information).
4. Discussion
The coincident temperature of snowfall extremes (Figure 1b) is largely a by-product of the regional climate(e.g., latitude, elevation, and continentality). Differences between Tavg90 and Tavgsnow are a result of theinterplay between enhanced atmospheric moisture content and potential precipitation rates, anddecreased proportion of precipitation falling as snow with warming [O’Gorman, 2014]. In relatively warmerregions, mixed phase precipitation events may mitigate large SFE accumulations. Larger-snowfall events insuch regions may be favored when a greater proportion of precipitation falls as snow with temperaturesbelow Tavgsnow. In contrast, in relatively cold regions, the moisture-holding capacity of the atmosphere islimited. For these nontemperature-limited regions, it follows that snowfall extremes are more likely to occurat temperatures slightly above Tavgsnow, since atmospheric moisture-holding capacity increases with tem-perature. Temperature differences between Tavg90 and Tavgsnow may also be a function of snowfall season-ality; west of the Rockies, heavy snowfall events primarily occur December through February whentemperatures are coldest and moisture is abundant, while east of the Rockies, heavy snowfall events canoccur in March and April when temperatures are warmer but dynamics for precipitation extremes are morefavorable [Serreze et al., 2001].
Regional changes in annual SFE (Figure 3a) were comparable to those found by Pierce and Cayan [2013] forOctober–March SFE. The larger and more robust decreases in our projections of change in annual SFE rela-tive to those of Pierce and Cayan [2013] are in part due to the inclusion of SFE accumulation after 31 March,which is especially sensitive to warming. Projected declines in annual SFE indicate reduced snowpack stor-age of winter precipitation and increased winter runoff in the context of increased total winter precipitation(Figure 2). Barring increased reservoir capacity, this will result in a larger portion of annual precipitationbeing unavailable for use later in the year for locations where snowpack is relied upon as an important nat-ural reservoir of winter precipitation [Barnett et al., 2005].
Projected increases in precipitation extremes outpaced increases in small and moderate precipitationevents (Figure 6), similar to the findings of Meehl et al. [2005]. Changes in the magnitude of snowfall eventsreflect the change in precipitation and the differential temperature sensitivities of snowfall extremes relativeto the average snowfall event. Results are comparable to the findings of de Vries et al. [2014], with largedeclines in the historically warmest locations and small increases in the coldest locations. Extreme snowfallevents at many stations in the Cascades and the Sierra Nevada historically occurred at temperatures above23�C (Figure 1b), making them sensitive to projected warming of 1.5–5�C. The relatively high coincidenttemperatures of atmospheric rivers, which contribute up to 40% of seasonal SWE accumulation in maritimelocations, may make precipitation falling with these systems particularly vulnerable to projected warming[Guan et al., 2010]. However, other snowfall extremes in these warm locations have historically occurred atcooler temperatures than typical snowfall events, making them less sensitive to warming. While O’Gorman[2014] found that the response of mean snowfall to climate change was typically stronger than theresponse of extreme snowfall, we find that in the coldest regions of the western U.S., including the Middleand Southern Rockies, extreme snowfall responds more strongly than the 50th percentile of snowfall events(Figure 6). Changes in the distribution of snowfall events have implications for snowpack dynamics as wellas avalanche risk. For example, Kumar et al. [2012] found that fewer but more intense snowfall events withno net change in annual SFE increase annual maximum SWE and may partially offset the impacts ofdecreased annual snowfall and increased melt rates on SWE. West-wide projections of warmer and wetterwinters with more heavy snowfall events relative to small and moderate events may result in more frequentwet-snow avalanches and fewer avalanches due to depth hoar [Martin et al., 2001].
Decreases in the number of snow days reduce the sample from which annual SFE is created, resulting ingreater variability about the mean similar to the findings of Polade et al. [2014] for precipitation. The
Water Resources Research 10.1002/2014WR016267
LUTE ET AL. VC 2015. American Geophysical Union. All Rights Reserved. 969

reliance of annual SFE on fewer and heavier events, at the expense of light and moderate events, increasesthe volatility of annual SFE to the occurrence (or absence) of extreme snowfall events during a given winter.This is further reinforced by increases in the CV of cumulative SFE for snowfall extremes, particularly inregions that currently experience the largest historical variability in annual SFE [Lute and Abatzoglou, 2014].Despite increases in the variability of annual SFE, decreases in mean annual SFE result in more frequentlow-snowfall years and less frequent high-snowfall years by midcentury.
5. Conclusions
While much literature has focused on observed, projected, and theoretical changes in extreme precipitation[e.g., Karl and Knight, 1998; Giorgi et al., 2011; Singh et al., 2013; Meehl et al., 2005], changes in snowfallextremes have received less attention despite their importance to interannual variability in water resources[Lute and Abatzoglou, 2014]. Differential temperature sensitivities of extreme snowfall events relative toother snowfall events were attributed to a balance between increased atmospheric moisture-holdingcapacity and decreased proportion of precipitation falling as snow at warmer temperatures, confirming theresults of O’Gorman [2014]. Our results extend the elevation range and resolution of the O’Gorman [2014]analysis to montane regions in the western U.S. above 1000 m where the bulk of seasonal snowpack islocated and specifically to SNOTEL stations from which operational decisions are currently made. We showthat snowfall extremes will decline less than small and moderate snowfall events and may increase in thecoldest regions. Coupled with widespread decreases in annual SFE, this will result in a greater portion ofannual SFE from extreme events, making annual snow water resources vulnerable to the presence orabsence of a few large events. Considering the disproportionate impact that large events have on publicperception, projected changes in extreme snowfall events may hamper the communication of climatechange to the broader public.
Previous studies have considered changes in mean and seasonal snowfall metrics [e.g., Pierce and Cayan,2013; Ashfaq et al., 2013; Klos et al., 2014] but have not considered changes in snowfall variability, althoughinterannual variability presents one of the greatest challenges to current water management [Raff et al.,2013] as well as to infrastructure, society, and ecosystems. Increases in snowfall variability across the north-western U.S. as well as widespread increases in the occurrence of low-snowfall years add an important per-spective to water resource planning in a changing climate. Our results suggest that the combination ofreduced number of snow days and proportionally larger contribution via snowfall extremes helps facilitateincreased interannual SFE variability. In light of such projections, greater elasticity may be required of watermanagement and infrastructure with regards to release timing, year-to-year reservoir carry over capacity,and inflow rates.
The changes in snow metrics presented here portend significant changes for the three western U.S. snow-pack regimes [Trujillo and Molotch, 2014]. For intermountain and continental regimes, warmer and wetterwinters, declines in annual SFE and snow days, and relative increases in extreme snowfall will likely result indenser snow, shortened snow cover duration, and greater potential for rain-on-snow events, altogetherresulting in a transition to a more maritime snowpack regime. However, at many continental sites, the mod-est declines in annual SFE and snow days, and nonsignificant to positive changes in extreme snowfall sug-gest peak SWE values at these sites may be maintained or increase [Kumar et al., 2012], helping to bufferlosses in the snow cover period due to warming. In continental regions, snowpack will likely continue toserve as an excellent water reservoir into the mid-21st century. Maritime locations are projected to experi-ence significant declines in annual SFE and snow days and increased interannual variability in annual SFE.These changes will challenge water resource management in maritime regions to make do with less naturalwater storage, possible intermittent snowpacks, and greater year-to-year variability.
Projected declines in annual SFE and snowfall days, coupled with projected increases in winter precipitationtotals and intensity suggest that even at many high elevation stations, snow events are likely to transitionto rain events, increasing the likelihood of rain-on-snow events and the magnitude of rainfall extremes withimplications for flood risk in some watersheds [McCabe et al., 2007; Salath�e et al., 2014]. Furthermore,decreased natural water storage in snowpack will increase the need for reservoir capacity if current wateravailability levels are to be maintained [Barnett et al., 2005]. Barring additional storage infrastructure, manyregions of the west will be faced with difficult choices between conflicting objectives including ecosystem
Water Resources Research 10.1002/2014WR016267
LUTE ET AL. VC 2015. American Geophysical Union. All Rights Reserved. 970
support, hydropower, irrigation, and navigation [Barnett et al., 2004]. This situation will become more acuteas snowfall continues to decline, snowmelt occurs earlier in the year, and water demand increases. Increas-ing interannual variability in annual SFE will add further complexity to future water management. In thefuture, annual SFE will be composed of fewer, relatively heavy snowfall events and will more often resemblethe low-snowfall years of the current climate. The growing importance of heavy snowfall events to annualSFE totals suggests that improved understanding of the synoptic causes of these events will enable waterresource managers to make the most of diminished and more variable snow water resources.
As far as we are aware, this is the first study to analyze climate change impacts on snow metrics at SNOTELstations. SNOTEL stations are regularly used in hydrologic forecasting and modeling and are familiar tomost water managers in the western U.S. The presentation of our results at these stations, as opposed to ina gridded or other format, make the projections more communicable to the water resource managementcommunity, bridging the science-management gap, and providing knowledge to those with the power toplan for our future.
ReferencesAbatzoglou, J. T., and T. J. Brown (2012), A comparison of statistical downscaling methods suited for wildfire applications, Int. J. Climatol.,
32, 772–780, doi:10.1002/joc.2313.Ashfaq, M., S. Ghosh, S.-C. Kao, L. C. Bowling, P. Mote, D. Touma, S. A. Rauscher, and N. S. Diffenbaugh (2013), Near-term acceleration of
hydroclimatic change in the western U.S, J. Geophys. Res. Atmos., 118, 10,676–10,693, doi:10.1002/jgrd.50816.Bales, R. C., N. P. Molotch, T. H. Painter, M. D. Dettinger, R. Rice, and J. Dozier (2006), Mountain hydrology of the western United States,
Water Resour. Res., 42, W08432, doi:10.1029/2005WR004387.Barnett, T. P., R. Malone, W. Pennell, D. Stammer, B. Semtner, and W. Washington (2004), The effects of climate change on water resources
in the West: Introduction and overview, Clim. Change, 62, 1–11, doi:10.1023/B:CLIM.0000013695.21726.b8.Barnett, T. P., J. C. Adam, and D. P. Lettenmaier (2005), Potential impacts of a warming climate on water availability in snow-dominated
regions, Nature, 438, 303–309, doi:10.1038/nature04141.Barnett, T. P., et al. (2008), Human-induced changes in the hydrology of the western United States, Science, 319(5866), 1080–1083, doi:
10.1126/science.1152538.Brekke, L. D. (2011), Addressing climate change in long-term water resources planning and management: User needs for improving tools
and information, Civil Works Tech. Ser., CWTS-10-02, U.S. Army Corps of Eng., National Technical Information Service Operations Division,Springfield, Va. [Available at http://www.usbr.gov/climate/userneeds/.]
Brekke, L. D., J. E. Kiang, J. R. Olsen, R. S. Pulwarty, D. A. Raff, D. P. Turnipseed, R. S. Webb, and K. D. White (2009), Climate change and waterresources management: A federal perspective, U.S. Geol. Surv. Circ., 1331, 65 pp. [Available at http://pubs.usgs.gov/circ/1331/.]
Collins, M., et al. (2013), Long-term climate change: Projections, commitments and irreversibility, in Climate Change 2013: The Physical Sci-ence Basis. Contribution of Working Group I to the Fifth Assessment Report of the Intergovernmental Panel on Climate Change, edited by T.F. Stocker et al., Cambridge Univ. Press, Cambridge, U. K.
Dai, A. (2008), Temperature and pressure dependence of the rain-snow phase transition over land and ocean, Geophys. Res. Lett., 35,L12802, doi:10.1029/2008GL033295.
de Vries, H., G. Lenderink, and E. van Meijgaard (2014), Future snowfall in western and central Europe projected with a high-resolutionregional climate model ensemble, Geophys. Res. Lett., 41, 4294–4299, doi:10.1002/2014GL059724.
Diffenbaugh, N. S., J. S. Pal, R. J. Trapp, and F. Giorgi (2005), Fine-scale processes regulate the response of extreme events to global climatechange, Proc. Natl. Acad. Sci. U. S. A., 102(44), 15,774–15,778, doi:10.1073/pnas.0506042102.
Duliere, V., Y. Zhang, and E. P. Salath�e (2013), Changes in twentieth-century extreme temperature and precipitation over the westernUnited States based on observations and regional climate model simulations, J. Clim., 26(21), 8556–8575, doi:10.1175/JCLI-D-12-00818.1.
Giorgi, F., E.-S. Im, E. Coppola, N. S. Diffenbaugh, X. J. Gao, L. Mariotti, and Y. Shi (2011), Higher hydroclimatic intensity with global warming,J. Clim., 24, 5309–5324, doi:10.1175/2011JCLI3979.1.
Guan, B., N. P. Molotch, D. E. Waliser, E. J. Fetzer, and P. J. Neiman (2010), Extreme snowfall events linked to atmospheric rivers and surfaceair temperature via satellite measurements, Geophys. Res. Lett., 37, L20401, doi:10.1029/2010GL044696.
Guan, B., N. P. Molotch, D. E. Waliser, E. J. Fetzer, and P. J. Neiman (2013), The 2010/2011 snow season in California’s Sierra Nevada: Role ofatmospheric rivers and modes of large-scale variability, Water Resour. Res., 49, 6731–6743, doi:10.1002/wrcr.20537.
Hamlet, A. F., and D. P. Lettenmaier (1999), Effects of climate change on hydrology and water resources in the Columbia River Basin, J. Am.Water Resour. Assoc., 35, 1597–1623, doi:10.1111/j.1752-1688.1999.tb04240.x.
Hawkins, E., and R. Sutton (2009), The potential to narrow uncertainty in regional climate predictions, Bull. Am. Meteorol. Soc., 90(8), 1095–1107, doi:10.1175/2009BAMS2607.1.
Kapnick, S., and A. Hall (2012), Causes of recent changes in western North American snowpack, Clim. Dyn., 38(9–10), 1885–1899, doi:10.1007/s00382-011-1089-y.
Kapnick, S. B., and T. L. Delworth (2013), Controls of global snow under a changed climate, J. Clim., 26, 5537–5562, doi:10.1175/JCLI-D-12-00528.1.
Karl, T. R., and R. W. Knight (1998), Secular trends of precipitation amount, frequency, and intensity in the United States, Bull. Am. Meteorol.Soc., 79, 231–241, doi:10.1175/1520-0477(1998)079<0231:STOPAF>2.0.CO;2.
Katz, E. W., and B. G. Brown (1992), Extreme events in a changing climate: Variability is more important than averages, Clim. Change, 21,289–302, doi:10.1007/BF00139728.
Klos, P. E., T. E. Link, and J. T. Abatzoglou (2014), Extent of the rain-snow transition zone in the western U.S. under historic and projected cli-mate, Geophys. Res. Lett., 41, 4560–4568, doi:10.1002/2014GL060500.
Knowles, N., M. D. Dettinger, and D. R. Cayan (2006), Trends in snowfall versus rainfall in the western United States, J. Clim., 19, 4545–4559,doi:10.1175/JCLI3850.1.
AcknowledgmentsWe thank two anonymous reviewersand Noah Molotch for theirconstructive feedback. Weacknowledge the World ClimateResearch Programme’s Working Groupon Coupled Modeling, which isresponsible for CMIP, and we thankthe climate modeling groups (listed inTable 1 of this paper) for producingand making available their modeloutput. This research was funded bythe NOAA Climate Impacts ResearchConsortium (RISA for the Northwest)under award NA10OAR4310218 andthrough a scholarship from AvistaUtilities. We thank Timothy E. Link andPeter Goodwin for providingconstructive feedback on a priorversion of this manuscript.
Water Resources Research 10.1002/2014WR016267
LUTE ET AL. VC 2015. American Geophysical Union. All Rights Reserved. 971
Kumar, M., R. Wang, and T. E. Link (2012), Effects of more extreme precipitation regimes on maximum seasonal snow water equivalent,Geophys. Res. Lett., 39, L20504, doi:10.1029/2012GL052972.
Li, H., J. Sheffield, and E. F. Wood (2010), Bias correction of monthly precipitation and temperature fields from Intergovernmental Panel onClimate Change AR4 models using equidistant quantile matching, J. Geophys. Res., 115, D10101, doi:10.1029/2009JD012882.
Livneh, B., E. A. Rosenberg, C. Lin, B. Nijssen, V. Mishra, K. Andreadis, E. P. Maurer, and D. P. Lettenmaier (2013), A long-term hydrologicallybased data set of land surface fluxes and states for the conterminous United States: Updates and extensions, J. Clim., 26, 9384–9392,doi:10.1175/JCLI-D-12-00508.1.
L�opez-Moreno, J. I., S. Goyette, S. M. Vicente-Serrano, and M. Beniston (2011), Effects of climate change on the intensity and frequency ofheavy snowfall events in the Pyrenees, Clim. Change, 105(3–4), 489–508, doi:10.1007/s10584-010-9889-3.
Lute, A. C., and J. T. Abatzoglou (2014), Role of extreme snowfall events in interannual variability of snowfall accumulation in the westernUnited States, Water Resour. Res., 50, 2874–2888, doi:10.1002/2013WR014465.
Martin, E., G. Giraud, Y. Lejeune, and G. Boudart (2001), Impact of climate change on avalanche hazard, J. Glaciol., 32(1), 163–167, doi:10.3189/172756401781819292.
McCabe, G. J., L. E. Hay, and M. P. Clark (2007), Rain-on-snow events in the western United States, Bull. Am. Meteorol. Soc., 88, 319–328, doi:10.1175/BAMS-88-3-319.
Meehl, G. A., J. M. Arblaster, and C. Tebaldi (2005), Understanding future patterns of increased precipitation intensity in climate model sim-ulations, Geophys. Res. Lett., 32, L18719, doi:10.1029/2005GL023680.
Milly, P. C. D., J. Betancourt, M. Falkenmark, R. M. Hirsch, Z. W. Kundzewicz, D. P. Lettenmaier, and R. J. Stouffer (2008), Climate change. Sta-tionarity is dead: Whither water management?, Science, 319, 573–574, doi:10.1126/science.1151915.
Mote, P. W., A. F. Hamlet, M. P. Clark, and D. P. Lettenmaier (2005), Declining mountain snowpack in western North America, Bull. Am. Mete-orol. Soc., 86, 39–49, doi:10.1175/BAMS-86-1-39.
O’Gorman, P. A. (2012), Sensitivity of tropical precipitation extremes to climate change, Nat. Geosci., 5, 697–700, doi:10.1038/ngeo1568.O’Gorman, P. A. (2014), Contrasting responses of mean and extreme snowfall to climate change, Nature, 512, 416–418, doi:10.1038/
nature13625.Pierce, D. W., and D. R. Cayan (2013), The uneven response of different snow measures to human-induced climate warming, J. Clim., 26,
4148–4167, doi:10.1175/JCLI-D-12-00534.1.Pierce, D. W., T. P. Barnett, B. D. Santer, and P. J. Gleckler (2009), Selecting global climate models for regional climate change studies, Proc.
Natl. Acad. Sci. U. S. A., 106, 8441–8446, doi:10.1073/pnas.0900094106.Polade, S. D., D. W. Pierce, D. R. Cayan, A. Gershunov, and M. D. Dettinger (2014), The key role of dry days in changing regional climate and
precipitation regimes, Sci. Rep., 4, 4364, doi:10.1038/srep04364.Raff, D., L. Brekke, K. Werner, A. Wood, and K. White (2013), Short-term water management decisions: User needs for improved climate,
weather and hydrologic information, Civil Works Tech. Ser., CWTS-2013-1, U.S. Army Corps of Eng., National Technical Information ServiceOperations Division, Springfield, Va. [Available at http://www.ccawwg.us/docs/Short-Term_Water_Management_Decisions_Final_3_Jan_2013.pdf.]
Salath�e, E. P., A. F. Hamlet, C. F. Mass, S. Lee, M. Stumbaugh, and R. Steed (2014), Estimates of twenty-first-century flood risk in the PacificNorthwest based on regional climate model simulations. J. Hydrometeorol., 15(5), 1881–1899, doi:10.1175/JHM-D-13-0137.1.
Serreze, M. C., M. P. Clark, and A. Frei (2001), Characteristics of large snowfall events in the montane western United States as examinedusing snowpack telemetry (SNOTEL) data, Water Resour. Res., 37(3), 675–688, doi:10.1029/2000WR900307.
Singh, D., M. Tsiang, B. Rajaratnam, and N. S. Diffenbaugh (2013), Precipitation extremes over the continental United States in a transient,high-resolution, ensemble climate model experiment, J. Geophys. Res. Atmos., 118, 7063–7086, doi:10.1002/jgrd.50543.
Stewart, I. T., D. R. Cayan, and M. D. Dettinger (2004), Changes in snowmelt runoff timing in western North America under a ‘‘business asusual’’ climate change scenario, Clim. Change, 62, 217–232, doi:10.1023/B:CLIM.0000013702.22656.e8.
Stewart, I. T., D. R. Cayan, and M. D. Dettinger (2005), Changes toward earlier streamflow timing across Western North America, J. Clim., 18,1136–1155, doi:10.1175/JCLI3321.1.
Taylor, K. E., R. J. Stouffer, and G. A. Meehl (2012), An overview of CMIP5 and the experiment design, Bull. Am. Meteorol. Soc., 93, 485–498,doi:10.1175/BAMS-D-11-00094.1.
Tebaldi, C., J. M. Arblaster, and R. Knutti (2011), Mapping model agreement on future climate projections, Geophys. Res. Lett., 38, L23701,doi:10.1029/2011GL049863.
Trujillo, E., and N. P. Molotch (2014), Snowpack regimes of the western United States, Water Resour. Res., 50, 5611–5623, doi:10.1002/2013WR014753.
Zhang, F., and A. P. Georgakakos (2013), Joint variable spatial downscaling, Clim. Change, 111(3–4), 945–972, doi:10.1007/s10584-011-0167-9.
Water Resources Research 10.1002/2014WR016267
LUTE ET AL. VC 2015. American Geophysical Union. All Rights Reserved. 972