Publication V - Aalto University Learning...
18
Publication V T. Näsi*, H. Mäki*, K. Kotilahti, I. Nissilä, P. Haapalahti, and R. J. Ilmoniemi. Magnetic-stimulation-related physiological artifacts in hemodynamic near-infrared spectroscopy signals. Submitted. 147
Transcript of Publication V - Aalto University Learning...

Publication V
T. Näsi*, H. Mäki*, K. Kotilahti, I. Nissilä, P. Haapalahti, and R. J.Ilmoniemi. Magnetic-stimulation-related physiological artifacts inhemodynamic near-infrared spectroscopy signals. Submitted.
147
1
Magnetic-Stimulation-Related Physiological Artifacts in Hemodynamic Near-Infrared Spectroscopy Signals
Short tile: TMS-Related Artifacts in NIRS Signals
Tiina Näsia,b,
*, Hanna Mäkia,b
, Kalle Kotilahtia,b
, Ilkka Nissiläa, Petri Haapalahti
c, Risto J.
Ilmoniemia,b
aDepartment of Biomedical Engineering and Computational Science (BECS), Aalto
University School of Science, Espoo, Finland bBioMag Laboratory, HUSLAB, Helsinki University Central Hospital, Helsinki, Finland
cDivision of Clinical Physiology and Nuclear Medicine, HUSLAB, Helsinki University
Central Hospital, Helsinki, Finland
*Corresponding author
Abstract
Hemodynamic responses evoked by transcranial magnetic stimulation (TMS) can be
measured with near-infrared spectroscopy (NIRS). This study demonstrates that cerebral
neuronal activity is not their sole contributor. We compared bilateral NIRS responses
following brain stimulation to those from the shoulders evoked by shoulder stimulation
and contrasted them with changes in circulatory parameters. The left primary motor
cortex of ten subjects was stimulated with 8-s repetitive TMS trains at 0.5, 1, and 2 Hz at
an intensity of 75% of the resting motor threshold. Hemoglobin concentration changes
were measured with NIRS on the stimulated and contralateral hemispheres. The
photoplethysmograph (PPG) amplitude and heart rate were recorded as well. The left
shoulder of ten other subjects was stimulated with the same protocol while the
hemoglobin concentration changes in both shoulders were measured. In addition to PPG
amplitude and heart rate, the pulse transit time was recorded. The brain stimulation
reduced the total hemoglobin concentration (HbT) on the stimulated and contralateral
hemispheres. The shoulder stimulation reduced HbT on the stimulated shoulder but
increased it contralaterally. The waveforms of the HbT responses on the stimulated
hemisphere and shoulder correlated strongly with each other (r=0.65–0.87). All
circulatory parameters were also affected. The results suggest that the TMS-evoked NIRS
signal includes components that do not result directly from cerebral neuronal activity.
These components arise from local effects of TMS on the vasculature and from global
circulatory effects due to arousal. Thus, studies involving TMS-evoked NIRS responses
should be carefully controlled for physiological artifacts.

2
Introduction
Transcranial magnetic stimulation (TMS) activates the brain in a direct and controlled
manner [1]; the location, timing, amplitude, direction, and wave shape of the TMS-
induced current in the brain can be accurately determined. The TMS-evoked neuronal
activity is coupled to brain hemodynamics through neurovascular coupling. Increased
neuronal activity leads to increased blood flow, oxygenation and volume in the affected
regions. This hemodynamic response can be recorded with near-infrared spectroscopy
(NIRS) [2–10], functional magnetic resonance imaging (fMRI) [11,12], or positron
emission tomography (PET) [13–15]. The TMS-evoked hemodynamic responses inform
us about the neurovascular coupling, neuronal plasticity, functional connectivity between
brain regions, and the effects of TMS in the treatment of neurological and psychiatric
diseases [16,17]. TMS–NIRS has several advantages: NIRS is not disturbed
electromagnetically by TMS, the temporal resolution is better than in PET and fMRI,
allowing the shape of the hemodynamic response to be obtained, and the subjects are not
exposed to ionizing radiation.
TMS-evoked NIRS responses have been reported previously, but the question to what
extent they reflect TMS-evoked cerebral hemodynamic responses has not been critically
addressed. TMS induces currents also in other excitable cells than just cerebral neurons
and can activate them (see the physical principles of TMS in, e.g., [18]). The activation of
muscles or sympathetic neurons can produce local changes in blood flow, volume and
oxygenation. These types of temporally and spatially confined hemodynamic changes
that are not caused by TMS-evoked cerebral activity may occur in both the brain and the
extracerebral layers. In addition to local effects of TMS, stimulation-related changes in
systemic circulation may arise [19–21], for instance, due to discomfort and changes in
arousal state. Since the NIRS measurement is sensitive to hemodynamic changes also in
extracerebral tissue, it is affected by systemic circulation. Both systemic changes and
local direct effects of TMS on circulation may produce physiological artifacts, which
mask the cerebral hemodynamic response [22].
Sham stimulation is often implemented by moving the TMS coil away from the head,
which decreases the strength of the magnetic field and currents induced in the tissue.
However, the traditional sham stimulation is not a suitable control for stimulation-related
effects in NIRS since the local tissue effects, the discomfort and the cerebral effect all
depend on the TMS-induced currents in the tissue [18]. In this study, we characterize
stimulation-related physiological artifacts in NIRS signals, comparing TMS-evoked
bilateral NIRS responses measured during and after primary motor cortex (M1)
stimulation with those evoked by shoulder stimulation and measured in the shoulders. In
addition, we contrast the NIRS responses with changes in circulatory parameters.

3
Methods
Ethics Statement
All participants gave their written informed consent before the experiment. The study
was accepted by the Ethics Committee of Helsinki University Central Hospital and was
in compliance with the declaration of Helsinki.
Participants
Thirteen healthy subjects (age 22–32, mean 27; 1 female, 2 left-handed) participated in
brain stimulation experiments (“brain subjects”) and ten different healthy subjects (22–
33, mean 26; 2 female) in shoulder stimulation experiments (“shoulder subjects”). None
of the subjects had any history of neurological or cardiac diseases nor were they taking
any medication affecting their nervous system. Two male brain subjects were excluded
because of excessive movement and one because of difficulty staying awake.
The brain subjects sat on a reclining chair in a dimmed room in a half-sitting position and
the shoulder subjects in an upright position. They were instructed to stay relaxed and to
keep their eyes open. To prevent an auditory response, the brain subjects listened to
masking white noise (volume below 90 dB) through noise-damping headphones adjusted
so that they did not perceive the coil click. The shoulder subjects wore hearing protection
and watched a silent movie during the stimulation.
Magnetic stimulation
An eXimia stimulator with its figure-of-8 biphasic coil (average winding diameter 50
mm; Nexstim Ltd., Helsinki, Finland) was used to stimulate the left M1 hand area of the
brain subjects with eight-second repetitive TMS (rTMS) trains at 0.5, 1, and 2 Hz. 25
trains at each frequency were given in randomized order, interleaved with 28–38-s rest
periods. The coil location and orientation were determined with the MRI-guided Nexstim
eXimia Navigated Brain Stimulation system (NBS) and adjusted further to produce
maximal responses from the abductor pollicis brevis (APB). The stimulation intensity
was 75% of the resting motor threshold of the APB, which was assessed by recording
motor-evoked potentials with the ME6000 EMG device and MegaWin software (Mega
Electronics Ltd., Kuopio, Finland). A subthreshold intensity was selected in order to
avoid somatosensory responses to TMS-evoked thumb movement. Even below the motor
threshold, TMS is known to elicit cerebral activity [23].
In the shoulder experiments, magnetic pulse trains identical to those in the brain
experiments were delivered above the proximal end of the left humerus (Figure 1). This
stimulation site was chosen because there is bone and no muscular tissue under the site. A
nearby muscle (deltoid) may be activated to some extent like the temporal muscle may be
activated during the stimulation of M1. Since the brain subjects did not report cranial
muscle activation, and as the goal was to produce similar effects in both shoulder and
brain stimulation, the position of the coil was adjusted slightly if the shoulder subjects

4
reported muscle contractions. The maximal induced current was directed medially and
the intensity was 57% of the maximal stimulator output1 (equal to the average intensity
for the brain subjects).
------
Place Figure 1 here
------
NIRS Recordings
A frequency-domain instrument with two time-multiplexed laser diodes modulated at 100
MHz recorded the NIRS signals [24]. The optical power was 4–12 mW at the surface of
the tissue. One NIRS probe was attached over each hemisphere or shoulder. Each probe
comprised two source fibers and seven detector fiber bundles (brain experiments, Figure
1A) or one source and three detectors (shoulder experiments, Figure 1B). The fibers had
three different source-to-detector distances in both probe types: short (1.3 cm),
intermediate (2.8 cm), and long (3.8 cm). The purpose of the different source-to-detector
distances was to provide signals with different relative contributions from superficial and
brain tissues. Signals measured at the shortest source-to-detector distance have a
negligible relative contribution from the brain [25]. The source fibers and detector fiber
bundles had prism terminals to minimize the thickness of the probes (approximately 1
cm), which enabled coil positioning close to the stimulated tissue. The head probes were
positioned with the NBS system so that the central detectors were located above the hand
areas of the M1 on both hemispheres (Figure 1A). The shoulder probes were placed so
that the stimulation site was between the short- and intermediate-distance detectors, the
source being medial and the long-distance detector lateral to it (Figure 1B).
Photoplethysmographic (PPG) pulse waveforms were recorded with a pulse oximeter
(S/5 patient monitor, Datex-Ohmeda, Finland) attached to the left index finger of both
brain and shoulder subjects. In the shoulder subjects, the S/5 monitor simultaneously
recorded an electrocardiogram (ECG). All subjects had a movement sensor
(inclinometer) attached to their head (brain subjects) or the right shoulder (shoulder
subjects).
Data Analysis
To attenuate drifts and artifacts due to fiber contact variations, the NIRS amplitude
signals were de-trended by dividing them with a lowpass-filtered version of the
corresponding signal (–3-dB cutoff at 0.015 Hz). High-frequency noise was suppressed
by low-pass filtering (–3-dB cutoff at 0.5 Hz). The amplitude signals were converted into
total hemoglobin (HbT) and oxy- and deoxyhemoglobin (HbO2 and HbR, presented as
1 57% of the maximal stimulator output corresponds to 969 V charge of the capacitor and 3.1 kA
current in the stimulator coil.

5
supporting information) concentrations with the modified Beer–Lambert law and a
differential pathlength factor of 6 [26]. The sampling frequency of the concentrations was
2 Hz. Epochs containing peak-to-peak changes greater than six times the standard
deviation of the channel were rejected as they most likely contained motion artifacts or
changes in the contact between the probe and the skin. Also, epochs with movements as
shown by the inclinometer signal were rejected.
The heart rate and the PPG peak-to-peak amplitude were determined from the PPG for
the brain and the shoulder subjects. In addition, for the shoulder subjects, the pulse transit
time (PTT) was determined from the ECG and the PPG. The PPG amplitude reflects the
amount of blood pulsating in the blood vessels of the finger. It depends on the local
vascular compliance and is affected by vasoconstriction and -dilation [27]. The PTT was
defined as the time difference between the R peak in the ECG and the corresponding PPG
pulse wave peak. It represents the time taken by the pulse pressure wave to travel from
the heart to the finger and thus characterizes arterial stiffness along the path that the
pressure wave travels. The PTT and the PPG amplitude depend on both systemic and
local vascular tone and closely follow circulatory changes. The inverse of the pulse
transit time (1/PTT), which correlates with blood pressure [28], was analyzed
subsequently. The heart rate, PPG amplitude and 1/PPT signals were interpolated to a
sampling rate of 2 Hz. In addition, the PPG amplitudes were divided by the mean value
of each subject as they depend on the size of the blood vessels in the sampling volume
and thus vary between subjects. Epochs rejected from the NIRS signals were also rejected
from the heart rate, PPG amplitude, and 1/PTT signals. Epochs having peak-to-peak
changes eight times the standard deviation of the averaged response were also rejected (at
most 3 epochs per subject).
The HbT signals, as well as heart rate, PPG amplitude, and 1/PTT were averaged over
baseline-corrected epochs ranging from –2 to 25 s with respect to the onset of the pulse
train. The averages for each stimulation frequency were calculated over the subjects and,
in the brain experiments, over channels with identical source-to-detector distances within
each hemisphere.
Statistical Methods
To test if the responses differed significantly from baseline, paired t-tests were applied to
compare the amplitudes averaged over the 2-s time interval at the end of the magnetic
pulse train (6…8 s after the stimulation onset) with the average amplitudes of the baseline
(–2…0 s). To correct for multiple comparisons, the significance level α=0.05 was
adjusted for positively correlated tests by controlling the false discovery rate (FDR) [29].
The number of tests for correcting the significance level was 36 for HbT, HbO2 and HbR
(3 frequencies × 3 source-to-detector distances × 2 hemispheres/sides × 2 stimulation
sites, i.e., brain and shoulder), 6 for the heart rate and PPG amplitude (3 frequencies × 2
stimulation sites), and 3 for the 1/PTT (3 frequencies).
To compare the HbT waveforms from the brain with those from the shoulder and with the
circulatory responses, Pearson’s correlation coefficients (r) were calculated between the

6
corresponding values in the time period from 0 to 25 s after stimulation onset. In each
comparison, the stimulation frequencies and the source-to-detector distances were
matched. The HbT signals from the shoulder were similarly compared with the
circulatory responses.
Results
On the stimulated side, in both brain and shoulder experiments, the 2-Hz stimulation
decreased the HbT concentration significantly in channels with intermediate and long
source-to-detector distances (Figure 2); the waveforms in the brain and the shoulder
correlated strongly with each other (intermediate distance: r=0.87; long distance: r=0.65).
Contralaterally, HbT concentrations decreased in response to brain stimulation but
increased in response to shoulder stimulation (Figure 2). The changes in HbT resulted
mostly from changes in HbO2 in the brain subjects, whereas HbO2 and HbR changed
approximately the same amount in the shoulder subjects (Figures S1 and S2). The
difference may reflect the different oxygen saturation of the brain and shoulder: as the
oxygen saturation of the response generating tissue decreases, the HbR concentration and
the amplitude of the HbR response increases.
------
Place Figure 2 here
------
All the circulatory parameters were affected by the stimulation (Figure 3); in general, the
heart rate and PPG amplitude (reflecting local vascular compliance) decreased while
1/PTT (reflecting blood pressure) increased. The HbT concentrations showed
intermediate to strong correlations with the PPG amplitude in cases where both responses
compared were statistically significant (stimulated hemisphere: r = 0.34…0.46;
contralateral hemisphere: r = 0.26…0.65; stimulated shoulder: r = 0.49…0.83;
contralateral shoulder: r = –0.86…–0.53). In these cases, many of the HbT responses
showed intermediate to strong correlation also with the heart rate (contralateral
hemisphere: r = 0.31…0.50; stimulated shoulder: r = 0.49…0.65) and the 1/PTT
waveforms (stimulated shoulder: r = –0.89…–0.32), while the correlation coefficients
between other responses varied greatly between channels and conditions (heart rate and
stimulated hemisphere: r = –0.13…0.49; 1/PTT and contralateral shoulder: r =
0.01…0.47) or did not show a notable correlation (heart rate and contralateral shoulder: r
= –0.09…0.11).
------
Place Figure 3 here
------

7
Discussion
We recorded magnetically evoked hemoglobin concentration decreases in the stimulated
shoulder, which demonstrates that magnetic stimulation is capable of evoking NIRS
signal changes not directly related to cerebral hemodynamic responses. The HbT
waveforms measured on the stimulated shoulder were similar to the ones recorded on the
stimulated hemisphere and to the waveforms of the circulatory parameters as
characterized by correlation coefficients. In previous NIRS studies, decreases in HbT or
HbO2 concentrations qualitatively similar to the ones presented here have been reported
following TMS of the motor and prefrontal areas. The decreases have been measured
above both the stimulated [3, 5] and contralateral [2, 4–5, 7] cortices as well as anterior to
the stimulation site [10]. The present study challenges the view that cerebral
hemodynamic responses are the sole contributor to TMS-evoked NIRS signals. Based on
the present results, magnetic-stimulation-evoked NIRS signals include physiological
changes that are caused by TMS but do not result from the activation of cerebral neurons.
Irrespective of the origin of the magnetic-stimulation-evoked HbT decrease on the
stimulated shoulder, it is created by vasoconstriction. This is because HbT concentration
is proportional to the blood volume in the measured tissue assuming a constant
hematocrit [30]. There are at least four possible scenarios how magnetic stimulation can
cause this vasoconstriction: 1) arousal and subsequent vasoconstriction in the skin, 2)
direct stimulation of the smooth muscle walls of blood vessels and their contraction in the
extracerebral or the cerebral tissue or both, 3) stimulation of sympathetic efferent or
afferent nerve fibers, whose activation causes vasoconstriction either by directly
activating the vascular smooth muscles or indirectly through sympathetic outflow from
the brain, or 4) direct stimulation of skeletal muscles causing their contraction and,
because of the pressure generated by this, blood vessels serving the muscles constrict.
A systemic arousal effect caused by the stimulation is evident in the data: the PPG
amplitude decreased in both brain and shoulder subjects, while 1/PTT, which is linked to
blood pressure, increased in shoulder subjects. The changes in the PPG amplitude and the
1/PTT indicate that the vascular distensibility in the finger decreases and arterial stiffness
in the upper extremity increases, both of which can be associated with vasoconstriction.
The simultaneously decreased heart rate can be explained as a parasympathetic reflex to
the slight elevation in blood pressure. Preliminary results of bilaterally measured
circulatory parameters in one shoulder subject show comparable PPG amplitude and
1/PTT responses between the right and left hand, suggesting that the effect seen in the
circulatory parameters is global. This kind of systemic circulatory changes have been
reported in other NIRS studies and they seem to affect the signals [22]. Indeed, the HbT
waveform correlated with some of the circulatory parameters. However, it is unlikely that
arousal alone produces the recorded HbT concentration changes in the shoulder
experiment, since the responses on the stimulated and contralateral shoulders differ in
polarity. If the HbT responses were solely caused by arousal, they should have the same
characteristics in both shoulders because arousal acts globally.

8
The difference in the polarity of the HbT responses between the stimulated and
contralateral shoulders suggests that a local effect is included in the shoulder responses.
The local effect may arise from direct stimulation of the smooth muscle walls in blood
vessels, since the changing magnetic field induces currents in all conducting material,
also in muscle fibers. The contraction time of vascular smooth muscles is in the order of
seconds [31], which corresponds to the duration of the observed HbT responses. In
addition to direct muscle activation, vascular smooth muscles may be activated indirectly
via nerve fibers located near the target site. This could be brought about either by direct
activation of efferent sympathetic vasoconstrictor nerve fibers or by reflex sympathetic
outflow aroused by stimulation of nearby afferent nerve fibers, resulting in
vasoconstriction at the target site and close to it. By this means, the stimulation could
produce vasoconstriction that is local but covers a larger area than that just below the
target site (e.g., the whole arm). The sympathetic nerve fiber activation could thus
explain the changes seen in the PPG amplitude and the 1/PTT measured in the shoulder
experiment. However, based on preliminary results on one shoulder subject that had
comparable responses in a bilateral PPG measurement and the fact that also brain
subjects showed a consistent decrease in PPG amplitude, it seems that the PPG amplitude
and 1/PTT reflect arousal rather than stimulation-induced local sympathetic nerve fiber
activity.
Magnetic stimulation activates muscles near the stimulation coil [32]; therefore, it may
produce a NIRS component that is related to skeletal muscle contraction. This component
should, however, be small because TMS-evoked electroencephalography signals are
often free of muscle artifacts following M1 stimulation at intensities greater than the ones
in this study, even at 120% of the resting motor threshold [33]. The component stemming
from muscle contraction should be also small, since the stimulation site does not contain
muscles and the subjects did not report any muscle contraction. In addition, as opposed to
smooth muscles, the contraction of skeletal muscles lasts typically only tens or hundreds
of milliseconds [31]; thus, the latter could not explain the slow HbT responses.
The brain and the shoulder differ in their anatomy and physiology, so direct conclusions
about the origin of the NIRS responses following brain stimulation cannot be drawn
based on those following shoulder stimulation. Nevertheless, only by stimulating some
other area than the brain, the contribution of cerebral hemodynamic responses in the
NIRS signals can be excluded. In addition, direct magnetic stimulation effects can only
be studied by recording NIRS above the target site. The shoulder stimulation produced,
on the target site, HbT responses, which correlated with those produced by the brain
stimulation. This result is, despite the differences between the stimulation sites, a strong
indicator of components not related to cerebral hemodynamic responses in the brain
experiments. Any of the possible causes for the stimulation-related HbT concentration
changes in the shoulder can produce physiological artifacts in the HbT responses in the
brain experiments in a similar manner. Moreover, there is a discrepancy between TMS–
NIRS and TMS–fMRI or TMS–PET studies, which can be explained by a component in
the NIRS signals not related to cerebral hemodynamic responses; TMS–fMRI and TMS–
PET have showed increases or no significant changes in cerebral blood flow [13, 15, 34]
or blood oxygen level dependent (BOLD) responses [35–38] on the stimulated

9
hemisphere with subthreshold TMS intensities in contradiction with HbT decreases
recorded in this and other NIRS studies [3,5].
The contralateral HbT signals in the brain may also include components not directly
related to cerebral neuronal activity. The decreased HbT concentration on the
contralateral M1 is, however, consistent with the results of TMS–fMRI and TMS–PET
studies, where negative BOLD responses [36,37] and decreased regional cerebral blood
flow [13] have been reported following subthreshold M1 stimulation. Since fMRI and
PET have good spatial resolution, the reported hemodynamic changes are local, and
extracerebral and cerebral signals are better separated than in NIRS, it is probable that the
decreases reflect an actual cerebral hemodynamic response, resulting from inhibited
contralateral cerebral activity, rather than an effect of TMS on the vasculature unrelated
to cerebral activity.
If we understand the nature of the different NIRS components, it may be possible to
separate the cerebral-activity-induced hemodynamic response from the other
components. Established methods for removing physiological artifacts from NIRS
responses are particularly suitable for removing global signal changes. Principal
component analysis (PCA), for example, divides the signal into uncorrelated components
and the component with the largest eigenvalue reflects, in some cases, the systemic
contribution [39,40]. In the current study, this variation of PCA is not suitable because it
seems that the stimulus-related components observed here are not completely of global
origin but result also from local effects of the stimulation. In general, applying PCA-
based artifact removal methods for TMS-evoked NIRS signals is problematic because the
cerebral hemodynamic responses and other components that are temporally and spatially
correlated cannot be easily separated with PCA. This temporal correlation between the
hemodynamic response and the other components is also a problem in another method in
which the mean of the signals in channels with a short source-to-detector distance is
decorrelated from the data with linear regression [41,42]. In addition, if the local effect of
TMS is not only superficial but also prominent in deeper layers, this and other methods
relying on signals reflecting activities in different layers in different proportions are not
reliable. Indeed, if TMS causes direct contraction of blood vessels in the brain, it may be
impossible to separate the resulting physiological artifact from the cerebral hemodynamic
responses. Nevertheless, if this is not the case, sophisticated independent component
analysis methods combined with a dense NIRS grid to better spatially separate between
different components [43] could help in distinguishing the cerebral hemodynamic
response. In addition, it may be possible to draw inferences about TMS-evoked cerebral
activity by carefully controlling the study design or by performing control measurements
that would evaluate the effects of TMS-related physiological artifacts on the NIRS
responses.
In conclusion, NIRS can be easily combined with TMS to measure stimulation-evoked
hemodynamic changes. These changes, however, include components not directly related
to cerebral activity. Such components can result from local effects of TMS on the
vasculature and from a global arousal effect. Effective methods to separate these
components from the cerebral hemodynamic responses are needed. Altogether, when

10
recording TMS-evoked cerebral activity with NIRS, the study should be carefully
controlled for physiological artifacts in order to draw reliable inferences about cerebral
activity.
Acknowledgments
The authors would also like to thank Dustin Jacqmin for providing help with editing the
manuscript.
References
[1] Barker AT, Jalinous R, Freeston IL (1985) Non-invasive magnetic stimulation of the
human motor cortex. Lancet 1: 1106–1107.
[2] Aoyama Y, Hanaoka N, Kameyama M, Suda M, Sato T, et al. (2009) Stimulus
intensity dependence of cerebral blood volume changes in left frontal lobe by low-
frequency rTMS to right frontal lobe: a near-infrared spectroscopy study. Neurosci Res
63: 47–51.
[3] Hada Y, Abo M, Kaminaga T, Mikami M (2006) Detection of cerebral blood flow
changes during repetitive transcranial magnetic stimulation by recording hemoglobin in
the brain cortex, just beneath the stimulation coil, with near-infrared spectroscopy.
NeuroImage 32: 1226–1230.
[4] Hanaoka N, Aoyama Y, Kameyama M, Fukuda M, Mikuni M (2007) Deactivation
and activation of left frontal lobe during and after low-frequency repetitive transcranial
magnetic stimulation over right prefrontal cortex: A near-infrared spectroscopy study.
Neurosci Lett 414: 99–104.
[5] Kozel FA, Tian F, Dhamne S, Croarkin PE, McClintock SM, et al. (2009) Using
simultaneous repetitive transcranial magnetic stimulation / functional near infrared
spectroscopy (rTMS/fNIRS) to measure brain activation and connectivity. NeuroImage
47: 1177–1184.
[6] Mochizuki H, Ugawa Y, Terao Y, Sakai KL (2006) Cortical hemoglobin-
concentration changes under the coil induced by single-pulse TMS in humans: a
simultaneous recording with near-infrared spectroscopy. Exp Brain Res 169: 302–310.
[7] Mochizuki H, Furubayashi T, Hanjima R, Terao Y, Mizuno Y, et al. (2007)
Hemoglobin concentration changes in the contralateral hemisphere during and after theta
burst stimulation of the human sensorimotor cortices. Exp Brain Res 180: 667–675.
[8] Noguchi Y, Watanabe E, Sakai KL (2003) An event-related optical topography study
of cortical activation induced by single-pulse transcranial magnetic stimulation.
NeuroImage 19: 156–162.

11
[9] Oliviero A, Di Lazzaro V, Piazza O, Profice P, Pennisi MA, et al. (1999) Cerebral
blood flow and metabolic changes produced by repetitive magnetic brain stimulation. J
Neurol 246: 1164–1168.
[10] Thomson RH, Daskalakis ZJ, Fitzgerald PB (2010) A near infra-red spectroscopy
study of the effects of pre-frontal single and paired pulse transcranial magnetic
stimulation. Clin Neurophysiol 122: 378–382.
[11] Bestmann S, Ruff CC, Blakenburg F, Weiskopf N, Driver J, et al. (2008): Mapping
causal interregional influences with concurrent TMS–fMRI. Exp Brain Res 191:383–402.
[12] Bohning DE, Shastri A, Nahas Z, Lorberbaum JP, Andersen SW, et al. (1998)
Echoplanar BOLD fMRI of brain activation induced by concurrent transcranial magnetic
stimulation. Invest Radiol 33: 336–340.
[13] Fox PT, Narayana S, Tandon N, Fox SP, Sandoval H, et al. (2006) Intensity
modulation of TMS-induced cortical excitation: primary motor cortex. Hum Brain Mapp
27: 478–487.
[14] Paus T, Jech R, Thompson CJ, Comeau R, Peters T, et al. (1997) Transcranial
magnetic stimulation during positron emission tomography: a new method for studying
connectivity of the human cerebral cortex. J Neurosci 17: 3178–3184
[15] Siebner HR, Takano B, Peinemann A, Schwaiger M, Conrad B, et al. (2001)
Continuous transcranial magnetic stimulation during positron emission tomography: a
suitable tool for imaging regional excitability of the human cortex. NeuroImage 14: 883–
890.
[16] O'Shea J, Taylor PCJ, Rushworth MFS (2008) Imaging causal interactions during
sensorimotor processing. Cortex 44: 598–608.
[17] Shibasaki H (2008): Human brain mapping: Hemodynamic response and
electrophysiology. Clin Neurophysiol 119: 731–743.
[18] Ilmoniemi RJ, Ruohonen J, Karhu J (1999) Transcranial magnetic stimulation – a
new tool for functional imaging of the brain. Crit Rev Biomed Eng 27: 241–284.
[19] Foerster A, Schmitz JM, Nouri S, Claus D (1997) Safety of rapid-rate transcranial
magnetic stimulation: heart rate and blood pressure changes. Electroencephalogr Clin
Neurophysiol 104: 207–212.
[20] Macefield VG, Taylor JL, Wallin BG (1998) Inhibition of muscle sympathetic
outflow following transcranial cortical stimulation. J Auton Nerv Syst 68: 49–57.

12
[21] Sander D, Meyer B-U, Röricht S, Klingelhöfer J (1995) Effect of hemisphere-
selective repetitive magnetic brain stimulation on middle cerebral artery blood flow
velocity. Electroencephalogr Clin Neurophysiol 97: 43–48.
[22] Tachtsidis I, Leung TS, Chopra A, Koh PH, Reid CB, et al. (2009) False positives in
functional nearinfrared topography. Adv Exp Med Biol 645: 307–314.
[23] Komssi S, Kähkönen S, Ilmoniemi RJ (2004) The effect of stimulus intensity on
brain responses evoked by transcranial magnetic stimulation. Hum Brain Mapp 21: 154–
164.
[24] Nissilä I, Noponen T, Kotilahti K, Katila T, Lipiäinen L, et al. (2005)
Instrumentation and calibration methods for the multichannel measurement of phase and
amplitude in optical tomography. Rev Sci Instrum 76: 044302.
[25] Firbank M, Okada E, Delpy DT (1998) A theoretical study of the signal contribution
of regions of the adult head to near-infrared spectroscopy studies of visual evoked
responses. NeuroImage 8: 69–78.
[26] Nissilä I, Noponen T, Heino J, Kajava T, Katila T (2005) Diffuse optical imaging.
In: Lin JC, editor. Advances in electromagnetic fields in living systems. Vol 4. New
York: Springer Science+Business Media. pp. 77–130.
[27] Shelley KH (2007) Photoplethysmography: beyond the calculation of arterial oxygen
saturation and heart rate. Anesth Analg 105: S31–S36.
[28] Naschitz JE, Bezobchuk S, Mussafia-Priselac R, Sundick S, Dreyfuss D, et al.
(2004) Pulse transit time by R-wave-gated infrared photoplethysmography: review of the
literature and personal experience. J Clin Monit Comput 18: 333–342.
[29] Benjamini Y, Hochberg Y (1995) Controlling the false discovery rate: a practical
and powerful approach to multiple testing. J R Statist Soc, B 57: 289–300.
[30] Boas DA, Strangman G, Culver JP, Hoge RD, Jasdzewski G, et al. (2003) Can the
cerebral metabolic rate of oxygen be estimated with near-infrared spectroscopy? Phys
Med Biol 48: 2405–2418.
[31] Guyton AC, Hall JE (2000) Textbook of medical physiology. Philadelphia: W. B.
Saunders Company. 1064 p.
[32] Mäki H, Ilmoniemi RJ (2011) Projecting out muscle artifacts from TMS-evoked
EEG. NeuroImage 54: 2706–2710.
[33] Kičić D, Lioumis P, Ilmoniemi RJ, Nikulin VV (2008) Bilateral changes in
excitability of sensorimotor cortices during unilateral movement: combined
13
electroencephalographic and transcranial magnetic stimulation study. Neuroscience 152:
1119–1129.
[34] Speer AM, Willis MW, Herscovitch P, Daube-Witherspoon M, Shelton JR, et al.
(2003) Intensity-dependent regional cerebral blood flow during 1-Hz repetitive
transcranial magnetic stimulation (rTMS) in healthy volunteers studied with H215
O
positron emission tomography: I. Effects of primary motor cortex rTMS. Biol Psychiatry
54: 818–825.
[35] Baudewig J, Siebner HR, Bestmann S, Tergau F, Tings T, et al. (2001) Functional
MRI of cortical activations induced by transcranial magnetic stimulation (TMS).
Neuroreport 12: 3543–3548.
[36] Bestmann S, Baudewig J, Siebner HR, Rothwell JC, Frahm J (2003) Subthreshold
high-frequency TMS of human primary motor cortex modulates interconnected frontal
motor areas as detected by interleaved fMRI-TMS. NeuroImage 20: 1685–1696.
[37] Bestmann S, Baudewig J, Siebner HR, Rothwell JC, Frahm J (2004) Functional MRI
of the immediate impact of transcranial magnetic stimulation on cortical and subcortical
motor circuits. Eur J Neurosci 19: 1950–1962.
[38] Bohning DE, Shastri A, McConnell KA, Nahas Z, Lorberbaum JP, et al. (1999) A
combined TMS/fMRI study of intensity-dependent TMS over motor cortex. Biol
Psychiatry. 45: 385–94.
[39] Virtanen J, Noponen T, Meriläinen P (2009) Comparison of principal and
independent component analysis in removing extracerebral interference from near-
infrared spectroscopy signals. J Biomed Opt 14: 054032.
[40] Zhang Y, Brooks DH, Franceschini MA, Boas DA (2005) Eigenvector-based spatial
filtering for reduction of physiological interference in diffuse optical imaging. J Biomed
Opt 10: 11014.
[41] Saager RB, Berger AJ (2005) Direct characterization and removal of interfering
absorption trends in two-layer turbid media. J Opt Soc Am A Opt Image Sci Vis 22:
1874–1882.
[42] Gregg NM, White BR, Zeff BW, Berger AJ, Culver JP (2010) Brain specificity of
diffuse optical imaging: improvements from superficial signal regression and
tomography. Front Neuroenergetics 2: 1–8.
[43] Heiskala J, Hiltunen P, Nissilä I (2009) Significance of background optical
properties, time-resolved information and optode arrangement in diffuse optical imaging
of term neonates. Phys Med Biol 54: 535–554.

14
Figure Legends
Figure 1. Measurement setup. The position of the NIRS probe (A) in the brain
experiments digitized with the NBS software and (B) in the shoulder experiments without
(left) and with (right) the stimulation coil. Three different source-to-detector distances
(1.3, 2.8, and 3.8 cm) were used to estimate signals originating in different proportions
from different depths of the measured tissue. Identical probes were attached on the
contralateral hemisphere and shoulder.
Figure 2. HbT responses following brain (green) and shoulder (blue) stimulation.
HbT responses from the stimulated (left) and the contralateral (right) brain hemispheres
and shoulders at short (uppermost row), intermediate (center row), and long (lowest row)
source-to-detector distance channels. The standard errors of mean are shaded with the
corresponding color. Vertical lines indicate times at which the magnetic pulses were
given. HbT decreased on both the stimulated brain hemisphere and shoulder, while the
brain and shoulder responses had opposite polarities on the contralateral side. * p < 0.05
(t-tests for the response amplitudes compared to baseline, p-values controlled for FDR)
Figure 3. Changes in circulatory parameters following brain (green) and shoulder
(blue) stimulation. The standard errors of mean are shaded with the corresponding color.
Vertical lines indicate times at which the magnetic pulses were given. The PPG
amplitude and heart rate decreased and 1/PTT increased in response to stimulation. * p <
0.05 (t-tests for the response amplitudes compared to baseline, p-values controlled for
FDR)
Supporting Information Legends
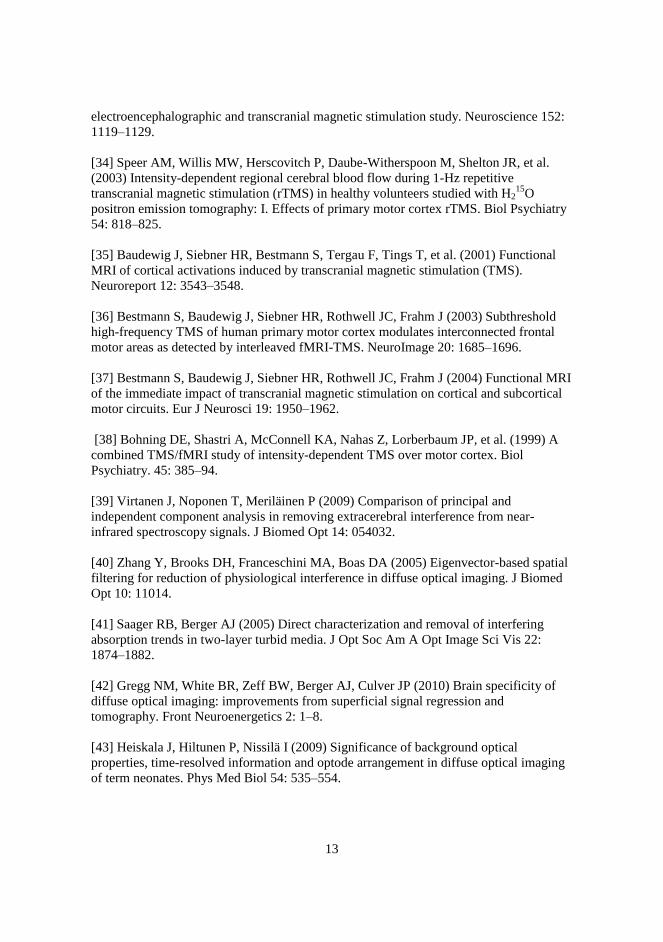
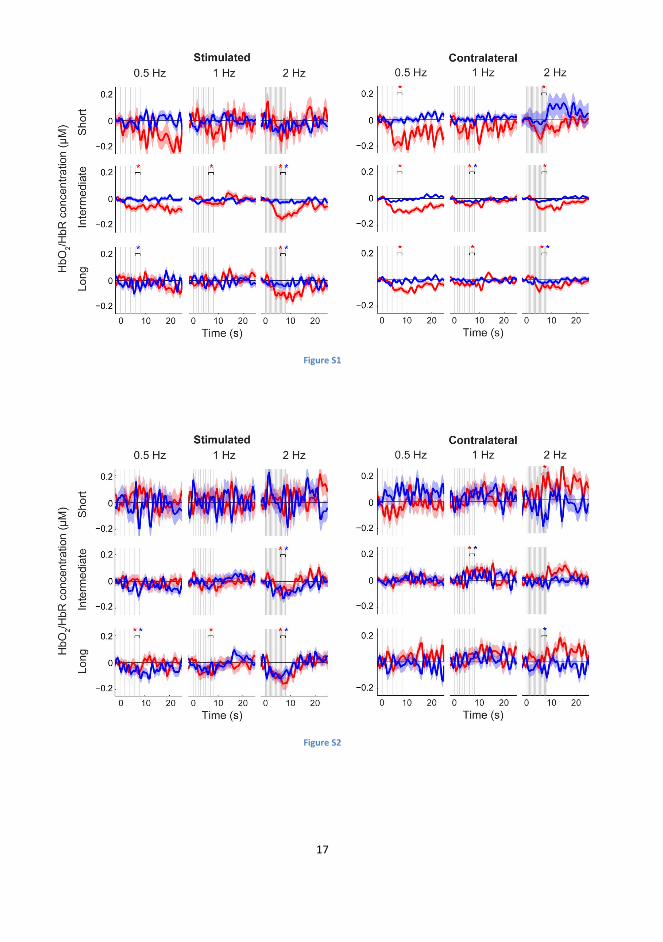
Figure S1. Changes in HbO2 (red) and HbR (blue) following brain stimulation.
HbO2 and HbR responses from the stimulated (left) and the contralateral (right) brain
hemispheres at short (uppermost row), intermediate (center row), and long (lowest row)
source-to-detector distance channels. The standard errors of mean are shaded with the
corresponding color. Vertical lines indicate times at which the TMS pulses were given.
HbO2 decreased on both the stimulated and the contralateral hemisphere. * p < 0.05 (t-
tests for the response amplitudes compared to baseline, p-values controlled for FDR)
Figure S2. Changes in HbO2 (red) and HbR (blue) following shoulder stimulation.
HbO2 and HbR responses from the stimulated (left) and the contralateral (right) shoulders
at short (uppermost row), intermediate (center row), and long (lowest row) source-to-
detector distance channels. The standard errors of mean are shaded with the
corresponding color. Vertical lines indicate times at which the magnetic pulses were
given. HbO2 and HbR decreased on the stimulated shoulder. * p < 0.05 (t-tests for the
response amplitudes compared to baseline, p-values controlled for FDR)

15
Figure 1

16
Figure 2
Figure 3
17
Figure S1
Figure S2