Publication No. 63-SO WA-PS-003o · Publication No. 63-SO WA-PS-003o ... Everett is situated on...
18
Publication No. 63-SO WA-PS-003o NOtE (II SULFITE WASTE LIQUOR AND DISSOLVED OXYGEN CONCENTRATIONS IN THE VICINITY OF A SUBMARINE OUTFALL by Richard J. Callavay U. S. Public Health Service Water Supply and Pollution Control Program 570 Pittock Block Portland 5, Oregon
Transcript of Publication No. 63-SO WA-PS-003o · Publication No. 63-SO WA-PS-003o ... Everett is situated on...

PublicationNo. 63-SOWA-PS-003o
NOtE (II SULFITE WASTE LIQUOR AND DISSOLVED OXYGEN
CONCENTRATIONS IN THE VICINITY OF A SUBMARINE OUTFALL
by
RichardJ. Callavay
U. S. Public Health ServiceWater Supply and Pollution Control Program
570 Pittock BlockPortland 5, Oregon

ABSTRACT
Monthly oceanographic surveys have been conducted in the vicinity of
Everett, Washington since Hay 1962. One purpose of these surveys, which
still continue, is to determine the distribution of sulfite waste Liquor
emanating from a deep submarine diffuser outfall serving Lw pulp mills.
Examples of sumner and winter sulfite waste liquor and dissolved
oxygen conditions in Possession Sound are given. Concentrations of sulfite
waste liquor greater than 5 mg/I are found at depth at dis:ances greater
than 10 kin frost the diffuser. Oxygen demand of mill waste products is
traceable at depth to 8 km fro. the source. The diffuser itself approxi-
uatee a conttuuouu point source.
INTRODUCTION
Since May 1962, the U. S. Public Health Service and Washington Pollution
Control Co~uutsston have been engaged in joint tuvestigationi of the wters
in the vicinity of Everett, Washington. One aspect of this work is presented
here--namely, the distribution of sulfite waste liquor (SIlL) discharged via
a submarine diffuser line and the effect of SIlL on local oxygen resources.
STUDY AREA
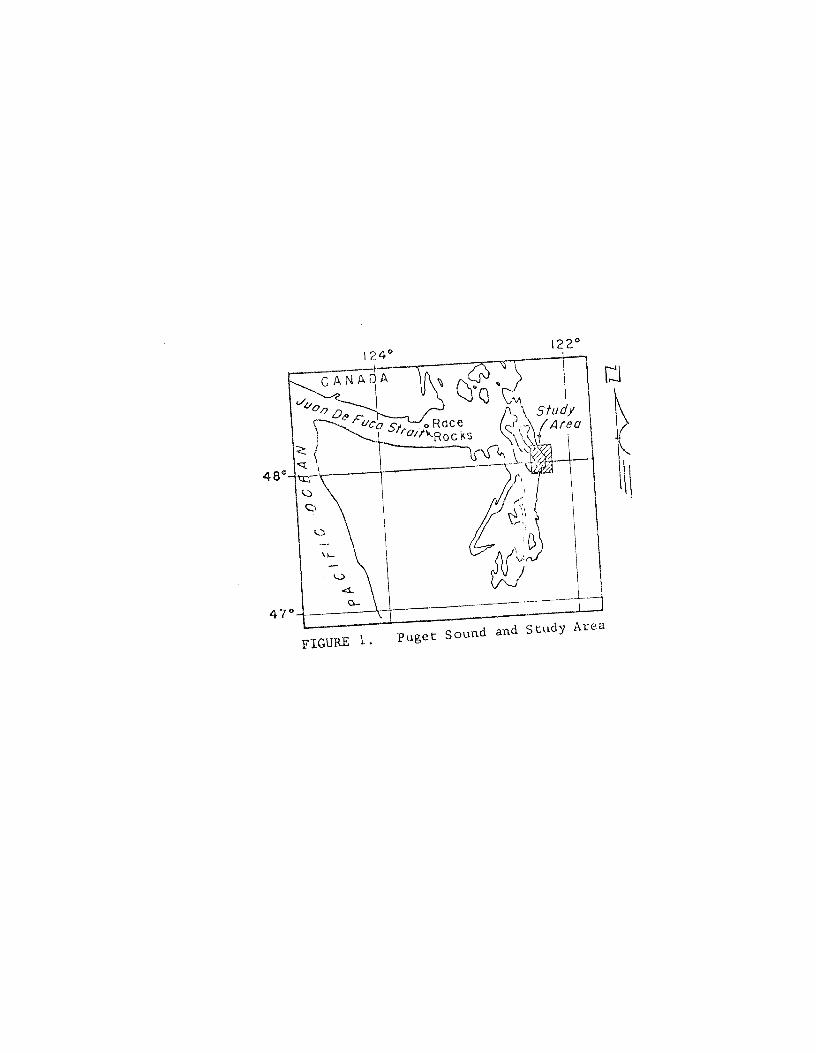
Everett is situated on Port Gardner which is part of the Puget Sound
system (Figures 1 and 2). Tides In Puget Sound are mixed, and the mean
diurnal range is 3.4 meters, Tidal currents are not well known at present
but are described by the U. S. Coast & Geodetic Survey (1952) as “weak and
variable”.

2.
Net motion is northwardalong the bottom. Considerabledilution of
surface watersoccurs due to precipitation, runoff frost the Snohomish River,
and advectionof dilute surfacewaters. Sills of relatively shallow depth
are situatedat the entrancesto Port Susan. The effect of thesesills on
water exchange in Port Susan and on oxygen consumption therein has been.
described by Barnes and Collias (1958).
Numerous hydrographic stations han been occupied in Possession Sound
and adjacent areas by the University of Washington since 1952. Time-series
analysis of their data indicates that the bottom water in Possession Sound
is renewed via water entering the Strait of Juan de Fuca. There is a lag
of approxisately six weeks from the time deep water passes Race Rocks until
it enters Possession Sound.
WASTEEFFLUENT
There are two large sulfite pulp mills situated in Everett. Waste
waters from these mills are discharged into the surface waters of the inner
harbor and through a submerged outfall. The surface discharge results pri-
warily from log barking processes used prior to reducing the logs, white
waters from pulp and paper machines, and bleach plant effluents. The waste
liquor from the two mills is transported to a surge tank by a single pipe-
line. The liquor is then discharged at depth from the surge tank.
The submerged pipeline is 914 meters long, of which the last 305 meters
consist of a multiple-port diffuser line. The upper part of the diffuser
lies in about 50 meters of water, and the lower part in about 100 meters.

3.
According to pulp mill data, total discharge to the submerged outfall
is approximately 79.5 x l0~ cubic meters per day and is continuously dis-
charged throughout a day. Included in this volume of water; 1,277 metric
tons of dissolved solids and 4.58 metric tons of fiber are discharged.
Biochemical oxygen demand is estimated at 386.4 metric tons per day.
METHODS
At approximately one-month intervals, hydrographic stations were occu-
pied at about one nautical-mile intervals radially from the end of the pipe-
line (Figure 2). Water samples are collected using teflon-coated Hansen•
bottles, usually at depths of 0, 5, 10, 20, 303 50, 75, 100, 125, and 150
meters, depth permitting.
Sulfite waste liquor concentration is determined by the Barnes et al.
(1963) modification of the Pearl-Benson (1940) technique. This is a measure
of the lignin content of water originating from the pulping processes —-
ployed by the pulp mills. The test does not give an indication of spent
chemicals, sugars, and other componenets, that are also Included under the
tern sulfite waste liquor (or, as some prefer, spent sulfite liquor). Con-
centrations of SWL of 5 mg/I or less are generally considered “background”.
Other substances, such as pea vine wastes or sanitary sewage, will give
significant SIlL values. In the region considered concentrations of greater
than 5 mg/I SWL are due solely to the presence of lignin. Measurable oxygen
demand is by substances other than lignin (hexoses, pentoses) but good cor-
relation exists between SIlL concentration and oxygen deficiency.
In addition to SIlL; temperature, salinity, dissolved oxygen, and pH
are routinely measured from the same Hansen bottle from which the SWL

4,
sample was obtained. Dissolved oxygen is determined by the Alsterberg
(azidc) modification (APHA, 1960) of the Winkler test. The Rennerfelt
(1955) test of the effect of SWL on the azide determination of dissolved
oxygen showed no lowering of dissolved oxygen at the SWL concentrations
encountered. (Dissolved oxygen in the presence of SWL will be determined
in the field by gas chromatography and in situ by galvanic cell analyzer
in the summer of 1963.)
RESULTS
Station positions shown in Figure 2 were occupied on August 2-3, 1962.
Tidal ‘onditions are indicated in the inset. A vertical section of SWL
concentration along the line connecting iydrographic stations in Figure 2
is given in Figure 3. This section extends from the pipeline into Saratoga
Passage. About six hours were required to occupy the stations. There is
a pronounced tongue of high (50 mg/I) SWL concentration extending 4 km from
the diffuser at about 75 meters depth. The tongue gradually rises to about
40 meters where the concentration diminishes to 22 ppm at 8 km. ~The figure
also shows a secondary tongue of SWL at about 20 meters (SWL conc. 400 mg/l)~
whjelt< l~eii~Lt~ ~b--d~e~-t~o~-a h~ak. itv-the The s ~ The
surface waters show concentrations of 10-20 ppm. Thermocline depth during
This cruise was 5-10 meters, and he depth of the halocline was 2-5 meters.
Figure 4 shows oxygen distribution along the same section during the
August cruise. Plume depths and configurations of low dissolved oxygen
and high SWL concentration are similar,
5.
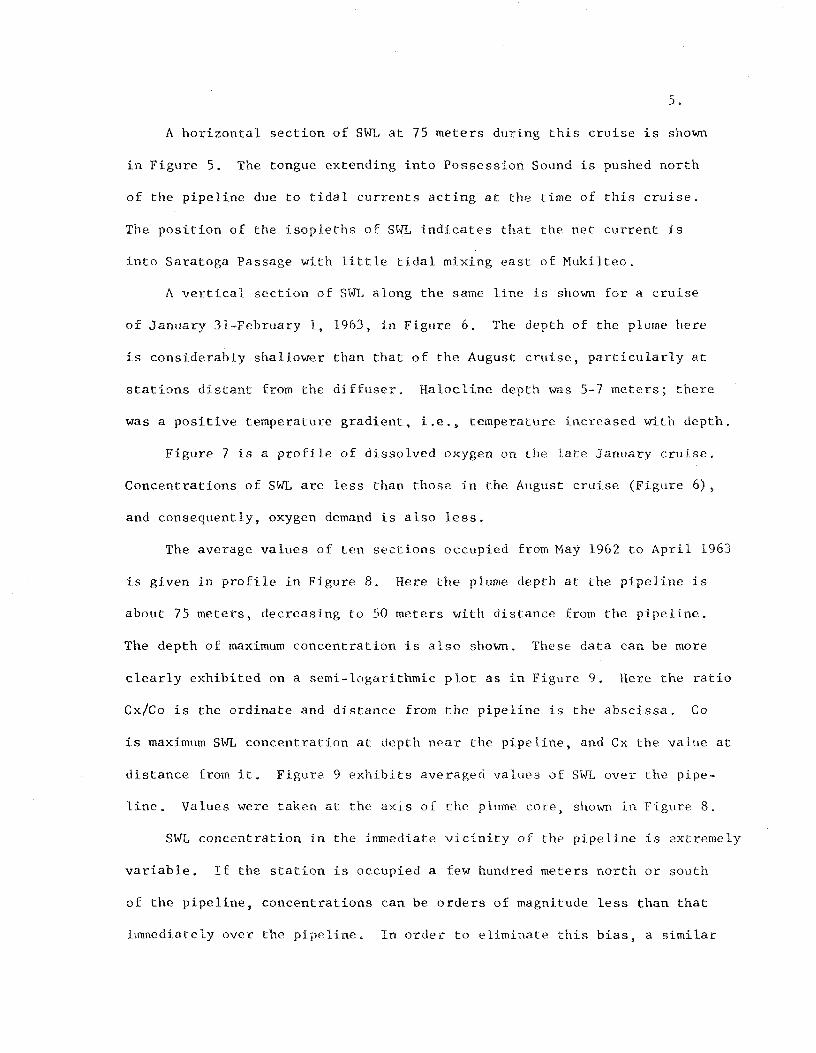
A horizontal section of SWL at 75 meters during this cruise is shown
in Figure 5. The tongue extending into Possession Sound is pushed north
of the pipeline due to tidal currents acting at the time of this cruise.
The position of the isopleths of SWL indicates that the net current is
into Saratoga Passage with little tidal mixing east of Nukilteo.
A vertical section of SWV along the same line is shown for a cruise
of January 31-February 1, 1963, in Figure 6. The depth of the plume here
is considerably shallower than that of the August cruise, particularly at
stations distant from the diffuser, Halocline depth was 5-7 meters; there
was a positive temperature gradient, i.e temperature increased with depth.
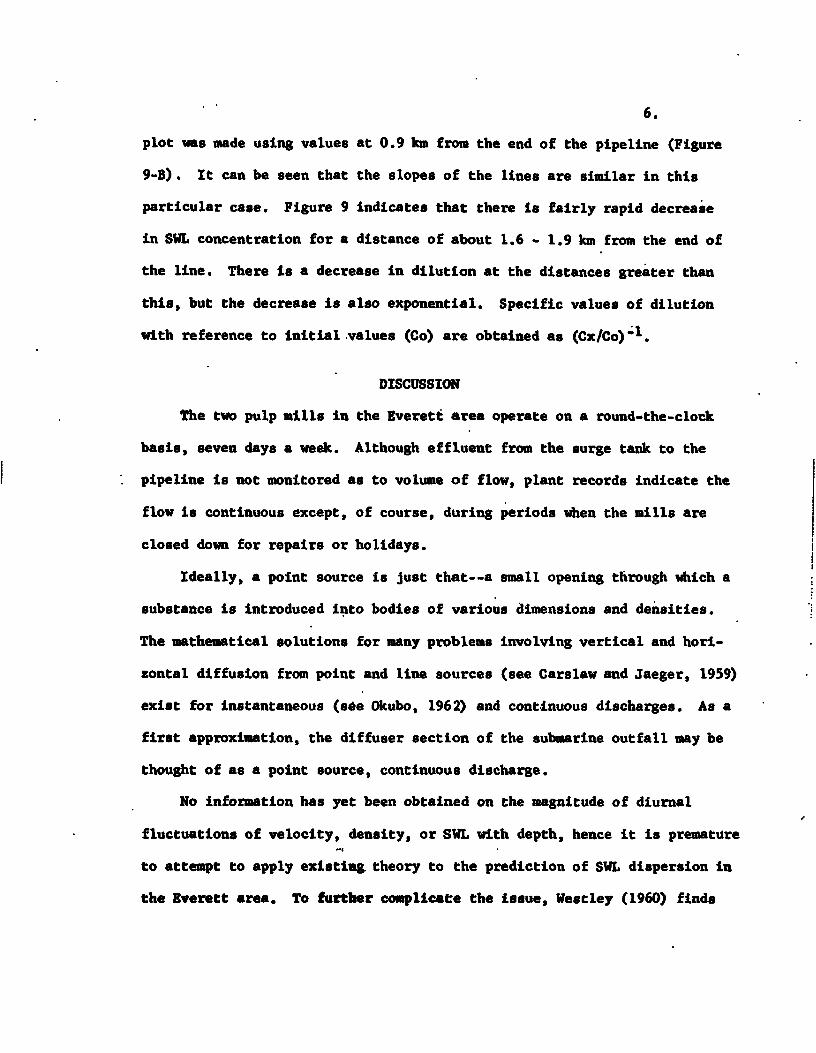
Figure 7 is a profile of dissolved oxygen on th. lat- January cruise.
Concentrations of S1~TL are less than those in the August cruise (Figure 6),
and consequently, oxygen demand is also less.
The average values of ten sections occupied from Nay 1962 to April 1963
is given in profile in Figure 8. Here the plume depth at the pipeline is
about 75 meters, decreasing to 50 meters with distance from the pipeline.
The depth of maximum concentration is also shown. These data can be more
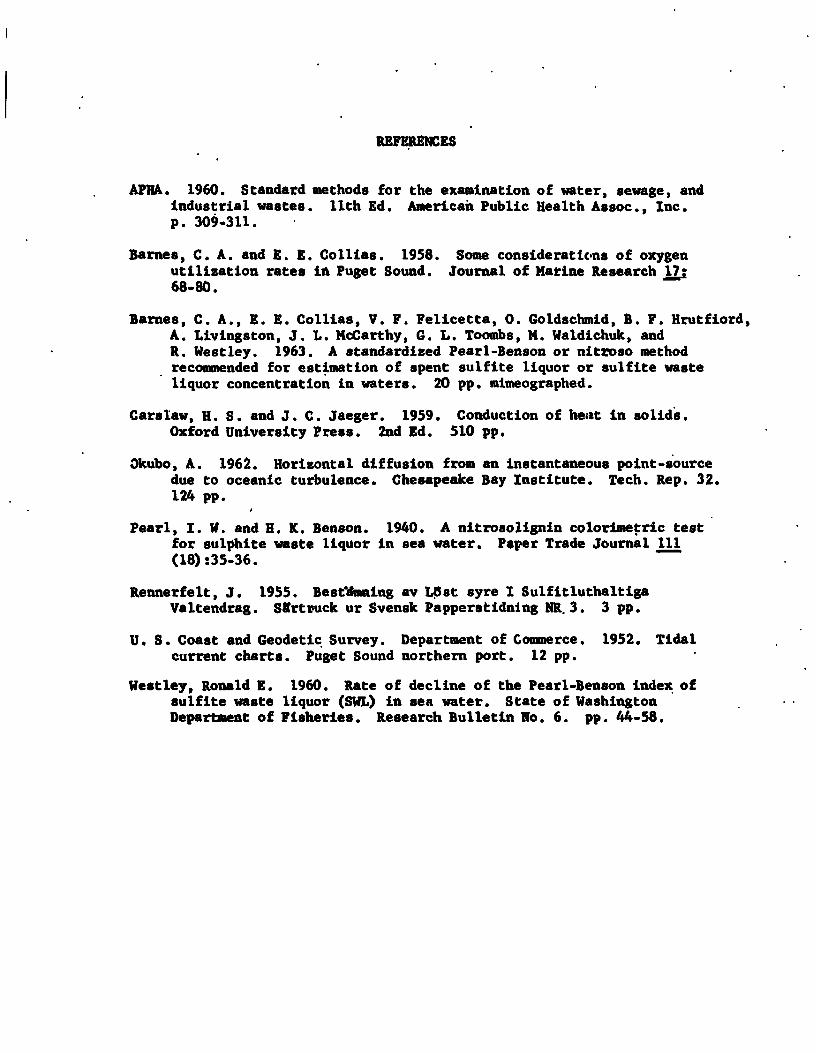
clearly exhibited on a semi-logarithmic plot as in Figure 9. Here the ratio
Cx/Co is the ordinate and distance from the pipeline is the abscissa. Co
is maximum SWL concentration at (Iepth near the pipeline, and Cx the value at
distance from it, Figure 9 exhibits averaged values of SWE over the pipe-
line, Values were taken at the ~xis of The plume cur shown in Figure 8.
SWL concentration in the immediate vicinity of the pipeline is extremely
variable. If the station is occupied a few hundred meters north or south
of the pipeline, concentrations can be orders of magnitude less than that
i ediately over the p1 e~ine, In orde~- to eliminate this bias, a similar
6.
plot was made using values at 0.9 km from the end of the pipeline (Figure
9-B). It can be seenthat the slopes of the lines are similar in this
particular case. Figure 9 indicates that there is fairly rapid decrease
in SIlL concentration for a distance of about 1.6 - 1.9 km from the end of
the line. There is a decrease in dilution at the distances greater than
this, but the decrease is also exponential. Specific values of dilution
with reference to initial values (Co) are obtained as (CxICoY1.
DISCUSSION
The two pulp mills in the Everett area operate on a round-the-clock
basis, seven days a week. Although effluent from the surge tank to the
pipeline is not monitored as to volume of flow, plant records indicate the
flow is continuous except, of course, during periods when the mills are
closed down for repairs or holidays.
Ideally, a point source is just that--a small opening through which a
substance is introduced into bodies of various dimensions and densities.
The mathematical solutions for many problems involving vertical and hori-
zontal diffusion from point and line sources (see Carslaw and Jaeger, 1959)
exist for instantaneous (see Okubo, 1962) and continuous discharges. As a
first approximation, the diffuser section of the submarine outfall may be
thought of as a point source, continuous discharge.
No information has yet been obtained on the magnitude of diurnal
fluctuations of velocity, density, or SWL with depth, hence it is premature
to attempt to apply existing theory to the prediction of SWL dispersion in
the Everett area. To further complicate the issue, Veseley (1960) finds

from experiments in an enclosed lagoon that SIlL is not a conservative
substance• He found that SIlL (as measuredby the Pearl-Benson technique)
had a half-life of about five days at 200C and 9.5 days at ll.7”C. His
experiments were conducted in semi-field conditions in a shallow lagoon
with maximum depth of 4 meters• No estimatesof boundary absorption or
the degreeof mixing are given.
SUIHARY
The field work to date has been of a general survey nature in which
long term trends in salinity, dissolved oxygen, and SIlL concentrations
have been followed. This work has provided the needed background for
small scale (in time and space) investigations in which ciurnal and short
term effects may be studied. Certain empirical relations, such as that
shown in Figure 9, have provided first order estimates of zones of initial,
rapid dispersion and dilution of SIlL. The limits of SIlL distribution have
been mapped for various tidal and climatic conditions.
REFERENCES
APHA. 1960. Standard methods for the examination of water, sewage, andindustrial wastes. 11th Ed. American Public Health Assoc., Inc.p. 309-311.
Barnes, C. A. and H. 3. Collias. 1958. Some considerations of oxygenutilization rates itt Puget Sound. Journal of Marine Research 17
:
68-80.
Barnes, C. A., H. H. Collias, V. F. Felicetta, 0. Goldschmid, B. F. Hrutfiord,A. Livingston, J. L. McCarthy, G. L. Toombs, M. Waldichuk, andR. Westley. 1963. A standardized Pearl-Benson or nitroso methodrecommended for estimation of spent sulfite liquor or sulfite wasteliquor concentration in waters. 20 pp. mimeographed.
Carsiaw, H. S. and J. C. Jaeger. 1959. Conduction of heat in solids.Oxford University Press. 2nd Ed. 510 pp.
Okubo, A. 1962. Horizontal diffusion from an instantaneous point-sourcedue to oceanic turbulence. Chesapeake Bay Institute. Tech. Rep. 32.124 pp.
Pearl, I. V. and H. IC. Benson. 1940. A nitrosolignin colorimepric testfor sulphite waste liquor in sea water. Paper Trade Journal 111(18) :35-36.
Rennerfelt, J. 1955. Bestiuming av War syre I SulfirluthaltigaValtendrag. Sffrtiuck or Svensk Papperstidning KR. 3. 3 pp.
U. S. Coast and Geodetic Survey. Department of C.ouuaerce. 1952. Tidalcurrent charts. Puget Sound northern port. 12 pp.
Westley, Ronald 3. 1960. Rate of decline of the Pearl-Benson index ofsulfite waste liquor (SIlL) in sea water. State of WashingtonDepartment of Fisheries. ResearchBulletin No. 6. pp. 44-58.
t4
FiGURE 1. Puget sound and study Area

Station locations, August 1962.used in vertical sections.
Open circles show stations
‘-4
0
b4v’.~UO
P1k
FIGURE 2,

0C)C)
CNkm0CD
0‘—4
CD
Cl)
‘4-40~C
)o
CD
.‘jC~j
4-4(/)
UU
)0
(0
‘—4
(0co
CD
uO
.‘-1.4~)
E)C
O
CJC
O~
•v)
c~)CD0
0
0

00
00
In0
InH
—
0
00
0In
0In
04-~j
In~
——
II
I
41)U
)
00-oCLiiE00)
0U)
0
In
II
‘I
C’)
C-’
‘--4Li
U)
CD
‘-4CDC)CD
0‘-UC)
‘--4
0U)
U)
‘H~0
‘4-40(00“-44-4C)04U)
-4(0C)
“-4Li4-4
C)
C)CD(0(I)U)
(0p-4(0CD0L
i(04-4(0U
)0LiC)
(0“-4‘--4C
)
‘H
I///
410H

ax
0)
0
I
FIGURE 5~ SWL (mg/i) at 75 meters, August 1962.

0)
U)
‘4—C
)
‘H
004
‘H
E04—(0‘-CC
-’‘—
41~0
)(0
ciCoC
)
0
—4
.
‘—4CD
‘4-AC
)0
CD(0
CU
)C
U)
‘H(0
Li~
C-)0
4(0
U)
CD
0(0
‘--4L
i(0
(0U
4-a
‘HCo
Li
(/2
04
0
‘-0
-Co
0H
0
0In
0In
00
Inr—
~0
InH
..--.-
0
00
In0
InIn
0In
II
II
I
0

In0In
II
I’—
oa
a0
0
In0
II
0In
In0
In0
a0
(\~jIn
~0
InH
,.—..
—
0
0
00
)1U
)
0CLi-iE0Li—0)
4-)CC0
a
•0
)InIn
~I
aa
1~(01-4‘-CC
)CD(0
’0
40
4C
DC
D~
-‘(0
~U
)C
)U)(0
C)
~z’(0
~C
D0
0U
)L
iU
)(0‘H
4-4‘0
(0U
)‘4-40
0L
i(00
04‘H
(0L
i‘H
C.)‘--4
04
04
U)
o~‘H
(0uW
‘HLi
C~
)~X
C04
C-’
:::~c—
’
I—0H
-m
0
4.’

(0
/I—
—1/
-4”-
/A
0
1~
0
I/I
0’~~’
0
0
0
10 9 3 7 6 5 4 3 2 1 0Kilometers From Source
FIGIJRE 9. Ratio of averaged SWL concentration in core versusdistance from source.. See text.
I
P
0(~)
0~I
I’
10

XCC-’
‘—41~(01~
InC)
‘--4
CD
U)
L.C
)0
CD
(0(0
U)
‘HCo
Li~
004
(0U)
CD
0•
Li
(0(0
C)4
-4‘H
CoL
iU
)1~0
40
~Li
XC0
00
In0
In0
In0
In—
II
II
0In
00
0C~J
In0
In
Lii