Public Workshop No.2: Evaluation of Conceptual … Capital and Operating Costs 28 Scenario CAPEX...
57
May 2013 Public Workshop No.2: Evaluation of Conceptual Alternatives CDOT Interregional Connectivity Study
Transcript of Public Workshop No.2: Evaluation of Conceptual … Capital and Operating Costs 28 Scenario CAPEX...

May 2013
Public Workshop No.2:Evaluation of Conceptual
Alternatives CDOT Interregional Connectivity Study

The Goals Of This Meeting Are To:
2
Provide an update on the ICS project Level 2 Evaluation
Hear your input on the final 5 scenarios – Endorse a final 2
to 3 scenarios
Hear your input on revenue and financing options
Better understand potential environmental and community
impacts and where they serve as discriminators

3
Where Are We In The Process?

4
A Refresher from Level 1

ICS Study Sponsors & Purposes
Sponsors:
� CDOT with funding from the Federal Railroad Administration
Purposes:
� Provide cost-effective recommendations for alignments, technologies and station locations in the Denver Metro Area that maximize ridership between high speed rail & RTD.
� Suggest method for integrating HSIPR into the statewide multi-modal network.
� Develop the basis for next steps.
5

ICS – Front Range
• Fort Collins
• Denver
• Colorado Springs
• Pueblo
AGS – Mountains
• Eagle County Airport
ICS Study Area
6

7
Logic
Determine the
best Segments
going North
and South
Study Segments
through and
around Denver

Four Basic E-W Segments And One N-S Segment Remained Going Into Level 2
8

Two Segments Remained To Fort Collins
9

10
One Segment Remained to Colorado Springs & Pueblo

What Was Promised At The Conclusion Of Level 1 Evaluation?
Assessment of an alternative to the Black Forest alignment
Add an alignment along the I-76 through Denver to DIA
Revise the C1 Shared Track with RTD scenario to allow travel to the
south
Prepare better information on costs, benefits and impacts of the final 5
scenarios
Perform an initial Benefit/Cost Assessment
11

12
Level 2 Evaluation-What is it-Methodologies-Results-Next Steps

Level 2 Evaluation Goals
• Maintain public support
• Select alignments north and south outside the Denver metro
• Define the best E-W alignments through the Denver metro
• Define the best alignment around the Denver metro area
• Identify general station locations
13

Level 2 Evaluation Criteria
14
Public Benefits
Engineering and
Institutional Feasibility
Transportation BenefitsBenefit/Cost
Environmental
Impacts

15
Methodologies-Ridership-Capital Costs-Operating Costs

Ridership Methodology
Open, non-proprietary forecasting models
Use of DRCOG and other MPO models and data to represent
� Connectivity with RTD
� Socio-economic and transportation characteristics of urban areas
New local data collected to
� Purchase of “cell phone” data
� Conduct a “stated preference survey”
Information exchange and documentation
� Interactions with MPOs, stakeholders and modelers
� Memos/reports on model development and application to come
16

Internet-based SP survey conducted in December 2012
� Data from local residents
� About 1000 completed surveys
Survey respondents recruited using market research firm
Stated preference alternatives
� Current auto travel option
� Auto travel with tolled facility
� AGS/Train travel
17
Stated Preference (SP) Survey
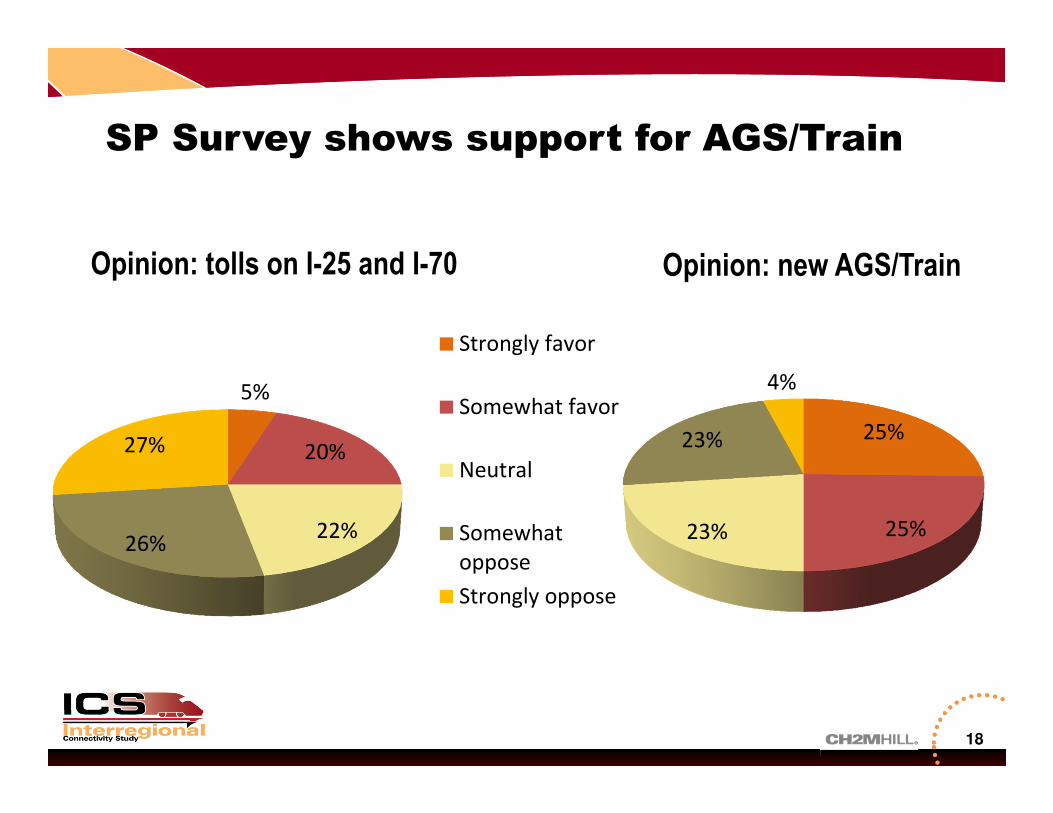
SP Survey shows support for AGS/Train
Opinion: new AGS/Train
25%
25%23%
23%
4%
Opinion: tolls on I-25 and I-70
5%
20%
22%26%
27%
Strongly favor
Somewhat favor
Neutral
Somewhat
oppose
Strongly oppose
18

CAPEX Methodology
• CAPEX Methodology Manual was developed at Level 1
• Standard Cross Sections were developed for
– Track at grade– Track on retained fill– Track on structure– Track in Tunnel
• Unit Prices were developed for each standard cross section
• Unit price is multiplied by the length of a standard cross section within a given segment
19

Example of Quantity Measurement
20
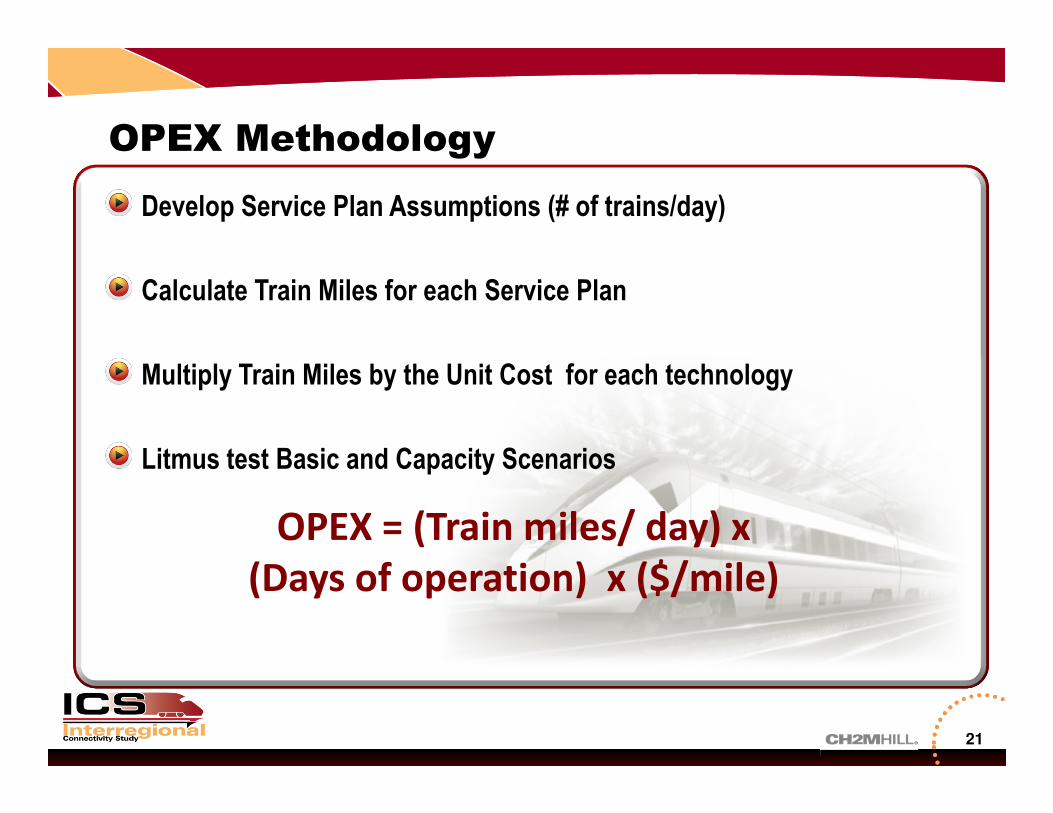
OPEX Methodology
Develop Service Plan Assumptions (# of trains/day)
Calculate Train Miles for each Service Plan
Multiply Train Miles by the Unit Cost for each technology
Litmus test Basic and Capacity Scenarios
21
OPEX = (Train miles/ day) x
(Days of operation) x ($/mile)

18 Hour Operation Per Day for each Scenario
In Each Scenario, Two Options:
� Basic Frequency Service Plan
• 12 hours @ 1 hr frequency + 6 hrs @ 30 min frequency
= 24 trains/day
� Capacity-Based Frequency Service Plan
• 12 hours @ 1 hr frequency + 6 hrs @ 15 min frequency
= 36 trains/day (4,900 peak hour passengers)
Two Operating Scenarios Were Considered
22

Environmental Impact Methodology
Important environmental resources were identified from available
mapping
Engineering alignments were developed and compared to mapped
resources – high level
Typical construction footprints were developed for
� Track
� Stations and support facilities
� Acres of disturbance calculated
Four PLT meetings were held to discuss issues
23

24
Level 2 Results

Five Scenarios Remained In Level 2
25
C-1: Shared RTD
Track
A-1 and A-5: Through Denver
Options A (I-76) or B (US 6)
B-2A and B-5: Around Denver

26
Performance by Scenario

Distribution of Ridership by Scenario
27
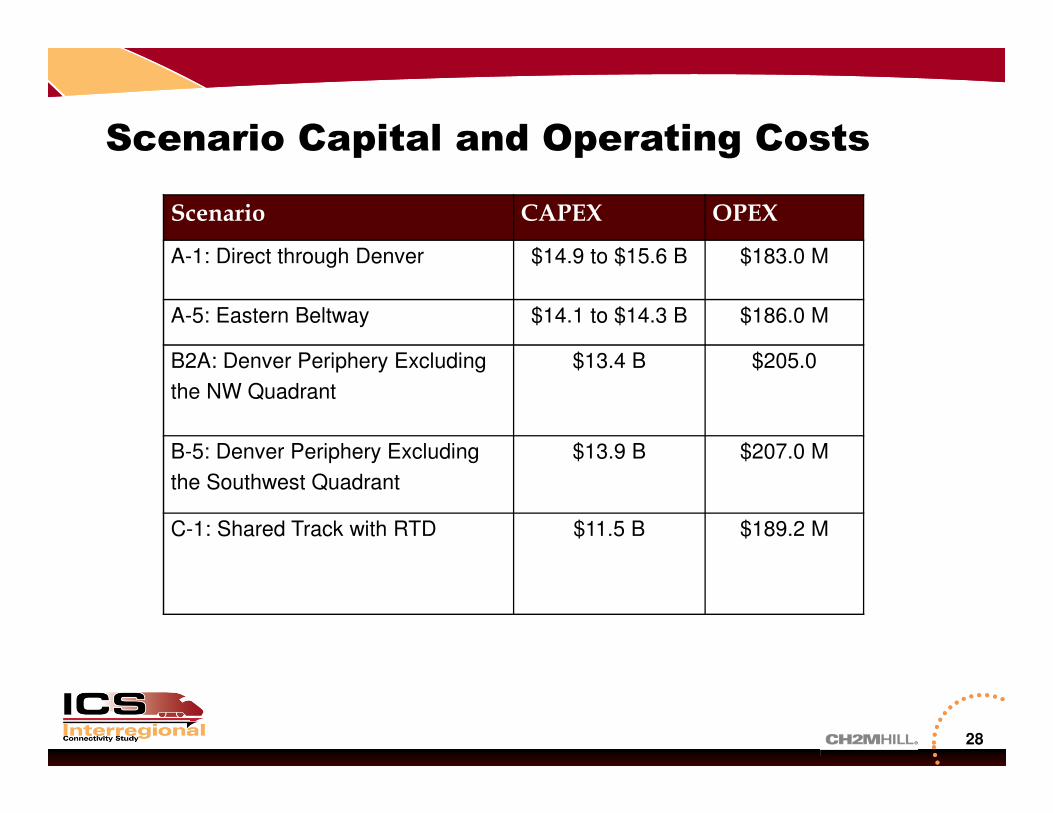
Scenario Capital and Operating Costs
28
Scenario CAPEX OPEX
A-1: Direct through Denver $14.9 to $15.6 B $183.0 M
A-5: Eastern Beltway $14.1 to $14.3 B $186.0 M
B2A: Denver Periphery Excluding
the NW Quadrant
$13.4 B $205.0
B-5: Denver Periphery Excluding
the Southwest Quadrant
$13.9 B $207.0 M
C-1: Shared Track with RTD $11.5 B $189.2 M

How Environmental Impacts Affect Results
North to Fort Collins
� Impacts of N1 (EIS) are too great on Longmont, Loveland and Fort Collins
� The impacts of N2 (I-25) are minimal due to its location in the I-25 median
Through the Denver Area
� Segments through Denver have high impacts and are likely not implementable
� Beltway segments around Denver have fewer issues and could be implemented
South to Colorado Springs/Pueblo
� Since there is only one basic alignment the emphasis will be to mitigate anticipated impacts
� Impact challenges are anticipated through Castle Rock and Colorado Springs, as well as streams and floodplains between Castle Rock and Monument
29
30
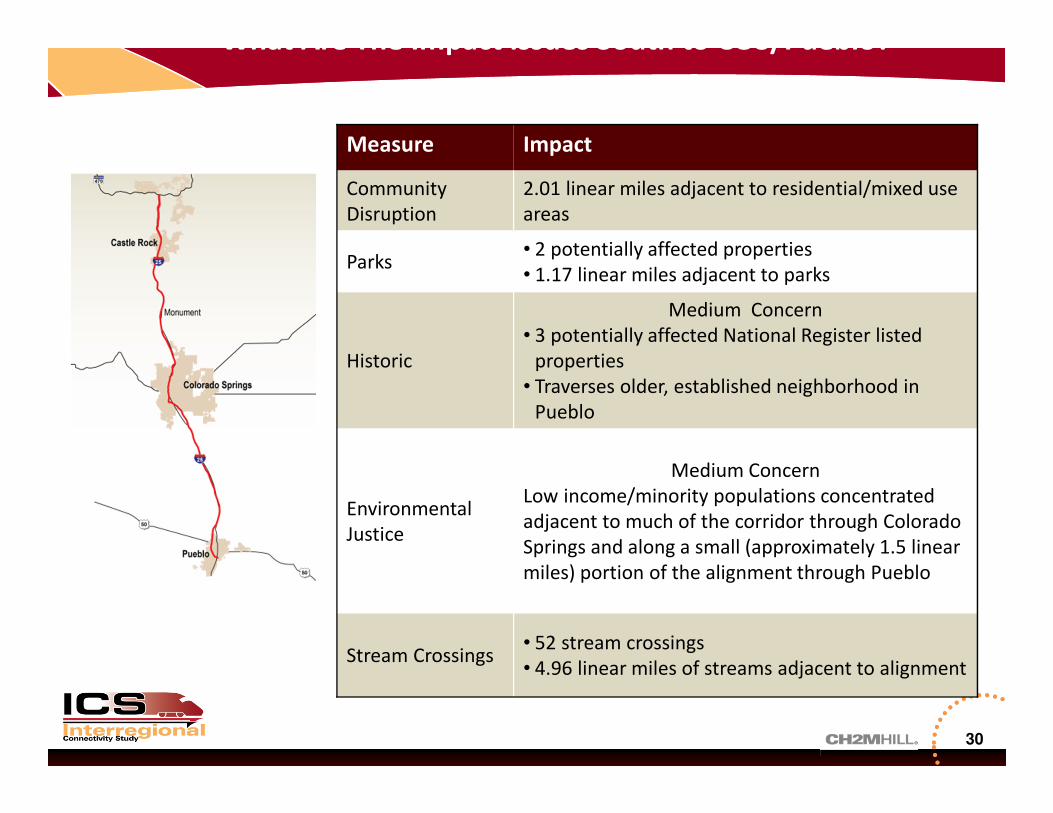
What Are The Impact Issues South to COS/Pueblo?
Measure Impact
Community
Disruption
2.01 linear miles adjacent to residential/mixed use
areas
Parks• 2 potentially affected properties
• 1.17 linear miles adjacent to parks
Historic
Medium Concern
• 3 potentially affected National Register listed
properties
• Traverses older, established neighborhood in
Pueblo
Environmental
Justice
Medium Concern
Low income/minority populations concentrated
adjacent to much of the corridor through Colorado
Springs and along a small (approximately 1.5 linear
miles) portion of the alignment through Pueblo
Stream Crossings• 52 stream crossings
• 4.96 linear miles of streams adjacent to alignment

31
Benefit Cost Ratio

What Are the Components of the BCA?
1. Ticket Revenue
2. Reductions in VMT
3. Reductions in travel delay
4. Fatalities avoided
5. Air Quality
6. Temporary and permanent employment
7. Influx of federal grant money
8. Multiplier effects
1. Capital Cost
2. Interest on bonds
3. Operation and Maintenance Costs
32
Benefits Costs

Early B/C Conclusions
Operating ratio and B/C is positive for the ICS system
� Does not include Mountain Corridor yet
B/C is driven by:
� Impact of the interest rate assumed
� Fare box revenue
� Construction employment
� Operations employment
� Effects of and influx of federal funding
33

Preliminary B/C Calculations
34
B/C Element A-1a A1b A-5a A-5b C-1 B-2A B-5
Total Benefits $48.2 B $47.7 B $44.8 B $45.4 B $37.3 B $43.8 B $44.8 B
Total Costs $24.5 B $23.5 B $22.4 B $22.7 B $18.9 B $22.5 B $22.5 B
B/C Ratio 1.97 2.03 2.00 2.00 1.97 2.01 1.99
Operating Ratio 1.32 1.45 1.32 1.35 1.05 1.21 1.19

35
Revenues and Financing Options

Why Is This Important?
All scenarios will require a significant local funding contribution
� Perhaps $80-$100 million/year for an initial phase (MOS)
The higher level of local funding the better the chance to:
� Receive a federal grant
� Attract private funding
The public will need to support some form of revenue increase
Without public support the HSIPR project will not be implemented
36

Transportation Is A Small Part Of The State Budget (Fiscal Year 2010-2011)
$25 billion budget
22 departments
Largest departments: Health Care & Education
Transportation is about 5% of overall state budget at $1.3 billion
37
Health Care
20%
Education
18%Higher
Education
17%
Human
Services
10%
Labor
10%
Transportation
5%

Where Does the Money Come From For HSIPR Projects?
Currently used for
transportation
– Motor Fuel Taxes
– Vehicle Registration Fees
Other General Government
– Sales Taxes
– Income Taxes
– Property Taxes
– Profits from Lottery Sales
Other sources
– Farebox Revenues
– Value Capture Mechanisms
(Fees)
– Vehicle Miles Travelled (VMT)
Fees
– Utility Fees
– Lodging (or other Visitor Fees)
38

Increase / ChangeRevenues
Generated (2035
Pop in M$)
TBD
$.25 per gallon $447 $715
$.01 per mile $393 $629
$100 per vehicle $391 $626
$15 per month per
household $294 $470
1% $572 $915
4 mills $200 $320
1% $1,044 $1,670
1% of current statewide
lodging spending $27 $43
Reallocation of 10% of
lottery program profits $11 $18
$10,000 per residential
unit and 1% fee on the
value of commercial
development $169 $270
Total $3,548 $5,676
Value Capture Mechanisms
Development Fee
Increased State Sales Tax
Increased State Property Tax
Increased State Income Tax
Lodging Tax
Change in Lottery Tax Allocation
Motor Fuel Purchase Tax Increase
VMT Fees
Increase in Vehicle Registration Fees
Utility Fees
General Revenues
Sources
Revenues
Generated
(2011$M)
User Fees
Farebox Revenues TBD
Implementing All Revenue Options, Could Generate $5.6 Billion in 2035
39

Tonight: What are your thoughts……..
What is your opinion on the 5 scenarios?
What weighs heaviest – higher ridership or fewer
environmental/community impacts?
Do you have thoughts on other revenue sources?
Other comments or concerns
40

Next Steps For Level 3 Evaluation
Planning Studies
� Better define and mitigate high impacts
� Refine the service plan to optimize service and improve cost-effectiveness
� Refine the OPEX estimate with specific technology based unit costs.
Engineering Studies
� Make recommendations for a preferred technology
� Value engineer the remaining scenarios to improve cost-effectiveness
� Better define ROW requirements
� Revise CAPEX to account for engineering refinements
� Prepare a phasing strategy
Third Round of Public Open Houses – early Fall
41

42
CDOT Advanced Guideway System
(AGS) Feasibility StudyUpdate

43
Location of AGS (six stations)

To find a feasible and implementable high speed transit system
to ultimately link Denver International Airport and Eagle County
Regional Airport, following the I-70 alignment
This system will serve the recreational, business and commuter
needs of the corridor
This system will also reduce the amount of truck traffic on the
corridor
AGS Project Goal
44

Study Progress to Date:
Feasible Technologies Identified
Alignment Alternatives Developed
Preliminary Ridership Estimates Completed
On-Going Cost Estimating (Capital & O&M)
Assessing Financial Feasibility
Planned Completion in Early Fall 2013
45

46
Extra Slides
What is the Level 2 Evaluation
The Level 2 Evaluation builds from the technical analysis and public
input received during the Level 1 Evaluation
More quantitative assessment of the ridership, cost and environmental
consequences of each of the five surviving scenarios
Benefits are compared to the full cost of each scenario
The intent will be to reduce the number of scenarios to two or three for
more detailed study at Level 3.
47

Scenario A-1
Direct service to Denver from north and south of metro area
Does not serve DIA directly from north or south; requires transfer at DUS
Competes with RTD’s lower fares from DUS to DIA
High community impacts and ROW costs, particularly for US 6 and railroad alignments through Denver
48
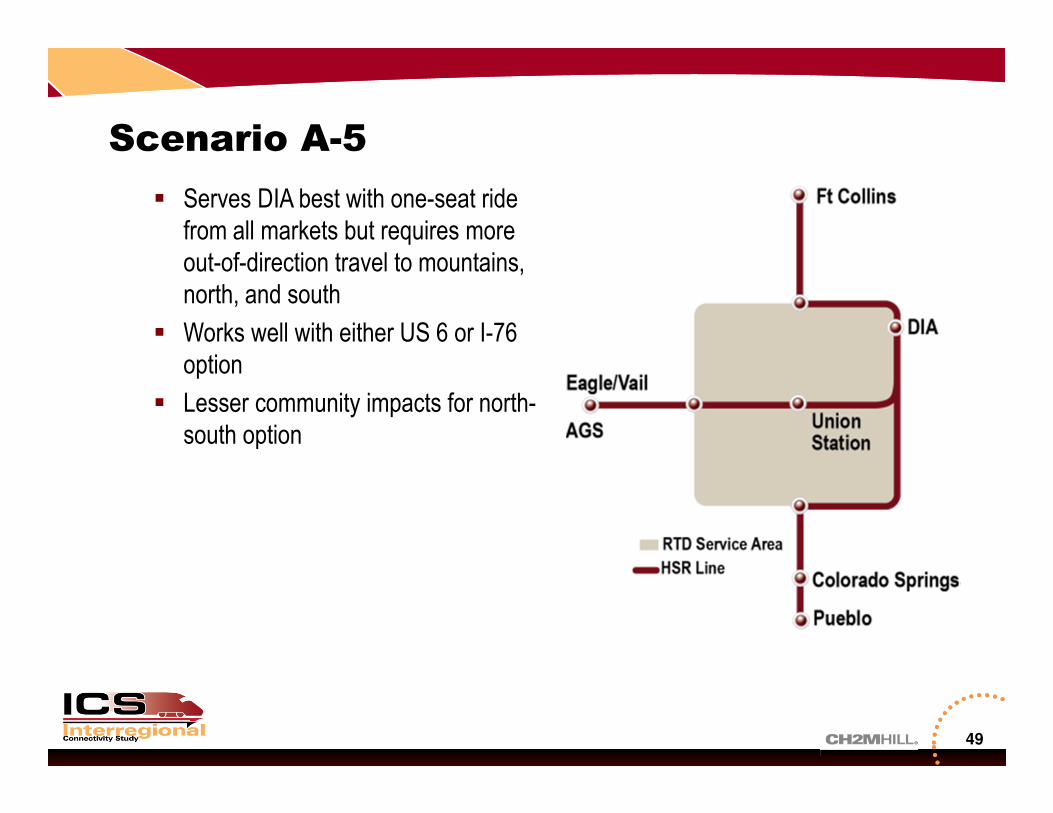
Scenario A-5
� Serves DIA best with one-seat ride from all markets but requires more out-of-direction travel to mountains, north, and south
� Works well with either US 6 or I-76 option
� Lesser community impacts for north-south option
49

Scenario B-2A
50
� Very strong ridership
� No direct access to DUS; relies on utilization of existing RTD system infrastructure
� Poor access to DIA from the mountains
� Good access from south to mountains and DIA
� Avoids community impacts through the Denver metro area

Scenario B-5
51
� Very strong ridership
� No direct access to DUS; relies on utilization of existing RTD system infrastructure
� Good access to DIA from all but the SW metro area
� Avoids community impacts through the Denver metro area
� Involves the unknowns of constructing through the NW Quadrant; possible conflicts with CDOT/Golden agreements for

C-1 Scenario
� Shared track with RTD lowers cost by about $3.3 B
� Avoids community impacts through the Denver Metro area
� Capitalizes on RTD FasTracks investment
� Could complicate RTD FasTracks operating plan but could also be revenue source for RTD
� Slower speeds through metro area result in 2.3 million fewer riders
52

Trip Type Breakdown by Scenario
53
Scenario Intercity Intra-Urban Connect Air
A-1a (I-76) 84% 12% 4%
A-1b (US 6) 84% 12% 4%
A-5a (I-76) 75% 20% 5%
A-5b (US 6) 76% 19% 5%
B2a 77% 19% 4%
B5 75% 21% 4%
C-1 78% 16% 6%

Comparison of Community/Environmental Impacts East – West Options through Denver
I-76
through
Denver
US 6
through
Denver
Beltway
north
around
Denver
Community
Disruption8.3 linear miles 11.32 linear miles 7.02 linear miles
Parks5 parks + RMA
0.56 linear miles
7 parks + RMA
1.07 linear miles
9 parks/open space
6.73 linear miles
Historic Medium High Low
Environmental
JusticeHigh High Low
Stream
Crossings13 12 13
54

Comparison of Community/Environmental Impacts North-South Options through Denver
55
Railroad/
Santa Fe
Corridor
Beltway
east
around
Denver
Beltway
west
around
Denver
Community
Disruption18.31 5.05 9.98
Parks1 park
0.15 linear milesNone
12 parks
11.28 linear miles
Historic High Low Low
Environmental
JusticeHigh Low Low
Stream
Crossings23 11 20

Summary Comparison (cont)
ScenarioB-2 B-5
$13.4 Billion
$206 Million/yr
13.8 million/yr
$250 Million/yr
1.21
CAPEX
OPEX
Ridership
Revenue
Opex Ratio
$13.9 Billion
$207 Million/yr
13.7 million/yr
$247 Million/yr
1.19
CAPEX
OPEX
Ridership
Revenue
Opex Ratio

Summary Comparison of Scenarios
57
$15.2 Billion
$183 Million/yr
12.1 to 13.1 million/yr
$252 Million/yr
1.38
$57.86
$14.2 Billion
$186 Million/yr
12.9 to 13.1 million/yr
$248 Million/yr
1.33
$57.84
$11.5 Billion
$189 Million/yr
10.8 million/yr
$198 Million/yr
1.05
$61.54
CAPEX
OPEX
Ridership
Revenue
Opex Ratio
$/Rider (Capex)
A-1 A-5 C-1
A-1 A-5 C-1