Human Hearing How the ear works Notes from How Hearing Works by Tom Harris.
Public Works Budget Hearing – Session No. 2
August 20, 2014

Public Works Organizational Structure
Citizens of
South Bend
City Council Mayor
Public Works
Environmental Services
Water
Works
Solid
Waste
Streets & Sewers
Engineering Central Services
Office of Sustainability
City Clerk

Sewage Ops
Sewer Insurance
Sustainability
Traffic & Lighting
Project Releaf
Major Moves
Solid Waste
Water Works
Central Services
MVH
Engineering
Local Road & Street
Public Works
Funds
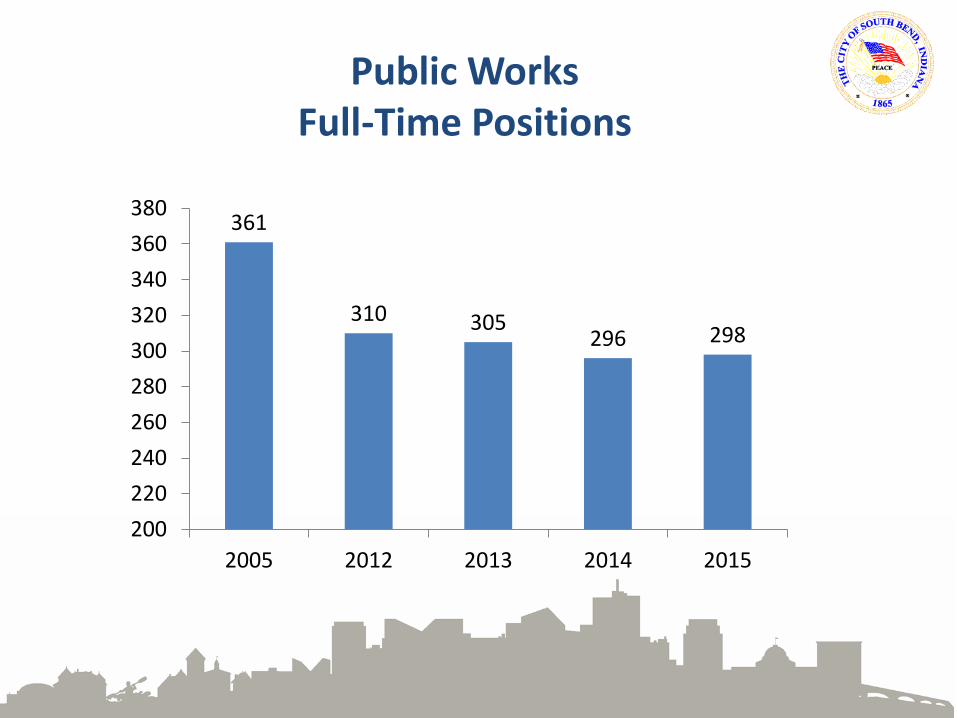
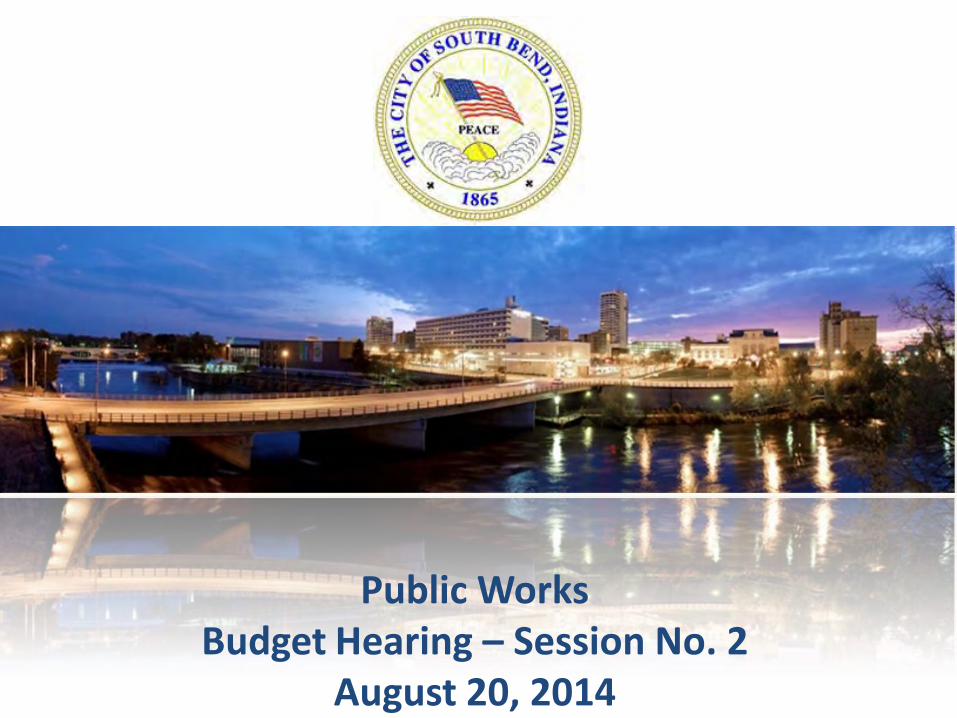
Public Works Full-Time Positions
361
310 305 296 298
200
220
240
260
280
300
320
340
360
380
2005 2012 2013 2014 2015

Staff Additions & Changes
Division Position
Engineering Engineer I
Solid Waste Secretary V
Division 2014 Position 2015 Position
Wastewater Director Utility Director
Water Director Assistant Utility Director
Water Quality Assurance Tech
Water Quality Specialist
Solid Waste Job Leader Superintendent II
Code(NEAT) Job Leader Superintendent II
Additions Changes

Public Works Full-Time Positions
25
96
44
6
69
2 40
16
by Division
Solid Waste
Street/Sewers
Wastewater
Organic Resources
Water Works
Sustainability
Central Services
Engineering

Engineering Fund 101 – 0602

Engineering
2014 Infrastructure Projects
LTCP
Southwood
Kensington
SMART STREETS
Jefferson
Lafayette & Williams 2way Conversion
Lincolnway West
CITY FACILITIES
Fire Training Center
Century Center (Floors, Elevator,
Exterior)
ECONOMIC DEVELOPMENT
- Ignition Park
- Colfax & Hill
- Ivy Tower
V & A
Sidewalks
SR 23 Improvements
US 31 Improvements
2015 Infrastructure Projects
LTCP Projects
Prairie
Eastbank
SMART STREETS
Marion & Madison 2way Conversion
Bartlett Street
Western Avenue
CITY FACILITIES
Parking Garages
Century Center Improvements
ECONOMIC DEVELOPMENT
- Ignition Park
- Nello
- Ivy Tower
V & A
Safe Routes to School
Olive & Sample
Traffic Calming

Engineering Expense Budget
0
200,000
400,000
600,000
800,000
1,000,000
1,200,000
1,400,000
1,600,000
1,800,000
2012 2013 2014 2015(P)
Budget
2014-2015 15.4% Decrease

Engineering Expenses 2012-2015
Personnel Supplies Services Capital Total
2012 $1,103,197 $13,713 $558,929 $8,399 $1,684,238
2013 $611,362 $17,665 $671,060 $0 $1,300,087
2014 $610,675 $15,736 $499,891 $0 $1,126,302
2015 $710,552 $26,700 $215,780 $0 $953,032
$0
$200,000
$400,000
$600,000
$800,000
$1,000,000
$1,200,000
$1,400,000
$1,600,000
$1,800,000
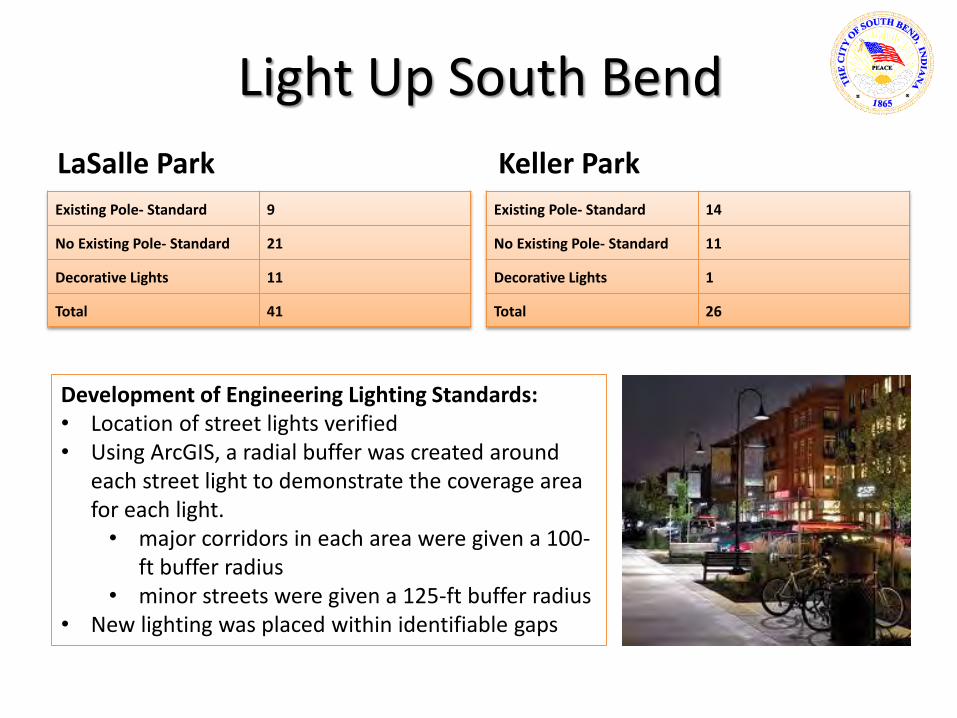
Light Up South Bend
LaSalle Park
Existing Pole- Standard 9
No Existing Pole- Standard 21
Decorative Lights 11
Total 41
Keller Park
Existing Pole- Standard 14
No Existing Pole- Standard 11
Decorative Lights 1
Total 26
Development of Engineering Lighting Standards: • Location of street lights verified • Using ArcGIS, a radial buffer was created around
each street light to demonstrate the coverage area for each light.
• major corridors in each area were given a 100-ft buffer radius
• minor streets were given a 125-ft buffer radius • New lighting was placed within identifiable gaps
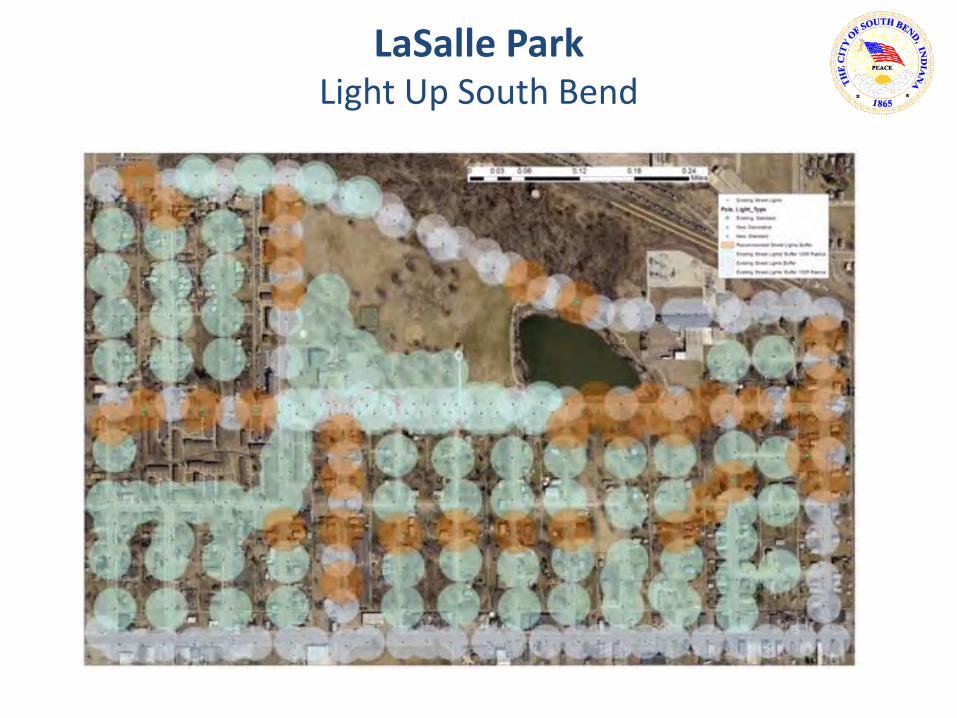
LaSalle Park Light Up South Bend

Keller Park Light Up South Bend

2014 LTCP Reassessment
• Opportunity for Significant Savings from Current LTCP
• Value Engineering
• Green Infrastructure
• Grey Infrastructure that is more sustainable
• Refine the current projects
• Analyze opportunities for Reopening the Consent Decree
• Renegotiate Level of Control

CSO Annual Overflow Volumes
1255
2111
1432
2054
1199
801 890
445
715
31
45
42
48
36.5
29.5
41.9
29.8
35.8
0
5
10
15
20
25
30
35
40
45
50
0
500
1000
1500
2000
2500
3000
2005 2006 2007 2008 2009 2010 2011 2012 2013
Inch
es
of
Rai
n
Ove
rflo
w M
illio
n G
allo
ns
Overflow Volume, MG
Rain, IN
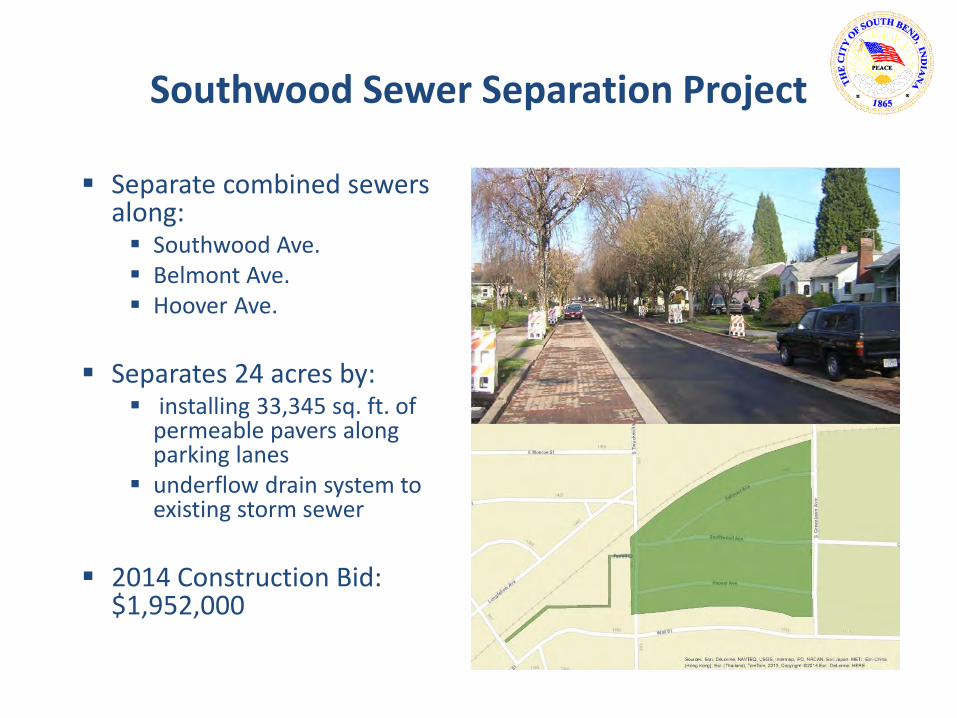
Southwood Sewer Separation Project
Separate combined sewers along: Southwood Ave. Belmont Ave. Hoover Ave.
Separates 24 acres by:
installing 33,345 sq. ft. of permeable pavers along parking lanes
underflow drain system to existing storm sewer
2014 Construction Bid:
$1,952,000

Kensington Basin CSO Sensory Control Valve Project
Install smart-valve to: Balance stormwater flow
between the dry basin and the CSS
Maximize storage
Maximize infiltration
Reduce overflows to the St. Joseph River
Better use of the existing infrastructure
2014 Construction Bid: $306,600

Major Moves Fund 412
Smart Streets Funding
• $1,330,000 – Main & Michigan
Signals/Striping
– St. Joseph/Western Roundabout
– St. Joseph Signals/Striping
– Michigan Street Extension
– LWW/MLK Roundabout

Smart Streets

Jefferson Streetscape
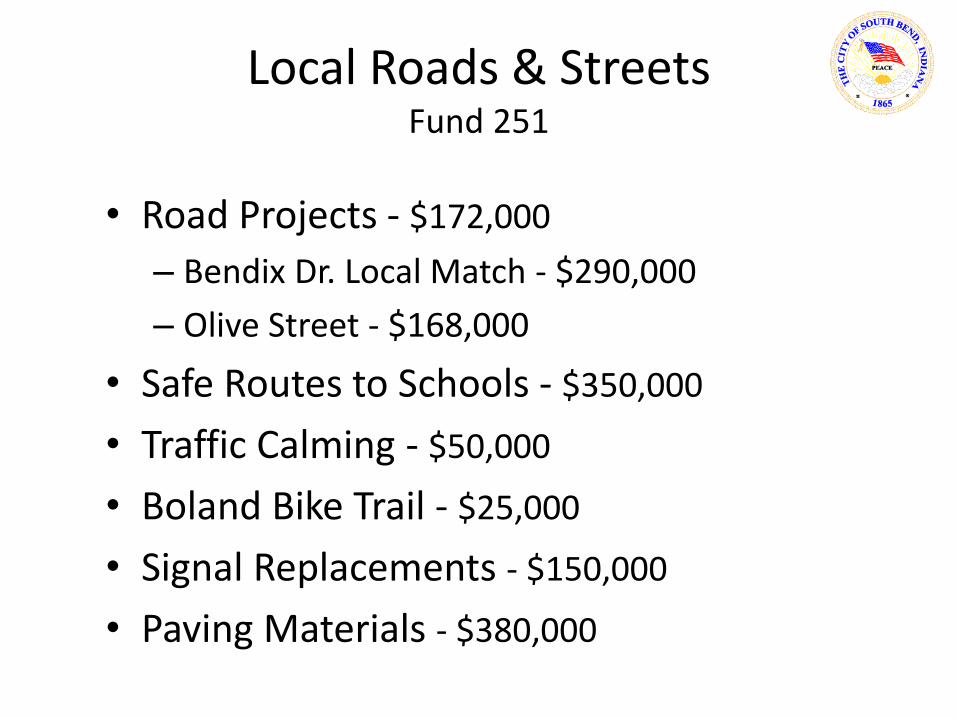
Local Roads & Streets Fund 251
• Road Projects - $172,000
– Bendix Dr. Local Match - $290,000
– Olive Street - $168,000
• Safe Routes to Schools - $350,000
• Traffic Calming - $50,000
• Boland Bike Trail - $25,000
• Signal Replacements - $150,000
• Paving Materials - $380,000

Traffic Calming
• $50,000 to calm traffic
• Local Classification Residential Roads
• Pilot Areas
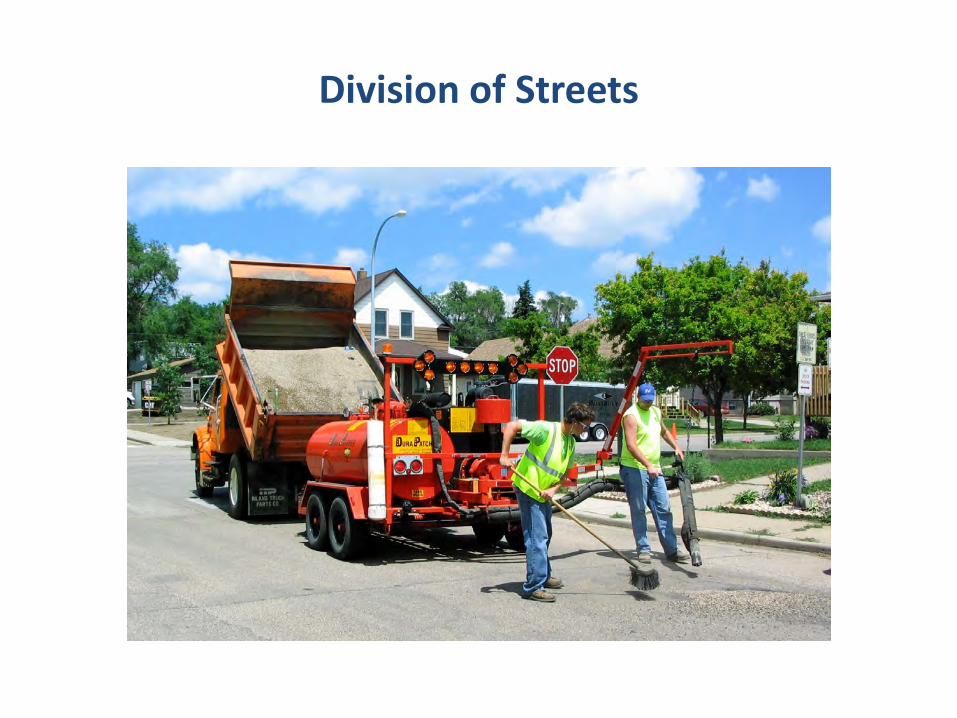
Division of Streets

0
2,000,000
4,000,000
6,000,000
8,000,000
10,000,000
12,000,000
2012 2013 2014 2015(P)
Revenue
Expense
MVH Revenue & Expense Budget Fund 202
2014-2015 10.8% Exp Decrease

MVH Expenses 2012-2015
Personnel Supplies Services Capital Total
2012 $2,854,384 $2,513,468 $1,243,346 $159,602 $6,770,800
2013 $3,461,071 $2,430,754 $1,742,320 $95,847 $7,729,992
2014 $4,124,220 $3,329,451 $2,376,956 $178,250 $10,008,877
2015 $4,314,548 $2,014,593 $2,502,159 $100,000 $8,931,300
$0
$2,000,000
$4,000,000
$6,000,000
$8,000,000
$10,000,000
$12,000,000

Streets
Maintenance and Operations
Fund 202 (MVH)
Streets
Traffic & Lighting
Fund 641 (Sewer
Operations)
Fund 642 (Sewer Capital)
Fund 640
(Sewer Insurance)
Fund 655 (Project ReLeaf)

Streets
Core Functions
Snow & Ice Removal
Pavement Maintenance
& Management
Sewer & Manhole
Inspection & Maintenance
Curb & Sidewalk
Improvement
Support Special Events
Traffic Signal, Signs, Street
Light Inspection & Maintenance

Streets
2014 Accomplishments
15 lane-miles of streets
paved
Supported over 170
special events
Experienced largest
snowfall in 35 years (8,700 Tons of Salt
used)
Serviced 100 residents with new
curb and/or sidewalk
Upgraded Nimtz
Parkway to 100% LED
streetlights
Rehabilitated 11,977 feet (2.25 miles)
of sewer
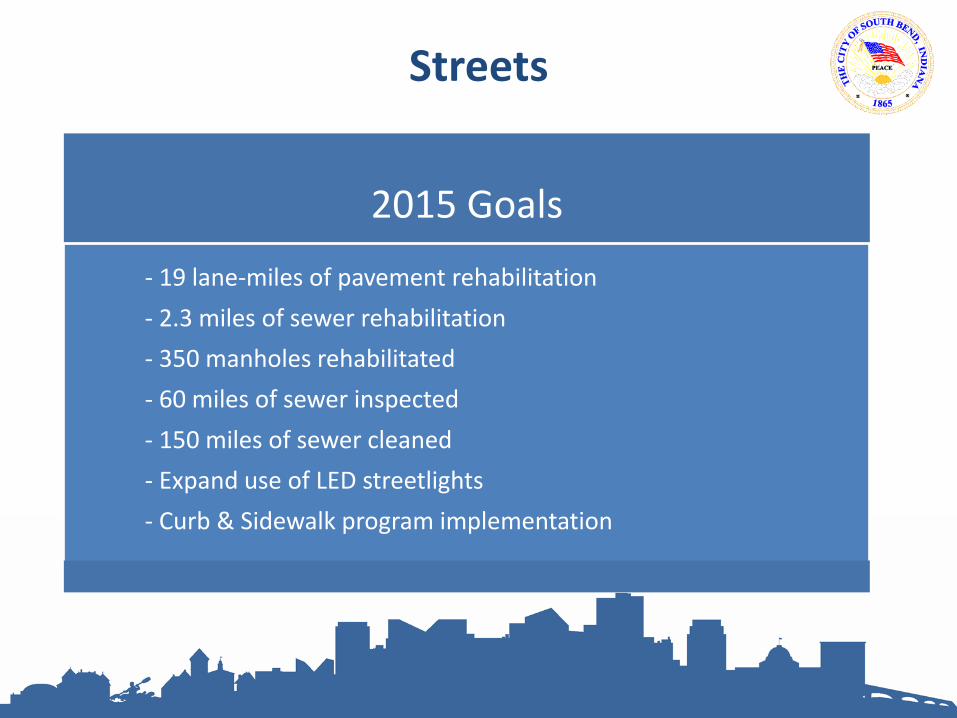
Streets
2015 Goals
- 19 lane-miles of pavement rehabilitation
- 2.3 miles of sewer rehabilitation
- 350 manholes rehabilitated
- 60 miles of sewer inspected
- 150 miles of sewer cleaned
- Expand use of LED streetlights
- Curb & Sidewalk program implementation
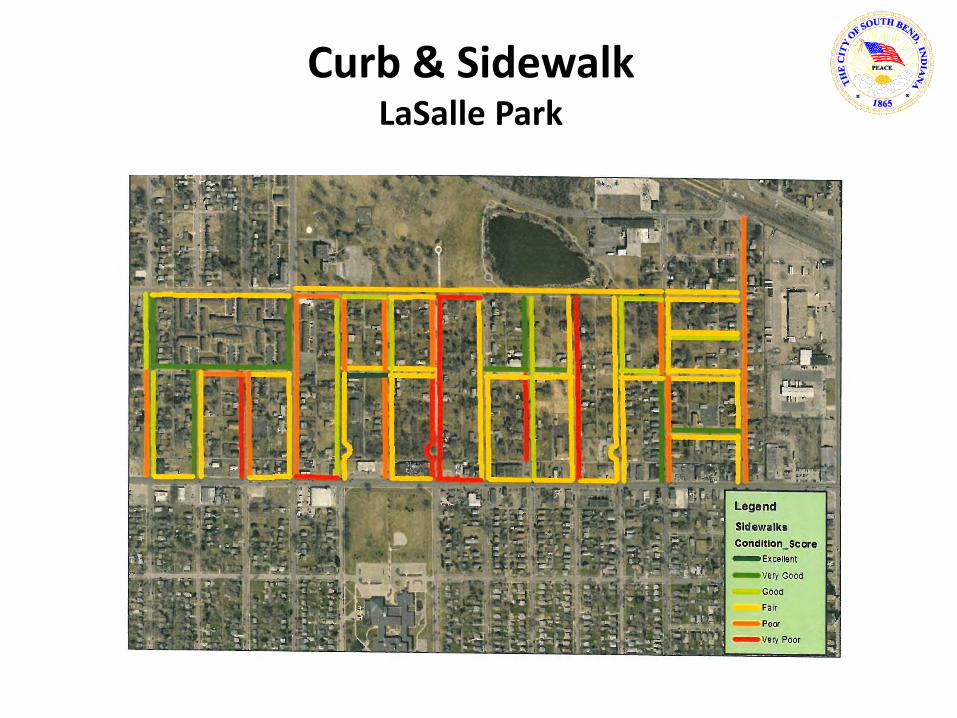
Curb & Sidewalk LaSalle Park

Curb & Sidewalk Keller Park
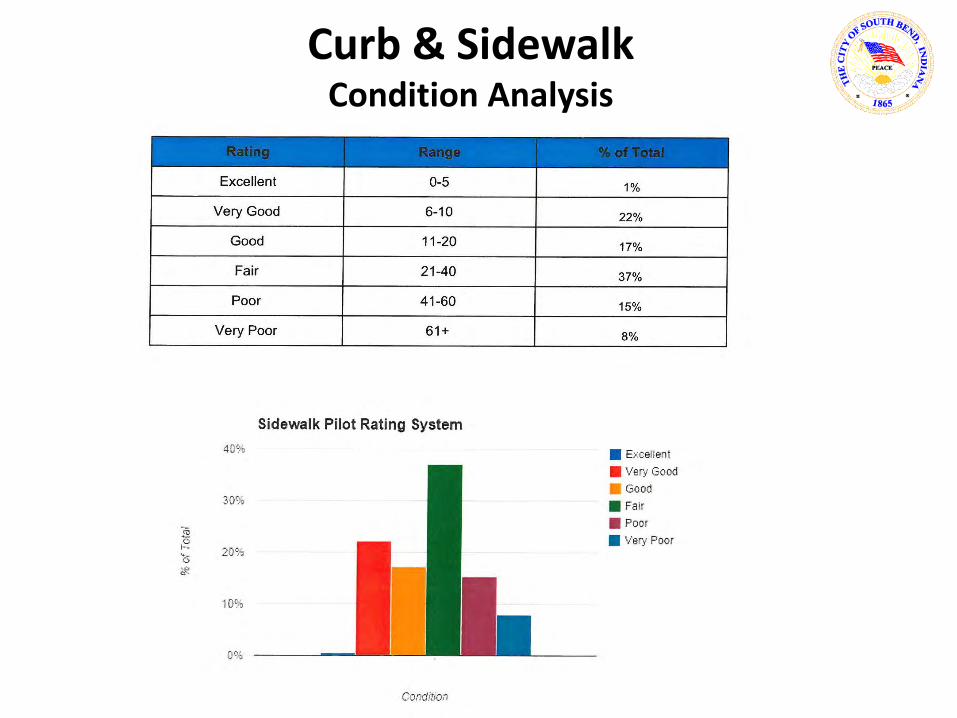
Curb & Sidewalk Condition Analysis

Curb & Sidewalk Program
750 Miles Citywide
~ 300,000 Feet in Very Poor Condition
~ 600,000 Feet in Poor Condition

Property owner paysfull cost
City shares cost withproperty owner
City pays full cost05
101520253035404550
How do cities pay for sidewalk repair?
Survey of 82 cities in 45 states Donald Shoup, “Fixing Broken Sidewalks” Access, Spring 2010

Curb &
Sidewalk
10% 6%
41% 22%
10%
11%
Sidewalks by District
123456
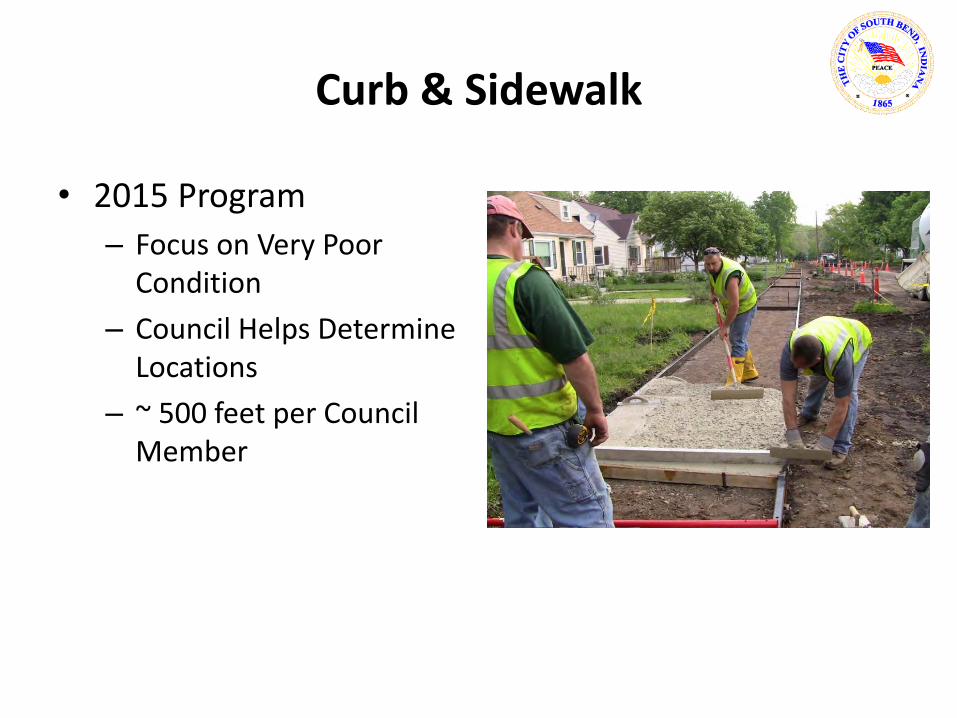
Curb & Sidewalk
• 2015 Program
– Focus on Very Poor Condition
– Council Helps Determine Locations
– ~ 500 feet per Council Member

Safe Routes to Schools
Coquillard Primary HSIP Funding
• 9,000 feet of Sidewalk
• $796,000
– 80/20 split

Safe Routes to Schools
Harrison Primary HSIP Funding
• 10,000 feet of Sidewalk
• $872,000
– 80/20 split
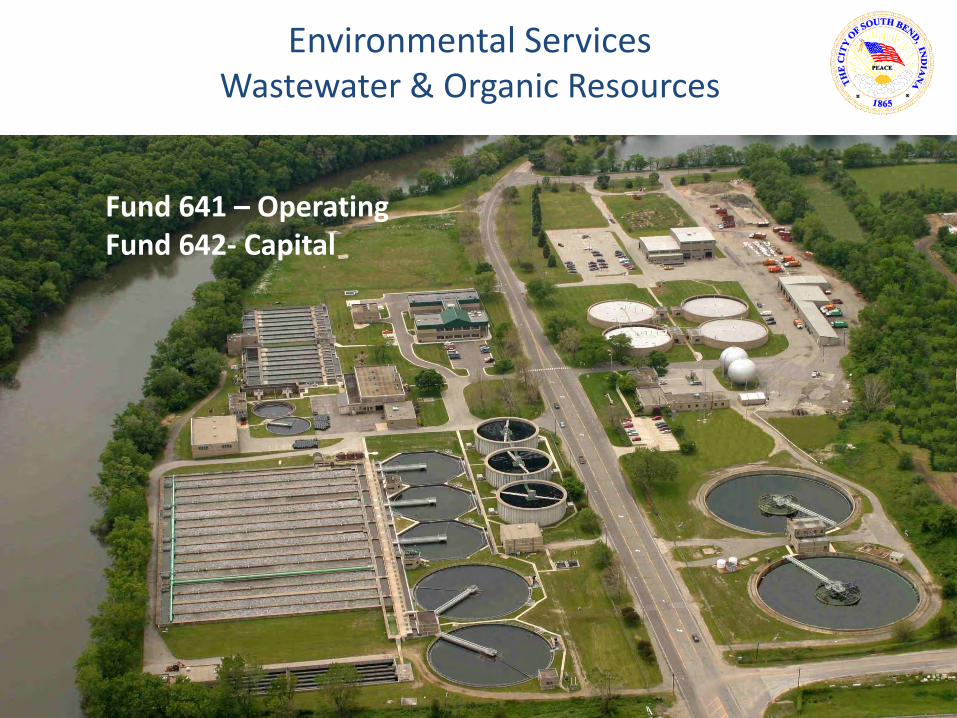
Environmental Services Wastewater & Organic Resources
Fund 641 – Operating Fund 642- Capital
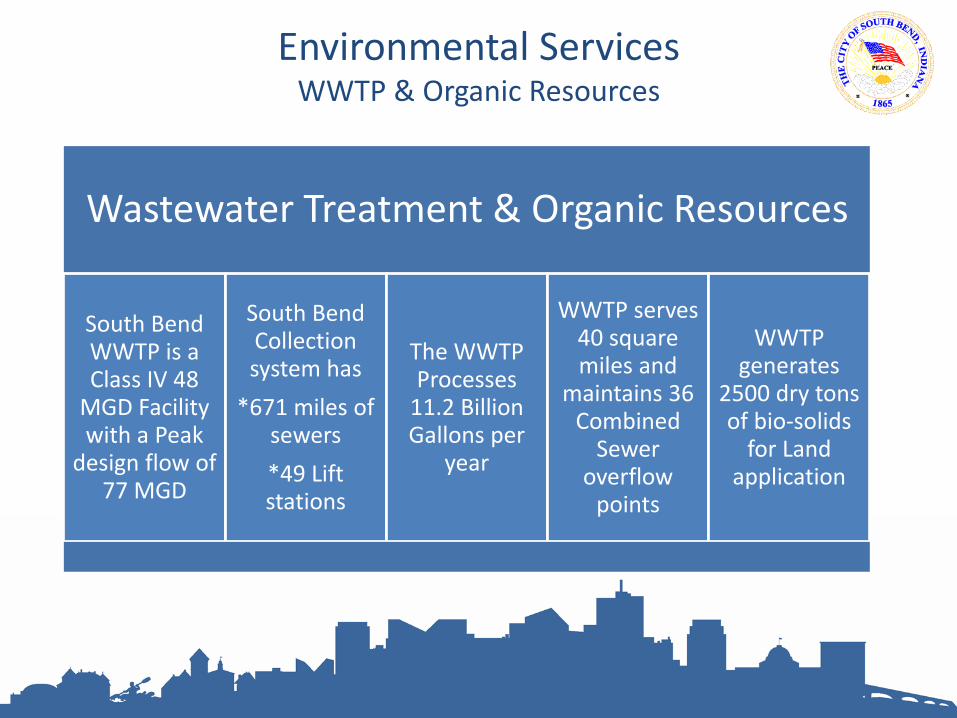
Environmental Services WWTP & Organic Resources
Wastewater Treatment & Organic Resources
South Bend WWTP is a Class IV 48
MGD Facility with a Peak
design flow of 77 MGD
South Bend Collection system has
*671 miles of sewers
*49 Lift stations
The WWTP Processes
11.2 Billion Gallons per
year
WWTP serves 40 square miles and
maintains 36 Combined
Sewer overflow
points
WWTP generates
2500 dry tons of bio-solids
for Land application
0
5,000,000
10,000,000
15,000,000
20,000,000
25,000,000
30,000,000
35,000,000
40,000,000
2011 2012 2013 2014 2015(P)
Revenue
Expense
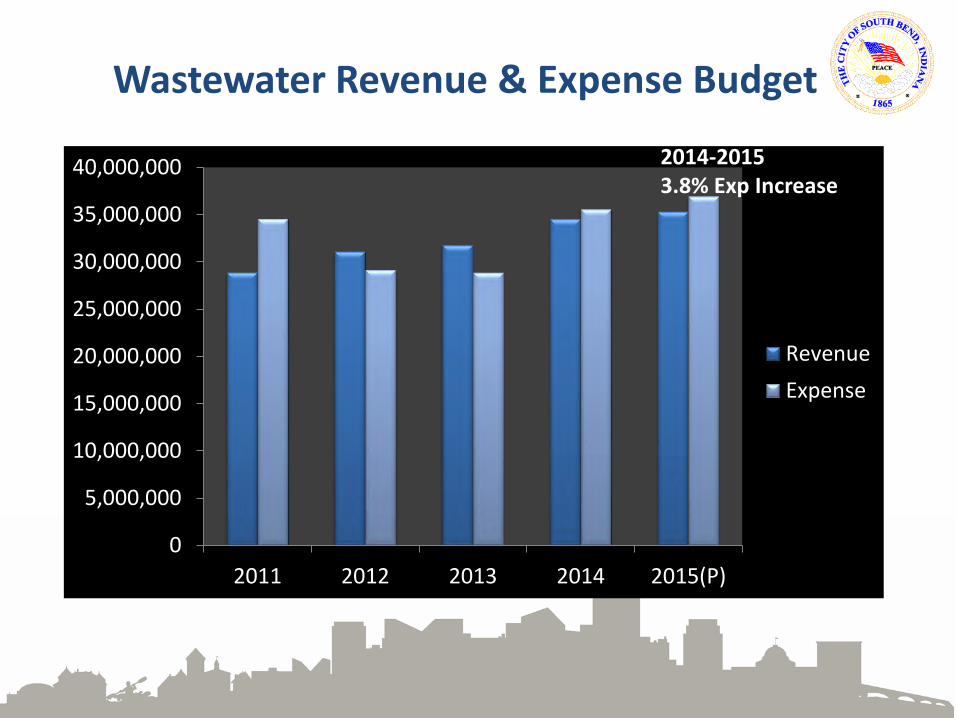
Wastewater Revenue & Expense Budget
2014-2015 3.8% Exp Increase
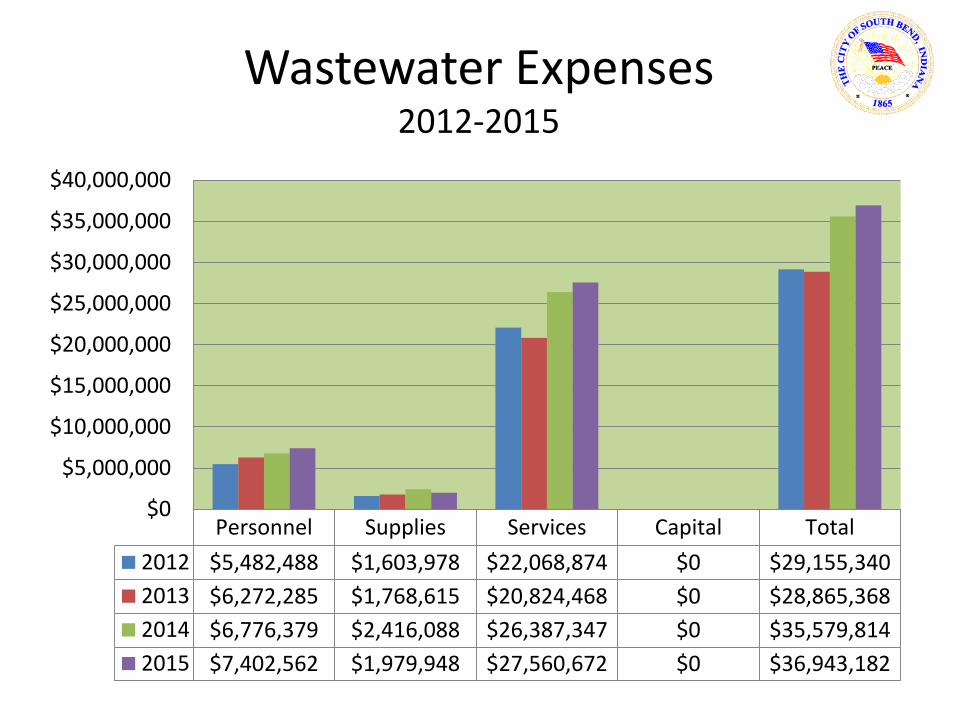
Wastewater Expenses 2012-2015
Personnel Supplies Services Capital Total
2012 $5,482,488 $1,603,978 $22,068,874 $0 $29,155,340
2013 $6,272,285 $1,768,615 $20,824,468 $0 $28,865,368
2014 $6,776,379 $2,416,088 $26,387,347 $0 $35,579,814
2015 $7,402,562 $1,979,948 $27,560,672 $0 $36,943,182
$0
$5,000,000
$10,000,000
$15,000,000
$20,000,000
$25,000,000
$30,000,000
$35,000,000
$40,000,000

Wastewater Capital Expense Budget Fund 642
0
1,000,000
2,000,000
3,000,000
4,000,000
5,000,000
6,000,000
2012 2013 2014 2015(P)
Budget 2014-2015 51% Increase
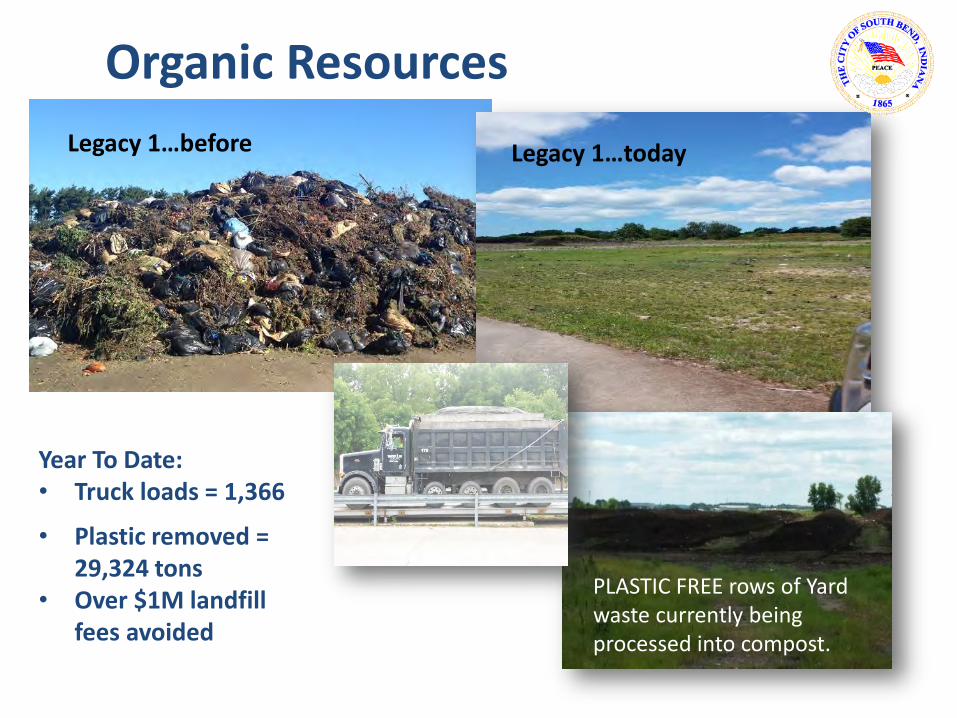
Legacy 1…before Legacy 1…today
PLASTIC FREE rows of Yard waste currently being processed into compost.
Organic Resources
Year To Date: • Truck loads = 1,366
• Plastic removed = 29,324 tons
• Over $1M landfill fees avoided
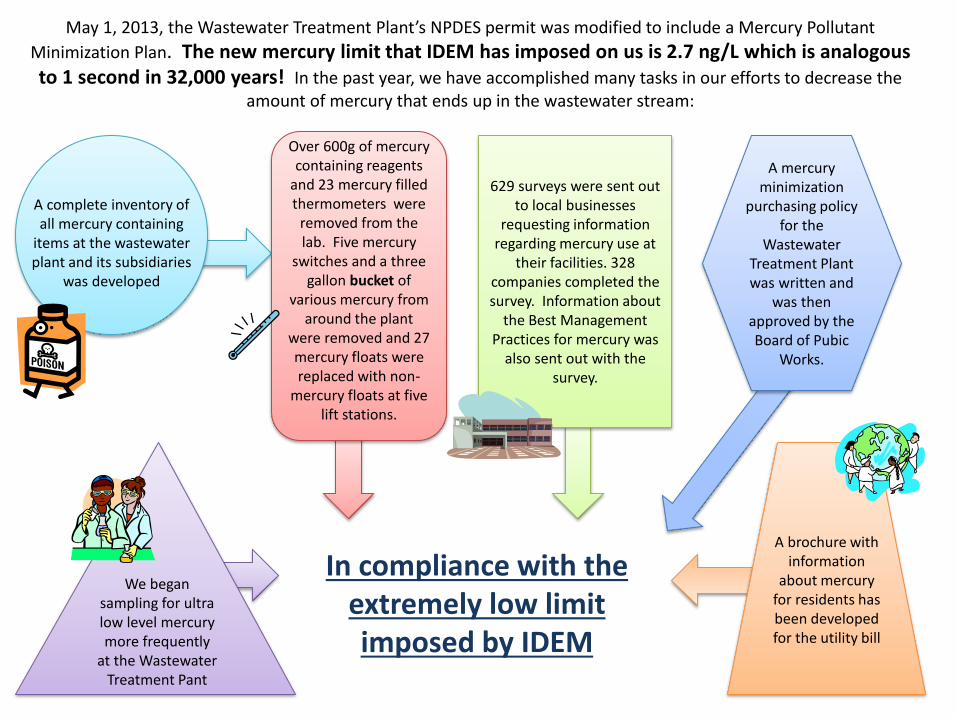
May 1, 2013, the Wastewater Treatment Plant’s NPDES permit was modified to include a Mercury Pollutant
Minimization Plan. The new mercury limit that IDEM has imposed on us is 2.7 ng/L which is analogous to 1 second in 32,000 years! In the past year, we have accomplished many tasks in our efforts to decrease the
amount of mercury that ends up in the wastewater stream:
In compliance with the extremely low limit imposed by IDEM
A mercury minimization
purchasing policy for the
Wastewater Treatment Plant was written and
was then approved by the Board of Pubic
Works.
A complete inventory of all mercury containing
items at the wastewater plant and its subsidiaries
was developed
Over 600g of mercury containing reagents
and 23 mercury filled thermometers were
removed from the lab. Five mercury
switches and a three gallon bucket of
various mercury from around the plant
were removed and 27 mercury floats were replaced with non-
mercury floats at five lift stations.
629 surveys were sent out to local businesses
requesting information regarding mercury use at
their facilities. 328 companies completed the survey. Information about
the Best Management Practices for mercury was
also sent out with the survey.
We began sampling for ultra low level mercury more frequently
at the Wastewater Treatment Pant
A brochure with information
about mercury for residents has been developed for the utility bill

LTCP – Digester No. 2 Upgrade

LTCP – Primary Clarifier Rehabilitation

Wastewater & Organic Resources Key Performance Indicators (KPI)
Measure 2013 Goal 2013
Actual 2014 est 2015
Target NPDES Permit effluent parameters with 100% compliance 100% 100% 100% 100%
CSO Dry Weather Overflows 0 2 1 0 Reduce backlog of plastic laden compost materials at OR NA NA 40% 100%
Overflows caused by : 1) City water main break 2) Sewer cleaning/lining company doing work next to a CSO 3) Opened a storm water pond gate to quickly

Solid Waste
Funds 610, 611

0
1,000,000
2,000,000
3,000,000
4,000,000
5,000,000
6,000,000
7,000,000
2011 2012 2013 2014 2015(P)
Revenue
Expense
Solid Waste Revenue & Expense Budget
2014-2015 4.7% Exp Increase
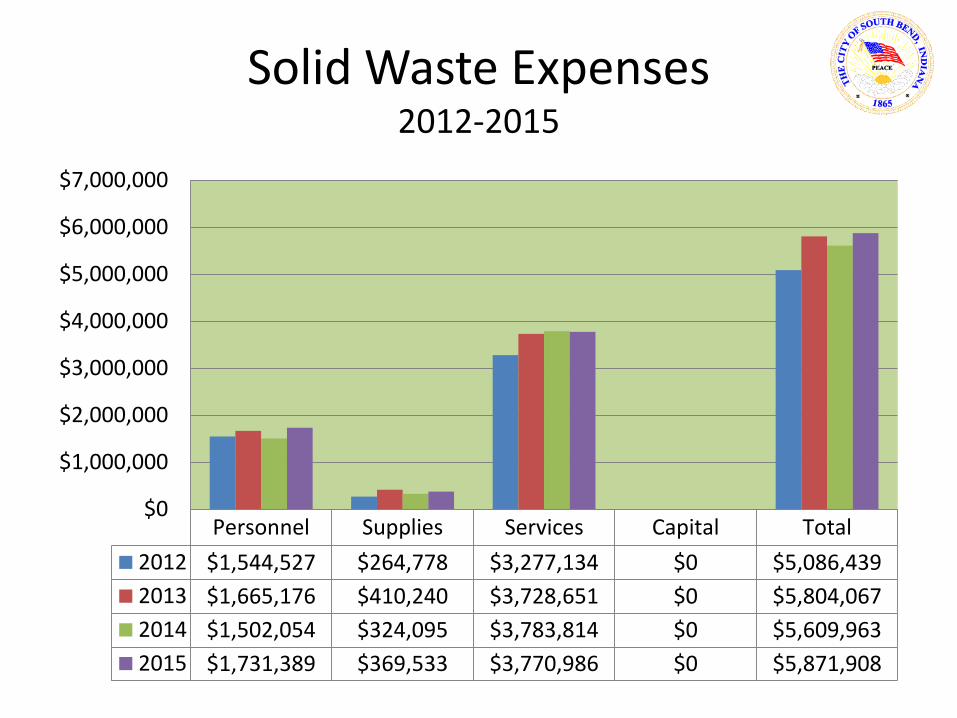
Solid Waste Expenses 2012-2015
Personnel Supplies Services Capital Total
2012 $1,544,527 $264,778 $3,277,134 $0 $5,086,439
2013 $1,665,176 $410,240 $3,728,651 $0 $5,804,067
2014 $1,502,054 $324,095 $3,783,814 $0 $5,609,963
2015 $1,731,389 $369,533 $3,770,986 $0 $5,871,908
$0
$1,000,000
$2,000,000
$3,000,000
$4,000,000
$5,000,000
$6,000,000
$7,000,000

Solid Waste Cash Balance
1,181,620 1,169,980
795,275
443,013
283,394
9,588 0
200,000
400,000
600,000
800,000
1,000,000
1,200,000
1,400,000
2011 2012 2013 2014 2015(Inc) 2015(NoInc)
Ending Cash Balance
Last Rate Increase 2009
With 9% Increase

Solid Waste
Trash, Yard Waste, Large Items
33,000 Customers
6,800 Tons
Yard Waste
27,000 Tons Trash
7,800 Large Items

Solid Waste
• CNG Fueling Station • Fleet Migration to CNG Fuel • Implementation of Elmos Real
Time Management Software • Implementation of Container
Management

Solid Waste Refuse Collection 33,000 Customers
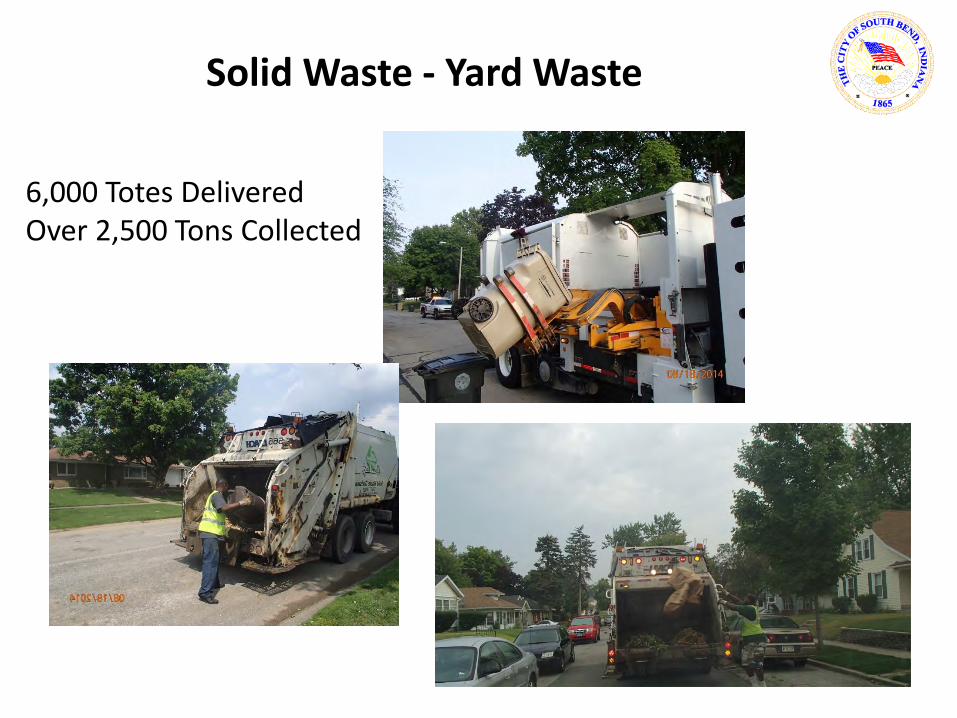
6,000 Totes Delivered Over 2,500 Tons Collected
Solid Waste - Yard Waste
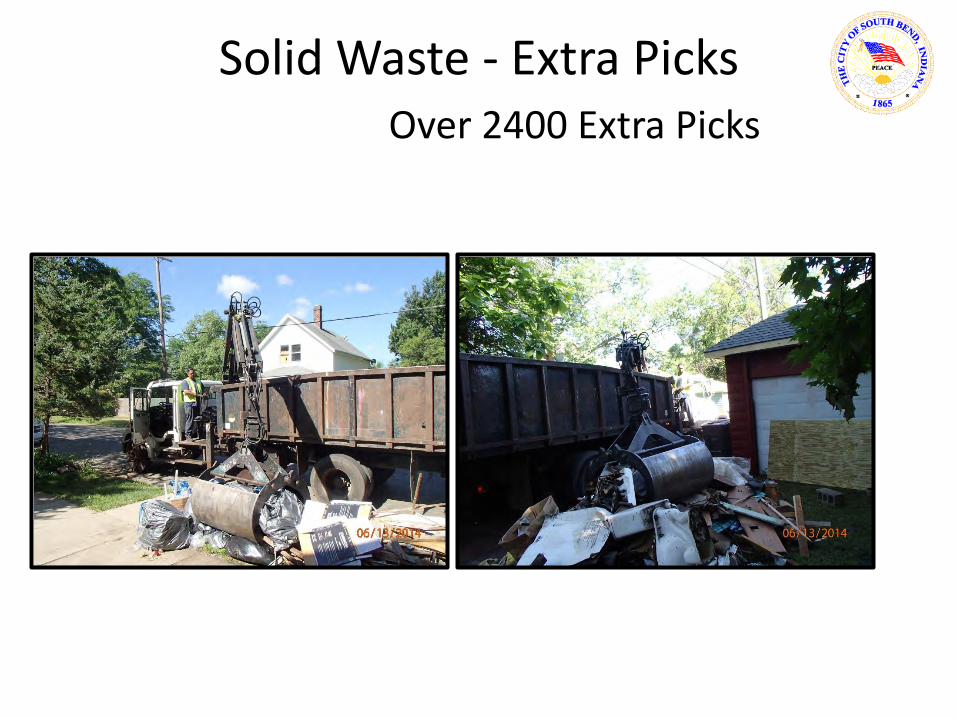
Solid Waste - Extra Picks Over 2400 Extra Picks
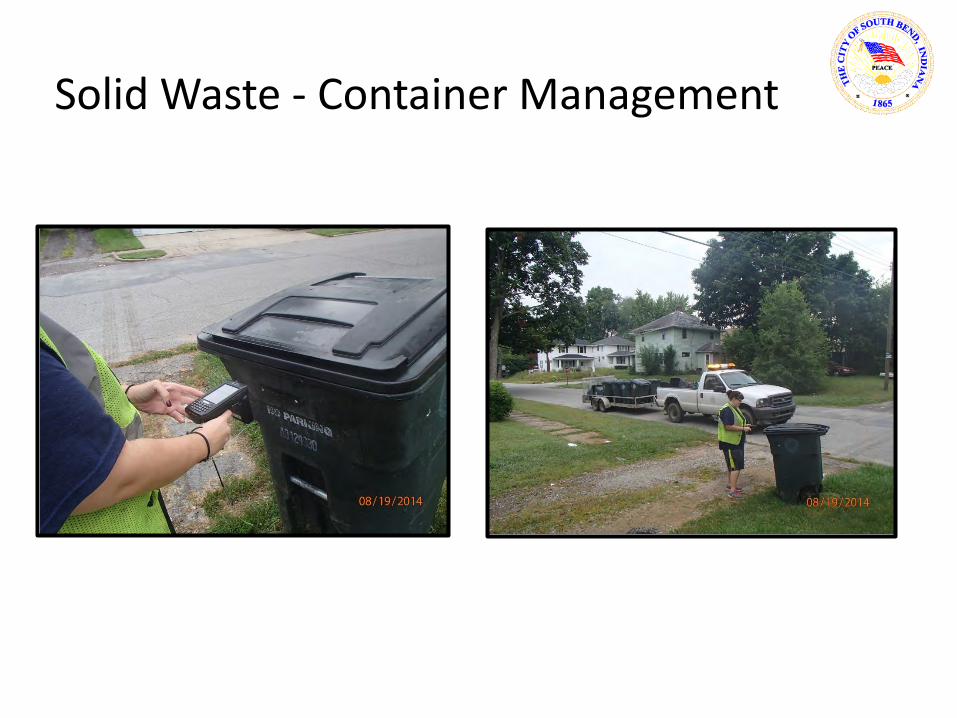
Solid Waste - Container Management

Fund 222
0
1,000,000
2,000,000
3,000,000
4,000,000
5,000,000
6,000,000
7,000,000
8,000,000
9,000,000
2012 2013 2014 2015
Revenue
Expense
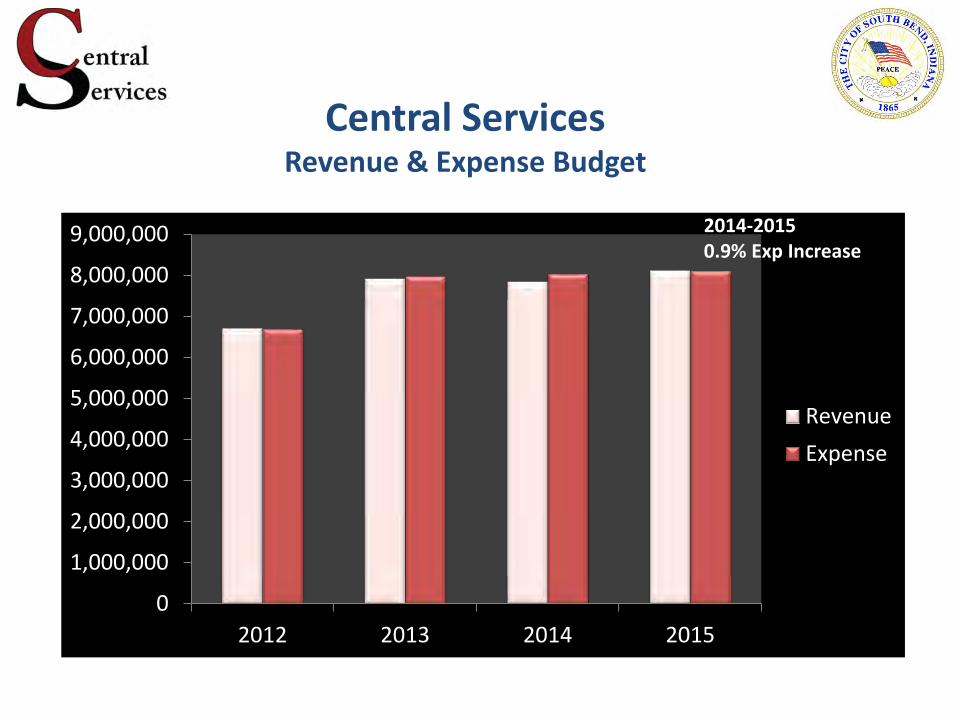
Central Services Revenue & Expense Budget
2014-2015 0.9% Exp Increase
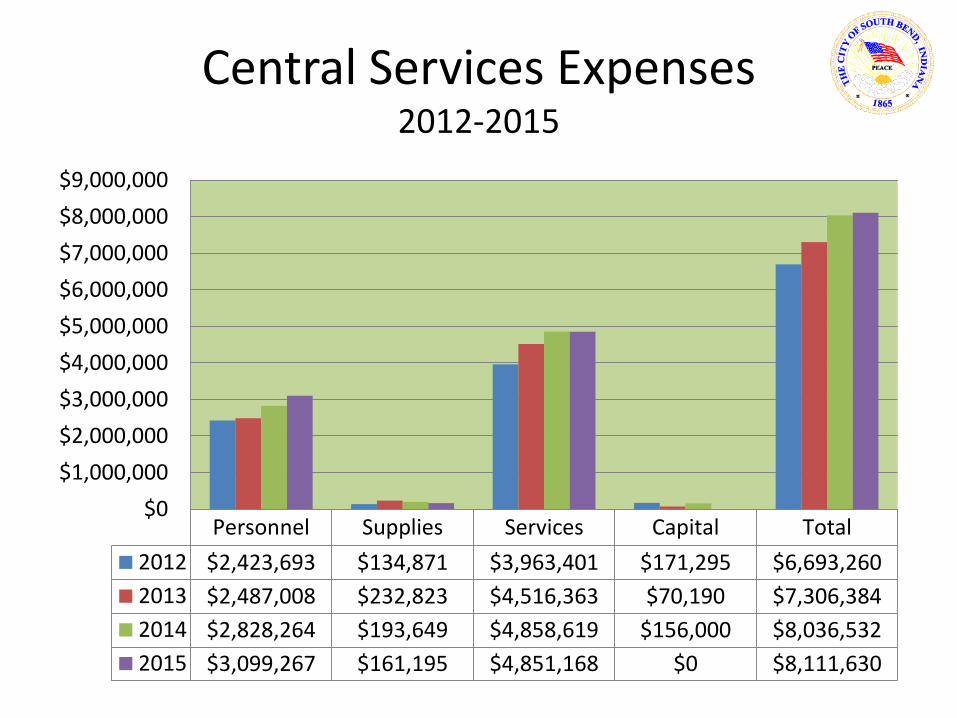
Central Services Expenses 2012-2015
Personnel Supplies Services Capital Total
2012 $2,423,693 $134,871 $3,963,401 $171,295 $6,693,260
2013 $2,487,008 $232,823 $4,516,363 $70,190 $7,306,384
2014 $2,828,264 $193,649 $4,858,619 $156,000 $8,036,532
2015 $3,099,267 $161,195 $4,851,168 $0 $8,111,630
$0
$1,000,000
$2,000,000
$3,000,000
$4,000,000
$5,000,000
$6,000,000
$7,000,000
$8,000,000
$9,000,000

Central Services
Internal Services
Cost Centers
Equipment Services
Office of Sustainability
Central Stores Print Shop Radio Communication
Building Maintenance
$2,661,743 $201,318 $97,447 $138,379 $269,693 $4,471,200

Central Services
Internal Services
1,200+ Pieces of
Equipment
$40 M Value
5.5 M Miles
860,000 Gallons of
fuel
2,750 Two-Way
radio’s
29 channels
$260,000
Central Stores
volume
26 outside Customers $134,000 Revenues
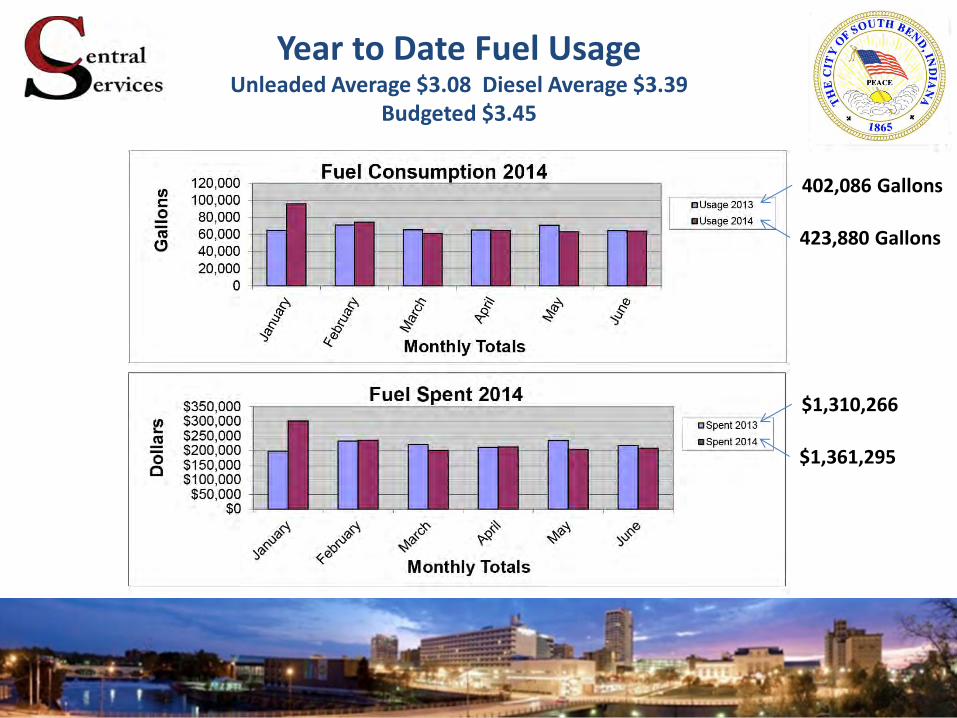
Year to Date Fuel Usage Unleaded Average $3.08 Diesel Average $3.39
Budgeted $3.45
402,086 Gallons
423,880 Gallons
$1,310,266
$1,361,295

Equipment Services Outside Revenues year to date $86,000

Equipment Services Fleet Availability 98%
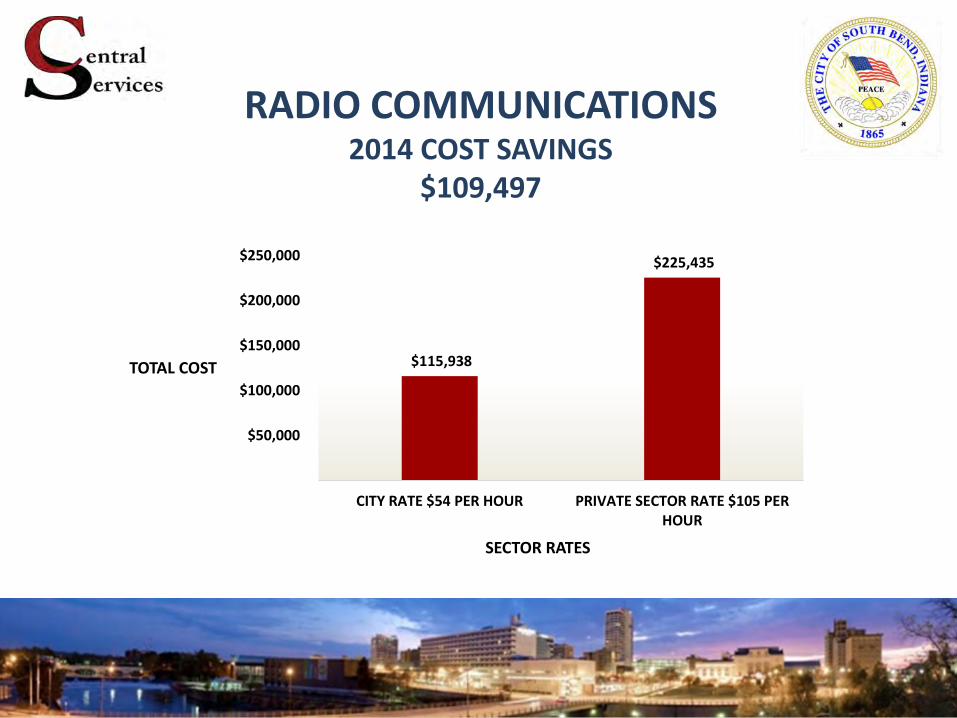
RADIO COMMUNICATIONS 2014 COST SAVINGS
$109,497
$115,938
$225,435
$-
$50,000
$100,000
$150,000
$200,000
$250,000
CITY RATE $54 PER HOUR PRIVATE SECTOR RATE $105 PERHOUR
TOTAL COST
SECTOR RATES
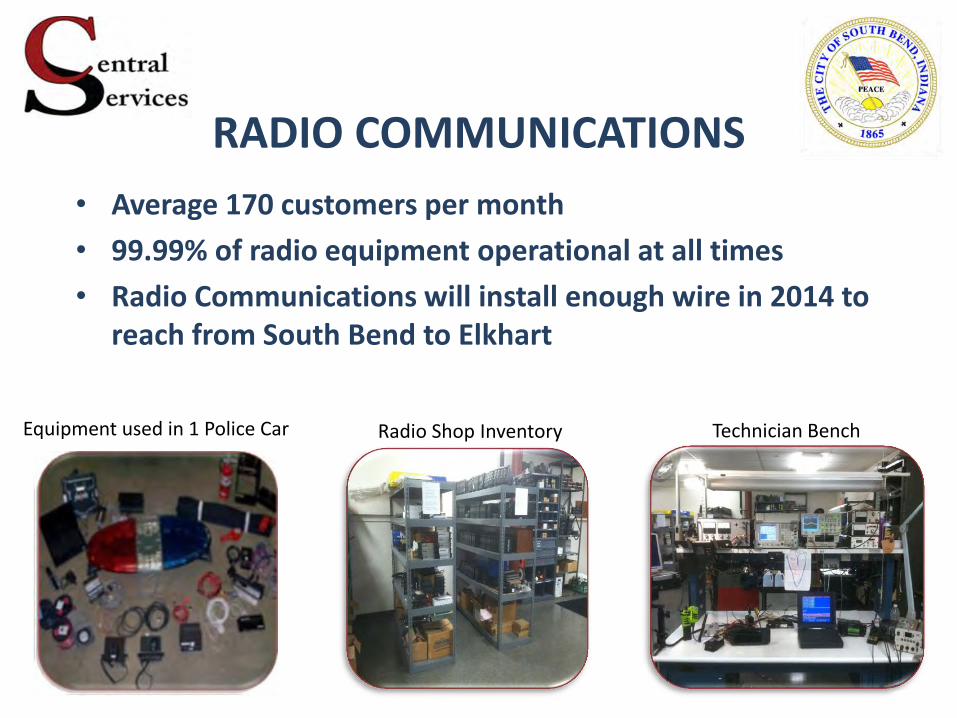
RADIO COMMUNICATIONS
• Average 170 customers per month
• 99.99% of radio equipment operational at all times
• Radio Communications will install enough wire in 2014 to reach from South Bend to Elkhart
Equipment used in 1 Police Car Radio Shop Inventory Technician Bench
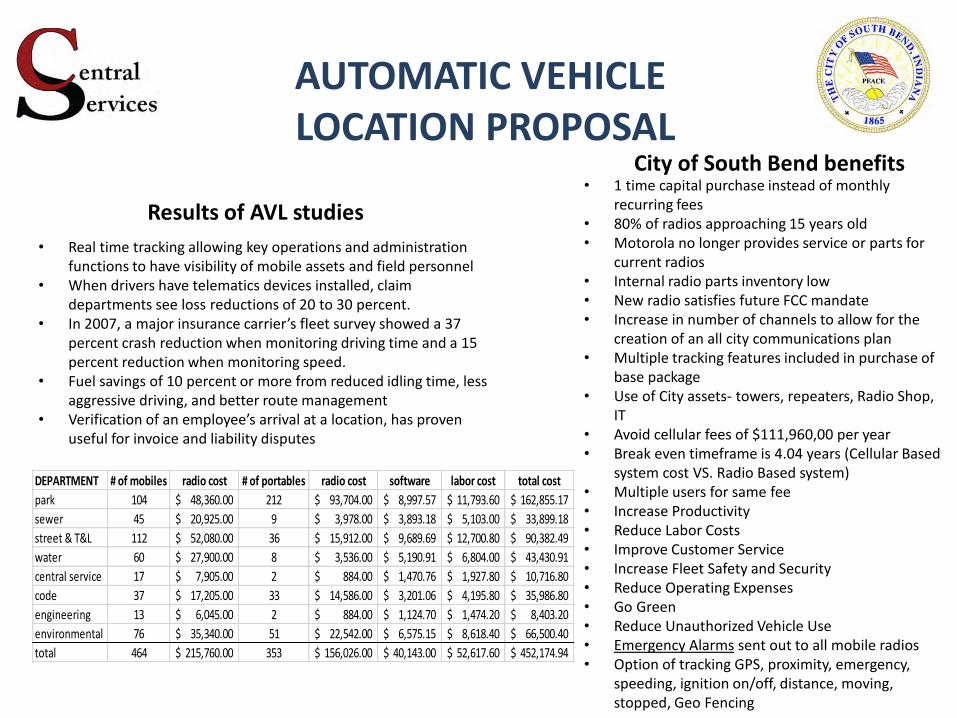
• Real time tracking allowing key operations and administration functions to have visibility of mobile assets and field personnel
• When drivers have telematics devices installed, claim departments see loss reductions of 20 to 30 percent.
• In 2007, a major insurance carrier’s fleet survey showed a 37 percent crash reduction when monitoring driving time and a 15 percent reduction when monitoring speed.
• Fuel savings of 10 percent or more from reduced idling time, less aggressive driving, and better route management
• Verification of an employee’s arrival at a location, has proven useful for invoice and liability disputes
Results of AVL studies
• 1 time capital purchase instead of monthly
recurring fees • 80% of radios approaching 15 years old • Motorola no longer provides service or parts for
current radios • Internal radio parts inventory low • New radio satisfies future FCC mandate • Increase in number of channels to allow for the
creation of an all city communications plan • Multiple tracking features included in purchase of
base package • Use of City assets- towers, repeaters, Radio Shop,
IT • Avoid cellular fees of $111,960,00 per year • Break even timeframe is 4.04 years (Cellular Based
system cost VS. Radio Based system) • Multiple users for same fee • Increase Productivity • Reduce Labor Costs • Improve Customer Service • Increase Fleet Safety and Security • Reduce Operating Expenses • Go Green • Reduce Unauthorized Vehicle Use • Emergency Alarms sent out to all mobile radios • Option of tracking GPS, proximity, emergency,
speeding, ignition on/off, distance, moving, stopped, Geo Fencing
City of South Bend benefits
DEPARTMENT # of mobiles radio cost # of portables radio cost software labor cost total cost
park 104 48,360.00$ 212 93,704.00$ 8,997.57$ 11,793.60$ 162,855.17$
sewer 45 20,925.00$ 9 3,978.00$ 3,893.18$ 5,103.00$ 33,899.18$
street & T&L 112 52,080.00$ 36 15,912.00$ 9,689.69$ 12,700.80$ 90,382.49$
water 60 27,900.00$ 8 3,536.00$ 5,190.91$ 6,804.00$ 43,430.91$
central service 17 7,905.00$ 2 884.00$ 1,470.76$ 1,927.80$ 10,716.80$
code 37 17,205.00$ 33 14,586.00$ 3,201.06$ 4,195.80$ 35,986.80$
engineering 13 6,045.00$ 2 884.00$ 1,124.70$ 1,474.20$ 8,403.20$
environmental 76 35,340.00$ 51 22,542.00$ 6,575.15$ 8,618.40$ 66,500.40$
total 464 215,760.00$ 353 156,026.00$ 40,143.00$ 52,617.60$ 452,174.94$
AUTOMATIC VEHICLE LOCATION PROPOSAL

Central Stores 6,400 Boxes Delivered

Print Shop 2014 Graphic Design
Hours - 240

Building Maintenance COST SAVINGS
$144,342
$106,920
$251,262
$-
$50,000
$100,000
$150,000
$200,000
$250,000
$300,000
CITY RATE $40 PER HOUR PRIVATE SECTOR RATE$94 PER HOUR
2014 COSTS
SECTOR RATES
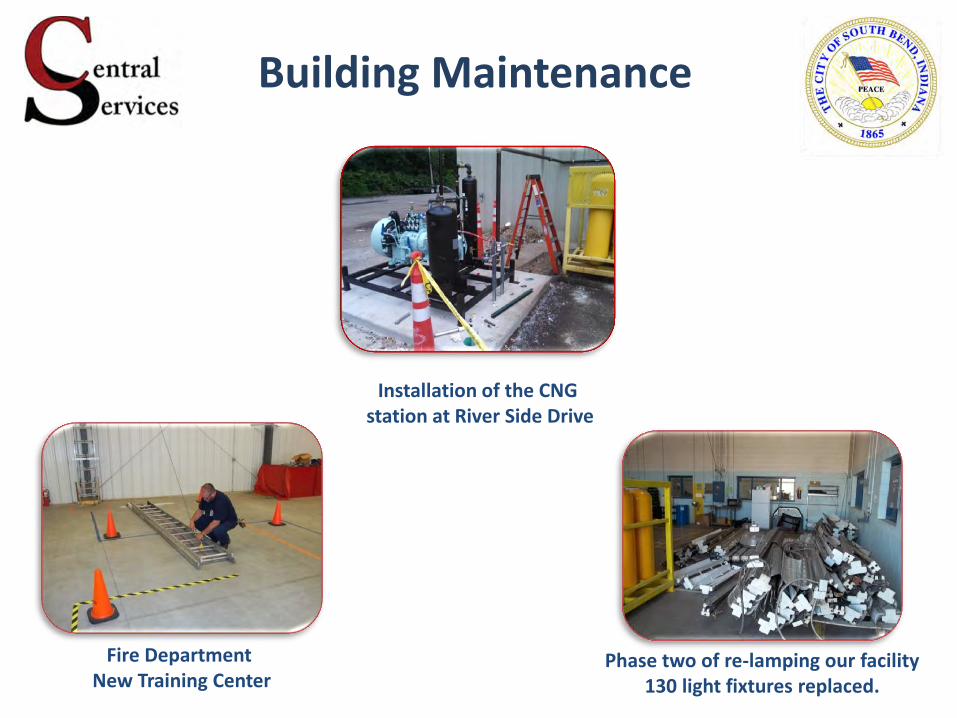
Installation of the CNG station at River Side Drive
Fire Department New Training Center
Phase two of re-lamping our facility 130 light fixtures replaced.
Building Maintenance

Office of Sustainability
• Goal: Expand scope beyond energy, incorporating sustainability into all aspects of City operations and community life.
• Transition from Municipal Energy Office in early May 2014

Potential for Cross Cutting Activities
Create Place
•“Place” = Economic Development
•Biking and walking, Smart Streets
•Trees, urban agriculture and native plants
Reduce Utility Costs
•Manage energy budgets.
•Efficiency projects.
•Rebates and grants.
•Renewable energy.
Create Collabor-
ative Solutions
•Keep food waste and recycling out of landfills.
•Help manage CSOs via rain gardens, swales, downspout disconnects, etc.
•Policies that optimize city operations.
Celebrate •Measure and verify successes.
•Share stories of great projects city-wide.
•Engage the community and build excitement.
South Bend Office of Sustainability
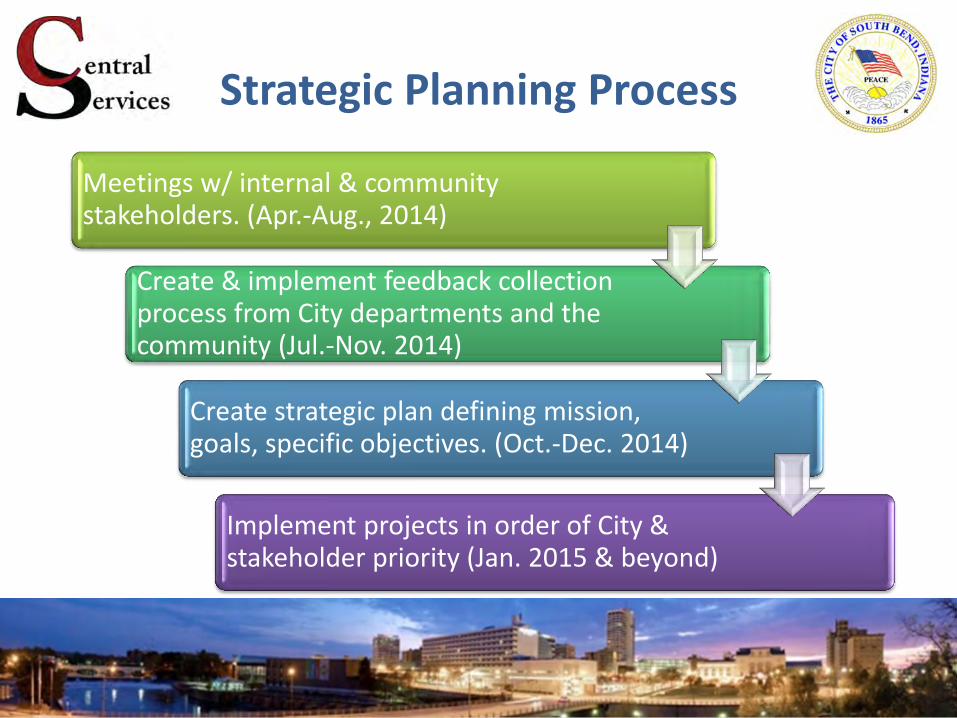
Strategic Planning Process
Meetings w/ internal & community stakeholders. (Apr.-Aug., 2014)
Create & implement feedback collection process from City departments and the community (Jul.-Nov. 2014)
Create strategic plan defining mission, goals, specific objectives. (Oct.-Dec. 2014)
Implement projects in order of City & stakeholder priority (Jan. 2015 & beyond)
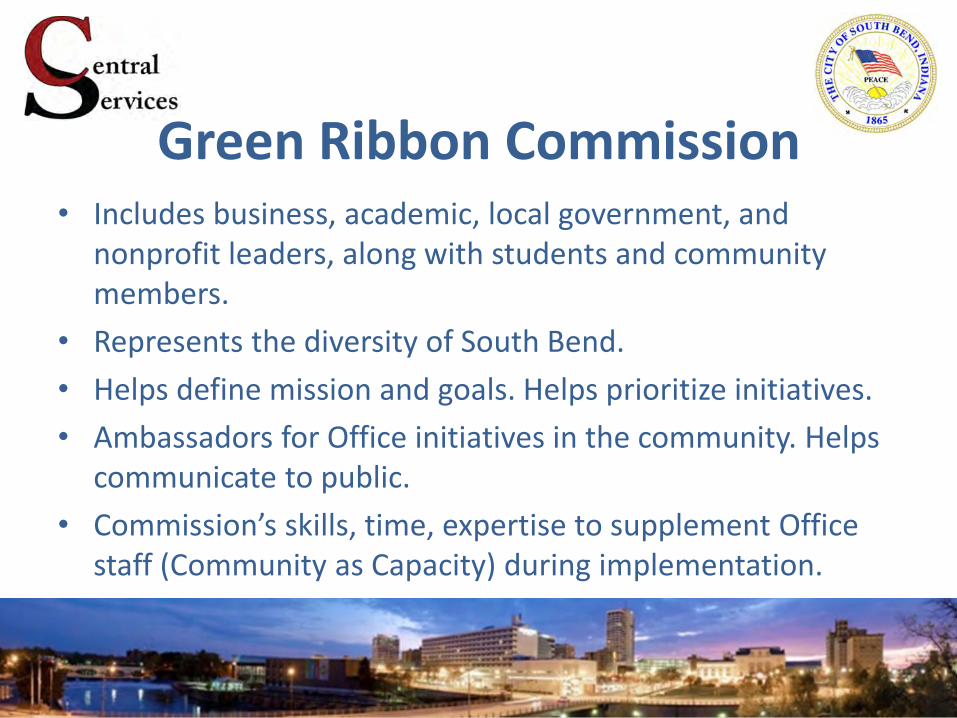
Green Ribbon Commission • Includes business, academic, local government, and
nonprofit leaders, along with students and community members.
• Represents the diversity of South Bend.
• Helps define mission and goals. Helps prioritize initiatives.
• Ambassadors for Office initiatives in the community. Helps communicate to public.
• Commission’s skills, time, expertise to supplement Office staff (Community as Capacity) during implementation.

Ongoing Energy Projects
Projects Yielding Cost-savings and Emissions Reductions

Energy Use at the WWTP
• Partnering with Environmental Services
• Calculate impact of efficiency investments
• Identify other savings opportunities (rate analysis, technology, fuel switching, utilizing biogas).
• Understand sources of greenhouse gas emissions, estimate emissions and identify trends

Century Center Retrofit
• Partnering with Century Center’s facility manager
• Past performance contract reduced electricity bills by 50%, or $200,000.
• Chiller upgrades, LED lighting, water-efficient equipment all contributed.
• New performance contract will identify even more opportunities, including necessary repairs.
• This Guaranteed Energy Savings Contract requires no up-front capital, pays for costly repairs with benefits from other retrofits, and savings are guaranteed.
• Energy savings are permanent – Century Center will see consistently lower utility costs for 10-20 years.

Hydropower in the Dam
• Partnering with City Engineer
• City engineering interns researched and designed transmission line to Notre Dame.
• Design public-private partnership to fund installation of turbines and provide for maintenance of the dam.
• Maintain legal status of hydropower permits
• Operate and maintain existing hydropower unit.

CNG Conversion
• Partnering with Fleet Mgr.
• 793,234 gal fuel/yr @ $3.25/gal = $2.58M
• Converting all to CNG @ $0.75/gal = $0.60M
• CNG-ready vehicles already in fleet: 8
• CNG-ready vehicles in fleet by end of 2015: 100
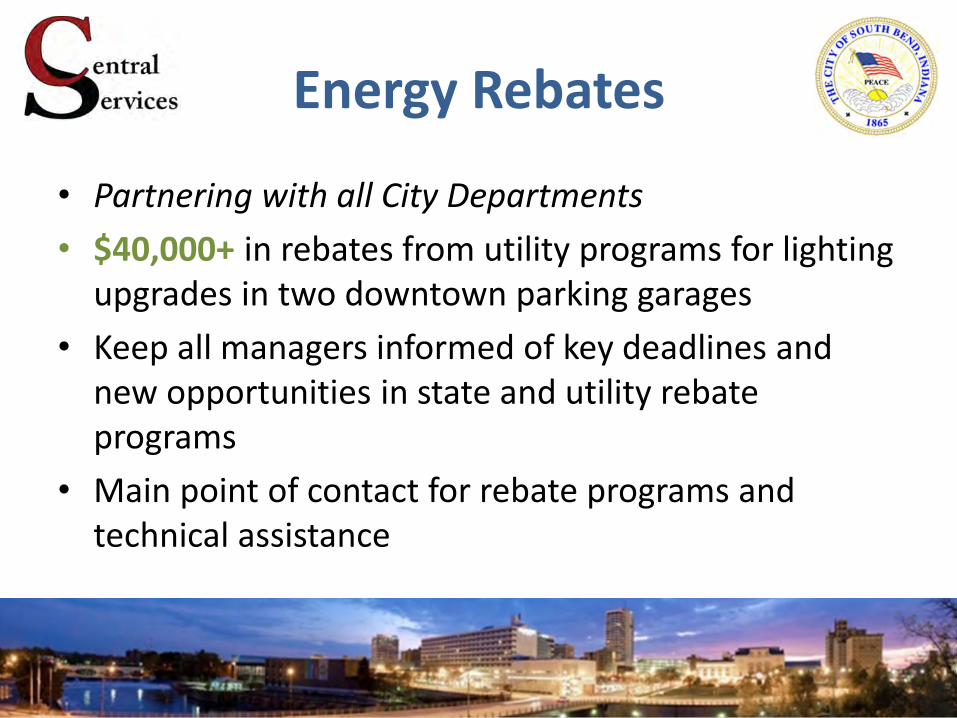
Energy Rebates
• Partnering with all City Departments
• $40,000+ in rebates from utility programs for lighting upgrades in two downtown parking garages
• Keep all managers informed of key deadlines and new opportunities in state and utility rebate programs
• Main point of contact for rebate programs and technical assistance

Fire Station Efficiency
• Partnering with Fire Department Chief, Asst. Chief, and Central Services Maintenance Mgr.
• Energy walk-through of two Fire Stations, identifying potential energy savings.
• Research opportunities for energy savings, recognitions, and awards for FD.
• Different AC technology is being selected to provide much better comfort with increased efficiency.

• Partnering with Community Organizations
• Web presence and social media to educate
• Technical assistance and info to all citizens
• Present at workshops, meetings, and events
• Identify resources for residents and business owners to save energy, reduce costs, and lower impacts.

Water Works
Fund 620 – Operating Fund 622 - Capital

0
2,000,000
4,000,000
6,000,000
8,000,000
10,000,000
12,000,000
14,000,000
16,000,000
18,000,000
2009 2010 2011 2012 2013 2014 2015(P)
Revenue
Expense
Public Works Water Works Revenue & Expense Budget
2014-2015 5.2% Exp Increase
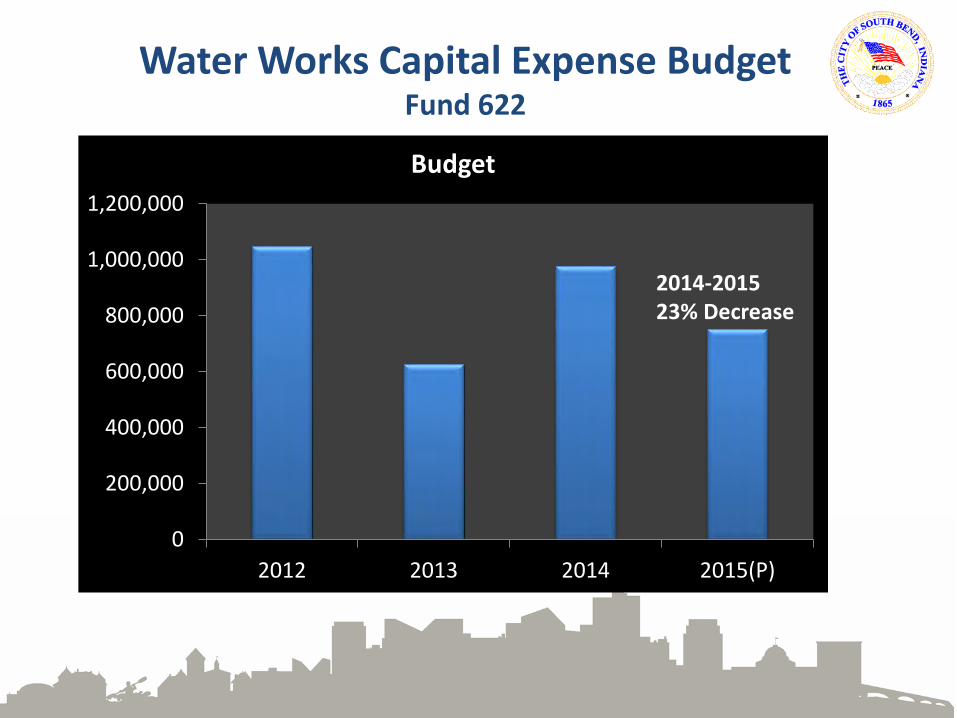
Water Works Capital Expense Budget Fund 622
0
200,000
400,000
600,000
800,000
1,000,000
1,200,000
2012 2013 2014 2015(P)
Budget
2014-2015 23% Decrease

Water Works Expenses 2012-2015
Personnel Supplies Services Capital Total
2012 $4,030,629 $732,910 $10,794,267 $0 $15,557,806
2013 $4,083,769 $959,736 $8,330,782 $0 $13,374,287
2014 $4,578,134 $1,618,415 $8,645,455 $0 $14,842,004
2015 $5,006,035 $1,471,244 $9,130,961 $0 $15,608,240
$0
$2,000,000
$4,000,000
$6,000,000
$8,000,000
$10,000,000
$12,000,000
$14,000,000
$16,000,000
$18,000,000


Water Works
Booster Stations - 6 Wells – 30
Elevated Tower – 1
Reservoirs - 3
Treatment Facilities - 5
Miles of Water Main – 582.5
Fire Hydrants - 5,447
Customer Accounts Served – 41,000
Delivered Safe Reliable Water YTD – 3,207 MG
Water Meters Exchanged - 20,740 (31 months)

Committed To Best-In-Class Service

Solid Waste $ 4,866,822
Water Works $13,781,770
Project ReLeaf $433,027
Sewage Works $31,823,558
2013 Revenues Billed $50,905,237
Water Works Provides Meter Reading, Billing, and Collection Services