Public vs Private Higher Education Services
63
SCHOOL OF MANAGEMENT IN TRENČÍN PUBLIC VS. PRIVATE SERVICES WITH THE FOCUS ON HIGHER EDUCATION Bachelor Thesis 2014 Helena Šefčovičová
-
Upload
helena-sefcovicova -
Category
Education
-
view
345 -
download
1
Transcript of Public vs Private Higher Education Services

SCHOOL OF MANAGEMENT IN TRENČÍN
PUBLIC VS. PRIVATE SERVICES WITH THE FOCUS ON
HIGHER EDUCATION
Bachelor Thesis
2014 Helena Šefčovičová

SCHOOL OF MANAGEMENT IN TRENČÍN
PUBLIC VS. PRIVATE SERVICES WITH THE FOCUS ON
HIGHER EDUCATION
Bachelor Thesis
Study program: Business Administration
Number of the field of study: 6284
Title of the field of study: 3.3.16 Economics and Business Administration
Workplace: School of Management Bratislava
Thesis advisor: Alena Bušíková, PhD., M.B.A.
Bratislava, 2014 Helena Šefčovičová


Abstrakt
Bakalárska práca sa zameriava na vývoj školstva v Slovenskej republike, ale aj na
celkový stav tohto odvetvia vo svete. Krajiny OECD a EU21 boli porovnané so Slovenskou
republikou na základe vybraných ukazovateľov. Spomínali sa aj nové trendy, akým je
napríklad e-learning. V praktickej časti sa zúžil zámer iba na vzdelávacie inštitúcie na
Slovensku, s cieľom detailne porovnať verejné a súkromné vysoké školy. Na základe vzorky
200 študentov bolo možné vyzdvihnúť a analyzovať rozdiely medzi týmito dvoma typmi škôl.
Zároveň bol uskutočnený rozhovor s dvoma učiteľmi – po jednom z každého typu školy –
aby poskytli bližší pohľad do fungovania škôl z ich perspektívy. Vďaka zozbieraným
informáciam bolo možné zostaviť SWOT analýzu a zoznam možných vylepšení. Výsledky
ukázali, že oba typy vysokých škôl maju ako aj silné stranky, tak aj nedostatky, ktoré treba
vylepšiť.
Kľúčové slová: verejné, súkromné, vysoké školy, rozdiely
Abstract
The thesis sheds light on the development of Slovak education as well as on the global
overview of the state of the education industry. Countries from OECD and EU21 were
compared to the Slovak Republic. New trends such as e-learning were also included. In the
practical part the focus was shifted solely on the Slovak Republic in order to be able to
compare private and public university institutions in great detail. Due to 200 sample students,
it was possible to identify various differences between these universities and analyze them.
Instructors from each type of university were interviewed to provide further insight to the
functioning of each type of university. Thanks to the collected information a SWOT analysis
and a set of recommendations were created. Results show that both universities have very
strong points as well as weak points that require further improvement.
Key words: public, private, university, differences

5
Contents
List of Terms ............................................................................................................................... 6
Illustrations ................................................................................................................................. 7
Acknowledgements ..................................................................................................................... 8
Introduction ................................................................................................................................. 9
Brief history of Education in Slovakia ..................................................................................... 10
Theoretical Background and Comparison ................................................................................ 11
Industry Analysis ...................................................................................................................... 16
Academic staff ...................................................................................................................... 17
Slovak Universities & Financing .......................................................................................... 18
E-Learning Worldwide ............................................................................................................. 20
Goals ......................................................................................................................................... 23
Methodology ............................................................................................................................. 23
Analysis of Student Survey Results .......................................................................................... 24
General .................................................................................................................................. 25
Public ................................................................................................................................ 25
Private ............................................................................................................................... 27
Study Program ...................................................................................................................... 28
Teachers ................................................................................................................................ 34
Student Services & Facilities ................................................................................................ 38
Marketing .............................................................................................................................. 42
SWOT Analysis .................................................................................................................... 44
Public ................................................................................................................................ 44
Private ............................................................................................................................... 45
Illustrative Teacher Interviews ................................................................................................. 47
Recommendations ..................................................................................................................... 51
Conclusion ................................................................................................................................ 53
Resumé ...................................................................................................................................... 54
References ................................................................................................................................. 57
Appendix - Sample questionnaire ............................................................................................. 59
6
List of Terms
EU21 average: “is calculated as the unweighted mean of the data values of the 21 countries
that are members of both the European Union and the OECD for which data are available or
can be estimated,” (OECD, 2013)
Countries included in the EU 21 average : “Austria, Belgium, the Czech Republic,
Denmark, Estonia, Finland, France, Germany, Greece, Hungary, Ireland, Italy, Luxembourg,
the Netherlands, Poland, Portugal, Slovenia, the Slovak Republic, Spain, Sweden and the
United Kingdom.”
OECD: “the Organisation for Economic Co-operation and Development,” (OECD, n.d.)
** The number of respondents from each university
* Grade legend: 0 – not satisfied at all, 1 - very dissatisfied, 2 – dissatisfied,
3 – average/acceptable, 4 – satisfied, 5 – very satisfied
Top 100 universities: the author used rankings from an OECD report, Education at a Glance
2003. (See Psacharopoulos, 2004 in “References”)
Korea: in the OECD report only “Korea” is mentioned, it stands for South Korea
7
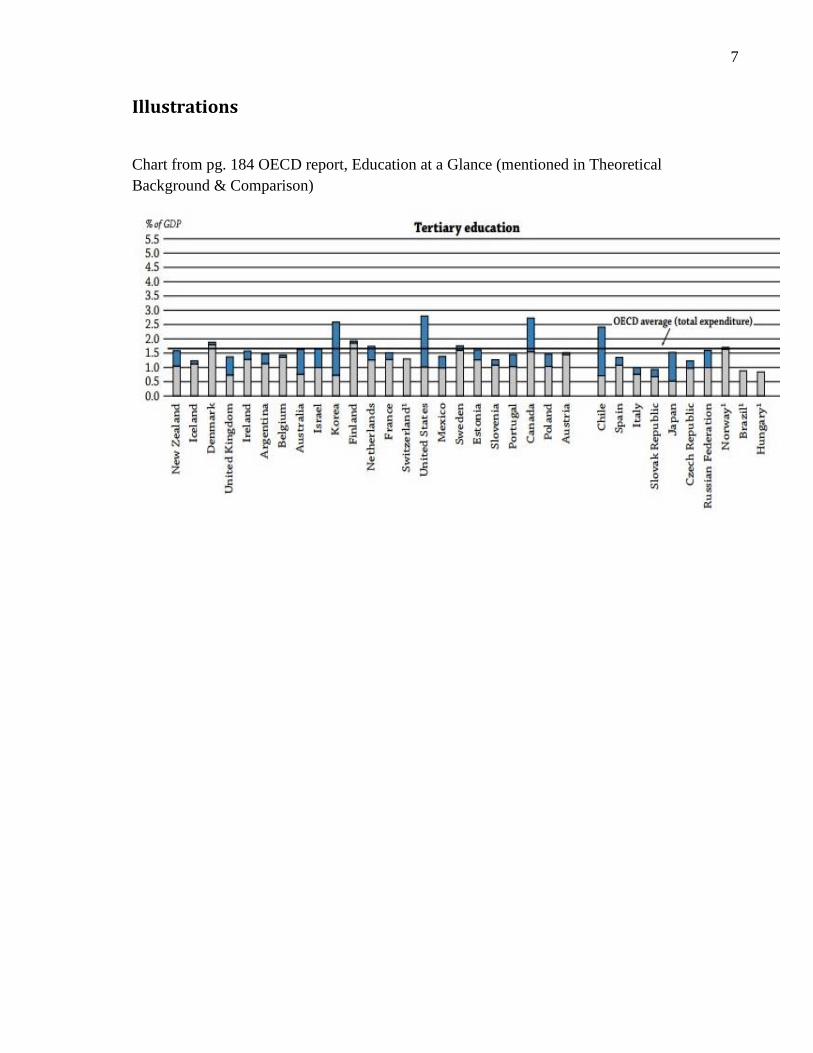
Illustrations
Chart from pg. 184 OECD report, Education at a Glance (mentioned in Theoretical
Background & Comparison)

8
Acknowledgements
I would like to express my deepest gratitude to my advisor Alena Bušíková for her
guidance, support and continuous advice during my research. I would also like to thank the
teachers and friends that helped me collect enough information for my research. It would not
have been possible without them.

9
Introduction
The following paper describes, analyzes and compares public and private services with
the focus on Higher Education or more specifically tertiary education. At first, a Brief History
of Education” will describe the most important acts and guidelines that were adopted in the
Slovak Republic, like the Bologna Declaration. It helped improve and develop Slovak
education systems’ techniques and approaches. The declaration also focuses on enlarging the
research capacity and amelioration of quality assurance systems in the EU and Slovak
republic.
Then, the “Theoretical Background” will provide definitions and data for comparison
of public and private universities and expenditures in Slovakia, EU 21 (see “List of Terms”)
and OECD countries. This section describes the technical characteristics and differences
between university and non-university types of Higher Education Institutions based on
guidelines from the European University Association (EUA) report. Once the technical
framework is explained, the financial part of this section compares the amount of cash-flow
directed at universities from each of the mentioned countries.
This will be followed by a thorough “Industry Analysis” that generates a broader range
of information about the higher-education industry. The current state of tertiary education in
Slovakia is outlined, with a more detailed assessment of the academic staff, the available
universities and their financing.
At the end of the theoretical section, a quick overview of the current state and usage of
e-learning was added to underline the increasing trend. A technical background of e-learning
specifies the various accreditation programs and licenses as awarded by the EFQUEL
(European Foundation for Quality in e-Learning).
In the practical section a much smaller area was studied. The main focus is on the
comparison of Slovak private and public university institutions. The research was done
through a survey filled by 100 students from each type of university. Their answers were
processed into various sets of data that was necessary to identify and highlight the many
differences among private and public universities. Survey questions were separated into
different groups for clearer analysis and concentrated on specific aspects of both types of

10
institutions, like “Study Program”, “Student Services & Facilities”, “Marketing”, etc. Though,
for a different perspective university instructors were consulted as well. They commented on
topics such as management and administration, motivation, flexibility, etc. After gathering and
analyzing the provided information, a list of recommendations was created to highlight and
summarize the most pressing issues for each type of university.
Brief history of Education in Slovakia
“Slovak higher education has undergone fundamental changes since the fall of the iron
curtain,” (Jensen, 2008). In 1990 a new Higher Education Act was implemented in
Czechoslovakia – it “marked a new era, bringing academic freedom to higher education after a
period of central management by the government of contents and procedures.” Then a few
years later in 2002, Higher Education was transformed thanks to a new Higher Education Act.
In consequence, the Bologna Declaration was implemented, so higher education institutions
became “legal entities” and “profound changes in the allocation of funds to Higher Education
Institutions” were adopted as well. The demand for higher education increased rapidly, thus
new universities were founded and “the number of undergraduate students (first and second
level) increased from 60,000 to 168,000 in just 16 years (1989 and 2005); the percentage of
new entrants to tertiary study rose from 27.2% to 61.4% of all 18 year olds.”
“The Bologna reforms (Bologna Declaration, 1999) are often associated with European
systems adopting a three cycle degree structure (Bachelor, Master, PhD) to allow for greater
international comparability of their degrees.” Before, study programs were not separated in
such a manner. The adoption of the Bologna reform is part of a larger goal within the
European Higher Education Area. The aim of this reform is to shift the “focus from a teacher-
centred to a learner-centred approach in tertiary education”. Moreover, “Such changes of
perspectives require new ways of organising curricula and the teaching process itself (e.g. less
ex-cathedra, more counselling of independent projects and teams).”
In today’s world the professional setting has completely changed. The work
environment and careers have evolved in various ways. Today, there is “more international
and inter-sectoral mobility, with people changing employers and places of employment several
times in their lives” and therefore “adaptability has become a key asset”. Several other trends
11
in the modern work environment are: entrepreneurship which “is becoming a prominent value
in our societies” along with interdisciplinary competences as they “are becoming vital in
careers which are based on research, technological development and innovation.” However,
the Slovak Republic has yet to improve its higher education as the “deeper challenge of
shifting attention to the diverse needs of the learners and the competences they need to excel
in tomorrow’s working environments has not yet been addressed at all universities.”
The Bologna reforms focus on another central factor “common standards and trust
among quality assurance systems in Europe.” It means that the Slovak Republic along with the
rest of Europe has to concentrate on “introducing a more trust-based and more systematic
approach to quality assurance within higher education institutions”. In 2005 the European
Standards and Guidelines for Quality Assurance were put in place “on the basis of
increasingly close cooperation between the different quality assurance and accreditation
agencies” by the Ministers in Bergen.
The last factor it concentrates on is the “research capacity of the system, namely the
remarkable attention and energy which has recently been invested in the reform of doctoral
provision all over Europe.” In order to enlarge the research capacity of the system, there have
to be more doctoral students to carry out the research. “During the last fifteen years, there was
also a sharp increase in the number of postgraduate students, from about 600 in 1990 to 10,400
in 2005.”
Theoretical Background and Comparison
The previously mentioned higher education act was created and adopted in Slovakia in
2002, (Jensen 2008). “The higher education institutions were supposed to be strictly divided
between university and non-university type of HEIs.” It is specified that the university type
which we will be focusing on “shall provide education in the study programmes of all the
three levels” as specified by the Bologna reform. However, in 2007 another act was put in
place – it does not separate HEIs into university and non-university types anymore, it divides
them in 3 categories: Higher education institution, Professional higher education institution
and University. The HEI as described by the law shall only provide “study programmes of the
first level, second level and (…) shall carry out especially the basic research”. Then the

12
professional HEI “shall provide for higher education in the study programmes of the first level
and shall carry out especially the applied research” and finally a University aside from
providing education programs of all three levels, “shall carry out especially the basic
research”. HEIs are classified into these categories after the Accreditation Commission has
reviewed their relative performance by analyzing “threshold levels of number of students per
level and per number of staff, research performance (with three categories of performance
fixed) and third party grant income”.
As mentioned we will be focusing on the University type of HEI. To be able to obtain
the university title, “five out of the six parameters on which institutions are evaluated” should
be “research-related”, such as: “the number of doctoral students per staff, the number of
doctoral graduates in all, the research results of their theses, the average grant income per
professor and the overall research performance.” As suggested by the EUA, to further increase
these numbers, the Slovak Republic should create separate incentives “to allow for excellence
standards to be pursued” by Universities and HEIs in areas they choose to focus on, e.g. “the
quality of teaching, of research and of innovation or entrepreneurial activities”. It is important
that each of these activities is supported and rewarded by the state as a form of
encouragement, as explained in the EUA report. Also, “If universities or other higher
education institutions choose to focus most strongly on being particularly responsive in their
contacts with business sectors and on actively promoting commercialisation of research
results, such initiatives should also find a group of incentives as fuel to their motors of
quality.”
However, in this research we will be analyzing and comparing the public and private
sector in higher education. It is also called tertiary education. At first, we should understand
the difference between a public and a private university. “An institution is classified as public
if it is controlled and managed directly by a public education authority, or by a governing
body most of whose members are appointed by a public authority, (Psacharopoulos, 2004). On
the other hand, “a private institution is one that is controlled by a nongovernmental
organization, or if its governing board consists mostly of members not selected by a
government agency.” The author, who is a member of the European Experts Network on
Economics of Education, has created a summary of the most important decisions a university

13
has to make along the people who make them. The crucial decisions are the university budget
level, university budget allocation, tuition fees, hiring professors, professorial pay, professorial
promotion and tenure, admissions policy and university entry policy. In public university
systems all of these decisions are made by the state, though in the private university systems
most of the decisions are made by the university itself and in some areas students can make
the decision as well.
The author also suggests that there is a strong correlation between private resources to
tertiary education and number of universities in the top 100 (see “List of Terms”). Out of 14
countries that have a minimum of 7% of private share of GDP to tertiary education, 11 have
at least one university in the top 100 world rank. The country with the highest private share of
GDP (in 2004) is the US with 66.7% and accounts for 51 universities in the top 100. The
second country with the highest private share is Japan with 54.5% which only accounts for 5
top 100 universities. It seems that private resources in the tertiary sector greatly increase the
quality of universities, though there are a few countries with 0% of private resources in tertiary
education and still have 1 university in the top 100 ranking – Austria, Denmark, Finland and
Norway. It is very clear there are different degrees of privatization of universities which are
classified into “distinct clusters”: Continental Europe: mostly public university systems; the
UK, Ireland and Spain: outliers in Europe regarding private systems; Australia and Japan:
leaders in privatization and North America: United States mostly privatized. It means that
most of Europe has a majority of public universities with very low private resources, except
for the mentioned outliers that are the UK, Ireland and Spain each having at least 20% of
private share of GDP. Then as the name suggests Australia and Japan have the highest
percentage of private shares (above 40%) in the world except the US which is part of the
North American group along with Canada (just under 40%).
In order to provide more detail, we will be examining various sets of quantitative data
from the OECD Report, Education at a Glance 2013 with a focus on the EU 21 and the Slovak
Republic. The first indicator is expenditure on educational institutions as a percentage of GDP,
it “presents a measure of expenditure on educational institutions relative to a nation’s wealth.”
The estimate of national wealth is “based on the GDP, and expenditure on education includes
spending by governments, enterprises and individual students and their families.” According
14
to a chart in the report (pg.184) Slovakia invests just under 1% of the GDP to the tertiary
education sector – from that about 2/3 seems to be the public expenditure and the rest is
private expenditure (see “Illustrations”). “Expenditure on tertiary education amounts to more
than 1.5% of GDP in more than half of all [OECD] countries” though “three countries devote
less than 1% of GDP to tertiary education,” the Slovak Republic is among them with only
0.9%. A table on (pg. 191) confirms these low numbers. In the years from 1995 to 2005
Slovak Republic’s expenditure on tertiary education rose from 0.7% to 0.8%, then rose to
0.9% in 2005 and stayed at the same level until 2010. Compared to the EU 21 average it is
about a half a percent lower, the expenditure rose from 1.1% in 1995 to 1.3% in 2005 up to
1.4% in 2010.
As for private funding of tertiary education in Slovakia, the share has increased (from
2000 to 2010) “by more than nine percentage points” along with Italy, Mexico, Portugal and
the UK. Even though “Educational institutions in OECD countries are mainly publicly funded
(…) there is a substantial – and growing – level of private funding at the tertiary level.” Due
to significant increases in private funding ,“the share of public funding for educational
institutions decreased by at least 4 percentage points in Canada, Italy, Mexico and Portugal
and by more than 10 percentage points in the Slovak Republic and the United Kingdom.”
However, there are enormous differences between countries’ levels of private funding. “The
proportion of expenditure on tertiary institutions covered by individuals, businesses and other
private sources, including subsidized private payments, ranges from 5% or less in Denmark,
Finland and Norway” followed by “more than 40% in Australia, Canada, Israel, Japan and the
United States” and then “over 70% in Chile, Korea and the United Kingdom.”
Once we compare the public and private sector it becomes clear that in most countries
“public expenditure per student is higher on public than on private institutions.” Again
countries are classified by “patterns in the allocation of public funds to public and private
institutions”. The first set of countries have “at least 90% of students [that] are enrolled in
public institutions,” therefore most public funds are invested in to public institutions and
“private funds complement public funds to varying degrees”. This is the case for Denmark and
the Netherlands. In the next set of countries, “public expenditure goes to both public and
private institutions, and public expenditure, per student, on private institutions represents (…)

15
nearly 100% – of the level of public expenditure, per student, on public tertiary institutions,”
e.g. Finland, Hungary, Iceland, Belgium, Estonia and Sweden. All of these countries are below
the OECD average with their share of private expenditure on tertiary education.
It is also important to note that the financial crisis highly influenced the education
budgets “in the OECD countries that had substantial general budget deficits in 2010 and 2011”
– Slovakia is a part of this group. Therefore, in 2011/2012 there were cuts in education
budgets in 15 OECD countries. The Slovak Republic is in the group of countries with
education budget cuts between 1 and 5%. As higher education and R&D are closely related,
we should be aware that the share of R&D expenditure as a percentage of GDP is almost 7
times lower than the expenditure for tertiary education with only 0.14%.
The proportion between private and public sources of funding has noticeably changed.
The private sources can be divided in to “household expenditure” and “expenditure of other
private entities”. To simplify, the private sources will be added together when comparing with
the public sources. Surprisingly, Slovakia’s private expenditure is above the EU 21 average
but below the OECD average. In the Slovak Republic, private sources account for 29.8% and
public sources for 70.2%. The EU 21 average is 77.3% for public sources, 22.7% for private
sources and the OECD average is 31.6% for private sources and 68.4% for public sources.
Moreover, the Slovak Republic has got more private sources of funding than any of its
neighbors.
In Slovakia, 83% of students enroll in public universities compared to only 17% of
students enrolling in private universities. As opposed to the EU 21 average there are no
private government-dependent institutions. In the EU 21 75% students go to public
institutions, 16% to private government-dependent institutions and only 8% to private
institutions. The OECD is slightly different form the EU 21 average with 71% of students in
public institutions, 14% in private government-dependent institutions and 15% in private
institutions.
The last factors to look at are the entry rates into tertiary education, average age of new
entrants and the graduation ages. Entry rates into tertiary education are different for men and
women. First, we should clarify what “net entry rates” are and how are they calculated. “The

16
net entry rate for a specific age is obtained by dividing the number of first-time entrants of that
age for each type of tertiary education by the total population in the corresponding age group.”
Then to calculate the sum of net entry rates, the rates for each year of age have to be added.
“The result represents an estimate of the probability that a young person will enter tertiary
education in his/her lifetime if current age-specific entry rates continue.” These rates are
calculated with “average weighted age of entry” – it is “calculated by assigning higher weight
to those ages at which the number of students entering a new level is higher”. In Slovakia the
sum of age-specific entry rates is 52 for men, 71 for women and 61 when combined for an
average age of 23. For comparison, the EU21 average the entry rates are 51 for men, 67 for
women and 59 both sexes together for an average age of 22 and the OECD average is very
similar with 53 for men, 67 for women and 60 for both with an average age of 22. These
numbers help us understand more precisely the position of Slovak Republic’s trends in
education, when compared to the EU 21 and OECD countries. It is possible to assess how
early or late do Slovak students start their university studies when compared to the mentioned
groups of countries.
There is an evident difference between the mentioned entry rates and entry rates that
are narrowed down to students under the ages of 25. The same process as above is applied
when calculating the entry rates, except there will only be students with the maximum age of
25. In the Slovak Republic there is an entry rate of 43 for men, of 56 for women and 49 once
these are combined. Once again, for comparison the EU 21 average is 43 for men, 55 for
women and 49 for both. The OECD average rates are 42 for men, 54 for women and 48 for
both.
Industry Analysis
According to the European University Association’s (EUA) Institutional Evaluation
Programme, “The central role of the universities as providers of research competences and of
the research foundation for innovation should be recognised and supported,” (Jensen, 2008).
The statement indicates there is a strong relationship between the higher education sector and
R&D. At an EU summit in 2002, one of the main targets was to increase the R&D investment
rate up to 3% - in the process of reaching this goal several smaller targets were created and

17
one of them was “investment for higher education”. Thus, the higher the budget for R&D the
more investment will be directed at the higher education institutions and systems. It is an
extremely important factor for Slovakia as “the Slovak Higher Education system compares
unfavourably to the already low European average with respect to research and innovation
investments”. Also EUA suggests, “The Slovak Republic should seek urgent action in
redressing the imbalance rather than letting it grow even more”. The EUA analysis underlines
the great importance of and need for funding in the R&D sector in order to improve the Higher
Education system and at least get to the European average.
Moreover, to be able to rise to the European average, Slovakia’s higher education
sector requires an amelioration of the university curricula to make it coincide with new
structural demands by “shifting attention to the diverse needs of the learners and the
competences they need to excel in tomorrow’s working environments”. However, “the quality
of educational and research activities has suffered from the pace and insufficient financial
coverage of that expansion.” Slovak universities do need to modernize their teaching programs
to be able to teach students skills and competences needed in the modern world as was already
mentioned in the previous section; though it is clearly a hard task to accomplish without
sufficient funds.
Structural Funds can be used to finance and improve this situation by “renewing the
research infrastructure, networking and framework conditions for all actors in research and
innovation in order to build their international competitiveness,” as these are “vital
preconditions for competitive research environments”. Lack of any of these conditions could
decrease the probability of success. Therefore, preconditions must be met in order to become
equal rivals with other countries.
Academic staff
To accomplish this goal, a fundamental trait of the Slovak tertiary education must be
taken care of - the old age of most professors. After the system review, EUA concluded “the
age distribution of the academic staff was a serious issue, with many professors and associate
professors over fifty and in some faculties averages were even higher.” The academic staff
will soon have to be renewed; it may become a “threat to the future pedagogical and research
development of the universities”. Therefore, this issue has to be addressed promptly; in case

18
of the opposite the “Slovak higher education will be unable to produce the qualified labor it
needs to underpin its economy and society and to increase its knowledge base and
productivity.” In order to prevent this unsatisfactory situation extensive focus on quality,
innovation and provision of funds should be directed to Slovak universities with the goal of
attracting modern bright minds and use the universities’ up to date equipment to encourage
research and broaden Slovakia’s knowledge base. Other than attracting the mentioned bright
minds it is substantial they share their knowledge with the largest number of students possible.
As EUA suggests, “the Slovak government and the leaders of higher education institutions
will have to invest considerable resources and care into increasing the attractiveness of the
university sector for bright young people, both in terms of salaries as well as in terms of
attractive working conditions and infrastructure (including buildings).”
Once Slovak universities are attractive enough to appeal to young intelligent people,
the next step is to help them present the new knowledge on the international scene. However,
even more attractive incentives will be needed to assure the return of young professors and
researchers. International experiences are “known to contribute substantially to the innovative
potential of individual researchers.” Thus, these experiences “should be fostered
systematically” along with interesting incentives in the return schemes “to make the return of
young researchers from international stays attractive.” All of these efforts would eliminate the
previously mentioned possibility of Slovakia’s close to non-existent knowledge base to
support its economic and societal development, creating on the other hand a much larger
qualified labor group coupled with increased skill and knowledge quality.
Though improving the knowledge base is a hard task without any support or incentive
for research and innovation. Universities cannot easily focus on these areas “since they are
funded predominantly on the basis of student numbers.” So, “More incentives are needed to
reward research and innovation initiatives in universities.”
Slovak Universities & Financing
As for the institutions providing higher education, “more than half of the 20 public
universities have some subject area monopolies.” Though, “at the same time (…) subject
differentiations are being blurred in the process of expansion as most of the originally
specialized universities have added a wider range of subject areas.” The five largest and most

19
frequented universities are the Comenius University, the Slovak Technical University and
Economic University in Bratislava as well as the Technical University in Kosice and UCP
Nitra. There are also four private universities of which “three have fewer than 1000 students.”
There are very few private universities as well as there are very few private investors
engaged in university funding (non-university institutions are not included). It evokes certain
obvious questions – why aren’t there more private universities and why aren’t there more
private investors? EUA created the following list of obstacles after interviewing university and
industry representatives, (Jensen, 2008):
1. Industry representatives point to the problem of age structure of the research staff
namely that there are not enough younger people.
2. The poor quality of scientific equipment makes it difficult to develop state-of-the art
technology.
3. Industry executives feel the need for university leaders who are able to profile the
faculty, making its strengths apparent and convincing industry leaders that they are
investing into a winning environment.
4. The traditional institutional fragmentation originating from pre-2002 and overly
vertical organization prevent universities from being able to work across disciplinary
boundaries. This makes the solution of problems often impossible the latter ten to be
interdisciplinary and cannot be addressed by individual disciplinary teams.
5. The size of the research groups is often too small to respond to the industrial research
challenges.
6. The slow response of universities.
These obstacles “hinder academic performance” and for that reason “universities may want to
rethink their internal faculty structures, incentives and decision-making processes” which will
consequently “facilitate internal flexibility, interdisciplinary perspectives and cooperative
spirit.” All of these factors combined should increase universities’ attractiveness for private
investors.
Once private investors are involved, universities will be much better equipped, have
better incentives and more funds to improve the academic curricula and thus increase the

20
universities’ quality along with their chance of appealing to young researchers. Although,
universities also have the already mentioned possibility to receive financing through EU’s
Structural Funds “which allow expenditures on structural aspects of the knowledge economy
and should help very significantly in jump-starting university-industry cooperation.” Also, “It
is to be hoped that the conditions for drawing funds from the Structural Funds (…) will be as
flexible and unbureaucratic as possible.” The Ministry of Finance is currently working on
these conditions aiming to “smooth the interface between industry and universities”.
According to EUA, once financing is granted for a specific project or a PhD position it takes
18 months to receive the funding if it is ever received – sometimes there are “projects being
finished without any of the promised money ever having arrived”. If the Slovak government
does not eliminate these conditions along with “insufficient degree of competitive
performance criteria of grant distribution (…) Slovak university research stands no chance to
compete internationally”.
Another relevant area that “the national government should support (…) with funds
and larger competences” is the regional and international cooperation among universities.
“The importance of regional and metropolitan networking for increasing knowledge intensity
and productivity, and the vitality of university initiatives in this context, cannot be emphasised
enough.” Tightened cooperation through shared efforts and goals could give rise to the
“establishment of technology centres, technology incubators, and industry/ university centres
of excellence”. This alone, would positively influence and improve Slovakia’s economic and
research capability
E-Learning Worldwide
The worldwide technological innovation has reached the education field and stimulated
the creation of new educational techniques. Various universities and tertiary education
institutions modernized their teaching methods and created online versions of their programs.
This new trend of studying online, through computers as well as interacting with classmates
and teachers via internet is known as e-learning.
In 2005 EFQUEL was created. EFQUEL stands for European Foundation for Quality
in e-Learning. It is “the leading international network in the field of quality in education and is

21
open for individual members, academic & non-academic institutions, and corporations,”
(EFQUEL, 2012a). However, our main focus is the usage of EFQUEL services in academic
institutions. One of its services is called “UNIQUe E-Quality Label”, the label “is designed to
review and certify higher education institutions or institutes within
higher education institutions, e.g. a university or a school or faculty within a university.” Once
the quality and implementation are reviewed these institutions receive an “EFQUEL
Certification for Higher Education Institutions using ICT for Learning”. The main role of the
EFQUEL review before issuing the certificate is to look “into the excellence of using ICT to
improve quality in higher education”. Qualifying criteria for this program concentrate on
reviewing the level of “continuous iterative innovation in all aspects of pedagogical design
and course provision,” (EFQUEL, 2012b) as well as they are specifically tailored to be
“complementary to the European Standards and Guidelines for Quality Assurance in Higher
Education” and are in line with the Bologna reforms.
In 2009, EFQUEL already had roughly 90 members from 23 countries all over the
world, (Ehlers, 2009). The newest list of countries includes Austria, Cyprus, Bulgaria, Egypt,
Malaysia, Montenegro and Slovenia with just one or two institutions as a part of the EFQUEL
quality label. Countries like Russia, Belgium, Germany, Portugal and Italy have about five or
more institutions that were awarded an e-quality label, (EFQUEL, 2012c). Slovakia and
Hungary are exceptions in the EU that have not yet taken part in an e-learning initiative and
thus have no institutions that obtained the UNIQUe qualification or any of the other provided
certifications.
However for those that took part in the initiative, there are 3 different ways to
implement E-learning in Universities according to EFQUEL: virtual, integrated, enriched.
(Ehlers, 2009). The virtual concept is composed of virtual lectures, conferences, seminars or
online courses; the integrated concept uses forms of e-learning for evaluation, online tutoring,
communication and self-study. As for the enriched concept, it is a combination of interactive
assignments, electronic scripts, presentation slides and visualization. According to the
presentation of Mr. Ehlers, president of EFQUEL at Baden-Wurttemberg Cooperative State
University, there is a transition from transmissive learning to expansive learning once ICT is
implemented into higher education. Before the implementation of e-learning, students would

22
study on their own form various dsitributed materials, presentations posted online and learning
management systems (transmissive learning). After the implementation, expansive learning
would take place which consists of many students communicating with one another as well as
the teacher, using weblogs, communities, wikis, e-portfolios and most importantly
“collaboration and reflection”.
As e-learning is has been greatly expanding in the past few years so has the number of
institutions concentrating on improving and expanding these services. Another important
organization is the “EDEN,” the European Distance and E-learning Network which “exists to
share knowledge and improve understanding amongst professionals in distance and e-learning
and to promote policy and practice across the whole of Europe and beyond,” (EDEN, 2012).
In 2012, the EDEN had 1200 individual members from 200 institutions as well as 420
organisations from 58 different countries. All of these individuals and institutions have been
working on the integration of e-learning in their countries and all over the world.
The success of these organisations in acquiring members and improving e-learning
conditions proves the growing trend and need for distance learning using the internet and
various information technologies. Unfortunately, there has not yet been an extensive study
published examining e-learning in universities and the statistics of this area. The European
University Association “launched a questionnaire addressing [its] members” and “other
European higher education institutions on institutional practices related to e-learning” in
October 2013, (EUA, 2013). The survey was closed only on November 18th
, 2013 so the
results are currently being processed and are not available yet.

23
Goals
The primary goal of the following research is to highlight the most important aspects
of university institutions in order to be able to compare and analyze them. The results should
indicate each type of university’s stronger and weaker points. The goal is also to be objective
while interpreting the findings and to ensure a broader perspective on the matter. The research
should also bring insight on necessary initiatives and improvements needed to strengthen and
ameliorate the higher education sector in Slovakia.
Methodology
To achieve the previously mentioned goals, the practical part will consist of an analysis
of survey results, interviews and a set of recommendations.
The survey was sent out to public and private university students (or students that have
finished their degrees and are now working) with questions mostly focusing on the “basic
university features,” such as their satisfaction with program, teachers, services and facilities.
Other questions focused on annual fees, the form of studying, availability of course material
and teachers’ teaching styles. The questionnaire was created online and spread through various
social networks and groups in order to get the widest reach possible – students from all over
Slovakia have answered. The sample is comprised of 100 students from private universities
and 100 students from public universities, not only from Bratislava but also from Zilina,
Banska Bystrica, Zvolen, Kosice, etc. Thanks to their answers, it is possible to assess and
compare the differences between the public and private university types.
The analysis consists of comparing and cross-referencing the acquired sets of data in
order to extract the underlying information and discover further implications. After the
comparison of public and private university sets of data, a SWOT analysis table was created to
highlight most important and interesting points. Due to insights gained from the research, it is
possible to create several recommendations. However, it is necessary to analyze the issue from
both sides. Therefore, one teacher from each type of university was interviewed on issues that
students do not have experience with. The interview section will be merely illustrative as it
was not possible to interview a larger number of teachers.

24
Analysis of Student Survey Results
The first question in the survey asked students whether they were from public or
private schools or whether they tried both. Results showed that all students selecting “tried
both” transitioned from public higher education institutions to private ones. Therefore, all the
“tried both” students will be considered as a part of the “private” batch of students – their
answers to the survey were ones describing the more recent institutions they attended (private
ones). Perhaps a few illustrative quotes from personal interviews with students that “tried
both”, may give a little insight to why all these students changed from public to private
universities and will show the importance and need for assessing the differences between these
institutions. All students were promised anonymity (taking part in the survey and personal
interviews). One student that currently attends a private university transferred from Comenius
University. She explained, “our preparations for exams consisted of memorizing countless
pages of text provided by the teacher, and on the actual exam we had to fill in the blanks from
the text we were supposed to memorize”. Another student transferred from the Economic
University described his reasons for leaving as “the students services staff was absolutely
uncooperative, the teachers seemed to make it intentionally harder for students and mostly
focused on the theoretical side,” leaving the students with no added value from their lessons.
The analysis of the results from this survey should point to the differences and
problems in each type of institutions as perceived by the students, the institutions’
“customers”. The results should also provide good basis for comparison and assessment of
each university type.
The questionnaire was very short, with simple questions touching as many relevant
university areas as possible. Without these specific features, it would have been much more
difficult to get as many students to participate in the survey voluntarily (these assumptions are
based on the positive feedback from sample students). Due to its simplicity, the questionnaire
touches only the “surface” of each interest area. The combination of these results will create
an opportunity to understand the researched issue further. The analysis of the results will be
organized into different sections: General, Study Program, Teachers, Student Services &
Facilities and Marketing. Once these were explained and described, an overall SWOT analysis

25
was created. Also, it is important to note that all of the numbers can be directly transformed to
percentages as the sample was exactly 100 students for each type of university.
(All graphs in the following sections were created with data from student survey results unless
stated otherwise.)
General
In this section, the general demographics of sample students will be described (public
and private results will be treated separately as an exception). The first seven questions in the
survey asked students about the type of university they attend (or attended) to, the name of the
university, form of study, current academic or professional occupation, age, primary focus of
their studies and finally the annual tuition fees.
Public
First we will focus on the 100 sample students that have answered they study at public
universities in Slovakia. Public university students are spread out all over Slovakia, so the
general opinion of these students put together should be interesting and fairly accurate. The
majority of sample students study at the Comenius University in Bratislava (33), the Slovak
Technical University as well in Bratislava (17) and at University of Zilina in Zilina (17). Then,
the next largest groups of sample students study at Economic University in Bratislava (14) and
the University of Matej Bel in Banska Bystrica (12). The smallest numbers of sample students
were spread among 4 different universities: the University of Constantine the Philosopher in
Nitra (3), Technical University in Zvolen (2), University of A.Dubcek in Trencin (1) and the
University of Trnava in Trnava (1). 95% of all of these students are following a university
study program in the “daily” form; they have to attend classes several times a week as opposed
to the 5% that study “externally”. Depending on the type of university policies and programs
the external students have evening classes once a week or less.
As for their current academic or professional occupation, the question enquired about
how far they are in their higher education studies and whether they have time to work along
the way, or whether they have already finished studying and only focus on work. 54% of
respondents are still studying for their Bachelor’s degrees; however out of those, 8% manage
to go to work along their studies. 41% of respondents have already finished their Bachelor’s
26
degrees and are now studying for Master’s degrees – only 6% of Master students have a job as
well. There is also 3% of doctorate students with 1% that also has time to work. The last 2%
of respondents are ones that have already finished their studies at a public university and focus
on work.
The question about age does not provide much insight on its own, so it was cross
referenced with the academic or professional occupations of students that are mentioned in the
previous paragraph. The first age category is 18 to 21 years old in which all students are
studying for Bachelor’s degrees (23) and two of those also go to work. The majority of
respondents fit in the next age category which is 22 to 25 years (71). Out of those 29 are
currently progressing on their Bachelor’s degrees and a few of those also have a job. Then the
next category, 22 to 25 year olds, consists of Master’s degree students (39) with also a few
that go to work. There are also two that are already working on their Doctorates and one that
has finished studies and is employed. The last age category is 26 to 29 year olds with 6
students out of which 2 are working on their Bachelor’s degrees and one also goes to work, 2
that are in the Master’s degree program, 1 that is preparing his Doctorate and is employed. The
last respondent has already finished his studies and has a job. There was a last option available
as “30+ (30 included)”, but no one from the public universities fit in that one.
The following question asked respondents to choose the primary focus of their studies.
After comparing various questionnaires, the study categories were separated to “Humanities &
Law”, “Sciences & Engineering”, “Business & Economics” and “Other” – the first two have
further specifications in parentheses (see questionnaire). The largest number of students
studies “Sciences & Engineering” (42), then “Humanities & Law” is the second most popular
category with 27 students and the last is “Business & Economics” with 24 students. The last 7
students have selected “other” as they felt that neither of those categories described their
studies well enough, e.g. industrial management, logistics, foreign languages & intercultural
communication, translation, etc.
Lastly, the tuition fees are perhaps one of the main differences between the two types
of universities. Majority of students (84) does not have any tuition fees, 12% pays tuition fees
just under €1000 and only 4% pays from €3000 to €5000.

27
Private
In the same manner, the 100 private university students will be described and analyzed.
However, most respondents were from universities in Bratislava, possibly due to the fact there
is the highest concentration of private universities in Slovakia, (PortalVs, 2014). Most
respondents are from City University of Seattle/School of Management (56) and Paneuropean
University (33) both in Bratislava. Then there was a few respondents from City University of
Seattle in Trencin/School of Management (8), School of Security Management in Kosice (3),
University in Sladkovicovo (1). More interestingly, there seems to be quite a change in the
proportion of students studying “daily” and “externally”, for the private university the
proportion is 80 to 20 as in the public it was 95 to 5.
For the private universities, the distribution of students’ academic and professional
occupations is quite different. Most students are still in the process of completing their
Bachelor’s degrees (75), as most of the respondents come from City University of Seattle
which has a 4 year-degree. However, out of the undergraduate students 19 also go to work (as
opposed to the public university 8). In the next category, 19 students are working on Master’s
degrees out of which only 2 also work. There are no private university Doctorate students that
have responded to the survey, but there are last 6 respondents that have finished studies and go
to work.
The age distribution cross referenced with the academic and/or professional occupation
the respondents are currently involved in is similar to the public university institutions. 16
respondents were from the youngest age group, all of which are working for a Bachelor’s
degree – out of these only 4 have jobs as well. The 22 to 25 age group has the most
respondents (66), with 53 students completing their Bachelor’s degrees (out of that 11 also
work), 12 are in the process of finishing their Master’s degrees and 1 respondent has finished
his degree and currently works. There is 4 more respondents from private institutions within
the ages of 26 and 29 than from the public university: 6 Master’s degrees (2 also work), 1
Bachelor’s degree and 3 that currently work. There is also 8 respondents from the 30+
category (for private universities there were none). 5 of these respondents are Bachelor’s
degree students with 2 that also have jobs, 1 is a Master’s student and the last 2 work.
28
The primary focus of most private students is divided between “Business &
Economics” (71) and “Humanities & Law” (26). There does not seem to be a popular “Science
& Engineering” program in private universities; the number of respondents is 0. The
Paneuropean University offers an IT course but it has only been accredited in July 2012,
(Paneuropean University, 2013). “Other” responses were selected by students of Security
Management (2) and Mass Media Communications (1). Based on these answers and personal
experience, it is possible to assume there is lower variety of study programs offered in private
universities, when compared to public ones.
The tuition fees for private university students are remarkably higher – only 3% pays
less than €1000. The majority of 96% pays €1000 to €3000 and only 1% of students have to
pay fees from €3000 to €5000.
To conclude this section, certain explanations are required. In the first paragraph of the
“Private” part, the great difference between proportions of daily and external students among
the two university types was underlined. Private universities seem to have more developed
external study methods than the public universities do, though this assumption will be further
supported by research in the SWOT analysis. Also, the reason for emphasizing in the “age”
paragraph the fact that there have been less (or no) respondents for the older categories in the
public universities, was to point out the possible implication of private universities being more
convenient and flexible for “older students”. The largest is the financial difference where most
public university students do not have to pay any fees and most private university students
have to pay from €1000 to €3000.
Study Program
There were specifically 4 questions addressing the study program. They inspect the
frequency of students’ studying, whether there is enough course material provided for them to
study with, their satisfaction with the program and finally, whether they felt their program was
rather practical or theoretical. In the following section, public and private university students’
answers will be compared directly.
The frequency of studying question has many possibilities and combinations of
responses as the students were required to choose one or more statements that corresponds to

29
how often they study and why (examinations or projects/presentations). The answer options in
the question were built in a manner, to find out whether students have to study frequently or
only before exams and evaluations, and on the other hand whether they have to work on
projects, papers or presentations often or not.
Public university students have answered in majority that they only study before exams
(47). However, out of those 26 often work on “papers, projects and presentations” as stated in
the questionnaire. 44 students have selected they “study regularly (at least every week)” from
which only 17 students have frequent paper, project or presentation assignments. The last 9
students have answered they only have to focus on doing the various assignments. In
comparison, private university students mostly have to study regularly (57), out of which 41
also have to also work on projects, papers and presentations. Only 31 students study right
before exams and 21 of those rarely receive any extra assignments. Finally, 12 students only
focus on completing various assignments. These categories are displayed in the following
graphs, for a clearer view the categories with “+A” or “+R” mean that students have to often
complete various assignments (+A) or that they rarely have to complete extra assignments
(+R).
21%
26% 27%
17% 9%
Public - Study Frequency
only before exams
only before exams + A
regularly
regularly + A
just assignments

30
It seems that studying frequencies among these two types of universities are quite
opposite. In public universities, the larger half of respondents only studies before exams but
most has frequent assignments and projects. The smaller half studies regularly, but rarely has
extra assignments. In private universities, the majority of students have to study regularly and
often complete projects and assignments and a small number only studies before exams
without having to do any projects.
The following question examines the amount of material received by students from the
university and whether it is enough to “succeed in their studies”. Initially, they were separated
into those who answered that have “enough course material”, “always have to research for
more” and those who “do both”. Subsequently, they were also divided by their primary study
focus, creating a cross reference of which study field has to research and how much.
Respondents from public universities are usually not satisfied with the amount of information
they have – 29 selected they always need to do more research, 25 said they always “do both”
[have enough course material, but tend to also research]. 46% students have responded the
university always provides enough course material for studying. In private universities it is
almost exactly divided in two halves – 51% said they have enough material from the school,
and from the remaining 49% most students “do both” (35) and the rest always has to research
for more (14). So it seems that public and private universities are both divided roughly in half
between those who believe they have enough course material and those who do not.
10%
21%
16% 41%
12%
Private - Study Frequency
only before exams
only before exams + R
regularly
regularly + A
just assignments

31
When cross-referenced, most “Business & Economics” students on public universities
have enough study material and thus do not have to research further (13 out of 18, 72.23% ).
The “Science & Engineering” students seem to have enough material (23 out of 42, 54.76%),
but a large number also has to do extra research (14 out of 42, 33.34%). For the “Humanities
& Law” it is quite evenly separated: 37.03% of students “does both,” studies from course
material and researches online. Then, 33.34% always has to research for more and 29.63% has
enough course material to study. As for the “Other” category respondents 5 out of 7 have
answered they do more research even though they have enough course material (71.43%).
46%
29%
25%
Public - Course Material
enough material need more research both
51%
14%
35%
Private - Course Material
enough material need more research both

32
Private university students have less variety as there are no “Science & Engineering”
focus students. Concerning the “Business & Economics” focus, most students have selected
they have enough course material (47.89%), but a large number tends to follow up with
research despite the sufficient amount of study material and thus has selected “I do both”
(40.85%). Only 11.27% feels they always have to research more material in order to succeed
in their studies. Most of “Humanities & Law” students also feel they have enough material to
succeed (53.85%). Though, there is an equal amount of students in these disciplines that “do
both” and those who feel they always have to “research for more” information (23.08%). The
ones that chose “Other” (3) as study primary focus of study have all selected that they have
enough course material to study with.
Once all the answers are put together, it seems that both types of universities provide
enough material for students to succeed in their studies, but public university students seem to
be rather skeptical and often research more even though they already have enough
information.
In the next few questions (also in other topic sections), respondents will be asked to
grade their satisfaction on a scale from 0 to 5. The grades’ meaning has been chosen after
studying various examples of grading scales: 0 – not satisfied at all, 1 – very dissatisfied, 2 –
dissatisfied, 3 – acceptable/average situation, 4 – satisfied, 5 – very satisfied. The 0 grade does
not often appear on these types of grading scales, however due to academic curiosity an extra
grade was added to find out whether there are any cases of “extreme dissatisfaction” as well as
to give students the opportunity to express their true opinions on the state of their universities.
The aggregate of survey results shows the 0 grade has been used several times by public
university students and not once by private university students.
The first question with a grading scale interrogates respondents about their overall
satisfaction with the program (please see chart “Study Program”). Overall, private university
students seem to be much more satisfied with their program than their public counterparts.
None of private university students have selected grades 0 or 1 and only 6 have selected the
grade 2 “dissatisfied”. 28% of public university students show great dissatisfaction with the
program as 8 have chosen the grade 1, “very dissatisfied” and 20 have chosen grade 2,
dissatisfied. Though, they have in common the amount of students that consider this situation

33
“acceptable” or “average” and graded 3 – public (37), private (31). However, the amount of 4
and 5 grades in private universities is almost the double of public ones. Only 25 public
university students have chosen a “4” on the satisfaction scale as opposed to 44 of private
university respondents. Similarly, 10 public university students chose 5, as “very satisfied”
with their program which is a small number compared to the 19 private university students
that have responded with this grade as well.
(**, *, See “List of Terms”)
0
5
10
15
20
25
30
35
40
45
0 1 2 3 4 5
Private
Public
Study Program
Type of
university** (y)
Grade*(x) Private Public
0 0 0
1 0 8
2 6 20
3 31 37
4 44 25
5 19 10
34
The last question in this section asks students whether their program is rather
theoretical, practical or an exact balance of the first two options. Responses to the question
from both types of students are very insightful and provide an idea of public and private
universities’ strengths and weaknesses. A large number of public university students answered
their study program is “mostly theoretical” (63). When the number is split in half, it is still
larger than the number of private university students, that answered they also have “mostly
theoretical” study programs (28). One public university student chose to add an answer
through “Other” and wrote his program was purely theoretical. Though, it may be interesting
to note that the majority of the 28 private university students are enrolled in Paneuropean
University, which offers a Law degree and more than half of the mentioned students have
selected “Humanities & Law” in the earlier question.
However, 21 public university students feel their programs are the exact balance of
both theoretical and practical forms of study. On the other hand, this is a predominant option
for private university students where almost half (43) suggests their studies are in “exact
balance”. There is also roughly a third (29) of students from private institutions that said their
study program is “mostly practical”. It is nearly a half of that in public universities (13). Two
more students from the public type of university have chosen to add a different answer. One
elaborated that his program is “1/3 practical and 2/3 theoretical”; the other one explained the
first 3 years of his studies were theoretical and the last two practical.
Once these numbers are compared, the visible trend is that most public university
students appear to have rather theoretical study programs and private university students seem
to have a “good balance” or rather practical types of programs.
Teachers
To examine and identify teaching differences between private and public universities,
students were first asked to evaluate their satisfaction with “quality of teachers and their
teaching manners” on the aforementioned graded scale. In the next question the focus was on
the interaction with teachers - can students ask questions during class or do they have to wait
till the end to speak with teachers? Does the teacher interact with many students during class

35
or is he the only one to speak? These were examples of options offered in the last “teachers”
question.
The students’ grading results for teachers were quite different between the two types of
universities. The results of public university students correspond to an almost normal
distribution (also slightly skewed to the right) and the private university student results are
skewed to the left (please see chart “Teachers”). In this case, it means the peak of the
distribution is provoked by the fact that most public university students have selected the
grade 3 – their satisfaction is average. Then, the number of students that have selected grades
on each side of “3”, is lower as it progresses to each end. To be more specific, there is 43
students that have selected the grade 3. Then there is 25 students that selected grade 2 and15
that selected grade 4. Finally, there are 14 students that have graded teachers with the number
1 and only 3 students that graded them with “very satisfied”, 5.
The left skewing data of private university students’ satisfaction can be explained by
most students being more than “averagely satisfied” as opposed to public university students.
None of the 100 students from private university students were “very dissatisfied” with their
teacher and graded them with “1”. There were only 5% of students that used the grade 2 (it is
five times less than the number of public university students). The number of “averagely
satisfied” private university students is close to half (26) of the public university students (43).
The majority of private university students have selected a grade 4 (54 students) and 5 (15
students) to evaluate their teachers – this means most is “satisfied” or “very satisfied”. So the
peak of the private university evaluation distribution is just one grade point (grade 4) above
the public university one (grade 3).

36
Type of university**
(y)
Grade*(x) Private Public
0 0 0
1 0 14
2 5 25
3 26 43
4 54 15
5 15 3
(**, *, See “List of Terms”)
The second teacher-themed question inquired about teachers’ interaction with students.
A large number of students in both types of universities selected that they can ask questions
during class, but otherwise the teacher does not interact further with them; he is the only one
to speak (42 public and 38 private university students). In case of need of further discussion or
deeper explanation, students can arrange meetings or follow up after class. However, a very
positive side of these results is the fact that a large portion of both types of students have
teachers that interact with many of them and the flow of questions functions both ways. In
public universities, 38% of students have interactive lessons with various questions and
discussions. On the other hand, 58% students from private universities have similarly
interactive teachers. As for the not so interactive teachers in public universities, 11 students
have selected that they have to schedule a meeting and 4 that have to wait until the end of
0
10
20
30
40
50
60
0 1 2 3 4 5
Private
Public
Teachers

37
class. For private university students, these numbers are 3 and 1. The last possible option was
to choose, that during class “only the teacher talks” with no possibility of asking questions or
interaction – 5 public university students have chosen this and none of the private university
students.
To sum up, most public university students consider their teachers average or worse
than average. On the flipside, most private university students believe their teachers are above
average and are satisfied with them. As for the interaction between students and teachers, it
44%
40%
12%
4%
Teacher-Student Interaction Public
ask questions
interactive lesson
schedule meeting
after class
38%
58%
3% 1%
Teacher-Student Interaction Private
ask questions
interactive lesson
schedule meeting
after class
38
seems to be more balanced. Roughly 40% of students from both universities can ask questions
during class but do not interact with the teacher further. Though there is also a large number of
all students, that have interactive teachers and lessons where they can communicate more
deeply as opposed to a simple “question-answer” dialogue. This is the case for less than half
of public university students and more than half of private university students.
Student Services & Facilities
Among the important parts of the university are the facilities along with the equipment
and the administrative staff that provides required university services and information. The
facilities and equipment are for example laboratories, classrooms, libraries, student spaces,
bathrooms, etc. The student staff and their services take care of and provide Erasmus exchange
opportunities, financial support, administrative documents and advice, schedules, etc. The
sample students had to grade their satisfaction with the “availability and functioning of student
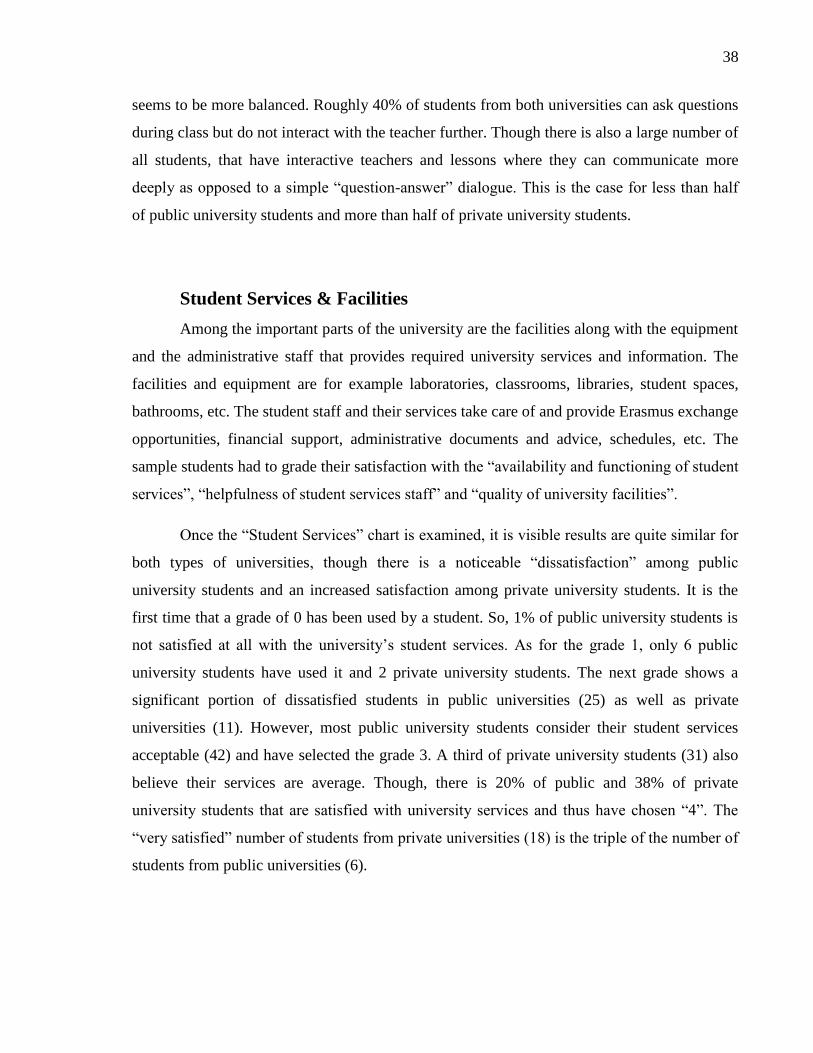
services”, “helpfulness of student services staff” and “quality of university facilities”.
Once the “Student Services” chart is examined, it is visible results are quite similar for
both types of universities, though there is a noticeable “dissatisfaction” among public
university students and an increased satisfaction among private university students. It is the
first time that a grade of 0 has been used by a student. So, 1% of public university students is
not satisfied at all with the university’s student services. As for the grade 1, only 6 public
university students have used it and 2 private university students. The next grade shows a
significant portion of dissatisfied students in public universities (25) as well as private
universities (11). However, most public university students consider their student services
acceptable (42) and have selected the grade 3. A third of private university students (31) also
believe their services are average. Though, there is 20% of public and 38% of private
university students that are satisfied with university services and thus have chosen “4”. The
“very satisfied” number of students from private universities (18) is the triple of the number of
students from public universities (6).

39
Type of
university** (y)
Grade*(x) Private Public
0 0 1
1 2 6
2 11 25
3 31 42
4 38 20
5 18 6
(**, *, See “List of Terms”)
The next question was specifically focused on the student services staff. 3 students
from public universities used a “0” to display the level of their satisfaction. Even with these
low grades, the overall outcome was rather positive (please see “Student Services Staff”
chart). Public and private universities have very similar number for grade “3” and “4”. 33
public and 28 private students believe the student services staff to be average. A more
interesting outcome is that 33 of public and 33 of private university students are “satisfied”
with the staff. The differences become significant when examining other grades – more public
university students have graded below 3 and more private university students have graded
0
5
10
15
20
25
30
35
40
45
0 1 2 3 4 5
Private
Public
Student Services

40
above 3. The number of private university students (25) that are “very satisfied” with the
student services staff is five times larger than the number of public university students (5).
Looking at the below average end of the scale, the number of public university students (20)
that have selected the grade 2 is more than the double of the private university students (9) that
have selected the same grade. As for the “very dissatisfied” grade 1, the number of public
students (11) is five times as large as the number of private university students (2).
(**, *, See “List of Terms”)
0
5
10
15
20
25
30
35
0 1 2 3 4 5
Private
Public
Student Services Staff
Type of
university** (y)
Grade*(x) Private Public
0 0 3
1 2 11
2 9 20
3 31 28
4 33 33
5 25 5

41
The last topic in this section analyzes the satisfaction with the quality of facilities. The
results are highly similar to the ones in the previous question. Most students from both types
of universities have selected grades 3 and 4. The amount of students that graded accordingly is
32 and 36 for private universities, 35 and 31 for public universities. Moreover, there is twice
the number of private university students (23) that are “very satisfied” with the facilities and
chose the grade 5 than the number of public university students (9). As for the below average
grades: 10, 13 and 2 public university students have chosen grades 2, 1 and 0. For private
university students, these numbers are 7, 2 and 0.
To conclude, there is 1/4 of public university students that are dissatisfied with their
services, for private university students it is less than half of that. Though on the other hand,
when considering the number of public university students that are “satisfied” with student
services, the number of “satisfied” private university students is twice as large.
Also, the student services staff has received a better grading – most students from both
types of universities consider staff average or above average. However, there is a 20-30% part
of students from each type of university that stands out. In public universities the mentioned
part of students has selected grades 1 and 2 as for the 20-30% part of students from private
universities have selected a grade of 5. Therefore, it is possible to assume that private
universities have a higher satisfaction rate concerning the services and staff than the public
universities do.
The same description applies to the satisfaction with quality of facilities question –
most students from both types of universities were satisfied but a significant portion of
students from public universities was rather dissatisfied and a portion of students from private
universities was rather satisfied. (Please consult chart “Quality of Facilities”).
42
(**, *, See “List of Terms”)
Marketing
The last practical comparison section for these universities is regarding marketing. The
students were asked about their university’s marketing practices and whether they should
increase or decrease them.
33 public university students answered their university does “a lot of advertising” and
53 answered that it does “no advertising”. Then 9, had no idea whether the university does
0
5
10
15
20
25
30
35
40
0 1 2 3 4 5
Private
Public
Quality of Facilities
Type of
university** (y)
Grade*(x) Private Public
0 0 2
1 2 13
2 7 10
3 32 35
4 36 31
5 23 9

43
any advertising or not and 5 have selected “other”. Among the “other” options were
alternative marketing channels such as “website”, “high school competitions”, etc. Though, 80
of private university sample students have selected their university does “a lot of advertising”
and only 9 have selected “no advertising”. 11 students chose “other”, out of which 7 explained
university’s advertising is “not appropriate” and “could be better”. The remaining 4 believe
the advertising expenses are “reasonable”.
The answers to the last question of whether the university should advertise more or not
are quite varied. For the public university it is almost half and half. 45 students believes the
university should invest more into advertising, 51 believes it should not and the remaining 4
believe it should invest into the program quality along with international exchange
partnerships. Students from private universities mostly believe the university should invest
more into advertising (53), a few believe it should stay at the same level (11) and almost a
third does not believe the university should invest more into advertising (29). There are a few
students that suggested the university invests more into quality (4) and the remaining 3 are not
sure about what the university should do.
In the marketing area, universities’ strategies and activities greatly differ. The majority
of private universities invest into advertising and the majority of public universities does not.
For both types of universities, students are almost split in half between the ones that believe
the university should invest into advertising and those who do not.

44
SWOT Analysis
The following analysis will examine the strengths, weaknesses, threats and
opportunities of the two types of universities. The public and private universities will be
treated separately, starting by the positive points – strengths and opportunities, and followed
by the negative points – weaknesses and threats.
Public
Strengths
- Larger variety of study programs
- Stronger and more numerous partnerships with international universities, thus better
Erasmus options
- The majority of students (not enrolled in “Law & Humanities” ) are satisfied with the
amount of course material provided
- 1/3 of students is satisfied above average with the quality of their study program
- ~20% students have an exact balance of practical and theoretical applications in their
programs; ~ 10% have a mostly practical study experience
- ~ 20% considers the quality of teachers to be above average
- All students can communicate and ask for explanations during class
- ~ 40% has interactive lessons where teachers communicate back and forth with many
students
- 1/4 of students show a more than average satisfaction with student services
- ~ 40% is satisfied above average (grades 4 and 5) with student services staff as well as
with the quality of facilities
Opportunities
- More easily recognized by other universities usually due to age and historical
reputation
- More research opportunities due to greater number of projects, larger departments and
facilities

45
Weaknesses
- External study methods are outdated when compared to private universities (no
possibility of only online education)
- Teaching system created in a manner where 1/2 of students only studies before exams
and the other 1/2 studies regularly without any assignments – not diversified form of
education
- Several students using grade “0” in satisfaction questions – universities should take
care of these issues as soon as possible
- 1/4 of students is dissatisfied with the quality of their study program
- ~ 65% experiences a rather theoretical form of education with no practical applications
- 1/3 believes their teachers and teaching manners are below average and thus are
unsatisfied
- ~ 30% is dissatisfied with student services as well as the staff and gave grades below 3
- 1/4 is equally unsatisfied with the state and quality of facilities
Threats
- Public universities are usually very large and old, so it is harder and more complicated
to implement and apply new policies and various changes
- Almost no advertising – students might not find out about the possible advantages of
these universities and thus might not be attracted
Private
Strengths
- More evolved external study programs (possibility of accomplishing the whole degree
online), thus there is an increased flexibility of studies for older students
- Diversified form of education – 1/2 of students has to often work on various
assignments such as group projects, papers, presentations, etc.
- 1/2 of students are satisfied with the provided course material
- ~ 65% have selected they are either “satisfied” or “very satisfied” with the quality of
the program
- ~ 45% are convinced their program is an exact balance between practical and
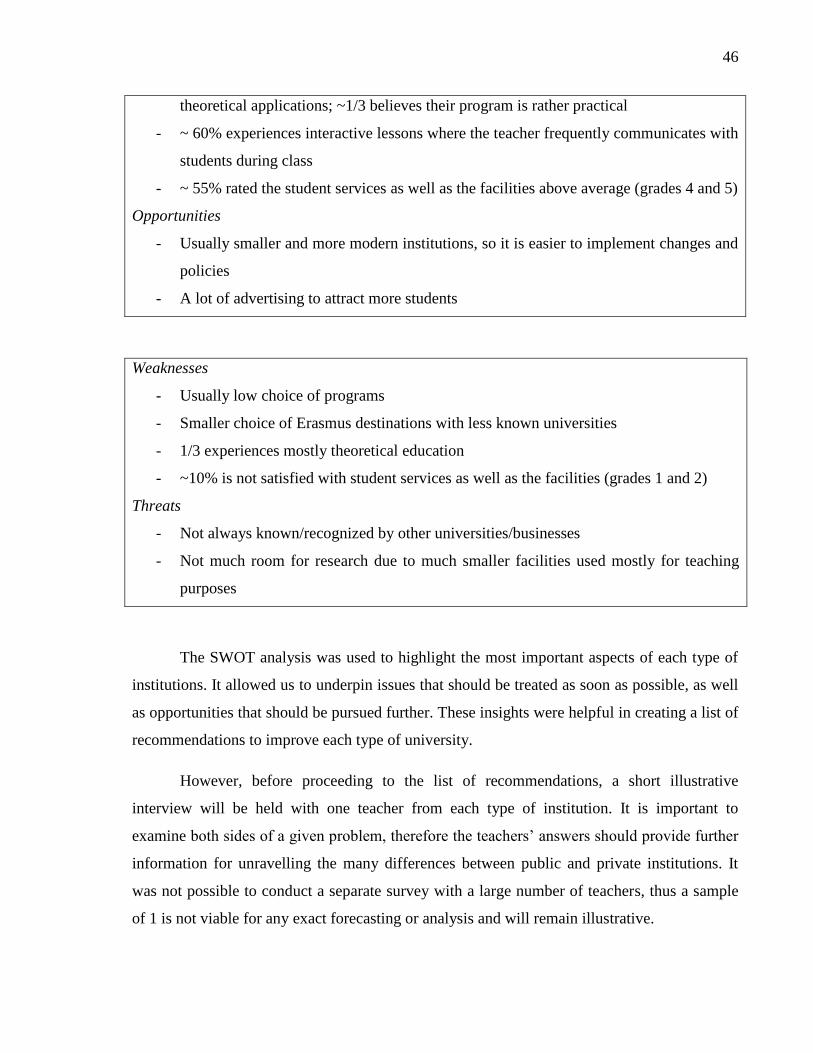
46
theoretical applications; ~1/3 believes their program is rather practical
- ~ 60% experiences interactive lessons where the teacher frequently communicates with
students during class
- ~ 55% rated the student services as well as the facilities above average (grades 4 and 5)
Opportunities
- Usually smaller and more modern institutions, so it is easier to implement changes and
policies
- A lot of advertising to attract more students
Weaknesses
- Usually low choice of programs
- Smaller choice of Erasmus destinations with less known universities
- 1/3 experiences mostly theoretical education
- ~10% is not satisfied with student services as well as the facilities (grades 1 and 2)
Threats
- Not always known/recognized by other universities/businesses
- Not much room for research due to much smaller facilities used mostly for teaching
purposes
The SWOT analysis was used to highlight the most important aspects of each type of
institutions. It allowed us to underpin issues that should be treated as soon as possible, as well
as opportunities that should be pursued further. These insights were helpful in creating a list of
recommendations to improve each type of university.
However, before proceeding to the list of recommendations, a short illustrative
interview will be held with one teacher from each type of institution. It is important to
examine both sides of a given problem, therefore the teachers’ answers should provide further
information for unravelling the many differences between public and private institutions. It
was not possible to conduct a separate survey with a large number of teachers, thus a sample
of 1 is not viable for any exact forecasting or analysis and will remain illustrative.
47
Illustrative Teacher Interviews
Both instructors were promised anonymity, thus their names will not be used or
mentioned in the thesis. Below, a transcript of the interviews will follow. The questions or
topic areas will be clearly stated and alternated with paraphrased answers and concepts
explained by the instructors during the interview.
In the following section, two volunteer instructors will be introduced, to show a
different perspective with observations from an “employee” point of view as opposed to a
“customer” point of view provided by the students.
The first area of interest was the satisfaction with the management of the university.
The public university teacher said clearly she was “unhappy” with the management as it is
highly inefficient. The organizational structure is very complex and unclear. There are many
departments that teachers themselves do not even know about or what they are used for. Hand
in hand goes a “redundancy” of work as several employees in different departments seem to
have an identical function and thus do the same work twice. Therefore, the instructor believes
the school would function much better if there would be a much simpler structure with a
smaller number of departments. Also, the administrative section is larger than needed – many
processes could be outsourced to different companies to increase efficiency a lower
bureaucracy at the university. At the private university, the situation is quite different. The
instructor was very satisfied with its functioning and organization. The management focuses
only on the administrative part, pricing, scheduling and overall functioning. Then there are
cathedral heads that control content and teachers responsibilities.
The next question revolved around the financial and “other evaluation” of their work.
The answer was very short and negative from the public university instructor – “unsatisfied”.
The pay is extremely low, it is not enough to take care of a family. Bonuses are usually not
offered and in case there is a bonus it is roughly €20-€30. As for other evaluation, the teachers
do not feel appreciated as they are rarely rewarded. According to the private university
teacher, the wage has not changed in at least the past 5 years. He too, does not feel appreciated
by the university or the government from which it is hard to receive any grants or funds. The
salary is most probably slightly higher for the private university teachers, but not by much -
the teaching is just one of their jobs.
48
The following area questioned the satisfaction with job duties and responsibilities and
whether there are any special duties except teaching, grading and evaluating. The public
university instructor explained that almost all teachers have responsibilities divided into two
halves: 50% of their responsibilities are all the activities needed for teaching and the other
50% into helping with bachelor and master theses. The private university teacher elaborates
that they do not have any extra duties, but it depends on the type of teacher whether he/she is
willing to go the “extra-mile”. It means whether the teacher makes an effort above the
“minimum requirement”.
Teachers were also asked about the flexibility of the university. The public university
is very flexible about the presentation of content depending to which students they are
presented (also depending on the year and program they are in). However, they are not flexible
at all with the schedules for teachers – the teacher has no say in how the schedules are
organized, only in special situations the instructor can demand to not teach past a specific
hour. This applies for class and examination schedules. As for the private university instructor,
he was very satisfied with the flexibility – the university fully adapts to him, he can choose the
schedules and amount of classes he is willing to teach. The university is the one to ask
teachers when it is convenient for them and it understands the wages could be better; therefore
it does not stop teachers from external work.
Then the discussion headed toward one of the most important areas – motivation. It is
important for teachers in Slovakia to be motivated as they are the ones that are responsible for
“transferring knowledge” to our students. It is generally known, that a non-motivated
individual is usually less productive and does not achieve a full potential. It seems this is a
profound problem at both types of universities. The public university instructor said she is the
absolute opposite of motivated and that the university is not paying attention to this issue or
trying to improve this. The private university teacher also said there is no effort to motivate
them. One more thing they have in common is the university asking them to do “extra-
activities” like conferences, recruiting students for various programs, presentations, etc. These
activities are never rewarded financially or otherwise, so the teachers feel they are doing the
university a “mandatory favor”.

49
One of the primary parts of being an instructor, is the communication and relationship
with students: is it a dialogue or a speech? Does the teacher know the students’ names and
how much contact information does he/she provide them with? The public university teacher
explained it depends on the year the students are in (starting bachelor students or finishing
master students) – with freshmen it is a lesson of interactive explanations and questions and on
the other hand with senior students it is more of an intense discussion based on the current
topic or assignment. On the other hand, the private university teacher communicates more or
less the same with students in all years (also due to difference of education system). The
teacher creates a dialogue with the class: teaching and explaining the course material and
following up with questions directed at a number of students. Though, both teachers know
their students names and provide them with mobile phone and email contacts (also social
networks depending on their usage).
Interviewees were also asked about the presence of any specific guidelines for teaching
and required teaching techniques. Both teachers responded in the same manner. They receive a
methodic plan or “list of concepts” the students are required to know by the end of the course.
Otherwise, teachers at both types of institutions are free to teach according to their will.
Though, the private university teacher commented further that there is great emphasis from the
university to make sure all students are competent in the required outcomes and concepts.
The next question is concerning assignments and whether they are chosen by the
university or the teacher. Each type of university has an absolutely different way of executing
in this area. The public university teacher chooses all the assignments on her own. The private
university teacher has a professional course manager, that clarifies the outcomes and
requirements of the course for the teacher and prepares guidelines you have to follow –
number and type of assignments (case study, project, presentation, etc). So the private
university teachers have a bit more organized and easier task as opposed to the public
university teachers that receive no help and have to prepare everything for themselves.
As it is mentioned in the theoretical part, the average age of public university teachers
is very high, so the instructors were asked to comment on quality and age of their colleagues.
The public university instructor confirmed teachers at her university at very old. However, the
university needs them as they are the ones with highest and most prestigious titles which is

50
very helpful for the university’s accreditation. As for the quality, she described some of her
colleagues as brilliant, some not so good, though for the largest part they are “ok” or
“average”. The private university instructor explained the teachers are quite good, but it does
not matter as each of them does the “bare minimum” due to the low financial compensation.
Teachers only do what needs to be done as it is usually not their main source of income.
An institution could not function without its administrative section, thus the next topic
of interest was the efficiency of the school administration and its processes. At the public
university, the administration department is very extensive and bureaucratic as already
mentioned; therefore it is difficult to communicate with them. The public university instructor
shared a few experiences – any papers or documents take extremely long to get processed and
due to that she had to wait 4 years for a new computer in her office. She also suggested that if
there was a grading scale available from 1 to 5, she would choose the lowest one. On the other
hand the private university teacher is very satisfied with the professionalism of the
institutions’ administration. He says it is one of the best organized administrative departments
he experienced. From his point of view, this is due to a good organizational structure.
Communication with instructors is also very well executed. For example, he explained once
the schedules and number of classes are set, it does not move or change further (as opposed to
unexpected and tardy changes in other institutions).
A great part of education and academia is also research. The theoretical part discussed
the decreasing number of university teachers and students willing to do research for the
university. Both instructors disclosed interesting facts about the availability of research
opportunities and projects. On public universities, the participation in research and various
projects is mandatory. It is 50% of their financial evaluation – if they do not reach the quota of
number of articles or projects, they are paid less. However, if they do reach or surpass the
quota they are not rewarded. There is no motivation from the school whatsoever, therefore
teachers operate below their potential and Slovakia is losing great opportunities for research
and hidden talents. As for the private university teachers, research and projects are not
mandatory. It is hard to become part of these projects, though once they do, they are not
rewarded or paid for their expenses. Thus, once again both teachers feel like they are “doing a
favor” to the university.

51
In todays’ world, it is not possible to function without technology, even for teachers.
As a last question, they were asked to comment on the quality and satisfaction with IT systems
they are required to use for their jobs. The public university teacher said, she is happy that
there at least is one as they still use specific “booklets” to record students’ grades. She
explains their system has a lot of shortcomings, but it works so it is acceptable. The private
university instructor say the system has basic functions needed for the job, but nothing further.
He can use it to accomplish the needed tasks, so the system is “ok” but it could be better.
The final point of difference to observe between the universities is the student-teacher
evaluation. Public university instructors are not evaluated by the students unless they take the
initiative themselves. For private universities it is different since the students do have to pay
for the education, so the institution makes a larger effort to receive feedback. So for the private
university teacher, the student evaluation is mandatory.
Recommendations
Based on students’ answers and satisfaction, several trends that require improvement
were spotted. The order of recommendations will correspond to the “Analysis of Student
Survey Results” section.
Several short comings of both university types came to surface at the very beginning of
the analysis. Among the first issues that need improvement is the state of external or part-time
education systems at public universities. After consulting several “external students” and
various public university websites, it is not possible for students to complete a full degree
without attending the required classes. Public university external-education systems are ones
that usually require students to be present once a week or few times a month, several hours in
a row with all the different subjects in a row. When compared to some of the already available
private university external-education systems, it is fairly outdated. Though, it is important to
note that not all private universities have such an advanced external-study method. However,
those that do have advanced external-study methods are much more convenient than the public
university ones. Students usually do not have to be in class at all, as the class is held online in
the form of discussions and various assignments that require academic preparation. The only
times these students have to be present at a specific place is to write midterm and final

52
examinations. Therefore, one of the areas public universities should improve is the quality and
system of their external-education methods.
The following recommendation is one for private universities. As private universities
are often smaller in size and younger in age, they do not have yet established many university
partnerships and if they have, it is with not well known universities. Thus, private universities
do not often have access to the larger universities in Erasmus destinations, as the public
university students do. Thus, it might be fruitful for private universities to create contacts and
partnerships with larger and well-known universities if possible.
The next point requiring improvement is the form of the study program at public
universities. The survey results showed that a large number of students only need to study
before examinations and tests which are only a few times in one semester. It might be helpful
and more efficient, to create a more diversified study program for students – one where they
can work with real life simulations, more case studies, special group projects, presentations,
etc. It would also improve the situation of most students having only “theoretical knowledge”.
However, both public and private universities could intertwine the study program with
prepared working experiences in partnering companies.
Public university students are more dissatisfied with their teachers than private
university students. This might be cause by the old age of most teachers and their “outdated”
practices and teaching techniques. So one more suggestion for public universities would be to
try and recruit younger and experienced teachers.
Public universities should also try to improve their administrative department as
suggested by the interviewed instructor. It would speed up processes and improve employee
and student satisfaction.
Both types of universities, could work on improving their students services and how
efficient those are. For public universities, as mentioned in the interview, it would help to
reorganize the administrative section of the university and its processes. On the other hand,
smaller private universities could broaden the services they are offering.

53
Both types of universities should also find a way to improve the motivation of their
employees and contractors. Both teachers were dissatisfied and demotivated, therefore at least
an interpersonal motivation system should be established and an initiative created to improve
employee salaries. Demotivated teachers will not be able to motivate students.
Conclusion
The thesis started with a brief history of education in Slovakia offering a closer look at
its evolution in the past decades. The theoretical background then gave a broader overview of
the higher education industry worldwide allowing the comparison of Slovak republic with
other countries on their progress and expenditure in the higher education sector. Using the
European University Association (EUA) report, a detailed industry analysis described the
current state of Slovak universities with the focus on staff, financing and quality. The higher
education systems in Slovakia have greatly evolved through the years, but we still have not
reached the EU21 average, therefore a lot of modifications and progress is required.
Then in the practical section, the main goal was to identify the differences between
public and private university institutions. After a great deal of research these differences were
spotted and transformed into advantages and disadvantages for each type of university. In
light of the results, several recommendations were made, to improve the state and functioning
of each type. Therefore, as identifying and comparing differences was the primary goal of the
research, it is possible to say it was reached and taken further.
In conclusion, even though these institutions have several strong points, there is
always room for improvement. It is important for the Slovak Republic to at least reach the
EU21 average of quality education if we want our country and graduates to thrive in the future
labor market. Moreover, university institutions are the ones that drive and create the
“knowledge basis” of our nation as well as they support and develop talent; and thus every
effort should be made to increase the quality level of our institutions.

54
Resumé
Bakalárska práca obsahuje teoretickú a praktickú časť. Teoretická časť pozostáva
z krátkej histórie školstva so zameraním na vysoké školy, teoretického popisu a porovnania
s inými krajinami, a takisto z podrobnejšiej analýzy tejto oblasti.
Historická časť vykresľuje vývoj školstva na Slovensku (a Česko-Slovensku) od roku
1990 až do dnes. Spomína významné reformy akou bola Bolognská Deklarácia a aký mali
dopad na “vyššie vzdelávanie”. Jedným z najdôležitejších cieľov spomínanej deklarácie je
prispôsobiť vyučovacie techniky študentom viacej než učiteľom. Medzi hlavné ciele patrí aj
podpora “podnikateľského ducha” študentov a príprava mladých ľudí na rozvíjajúci sa
pracovný trh.
Teoretický popis vysvetľuje rozdiely medzi univerzitnými a neuniverzitnými
inštitúciami, nasleduje hlbší pohľad na čisto univerzitné inštitúcie. Sú v ňom opísané
požiadavky Európskej asociácie univerzít (EUA), tie musia spĺňať všetky inštitúcie, ktoré chcú
obdržat akreditáciu a stať sa univerzitou. Cieľom tejto práce je však porovnanie rozdielov
medzi súkromnými a verejnými vysokými školami; preto sú ďalej vysvetlené charakteristiky
týchto dvoch typov škôl. Okrem škôl je porovnaný aj finančný tok krajín v OECD a EU 21,
ktorý prebieha medzi štátnymi inštitúciami jednotlivých krajín a univerzitami, a taktiež medzi
súkromnými investormi a univerzitami. Napríklad na Slovensku je väčšina škôl financovaných
štátom, no financovanie súkromnými investormi narástlo o 9% od roku 2000 do 2010.
Rozdiely medzi krajinami sú veľmi výrazné: v škandinávskych krajinách je menej ako 5%
financovaných súkromnými investormi a zvyšok je hradený štátom. V krajinách ako je
Japonsko, Kanada a Austrália sa súkromné financovanie pohybuje okolo 40%, ale v Chile,
Južnej Kórei a Spojenom kráľovstve dosahuje až úrovne 70%. Kvôli ekonomickej kríze bolo
15 krajín OECD prinútenych znížiť financovanie škôl, a preto sú v tejto časti zachytené aj
zmeny vo výške financovania. Nasleduje pohľad na percentuálny podiel študentov
vstupujúcich na univerzitné vysoké školy, a takisto aj na vek študentov, v ktorom je tento
podiel najvyšší (špecifické znaky univerzitných a neuniverzitných vysokých škôl sú bližšie
vysvetlené v bakalárskej práci). Objasňuje, aké percento ľudí chodí na vysoké školy, a
v ktorom veku najväčšie množstvo študentov začína svoje vysoko školské štúdium .

55
V nasledujúcej sekcii teoretickej časti je podrobnejší opis a analýza oblasti školstva na
Slovensku. Výsledok meraní a prieskumu EUA zaradil v rebríčku Slovensko pod úroveň
priemeru krajín EU21. Odporučili, aby sa vláda Slovenskej republiky čo najrýchlejšie
zmobilizovala, a pripravila plán na dosiahnutie vyššieho financovania vo výskumnom sektore,
ktorý majú na starosť univerzitné vysoké školy. Vďaka zvýšenej výskumnej aktivite by
univerzity mohli zlepšiť svoje miesto v rebríčku európskych univerzít. Aby slovenské vysoké
školy dosiahli európsky priemer, musia tiež upraviť svoje akademické curriculum tak, aby
zodpovedalo novým štrukturálnym požiadavkam Európskej asociácie univerzít.
Analýza tejto oblasti pozostáva z dvoch častí. V prvej časti je uvedená
najväčšia prekážka vo zvyšovaní kvality slovenských vysokých škôl – vekový priemer
učiteľov sa pohybuje okolo 50 rokov a viac. Akademický personál bude treba z tohto dôvodu
čoskoro obnoviť – môže to však ovplyvniť a zabrzdiť budúci pedagogický a výskumný rast na
vysokých školách.
V druhej časti, ktorá je zameraná na slovenské univerzity a ich financovanie, je
spomínaný druhý najväčší problém podľa EUA: nízke financovanie súkromnými investormi.
EUA pripravila zoznam vecí, ktoré bránia zlepšeniu situácie so súkromným financovaním.
Prítomnosť týchto prekážok zhoršuje celkový akademický výkon univerzít.
Poslednou témou teoretickej časti je tzv. e-learning – možnosť študovať iba cez
internet. V EU sa o kvalitu e-learning programov stará nadácia EFQUEL. Táto nadácia vydáva
rôznym inštitúciám, agentúram a vysokým školám certifikáty o kvalite a kompletnosti ich
programu. Tieto certifikáty sú im udelené až po podrobnom preskúmani ich kvality a procesu
implementácie programov. Vďaka EFQUEL je možné presnejšie posúdiť, ako rýchlo sa e-
learningový trend vyvíja po celej Európe, a koľko inštitúcií v ktorých krajinách adoptovalo
túto novú formu výuky. V tejto časti sú vysvetlené typy implementácií e-learningových
programov a opísané druhy certifikátov od EFQUEL.
Praktická časť tejto bakalárskej práce pozostáva zo štyroch väčších celkov. Najskôr je
charakterizovaný spôsob a výsledky prieskumu. 100 študentov z verejných a 100 študentov zo
súkromných vysokých škôl vyplnilo dotazník, ktorého výsledky sú spracované v Analýze
výsledkov. Otázky a výsledky sú rozdelené do 5 kategórií: všeobecné, študijný program,
56
učitelia, študijné oddelenie a výbava a marketing. Každá kategória odkazuje na jeden aspekt
univerzít, v kontexte ktorého sú následne porovnané štátne inštitúcie so súkromnými.
Hlbšia analýza výsledkov prieskumu umožnila vyzdvihnutie pozitívnych a negatívnych
oblastí každého typu inštitúcie formou SWOT analýzy. Pre širší nadhľad a lepšiu ilustráciu
boli uskutočnené rozhovory s jedným učiteľom z obidvoch typov vysokých škôl. Otázky
a oblasti spomínané v rámci interview sa týkali spokojnosti s vedením, osobným a finančným
ohodnotením a administratívnymi procesmi. Otázky zahŕňali aj témy ako flexibilita školy,
vyučovacie metódy učiteľov a ich voľnosť a iné.
Na záver bolo možné predložiť vďaka nazbieraným informáciam návrhy na vylepšenie
určitých aspektov v oboch typoch univerzít.

57
References
EDEN. 2012. EDEN in a Nutshell. (2012). EDEN official website Dostupné na internete:
http://www.eden-online.org/introducing-eden.html (pdf)
EFQUEL. 2012a. About us. EFQUEL official website. Dostupné na internete:
http://efquel.org/aboutus/
EFQUEL. 2012b. How does UNIQUe help my institution? EFQUEL official website.
Dostupné na internete: http://unique.efquel.org/about/value-proposition/
EFQUEL. 2012c.The network dedicated to quality in technology enhanced learning. EFQUEL
official website. Dostupné na internete: http://efquel.org/membership/members-list/
Ehlers, U. 2009. E-Learning Quality in Higher Education in Europe. Dostupné na internete:
http://www.slideshare.net/uehlers/elearning-quality-in-higher-education-in-europe
EUA. 2013. Survey on E-learning in the European Higher Education Institutions. EUA official
website. Dostupné na internete: http://www.eua.be/eua-work-and-policy-area/building-the-
european-higher-education-area/e-learning/survey-on-e-learning.aspx
Jensen, H., Kralj,A., McQuillan D., Reichert S. 2008. The Slovak higher education system and
its research capacity. [EUA Sectoral Report, online]. European University Association.
OECD. 2013. Education at a Glance 2013:OECD Indicators. OECD Official Website.
Dostupné na internete: http://www.oecd.org/edu/ eag2013%20(eng)--
FINAL%2020%20June%202013.pdf
OECD. n.d. About. OECD official website. Dostupné na internete: http://www.oecd.org/about/
Paneuropean University. 2013. Akreditácia Bc. Štúdia. Official website of Paneuropean
University. Dostupné na internete: http://www.paneurouni.com/sk/fakulty/fakulta-
informatiky/o-fakulte/aktuality-podujatia/aktuality/akreditacia-bc-studia.html
Paneuropean University. 2013. Official website of Paneuropean University. Dostupné na
internete: http://www.paneurouni.com/sk/

58
PortalVs. 2014. Verejné vysoké školy, Štátne vysoké školy, Súkromné vysoké školy. Portál
vysokých škôl. Dostupné na internete: https://www.portalvs.sk/sk/informacie-o-vysokych-
skolach#sukromne
Psacharopoulos, G. 2004. Public versus private university systems. [DICE report, online].
Vysoká škola ekonómie a manažmentu. 2014. Official website of Vysoká škola ekonómie a
manažmentu. Dostupné na internete: http://www.vsemvs.sk/
Vysoká škola manažmentu. 2012. Official website of Vysoká škola manažmentu. Dostupné na
internete: http://www.vsm.sk
Vysoká škola bezpečnostného manažérstva. 2011. Official website of Vysoká škola
bezpečnostného manažérstva. Dostupné na internete: http://www.vsbm.sk/

59
Appendix - Sample questionnaire
The following questionnaire was copied from the original website it was created on:
https://docs.google.com/forms/d/1lZ6FeT7WCr0ji-TC78sWLUf389LhQKojVtd3lHGWfSo/viewform
Public & Private University Analysis
The survey is composed of 20 questions + 1 optional - there are check-boxes, multiple choice questions and a
short essay question.
This survey should help in identifying and exploring the differences of public and private university institutions.
The answers will support and provide information for the analysis of strengths and weaknesses of these
institutions.
* Required
I study/studied at a *
Public university
Private university
Tried both
Name of the university you attend(ed) *
Is the form of your studies: *
Daily (full-time)
Externally (via internet/part-time)
My current academic and/or professional occupation: *
Select the current degree or "work" or both.
Bachelor's degree
Master's degree
Doctorate
Work

60
Select an age category *
18 to 21
22 to 25
26 to 29
30 + (including 30)
Primary focus of your studies: *
Humanities & Law (Social Sciences, History, Philosophy, etc.)
Sciences & Engineering (IT, Biology, Medicine, Physics, Chemistry, etc. )
Business & Economics
Other:
Annual tuition fees : *
I do not have to pay any fees
Less than €1000
Over €1000 to €3000
Over €3000 to €5000
More than €5000
Other:
University program: Frequency of studying *
Please choose one or more options that describe your activities the best
I have to study regularly (at least every week)
I only need to study before exams and tests
I often write papers, projects and have presentations
I rarely have to work on papers, projects, presentations
I only write papers
I only have group projects
I only have presentations
Other:

61
Is the provided course material enough for succeeding in your studies? *
I have enough course material to study
I always have to research for more information
I do both
Other:
Overall satisfaction with quality of program *
Please grade your satisfaction on a scale from 0 to 5
0 1 2 3 4 5
Not satisfied
Select a value from a range of 0,Not satisfied , to 5,Very satisfied,.
Very satisfied
You believe your study program is rather theoretical or practical? *
(Practical: case studies, real-life simulations, etc.; Theoretical: only book knowledge is required)
Mostly theoretical
Mostly practical
Exact balance
Other:
Are you satisfied with quality of teachers and their teaching manners? *
Please grade your satisfaction on a scale from 0 to 5
0 1 2 3 4 5
Not satisfied
Select a value from a range of 0,Not satisfied, to 5,Very satisfied,.
Very satisfied

62
Interaction with teachers *
Please choose one or more options that describe your activities the best
I can ask the teacher any question during class
I can interact with the teacher only after class
I have to schedule a meeting with the teacher
During class, the teacher interacts with many students
During class, only the teacher speaks and students have to listen
Other:
Availability and functioning of student services *
Please grade your satisfaction on a scale from 0 to 5
0 1 2 3 4 5
Not satisfied
Select a value from a range of 0,Not satisfied, to 5,Very satisfied,.
Very satisfied
Helpfulness of student services staff *
Please grade your satisfaction on a scale from 0 to 5
0 1 2 3 4 5
Not satisfied
Select a value from a range of 0,Not satisfied, to 5,Very satisfied,.
Very satisfied
Quality of university facilities (library, laboratories, classrooms, bathrooms, student space,
etc.) *
Please grade your satisfaction on a scale from 0 to 5
0 1 2 3 4 5
Not satisfied
Select a value from a range of 0,Not satisfied, to 5,Very satisfied,.
Very satisfied

63
Does your university/faculty do any marketing? *
Please choose an answer for the first part of the question and an answer for the second part of the
question
Our university has paid for a lot of advertising
Our university has no advertising
Other:
Do you feel your university needs to invest into marketing? *
Please choose an answer that describes your opinion the best
I think the university should invest more into advertising
I think the university should not be investing into advertising
Other:
I am a *
Male
Female
Please add any additional comment or insight you may have regarding any of the previous questions.
(Do not forget to specify which question/topic).
Submit
Never submit passwords through Google Forms.
100%: You made it.