Tariff and Non-Tariff Barriers - Research and Information ...
BY GARRETT FITZGERALD AND CHRIS NELDER
EVGO FLEET AND TARIFF ANALYSISPHASE 1: CALIFORNIA
RO
CKY MOUNTAIN
INSTIT UTE
PUBLIC VERSION

EVgoFleetandTariffAnalysis|ii
AUTHORS & ACKNOWLEDGMENTS Authors Garrett Fitzgerald, Chris Nelder * Authors listed alphabetically. All authors are from Rocky Mountain Institute unless otherwise noted.
Contacts Chris Nelder ([email protected])
Garrett Fitzgerald ([email protected])
Acknowledgments The authors thank the following individuals for offering their insights and perspectives on this work, which
does not necessarily reflect their views.
Jim Lazar, Regulatory Assistance Project
Dan Cross-Call, RMI
Image courtesy of EVgo
About Rocky Mountain Institute Rocky Mountain Institute (RMI)—an independent nonprofit founded in 1982—transforms global energy use to
create a clean, prosperous, and secure low-carbon future. It engages businesses, communities, institutions, and
entrepreneurs to accelerate the adoption of market-based solutions that cost-effectively shift from fossil fuels to
efficiency and renewables. RMI has offices in Basalt and Boulder, Colorado; New York City; Washington, D.C.; and
Beijing.

EVgoFleetandTariffAnalysis|iii
TABLE OF CONTENTS
EXECUTIVE SUMMARY 1
FLEET AND TARIFF ANALYSIS 3
Analysis of Current EVgo Fleet Usage in California 3 Host categorization 4
EV and EVSE Growth Scenarios 5 Assumptions 5
Scenarios 5
How we represented the scenarios in the workbook model 8
EV Rate Design 10 Rate design theory 10
Summary analysis of new tariffs proposed by SCE and SDG&E 11
Analysis of current EVgo fleet electricity costs in California 16 Cost structure of current California EVSE fleet under current rates 16
Cost structure of current DCFC operation in California under alternative/proposed EV rates 17
Potential cost of future fleet under various rates by scenario 18
Recommendations 19 Public DCFC rate design theory/best practices 20
A social objective approach 22
How to moderate EVgo’s costs 22
Suggestions for further study 23
ENDNOTES 24
EVgoFleetandTariffAnalysis|iv
TABLE OF TABLES Table 1: Annual DCFC utilization and performance metrics by site host type __________________________________________________________ 4
Table 2: Manually defined parameter values in the scenario model _________________________________________________________________ 9
Table 3: Calculated parameter values in the scenario model ______________________________________________________________________ 9
Table 4: CPUC rate design principles _______________________________________________________________________________________ 11
Table 5: SDG&E charges, cost-recovery intents, and tariff components _____________________________________________________________ 13
Table 6: Illustrative commercial GIR tariff charges _____________________________________________________________________________ 13
Table 7: Illustrative commercial GIR tariff charges _____________________________________________________________________________ 13
Table 8: Estimated cost/mile scenarios under SDG&E Public Charging GIR _________________________________________________________ 15
Table 9: Anticipated annual average bills under various SCE EV tariffs _____________________________________________________________ 16
Table 10: Monthly utility bill by rate and host type ______________________________________________________________________________ 17
Table 11: Demand charge bill fraction under various rates _______________________________________________________________________ 17
Table 12: Utility bill for existing and proposed SCE EV tariffs _____________________________________________________________________ 18
Table 13: Utility bill for existing and proposed SDG&E tariffs _____________________________________________________________________ 18
TABLE OF FIGURES Figure 1: Monthly energy use and peak demand of an individual EVgo host site _______________________________________________________ 3
Figure 2: Hourly utilization rates of an individual EVgo host site ____________________________________________________________________ 4
Figure 3 Mobility-as-a-service scenario. Source: RMI 2016, Peak Car Ownership ______________________________________________________ 7
Figure 4: California EV deployment in the scenarios _____________________________________________________________________________ 8
Figure 5: SCE’s proposed ToU schedule for new EV tariffs. Source: Southern California Edison __________________________________________ 15
Figure 6: EVgo's cost per mile to deliver one mile of EV charge for existing and proposed EV tariffs ______________________________________ 19

EVgoFleetandTariffAnalysis|1
EXECUTIVE SUMMARY Public direct current fast chargers (DCFC) are anticipated to play an important role in accelerating electric vehicle (EV) adoption and mitigating transportation sector greenhouse gas (GHG) emissions. However, the high cost of utility demand charges is a significant barrier to the development of viable business models for public DCFC network operators.
With today’s EV market penetration and current public DCFC utilization rates, demand charges can be responsible for over 90% of electricity costs, which are as high as $1.96/kWh at some locations during summer months.i This issue will be compounded by the deployment of next-generation fast-charging stations, which are designed with more than two 50 kW DCFC per site and with higher-power DCFC (150kW or higher).
As state legislators begin to craft legislation defining the role of utilities in deploying, owning and operating electric vehicle charging stations (EVSE) and other supporting infrastructure, it is critical that utility tariffs for EV charging support, rather than stifle, the shift to EVs. Utilities, their regulators, and EV charging station owners and operators must work together to provide all EV drivers—especially those without home and workplace charging options—access to reliable EV charging at a rate competitive with the gasoline equivalent cost of $0.29/kWh.
ii Put another way, it should be possible for DCFC
operators to sell power to end-users for $0.09/mile or less, while still operating a sustainable business.
This project analyzed data from every charging session in 2016 from all 230 of EVgo’s DC fast charging stations in the state of California. From that data, we developed demand profiles for eight common types of site hosts, and analyzed the components of EVgo’s costs based on the utility tariffs the charging stations were on.
We also created a workbook modeling tool that EVgo could use to test the effect that different tariffs would have on its network of charging stations within the territory of the three major California investor-owned utilities (IOUs): Southern California Edison (SCE), San Diego Gas & Electric (SDG&E), and Pacific Gas & Electric (PG&E). To provide context for this modeling, we created four scenarios describing the possible future evolution of the EV and public charging markets. These scenarios were narrative in nature, and mainly served as conceptual guides to future cost modeling.
After modeling how different current and future tariffs affect the utility bills for each type of site where EVgo’s DCFC are located, and how those bills might look under the four scenarios in the future, we developed a critique of the various tariffs and some recommendations for future EV-specific rate design efforts.
We concluded that, in order to promote a conducive business environment for public DCFC charging stations like EVgo’s, tariffs should have the following characteristics:
• Time-varying volumetric rates, such as those proposed for SDG&E’s Public Charging Grid Integration Rate
(GIR). Ideally, these volumetric charges would recover all, or nearly all, of the cost of providing energy and system capacity. An adder can be used to recover excessive costs for distribution capacity, but only costs in excess of the cost of meeting the same level of usage at a uniform demand rate, and ideally such an adder would be something the customer can try to avoid. The highest-cost periods of the time-of-use (ToU) tariff should coincide with the periods of highest system demand (or congestion) to the maximum practical degree of granularity.
• Low fixed charges, which primarily reflect routine costs for things like maintenance and billing.
i Based on summer rates at EVgo’s lowest-utilization SDG&E Freedom Station, Las Americas (bill date of June 28, 2016), ii Assumes 32 mpg, $3/gallon of gas, 0.32 kWh/mile
EVgoFleetandTariffAnalysis|2
• The opportunity to earn credit for providing grid services, perhaps along the lines of a solar net-metering design. • Rates that vary by location. “Locational marginal pricing” is conventionally a feature of wholesale electricity
markets, reflecting the physical limits of the transmission system. But the concept could be borrowed for the purpose of siting charging depots, especially those that feature DCFC, in order to increase the efficiency of existing infrastructure and build new EV charging infrastructure at low cost. This could be done, for example, by offering low rates for DCFC installed in overbuilt and underutilized areas of the grid, particularly for “eHub” charging depots serving fleet and ridesharing vehicles.
• Limited or no demand charges. Where demand charges are deemed to be necessary, it is essential that they be designed only to recover location-specific costs of connection to the grid, not upstream costs of distribution
circuits, transmission, or generation.
Our analysis shows that the new EV-specific tariffs proposed by SDG&E and SCE in their SB 350 Transportation Electrification applications would have far more stable and certain costs than the tariffs currently available in their territories, and would meet the objective of delivering public charging to end-users for less than $0.09/mile, in all four scenarios. This is primarily due to the lower or non-existent demand charges outlined in the new tariffs.
We show that reducing or eliminating demand charges for the commercial public DCFC market, as these new tariffs do, is consistent with good rate-design principles and helps California to achieve its social objectives. We suggest that recovering nearly all utility costs for generation, transmission, and distribution through volumetric rates is appropriate for tariffs that apply to public DCFC, and that recovering some portion of those costs from the general customer base would be justifiable because public DCFC provide a public good. Finally, we offer some additional suggestions for how EVgo might reduce the cost of operating its network, beyond switching tariffs.
EVgoFleetandTariffAnalysis|3
FLEET AND TARIFF ANALYSIS The purpose of this analysis was to determine the key factors that contribute to the electricity costs of EVgo’s network of DCFC in California; what alternatives may be available to EVgo to reduce those costs; and to provide some guidance that may be useful for future rate design discussions.
Analysis of Current EVgo Fleet Usage in California
In the first part of the analysis, RMI and EVgo collaboratively explored the question: What are the demand profiles and energy consumption rates of EVgo’s existing California DCFC network, and how do those profiles vary across different types of host sites?
EVgo provided data representing all fast charging sessions that occurred on its network of 230 DCFC in California in 2016. Key data included:
• Start time of session • Length of session • kWh consumed per session • Host address and name
From this data, RMI created an hourly load profile for each host site. These profiles were used to identify usage trends and behaviors that are typical for particular types of host sites.
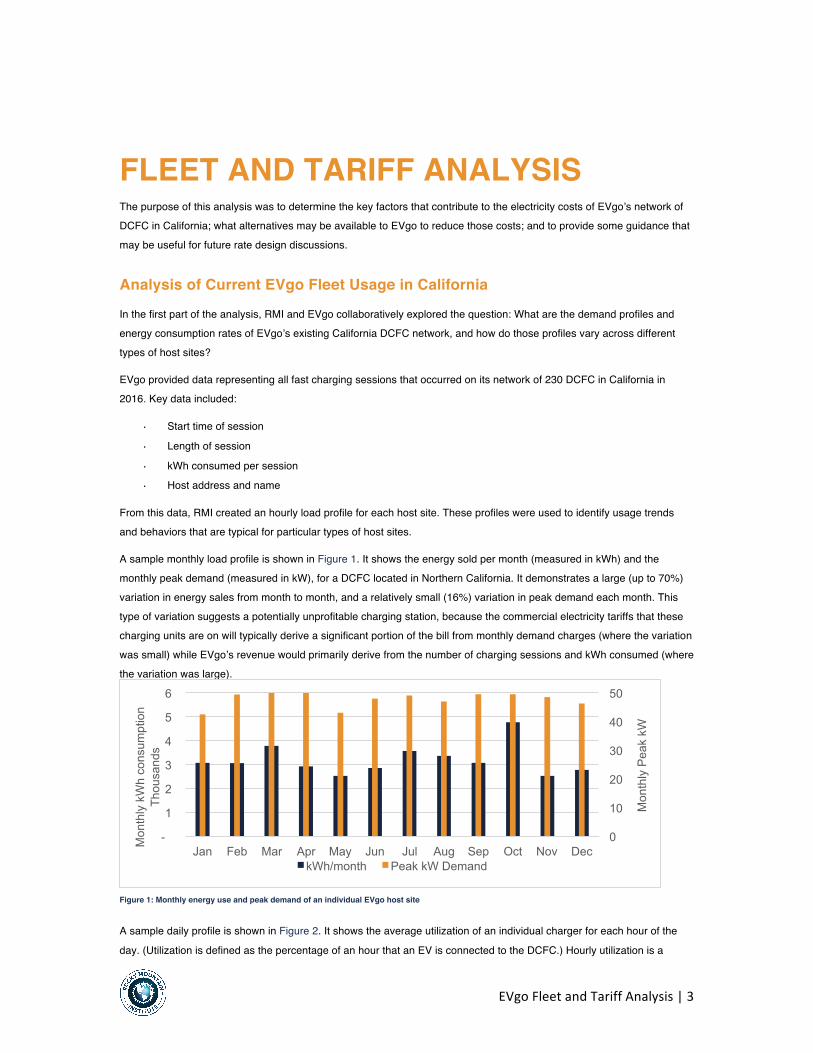
A sample monthly load profile is shown in Figure 1. It shows the energy sold per month (measured in kWh) and the monthly peak demand (measured in kW), for a DCFC located in Northern California. It demonstrates a large (up to 70%) variation in energy sales from month to month, and a relatively small (16%) variation in peak demand each month. This type of variation suggests a potentially unprofitable charging station, because the commercial electricity tariffs that these charging units are on will typically derive a significant portion of the bill from monthly demand charges (where the variation was small) while EVgo’s revenue would primarily derive from the number of charging sessions and kWh consumed (where the variation was large).
Figure 1: Monthly energy use and peak demand of an individual EVgo host site
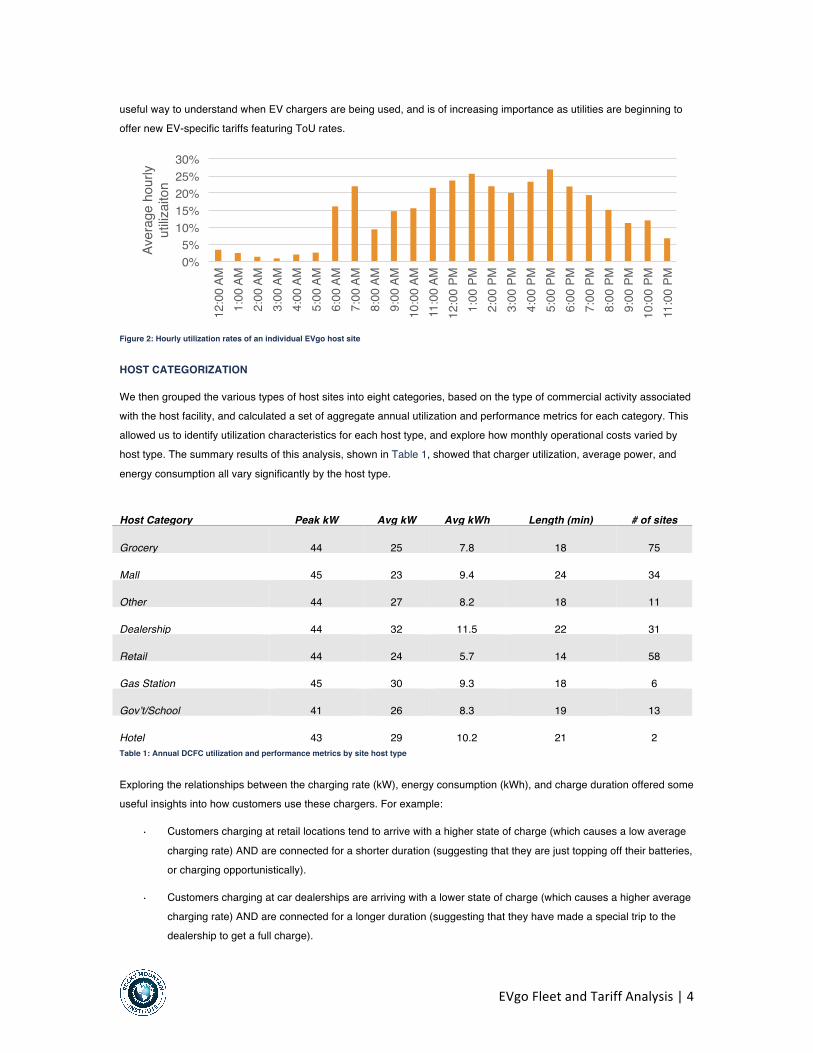
A sample daily profile is shown in Figure 2. It shows the average utilization of an individual charger for each hour of the
day. (Utilization is defined as the percentage of an hour that an EV is connected to the DCFC.) Hourly utilization is a
0
10
20
30
40
50
-
1
2
3
4
5
6
Jan Feb Mar Apr May Jun Jul Aug Sep Oct Nov Dec
Mon
thly
Pea
k kW
Mon
thly
kW
h co
nsum
ptio
n Th
ousa
nds
kWh/month Peak kW Demand
EVgoFleetandTariffAnalysis|4
useful way to understand when EV chargers are being used, and is of increasing importance as utilities are beginning to offer new EV-specific tariffs featuring ToU rates.
Figure 2: Hourly utilization rates of an individual EVgo host site
HOST CATEGORIZATION
We then grouped the various types of host sites into eight categories, based on the type of commercial activity associated with the host facility, and calculated a set of aggregate annual utilization and performance metrics for each category. This allowed us to identify utilization characteristics for each host type, and explore how monthly operational costs varied by host type. The summary results of this analysis, shown in Table 1, showed that charger utilization, average power, and
energy consumption all vary significantly by the host type.
Host Category Peak kW Avg kW Avg kWh Length (min) # of sites
Grocery 44 25 7.8 18 75
Mall 45 23 9.4 24 34
Other 44 27 8.2 18 11
Dealership 44 32 11.5 22 31
Retail 44 24 5.7 14 58
Gas Station 45 30 9.3 18 6
Gov’t/School 41 26 8.3 19 13
Hotel 43 29 10.2 21 2 Table 1: Annual DCFC utilization and performance metrics by site host type
Exploring the relationships between the charging rate (kW), energy consumption (kWh), and charge duration offered some useful insights into how customers use these chargers. For example:
• Customers charging at retail locations tend to arrive with a higher state of charge (which causes a low average
charging rate) AND are connected for a shorter duration (suggesting that they are just topping off their batteries, or charging opportunistically).
• Customers charging at car dealerships are arriving with a lower state of charge (which causes a higher average charging rate) AND are connected for a longer duration (suggesting that they have made a special trip to the dealership to get a full charge).
0%5%
10%15%20%25%30%
12:0
0 AM
1:00
AM
2:00
AM
3:00
AM
4:00
AM
5:00
AM
6:00
AM
7:00
AM
8:00
AM
9:00
AM
10:0
0 AM
11:0
0 AM
12:0
0 PM
1:00
PM
2:00
PM
3:00
PM
4:00
PM
5:00
PM
6:00
PM
7:00
PM
8:00
PM
9:00
PM
10:0
0 PM
11:0
0 PM
Aver
age
hour
ly ut
ilizai
ton

EVgoFleetandTariffAnalysis|5
Exploring customer behavior as a function of host type was outside of the scope of this project. However, customer behavior and, more importantly, customer responsiveness to ToU price signals will be of critical importance in the design of both commercial DCFC tariffs and the pricing structures charging companies like EVgo offer to their customers. We explore these issues later in this report.
Regardless of the type of host, the DCFC utilization profile resembles the load profile of the California Independent System Operator (CAISO) system (the wholesale bulk power system in California), with low use in the early morning, increasing use throughout the day, and then a peak between 5 p.m. and 9 p.m. This is not surprising considering that customers typically use public DCFC opportunistically, when they’re running errands and making other routine trips in the afternoon or after-work hours.
EV and EVSE Growth Scenarios
Before proceeding with modeling EVgo’s current and future electricity costs, we created four scenarios describing how EV adoption and DCFC deployment might proceed in the future to provide context for the analysis. In the workbook model, these scenarios mainly serve as conceptual guides; they are not meant to be empirically derived.
ASSUMPTIONS
These assumptions apply to all four scenarios.
1. Time horizon: 10 years (2017–2027) 2. Incremental change only—no major technology breakthroughs, radical policy changes, etc. 3. Stable-to-slow-growth (3% or less compound annual growth rate
1) for the U.S. economy
4. Industry standard DCFC power rate is 50 kW at start of scenario, 150 kW by 2020, and 300 kW by 2027. The average EV can accommodate the same rate of charging in those years.
5. Vehicle battery capacity ranges from 30–60 kWh in 2017, and 60–90 kWh from 2020 onward.i
6. Autonomous vehicles only become a factor after 2020 in all scenarios.
SCENARIOS
The main differences between the first three scenarios are the levels of EV adoption and corresponding distributed DCFC deployment. In the fourth scenario, autonomous vehicles become dominant rather quickly, and DCFC deployment is concentrated in charging hubs designed to serve fleets of shared vehicles, rather than being widely distributed.
Scenario 1: BAU, slow EV growth A default business-as-usual (BAU) path in which current trends continue more or less unchanged. Personally owned vehicles remain dominant and EV penetration continues to follow today’s moderate growth rates. Deployment of autonomous vehicles after 2020 is negligible, so those vehicles are not a factor in siting DCFC.
• EVs on the road in the US in 2027: 1.4 million, representing a compound annual growth rate (CAGR) of about 10%
• California falls short of its goal of having 1.5 million zero-emission vehicles (ZEVs) on the road by 2025. Instead it keeps its current market share of about half the U.S. EV fleet and achieves 700,000 EVs by 2027.
• Most charging is done at workplaces and homes using Level 1 or Level 2 chargers.
i At 100 kWh, a vehicle would have a roughly 400 mi. range, which should be sufficient for most users’ purposes. Therefore, we assume it would not be cost-effective to build vehicles with more than a 100 kWh capacity. Indeed, battery capacity may actually decline as DCFC chargers become more widely available, and it becomes less necessary to be able to drive long distances without recharging.

EVgoFleetandTariffAnalysis|6
• There is a perceived need for DCFC services, but actual use of public DCFC is still quite limited at the end of the scenario period.
• Wireless charging does not get traction. • Utility tariffs for EVs are still a very uneven landscape nationally, with California still the most progressive state,
and most other states having no special EV tariffs. • Vehicles are idle 95% of the time, making them available to provide demand response and other grid services.
Scenario 2: BAU, fast EV growth BAU is still the main context and personally owned vehicles remain dominant, but EVs experience much faster growth. Deployment of autonomous vehicles after 2020 is negligible and they are not a factor in siting DCFC.
• EVs on the road in the US in 2027: 4.1 million (CAGRs accelerate from ~10% in 2017 to 35% in 2027) • California meets its goal of having 1.5 million ZEVs on the road by 2025. • DCFC for public access, workplaces, and heavily trafficked highway corridors are broadly available by 2027 and
meet 30% of EV electricity consumption (kWh), but it’s all still wired EVSE (not wireless). “Charging valets” are commonly used to move vehicles in and out of the charging bays, and their pay is regarded as a loss leader by the shopping malls, workplaces, and other sites where the chargers are located.
• Most utilities have offered EV-friendly charging tariffs by 2027, and the majority of chargers are on those tariffs. • Some utilities buy grid services from EV aggregators and fleets using Level 1 and Level 2 chargers, but DCFC
only sell demand response to utilities.
Scenario 3: Personal EVs gain real market share as wireless charging and autonomous EVs get traction Personally owned vehicles remain dominant as EVs experience very fast growth. Autonomous vehicles become popular from 2020 onward and become a factor in siting DCFC.
• EVs on the road in the US in 2027: 10 million. • California far exceeds its goal of having 1.5 million ZEVs on the road by 2025; it actually has 5.0 million by
2027. • Over the scenario period, charging has begun to migrate to high-speed wireless induction chargers, which by
2027 are popping up everywhere: in parking spots, at stoplights, at workplaces, etc. Charging transactions are automated and billing is handled by a common payment processor (Visa, Stripe, a blockchain payment processor, or the like).
• Autonomous vehicles can go park themselves elsewhere when they’re done charging to free up the charger for the next vehicle.
• Only about 20% of charging load is now met by Level 1 or Level 2 chargers at workplaces and residences, so their capacity to sell grid services to utilities is limited. The other 80% of charging load is met by ubiquitous DCFC, which can supply most vehicles with an 80% full charge in 15 minutes.
• Nearly all EVSE are on an EV-specific ToU tariff with local utilities.
Scenario 4: Fast autonomous EV growth leads to a MaaS future
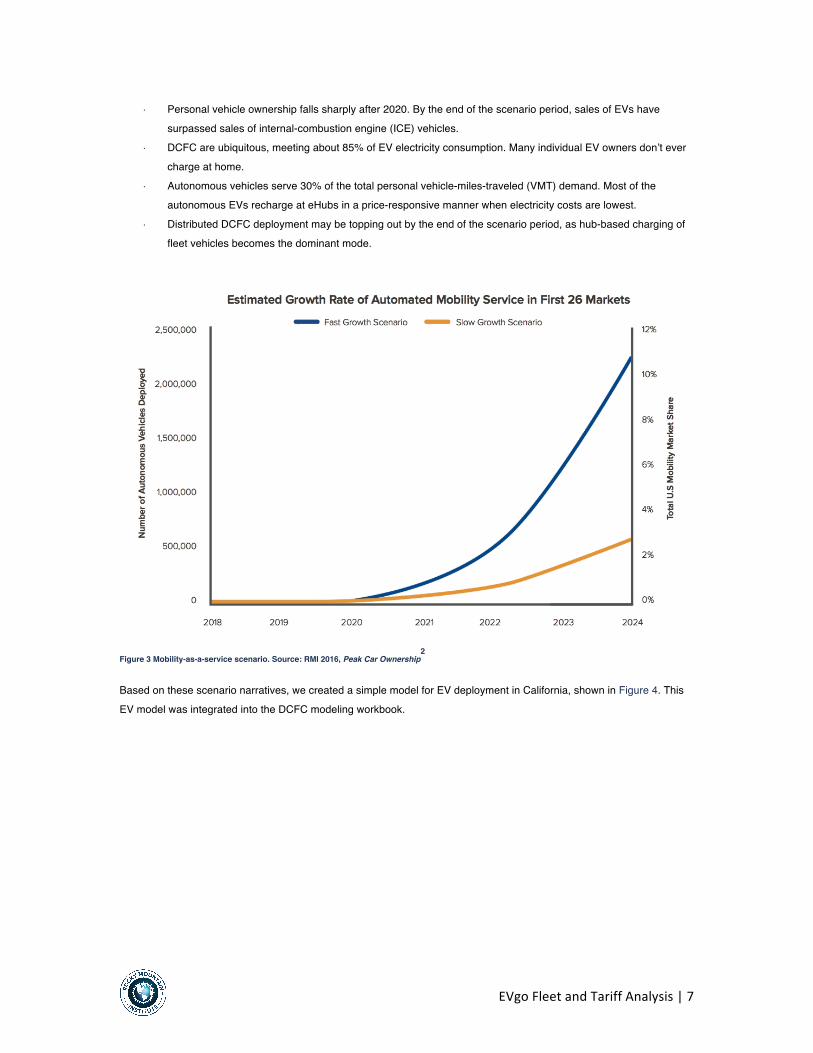
EVs experience fast growth throughout the scenario period and autonomous vehicles gain a majority of market share by 2021, completely upending the normal vehicle market. By the end of the scenario period, autonomous vehicles are around 15% of all vehicles, as projected in Figure 3 below. Most of the autonomous vehicles are fleet vehicles and ride-hailing vehicles as mobility-as-a-service (MaaS) becomes commonplace. Personal vehicle ownership is in decline and most new vehicle sales are for fleet and ridesharing purposes.
• EVs on the road in the US in 2027: 41 million • California has ~10 million ZEVs on the road by 2025, most of which are ride-sharing vehicles.
EVgoFleetandTariffAnalysis|7
• Personal vehicle ownership falls sharply after 2020. By the end of the scenario period, sales of EVs have surpassed sales of internal-combustion engine (ICE) vehicles.
• DCFC are ubiquitous, meeting about 85% of EV electricity consumption. Many individual EV owners don’t ever charge at home.
• Autonomous vehicles serve 30% of the total personal vehicle-miles-traveled (VMT) demand. Most of the autonomous EVs recharge at eHubs in a price-responsive manner when electricity costs are lowest.
• Distributed DCFC deployment may be topping out by the end of the scenario period, as hub-based charging of fleet vehicles becomes the dominant mode.
Figure 3 Mobility-as-a-service scenario. Source: RMI 2016, Peak Car Ownership
2
Based on these scenario narratives, we created a simple model for EV deployment in California, shown in Figure 4. This EV model was integrated into the DCFC modeling workbook.

EVgoFleetandTariffAnalysis|8
Figure 4: California EV deployment in the scenarios
HOW WE REPRESENTED THE SCENARIOS IN THE WORKBOOK MODEL
Although the scenarios were narrative in nature, and mainly served as conceptual guides to future cost modeling rather than being empirically represented, we did need to represent them numerically in the workbook to test how different tariffs would affect EVgo’s fleet in the future.
The model is designed to determine the cost of operating DCFC under different tariffs and scenarios. The key cost determinants are:
• The number of kilowatt-hours consumed in a month • When those kilowatt-hours are consumed (if under a ToU rate) • The single hour of a month in which the highest demand occurred (if the tariff includes demand charges).
To determine those numbers for each scenario, we manually programmed the model with the following assumptions for three modeling years within the ten-year scenario period:
• The beginning (2017) • Near the middle (2020, chosen because that year is often cited in policy targets and technical literature) • The end (2027).
All scenarios began with the same data in 2017, derived from EVgo’s actual data and other sources.
The following summary of the parameters used in the model is for illustrative purposes only; see the workbook for complete details.
Parameter Value in 2017 Value in 2027
Average DCFC power (kW) 24 100–200
Peak power of a charging session (kW) 50 300
Vehicle battery capacity (kWh) 40 60–90
Charge to be filled per charging session (%) 30 30–50
0
2
4
6
8
10
12
2016 2017 2018 2019 2020 2021 2022 2023 2024 2025 2026 2027
EVs
in C
alifo
rnia
M
illion
s
Scenario 1 Scenario 2 Scenario 3 Scenario 4
EVgoFleetandTariffAnalysis|9
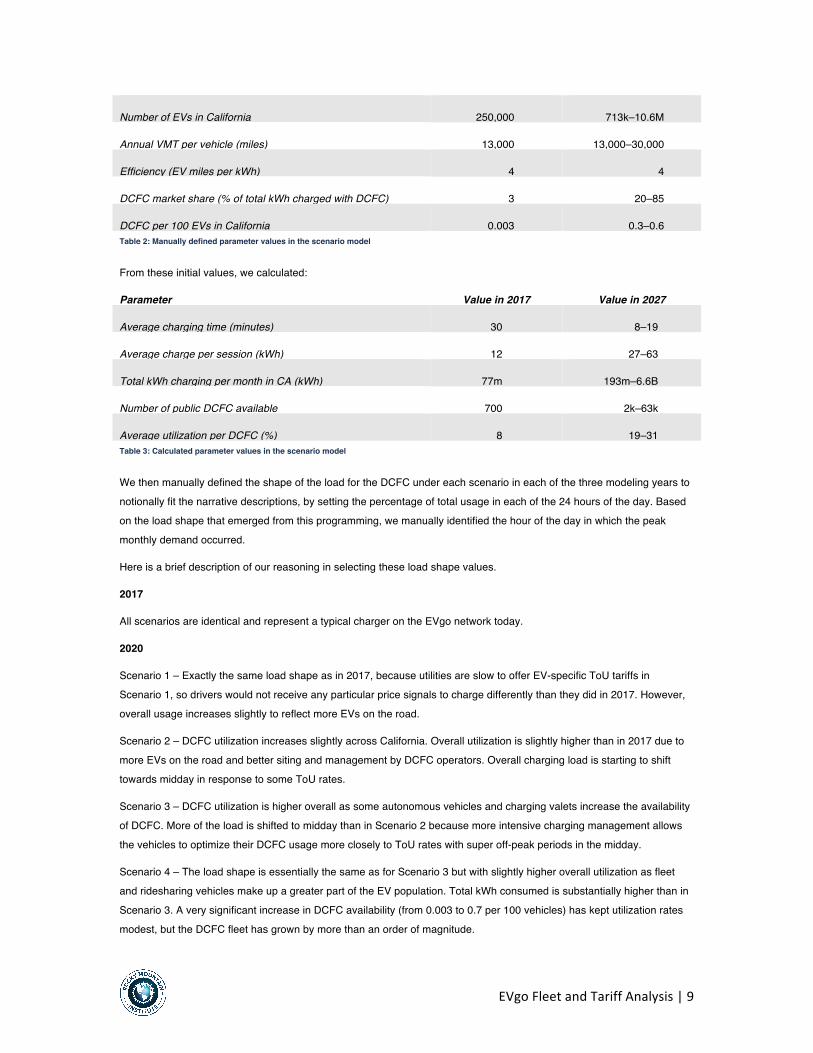
Number of EVs in California 250,000 713k–10.6M
Annual VMT per vehicle (miles) 13,000 13,000–30,000
Efficiency (EV miles per kWh) 4 4
DCFC market share (% of total kWh charged with DCFC) 3 20–85
DCFC per 100 EVs in California 0.003 0.3–0.6 Table 2: Manually defined parameter values in the scenario model
From these initial values, we calculated:
Parameter Value in 2017 Value in 2027
Average charging time (minutes) 30 8–19
Average charge per session (kWh) 12 27–63
Total kWh charging per month in CA (kWh) 77m 193m–6.6B
Number of public DCFC available 700 2k–63k
Average utilization per DCFC (%) 8 19–31 Table 3: Calculated parameter values in the scenario model
We then manually defined the shape of the load for the DCFC under each scenario in each of the three modeling years to notionally fit the narrative descriptions, by setting the percentage of total usage in each of the 24 hours of the day. Based on the load shape that emerged from this programming, we manually identified the hour of the day in which the peak monthly demand occurred.
Here is a brief description of our reasoning in selecting these load shape values.
2017
All scenarios are identical and represent a typical charger on the EVgo network today.
2020
Scenario 1 – Exactly the same load shape as in 2017, because utilities are slow to offer EV-specific ToU tariffs in Scenario 1, so drivers would not receive any particular price signals to charge differently than they did in 2017. However, overall usage increases slightly to reflect more EVs on the road.
Scenario 2 – DCFC utilization increases slightly across California. Overall utilization is slightly higher than in 2017 due to more EVs on the road and better siting and management by DCFC operators. Overall charging load is starting to shift towards midday in response to some ToU rates.
Scenario 3 – DCFC utilization is higher overall as some autonomous vehicles and charging valets increase the availability of DCFC. More of the load is shifted to midday than in Scenario 2 because more intensive charging management allows the vehicles to optimize their DCFC usage more closely to ToU rates with super off-peak periods in the midday.
Scenario 4 – The load shape is essentially the same as for Scenario 3 but with slightly higher overall utilization as fleet and ridesharing vehicles make up a greater part of the EV population. Total kWh consumed is substantially higher than in Scenario 3. A very significant increase in DCFC availability (from 0.003 to 0.7 per 100 vehicles) has kept utilization rates modest, but the DCFC fleet has grown by more than an order of magnitude.

EVgoFleetandTariffAnalysis|10
2027
Scenario 1 – The load shape remains the same as in 2017, reflecting the lack of utility ToU rates under this business-as-usual scenario. The utilization rate is the same as in 2020 but the total kWh consumed has doubled due to more vehicles and chargers in the field.
Scenario 2 – The load shape is substantially similar to what it was in 2020, but with a bit more charging at midday as drivers take advantage of ToU rates to charge at their workplaces or during their lunch breaks.
Scenario 3 – The load shape is strongly shifted to midday in response to ToU rates, because autonomous vehicles can drive themselves to go find a charger when they are idle.
Scenario 4 – The load shape is highly optimized to charging at midday as fleet and ridesharing vehicles take advantage of super off-peak periods under ToU rates. However, charging dips slightly during times when demand for rides would be highest: during the morning and evening commutes, at lunchtime, and at the end of the evening as bar, restaurant, and entertainment patrons go home. Utilization rates are still modest but a vastly expanded DCFC fleet (roughly as many DCFC in 2027 as there are gasoline pumps in California today
3) now serves 85% of total EV demand.
EV Rate Design
Having analyzed the use patterns of EVgo’s DCFC fleet, developed an economic modeling workbook, and created scenarios to contextualize the economic analysis, we still needed to understand the current tariffs that the DCFC are under, and the new EV-specific tariffs that the California utilities have proposed.
In this part of the analysis, we begin with a very brief review of rate design theory, then move on to a discussion of the new proposed tariffs. Finally, we summarize the findings of our economic modeling of the various rates, and consider the likely implications for DCFC rate design in California in the future.
RATE DESIGN THEORY
EVs have only recently become a sufficiently significant type of load to warrant special tariffs, and so there is not as yet an established practice for EV rate design. However, in light of expected growth in EV ownership, unique charging attributes of EVs, and resulting effects on electricity demand, specific attention is now being paid to designing rates for EVs. Designing these well will be very important to realizing the goals of individual EV owners, fleet owners/operators, utilities, and society at large. Because it is about EVgo’s DCFC fleet, this section focuses on rates for commercial DCFC operators, and leaves aside rates for residential customers charging EVs.
To understand the contemporary thinking on tariff design for commercial DCFC, and the anticipated trajectory of EV-specific tariff design in California, we examined the Transportation Electrification Plans submitted by the three California IOUs in January 2017, pursuant to SB 350 and California Public Utility Commission (CPUC) ruling R.13-11-007, “Order Instituting Rulemaking to Consider Alternative-Fueled Vehicle Programs, Tariffs, and Policies.”
4
California has roughly one-half of the nation’s EV fleet, the most aggressive policies and targets in the nation for EV and charging infrastructure deployment, and utility programs specifically designed around EV-grid integration. On account of these structural conditions and the state’s history of leadership on environmental and vehicle regulations, California’s
approach to DCFC tariff design may emerge as the utility industry “best practice” that other states will emulate.
In its Transportation Electrification Application,5
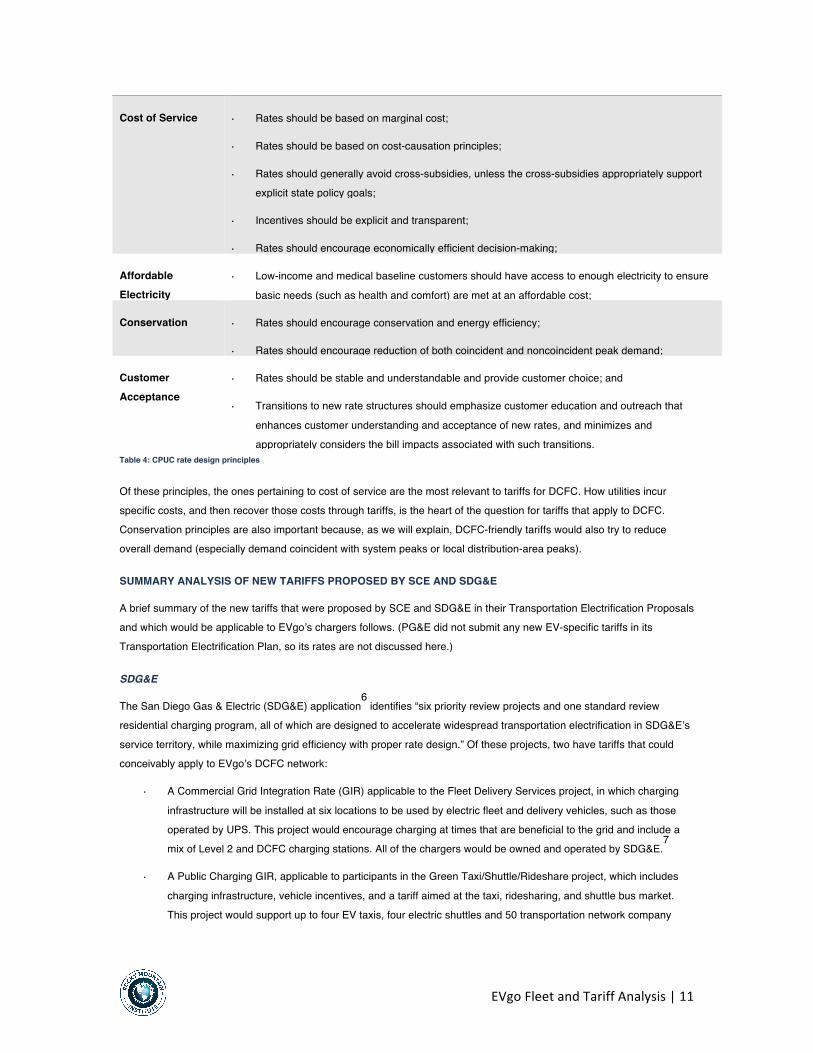
SDG&E reiterates the CPUC’s ten Rate Design Principles, as follows:
EVgoFleetandTariffAnalysis|11
Cost of Service • Rates should be based on marginal cost;
• Rates should be based on cost-causation principles;
• Rates should generally avoid cross-subsidies, unless the cross-subsidies appropriately support explicit state policy goals;
• Incentives should be explicit and transparent;
• Rates should encourage economically efficient decision-making;
Affordable Electricity
• Low-income and medical baseline customers should have access to enough electricity to ensure
basic needs (such as health and comfort) are met at an affordable cost;
Conservation • Rates should encourage conservation and energy efficiency;
• Rates should encourage reduction of both coincident and noncoincident peak demand;
Customer Acceptance
• Rates should be stable and understandable and provide customer choice; and
• Transitions to new rate structures should emphasize customer education and outreach that
enhances customer understanding and acceptance of new rates, and minimizes and appropriately considers the bill impacts associated with such transitions.
Table 4: CPUC rate design principles
Of these principles, the ones pertaining to cost of service are the most relevant to tariffs for DCFC. How utilities incur specific costs, and then recover those costs through tariffs, is the heart of the question for tariffs that apply to DCFC. Conservation principles are also important because, as we will explain, DCFC-friendly tariffs would also try to reduce overall demand (especially demand coincident with system peaks or local distribution-area peaks).
SUMMARY ANALYSIS OF NEW TARIFFS PROPOSED BY SCE AND SDG&E
A brief summary of the new tariffs that were proposed by SCE and SDG&E in their Transportation Electrification Proposals and which would be applicable to EVgo’s chargers follows. (PG&E did not submit any new EV-specific tariffs in its Transportation Electrification Plan, so its rates are not discussed here.)
SDG&E
The San Diego Gas & Electric (SDG&E) application6
identifies “six priority review projects and one standard review residential charging program, all of which are designed to accelerate widespread transportation electrification in SDG&E’s service territory, while maximizing grid efficiency with proper rate design.” Of these projects, two have tariffs that could conceivably apply to EVgo’s DCFC network:
• A Commercial Grid Integration Rate (GIR) applicable to the Fleet Delivery Services project, in which charging
infrastructure will be installed at six locations to be used by electric fleet and delivery vehicles, such as those operated by UPS. This project would encourage charging at times that are beneficial to the grid and include a mix of Level 2 and DCFC charging stations. All of the chargers would be owned and operated by SDG&E.
7
• A Public Charging GIR, applicable to participants in the Green Taxi/Shuttle/Rideshare project, which includes
charging infrastructure, vehicle incentives, and a tariff aimed at the taxi, ridesharing, and shuttle bus market. This project would support up to four EV taxis, four electric shuttles and 50 transportation network company

EVgoFleetandTariffAnalysis|12
(rideshare) EVs by deploying up to five grid-integrated charging facilities (one DCFC and two Level 2 EVSE each). All of the chargers would be owned and operated by SDG&E.
8
To understand the underlying theory of rate design and cost recovery, it is worth examining SDG&E’s explanation about why it has constructed these new tariffs the way it has.
SDG&E identifies the following objectives for its proposed tariffs:
1. To encourage economically efficient decision-making; 2. To encourage reduction of both coincident and noncoincident peak demand; 3. To provide a rate design that encourages cost-effective grid integrated charging solutions for EV customers; 4. To avoid cross-subsidies; 5. To base rates on cost causation; and 6. To examine alternative rate design.
SDG&E notes that in order to satisfy these objectives and the CPUC rate design principles, tariffs must send accurate price signals, which are based on marginal costs and cost-causation principles. (We would also note that the CPUC principles equally encourage conservation, energy efficiency, and demand management.)
SDG&E proposes to require participants to take service on its alternative GIR rate structures based on these cost-
causation principles in order to accurately reflect costs.
The following table maps the typical tariff components to their cost-recovery justifications and their roles in the proposed GIR tariffs.
Charge Component Cost Recovered by the Charge Component in Proposed GIR Tariffs
Fixed or monthly charge ($/month)
Routine costs of having an interconnected customer, such as meter reading and billing
Grid Integration Charge ($/Month)
Based on customer’s max annual demand (kW), to recover all basic customer costs and 80% of distribution-demand costs
Peak demand charge ($/peak kW)
Costs of maintaining system capacity sufficient to meet peak demand (independent of energy usage) in excess of the cost of meeting below-peak demand
Dynamic Adder – Commodity ($/kWh – Top 150 hours of system peak)
9
Based on commodity peak pricing, to recover 50% of generation capacity costs
Noncoincident demand charge ($/noncoincident kW)
Costs of maintaining circuit capacity sufficient to meet the combined demands of customers on the circuit (independent of energy usage) in excess of the cost of meeting the same level of usage at a uniform demand rate
Dynamic Adder – Distribution ($/kWh – Top 200 hours of circuit peak)
10
Based on distribution peak pricing, to recover 20% of distribution demand costs
Plus: Grid Integration Charge ($/Month per max kW), to recover distribution capacity investment
EVgoFleetandTariffAnalysis|13
Energy charge ($/kWh at time of use)
Costs of procuring energy at a given point in time, plus the costs of distribution that would be incurred if all usage were at a uniform rate of consumption
Hourly Base Rate ($/kWh)
Based on a variety of generation and transmission costs
Table 5: SDG&E charges, cost-recovery intents, and tariff components
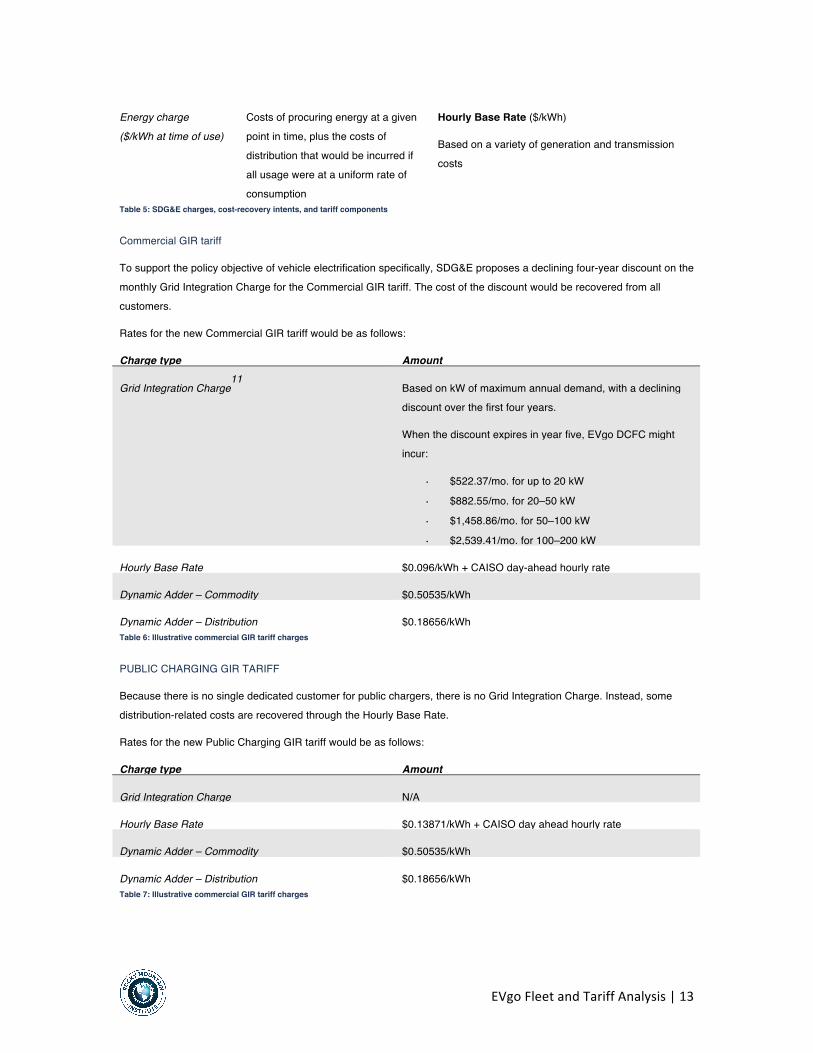
Commercial GIR tariff
To support the policy objective of vehicle electrification specifically, SDG&E proposes a declining four-year discount on the monthly Grid Integration Charge for the Commercial GIR tariff. The cost of the discount would be recovered from all customers.
Rates for the new Commercial GIR tariff would be as follows:
Charge type Amount
Grid Integration Charge11
Based on kW of maximum annual demand, with a declining discount over the first four years.
When the discount expires in year five, EVgo DCFC might incur:
• $522.37/mo. for up to 20 kW • $882.55/mo. for 20–50 kW • $1,458.86/mo. for 50–100 kW • $2,539.41/mo. for 100–200 kW
Hourly Base Rate $0.096/kWh + CAISO day-ahead hourly rate
Dynamic Adder – Commodity $0.50535/kWh
Dynamic Adder – Distribution $0.18656/kWh Table 6: Illustrative commercial GIR tariff charges
PUBLIC CHARGING GIR TARIFF
Because there is no single dedicated customer for public chargers, there is no Grid Integration Charge. Instead, some distribution-related costs are recovered through the Hourly Base Rate.
Rates for the new Public Charging GIR tariff would be as follows:
Charge type Amount
Grid Integration Charge N/A
Hourly Base Rate $0.13871/kWh + CAISO day ahead hourly rate
Dynamic Adder – Commodity $0.50535/kWh
Dynamic Adder – Distribution $0.18656/kWh Table 7: Illustrative commercial GIR tariff charges

EVgoFleetandTariffAnalysis|14
ANALYSIS OF SDG&E’S PROPOSED TARIFFS
Although the new rates proposed in SDG&E’s Transportation Electrification application are specifically targeted to the select projects SDG&E is proposing, in which it would install, own, and operate the charging infrastructure, the application also states, “While SDG&E provides these rate proposals as part this TE Application, SDG&E proposes not to limit the applicability of the proposed GIR to participants of SDG&E’s TE proposals, and instead proposes that they be made available to all customers.”
12
The Commercial GIR is evidently targeted to delivery trucks and other fleet vehicles that can recharge overnight at a central charging depot, so it does not seem to apply to EVgo’s network. However, it’s not obvious whether EVgo could own chargers that would be available to delivery vehicles and be eligible the Commercial GIR. If any of EVgo’s charging stations were to be used primarily by delivery trucks or other fleet vehicles, this tariff would pose a challenge to business model viability due to its high fixed Grid Integration Charges (unless the charging stations had very high utilization rates).
Allocating distribution-related costs through the fixed Grid Integration Charge would make it impossible for EVSE operators like EVgo to avoid those charges by smart charging (to avoid adding loads to the system peaks). It applies a high fixed monthly cost to every charging station, irrespective of that station’s utilization rate. Applying this tariff to EVgo’s charging stations would be undesirable.
The Public Charging GIR is aimed at high mileage taxi, shuttles and transportation network company (rideshare) electric vehicles that travel high-use transportation corridors. It is certainly within reason to expect that these vehicles, particularly ones operated by ridesharing companies like Uber, may use EVgo’s network of DCFC in equal measure to the ones proposed in the SDG&E project. Other than ownership, there does not appear to be any qualitative difference between the public chargers in SDG&E’s proposed Green Taxi/Shuttle/Rideshare project and the ones owned and operated by EVgo.
If EVgo’s network of charging stations were to be considered eligible for the Public Charging GIR, it could be a good option for EVgo. As SDG&E explains, the Public Charging GIR does not apply the fixed Grid Integration Charges because there is no single dedicated customer for public chargers. Instead, it recovers a share of the distribution-related costs through the Hourly Base Rate. In theory, EVgo chargers on the Public Charging GIR could not only shift charging to low-cost, off-peak hours by various means, but also pass on peak CAISO pricing to customers who use the charging stations through visual price displays.
On an energy-only basis, the wholesale power supply cost of operating an EVgo charger on the Public Charging GIR might work out to around $0.048 per mile of charge. Whereas a consumer driving an ICE vehicle equivalent to a Nissan LEAF might expect to pay on the order of $0.094 per mile to refuel with gasoline. To a first approximation, then, on the Public Charging GIR, EVgo might have nearly a 100% margin to work with between its cost of utility service and the consumer’s ICE refueling cost.
13 EVgo could use that margin to offset its site costs and equipment costs.
However, the “dynamic adders” (a form of Critical Peak Pricing charge) on the Public Charging GIR could amount to a worst-case annual cost of nearly $5,000 per year per charger. If EVgo could avoid or reduce its demand during the top 150 system hours and 200 circuit hours per year, for example by employing a stationary battery system to supply the power during those hours, or by throttling the chargers during those hours, or by raising its retail prices during those hours, or by some other means, those charges could be avoided and the tariff would be quite desirable. Since the peak hours that incur the dynamic adder fees are posted a day in advance, it should be practical for EVgo to pass along those costs to customers for charging during those hours.
If the worst-case dynamic adder costs were incurred, the effect on final cost would vary depending on several factors. For example: If they were amortized across the entire year, it would add $414 per month in costs. Assuming an average of 10 kWh of charge per session, that would affect the cost of the charger as shown in the following table.
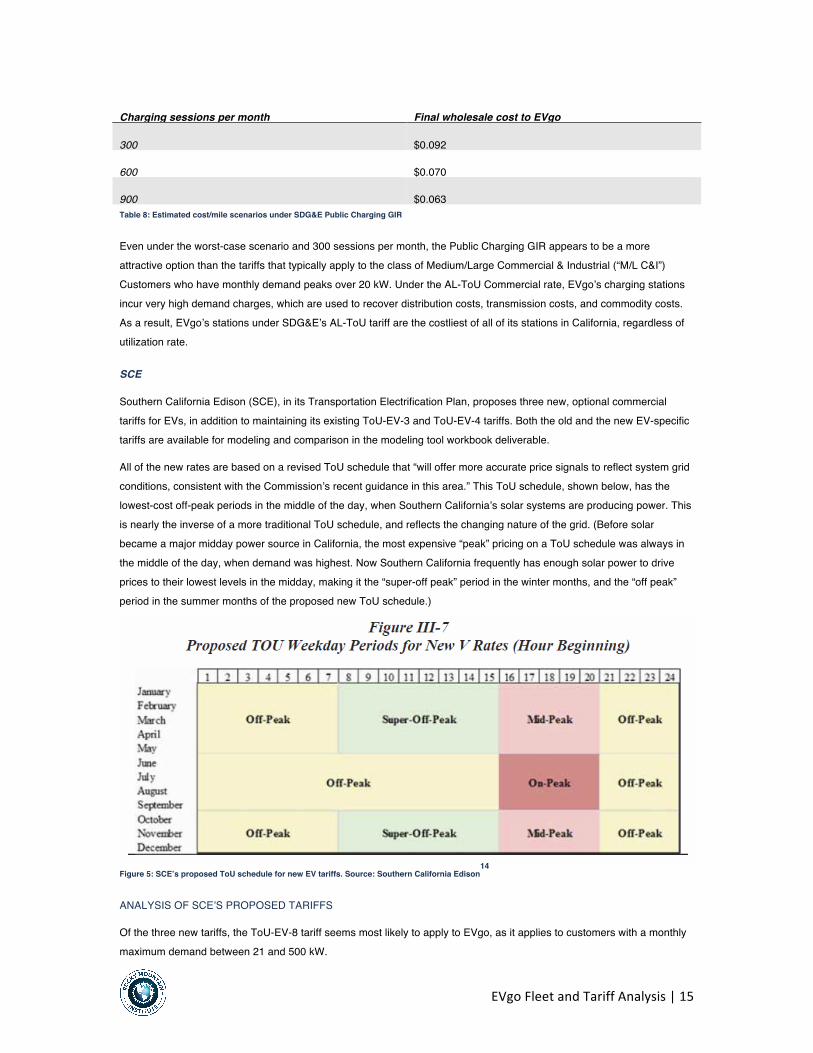
EVgoFleetandTariffAnalysis|15
Charging sessions per month Final wholesale cost to EVgo
300 $0.092
600 $0.070
900 $0.063 Table 8: Estimated cost/mile scenarios under SDG&E Public Charging GIR
Even under the worst-case scenario and 300 sessions per month, the Public Charging GIR appears to be a more attractive option than the tariffs that typically apply to the class of Medium/Large Commercial & Industrial (“M/L C&I”) Customers who have monthly demand peaks over 20 kW. Under the AL-ToU Commercial rate, EVgo’s charging stations incur very high demand charges, which are used to recover distribution costs, transmission costs, and commodity costs. As a result, EVgo’s stations under SDG&E’s AL-ToU tariff are the costliest of all of its stations in California, regardless of utilization rate.
SCE
Southern California Edison (SCE), in its Transportation Electrification Plan, proposes three new, optional commercial tariffs for EVs, in addition to maintaining its existing ToU-EV-3 and ToU-EV-4 tariffs. Both the old and the new EV-specific tariffs are available for modeling and comparison in the modeling tool workbook deliverable.
All of the new rates are based on a revised ToU schedule that “will offer more accurate price signals to reflect system grid conditions, consistent with the Commission’s recent guidance in this area.” This ToU schedule, shown below, has the lowest-cost off-peak periods in the middle of the day, when Southern California’s solar systems are producing power. This is nearly the inverse of a more traditional ToU schedule, and reflects the changing nature of the grid. (Before solar became a major midday power source in California, the most expensive “peak” pricing on a ToU schedule was always in the middle of the day, when demand was highest. Now Southern California frequently has enough solar power to drive prices to their lowest levels in the midday, making it the “super-off peak” period in the winter months, and the “off peak” period in the summer months of the proposed new ToU schedule.)
Figure 5: SCE’s proposed ToU schedule for new EV tariffs. Source: Southern California Edison
14
ANALYSIS OF SCE’S PROPOSED TARIFFS
Of the three new tariffs, the ToU-EV-8 tariff seems most likely to apply to EVgo, as it applies to customers with a monthly maximum demand between 21 and 500 kW.
EVgoFleetandTariffAnalysis|16
SCE describes the benefits of the new EV tariffs as: “(a) reduced distribution-related demand charges relative to the current EV and non-EV rates; (b) attractive volumetric rates during daytime super-off-peak periods and overnight; and (c) lower summer season charges to mitigate seasonal bill volatility.”
Importantly, to promote EV adoption, the new EV tariffs will suspend monthly demand charges during a five-year introductory period, after which SCE will phase in demand charges for a five-year intermediate period. During this intermediate period, the demand charges would collect an increasing share of distribution capacity-related costs, up to 60%, while the remaining 40% of distribution capacity costs will be collected via TOU energy charges. As the demand charges increase, the energy charges will decrease. Beginning in the eleventh year, the demand charges will be collecting 60% of distribution capacity costs and 100% of transmission capacity costs, and will have climbed to their full level, but SCE claims that the demand charges will “still be lower than what new EV customers would pay on their otherwise applicable (non-EV) commercial rates today.”
The way demand charges are calculated would also change. Under its existing EV tariffs, “time-related demand charges” (TRD) are assessed on a time-of-use basis during the on- and mid-peak periods in a month. Under the new tariffs, “facilities-related demand charges” (FRD) would be calculated based on the maximum demand in a month, irrespective of its coincidence with the system peak. This change would make it more difficult for EVgo to pass on its time-varying costs
to its charging station customers, or to reduce demand charges by encouraging customers to charge at times when grid power costs are lower. It also seems to contradict the intention of the demand charges, which is to recover SCE’s capacity-related delivery costs.
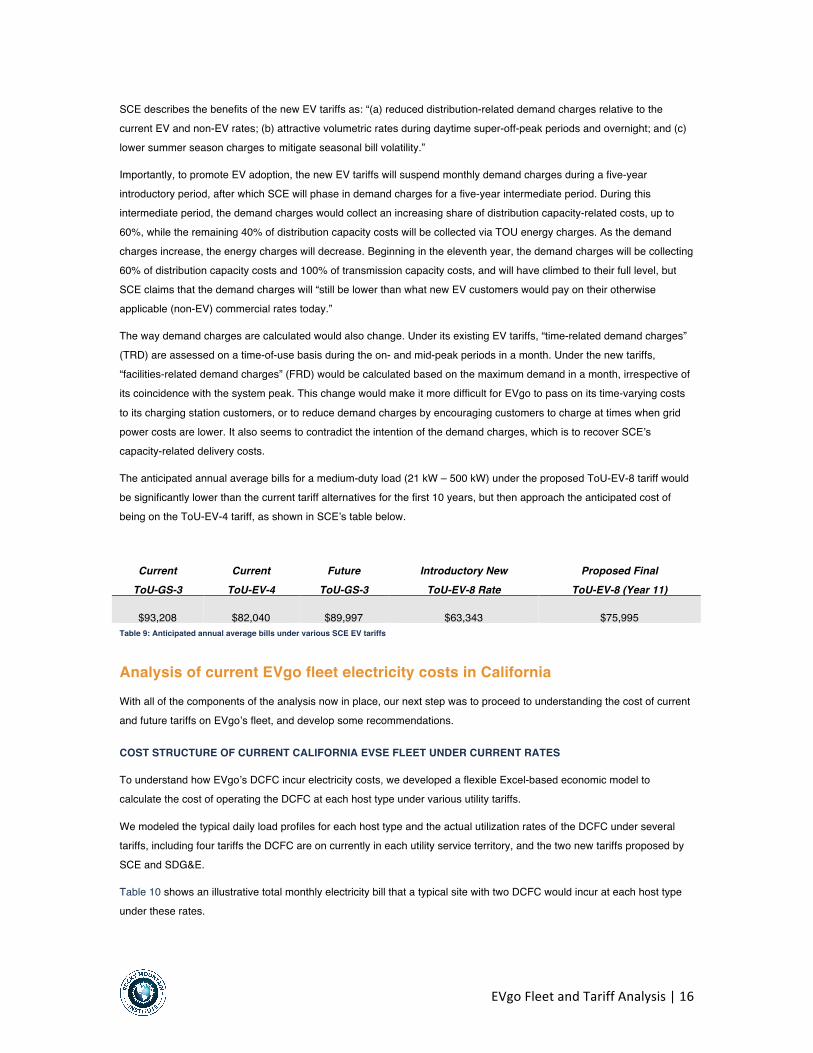
The anticipated annual average bills for a medium-duty load (21 kW – 500 kW) under the proposed ToU-EV-8 tariff would be significantly lower than the current tariff alternatives for the first 10 years, but then approach the anticipated cost of being on the ToU-EV-4 tariff, as shown in SCE’s table below.
Current ToU-GS-3
Current ToU-EV-4
Future ToU-GS-3
Introductory New ToU-EV-8 Rate
Proposed Final ToU-EV-8 (Year 11)
$93,208 $82,040 $89,997 $63,343 $75,995 Table 9: Anticipated annual average bills under various SCE EV tariffs
Analysis of current EVgo fleet electricity costs in California With all of the components of the analysis now in place, our next step was to proceed to understanding the cost of current and future tariffs on EVgo’s fleet, and develop some recommendations.
COST STRUCTURE OF CURRENT CALIFORNIA EVSE FLEET UNDER CURRENT RATES
To understand how EVgo’s DCFC incur electricity costs, we developed a flexible Excel-based economic model to calculate the cost of operating the DCFC at each host type under various utility tariffs.
We modeled the typical daily load profiles for each host type and the actual utilization rates of the DCFC under several tariffs, including four tariffs the DCFC are on currently in each utility service territory, and the two new tariffs proposed by SCE and SDG&E.
Table 10 shows an illustrative total monthly electricity bill that a typical site with two DCFC would incur at each host type under these rates.

EVgoFleetandTariffAnalysis|17
Category Host Type A Host Type B Host Type C Host Type D
Utilization 15% 8% 8% 4%
SCE ToU EV 4 (actual) $1,933 $1,817 $1,762 $1,682
SCE ToU EV 8 (proposed) $808 $648 $569 $461
SDG&E AL-ToU Commercial (actual) $3,313 $3,219 $3,178 $3,114
SDG&E Public Charging GIR (proposed) $501 $329 $255 $138
PGE A-6 ToU (actual) $484 $322 $260 $150
PG&E A-10 (actual) $1,318 $1,197 $1,147 $1,065 Table 10: Monthly utility bill by rate and host type
This analysis demonstrated that tariffs with high demand charges and low energy charges (EV 4 and AL-ToU) show minimal variation in the total bill across a wide range of DCFC utilization, while tariffs with smaller or no demand charges show a much wider range in total electricity bill.
It also demonstrated that DCFC with identical load profiles may incur widely varying utility bills, depending on the tariff. For example, operating a DCFC at a Host Type D with an average utilization of only 4% would cost EVgo $150 per month on the PGE A-6 ToU rate, but would cost $3,114 on the SDG&E AL-ToU rate—20 times more.
Both findings demonstrate the same point: that tariffs without demand charges more accurately reflect cost causation, whereas those with demand charges would be burdensome to any public DCFC, regardless of utilization. This is problematic because it is the very nature of underutilized or newly installed DCFC that the station can experience very low monthly kWh consumption and relatively high peak demand.
Table 11 shows the fraction of the total utility bill that demand charges make up under each tariff.
Tariff Host Type A Host Type B Host Type C Host Type D
SCE ToU EV 4 (actual) 70% 75% 77% 81%
SCE ToU EV 8 (proposed) 0 0 0 0
SDG&E AL-ToU Commercial (actual) 88% 91% 92% 94%
SDG&E Public Charging GIR (proposed) 0 0 0 0
PGE A-6 ToU with Option R (actual) 0 0 0 0
PG&E A-10 (actual) 67% 73% 76% 81% Table 11: Demand charge bill fraction under various rates
COST STRUCTURE OF CURRENT DCFC OPERATION IN CALIFORNIA UNDER ALTERNATIVE/PROPOSED EV RATES
Using the economic model and applying actual utilization datai of a DCFC deployed in California, we compared how the cost of operation could change if the proposed EV tariffs are adopted and applied to EVgo’s DCFC network. Table 12 and
i Hourly utilization profile of a typical grocery host site with a monthly kWh consumption of 2,764 kWh and a monthly peak demand of 88 kW
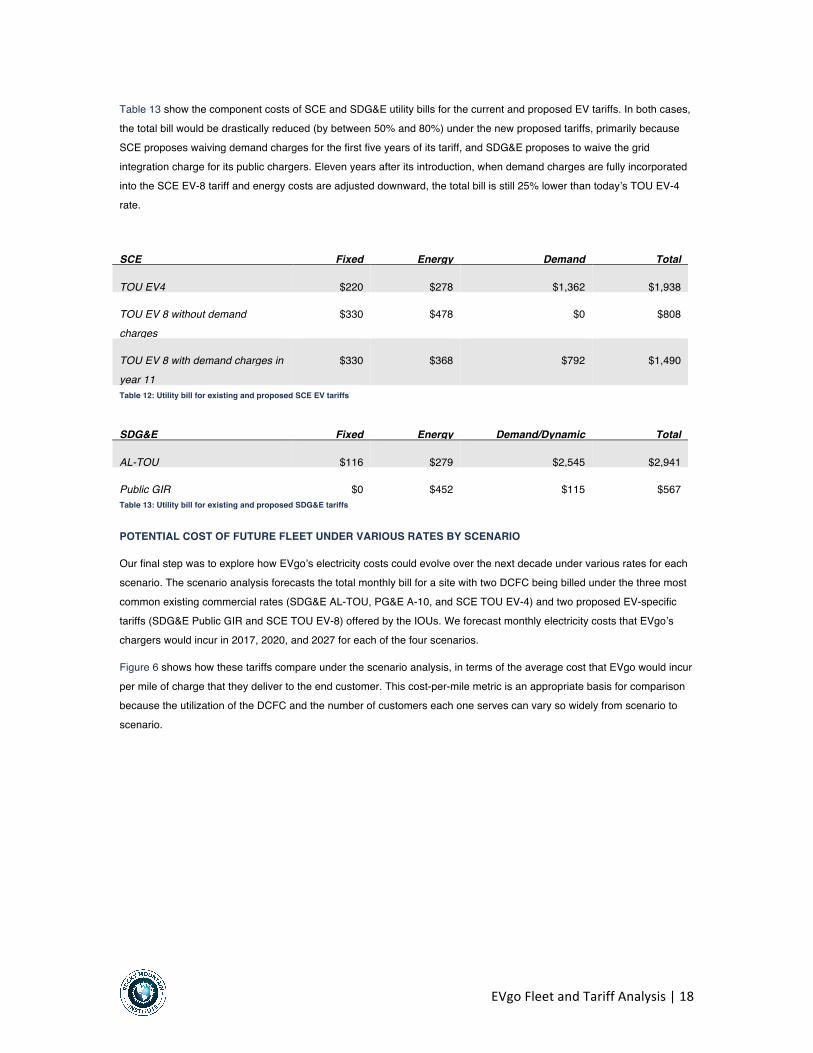
EVgoFleetandTariffAnalysis|18
Table 13 show the component costs of SCE and SDG&E utility bills for the current and proposed EV tariffs. In both cases, the total bill would be drastically reduced (by between 50% and 80%) under the new proposed tariffs, primarily because SCE proposes waiving demand charges for the first five years of its tariff, and SDG&E proposes to waive the grid integration charge for its public chargers. Eleven years after its introduction, when demand charges are fully incorporated into the SCE EV-8 tariff and energy costs are adjusted downward, the total bill is still 25% lower than today’s TOU EV-4 rate.
SCE Fixed Energy Demand Total
TOU EV4 $220 $278 $1,362 $1,938
TOU EV 8 without demand charges
$330 $478 $0 $808
TOU EV 8 with demand charges in year 11
$330 $368 $792 $1,490
Table 12: Utility bill for existing and proposed SCE EV tariffs
SDG&E Fixed Energy Demand/Dynamic Total
AL-TOU $116 $279 $2,545 $2,941
Public GIR $0 $452 $115 $567 Table 13: Utility bill for existing and proposed SDG&E tariffs
POTENTIAL COST OF FUTURE FLEET UNDER VARIOUS RATES BY SCENARIO
Our final step was to explore how EVgo’s electricity costs could evolve over the next decade under various rates for each scenario. The scenario analysis forecasts the total monthly bill for a site with two DCFC being billed under the three most common existing commercial rates (SDG&E AL-TOU, PG&E A-10, and SCE TOU EV-4) and two proposed EV-specific tariffs (SDG&E Public GIR and SCE TOU EV-8) offered by the IOUs. We forecast monthly electricity costs that EVgo’s chargers would incur in 2017, 2020, and 2027 for each of the four scenarios.
Figure 6 shows how these tariffs compare under the scenario analysis, in terms of the average cost that EVgo would incur per mile of charge that they deliver to the end customer. This cost-per-mile metric is an appropriate basis for comparison because the utilization of the DCFC and the number of customers each one serves can vary so widely from scenario to scenario.
EVgoFleetandTariffAnalysis|19
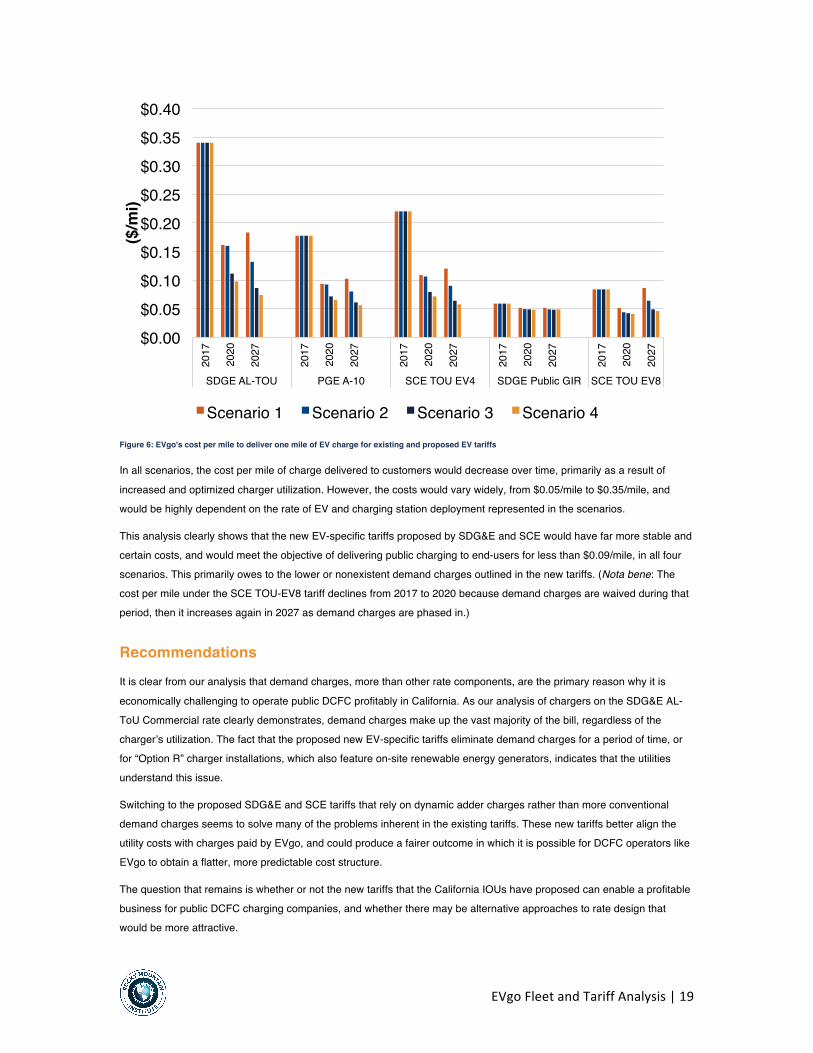
Figure 6: EVgo's cost per mile to deliver one mile of EV charge for existing and proposed EV tariffs
In all scenarios, the cost per mile of charge delivered to customers would decrease over time, primarily as a result of
increased and optimized charger utilization. However, the costs would vary widely, from $0.05/mile to $0.35/mile, and would be highly dependent on the rate of EV and charging station deployment represented in the scenarios.
This analysis clearly shows that the new EV-specific tariffs proposed by SDG&E and SCE would have far more stable and certain costs, and would meet the objective of delivering public charging to end-users for less than $0.09/mile, in all four scenarios. This primarily owes to the lower or nonexistent demand charges outlined in the new tariffs. (Nota bene: The cost per mile under the SCE TOU-EV8 tariff declines from 2017 to 2020 because demand charges are waived during that period, then it increases again in 2027 as demand charges are phased in.)
Recommendations It is clear from our analysis that demand charges, more than other rate components, are the primary reason why it is
economically challenging to operate public DCFC profitably in California. As our analysis of chargers on the SDG&E AL-ToU Commercial rate clearly demonstrates, demand charges make up the vast majority of the bill, regardless of the charger’s utilization. The fact that the proposed new EV-specific tariffs eliminate demand charges for a period of time, or for “Option R” charger installations, which also feature on-site renewable energy generators, indicates that the utilities understand this issue.
Switching to the proposed SDG&E and SCE tariffs that rely on dynamic adder charges rather than more conventional demand charges seems to solve many of the problems inherent in the existing tariffs. These new tariffs better align the utility costs with charges paid by EVgo, and could produce a fairer outcome in which it is possible for DCFC operators like EVgo to obtain a flatter, more predictable cost structure.
The question that remains is whether or not the new tariffs that the California IOUs have proposed can enable a profitable business for public DCFC charging companies, and whether there may be alternative approaches to rate design that would be more attractive.
$0.00$0.05$0.10$0.15$0.20$0.25$0.30$0.35$0.40
2017
2020
2027
2017
2020
2027
2017
2020
2027
2017
2020
2027
2017
2020
2027
SDGE AL-TOU PGE A-10 SCE TOU EV4 SDGE Public GIR SCE TOU EV8
($/m
i)
Scenario 1 Scenario 2 Scenario 3 Scenario 4
EVgoFleetandTariffAnalysis|20
PUBLIC DCFC RATE DESIGN THEORY/BEST PRACTICES
For a good guide to rate design theory in general, we recommend Smart Rate Design for a Smart Future.15
It contains a good deal of material that may be useful to EVgo. But here are some condensed thoughts about tariffs for public DCFC like EVgo’s in particular.
In theory, demand charges are assessed in such a way as to reflect the actual incremental capacity costs that the distribution utility incurs at peak times of the day, over and above the cost of capacity to serve off-peak demand. In practice, however, the structure of a tariff, including demand charges, often reflects other utility and social priorities as well, and the way that costs are recovered from various customer classes is not always consistent or reflective of cost causation.
16
Traditional demand charges for small-to-medium commercial customers were never designed for a business like EVgo’s, which has little control over when customers use its chargers, and which sees widely varying utilization rates across a heterogeneous network of chargers in widely varying locations and site types. In short, EVgo’s network of chargers looks and behaves nothing like a large commercial or industrial facility, but it’s being billed as if each location is a separate commercial facility.
The CPUC decision of December 2014 on a rate design proposal to include an Option R tariff in PG&E territory supports
this reasoning. That case concerned how demand charges were used to recover peak-related capacity costs for solar customers, but the reasoning should apply equally to DCFC loads, which are also sporadic-use customers with a great deal of diversity. As the CPUC’s decision argued:
The first line of argument is that the collection of coincident peak related capacity costs on the basis of customers’ highest single intervals of demand does not reflect the diversity benefit of multiple customers’ solar output, and net loads on PG&E’s system, changing by different amounts at different times….Stated differently, total coincident demand will never equal the sum of each customer’s highest recorded demand during a given time period because of the variability of millions of customers’ demands.
17
It is also true that the local infrastructure needed to serve DCFC, particularly dense groups of chargers in an “eHub” configuration as imagined in Scenario 4, would be non-trivial and location-specific, and so would meet the criteria for recovery on a customer-specific basis. Customer-specific charges for customer-specific costs to connect to the grid can cover this local transformer and service line cost. But this cost recovery should not reach upstream of the immediate distribution connection to the broader distribution circuit costs (substation, transmission, and generation), all of which would be more equitably recovered on a ToU energy basis so that shared-capacity customers share costs, and continuous-capacity customers are not subsidized.
Although utilities may argue that high demand charges, adders, and fixed charges based on maximum demand, like SDG&E’s Grid Integration Charge and SCE’s TRD, are justified methods of recovering the costs of capacity investments, these approaches also allow off-peak loads to free-ride on the system capacity paid for by on-peak users. If total system demand were uniform across all hours, and there were thus no “peak” to trigger demand charges, there would still be extensive generation, transmission, and distribution capacity costs to be paid by all customers. Therefore, it’s reasonable to argue that demand-based approaches amount to a shifting of system capacity costs onto customers with peaky demand profiles, and put an undue cost burden on those who may happen to have very brief and occasional demand spikes, like DCFC owners. To avoid such a cost-shift, system capacity costs should be recovered via energy sales, not separate demand-based charges. By this rubric, SDG&E’s recovery of a high percentage of distribution capacity costs
EVgoFleetandTariffAnalysis|21
through the Grid Integration Charge, and SCE’s recovery of transmission costs through its TRD, would be considered regressive approaches and would be discouraged. Those costs should be primarily recovered through ToU energy rates.
For tariffs that apply to public DCFC, demand charges for distribution circuit and upstream costs should be deemphasized—or better, eliminated. If demand charges must be a feature of tariffs for EVs, then those charges should be time varying and reflect actual system costs at a given time, in keeping with the principle of sending accurate price signals based on marginal costs. That way, if customers like EVgo are able to reduce their demands on the system’s transmission and distribution capacity by charging vehicles at times when there is spare grid capacity, they should be able to reduce their costs for making that effort. Likewise, customer-specific demand costs, such as the transformer and service drop, can be recovered via a fixed fee like a grid integration charge, but the circuit costs should not; those should be recovered in ToU energy charges to assure that sporadic-demand customers who can share capacity get the cost-saving benefits of that sharing.
Beyond such fine points of rate design theory, it may make sense to allocate the cost of EV infrastructure more broadly across the entire customer base, because promoting EV adoption is a societal goal that California has explicitly established, and public DCFC deliver a public good. This is what SDG&E proposes to do for the “discount” on the monthly grid integration charge component of its Commercial GIR tariff. Low-income discounts, renewable energy incentives, and
spreading the costs of providing full system reliability and meeting peak demand across the customer base are other examples of how some portion of actual costs are routinely socialized rather than being recovered entirely through a specific tariff. As the authors of Smart Rate Design for a Smart Future put it: “Regulators will need to determine if the public benefit of providing an infant-industry subsidy to EV charging is consistent with the public interest.”
18
Considering that owning and refueling an EV is already cheaper than owning and refueling a conventional ICE vehicle in many cases, and seems destined to only become more so, the continued advance of EVs against the existing ICE regime should be a relatively uncontroversial assumption. If we assume that EVs will continue to gain market share on their way to a near-total eclipse of the existing ICE vehicle regime—particularly if the future belongs to ride-sharing services provided by autonomous electric vehicles as imagined in Scenario 4—then socializing some part of the costs of building universally-available charging infrastructure might be justified.
Further, demand charges were invented in an era when a consuming commercial or industrial facility was only ever just that—a consumer. As RMI elucidated in its 2016 report, Electric Vehicles as Distributed Energy Resources,
19 and as both
SDG&E and SCE have acknowledged and piloted to various degrees, what we should be aiming for is a future in which EVSE doing “smart charging” can supply a variety of services back to the grid, in addition to consuming energy from the grid.
Accordingly, best-practice rate design for EVs would feature not only time-varying tariffs that reflect the actual cost of energy provisioning and delivery at a given time (and eventually, place), but also the ability of EVSE to reduce the need for investments in distribution capacity by providing services like demand response, as well as the need to invest in capacity to supply those same EVSE. However, as currently conceived, demand charges act more like a calculator that can only add.
In summary, to promote a conducive business environment for public DCFC charging stations like EVgo’s, tariffs should have the following characteristics:
• Time-varying volumetric rates, such as those proposed for SDG&E’s Public Charging GIR. Ideally, these
volumetric charges would recover all, or nearly all, of the cost of providing energy and system capacity. An adder can be used to recover excessive costs for distribution capacity, but only costs in excess of the cost of meeting the same level of usage at a uniform demand rate, and ideally would be something the customer could
EVgoFleetandTariffAnalysis|22
try to avoid. The highest-cost periods of the ToU tariff should coincide with the periods of highest system demand (or congestion) to the maximum practical degree of granularity.
• Low fixed charges, which primarily reflect routine costs for things like maintenance and billing. • The opportunity to earn credit for providing grid services, perhaps along the lines of a solar net-metering design. • Rates that vary by location. “Locational marginal pricing” is conventionally a feature of wholesale electricity
markets, reflecting the physical limits of the transmission system. But the concept could be borrowed for the purpose of siting charging depots, especially those that feature DCFC, in order to increase the efficiency of existing infrastructure and build new EV charging infrastructure at low cost. This could be done, for example, by offering low rates for DCFC installed in overbuilt and underutilized areas of the grid, particularly for “eHub”
charging depots serving fleet and ridesharing vehicles • Limited or no demand charges. Where demand charges are deemed to be necessary, it is essential that they be
designed only to recover location-specific costs of connection to the grid, not upstream costs of distribution circuits, transmission, or generation.
A SOCIAL OBJECTIVE APPROACH
The preceding discussion attempted to use the framework of traditional rate-design theory and existing rate proposals to identify a viable path for public fast-charging companies like EVgo. But perhaps a more unconventional approach is worth considering.
To begin with, we should recognize that the societal objective should be to create a business opportunity for EV charging companies like EVgo to earn a reasonable profit by providing a valuable service and maintaining universally available charging equipment in serviceable condition. That is not currently the case.
To achieve this objective directly, we could design a tariff by working down from a cost that will be attractive to consumers, rather than by building up from the cost basis of the utilities. Based on our simple calculations above, this approach might target a cost to the EV end-user of no more than nine cents per mile, in order to maintain the cost advantage of EVs over ICE vehicles. From that nine-cent-per-mile target, one could deduct a reasonable profit margin for the charging companies, and then set the result as the cost ceiling for a tariff that applies to public DCFC owners. Whatever missing revenue there may be between the revenue potential of that tariff and what is deemed to be the actual cost of service could be recovered from the general customer base on a cost (not cost-plus) basis only, to reflect the fact that there are
numerous EV-to-grid value streams that remain to be recognized in the tariffs, including the nebulous, yet real, value of enabling greater renewable energy penetration.
Should the state of the art in EV rate design evolve in the future, and make it possible to quantify and compensate the various value streams in the EV-grid interaction more discretely, a more sophisticated approach to EV tariffs could be devised. But at the present time, recognizing the great importance of California’s societal goals embodied in the hopes for much faster EV adoption, the emerging nature of the underlying EV and telematics technologies, and the difficulty of the existing tariff regime for DCFC providers, a tariff along these lines can strike an appropriate balance between the theory and the practice of EV rate design, while supporting established policy objectives and design principles.
HOW TO MODERATE EVGO’S COSTS
If possible, the most straightforward option for EVgo to reduce its public DCFC costs would be to switch to the Public GIR
tariff in SDG&E territory, and the TOU EV-8 tariff in SCE territory, as depicted in Figure 6. Switching to these tariffs could result in a bill reduction of up to 80% for DCFC in SDG&E territory, and between 25–50% for DCFC in SCE territory. Our modeling suggests that under these new tariffs, EVgo could potentially run those DCFC profitably while meeting the

EVgoFleetandTariffAnalysis|23
objective of delivering public charging to end-users for less than $0.09/mile. However, these tariffs are only proposed at this point, so whether switching to these tariffs is actually an option for EVgo is unknown at this time.
In the absence of tariff options for DCFC that substantially reduce or completely eliminate demand charges, the next best option might be for EVgo and other EVSE companies to adopt the concept of surge pricing and pass along the high demand charges and adders to their customers, where possible, to allow the utility’s price signal to influence when and where electricity is used on the grid, as such charges are intended to do.
In SDG&E territory, it may be possible for EVgo to hedge against critical peak pricing events that trigger the dynamic adders of ToU rates by paying a fixed monthly Capacity Reservation Charge (CRC).
20 We did not model this option in this
study, but it could be worth exploring with SDG&E.
It may also be possible for EVgo to get consolidated billing from the utilities based on the loads of all charging stations on the utility’s system, at least for the generation and transmission cost components. Under such an arrangement, peak generation capacity costs could be based on the collective coincident demand of all of EVgo’s DCFC on a utility’s system during peak hours.
There are other ways that EVgo could potentially reduce its costs, using technology solutions like on-site solar or electricity storage systems that could be called upon to deliver power when grid power costs are high, or when the charger
is at risk of triggering demand charges. However, our analysis was restricted to tariff-based solutions.
SUGGESTIONS FOR FURTHER STUDY
Although the current usage patterns of charging infrastructure suggest that it is easier for Level 2 chargers than it is for DCFC to shift their loads in response to TOU tariffs and provide grid benefits (such as demand response and ancillary services), more sophisticated and detailed modeling of DCFC’s demand flexibility may offer some useful insights, particularly if DCFC are paired with on-site solar systems, an Option R tariff and/or on-site supplementary battery storage systems that can be deployed to shave demand peaks.
That kind of modeling work does not appear to have been done to a deep level as yet; most of the existing work has looked at the potential value streams of EVs as grid assets from the perspective of the bulk power system or in terms of the total societal impact, rather than at a granular level where effects on the distribution system over time could be
assessed. It may very well be, for example, that the cost of a PV canopy and a redundant battery storage array located with a DCFC looks prohibitive at first blush, but a detailed modeling of the revenue potential in such a configuration would show that it would not only substantially reduce the direct costs of the DCFC by shaving or avoiding peak pricing and demand charges, but earn significant revenue for selling grid services to utilities, and enabling the uptake of renewable power on the grid to a degree that public utility commissioners see the value in developing performance-based incentives around it.
EVgoFleetandTariffAnalysis|24
ENDNOTES 1UnitedStatesGDPGrowthRate,TradingEconomics.http://www.tradingeconomics.com/united-states/gdp-growth2RMI,PeakCarOwnership.2016.https://rmi.org/Content/Files/CWRRMI_POVdefection_FullReport_L12.pdf3DataonthenumberofgasolinefillingstationsinCaliforniaishardtofind,butthissourcesuggests13,500,whichseemsintherightballpark.Ifweassume6pumpsperstation,thentherewouldbe81,000pumpsinCalifornia,comparedtothe63,500DCFCinCaliforniain2027underScenario4.http://www.answers.com/Q/How_many_gas_stations_in_California?#slide=24DocumentspertainingtoCPUCproceedingR.13-11-007maybefoundhere:https://apps.cpuc.ca.gov/apex/f?p=401:56:0::NO5SanDiegoGas&Electric,“ApplicationofSanDiegoGas&ElectricCompany(U902-E)forAuthoritytoImplementPriorityReviewandStandardReviewProposalstoAccelerateWidespreadTransportationElectrification,”January20,2017.https://www.sdge.com/regulatory-filing/20491/application-sdge-authority-implement-priority-review-and-standard-review6“PreparedDirectTestimonyofCynthiaFangonBehalfofSanDiegoGas&ElectricCompany,Chapter5,”January20,2017.https://www.sdge.com/sites/default/files/regulatory/Direct%20Testimony%20Chapter%205%20-%20Rate%20Design.pdf7“PreparedTestimonyofRandySchimkaonBehalfofSanDiegoGas&ElectricCompany,Chapter3,”January20,2017.https://www.sdge.com/sites/default/files/regulatory/Direct%20Testimony%20Chapter%203%20-%20Priority%20Review%20Projects.pdf8Ibid.9 ACPP[CriticalPeakPricing]rateisacommodityratestructurethat
includesahigherenergyprice($/kWh)appliedtopeakperiodsoncriticalsystemeventdaysthatarecalledonaday-aheadbasis.TheCPPrateisdesignedtorecoverthecostsofsystemcapacityduringeventdays,upto18daysperyearwithanassumedninedaysperyear,calledonaday-aheadbasisrateratherthanthroughapeakdemandchargeeverymonthoftheyearinordertosolicitdemandresponse.…Customerswillbenotifiedonaday-aheadbasiswhenforecastedloadexceedsanestablishedthresholdwiththethreshold

EVgoFleetandTariffAnalysis|25
calculatedbasedonthetop150systemhoursfromthepreviousyear,whichrepresentsapproximately1.71%ofannualhours.BymovingfromaToUratestructuretoanhourlydynamicratestructure,theproposedTEcommodityrateallowsSDG&Etofocusonasmallnumberoftrulyhighcosthours,the150systempeakhours,whilestillreflectingthecostbasisofcommodityservices.
“PreparedDirectTestimonyofCynthiaFangonBehalfofSanDiegoGas&ElectricCompany,Chapter5,”January20,2017.https://www.sdge.com/sites/default/files/regulatory/Direct%20Testimony%20Chapter%205%20-%20Rate%20Design.pdf10 Historiccircuitloadwillbeusedtodeterminethethreshold
amountforforecastingthetop200circuitpeakhours.Whentheforecastidentifiesanhourexceedingtheprioryear’stop200-hourthreshold,aD-CPPHourlyAdderwillbeappliedandpresentedtothecustomeronaday-aheadbasis.Year-to-yeardifferencesinloadcanresultinactualcircuitpeakhoursthatdifferfromtheforecastedtop200hours.
Ibid.11Ibid.12“PreparedDirectTestimonyofCynthiaFangonBehalfofSanDiegoGas&ElectricCompany,Chapter5,”January20,2017.https://www.sdge.com/sites/default/files/regulatory/Direct%20Testimony%20Chapter%205%20-%20Rate%20Design.pdf13Assuminga32mpgNissanSentraICEvehicle,$3/gallonofgasoline(basedonCApriceinQ42016)0.32kWh/miletypicalEVperformance,and$12/MWhCAISOday-aheadpricingincentralSanDiego(asofFebruary14,2017).http://gasprices.aaa.com/?state=CA;https://www.fueleconomy.gov/feg/bymodel/2015_Nissan_Sentra.shtml;http://www.afdc.energy.gov/vehicles/electric_emissions_sources.html.14SouthernCaliforniaEdison,“TestimonyofSouthernCaliforniaEdisonCompanyinSupportofitsApplicationofSouthernCaliforniaEdisonCompany(U338-E)ForApprovalofits2017TransportationElectrificationProposals,”January20,2017.http://on.sce.com/2kXeu1X15Lazar,J.andGonzalez,W.(2015).SmartRateDesignforaSmartFuture.Montpelier,VT:RegulatoryAssistanceProject.http://www.raponline.org/document/download/id/768016“Whilethecostsofutilityservicesareincurredinthesamemannerforallcustomerclasses,thereislittleconsistencyinhowcostsarerecoveredfromeachcustomerclass,withtheratestructureforsomecustomerclassesrecoveringcostsinamannerthatdoesnotreflectcostcausation.”“PreparedDirectTestimonyof

EVgoFleetandTariffAnalysis|26
CynthiaFangonBehalfofSanDiegoGas&ElectricCompany,Chapter5,”January20,2017.https://www.sdge.com/sites/default/files/regulatory/Direct%20Testimony%20Chapter%205%20-%20Rate%20Design.pdf17CPUCDecision14-12-080,“DecisiononaRateDesignProposaltoAdoptanOptionRTariffforPacificGasandElectricCompany,”December18,2014.http://docs.cpuc.ca.gov/PublishedDocs/Published/G000/M143/K631/143631744.PDF18Lazar,J.andGonzalez,W.(2015).SmartRateDesignforaSmartFuture.Montpelier,VT:RegulatoryAssistanceProject.http://www.raponline.org/document/download/id/768019ChrisNelder,JamesNewcomb,andGarrettFitzgerald,ElectricVehiclesasDistributedEnergyResources(RockyMountainInstitute,2016),http://www.rmi.org/pdf_evs_as_DERs20SDG&ETimeofUsePlus(CriticalPeakPricing-CPP-D)option.http://www.sdge.com/business/demand-response/cpp

1820 Folsom Street
Boulder, CO 80302 USA
http://www.rmi.org
© March 2017 RMI. All rights reserved. Rocky Mountain Institute® and RMI® are registered trademarks.
RO
CKY MOUNTAIN
INSTIT UTE
WAR R O O M
CARBON