Public Utilities - San Diego · Public Utilities - 463 ... store imported water, ... deliver...
36
Public Utilities
Transcript of Public Utilities - San Diego · Public Utilities - 463 ... store imported water, ... deliver...

Public Utilities

Page Intentionally Left Blank

Public Utilities
- 463 - City of San DiegoFiscal Year 2018 Adopted Budget
Department Description
The Public Utilities Department provides water for City of San Diego customers through the Water Utility Fund,wastewater collection for City of San Diego customers through the Municipal Wastewater Fund, and wastewatertreatment and disposal services for City of San Diego customers and regional partners through the MetropolitanWastewater Fund.
The Department's mission is:
To provide reliable water utility services that protect the health of our communities and the environment
The Department's vision is:
A world-class water utility for a world-class city
Did you know?
• The Public Utilities Department created the Help-to-Others San Diego (H2O SD) Program in Fiscal Year2017, which is a donation driven assistance program to assist low-income customers with their water andwastewater bills. H2O SD is the first assistance program of its kind in the region and utilizes donationsfrom customers, businesses, and others to comply with California law. To learn more about the H2O SDProgram, including to see if you may qualify for assistance in helping to pay your water and wastewaterbill or to donate, please visit this link: www.sandiego.gov/h2oSD
• Pure Water San Diego uses proven water purification technology to produce a safe, sustainable, and highquality water supply for San Diego. The Program is a cost-effective investment that will provide a reliable,locally-controlled and drought-proof drinking water supply. An initial 30 million gallon per day waterpurification facility is planned to be operational as early as 2021. The long-term goal, producing 83

Public Utilities
- 464 -City of San DiegoFiscal Year 2018 Adopted Budget
million gallons of purified water per day (one-third of San Diego's future drinking water supply), isplanned to be reached in 2035.
• The water and wastewater systems are among the largest and most complex systems in the world due tothe size of the service area, topography, and varied climate.
• The water system can treat up to 378 million gallons of drinking water per day and includes 49 pumpstations, 3 water treatment plants (Miramar, Alvarado, and Otay), 3,400+ miles of pipeline, 320,000+service connections, and 135 separate pressure zones.
• The wastewater system can treat up to 255 million gallons of wastewater per day and includes 79 pumpstations, 3 wastewater treatment plants (Pt. Loma, North City, and South Bay), a bio-solid processingplant, 2 ocean outfalls, and 3,000+ miles of pipeline.
• Both the water and wastewater funds have strong credit ratings (Aa3 and Aa2, respectively, as rated byMoody’s). Over $1.0 billion in water and wastewater fund outstanding debt has been refunded sinceFiscal Year 2016, saving approximately $150.0 million.
• The Public Utilities Department operates nine reservoirs: Barrett, El Capitan, Lake Hodges, Lake Murray,Lower Otay, Miramar, Morena, San Vincente, and Sutherland. These reservoirs capture local rain fall,store imported water, and offer various opportunities for recreational activities including fishing, boating,windsurfing, and water skiing.
• Over the next two years, the Public Utilities Department will be installing advanced meters citywide. Thiswill allow customers to monitor their water use and provide a tool to better understand their water usagepatterns. Customers will be able to access this information through the new MyWaterEasy customer portaland mobile app that will be available during the coming fiscal year.
Goals and Objectives
Goal 1: Water Supply and Environmental Stewardship
• Water supply and conservation
• Carbon footprint and energy management
Goal 2: Organization Excellence
• Rate structure optimization
• Safety
• Training and development
• Excellent organizational culture
Goal 3: Community Engagement
• Stakeholder understanding and support
• Customer service strategies
Goal 4: Infrastructure Management
• Asset management
• Infrastructure investment
Key Performance Indicators
Performance IndicatorFY2016 Target
FY2016 Actual
FY2017 Target
FY2017 Actual
FY2018 Target
1. Percentage reduction of per capita water
consumption1 N/A N/A 5% 5% 5%
2. Percentage reduction of imported water2 N/A N/A 5% 5% 5%
Public Utilities
- 465 - City of San DiegoFiscal Year 2018 Adopted Budget
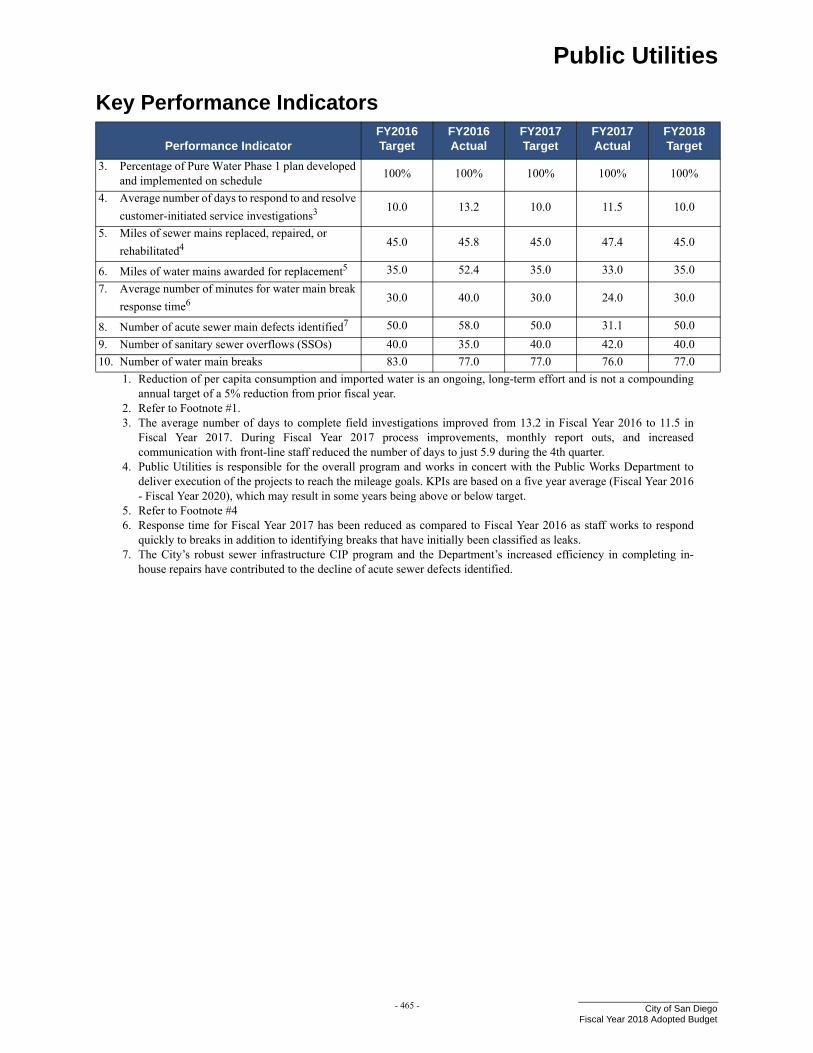
3. Percentage of Pure Water Phase 1 plan developed and implemented on schedule
100% 100% 100% 100% 100%
4. Average number of days to respond to and resolve
customer-initiated service investigations3 10.0 13.2 10.0 11.5 10.0
5. Miles of sewer mains replaced, repaired, or
rehabilitated4 45.0 45.8 45.0 47.4 45.0
6. Miles of water mains awarded for replacement5 35.0 52.4 35.0 33.0 35.0
7. Average number of minutes for water main break
response time6 30.0 40.0 30.0 24.0 30.0
8. Number of acute sewer main defects identified7 50.0 58.0 50.0 31.1 50.0
9. Number of sanitary sewer overflows (SSOs) 40.0 35.0 40.0 42.0 40.0
10. Number of water main breaks 83.0 77.0 77.0 76.0 77.0
1. Reduction of per capita consumption and imported water is an ongoing, long-term effort and is not a compoundingannual target of a 5% reduction from prior fiscal year.
2. Refer to Footnote #1.3. The average number of days to complete field investigations improved from 13.2 in Fiscal Year 2016 to 11.5 in
Fiscal Year 2017. During Fiscal Year 2017 process improvements, monthly report outs, and increasedcommunication with front-line staff reduced the number of days to just 5.9 during the 4th quarter.
4. Public Utilities is responsible for the overall program and works in concert with the Public Works Department todeliver execution of the projects to reach the mileage goals. KPIs are based on a five year average (Fiscal Year 2016- Fiscal Year 2020), which may result in some years being above or below target.
5. Refer to Footnote #46. Response time for Fiscal Year 2017 has been reduced as compared to Fiscal Year 2016 as staff works to respond
quickly to breaks in addition to identifying breaks that have initially been classified as leaks. 7. The City’s robust sewer infrastructure CIP program and the Department’s increased efficiency in completing in-
house repairs have contributed to the decline of acute sewer defects identified.
Key Performance Indicators
Performance IndicatorFY2016 Target
FY2016 Actual
FY2017 Target
FY2017 Actual
FY2018 Target

Page Left Intentionally Blank

Public Utilities
- 467 - City of San DiegoFiscal Year 2018 Adopted Budget
General Fund
Department SummaryFY2016Actual
FY2017Budget
FY2018Adopted
FY2017–2018Change
FTE Positions (Budgeted) 1,653.36 1,644.74 1,650.92 6.18Personnel Expenditures $ 157,571,869 $ 164,385,461 $ 172,990,858 $ 8,605,397Non-Personnel Expenditures 595,933,886 696,643,461 702,814,314 6,170,853
Total Department Expenditures $ 753,505,755 $ 861,028,922 $ 875,805,172 $ 14,776,250Total Department Revenue $ 899,464,526 $ 998,559,613 1,121,258,423 $ 122,698,810
Department Expenditures FY2016Actual
FY2017Budget
FY2018Adopted
FY2017–2018Change
Public Utilities $ - $ 2,577,246 $ 2,495,029 $ (82,217)Water 1,991,740 - - -
Total $ 1,991,740 $ 2,577,246 $ 2,495,029 $ (82,217)
Significant Budget Adjustments FTE Expenditures Revenue
Non-Discretionary AdjustmentAdjustment to expenditure allocations that are determined outside of the department's direct control. These allocations are generally based on prior year expenditure trends and examples of these include utilities, insurance, and rent.
0.00 $ 7,987 $ -
Reservoir Recreation Services ReductionReduction of non-personnel expenditures associated with reservoir recreation services.
0.00 (90,204) -
Revised RevenueAdjustment to reflect revised revenue projections.
0.00 - (200,000)
Total 0.00 $ (82,217) $ (200,000)
Expenditures by Category FY2016Actual
FY2017Budget
FY2018Adopted
FY2017–2018Change
NON-PERSONNELSupplies $ 86,199 $ 61,800 $ 61,800 $ -Contracts 1,832,311 2,450,881 2,377,309 (73,572)Information Technology 1,501 - - -Energy and Utilities 69,919 64,565 55,920 (8,645)Other 1,810 - - -
NON-PERSONNEL SUBTOTAL 1,991,740 2,577,246 2,495,029 (82,217)Total $ 1,991,740 $ 2,577,246 $ 2,495,029 $ (82,217)
Revenues by Category FY2016Actual
FY2017Budget
FY2018Adopted
FY2017–2018Change
Charges for Services $ 761,031 $ 1,089,000 $ 889,000 $ (200,000)Rev from Money and Prop 122,532 520,000 520,000 -
Total $ 883,563 $ 1,609,000 $ 1,409,000 $ (200,000)

Public Utilities
- 468 -City of San DiegoFiscal Year 2018 Adopted Budget
Metropolitan Sewer Utility Fund
Department Expenditures FY2016Actual
FY2017Budget
FY2018Adopted
FY2017–2018Change
Metropolitan Wastewater - Metro $ 79,141,507 $ - $ - $ -Public Utilities 108,578,487 220,304,391 224,055,992 3,751,601
Total $ 187,719,993 $ 220,304,391 $ 224,055,992 $ 3,751,601
Department Personnel FY2016Budget
FY2017Budget
FY2018Adopted
FY2017–2018Change
Metropolitan Wastewater - Metro 271.08 0.00 0.00 0.00Public Utilities 191.13 462.20 458.86 (3.34)
Total 462.21 462.20 458.86 (3.34)
Significant Budget Adjustments FTE Expenditures Revenue
Non-Discretionary AdjustmentAdjustment to expenditure allocations that are determined outside of the department's direct control. These allocations are generally based on prior year expenditure trends and examples of these include utilities, insurance, and rent.
0.00 $ 6,220,613 $ -
Salary and Benefit AdjustmentsAdjustments to reflect savings resulting from vacant positions for any period of the fiscal year, retirement contributions, retiree health contributions, and labor negotiations.
0.01 2,437,876 -
Support for Information TechnologyAdjustment to expenditure allocations according to a zero-based annual review of information technology funding requirements.
0.00 1,641,151 -
Laboratory Supplies and EquipmentAddition of non-personnel expenditures for laboratory supplies, equipment, and facility improvements.
0.00 1,420,620 -
Condition AssessmentsAddition of one-time non-personnel expenditures for condition assessments associated with programmatic wastewater pipelines and CIP project planning.
0.00 1,040,000 -
Wastewater PlanningAddition of one-time non-personnel expenditures to assess operational efficiencies at wastewater facilities.
0.00 620,000 -
Wastewater Pipeline ProjectAddition of one-time non-personnel expenditures associated with heavy pipeline cleanup for the Ferrous Line Improvement project.
0.00 500,000 -
Public Utilities RestructureReallocation among funds as a result of departmental efficiency efforts.
(1.97) 130,985 -

Public Utilities
- 469 - City of San DiegoFiscal Year 2018 Adopted Budget
IAM ProjectAddition of non-personnel expenditures and associated revenue for the Infrastructure Asset Management (IAM) project.
0.00 121,000 312,204
Security EquipmentAddition of non-personnel expenditures to support the planning, repair and maintenance of critical security equipment.
0.00 115,500 -
Marine Biology and Ocean OperationsAddition of non-personnel expenditures for consulting services associated with marine biology and ocean operations.
0.00 99,000 -
Southern California Coastal Water Research Project Joint Powers AgreementAddition of non-personnel expenditures for the annual Joint Powers Authority (JPA) member agency contribution.
0.00 25,000 -
Overtime AdjustmentAddition of overtime personnel expenditures related to emergency operations, vacancies and long-term absences.
0.00 16,500 -
Supplemental Cost of Living Adjustment (COLA)Adjustment to reflect the allocation of the pay-go costs for the continued funding of the Supplemental COLA Benefit.
0.00 1,412 -
Bond Administrative FeesAddition of non-personnel expenditures for miscellaneous bond administration fees and contractual services.
0.00 1,248 -
Hourly Sick LeaveAdjustment to reflect prior year expenditure trends, related to paid sick leave benefits for eligible hourly employees consistent with the requirements of Assembly Bill 1522.
0.00 (1,507) -
Non-Standard Hour Personnel FundingFunding allocated according to a zero-based annual review of hourly funding requirements.
(0.38) (57,687) -
Human Resources Functions ConsolidationTransfer of 0.99 FTE positions to the Human Resources Department from the Public Utilities Department for centralized human resources support.
(0.99) (124,124) -
State Revolving Fund (SRF) AdjustmentReduction of non-personnel expenditures for SRF loan repayments to reflect amortization schedules for Fiscal Year 2018.
0.00 (456,313) -
Pure Water ProgramReduction of non-personnel expenditures associated with consulting services for the Pure Water program.
0.00 (643,318) -
Equipment and MaintenanceReduction of non-personnel expenditures associated with equipment and maintenance.
0.00 (774,869) -
Contractual ReductionsReduction of non-personnel expenditures associated with Metropolitan Sewer Utility Agency waste disposal contracts.
0.00 (3,000,000) -
Significant Budget Adjustments (Cont’d)FTE Expenditures Revenue

Public Utilities
- 470 -City of San DiegoFiscal Year 2018 Adopted Budget
One-Time Reductions and AnnualizationsAdjustment to reflect the removal of one-time revenues and expenditures, and the annualization of revenues and expenditures, implemented in Fiscal Year 2017.
0.00 (5,581,486) -
Revised RevenueAdjustment to reflect revised revenue projections.
0.00 - 4,342,600
Total (3.33) $ 3,751,601 $ 4,654,804
Expenditures by Category FY2016Actual
FY2017Budget
FY2018Adopted
FY2017–2018Change
PERSONNELPersonnel Cost $ 28,690,800 $ 29,655,612 $ 29,474,819 $ (180,793)Fringe Benefits 18,024,071 19,221,033 21,803,869 2,582,836
PERSONNEL SUBTOTAL 46,714,870 48,876,645 51,278,688 2,402,043
NON-PERSONNELSupplies $ 21,540,223 $ 21,312,782 $ 21,662,766 $ 349,984Contracts 38,097,414 52,664,085 45,984,234 (6,679,851)Information Technology 4,557,943 5,068,982 6,710,133 1,641,151Energy and Utilities 10,037,365 17,392,348 16,265,567 (1,126,781)Other 232,343 398,834 310,316 (88,518)Contingencies - 3,500,000 3,500,000 -Transfers Out 64,682,089 67,696,383 74,743,616 7,047,233Capital Expenditures 2,272,653 3,379,078 3,585,417 206,339Debt (414,907) 15,254 15,255 1
NON-PERSONNEL SUBTOTAL 141,005,123 171,427,746 172,777,304 1,349,558Total $ 187,719,993 $ 220,304,391 $ 224,055,992 $ 3,751,601
Revenues by Category FY2016Actual
FY2017Budget
FY2018Adopted
FY2017–2018Change
Charges for Services $ 69,835,271 $ 69,195,422 $ 80,163,726 $ 10,968,304Other Revenue 247,273 100,000 100,000 -Rev from Federal Agencies - - 1,350,000 1,350,000Rev from Money and Prop 1,802,334 134,400 1,300,000 1,165,600Rev from Other Agencies 29,500 19,719,000 - (19,719,000)Transfers In 19,928,760 - 10,889,900 10,889,900
Total $ 91,843,139 $ 89,148,822 $ 93,803,626 $ 4,654,804
Personnel Expenditures JobNumber Job Title / Wages
FY2016Budget
FY2017Budget
FY2018Adopted Salary Range Total
FTE, Salaries, and Wages
20000011 Account Clerk 4.89 4.89 4.56 $31,491 - $37,918 $ 170,742
20000007 Accountant 3 0.33 0.33 0.33 59,363 - 71,760 23,676
20000102 Accountant 4 0.33 0.33 0.33 66,768 - 88,982 29,365
90000102 Accountant 4 - Hourly 0.00 0.10 0.10 66,768 - 88,982 8,898
20000012 Administrative Aide 1 1.10 0.44 0.77 36,962 - 44,533 32,767
20000024 Administrative Aide 2 5.19 5.85 6.51 42,578 - 51,334 318,699
Significant Budget Adjustments (Cont’d)FTE Expenditures Revenue

Public Utilities
- 471 - City of San DiegoFiscal Year 2018 Adopted Budget
20000057 Assistant Chemist 24.00 23.00 23.00 53,789 - 65,333 1,436,068
20001140 Assistant Department Director 1.16 1.16 1.16 31,741 - 173,971 162,403
20001202 Assistant Deputy Director 1.00 1.00 1.00 23,005 - 137,904 115,000
90001202 Assistant Deputy Director - Hourly 0.00 0.35 0.35 23,005 - 137,904 28,159
20000070 Assistant Engineer-Civil 8.42 8.42 8.19 57,866 - 69,722 531,889
20000087 Assistant Engineer-Mechanical 0.61 0.61 0.61 57,866 - 69,722 35,294
20000080 Assistant Laboratory Technician 1.00 1.00 1.00 33,696 - 40,602 40,602
20000041 Assistant Management Analyst 0.33 0.33 0.33 44,470 - 54,059 17,843
20001228 Assistant Metropolitan Wastewater Director
0.33 0.33 0.33 31,741 - 173,971 46,199
20000140 Associate Chemist 7.25 7.25 7.25 62,005 - 75,067 540,483
20000311 Associate Department Human Resources Analyst
1.65 1.65 0.66 54,059 - 65,333 43,130
20000145 Associate Engineer-Civil 0.83 1.16 1.33 66,622 - 80,454 101,252
20000143 Associate Engineer-Civil 11.34 10.73 10.95 66,622 - 80,454 857,847
90000143 Associate Engineer-Civil - Hourly 0.35 0.00 0.00 66,622 - 80,454 -
20000150 Associate Engineer-Electrical 2.61 3.22 3.22 66,622 - 80,454 245,228
90000150 Associate Engineer-Electrical - Hourly
0.00 0.35 0.35 66,622 - 80,454 25,626
20000154 Associate Engineer-Mechanical 0.61 0.61 0.61 66,622 - 80,454 47,238
20000132 Associate Management Analyst 0.33 0.33 0.33 54,059 - 65,333 17,843
20000119 Associate Management Analyst 11.21 11.04 11.10 54,059 - 65,333 669,724
20000134 Associate Management Analyst 0.33 0.33 0.33 54,059 - 65,333 21,565
90000119 Associate Management Analyst - Hourly
0.08 0.08 0.08 54,059 - 65,333 4,749
20000162 Associate Planner 0.34 0.34 0.46 56,722 - 68,536 27,046
20000655 Biologist 2 6.00 6.00 7.00 53,726 - 65,333 442,680
20000649 Biologist 3 0.24 0.24 0.24 62,005 - 75,067 17,662
20000648 Biologist 3 1.50 3.50 3.50 62,005 - 75,067 241,350
20000195 Boat Operator 1.00 1.00 1.00 43,493 - 51,896 49,054
20000201 Building Maintenance Supervisor 0.00 0.00 0.33 61,859 - 74,797 24,314
20000205 Building Service Supervisor 1.34 1.34 1.34 45,718 - 55,286 74,079
20000224 Building Service Technician 2.34 2.34 1.34 33,322 - 39,666 52,916
20000539 Clerical Assistant 2 8.32 5.99 2.99 29,931 - 36,067 106,338
20000306 Code Compliance Officer 0.44 0.44 0.44 37,232 - 44,803 16,368
20000307 Code Compliance Supervisor 0.11 0.11 0.00 42,890 - 51,334 -
20000545 Contracts Processing Clerk 0.00 0.33 0.33 32,968 - 39,811 13,138
20001168 Deputy Director 2.44 2.44 2.44 46,966 - 172,744 302,800
90001168 Deputy Director - Hourly 0.25 0.00 0.00 46,966 - 172,744 -
20000434 Electronics Technician 0.33 0.33 0.33 47,091 - 56,534 18,390
20000438 Equipment Painter 2.00 2.00 2.00 44,366 - 53,206 97,572
20000924 Executive Secretary 0.33 0.33 0.33 43,555 - 52,666 17,113
90000924 Executive Secretary - Hourly 0.11 0.00 0.00 43,555 - 52,666 -
20000461 Field Representative 0.55 0.55 0.55 32,323 - 38,917 20,865
Personnel Expenditures (Cont’d)JobNumber Job Title / Wages
FY2016Budget
FY2017Budget
FY2018Adopted Salary Range Total

Public Utilities
- 472 -City of San DiegoFiscal Year 2018 Adopted Budget
20000184 Fleet Parts Buyer 1.00 1.00 1.00 44,637 - 54,059 50,493
90000819 Golf Course Manager - Hourly 0.04 0.00 0.00 59,488 - 71,760 -
20000501 Heavy Truck Driver 2 3.00 3.00 3.00 37,565 - 45,302 135,906
20000178 Information Systems Administrator
0.34 0.34 0.34 73,466 - 88,982 30,253
20000290 Information Systems Analyst 2 3.06 2.04 2.04 54,059 - 65,333 125,398
20000293 Information Systems Analyst 3 2.38 2.38 2.38 59,363 - 71,760 166,560
20000998 Information Systems Analyst 4 1.36 1.36 1.36 66,768 - 80,891 108,857
20000999 Information Systems Analyst 4 1.00 1.00 1.00 66,768 - 80,891 80,891
20000514 Instrumentation and Control Supervisor
1.00 1.00 1.00 56,410 - 68,224 68,224
20000515 Instrumentation and Control Technician
8.00 8.00 8.00 51,896 - 62,296 459,348
90000515 Instrumentation and Control Technician - Hourly
0.35 0.35 0.70 51,896 - 62,296 39,706
20000497 Irrigation Specialist 0.33 0.33 0.33 37,814 - 45,261 14,843
20000590 Laboratory Technician 19.00 20.00 20.00 40,622 - 49,067 938,004
20000618 Machinist 4.00 4.00 4.00 46,134 - 55,266 211,103
90001073 Management Intern - Hourly 2.06 0.74 1.34 24,274 - 29,203 36,055
20000624 Marine Biologist 2 17.00 17.00 17.00 53,726 - 65,333 1,076,003
20000625 Marine Biologist 2 1.00 1.00 0.00 53,726 - 65,333 -
20000626 Marine Biologist 3 5.00 4.00 4.00 62,005 - 75,067 300,268
20000634 Organization Effectiveness Specialist 2
0.99 0.99 0.88 54,059 - 65,333 57,507
20000627 Organization Effectiveness Specialist 3
0.55 0.55 0.66 59,363 - 71,760 47,352
20000639 Organization Effectiveness Supervisor
0.66 0.66 0.33 66,768 - 80,891 26,350
20000667 Painter 3.00 3.00 3.00 41,600 - 49,962 144,014
20000680 Payroll Specialist 2 3.30 3.30 3.30 34,611 - 41,787 126,169
20000173 Payroll Supervisor 0.66 0.66 0.66 39,686 - 48,069 31,413
20000701 Plant Process Control Electrician 19.00 19.00 19.00 51,896 - 62,296 1,129,797
20000705 Plant Process Control Supervisor 6.33 6.33 7.33 56,410 - 68,224 491,654
20000703 Plant Process Control Supervisor 3.00 3.00 3.00 56,410 - 68,224 203,649
20000687 Plant Technician 1 22.00 21.00 21.00 37,814 - 45,261 912,567
20000688 Plant Technician 2 25.00 25.00 25.00 41,454 - 49,504 1,215,444
20000689 Plant Technician 3 14.00 14.00 14.00 45,490 - 54,434 758,365
20000706 Plant Technician Supervisor 9.00 9.00 8.00 52,666 - 62,837 501,753
20000732 Power Plant Operator 4.00 4.00 4.00 49,712 - 59,342 223,329
20000733 Power Plant Supervisor 2.00 2.00 2.00 55,141 - 66,581 133,162
21000184 Principal Backflow & Cross Connection Specialist
0.11 0.11 0.22 50,003 - 60,549 13,032
20000740 Principal Drafting Aide 0.88 0.88 0.88 50,003 - 60,549 52,881
20000743 Principal Engineering Aide 2.01 2.01 1.68 50,003 - 60,549 101,623
Personnel Expenditures (Cont’d)JobNumber Job Title / Wages
FY2016Budget
FY2017Budget
FY2018Adopted Salary Range Total
Public Utilities
- 473 - City of San DiegoFiscal Year 2018 Adopted Budget
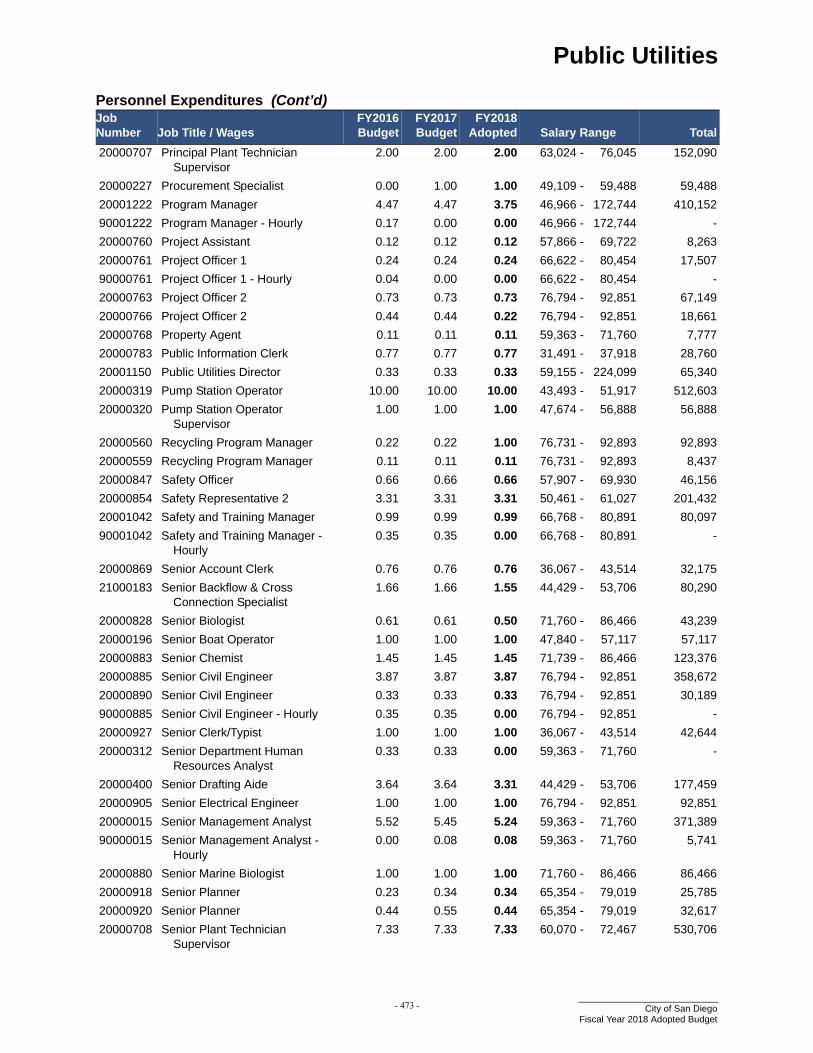
20000707 Principal Plant Technician Supervisor
2.00 2.00 2.00 63,024 - 76,045 152,090
20000227 Procurement Specialist 0.00 1.00 1.00 49,109 - 59,488 59,488
20001222 Program Manager 4.47 4.47 3.75 46,966 - 172,744 410,152
90001222 Program Manager - Hourly 0.17 0.00 0.00 46,966 - 172,744 -
20000760 Project Assistant 0.12 0.12 0.12 57,866 - 69,722 8,263
20000761 Project Officer 1 0.24 0.24 0.24 66,622 - 80,454 17,507
90000761 Project Officer 1 - Hourly 0.04 0.00 0.00 66,622 - 80,454 -
20000763 Project Officer 2 0.73 0.73 0.73 76,794 - 92,851 67,149
20000766 Project Officer 2 0.44 0.44 0.22 76,794 - 92,851 18,661
20000768 Property Agent 0.11 0.11 0.11 59,363 - 71,760 7,777
20000783 Public Information Clerk 0.77 0.77 0.77 31,491 - 37,918 28,760
20001150 Public Utilities Director 0.33 0.33 0.33 59,155 - 224,099 65,340
20000319 Pump Station Operator 10.00 10.00 10.00 43,493 - 51,917 512,603
20000320 Pump Station Operator Supervisor
1.00 1.00 1.00 47,674 - 56,888 56,888
20000560 Recycling Program Manager 0.22 0.22 1.00 76,731 - 92,893 92,893
20000559 Recycling Program Manager 0.11 0.11 0.11 76,731 - 92,893 8,437
20000847 Safety Officer 0.66 0.66 0.66 57,907 - 69,930 46,156
20000854 Safety Representative 2 3.31 3.31 3.31 50,461 - 61,027 201,432
20001042 Safety and Training Manager 0.99 0.99 0.99 66,768 - 80,891 80,097
90001042 Safety and Training Manager - Hourly
0.35 0.35 0.00 66,768 - 80,891 -
20000869 Senior Account Clerk 0.76 0.76 0.76 36,067 - 43,514 32,175
21000183 Senior Backflow & Cross Connection Specialist
1.66 1.66 1.55 44,429 - 53,706 80,290
20000828 Senior Biologist 0.61 0.61 0.50 71,760 - 86,466 43,239
20000196 Senior Boat Operator 1.00 1.00 1.00 47,840 - 57,117 57,117
20000883 Senior Chemist 1.45 1.45 1.45 71,739 - 86,466 123,376
20000885 Senior Civil Engineer 3.87 3.87 3.87 76,794 - 92,851 358,672
20000890 Senior Civil Engineer 0.33 0.33 0.33 76,794 - 92,851 30,189
90000885 Senior Civil Engineer - Hourly 0.35 0.35 0.00 76,794 - 92,851 -
20000927 Senior Clerk/Typist 1.00 1.00 1.00 36,067 - 43,514 42,644
20000312 Senior Department Human Resources Analyst
0.33 0.33 0.00 59,363 - 71,760 -
20000400 Senior Drafting Aide 3.64 3.64 3.31 44,429 - 53,706 177,459
20000905 Senior Electrical Engineer 1.00 1.00 1.00 76,794 - 92,851 92,851
20000015 Senior Management Analyst 5.52 5.45 5.24 59,363 - 71,760 371,389
90000015 Senior Management Analyst - Hourly
0.00 0.08 0.08 59,363 - 71,760 5,741
20000880 Senior Marine Biologist 1.00 1.00 1.00 71,760 - 86,466 86,466
20000918 Senior Planner 0.23 0.34 0.34 65,354 - 79,019 25,785
20000920 Senior Planner 0.44 0.55 0.44 65,354 - 79,019 32,617
20000708 Senior Plant Technician Supervisor
7.33 7.33 7.33 60,070 - 72,467 530,706
Personnel Expenditures (Cont’d)JobNumber Job Title / Wages
FY2016Budget
FY2017Budget
FY2018Adopted Salary Range Total

Public Utilities
- 474 -City of San DiegoFiscal Year 2018 Adopted Budget
20000968 Senior Power Plant Supervisor 1.00 1.00 1.00 63,357 - 76,440 76,440
90000968 Senior Power Plant Supervisor - Hourly
0.35 0.35 0.00 63,357 - 76,440 -
20000938 Senior Wastewater Operations Supervisor
6.00 6.00 6.00 70,699 - 85,530 498,179
20000055 Senior Wastewater Plant Operator
1.00 2.00 2.00 56,534 - 67,621 133,322
20000950 Stock Clerk 5.34 5.34 5.34 30,056 - 36,275 188,999
20000955 Storekeeper 1 3.34 3.34 3.34 34,611 - 41,517 138,443
20000956 Storekeeper 2 2.00 2.00 2.00 37,835 - 45,718 90,522
20000954 Storekeeper 3 1.00 1.00 1.00 39,811 - 47,882 46,924
90000964 Student Engineer - Hourly 0.54 0.96 0.58 26,707 - 32,011 16,812
20000313 Supervising Department Human Resources Analyst
0.33 0.66 0.66 66,768 - 80,891 48,731
20000995 Supervising Economist 0.41 0.41 0.41 66,768 - 80,891 33,167
20000990 Supervising Field Representative 0.11 0.11 0.11 35,651 - 42,890 4,716
20000985 Supervising Management Analyst 0.11 0.11 0.11 66,768 - 80,891 8,903
20000970 Supervising Management Analyst 3.90 4.01 4.51 66,768 - 80,891 358,348
21000177 Trainer 1.98 1.98 1.98 54,059 - 65,333 117,171
20001041 Training Supervisor 0.22 0.22 0.55 59,363 - 71,760 38,519
20000937 Wastewater Operations Supervisor
25.00 25.00 25.00 64,667 - 77,293 1,916,846
20000941 Wastewater Plant Operator 42.00 41.00 41.00 53,830 - 64,397 2,467,277
20000931 Wastewater Treatment Superintendent
4.00 4.00 4.00 81,578 - 98,675 360,506
90000931 Wastewater Treatment Superintendent - Hourly
0.35 0.70 0.80 81,578 - 98,675 71,968
20001058 Welder 2.00 2.00 2.00 44,366 - 53,206 105,614
20000756 Word Processing Operator 5.32 7.21 9.10 31,491 - 37,918 336,586
Bilingual - Regular 5,624
Budgeted Vacancy Savings (1,546,641)
Exceptional Performance Pay-Classified 927
Exceptional Performance Pay-Unclassified 1,045
Geographic Info Cert Pay 2,655
Night Shift Pay 99,597
Overtime Budgeted 2,425,452
Plant/Tank Vol Cert Pay 72,368
Reg Pay For Engineers 172,356
Sick Leave - Hourly 4,942
Split Shift Pay 14,249
Termination Pay Annual Leave 84,326
Vacation Pay In Lieu 45,930
Welding Certification 3,640
FTE, Salaries, and Wages Subtotal 462.21 462.20 458.86 $ 29,474,819
Personnel Expenditures (Cont’d)JobNumber Job Title / Wages
FY2016Budget
FY2017Budget
FY2018Adopted Salary Range Total

Public Utilities
- 475 - City of San DiegoFiscal Year 2018 Adopted Budget
Municipal Sewer Revenue Fund
FY2016Actual
FY2017Budget
FY2018Adopted
FY2017–2018Change
Fringe BenefitsEmployee Offset Savings $ 146,640 $ 140,448 $ 139,845 $ (603)Flexible Benefits 3,378,375 4,356,819 4,978,365 621,546Long-Term Disability 83,513 84,958 - (84,958)Medicare 395,348 365,496 364,801 (695)Other Post-Employment Benefits 2,530,145 2,583,434 2,561,107 (22,327)Retiree Medical Trust 14,139 17,589 18,900 1,311Retirement 401 Plan 20,433 20,049 19,472 (577)Retirement ADC 8,546,062 8,698,892 10,745,165 2,046,273Retirement DROP 136,007 127,543 150,403 22,860Risk Management Administration 429,854 445,999 431,919 (14,080)Supplemental Pension Savings Plan 1,642,846 1,655,861 1,664,503 8,642Unemployment Insurance 47,540 48,716 47,553 (1,163)Workers' Compensation 653,168 675,229 681,836 6,607
Fringe Benefits Subtotal $ 18,024,071 $ 19,221,033 $ 21,803,869 $ 2,582,836
Total Personnel Expenditures $ 51,278,688
Department Expenditures FY2016Actual
FY2017Budget
FY2018Adopted
FY2017–2018Change
Metropolitan Wastewater - Muni $ 45,983,700 $ - $ - $ -Public Utilities 76,774,684 133,936,893 128,128,232 (5,808,661)
Total $ 122,758,385 $ 133,936,893 $ 128,128,232 $ (5,808,661)
Department Personnel FY2016Budget
FY2017Budget
FY2018Adopted
FY2017–2018Change
Metropolitan Wastewater - Muni 234.00 0.00 0.00 0.00Public Utilities 175.32 400.71 401.04 0.33
Total 409.32 400.71 401.04 0.33
Significant Budget Adjustments FTE Expenditures Revenue
Pipeline Condition AssessmentsAddition of one-time non-personnel expenditures for condition assessments associated with programmatic wastewater pipelines and CIP project planning.
0.00 $ 1,750,000 $ -
Salary and Benefit AdjustmentsAdjustments to reflect savings resulting from vacant positions for any period of the fiscal year, retirement contributions, retiree health contributions, and labor negotiations.
(0.01) 1,245,475 -
Support for Information TechnologyAdjustment to expenditure allocations according to a zero-based annual review of information technology funding requirements.
0.00 871,467 -
Public Utilities
- 476 -City of San DiegoFiscal Year 2018 Adopted Budget
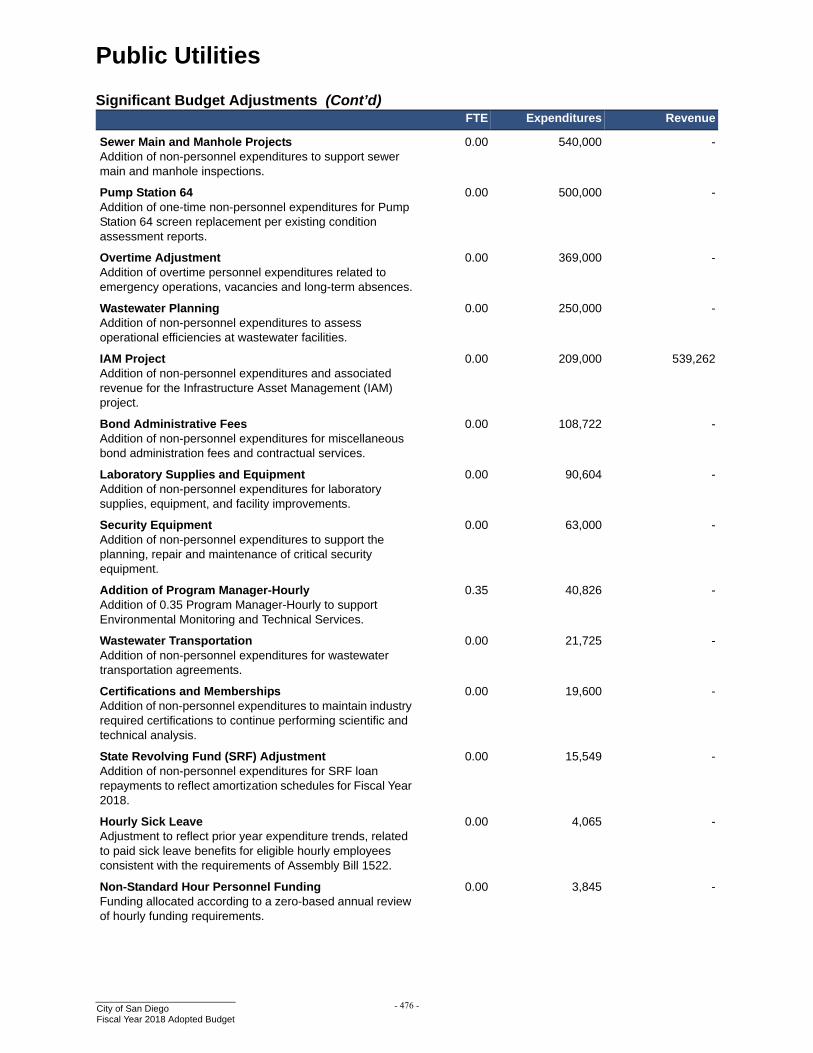
Sewer Main and Manhole ProjectsAddition of non-personnel expenditures to support sewer main and manhole inspections.
0.00 540,000 -
Pump Station 64Addition of one-time non-personnel expenditures for Pump Station 64 screen replacement per existing condition assessment reports.
0.00 500,000 -
Overtime AdjustmentAddition of overtime personnel expenditures related to emergency operations, vacancies and long-term absences.
0.00 369,000 -
Wastewater PlanningAddition of non-personnel expenditures to assess operational efficiencies at wastewater facilities.
0.00 250,000 -
IAM ProjectAddition of non-personnel expenditures and associated revenue for the Infrastructure Asset Management (IAM) project.
0.00 209,000 539,262
Bond Administrative FeesAddition of non-personnel expenditures for miscellaneous bond administration fees and contractual services.
0.00 108,722 -
Laboratory Supplies and EquipmentAddition of non-personnel expenditures for laboratory supplies, equipment, and facility improvements.
0.00 90,604 -
Security EquipmentAddition of non-personnel expenditures to support the planning, repair and maintenance of critical security equipment.
0.00 63,000 -
Addition of Program Manager-HourlyAddition of 0.35 Program Manager-Hourly to support Environmental Monitoring and Technical Services.
0.35 40,826 -
Wastewater TransportationAddition of non-personnel expenditures for wastewater transportation agreements.
0.00 21,725 -
Certifications and MembershipsAddition of non-personnel expenditures to maintain industry required certifications to continue performing scientific and technical analysis.
0.00 19,600 -
State Revolving Fund (SRF) AdjustmentAddition of non-personnel expenditures for SRF loan repayments to reflect amortization schedules for Fiscal Year 2018.
0.00 15,549 -
Hourly Sick LeaveAdjustment to reflect prior year expenditure trends, related to paid sick leave benefits for eligible hourly employees consistent with the requirements of Assembly Bill 1522.
0.00 4,065 -
Non-Standard Hour Personnel FundingFunding allocated according to a zero-based annual review of hourly funding requirements.
0.00 3,845 -
Significant Budget Adjustments (Cont’d)FTE Expenditures Revenue

Public Utilities
- 477 - City of San DiegoFiscal Year 2018 Adopted Budget
Supplemental Cost of Living Adjustment (COLA)Adjustment to reflect the allocation of the pay-go costs for the continued funding of the Supplemental COLA Benefit.
0.00 612 -
Human Resources Functions ConsolidationTransfer of 0.54 FTE positions to the Human Resources Department from the Public Utilities Department for centralized human resources support.
(0.54) (67,726) -
Employee TrainingReduction of non-personnel expenditures associated with employee training.
0.00 (105,250) -
Public Utilities RestructureReallocation among funds as a result of departmental efficiency efforts.
0.53 (162,112) -
Environmental Compliance ProjectsReduction of non-personnel expenditures associated with environmental compliance services.
0.00 (325,000) -
One-Time Reductions and AnnualizationsAdjustment to reflect the removal of one-time revenues and expenditures, and the annualization of revenues and expenditures, implemented in Fiscal Year 2017.
0.00 (789,680) -
Environmental ProjectsReduction of non-personnel expenditures associated with environmental restoration projects.
0.00 (2,450,000) -
Non-Discretionary AdjustmentAdjustment to expenditure allocations that are determined outside of the department's direct control. These allocations are generally based on prior year expenditure trends and examples of these include utilities, insurance, and rent.
0.00 (8,012,383) -
Revised RevenueAdjustment to reflect revised revenue projections.
0.00 - (8,300,900)
Total 0.33 $ (5,808,661) $ (7,761,638)
Expenditures by Category FY2016Actual
FY2017Budget
FY2018Adopted
FY2017–2018Change
PERSONNELPersonnel Cost $ 23,168,663 $ 22,579,254 $ 22,182,890 $ (396,364)Fringe Benefits 15,543,010 16,302,773 18,109,510 1,806,737
PERSONNEL SUBTOTAL 38,711,673 38,882,027 40,292,400 1,410,373
NON-PERSONNELSupplies $ 3,742,813 $ 5,220,637 $ 5,426,572 $ 205,935Contracts 30,028,624 37,125,308 37,175,902 50,594Information Technology 3,159,314 3,656,544 4,528,011 871,467Energy and Utilities 5,202,957 6,670,796 5,762,418 (908,378)Other 187,938 173,863 120,475 (53,388)Transfers Out 41,549,743 41,288,916 33,990,470 (7,298,446)Capital Expenditures 362,760 712,744 625,927 (86,817)Debt (187,439) 206,058 206,057 (1)
NON-PERSONNEL SUBTOTAL 84,046,711 95,054,866 87,835,832 (7,219,034)
Significant Budget Adjustments (Cont’d)FTE Expenditures Revenue

Public Utilities
- 478 -City of San DiegoFiscal Year 2018 Adopted Budget
Total $ 122,758,385 $ 133,936,893 $ 128,128,232 $ (5,808,661)
Revenues by Category FY2016Actual
FY2017Budget
FY2018Adopted
FY2017–2018Change
Charges for Services $ 282,315,468 $ 288,747,000 $ 279,785,362 $ (8,961,638)Other Revenue 414,494 - - -Rev from Money and Prop 2,215,334 910,400 2,110,400 1,200,000Rev from Other Agencies 29,975 - - -Transfers In 6,978,525 - - -
Total $ 291,953,796 $ 289,657,400 $ 281,895,762 $ (7,761,638)
Personnel Expenditures JobNumber Job Title / Wages
FY2016Budget
FY2017Budget
FY2018Adopted Salary Range Total
FTE, Salaries, and Wages
20000011 Account Clerk 2.82 2.82 2.64 $31,491 - $37,918 $ 98,843
20000007 Accountant 3 0.18 0.18 0.18 59,363 - 71,760 12,918
20000102 Accountant 4 0.18 0.18 0.18 66,768 - 88,982 16,020
90000102 Accountant 4 - Hourly 0.00 0.06 0.06 66,768 - 88,982 5,339
20000012 Administrative Aide 1 1.54 0.68 0.86 36,962 - 44,533 33,742
20000024 Administrative Aide 2 4.02 5.38 5.74 42,578 - 51,334 277,742
20000057 Assistant Chemist 10.00 10.00 10.00 53,789 - 65,333 620,557
20000058 Assistant Customer Services Supervisor
0.50 0.50 0.50 50,170 - 60,466 30,239
20001140 Assistant Department Director 0.36 0.36 0.36 31,741 - 173,971 50,399
20000070 Assistant Engineer-Civil 9.97 9.97 10.58 57,866 - 69,722 695,947
20000087 Assistant Engineer-Mechanical 0.16 0.16 0.16 57,866 - 69,722 9,264
20000041 Assistant Management Analyst 0.18 0.18 0.18 44,470 - 54,059 9,732
20001228 Assistant Metropolitan Wastewater Director
0.18 0.18 0.18 31,741 - 173,971 25,199
20000140 Associate Chemist 4.50 4.50 4.50 62,005 - 75,067 298,615
20000311 Associate Department Human Resources Analyst
0.90 0.90 0.36 54,059 - 65,333 23,522
20000143 Associate Engineer-Civil 9.06 8.31 8.31 66,622 - 80,454 660,940
20000145 Associate Engineer-Civil 0.44 0.62 0.70 66,622 - 80,454 53,220
20000150 Associate Engineer-Electrical 0.16 0.32 0.32 66,622 - 80,454 25,750
20000154 Associate Engineer-Mechanical 0.16 0.16 0.16 66,622 - 80,454 12,393
20000134 Associate Management Analyst 0.18 0.18 0.18 54,059 - 65,333 11,761
20000119 Associate Management Analyst 7.65 7.55 7.58 54,059 - 65,333 460,310
20000132 Associate Management Analyst 0.18 0.18 0.18 54,059 - 65,333 9,732
90000119 Associate Management Analyst - Hourly
0.05 0.05 0.05 54,059 - 65,333 2,968
20000162 Associate Planner 0.67 0.67 1.34 56,722 - 68,536 76,019
20000648 Biologist 3 0.00 1.25 1.25 62,005 - 75,067 91,870
20000649 Biologist 3 1.34 1.34 1.34 62,005 - 75,067 98,584
Expenditures by Category (Cont’d)FY2016Actual
FY2017Budget
FY2018Adopted
FY2017–2018Change

Public Utilities
- 479 - City of San DiegoFiscal Year 2018 Adopted Budget
20000201 Building Maintenance Supervisor 0.00 0.00 0.18 61,859 - 74,797 13,261
20000205 Building Service Supervisor 0.33 0.33 0.33 45,718 - 55,286 18,252
20000224 Building Service Technician 0.33 0.33 0.33 33,322 - 39,666 12,868
20000266 Cashier 2.50 2.50 2.50 31,491 - 37,918 90,826
20000236 Cement Finisher 1.00 1.00 1.00 43,451 - 52,083 51,041
20000539 Clerical Assistant 2 2.72 2.54 3.54 29,931 - 36,067 120,865
20000306 Code Compliance Officer 0.50 1.00 1.00 37,232 - 44,803 44,802
20000829 Compliance and Metering Manager
1.00 1.00 1.00 73,445 - 88,837 88,788
20000545 Contracts Processing Clerk 0.00 0.18 0.18 32,968 - 39,811 7,163
20000801 Customer Information and Billing Manager
1.00 1.00 1.00 73,445 - 88,837 81,142
20000369 Customer Services Representative
21.50 22.00 22.00 32,968 - 39,811 825,624
90000369 Customer Services Representative - Hourly
1.50 2.00 2.00 32,968 - 39,811 72,135
20000366 Customer Services Supervisor 2.00 2.00 2.00 57,782 - 69,784 137,354
20001168 Deputy Director 2.37 2.37 2.37 46,966 - 172,744 284,484
90001168 Deputy Director - Hourly 0.17 0.00 0.00 46,966 - 172,744 -
20000434 Electronics Technician 0.18 0.18 0.18 47,091 - 56,534 10,029
20000429 Equipment Operator 1 31.00 31.00 31.00 37,690 - 45,115 1,360,520
20000430 Equipment Operator 2 12.00 12.00 12.00 41,350 - 49,462 580,708
20000436 Equipment Operator 3 2.00 2.00 2.00 43,160 - 51,667 103,334
20000418 Equipment Technician 1 11.00 11.00 8.00 36,005 - 43,139 336,252
20000423 Equipment Technician 2 10.00 10.00 8.00 39,499 - 47,091 359,896
20000431 Equipment Technician 3 1.00 1.00 1.00 43,368 - 51,813 51,757
20000924 Executive Secretary 0.18 0.18 0.18 43,555 - 52,666 9,336
90000924 Executive Secretary - Hourly 0.06 0.00 0.00 43,555 - 52,666 -
20000461 Field Representative 14.00 14.00 14.00 32,323 - 38,917 530,919
90000461 Field Representative - Hourly 3.25 1.63 1.63 32,323 - 38,917 58,111
20000483 General Water Utility Supervisor 4.00 4.00 4.00 59,342 - 71,760 287,040
20000502 Heavy Truck Driver 1 1.00 1.00 1.00 36,234 - 43,160 43,160
20000501 Heavy Truck Driver 2 1.00 1.00 1.00 37,565 - 45,302 45,302
20000178 Information Systems Administrator
0.19 0.19 0.19 73,466 - 88,982 16,908
20000290 Information Systems Analyst 2 2.21 1.64 1.64 54,059 - 65,333 101,613
20000293 Information Systems Analyst 3 1.83 1.83 1.83 59,363 - 71,760 122,759
20000998 Information Systems Analyst 4 0.76 0.76 0.76 66,768 - 80,891 60,841
20000377 Information Systems Technician 0.50 0.50 0.50 42,578 - 51,334 23,686
20000590 Laboratory Technician 9.00 8.00 8.00 40,622 - 49,067 382,010
90000589 Laborer - Hourly 3.00 2.00 2.00 29,182 - 34,757 58,364
90001073 Management Intern - Hourly 1.80 2.70 2.70 24,274 - 29,203 72,055
20000634 Organization Effectiveness Specialist 2
0.54 0.54 0.74 54,059 - 65,333 48,352
Personnel Expenditures (Cont’d)JobNumber Job Title / Wages
FY2016Budget
FY2017Budget
FY2018Adopted Salary Range Total

Public Utilities
- 480 -City of San DiegoFiscal Year 2018 Adopted Budget
20000627 Organization Effectiveness Specialist 3
0.56 0.56 0.36 59,363 - 71,760 25,848
20000639 Organization Effectiveness Supervisor
0.36 0.36 0.18 66,768 - 80,891 14,367
20000680 Payroll Specialist 2 1.80 1.80 1.80 34,611 - 41,787 68,843
20000173 Payroll Supervisor 0.36 0.36 0.36 39,686 - 48,069 17,136
20000701 Plant Process Control Electrician 8.00 8.00 8.00 51,896 - 62,296 457,652
20000703 Plant Process Control Supervisor 1.00 1.00 1.00 56,410 - 68,224 67,991
20000705 Plant Process Control Supervisor 5.18 5.18 6.18 56,410 - 68,224 416,703
20000740 Principal Drafting Aide 0.74 0.74 0.74 50,003 - 60,549 44,579
20000743 Principal Engineering Aide 9.66 9.66 8.20 50,003 - 60,549 491,051
20000750 Principal Water Utility Supervisor 2.00 2.00 2.00 52,000 - 62,837 125,674
20001222 Program Manager 2.57 2.57 2.67 46,966 - 172,744 291,178
90001222 Program Manager - Hourly 0.17 0.00 0.35 46,966 - 172,744 38,449
20000760 Project Assistant 0.67 0.67 0.67 57,866 - 69,722 46,153
20000761 Project Officer 1 1.34 1.34 1.34 66,622 - 80,454 97,727
20000766 Project Officer 2 0.18 0.18 0.00 76,794 - 92,851 -
20000763 Project Officer 2 0.83 0.83 0.83 76,794 - 92,851 73,534
20000783 Public Information Clerk 0.36 0.36 0.36 31,491 - 37,918 13,424
20001150 Public Utilities Director 0.18 0.18 0.18 59,155 - 224,099 35,640
20000319 Pump Station Operator 5.00 5.00 5.00 43,493 - 51,917 259,283
20000320 Pump Station Operator Supervisor
1.00 1.00 1.00 47,674 - 56,888 56,888
20000560 Recycling Program Manager 0.38 0.38 0.00 76,731 - 92,893 -
20000847 Safety Officer 0.36 0.36 0.36 57,907 - 69,930 25,178
20000854 Safety Representative 2 1.95 1.95 1.95 50,461 - 61,027 118,579
20001042 Safety and Training Manager 0.54 0.54 0.54 66,768 - 80,891 43,668
20000869 Senior Account Clerk 0.44 0.44 0.44 36,067 - 43,514 18,638
20000883 Senior Chemist 1.30 1.30 1.30 71,739 - 86,466 97,684
20000890 Senior Civil Engineer 0.18 0.18 0.18 76,794 - 92,851 16,463
20000885 Senior Civil Engineer 2.44 2.44 2.44 76,794 - 92,851 225,671
20000898 Senior Customer Services Representative
3.00 3.00 3.00 37,835 - 45,781 135,333
20000312 Senior Department Human Resources Analyst
0.18 0.18 0.00 59,363 - 71,760 -
20000400 Senior Drafting Aide 1.44 1.44 1.26 44,429 - 53,706 67,456
20000900 Senior Engineering Aide 11.00 11.00 11.00 44,429 - 53,706 550,557
20000015 Senior Management Analyst 4.15 3.69 3.56 59,363 - 71,760 252,896
90000015 Senior Management Analyst - Hourly
0.00 0.05 0.05 59,363 - 71,760 3,588
20000920 Senior Planner 0.00 0.18 0.18 65,354 - 79,019 13,873
20000918 Senior Planner 0.67 0.67 0.67 65,354 - 79,019 52,943
20000708 Senior Plant Technician Supervisor
0.18 0.18 0.18 60,070 - 72,467 12,781
20000914 Senior Water Utility Supervisor 14.00 14.00 13.00 47,216 - 57,138 730,015
Personnel Expenditures (Cont’d)JobNumber Job Title / Wages
FY2016Budget
FY2017Budget
FY2018Adopted Salary Range Total
Public Utilities
- 481 - City of San DiegoFiscal Year 2018 Adopted Budget
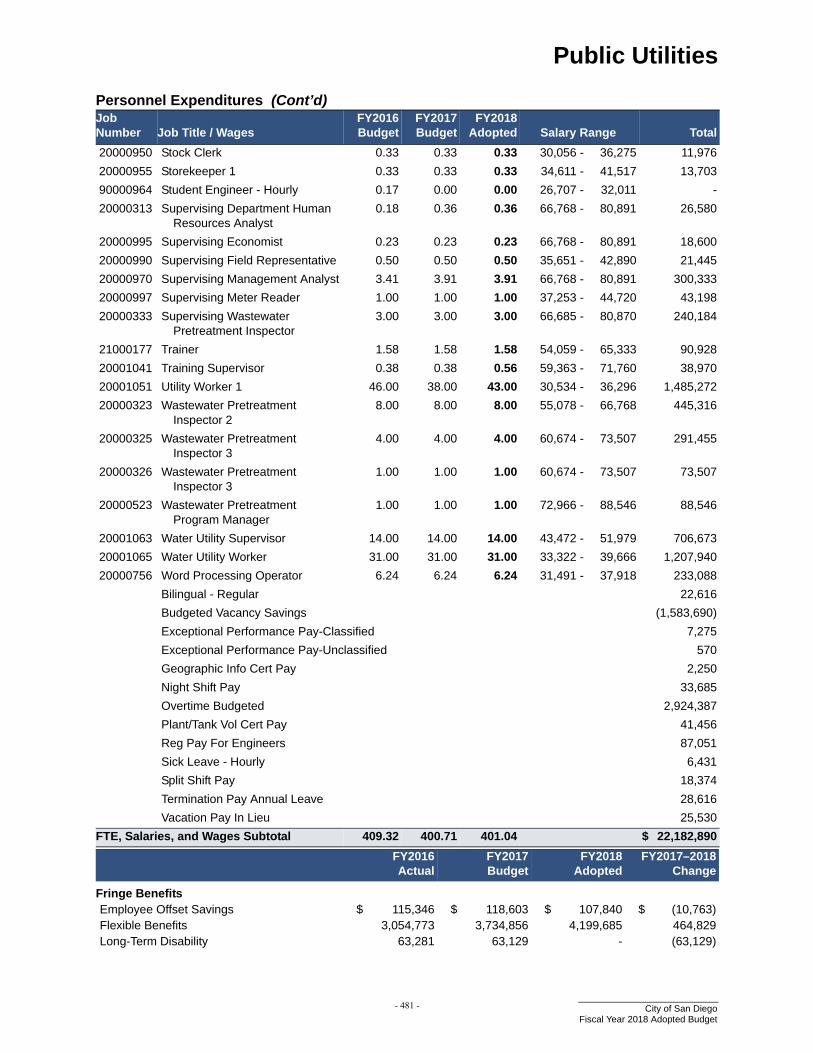
20000950 Stock Clerk 0.33 0.33 0.33 30,056 - 36,275 11,976
20000955 Storekeeper 1 0.33 0.33 0.33 34,611 - 41,517 13,703
90000964 Student Engineer - Hourly 0.17 0.00 0.00 26,707 - 32,011 -
20000313 Supervising Department Human Resources Analyst
0.18 0.36 0.36 66,768 - 80,891 26,580
20000995 Supervising Economist 0.23 0.23 0.23 66,768 - 80,891 18,600
20000990 Supervising Field Representative 0.50 0.50 0.50 35,651 - 42,890 21,445
20000970 Supervising Management Analyst 3.41 3.91 3.91 66,768 - 80,891 300,333
20000997 Supervising Meter Reader 1.00 1.00 1.00 37,253 - 44,720 43,198
20000333 Supervising Wastewater Pretreatment Inspector
3.00 3.00 3.00 66,685 - 80,870 240,184
21000177 Trainer 1.58 1.58 1.58 54,059 - 65,333 90,928
20001041 Training Supervisor 0.38 0.38 0.56 59,363 - 71,760 38,970
20001051 Utility Worker 1 46.00 38.00 43.00 30,534 - 36,296 1,485,272
20000323 Wastewater Pretreatment Inspector 2
8.00 8.00 8.00 55,078 - 66,768 445,316
20000325 Wastewater Pretreatment Inspector 3
4.00 4.00 4.00 60,674 - 73,507 291,455
20000326 Wastewater Pretreatment Inspector 3
1.00 1.00 1.00 60,674 - 73,507 73,507
20000523 Wastewater Pretreatment Program Manager
1.00 1.00 1.00 72,966 - 88,546 88,546
20001063 Water Utility Supervisor 14.00 14.00 14.00 43,472 - 51,979 706,673
20001065 Water Utility Worker 31.00 31.00 31.00 33,322 - 39,666 1,207,940
20000756 Word Processing Operator 6.24 6.24 6.24 31,491 - 37,918 233,088
Bilingual - Regular 22,616
Budgeted Vacancy Savings (1,583,690)
Exceptional Performance Pay-Classified 7,275
Exceptional Performance Pay-Unclassified 570
Geographic Info Cert Pay 2,250
Night Shift Pay 33,685
Overtime Budgeted 2,924,387
Plant/Tank Vol Cert Pay 41,456
Reg Pay For Engineers 87,051
Sick Leave - Hourly 6,431
Split Shift Pay 18,374
Termination Pay Annual Leave 28,616
Vacation Pay In Lieu 25,530
FTE, Salaries, and Wages Subtotal 409.32 400.71 401.04 $ 22,182,890
FY2016Actual
FY2017Budget
FY2018Adopted
FY2017–2018Change
Fringe BenefitsEmployee Offset Savings $ 115,346 $ 118,603 $ 107,840 $ (10,763)Flexible Benefits 3,054,773 3,734,856 4,199,685 464,829Long-Term Disability 63,281 63,129 - (63,129)
Personnel Expenditures (Cont’d)JobNumber Job Title / Wages
FY2016Budget
FY2017Budget
FY2018Adopted Salary Range Total
Public Utilities
- 482 -City of San DiegoFiscal Year 2018 Adopted Budget
Sewer Utility - AB 1600 Fund
Water Utility - AB 1600 Fund
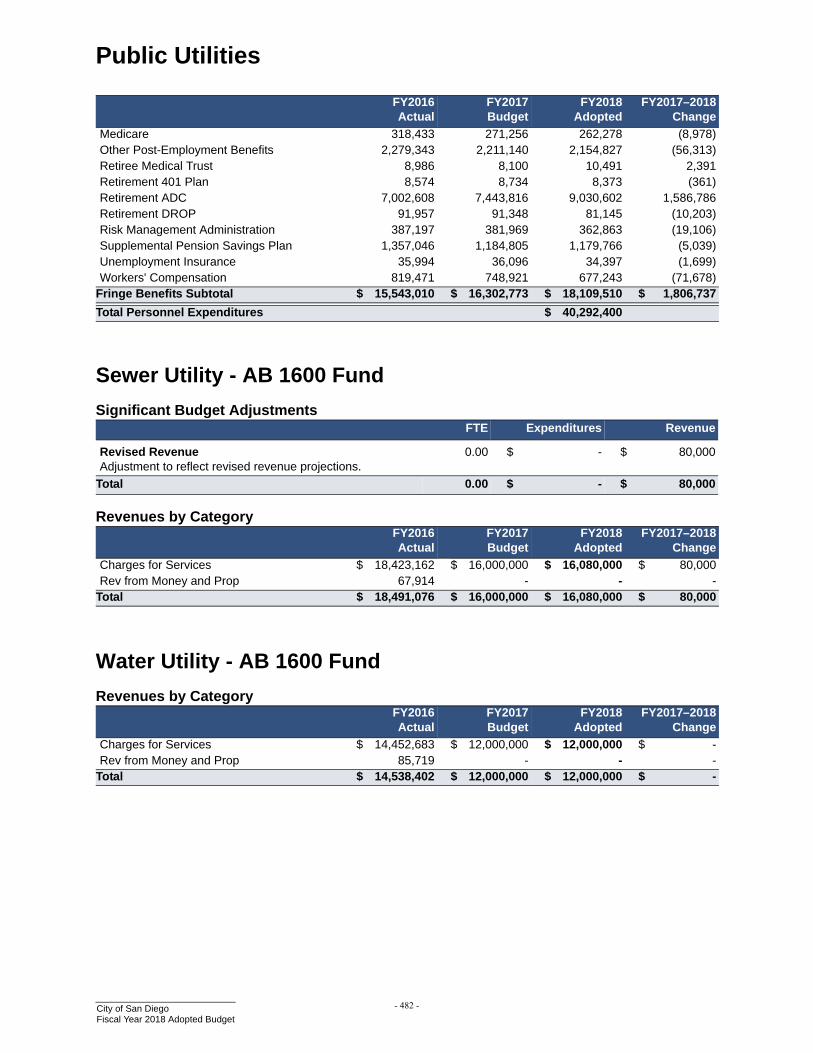
Medicare 318,433 271,256 262,278 (8,978)Other Post-Employment Benefits 2,279,343 2,211,140 2,154,827 (56,313)Retiree Medical Trust 8,986 8,100 10,491 2,391Retirement 401 Plan 8,574 8,734 8,373 (361)Retirement ADC 7,002,608 7,443,816 9,030,602 1,586,786Retirement DROP 91,957 91,348 81,145 (10,203)Risk Management Administration 387,197 381,969 362,863 (19,106)Supplemental Pension Savings Plan 1,357,046 1,184,805 1,179,766 (5,039)Unemployment Insurance 35,994 36,096 34,397 (1,699)Workers' Compensation 819,471 748,921 677,243 (71,678)
Fringe Benefits Subtotal $ 15,543,010 $ 16,302,773 $ 18,109,510 $ 1,806,737
Total Personnel Expenditures $ 40,292,400
Significant Budget Adjustments FTE Expenditures Revenue
Revised RevenueAdjustment to reflect revised revenue projections.
0.00 $ - $ 80,000
Total 0.00 $ - $ 80,000
Revenues by Category FY2016Actual
FY2017Budget
FY2018Adopted
FY2017–2018Change
Charges for Services $ 18,423,162 $ 16,000,000 $ 16,080,000 $ 80,000Rev from Money and Prop 67,914 - - -
Total $ 18,491,076 $ 16,000,000 $ 16,080,000 $ 80,000
Revenues by Category FY2016Actual
FY2017Budget
FY2018Adopted
FY2017–2018Change
Charges for Services $ 14,452,683 $ 12,000,000 $ 12,000,000 $ -Rev from Money and Prop 85,719 - - -
Total $ 14,538,402 $ 12,000,000 $ 12,000,000 $ -
FY2016Actual
FY2017Budget
FY2018Adopted
FY2017–2018Change
Public Utilities
- 483 - City of San DiegoFiscal Year 2018 Adopted Budget
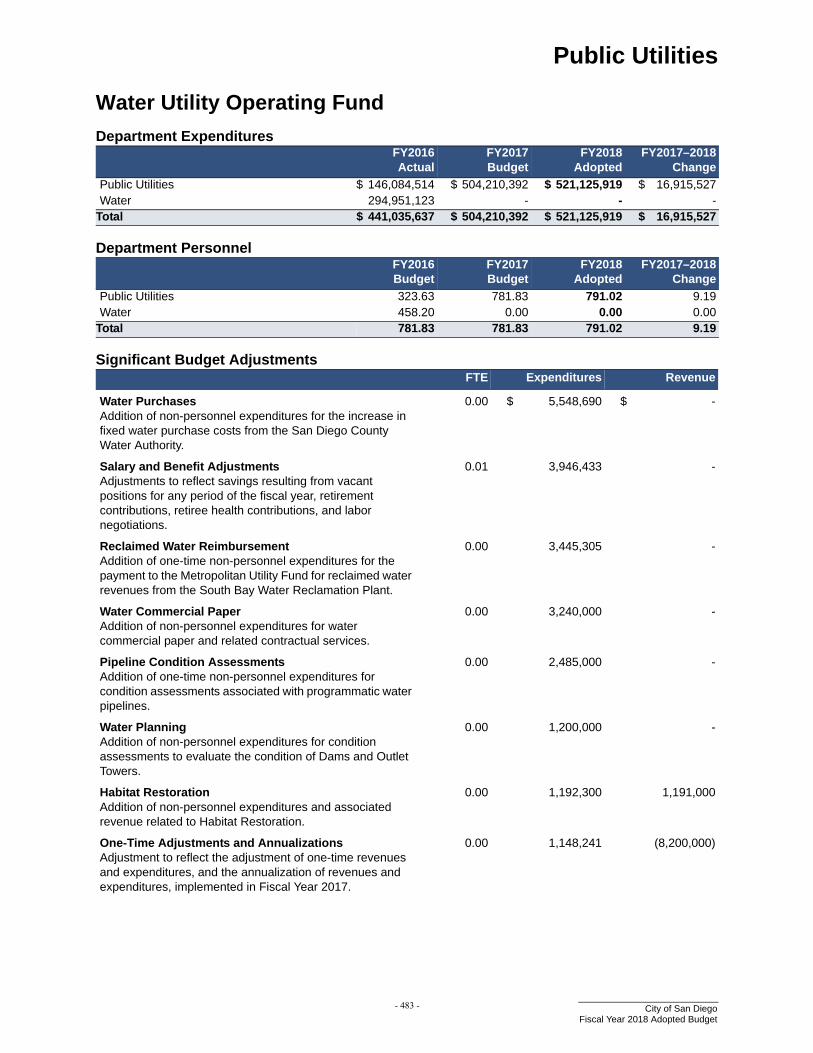
Water Utility Operating Fund
Department Expenditures FY2016Actual
FY2017Budget
FY2018Adopted
FY2017–2018Change
Public Utilities $ 146,084,514 $ 504,210,392 $ 521,125,919 $ 16,915,527Water 294,951,123 - - -
Total $ 441,035,637 $ 504,210,392 $ 521,125,919 $ 16,915,527
Department Personnel FY2016Budget
FY2017Budget
FY2018Adopted
FY2017–2018Change
Public Utilities 323.63 781.83 791.02 9.19Water 458.20 0.00 0.00 0.00
Total 781.83 781.83 791.02 9.19
Significant Budget Adjustments FTE Expenditures Revenue
Water PurchasesAddition of non-personnel expenditures for the increase in fixed water purchase costs from the San Diego County Water Authority.
0.00 $ 5,548,690 $ -
Salary and Benefit AdjustmentsAdjustments to reflect savings resulting from vacant positions for any period of the fiscal year, retirement contributions, retiree health contributions, and labor negotiations.
0.01 3,946,433 -
Reclaimed Water ReimbursementAddition of one-time non-personnel expenditures for the payment to the Metropolitan Utility Fund for reclaimed water revenues from the South Bay Water Reclamation Plant.
0.00 3,445,305 -
Water Commercial PaperAddition of non-personnel expenditures for water commercial paper and related contractual services.
0.00 3,240,000 -
Pipeline Condition AssessmentsAddition of one-time non-personnel expenditures for condition assessments associated with programmatic water pipelines.
0.00 2,485,000 -
Water PlanningAddition of non-personnel expenditures for condition assessments to evaluate the condition of Dams and Outlet Towers.
0.00 1,200,000 -
Habitat RestorationAddition of non-personnel expenditures and associated revenue related to Habitat Restoration.
0.00 1,192,300 1,191,000
One-Time Adjustments and AnnualizationsAdjustment to reflect the adjustment of one-time revenues and expenditures, and the annualization of revenues and expenditures, implemented in Fiscal Year 2017.
0.00 1,148,241 (8,200,000)

Public Utilities
- 484 -City of San DiegoFiscal Year 2018 Adopted Budget
Support for Information TechnologyAdjustment to expenditure allocations according to a zero-based annual review of information technology funding requirements.
0.00 1,079,868 -
Pure Water SupportAddition of 9.00 FTE positions to support the Pure Water program.
9.00 909,686 -
Groundwater Support Contract ConsultantAddition of non-personnel expenditures associated with consulting services for groundwater support.
0.00 850,000 -
Laboratory Supplies and EquipmentAddition of non-personnel expenditures for laboratory supplies, equipment, and facility improvements.
0.00 849,290 -
Contractual ServicesAddition of non-personnel expenditures associated with contractual services.
0.00 790,000 -
Otay Water Treatment PlantAddition of one-time non-personnel expenditures for filter replacement at the Otay Water Treatment Plant.
0.00 750,000 -
Vehicle and Equipment ReplacementsAddition of non-personnel expenditures for the replacement of equipment and vehicles.
0.00 687,996 -
Recycled Water Plan UpdateAddition of non-personnel expenditures to support the Recycled Water Master Plan Updates.
0.00 650,000 -
Meter ReplacementsAddition of one-time non-personnel expenditures for large meter head replacements to conduct flow meter testing on commercial water meters.
0.00 650,000 -
Groundwater ServicesAddition of non-personnel expenditures to support the rehabilitation and retrofit of groundwater wells.
0.00 476,772 -
Environmental Compliance ProjectsAddition of non-personnel expenditures for Environmental Compliance projects to support operations and planning activities.
0.00 325,000 -
Pure Water ProgramAddition of non-personnel expenditures for consulting services for the Pure Water program.
0.00 274,413 -
IAM ProjectAddition of non-personnel expenditures and associated revenue for the Infrastructure Asset Management (IAM) project.
0.00 220,000 567,644
Security EquipmentAddition of non-personnel expenditures to support the planning, repair and maintenance of critical security equipment.
0.00 171,500 -
Significant Budget Adjustments (Cont’d)FTE Expenditures Revenue

Public Utilities
- 485 - City of San DiegoFiscal Year 2018 Adopted Budget
Water Management SupportAddition of 1.00 Assistant Deputy Director to support the Water Construction and Maintenance Division (WCM).
1.00 110,202 -
Public Utilities RestructureReallocation among funds as a result of departmental efficiency efforts.
1.44 31,127 -
Overtime AdjustmentAddition of overtime personnel expenditures related to emergency operations, vacancies and long-term absences.
0.00 24,500 -
Supplemental Cost of Living Adjustment (COLA)Adjustment to reflect the allocation of the pay-go costs for the continued funding of the Supplemental COLA Benefit.
0.00 6,512 -
Hourly Sick LeaveAdjustment to reflect prior year expenditure trends, related to paid sick leave benefits for eligible hourly employees consistent with the requirements of Assembly Bill 1522.
0.00 (916) -
Bond Administrative FeesReduction of non-personnel expenditures for miscellaneous bond administration fees and contractual services.
0.00 (22,850) -
Non-Standard Hour Personnel FundingFunding allocated according to a zero-based annual review of hourly funding requirements.
(0.78) (28,725) -
Human Resources Functions ConsolidationTransfer of 1.47 FTE positions to the Human Resources Department from the Public Utilities Department for centralized human resources support.
(1.47) (184,326) -
Technology EnhancementsReduction of non-personnel expenditures associated with IT enhancement projects.
0.00 (236,777) -
Employee TrainingReduction in non-personnel expenditures associated with employee training.
0.00 (250,000) -
Contractual CampaignReduction of non-personnel expenditures for outreach and "Value of Water" campaign.
0.00 (356,423) -
Reduction of Non-Personnel ExpendituresReduction of non-personnel expenditures to align budget with anticipated expenditures.
0.00 (520,000) -
Groundwater SustainabilityReduction of non-personnel expenditures associated with Groundwater Sustainability Agency (GSA) efforts.
0.00 (745,000) -
Vehicle Rental and PurchaseReduction in non-personnel expenditures associated with vehicle rental and purchase.
0.00 (852,861) -
Equipment Rental and PurchaseReduction of non-personnel expenditures associated with equipment rental and purchase.
0.00 (1,222,328) -
Significant Budget Adjustments (Cont’d)FTE Expenditures Revenue

Public Utilities
- 486 -City of San DiegoFiscal Year 2018 Adopted Budget
Groundwater ProjectsReduction in non-personnel expenditures for State-mandated groundwater monitoring work and modeling that has been completed.
0.00 (1,530,000) -
Non-Discretionary AdjustmentAdjustment to expenditure allocations that are determined outside of the department's direct control. These allocations are generally based on prior year expenditure trends and examples of these include utilities, insurance, and rent.
0.00 (2,274,642) -
State Revolving Fund (SRF) AdjustmentReduction of non-personnel expenditures for SRF loan repayments to reflect amortization schedules for Fiscal Year 2018.
0.00 (2,422,460) -
Desalination Plant SettlementReduction of non-personnel expenditures associated with the contractual payment for the Sweetwater Water Authority desalination plant settlement agreement.
0.00 (3,500,000) -
Revised RevenueAdjustment to reflect revised revenue projections.
0.00 - 132,367,000
Total 9.20 $ 16,915,527 $ 125,925,644
Expenditures by Category FY2016Actual
FY2017Budget
FY2018Adopted
FY2017–2018Change
PERSONNELPersonnel Cost $ 42,577,941 $ 44,968,251 $ 45,042,888 $ 74,637Fringe Benefits 29,567,384 31,658,538 36,376,882 4,718,344
PERSONNEL SUBTOTAL 72,145,325 76,626,789 81,419,770 4,792,981
NON-PERSONNELSupplies $ 192,389,461 $ 231,042,822 $ 231,825,714 $ 782,892Contracts 92,195,150 94,689,787 106,966,132 12,276,345Information Technology 6,328,661 8,868,376 9,948,244 1,079,868Energy and Utilities 10,944,445 14,294,749 12,808,692 (1,486,057)Other 2,578,295 2,628,426 2,700,692 72,266Contingencies - 3,500,000 3,500,000 -Transfers Out 73,730,804 68,443,681 67,132,452 (1,311,229)Capital Expenditures 1,165,866 3,902,592 4,613,589 710,997Debt (10,442,371) 213,170 210,634 (2,536)
NON-PERSONNEL SUBTOTAL 368,890,312 427,583,603 439,706,149 12,122,546Total $ 441,035,637 $ 504,210,392 $ 521,125,919 $ 16,915,527
Significant Budget Adjustments (Cont’d)FTE Expenditures Revenue

Public Utilities
- 487 - City of San DiegoFiscal Year 2018 Adopted Budget
Revenues by Category FY2016Actual
FY2017Budget
FY2018Adopted
FY2017–2018Change
Charges for Services $ 408,587,812 $ 490,593,991 $ 524,028,635 $ 33,434,644Fines Forfeitures and Penalties 12,212,560 - - -Other Revenue 44,646,366 345,000 117,345,000 117,000,000Rev from Federal Agencies - - 3,650,000 3,650,000Rev from Money and Prop 7,204,429 10,211,400 6,458,100 (3,753,300)Rev from Other Agencies 1,786,975 88,994,000 1,191,000 (87,803,000)Transfers In 7,316,410 - 63,397,300 63,397,300
Total $ 481,754,551 $ 590,144,391 $ 716,070,035 $ 125,925,644
Personnel Expenditures JobNumber Job Title / Wages
FY2016Budget
FY2017Budget
FY2018Adopted Salary Range Total
FTE, Salaries, and Wages
20000011 Account Clerk 5.29 5.29 4.80 $31,491 - $37,918 $ 179,708
20000007 Accountant 3 0.49 0.49 0.49 59,363 - 71,760 35,166
20000102 Accountant 4 0.49 0.49 0.49 66,768 - 88,982 43,597
90000102 Accountant 4 - Hourly 0.00 0.17 0.17 66,768 - 88,982 15,127
20000012 Administrative Aide 1 3.36 2.88 3.37 36,962 - 44,533 142,414
20000024 Administrative Aide 2 11.79 13.77 14.75 42,578 - 51,334 725,575
20000057 Assistant Chemist 13.00 13.00 15.00 53,789 - 65,333 946,289
20000058 Assistant Customer Services Supervisor
0.50 0.50 0.50 50,170 - 60,466 30,227
20001140 Assistant Department Director 1.48 1.48 1.48 31,741 - 173,971 207,197
20001202 Assistant Deputy Director 0.00 0.00 1.00 23,005 - 137,904 80,454
20000070 Assistant Engineer-Civil 26.61 27.61 26.23 57,866 - 69,722 1,692,553
21000176 Assistant Engineer-Corrosion 1.00 1.00 1.00 57,866 - 69,722 66,622
20000087 Assistant Engineer-Mechanical 0.23 0.23 0.23 57,866 - 69,722 13,309
20000080 Assistant Laboratory Technician 1.00 0.00 0.00 33,696 - 40,602 -
20000041 Assistant Management Analyst 0.49 0.49 0.49 44,470 - 54,059 26,484
20001228 Assistant Metropolitan Wastewater Director
0.49 0.49 0.49 31,741 - 173,971 68,602
20000109 Assistant Reservoir Keeper 8.00 8.00 8.00 34,944 - 41,662 328,892
20000140 Associate Chemist 4.25 4.25 6.25 62,005 - 75,067 429,983
90000140 Associate Chemist - Hourly 0.50 0.00 0.00 62,005 - 75,067 -
20000311 Associate Department Human Resources Analyst
2.45 2.45 0.98 54,059 - 65,333 64,036
20000145 Associate Engineer-Civil 1.23 1.72 1.97 66,622 - 80,454 149,915
20000143 Associate Engineer-Civil 21.10 20.46 22.24 66,622 - 80,454 1,765,651
20000350 Associate Engineer-Corrosion 2.00 2.00 2.00 66,622 - 80,454 160,908
20000150 Associate Engineer-Electrical 0.23 0.46 0.46 66,622 - 80,454 37,006
20000154 Associate Engineer-Mechanical 0.23 0.23 0.23 66,622 - 80,454 17,813
20000132 Associate Management Analyst 0.49 0.49 0.49 54,059 - 65,333 26,484
20000119 Associate Management Analyst 22.14 22.41 22.32 54,059 - 65,333 1,350,580
20000134 Associate Management Analyst 0.49 0.49 0.49 54,059 - 65,333 32,018

Public Utilities
- 488 -City of San DiegoFiscal Year 2018 Adopted Budget
90000119 Associate Management Analyst - Hourly
0.22 0.22 0.22 54,059 - 65,333 13,060
20000162 Associate Planner 1.99 1.99 2.20 56,722 - 68,536 132,569
20000655 Biologist 2 8.00 8.00 8.00 53,726 - 65,333 511,057
20000649 Biologist 3 0.42 0.42 0.42 62,005 - 75,067 30,910
20000648 Biologist 3 2.50 3.25 3.25 62,005 - 75,067 228,939
20000201 Building Maintenance Supervisor 0.00 0.00 0.49 61,859 - 74,797 36,100
20000205 Building Service Supervisor 0.33 0.33 0.33 45,718 - 55,286 18,241
20000224 Building Service Technician 0.33 0.33 1.33 33,322 - 39,666 46,178
20000234 Carpenter 2.00 1.00 1.00 43,451 - 52,000 52,000
20000266 Cashier 2.50 2.50 2.50 31,491 - 37,918 90,821
20000236 Cement Finisher 1.00 1.00 1.00 43,451 - 52,083 52,083
20000539 Clerical Assistant 2 8.96 8.47 9.47 29,931 - 36,067 320,637
20000306 Code Compliance Officer 5.06 5.56 5.56 37,232 - 44,803 222,167
20000307 Code Compliance Supervisor 1.89 1.89 1.00 42,890 - 51,334 50,307
20000829 Compliance and Metering Manager
1.00 1.00 1.00 73,445 - 88,837 88,776
20000545 Contracts Processing Clerk 0.00 0.49 0.49 32,968 - 39,811 19,510
20000801 Customer Information and Billing Manager
1.00 1.00 1.00 73,445 - 88,837 81,140
20000369 Customer Services Representative
22.00 22.50 22.50 32,968 - 39,811 844,206
90000369 Customer Services Representative - Hourly
1.50 2.00 2.00 32,968 - 39,811 72,135
20000366 Customer Services Supervisor 2.00 2.00 2.00 57,782 - 69,784 137,366
20001168 Deputy Director 5.19 5.19 6.19 46,966 - 172,744 742,907
90001168 Deputy Director - Hourly 0.35 0.00 0.00 46,966 - 172,744 -
20000434 Electronics Technician 0.49 0.49 0.49 47,091 - 56,534 27,297
20000430 Equipment Operator 2 11.00 11.00 11.00 41,350 - 49,462 527,116
20000418 Equipment Technician 1 15.00 13.00 13.00 36,005 - 43,139 558,650
20000423 Equipment Technician 2 2.00 2.00 1.00 39,499 - 47,091 47,091
20000924 Executive Secretary 0.49 0.49 0.49 43,555 - 52,666 25,428
90000924 Executive Secretary - Hourly 0.17 0.00 0.00 43,555 - 52,666 -
20000461 Field Representative 18.45 22.45 22.45 32,323 - 38,917 847,300
90000461 Field Representative - Hourly 3.25 1.63 1.63 32,323 - 38,917 58,111
20000822 Golf Course Manager 2.00 2.00 2.00 59,488 - 71,760 141,009
90000819 Golf Course Manager - Hourly 0.31 0.00 0.00 59,488 - 71,760 -
20000501 Heavy Truck Driver 2 2.00 1.00 1.00 37,565 - 45,302 41,454
20000513 Hydrography Aide 1.00 1.00 1.00 42,536 - 51,251 42,536
20000178 Information Systems Administrator
0.47 0.47 0.47 73,466 - 88,982 41,821
20000290 Information Systems Analyst 2 5.73 3.32 3.32 54,059 - 65,333 204,896
20000293 Information Systems Analyst 3 3.79 3.79 3.79 59,363 - 71,760 259,968
20000998 Information Systems Analyst 4 2.88 1.88 1.88 66,768 - 80,891 150,466
Personnel Expenditures (Cont’d)JobNumber Job Title / Wages
FY2016Budget
FY2017Budget
FY2018Adopted Salary Range Total

Public Utilities
- 489 - City of San DiegoFiscal Year 2018 Adopted Budget
20000999 Information Systems Analyst 4 0.00 1.00 1.00 66,768 - 80,891 80,328
20000377 Information Systems Technician 0.50 0.50 0.50 42,578 - 51,334 23,687
20000514 Instrumentation and Control Supervisor
1.00 1.00 1.00 56,410 - 68,224 66,859
20000515 Instrumentation and Control Technician
9.00 8.00 8.00 51,896 - 62,296 486,300
20000497 Irrigation Specialist 4.67 4.67 4.67 37,814 - 45,261 201,729
20000590 Laboratory Technician 10.00 10.00 10.00 40,622 - 49,067 470,695
90000589 Laborer - Hourly 8.00 8.00 8.00 29,182 - 34,757 254,426
90000579 Lake Aide 1 - Hourly 6.00 0.70 0.70 23,483 - 27,768 19,438
20000564 Lake Aide 2 13.00 12.00 12.00 27,602 - 32,677 382,938
20000616 Lakes Program Manager 1.00 1.00 1.00 73,466 - 88,941 88,941
90001073 Management Intern - Hourly 6.68 9.80 9.47 24,274 - 29,203 252,721
20000622 Marine Mechanic 1.00 1.00 1.00 44,366 - 53,206 53,206
20000634 Organization Effectiveness Specialist 2
1.47 1.47 1.38 54,059 - 65,333 90,173
20000627 Organization Effectiveness Specialist 3
0.89 0.89 0.98 59,363 - 71,760 70,320
20000639 Organization Effectiveness Supervisor
0.98 0.98 0.49 66,768 - 80,891 39,118
20000680 Payroll Specialist 2 4.90 4.90 4.90 34,611 - 41,787 187,353
20000173 Payroll Supervisor 0.98 0.98 0.98 39,686 - 48,069 46,639
20000701 Plant Process Control Electrician 5.00 5.00 5.00 51,896 - 62,296 289,556
20000705 Plant Process Control Supervisor 0.49 1.49 2.49 56,410 - 68,224 161,505
20000703 Plant Process Control Supervisor 2.00 1.00 2.00 56,410 - 68,224 124,634
21000184 Principal Backflow & Cross Connection Specialist
0.89 0.89 1.78 50,003 - 60,549 105,455
20000740 Principal Drafting Aide 2.38 1.38 1.38 50,003 - 60,549 82,987
20000743 Principal Engineering Aide 6.33 6.33 6.12 50,003 - 60,549 369,758
20000746 Principal Engineering Aide 1.00 2.00 2.00 50,003 - 60,549 114,087
20001222 Program Manager 7.47 7.47 8.58 46,966 - 172,744 936,090
90001222 Program Manager - Hourly 0.17 0.00 0.00 46,966 - 172,744 -
20000760 Project Assistant 0.21 0.21 0.21 57,866 - 69,722 14,464
20000761 Project Officer 1 0.42 0.42 0.42 66,622 - 80,454 30,635
90000761 Project Officer 1 - Hourly 0.31 0.00 0.00 66,622 - 80,454 -
20000763 Project Officer 2 0.44 0.44 0.44 76,794 - 92,851 39,758
20000766 Project Officer 2 1.38 1.38 1.78 76,794 - 92,851 150,984
20000768 Property Agent 0.89 0.89 0.89 59,363 - 71,760 62,907
20000783 Public Information Clerk 2.87 2.87 1.87 31,491 - 37,918 70,244
20001150 Public Utilities Director 0.49 0.49 0.49 59,155 - 224,099 97,020
20000373 Ranger/Diver 1 3.00 3.00 3.00 42,494 - 51,272 145,644
90000373 Ranger/Diver 1 - Hourly 0.35 0.35 0.35 42,494 - 51,272 17,945
20000375 Ranger/Diver 2 2.00 2.00 2.00 46,634 - 56,347 111,849
20000376 Ranger/Diver Supervisor 1.00 1.00 1.00 53,726 - 64,958 64,958
Personnel Expenditures (Cont’d)JobNumber Job Title / Wages
FY2016Budget
FY2017Budget
FY2018Adopted Salary Range Total
Public Utilities
- 490 -City of San DiegoFiscal Year 2018 Adopted Budget
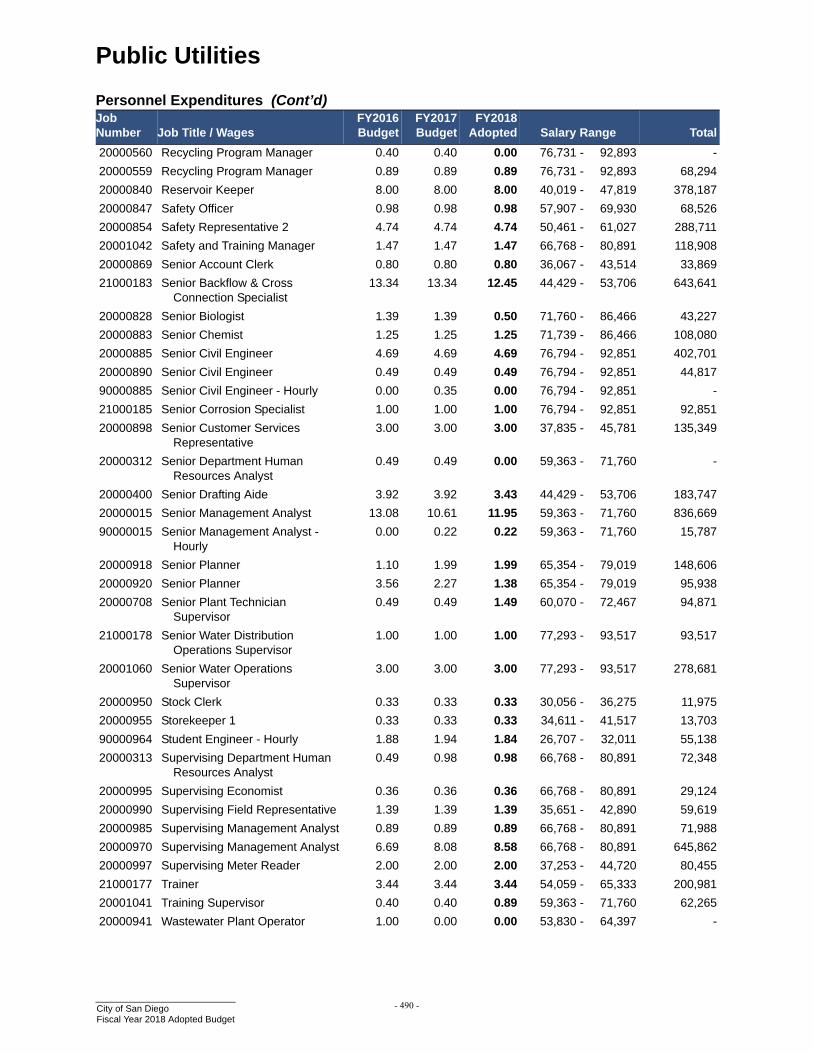
20000560 Recycling Program Manager 0.40 0.40 0.00 76,731 - 92,893 -
20000559 Recycling Program Manager 0.89 0.89 0.89 76,731 - 92,893 68,294
20000840 Reservoir Keeper 8.00 8.00 8.00 40,019 - 47,819 378,187
20000847 Safety Officer 0.98 0.98 0.98 57,907 - 69,930 68,526
20000854 Safety Representative 2 4.74 4.74 4.74 50,461 - 61,027 288,711
20001042 Safety and Training Manager 1.47 1.47 1.47 66,768 - 80,891 118,908
20000869 Senior Account Clerk 0.80 0.80 0.80 36,067 - 43,514 33,869
21000183 Senior Backflow & Cross Connection Specialist
13.34 13.34 12.45 44,429 - 53,706 643,641
20000828 Senior Biologist 1.39 1.39 0.50 71,760 - 86,466 43,227
20000883 Senior Chemist 1.25 1.25 1.25 71,739 - 86,466 108,080
20000885 Senior Civil Engineer 4.69 4.69 4.69 76,794 - 92,851 402,701
20000890 Senior Civil Engineer 0.49 0.49 0.49 76,794 - 92,851 44,817
90000885 Senior Civil Engineer - Hourly 0.00 0.35 0.00 76,794 - 92,851 -
21000185 Senior Corrosion Specialist 1.00 1.00 1.00 76,794 - 92,851 92,851
20000898 Senior Customer Services Representative
3.00 3.00 3.00 37,835 - 45,781 135,349
20000312 Senior Department Human Resources Analyst
0.49 0.49 0.00 59,363 - 71,760 -
20000400 Senior Drafting Aide 3.92 3.92 3.43 44,429 - 53,706 183,747
20000015 Senior Management Analyst 13.08 10.61 11.95 59,363 - 71,760 836,669
90000015 Senior Management Analyst - Hourly
0.00 0.22 0.22 59,363 - 71,760 15,787
20000918 Senior Planner 1.10 1.99 1.99 65,354 - 79,019 148,606
20000920 Senior Planner 3.56 2.27 1.38 65,354 - 79,019 95,938
20000708 Senior Plant Technician Supervisor
0.49 0.49 1.49 60,070 - 72,467 94,871
21000178 Senior Water Distribution Operations Supervisor
1.00 1.00 1.00 77,293 - 93,517 93,517
20001060 Senior Water Operations Supervisor
3.00 3.00 3.00 77,293 - 93,517 278,681
20000950 Stock Clerk 0.33 0.33 0.33 30,056 - 36,275 11,975
20000955 Storekeeper 1 0.33 0.33 0.33 34,611 - 41,517 13,703
90000964 Student Engineer - Hourly 1.88 1.94 1.84 26,707 - 32,011 55,138
20000313 Supervising Department Human Resources Analyst
0.49 0.98 0.98 66,768 - 80,891 72,348
20000995 Supervising Economist 0.36 0.36 0.36 66,768 - 80,891 29,124
20000990 Supervising Field Representative 1.39 1.39 1.39 35,651 - 42,890 59,619
20000985 Supervising Management Analyst 0.89 0.89 0.89 66,768 - 80,891 71,988
20000970 Supervising Management Analyst 6.69 8.08 8.58 66,768 - 80,891 645,862
20000997 Supervising Meter Reader 2.00 2.00 2.00 37,253 - 44,720 80,455
21000177 Trainer 3.44 3.44 3.44 54,059 - 65,333 200,981
20001041 Training Supervisor 0.40 0.40 0.89 59,363 - 71,760 62,265
20000941 Wastewater Plant Operator 1.00 0.00 0.00 53,830 - 64,397 -
Personnel Expenditures (Cont’d)JobNumber Job Title / Wages
FY2016Budget
FY2017Budget
FY2018Adopted Salary Range Total

Public Utilities
- 491 - City of San DiegoFiscal Year 2018 Adopted Budget
20000317 Water Distribution Operations Supervisor
1.00 1.00 1.00 54,766 - 65,374 65,374
20000316 Water Distribution Operator 6.00 6.00 6.00 47,632 - 56,867 331,946
20001059 Water Operations Supervisor 3.00 3.00 3.00 68,037 - 81,307 230,651
20001061 Water Plant Operator 24.00 24.00 24.00 59,134 - 70,699 1,682,158
20000932 Water Production Superintendent 2.00 2.00 4.00 81,578 - 98,675 394,700
90000932 Water Production Superintendent - Hourly
0.35 0.35 0.35 81,578 - 98,675 34,536
20000006 Water Systems District Manager 3.00 3.00 3.00 62,504 - 75,130 225,390
20000003 Water Systems Technician 3 190.00 199.00 200.00 41,454 - 49,504 8,478,113
20000004 Water Systems Technician 4 56.00 55.00 54.00 47,632 - 56,867 3,029,706
20000005 Water Systems Technician Supervisor
18.00 18.00 18.00 54,766 - 65,374 1,162,809
20001058 Welder 2.00 2.00 2.00 44,366 - 53,206 106,412
20000756 Word Processing Operator 12.44 11.55 10.66 31,491 - 37,918 394,707
AWWA WDP Cert Pay 33,488
Backflow Cert 12,480
Bilingual - Regular 38,736
Budgeted Vacancy Savings (2,851,234)
Cross Connection Cert 7,280
Emergency Medical Tech 25,170
Exceptional Performance Pay-Classified 18,949
Exceptional Performance Pay-Unclassified 1,832
Geographic Info Cert Pay 4,176
Night Shift Pay 9,280
Overtime Budgeted 4,119,899
Plant/Tank Vol Cert Pay 30,112
Reg Pay For Engineers 211,262
Sick Leave - Hourly 18,725
Split Shift Pay 100,705
Termination Pay Annual Leave 53,698
Vacation Pay In Lieu 383,540
Welding Certification 3,640
FTE, Salaries, and Wages Subtotal 781.83 781.83 791.02 $ 45,042,888
FY2016Actual
FY2017Budget
FY2018Adopted
FY2017–2018Change
Fringe BenefitsEmployee Offset Savings $ 247,862 $ 244,166 $ 223,881 $ (20,285)Flexible Benefits 5,543,598 7,113,530 8,288,923 1,175,393Long-Term Disability 125,070 126,825 - (126,825)Medicare 585,604 542,461 548,830 6,369Other Post-Employment Benefits 4,184,950 4,224,484 4,267,562 43,078Retiree Medical Trust 19,919 22,050 25,968 3,918Retirement 401 Plan 26,873 25,567 23,993 (1,574)Retirement ADC 14,166,699 14,658,580 18,209,424 3,550,844
Personnel Expenditures (Cont’d)JobNumber Job Title / Wages
FY2016Budget
FY2017Budget
FY2018Adopted Salary Range Total

Public Utilities
- 492 -City of San DiegoFiscal Year 2018 Adopted Budget
Retirement DROP 124,183 127,491 145,939 18,448Risk Management Administration 710,760 730,297 718,961 (11,336)Supplemental Pension Savings Plan 2,425,174 2,409,608 2,469,097 59,489Unemployment Insurance 71,230 72,443 71,391 (1,052)Workers' Compensation 1,335,462 1,361,036 1,382,913 21,877
Fringe Benefits Subtotal $ 29,567,384 $ 31,658,538 $ 36,376,882 $ 4,718,344
Total Personnel Expenditures $ 81,419,770
FY2016Actual
FY2017Budget
FY2018Adopted
FY2017–2018Change

Public Utilities
- 493 - City of San DiegoFiscal Year 2018 Adopted Budget
Revenue and Expense Statement (Non–General Fund)
Municipal Sewer Revenue Fund FY2016Actual
FY2017*
BudgetFY2018
Adopted
BEGINNING BALANCE AND RESERVES
Balance from Prior Year $ 165,055,020 $ 159,020,469 $ 70,248,647
Continuing Appropriation - CIP 151,815,452 135,519,275 186,310,736
Capital Reserve 5,000,000 5,000,000 5,000,000
Operating Reserve / Contingency 48,099,387 48,279,555 48,279,555
Rate Stabilization Reserve 51,000,000 65,250,000 65,250,000
Pension Stabilization Reserve – 1,693,461 1,693,461
Employee Efficiency Incentive Reserve 4,945,575 4,770,284 –
TOTAL BALANCE AND RESERVES $ 425,915,434 $ 419,533,044 $ 376,782,399
REVENUE
Charges for Services $ 370,573,901 $ 373,942,422 $ 376,029,088
Other Revenue 661,767 100,000 100,000
Revenue from Federal Agencies – – 1,350,000
Revenue from Other Agencies 59,475 19,719,000 –
Revenue from Use of Money and Property 4,085,582 1,044,800 3,410,400
Transfers In 26,907,285 – 10,889,900
TOTAL REVENUE $ 402,288,011 $ 394,806,222 $ 391,779,388
TOTAL BALANCE, RESERVES, AND REVENUE $ 828,203,444 $ 814,339,266 $ 768,561,787
CAPITAL IMPROVEMENTS PROGRAM (CIP) EXPENSE
CIP Expenditure $ 81,895,845 $ 131,284,000 $ 100,212,336 1
TOTAL CIP EXPENSE $ 81,895,845 $ 131,284,000 $ 100,212,336
OPERATING EXPENSE
Personnel Expenses $ 51,859,463 $ 52,234,866 $ 51,657,709
Fringe Benefits 33,567,081 35,523,806 39,913,379
Supplies 25,283,036 26,533,419 27,089,338
Contracts 68,126,038 89,789,393 83,160,136
Information Technology 7,717,257 8,725,526 11,238,144
Energy and Utilities 15,240,323 24,063,144 22,027,985
Other Expenses 420,281 572,697 430,791
Transfers Out 106,231,831 108,985,299 108,734,086
Capital Expenditures 2,635,414 4,091,822 4,211,344
Debt Expenses (602,346) 221,312 221,312
CIP Contingency – 3,500,000 3,500,000
TOTAL OPERATING EXPENSE $ 310,478,378 $ 354,241,284 $ 352,184,224
EXPENDITURE OF PRIOR YEAR FUNDS
CIP Expenditures $ 16,296,177 $ – $ –
TOTAL EXPENDITURE OF PRIOR YEAR FUNDS $ 16,296,177 $ – $ –
TOTAL EXPENSE $ 408,670,400 $ 485,525,284 $ 452,396,560

Public Utilities
- 494 -City of San DiegoFiscal Year 2018 Adopted Budget
Municipal Sewer Revenue Fund FY2016Actual
FY2017*
BudgetFY2018
Adopted
RESERVES
Continuing Appropriation - CIP $ 135,519,275 $ 135,519,275 $ 186,310,736
Capital Reserve 5,000,000 5,000,000 5,000,000
Operating Reserve / Contingency 48,279,555 48,279,555 48,279,555
Rate Stabilization Reserve 65,250,000 65,250,000 65,250,000
Employee Efficiency Incentive Reserve 4,770,284 – –
Pension Stabilization Reserve 1,693,461 1,693,461 –
TOTAL RESERVES $ 260,512,575 $ 255,742,291 $ 304,840,291
BALANCE $ 159,020,469 $ 73,071,691 $ 11,324,936
TOTAL BALANCE, RESERVES, AND EXPENSE $ 828,203,444 $ 814,339,266 $ 768,561,787
* At the time of publication, audited financial statements for Fiscal Year 2017 were not available. Therefore, the Fiscal Year 2017 column reflects final budgeted revenue and expense amounts from the Fiscal Year 2017 Adopted Budget, while the beginning Fiscal Year 2017 balance amount reflects the audited Fiscal Year 2016 ending balance.
1Fiscal Year 2018 capital improvement program budget for the Wastewater Fund has been reduced by approximately $30.0 million from estimatedde-appropriation requests that are anticipated to occur in Fiscal Year 2018.
Revenue and Expense Statement (Non–General Fund)

Public Utilities
- 495 - City of San DiegoFiscal Year 2018 Adopted Budget
Revenue and Expense Statement (Non–General Fund)
Water Utility Operating Fund FY2016Actual
FY2017*
BudgetFY2018
Adopted
BEGINNING BALANCE AND RESERVES
Balance from Prior Year $ 14,099,802 $ – $ –
Continuing Appropriation - CIP 114,306,367 86,400,961 91,997,115
Capital Reserve 5,000,000 5,000,000 5,000,000
Operating Reserve / Contingency 31,696,146 40,107,594 41,869,917
Rate Stabilization Reserve 46,117,000 38,617,000 38,617,000
Secondary Purchase Reserve 13,581,572 13,581,572 14,343,541
Pension Stabilization Reserve – 1,487,358 1,487,358
Employee Efficiency Incentive Reserve 1,611,536 1,514,961 –
TOTAL BALANCE AND RESERVES $ 226,412,423 $ 186,709,446 $ 193,314,931
REVENUE
Charges for Services $ 423,040,495 $ 502,593,991 $ 536,028,635
Fines Forfeitures and Penalties 12,212,560 – –
Other Revenue 44,646,366 345,000 117,345,000
Revenue from Federal Agencies – – 3,650,000
Revenue from Other Agencies 1,786,975 88,994,000 1,191,000
Revenue from Use of Money and Property 7,290,147 10,211,400 6,458,100
Transfers In 7,316,410 – 63,397,300
TOTAL REVENUE $ 496,292,953 $ 602,144,391 $ 728,070,035
TOTAL BALANCE, RESERVES, AND REVENUE $ 722,705,376 $ 788,853,837 $ 921,384,966
CAPITAL IMPROVEMENTS PROGRAM (CIP) EXPENSE
CIP Expenditures $ 94,960,293 $ 124,380,375 $ 208,431,474 1
TOTAL CIP EXPENSE $ 94,960,293 $ 124,380,375 $ 208,431,474
OPERATING EXPENSE
Personnel Expenses $ 42,577,941 $ 44,968,251 $ 45,042,888
Fringe Benefits 29,567,384 31,658,538 36,376,882
Supplies 192,389,461 231,042,822 231,825,714
Contracts 92,195,150 94,689,787 106,966,132
Information Technology 6,328,661 8,868,376 9,948,244
Energy and Utilities 10,944,445 14,294,749 12,808,692
Other Expenses 2,578,295 2,628,426 2,700,692
Transfers Out 73,730,804 68,443,681 67,132,452
Capital Expenditures 1,165,866 3,902,592 4,613,589
Debt Expenses (10,442,371) 213,170 210,634
CIP Contingency – 3,500,000 3,500,000
TOTAL OPERATING EXPENSE $ 441,035,637 $ 504,210,392 $ 521,125,919
TOTAL EXPENSE $ 535,995,930 $ 628,590,767 $ 729,557,393
RESERVES
Continuing Appropriation - CIP $ 86,400,961 $ 58,945,254 $ 91,997,115
Capital Reserve 5,000,000 5,000,000 5,000,000

Public Utilities
- 496 -City of San DiegoFiscal Year 2018 Adopted Budget
Water Utility Operating Fund FY2016Actual
FY2017*
BudgetFY2018
Adopted
Operating Reserve / Contingency 40,107,594 41,869,917 41,869,917
Rate Stabilization Reserve 38,617,000 38,617,000 38,617,000
Secondary Purchase Reserve 13,581,572 14,343,541 14,343,541
Employee Efficiency Incentive Reserve 1,514,961 – –
Pension Stabilization Reserve 1,487,358 1,487,358 –
TOTAL RESERVES $ 186,709,446 $ 160,263,070 $ 191,827,573
BALANCE $ – $ – $ –
TOTAL BALANCE, RESERVES, AND EXPENSE $ 722,705,376 $ 788,853,837 $ 921,384,966
* At the time of publication, audited financial statements for Fiscal Year 2017 were not available. Therefore, the Fiscal Year 2017 column reflects final budgeted revenue and expense amounts from the Fiscal Year 2017 Adopted Budget, while the beginning Fiscal Year 2017 balance amount reflects the audited Fiscal Year 2016 ending balance.
1The Fiscal Year 2018 capital improvement program budget for the Water Fund has been reduced by approximately $34.6 million from estimated de-
appropriation requests that are anticipated to occur in Fiscal Year 2018.
Revenue and Expense Statement (Non–General Fund)