PUBLIC STANDPOST WATER SUPPLIES - IRC
93
WHO INTERNATIONAL REFERENCE CENTRE FOR COMMUNITY WATER SUPPLY PUBLIC STANDPOST WATER SUPPLIES A DESIGN MANUAL LIBRARY, INTERNATIONAL REFERENi CENTlVt.-: ;-O» COMMUNITY WATER SUPPLY AND 3A-:,;.-,. ; .;N (IRC) P.O.': ;x '.••• :. •), 2MQ AD T'^3 ¡- Te!. VÜ7O) Ü. ;-.J ,i a x t 141/142 TECHNICAL PAPER 14 BER 1979 HaVehstraat o, zz/2 AD Voorburg (The Hague) The Netherlands Postal Address: P.O. Box 140, 2260 AC Leidschendam, The Netherlands
Transcript of PUBLIC STANDPOST WATER SUPPLIES - IRC

WHO INTERNATIONAL REFERENCE CENTREFOR
COMMUNITY WATER SUPPLY
PUBLIC STANDPOSTWATER SUPPLIES
A DESIGN MANUAL
LIBRARY, INTERNATIONAL REFERENiCENTlVt.-: ;-O» COMMUNITY WATER SUPPLYAND 3A-:,;.-,. ; .;N (IRC)P . O . ' : ;x '.••• :. •), 2MQ A D T'^3 ¡-
Te!. VÜ7O) Ü. ;-.J , i a x t 1 4 1 / 1 4 2
TECHNICAL PAPER 14BER 1979
HaVehstraat o, zz/2 AD Voorburg (The Hague)The Netherlands
Postal Address:P.O. Box 140, 2260 AC Leidschendam, The Netherlands

This report is issued on the responsibility of the WHO
International Reference Centre for Community Water Supply.
It does not necessarily represent the decisions or the
stated policy of the World Health Organization.

TABLE OF CONTENTS
Page
PREFACE 5
ACKNOWLEDGEMENT 7
1. INTRODUCTION 9
2. THE DESIGN OF A STANDPOST 11
3. THE REQUIRED DISCHARGE CAPACITY PER STANDPOST 15
4. DESIGN CALCULATIONS
4.1. Components and Parameters 23
4.2. How to Use the Graphs 27
5. DESIGN DRAWINGS 35
ANNEXES
1. Symbols and Abbreviations 67
2. Units and Conversion 69
3. Growth Factor 71
4. Service Radius , 73
5. Pressure Head Losses 75
6. Hydraulic Equations 77
7. Stopcock and Watermeter 79
8. Materials. 81
9. Standpost Drainage 83
10. Flow Control Mechanisms 84
11. List of References 91


PREFACE
Public standposts will continue to play an important role in imp-
roving and accelerating the provision of water supply and sanita-
tion in rural and urban fringe areas, for a long time to come.
In the framework of the International Drinking Water Supply and
Sanitation Decade (1981-1990), large investments will be made in
this sector in that period. This underscores the need for the
development of appropriate methods for the planning, design and
construction of public standpost water supply systems.
Throughout the world engineers have designed and installed public
standposts, incorporating their own ideas. Often they have had
to work from scratch and a great deal of valuable professional
time has been spent in working out details. The step-by-step
method that forms the basis of this Paper enables an engineer or
technician to make the necessary calculations in an efficient way.
The drawings and bills of quantities, which form the largest
section of the Paper, can easily be adapted to suit local condit-
ions. Therefore by using this Paper any technological skills
available can be used in the most effective way in selection and
modification to devise the most appropriate project. The Paper
may also be utilized effectively as a guideline manual for
instruction and training purposes.
JOHN PICKFORD


ACKNOWLEGEMENT
This Manual and the companion paper "Public Standpost Water Supplies"
(IRC/Technical Paper No. 13) result from a study commissioned by The
World Bank. The continuous support of the Bank to that study is
gratefully acknowledged.
Further acknowledgement is due to the International Water Supply
Consultants (IWACO, Rotterdam) for the preparation of this Manual.
Also the contributions of Dr. J. Pickford, Group Leader Water and
Waste Engineering for Developing Countries (WEDC), University of
Technology, Loughborough, United Kingdom, and Mr. D.J. Elliot,
Lecturer, University of Newcastle Upon Tyne, United Kingdom, in
reviewing this publication are much appreciated. A special word
of thanks is addressed to Marylynn Bianco for her organizational
assistance, and to Dick Mos for his technical assistance in the
finalization of this Paper.
It is intended to further develop and improve this Manual. Therefore,
we fully depend on the willingness of its users to inform us about
their experiences with this Manual and to communicate their sugges-
tions for improvement. Any such suggestions on this would be
highly appreciated.
Enric L.P. Heaping
Programme Officer


1. INTRODUCTION
A public standpost is a suitably supported water pipe, connected
with a water distribution system and terminating in a tap or
faucet, which is located at a public site, and from which water
may be drawn for domestic and other uses. In other publications
these installations are also referred to as: public standpipes,
public hydrants, public fountains, public taps, public spigots
or communal water points.
Public standposts are often installed as an intermediate step in
the development of a fully house-connected water supply system.
However, for many people, public standposts could well be the
only feasible method of water supply for a long time to come.
This is especially true in rural areas where a scattered housing
pattern makes individual connections very expensive and in urban
areas where improvements in housing are needed before house
connections can become a feasible proposition; and in general,
where funds for investment in water supply are severely limited.
In planning a public standpost water supply system, many organiz-
ational, economic, socio-cultural and technological factors have
to be taken into account. These factors and their inter-relation-
ships are discussed in the IRC Technical Paper 13, entitled
"Public standpost Water Supplies" which is regarded as a companion
document to this Manual.

The present Manual deals with the technical and engineering
aspects of the design and construction of public standposts.
It offers a step-by-step design method, including the present-
ation of design criteria, an example design calculation,
construction drawings and technical descriptions.
The design and construction of distribution networks are not
discussed in this Manual. Information on this subject may be
obtained from numerous other sources (see Annex 11).
In designing public standposts a number of alternatives have often
to be compared, which requires iterative calculations.
The reader is advised to study this Manual a number of times as
a whole, before using it as a guideline in the actual design of
a public standpost water supply.
The symbols and units used in this publication, are listed in
Annexes 1 and 2.
10

2. DESIGN OF A STANDPOST
The layout of the scheme and the siting of the standposts is one
of the most important aspects in the design of a public stand-
post water supply system. In general, standposts should be located
as near to as many houses as possible, easily accessible to all
users, but protected from vehicular traffic. The walking distance
to the farthest dwelling should preferably not exceed 200 metres
(m).
A standpost consists of a platform with a drainage facility, a
supporting structure for the pipe and taps, a stand for buckets,
the service pipe with valve and meter (optional), and the taps.
taps
supporting structure
platform
bucket stand
drainage gutter
• watermeter
-valve stopcock
FIGURE 1
CROSS SECTION OF A PUBLIC STANDPOST
11

The platform should extend for at least 1.0 m around the tap(s)
and be constructed of hard an impermeable material, preferably
concrete or masonary. It should be raised at least 0.10 m above
the ground to ensure good drainage and slope away from the taps
towards a drainage channel. Alternatively the platform may slope
inwards; the waste water is then collected in a gutter under-
neath the taps and is discharged into a drain.
The slope of both platform and drainage channels should be in
the range of 1:50 (2%) and 1.-20 (5%). The minimum dimension of
the gutter is 0.20 m wide and 0.05 m deep at the beginning of
the drain.
If possible, the waste water should be put to some use, for
instance: irrigation, cattle watering or fish fanning. It may
also be led through an open channel to a watercourse, an
existing storm-water drain, a soak-away pit or trench.
A soak-away pit consists of a hole of approximately 0.5 mz and
0.80 m deep filled with rubble or gravel through which waste
water can filter into the soil.
The required length of soak-away trenches depends on the perm-
eability of the soil; in clay soils relatively long trenches
are necessary; in sandy soils short ones will suffice.
The supporting Btruoture, and the attachment of the taps should
be solidly constructed. The best way to protect the pipe is to
encase it in a brick or concrete column of at least 0.30 m
square. To protect the taps, the supporting structure should
extend 0.10m above them.
12

Underneath the taps a raised stand can be constructed to support
buckets and containers whilst being filled. The height of the
stand, and of the taps themselves, is determined by the size of
the containers used, the manner of carrying them, and the question
of whether children as well as adults will fetch water.
For example, if people carry containers on their heads, the stand
should be 0.9 to 1.0 m high, with the height of the tap above it
dependent on the containers size. Children would need a stand
0.5 m high in this case.
The distance between the tap and the top of the container should
be less than 0.5 m in order to reduce the spillage of water.
The service pipe or supply pipe may be of galvanized steel or
PVC, but PVC pipes should only be used where they are covered
and cannot be damaged either by misuse or accident; The necessary
pipe diameter is dependent on the required discharge capacity, on
the type and number of taps at the standpost and on the water
pressure. Normally, the diameter of the service pipe is in the
range of 12 mm Cs-inch) to 36 mm (l'i-inch).
The main Valve or stopcock should be installed in a space which
can be locked. Water meters may provide important information
for studies on consumption and wastage, for calculations of future
consumption and on decisions regarding the need for additional
public standposts; and may serve as means for establishing the
payment due for water used. Meters should only be used when they
serve a definite purpose and when regular maintenance in a work-
shop by properly qualified and equipped staff is available. Every
meter should be housed in a box which can be locked and should be
inconspicuously located.
The flow control mechanism most frequently used is the ordinary
screw tap with washers. Possible alternatives are: a ball or
plug valve tap; spring-loaded or gravity operated taps; volumetric
or delayed-closing valves. Reference is made to Annex 10.
13

Other features can be included in the design, depending on the
users' needs and on provisions made for supervision and revenue
collection. The standpost may be surrounded by a wall or fence
with a locking gate for protection during unsupervised hours.
A curb 0.2 m high can prevent damage by traffic, while a wall
0.8 m high around the standpost area and a cattle grid at the
entrance, rules out pollution by animals.
14

3. THE REQUIRED DISCHARGE CAPACITYPER STANDPOST
An important factor in the design of a public standpost water
supply system, is the required maximum discharge capacity
(Q ) per standpost.
This parameter is the basis for the hydraulic calculation and
the determination of the dimensions of the service pipe and of
the type and number of taps.
This Q is determined by the design population (N), the averagemax
demand per capita (CJ , the peak factor (P) , the number of stand-
posts (S), the waste factor (w) and an efficiency factor (f).
The relationship between the factors is presented by the formula:
Q = N * — * ~ * P * * 4-*raax S 24 1-w f
Each of the six factors that constitute this formula have to be
determined separately before the maximum discharge capacity can
be calculated.
3.1. Design Population (N)
This factor depends on the initial magnitude of the population
to be served, the growth rate of the population, and the design
period.
The initial number of usera (N ) in the area to be served by the
prospective standposts should be counted or estimated.
15

An indication of the expected annual growth rate (r) of the
population can be obtained from historical statistical data on
the area concerned. If these are not available/ one may sub-
stitute figures related to a similar area or to the country as
a whole.
The standpost must have sufficient capacity to meet the users'
water demands during a period of several years. The design
period (T) is determined by various technical and economic
factors; a period of ten years is usually sufficient, but there
may be local reasons that make a shorter or longer period
desirable.
The Design Population (N) can now be calculated according to:
N = N * {l+r}T
o
m
One may prefer to work with a growth factor: m = {l+r} . In that
case use can be made of a table giving the growth factor as a
function of a fixed annual growth rate and the design period. In
general the growth factor will be in the range of 1.0-1.6 (see
Annex 3) .
3.2. Demand per Capita (CJ
The average volume of water drawn from public standposts is
typically between 20 and 60 litres per capita per day (led).
Local habits related to domestic water use will have to be
studied in order to establish an accurate figure, particularly
in cases where there has been no previous experience with stand-
posts or where other sources are available. Normally, a provision
is also made for livestock watering.
Future increases in demand should be provided for. It is advis-
able to provide excess capacity for a design period of at least
10 years and that allows for an increased consumption per person.
16

In the design of the distribution network, allowance may also
be made for uses other than domestic, such as small industries,
etc.
3.3. Peak Factor (P)
During some hours the standpost will be used more intensively
than during the rest of the day. The water supply system should
be capable of dealing with this peak demand. Therefore, a peak
factor representing the ratio between peak and average demand, is
introduced in the calculation Q . Normally, this peak factormax
is in the range of 2 to 4, a typical average being 3.
The peak factor can be approximated by P = 24/t, in which t is
the number of peak hours (normally in the range of 4 to 12 per
day). The result of this method tends, however, to be on the
high side, as the method presupposes that no water at all is
drawn outside the peak hours.
The peak factor should be determined with great care, as it has
a considerable influence on the Q . It is recommended that themax
local water collection pattern should always be studied thoroughly.
3.4. The Number of Standposts (S)
The required number of standposts is based on two other design
criteria, the maximum walking distance to the standpost and the
maximum number of users per tap. These two criteria are directly
related to the intended "level of service", which results from the
consultations between the users and the planners of the public
standpost scheme.
17

The Maximum Walking Distance
In general it is advisable to limit the walking distance to 200 m
and in densely populated areas it is often possible to limit the
distance to 100 m. In very sparsely populated areas a walking
distance of up to 500 m may sometimes be acceptable.
In densely populated areas, however, the application of this
criterion may result in too many users per standpost and per
tap. Therefore, a second criterion that relates to the popu-
lation density in a particular area, is required.
The Maximum Number of Usevs per Standpost
It is advisable to limit the number of users per standpost to
100-250; in no case should this number exceed 500. The number
of users per tap should preferably be in the range of 25-125.
This criterion is directly related to the maximum discharge
capacity of the taps and to the water collection pattern during
peak hours.
Proceeding from more or less evenly spaced standposts in a given
area (A) and a set maximum walking distance (R), the number of
standposts can be assessed using the formula:
S = A/TTR2
A = total area of the scheme in m2
S = the number of standposts
R = the service radius in m
Tt = 3.14
It should be noted that the service radius does not exactly
equal the maximum walking distance (see Annax 4).
18

In case the afore-mentioned approximation of the number of stand-
posts (S) leads to a too high average number of users per stand-
post, one may increase the number of taps per standpost, in order
to meet the criterion set for the maximum number of users per tap.
However, the number of taps per standpost should be limited to
avoid the crowding of too many people near one standpost; it is
advisable not to install more than four taps per standpost.
If by providing more than one tap the criterion of the maximum
number of users per tap can still not be met, the number of
standposts in the area under consideration is to be increased.
In practice, the actual local geographical and demographical
circumstances will determine the siting and the exact number
of standposts and taps, as well as the actual number of users
for each standpost. However, in most cases, as a first assess-
ment, the above method gives satisfactory results.
3.5. Waste Factor (w)
Part of the water is inevitably spilt by users when filling their
containers or drawing water for immediate use at the standpost.
To express this numerically, the waste factor (w) is introduced.
This factor can be determined by calculating the ratio of the
amount of water actually taken away by the users and the total
amount of water discharged through the taps.
Spillage and wastage depend on the way in which containers are
filled, the type and condition of the taps, the height of the
taps above the bucket-stand, the water pressure, and on whether
or not the standpost is supervised.
The waste factor can best be estimated from data obtained in
other schemes. It should only include the spillage and wastage
related to the collection and use of water at the tap and not
the leakage of water in the main and branch pipes of the distri-
bution network, as this leakage water is not discharged through
the taps.
19

The waste factor is in the range of 0.1 to 0.4 which means
that 10 - 40% of the total discharge at the tap is spilt or wasted.
As the waste factor has a considerable influence on the QTnax
careful assessment of the factor is required.
It is important to decide whether water used for purposes, such
as washing of utensils and personal cleaning at the tap should
be considered as part of the per capita demand or is to be regarded
in terms of spillage or wastage.
3.6. The Efficiency Factor (f)
The efficiency factor is introduced to take into account that
the suppliers rating of the capacity of a tap is usually based
on continuous discharge at 10 mhw with the tap fully open.
In practice the pressure will never be exactly 10 mhw and
discharge is usually not continuous. The closing and opening
of the tap will make the actual discharge smaller than the
theoretical maximum.
Depending on the type of tap, the efficiency factor (f) can
range from almost 1.0 for a ball valve (rapid closing tap), to
0.9 and 0.8 for an ordinary screw tap, and 0.7 for spring-
loaded taps.
20

3,7. Calculation Example
The calculation of the required maximum discharge capacity of
standposts can best be illustrated by an example; assume the
following situation:
N = initial number of users = 1 2 000o
r = population growth rate = 2% per year
T = design period = 10 year?
A = area of scheme = 100 ha = 1.106m2
S = number of standposts
C = average demand per capita = 40 led
t = number of peak hours = 4.5 h
w = wastage factor = 0.2
f - efficiency factor = 0.9
The design population can be calculated as:
N = N * {l+r}T= 12000 * 1.0210 = 12000 * 1.22 = 14640 persons,o
If the service radius is set as R=200 m and the number of users
per standpost is limited to 250, the number of standposts can be
determined as follows:
a. S>A/TTRZ = 106/3.14 * {200}z - 7.96 and
b. S>N/25Q = 14640/250 = 58.56
Consequently, the maximum number of users per standpost is the
decisive factor in this case (b). If the number of standposts
is now set at 60, the average number of users per standpost is:
14640/60 = 244 persons, and the service radius about 73 m.
The required discharge capaaity per standpost can be calculated
as:
maiN CdS 24
1464060
*
4024
P *
244,
11-w
5 *
*
1
1f
1.1-0,2} * 0
1
,9 = 3012 l/h
21

If the area had been 1000 ha instead of 100 ha, the result of the
equation S^A/TTR2, for R = 200, would have been 80 standposts and
the criterion of the maximum walking distance would have been
decisive (a). The average number of users per standpost would
then have been: 14640/80 = 183 and the Q equal to 2260 1/h per
standpost; assuming that population and standposts are evenly
distributed.
However, in practice, and particularly in larger areas, the pop-
ulation will almost never be evenly distributed. Therefore, the
number of standposts and their location will always have to be
determined on the basis of the local geographical cicumstances,
including the variation in population density in the area con-
cerned. This may lead to a variation in the number of users per
standpost and subsequently to a difference in the required dis-
charge capacity of the various standposts.
The above serves to show that, generally speaking, the maximum
number of users per standpost will be the criterion in densely
populated areas, whilst in sparsely populated areas the maximum
walking distance will be the decisive factor.
Finally, it should be pointed out that Q , as calculated in this
Chapter, only relates to water that is actually discharged via
standposts. The total amount of water that is pumped into the
distribution network is often reported to be 10-50% higher than
the total discharge via standposts and house connections. This
is due to leakage in the pipe system. This factor is NOT included
in the calculations in this publication, as this publication only
deals with the discharge from standposts.
All the afore-mentioned values have been assumed. The designer
should substitute his own data depending on the characteristics
of the system he is working on.
22

4. DESIGN CALCULATIONS
Following the calculation of the maximum required discharge
capacity (Q ), the diameter of the service pipe and themax
required number of taps can be determined. Use is made of a
number of graphs, which give the headloss for each component
of the system. Before this method is explained in detail
(see paragraph 4.2.) a short introduction is given on the
various components and parameters that play a role in the
graphical calculation.
4.1 COMPONENTS AND PARAMETERS
The sequence of presentation of the components is the same as
the sequence followed in the graphical calculation.
4 .1 .1 . Watermeter
Usually a watermeter has its nominal discharge at a pressure head
of 10 mhw. This means that a "3-m3" watermeter at 10 mhw dis-
charges 3 mVh. Higher flows will result in wear of the meter,
and impaired accuracy. The calculated discharge capacity of the
standpost should be between 50% and 80% of the maximum capacity
of the meter (e.g. where Q = 3012 1/h, a "5-m3" watermeter is
a good choice).
The headloss curve of a meter should preferably be obtained from
its supplier or manufacturer. However, if this is not available,
one can select a sufficiently accurate curve for a meter with a
similar nominal discharge from the graphs presented in this Manual.
23

Meters should only be used when they serve a definite purpose, for
instance, to obtain information for studies on consumption and
wastage or for determining what payments are due for water use.
Very often, however, there is no need for a watermeter and if no
watermeter is installed, this component should be disregarded in
the graphical calculation.
4.1.2, Material and Diameter of the Service Pips
The material and diameter have a direct influence on the hydraulic
characteristics of the service pipe, and of course, the same is
applicable to the main. This relationship forms the basis for the
formula for the hydraulic gradient (see Annex 6),
This hydraulic gradient indicates the headloss per meter of pipe.
For a given flow, headloss will decrease as pipes with greater
diameter are chosen. It is financially attractive to use the
smallest possible diameter pipe that delivers the desired flow
at the available pressure. On the other hand, a little extra
capacity in the form of a larger pipe may prove a good investment
in case of unexpectedly high demands, or a falling off of
pressure in the main.
For the calculation of the diameter of the service pipe, two
different graphs are available: one for galvanized steel and one
for polyvinylchloride (pages 31 and 32).
In the graph of the galvanized ateei (GS) pipes the specific curves
of *s, h, 1, 1^ and l^-inch have been drawn. The internal diameters
used comply with galvanized steel pipes, medium class, as specified
in ISO-Recommendation R 65, DIN 2240 and BS 1387.
Normalization of steel pipes is nearly worldwide, which is not the
case with PVC-pipes.
24

In the graph of the PVC-pipeS a bundle of curves with selected
internal diameters are presented. However, the actual internal
diameters of pipes having the same nominal sizes vary considerably
all over the world. Therefore, the most appropriate curve is to
be selected from the graph or alternatively a new curve has to be
drawn.
To facilitate the choice, some parts of the curves are heavily
lined. These parts should be applied with preference so as to
ensure that the flow velocity in the pipe is in the range of
0.5-2.0 m/s.
4.1.3. Length of Service Pipe
The service pipe should follow the most direct route possible.
The length of service pipe should be measured from the connection
point at the main pipe to the tap at the standpost. The length,
therefore, is greater than the direct horizontal distance between
main and standpost (see Annex 5).
In the "length of service pipe" diagram a series of curves has been
drawn. The appropriate curve should be selected or a new curve has
to be drawn by means of interpolation.
4.1.4. "Available Head"
The "available head" is defined as the pressure head that is
available to overcome the hydraulic losses which occur when the.
water flows through, the pipe, meter and tap. Therefore, the
actual water pressure in the main has to be adjusted for any
difference in level between the main and the outlet of the taps
(see annexes 3 and 4).
25

The water pressure in the main or distribution pipe at the point
where the service pipe is connected can be measured with a
pressure gauge on the pipe, or computed using technical data
for the distribution network. Normally, a "design pressure" is
chosen of between 5 and 20 mhw; to minimise leakage in the net-
work the pressure is often limited to 10 mhw.
4.1.5. Type of Tap
The type of tap to be applied depends upon the required discharge
capacity and the availability of the taps.
Generally, the discharge of a tap will be given by the supplier
at a pressure head of 10 mhw. A ij-inch ordinary tap commonly
delivers 800 1/h and a %-inch tap 1500 1/h at a head of 10 mhw.
In the graph a set of curves is presented for specified discharges
at a pressure head of 10 mhw. The most appropriate curve should be
selected or a new curve has to be drawn, giving the closest match
to the data supplied by the manufacturer of the particular tap.
The preferred range of pressure on the tap (4-10 mhw) is indicated
in the graph.
4.1.6. Number of Taps
The last section in the graph concerns the determination of the
number of taps. Preferably the number of taps on a public stand-
post should not exceed four, but in the graph the possibility
to select up to six taps is offered, A final decision regarding
the type and numberof taps is often made on the basis of a
comparison of existing alternatives, (see calculation examples
4.2.1. and 4.2.2.)
26

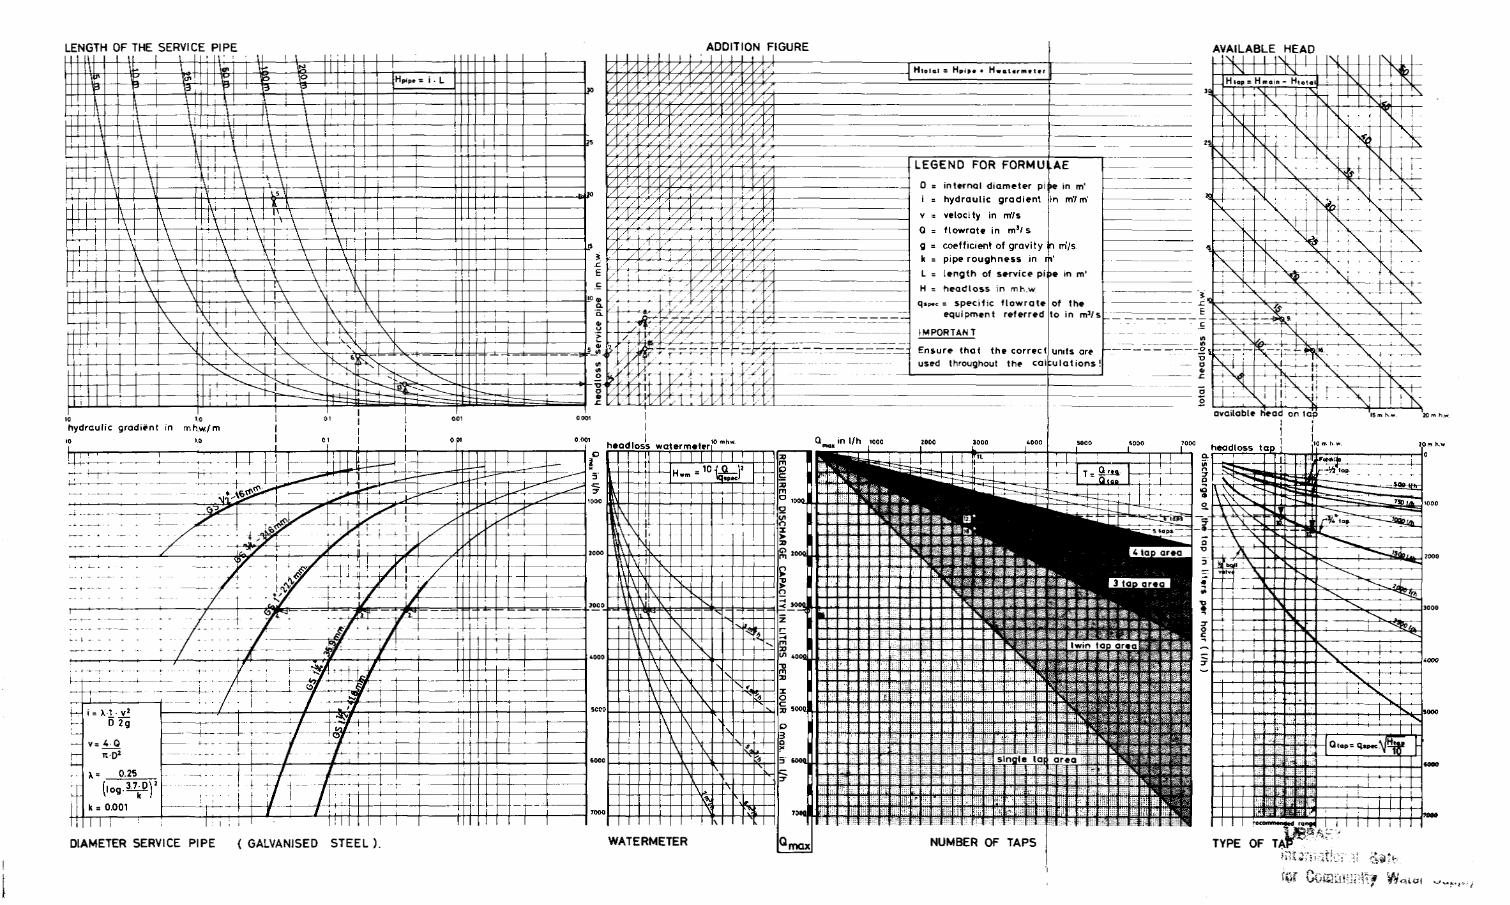
4.2 HOW TO USE THE GRAPHSThe way to find the diameter of the service pipe arid the number of
taps by using the graphs (on page 33 and 34) can best be explained
by means of an example.
The calculation example for the required discharge capacity, as
given in item 3.7, is chosen as the starting point: Q m a x = 3012 1/h.
In addition to this the following assumptions are made:
- length of service pipe = 80 m;
- pressure in the main at the point of connection of the
service pipe = 16,5 mhw;
- the taps are located 1,5m higher than the main.
Before the actual hydraulic calculations can start, we have to
determine the available head, the actual pressure in the main has
to be adjusted for the differences in elevation between the main
and the tap(s). Reference is made to Annex 5. In this case the
available head can be calculated as H = 1 6 , 5 - 1 , 5 = 1 5 mhw.
4.2.1. Example Shewing Haw to Use the Graph for Galvanised Pipes (p.31)
Start from the vertical Q - axis horizontally to the watermeter
diagram. The watermeter to be used for Q = 3012 1/h is a
"5 m3" meter.
The intersection with the "5 m3" watermeter curve is point 1.
The headloss of the watermeter can be read on the horizontal axis
(3,7mhw). If no meter is installed, pass horizontally through the
watermeter diagram and go directly to the service pipe diagram.
From point 1 travel horizontally to find the diameter of the
service pipe, continue to the heavy lined parts of the headloss
curves of the service pipes. Find point 2 on the l^-inch, point 3
on the l>j-inch and point 4 on the 1-inch curve of the service pipe.
There are now three alternatives, and, in principle, all of them
have to be considered.
27

Alternative I (GS; 1-inah Pipe)
Go vertically from point 4, the length of the service pipe diagram
and find point 5 at the intersection with the interpolated 80 m
curve. The headloss of the service pipe (on the vertical axis)
is 20 mhw. The found headloss is more than the "available head"
and hence this calculation is stopped.
Alternative II (GS; lk-ineh Pipe)
Go vertically from point 3 to the intersection with the 80 m curve,
find point 6, go across to meet the vertical axis of the length
of service pipe diagram and read the headloss of the 80 m service
pipe which amount to 4,8 mhw.
To graphically make the addition of the headloss of the water-
meter and the service pipe, use can be made of the addition
diagram. Start at point 7 and travel along the 45 degree incline
to find the intersection with the vertical line from the water-
meter diagram; this is point 8 and the addition has been made:
total headloss 8,5 mhw.
Travel further horizontally to the "available head" diagram; the
lines with an incline of 45 degrees represent steps of 5 metres.
The intersection with the related line of 15 mhw gives point 9.
From point 9 go vertically down to the type of tap diagram to point
10, read on the horizontal axis the available head on the tap
(approximately 7,5 mhw); this is within the recommended pressure
range for taps (4-10 mhw). In this case a %-inch ordinary tap
was chosen, with a discharge of 1500 1/h at a pressure head of
10 mhw.
28

To find the number of taps go horizontally from point 10 to the
'number of taps'-diagram for one ordinate; the other ordinate is
the required Q (on the horizontal axis). This gives point 12,
that lies within the "3 taps area".
The outcome of this alternative is 3 taps of %-inch and a lit-inch
service pipe. But we still have to look at the third alternative
as well.
Alternative III (GS 1%-inoh Pipe)
In a similar manner as before travel from point 2 to point 13 in
the 'length of the service pipe'-diagram; note that the headloss
in the l^-inch pipe is less than in the l'j-inch pipe.
Then to point 14 in the addition diagram, add the headloss in the
pipe (2 mhto) to the headloss of the watermeter (3,5 mhw), find
point 15, travel horizontally to point 16 in the "available head"-
diagram and down to the selected tap curve and point 17, continue
horizontally to point 18 to find the result: exactly 2 taps of the
chosen type. This would mean that the required maximum discharge
capacity of the standpost can never be exceeded because both taps
are then operating at their maximum discharge capacity.
If the planner should stipulate that for 244 users at least 4 taps
are required, and if several types of taps are available, one can
aim at the '4 taps area1 and let the type of tap follow from that.
The result could then be 4 taps of 4-inch (nominal 800 1/h) on a
IS-inch service pipe, or 4 taps of nominal 1000 1/h on a l'j-inch
service pipe.
Before a final decision is made always consider the various altern-
atives and carry out some iterative calculations regarding the
number and type of taps in relation to the diameter of the service
pipe.
29

4,2.2. Example Shewing the Use of the Graph for PVC Pipes (P. 32)
Start from the vertical Q - axis, travel horizontally to the
watermeter figure. The intersection with the relevant curve of the
"5 m3" watermeter is called point 1. The headloss of the watermeter
at a discharge of approximately 3000 1/h is 3,5 mhw.
Travel horizontally to find the service pipe diameters. If the
diameters of the available pipes are not among the given curves,
new curves will have to be interpolated. This is done as an
example and the point 2, 3 and 4 are the subsequent intersections.
The three alternatives can be worked out as follows:
Alternative I
Travel form point 4 vertically to meet the interpolated 80 m curve,
find point S and travel horizontally to meet the vertical axis;
the headloss in the service pipe is 9,5 mhw. The addition of the
headloss of the watermeter is done by travelling from point 6 along
the 45 degree incline to meet the vertical coming from point 1.
The found intersection is called point 7 and the total headloss
amounts to approximately 13 mhw. If no watermeter is used, dis-
regard this addition and go straight to the available head diagram-
Travel from point 7 horizontally to the "available head"-diagram,
meet the relevant head line and find point 8. Note the available
head at the tap is only 2 mhw. This is outside the recommended
pressure range, hence this calculation is stopped here.
Alternative II
Travel vertically from point 3 to meet the 80 m curve in the
'length of the service pipe'-diagram (point 9)- From here go across
to meet the Vertical axis; the headloss in the service pipe is
3,5 mhw,
30
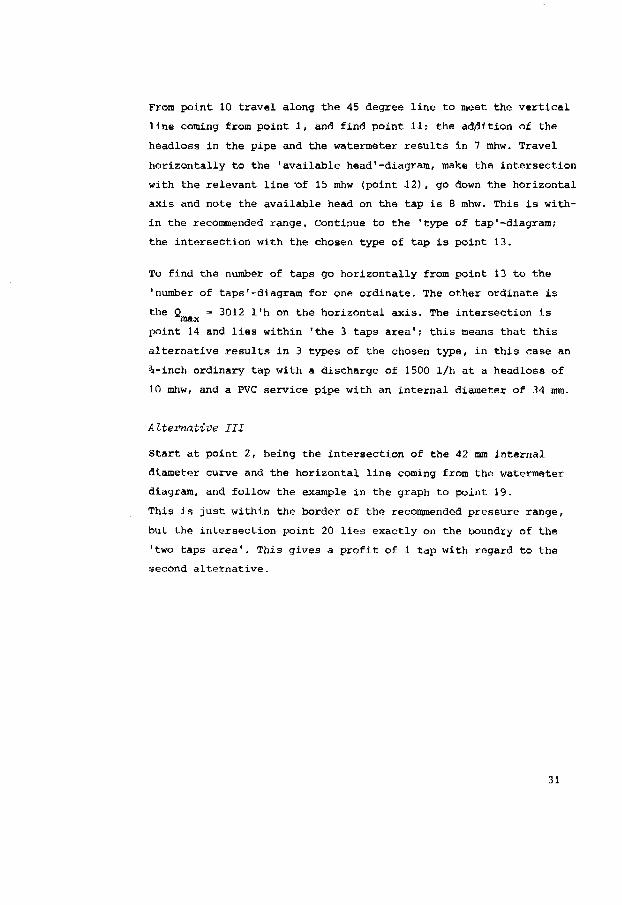
From point 10 travel along the 45 degree line to meet the vertical
line coming from point 1, and find point 11; the addition of the
headloss in the pipe and the watermeter results in 7 rahw. Travel
horizontally to the 'available head'-diagram, make the intersection
with the relevant line -of 15 mhw (point -12) , go down the horizontal
axis and note the available head on the tap is 8 mhw. This is with-
in the recommended range. Continue to the 'type of tap'-diagram;
the intersection with the chosen type of tap is point 13.
To find the number of taps go horizontally from point 13 to the
'number of taps'-diagram for one ordinate. The other ordinate is
the Q = 3012 l'h on the horizontal axis. The intersection is
point 14 and lies within 'the 3 taps area'; this means that this
alternative results in 3 types of the chosen type, in this case an
%-inch ordinary tap with a discharge of 1500 1/h at a headloss of
10 mhw, and a PVC service pipe with an internal diameter of 34 mm.
Alternative III
Start at point 2, being the intersection of the 42 mm internal
diameter curve and the horizontal line coming from the watermeter
diagram, and follow the example in the graph to point 19.
This is just within the border of the recommended pressure range,
but the intersection point 20 lies exactly on the boundry of the
'two taps area'. This gives a profit of 1 tap with regard to the
second alternative.
31

LENGTH OF THE SERVICE PIPE ADDITION FIGURE AVAILABLE HEAD
Hiolal s Hait* * H
LEGEND FOR FORMULAE
O = internal diameter pi le in rn'i = hydraulic gradient
v = velocity in nilsQ = flowrate in m'fs
= coefficient of gravityk = pipe roughness in m'L = length of service pH = headloss in mh.w
specific flowrateequipment referred
Ensure that the correctused throughout the cal
available head on taphydraulic gradient in mhw/m
10 >o headloss water m «ter l'0M headloss
WATERMETER NUMBER OF TAPSDIAMETER SERVICE PIPE {GALVANISED STEEL)


LENGTH OF THE SERVICE PIPE ADDITION FIGURE AVAILABLE HEAD
H lap — H main - H toi a
LEGEND FOR FORMULAE
D - internal diameter pipei = hydraulic gradient inv Ï velocity in mVsQ = tlowrate in m'/ s ;g = coefficient of gravity i(i m'/sIt = pipe roughness in m'L = length of service pipe in m'H = headloss in mh.w .
- specific flowratejof theequipment referred jto in m3/s
IMPORTANT
Ensure that the correctjunits areused throughout the calculations!
available head on tap]10 10hydraulic gradient in mh.w./m
10 10 headloss waterm«terWmh"
l i i \
WATERMETER NUMBER OF TAPS TYPE OF TAP
I i • MM
DIAMETER SERVICE PIPE ( POLYVINYLCHLORIDE )


5. DESIGN DRAWINGS
In addition to the design drawings the following notes are
made.
The service pipe is the pipe line from the distribution main
to the taps. The connection of the service pipe with the main
usually consists of a saddle, a T-piece or a ferrule. This is
often a weak point in the pipe system and responsible for a
great deal of leakage. Thus, it requires much attention during
construction.
The choice between galvanised steel (GS) and polyvinylahlovide
(PVC) pipes for the service pipe depends on various factors:
The advantages of galvanized steel are: the strength, the ease
of installation and the availability in almost every country.
The disadvantages are: the high weight, the sensitivity to
corrosion (internal as well as external) and the relatively
high wall roughness in relation to the flowing of water through
the pipe.
The advantages of PVC are: the absence of corrosion, the ease
of handling due to the low weight and the relatively low wall
roughness. The disadvantages are: the limited strength against
impact and the lack of standardization in the quality of the
material as well as in the pipe dimensions.
It is advisable to always install a stopcock in the service pipe,
for the purpose of shutting off the waterflow, e.g. for repair or
replacing tap washers, etc. The stopcock should be protected and,
therefore, installed in a covered pit, preferably within 5 m from
the standpost structure. Where a watermeter is used, this should
preferably be installed in the same pit.

It is recommended to use galvanized steel pipe for the part of the
service pipe from the stopcock to the taps; given the higher strength
of this material against impact and the ease of installing it and
connecting it with the taps. In case the soil has aggressive prop-
erties an adequate coating (bitumen or fabric) is required for the
part of the pipe that is installed in the ground.
For the purpose of drainage the slope of the platform is recommended
between 1:50 and 1:20. For a smooth plaster surface a slope of
1:50 is adequate, but for a trowel finished concrete floor, a slope
of up to 1:20 is recommended.
To prevent misuse of the taps for hanging buckets, the distance of
the taps to the wall should be as small as possible.
In finishing the construction due attention has to be given to the
prevention of water-ingress, in particular on the top of the post,
on the bucket stand, and at the point where the pipe comes out of
the construction.
In general, the design of a standpost should always be adjusted to
local habits and circumstances such as the availability of materials
and equipment.
36
TYPICAL DESIGNS DRAWINGS OF PUBLIC STANDPOSTS
5.1. Single tap concrete and brickwork standpost
bill of quantities
5.2. Twin tap concrete and brickwork standpost
bill of quantities
5.3. Three tap concrete and brickwork standpost
bill of quantities
5.4. Pour tap concrete and brickwork standpost
bill of quantities
5.5. Twin tap tubular standpost
bill of quantities
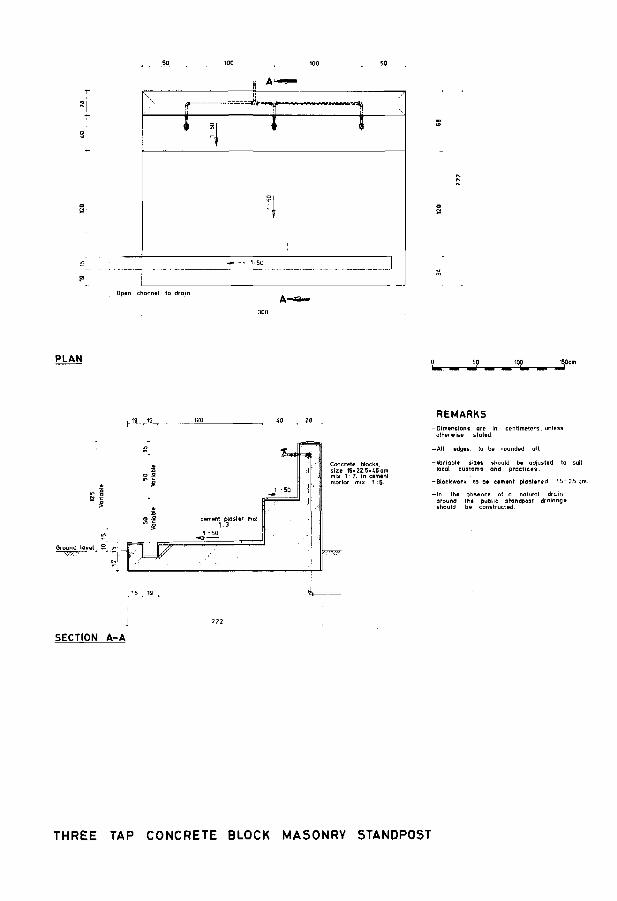
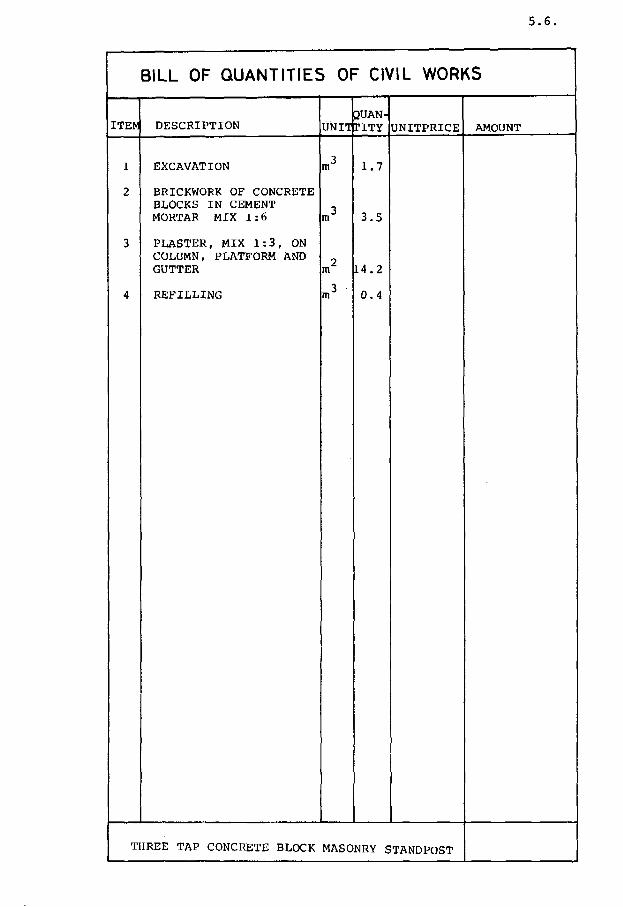
5.6. Three tap concrete block masonry standpost
bill of quantities
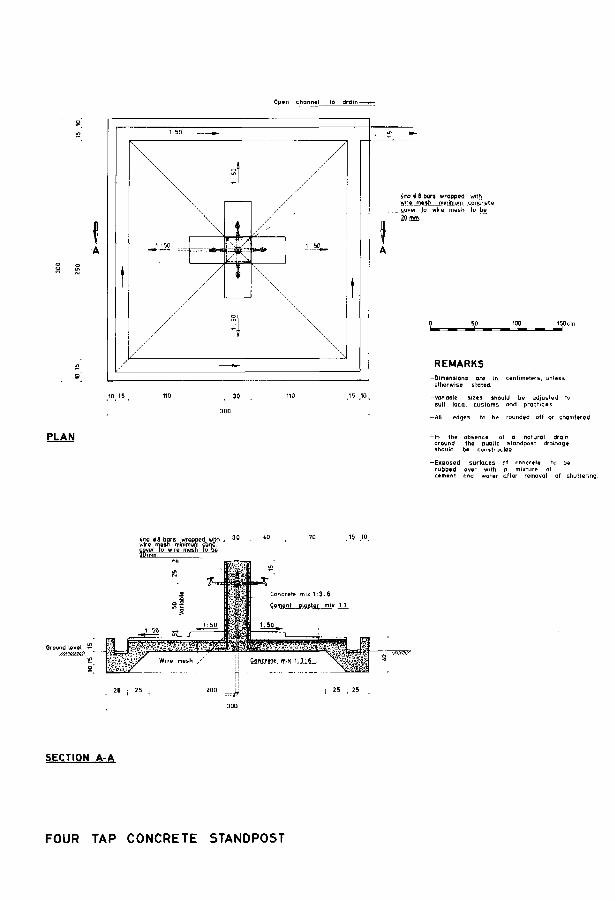
5.7. Pour tap concrete standpost
bill of quantities
5.8. Four tap concrete standpost
bill of quantities
5.9. Four tap rock masonry standpost
bill of quantities
5.10. Twin tap reinforced concrete standpost
bill of quantities
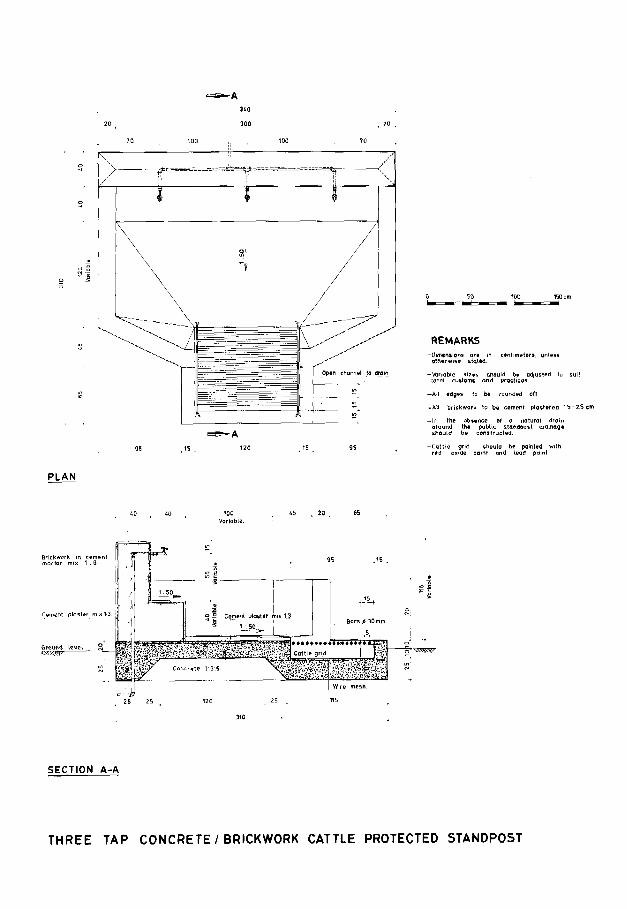
5.11. Three tap concrete/brickwork cattle protected
standpost bill of quantities
5.12. Waterkiosk with 4 taps
bill of quantities
NOTE: The figures in the bills of quanities are to be regarded as
indications. The quantities of materials and equipment actually
required, are to be calculated specifically for each standpost,
according to the actual design.

Op»n channtl to drain
PLAN is no
REMARKS-OimtnïlOnt art *o ctntimtUr», units*
athtrwfci stattd,
-Uariabl* sizi i should p* adjusttd toíuít local Customs and praeticM.
-All «dgis to b* rountftd off.
-All brickwork to bv c*m*r>t plastwtd IS - 2.5 cm,
-•In th* obttne* of a natural drainaround tht public stondpott drainogtshould b* constructed
mix 1:3-6
SECTION A-A
50 10 40 10. 35 15
C>m«rtt plattgr mix
*M
SECTION B-B
SINGLE TAP CONCRETE AND BRICKWORK STANDPOST

5 . 1 .
BILL OF QUANTITIES OF CIVIL WORKS
llTEM DESCRIPTIONIQUAN
U N I T I T I T Y UNITPRICE AMOUNT
EXCAVATION
FORMWORK PLATFORM
WIREMESH NETTINGDIMENSIONS... x ...
CONCRETE PLATFORMMIX 1:3:6
BRICKWORK IN CEMENTMORTAR MIX 1:6
PLASTERING MIX 1:3,INCLUDING GUTTER
REFILLING
m
m
m
m
m
1.6
4.0
3.0
1.0
0.2
4.3
0.5
SINGLE TAP CONCRETE AND BRICKWOIiK STANDPOST

PLAN
0 50 iqo 150 cm
REMARKS
otherwl** stated.
-Variable tizas should t>* adjusted to suitlocal customs and practicas.
- All edges to be round*d off.
-A l l brickwork cem»nt plastered 15 -2.5 cm.
- In th» absence of a • nofural drainaround the public etandpost drainageshould b* Constructed.
J 15 75 ¿0 40 40
SECTION A-A
50 10 4Û 10 35 15 .
SECTION B-B
TWIN TAP CONCRETE AND BRICKWORK STANDPOST

BILL OF QUANTITIES OF CIVIL WORKS
ITEM DESCRIPTION2UAN-
UNITriTY UNITPRICE AMOUNT
EXCAVATION
FORMWORK PLATFORM
WIREMESH NETTINGDIMENSIONS... X ...
CONCRETE PLATFORMMIX 1:3:6
BRICKWORK IN CEMENTMORTAR MIX 1:6
PLASTERING MIX 1:3INCLUDING GUTTER
REFILLING
m
m
m
m
2.5
5.4
4.8
1.5
0.2
5.0
0.6
TWIN TAP CONCRETE AND BRICKWORK STANDPOST

IS
s s
PLAN
4Û 40 ¿0
300
75 15
REMARKS
otherwise Stated.
-Variable sizes should be adjusted ta suitlocal customs gnd practices.
-All edg»s to be rao tided off.
-All brickwork cement plcttefcd 1.5 - 2.5 cm,
around th* public standpost drainageShould be constructed.
40 60
Ground l»
Cancr«tt rftix 1:3:5
SECTION A-A
THREE TAP CONCRETE AND BRICKWORK 5TANDP05T

5 . 3 ,
BILL OF QUANTITIES OF CIVIL WORKS
ITEM DESCRIPTION2UAN-
UNITTITY UNITPRICE AMOUNT
EXCAVATION
FORMWORK PLATFORM
WIREMESH NETTINGDIMENSIONS... x ...
CONCRETE PLATFORMMIX 1:3:6
BRICKWORK IN CEMENTMORTAR MIX 1:6
PLASTERING MIX 1:3INCLUDING GUTTER
REFILLING
m
m
m
m
3.5
6.4
6.9
2.0
0.3
8.4
0.8
THREE TAP CONCRETE AND BRICKWORK STAND?OST

Hî-A
PLAN
so too
Centimeters, units*
REMARKS-Dimensions aiStttt»d.
-Varmbl» tHes should b* adjusted tosuit local Customs ond practices.
-All edg*s to be roundtd off
—In thfi fib&t^Ct of o ndturoldrain around the public Stdndpostdrainage should b* constructed
,.« t S U -
SECTION A-A
FOUR TAP CONCRETE-BRICKWORK STANDPOST

5 . 4 .
BILL OF QUANTITIES OF CIVIL WORKS
ITEM DESCRIPTIONQUAN-
UNI1TITY UNITPRICE AMOUNT
EXCAVATION
FORMWORK PLATFORM
WIREMESH NETTINGDIMENSIONS... x ...
CONCRETE PLATFORMMIX 1:3:6
BRICKWORK IN CEMENTMORTAR MIX 1 :6
PLASTERING MIX 1:3INCLUDING GUTTER
REFILLING
m
m
itr
in
m
m
4.4
7.1
9.0
2.6
0.8
12.5
0.8
FOUR TAP CONCRETE AND BRICKWORK STANDPOST

-
1'50 — " •
[A
11
channel to drain -
PLAN60 ¿0 ¿0 60
VanoS!, Variable
. ' 5 .
Ground level ~
REMARKS- Dimensions or* in centim»t»rs, unless otherwise atat»d.
- All edges tg be roundid off
-Variable sizes íhould be adjusted to suitlOCfll customs and practiç#ï
- Where a variety of malcriáis are u t f d for columnconstruction, mes anfl types of tittinas shouldbe alttrvd accordingly
- In th« absence ol a natural dram around th*public standpott draingçí should be constructed
-Reinforcing bars («12] to b* bent after fitting insteel pip*
SECTION A-A
50 15 15 50
Steel p ip» fi l led wi th t t m c r e t » mix 1 3 : 6
Cement p l o t t e r mix 13.
25 .15 50 .15 . 25 . 25 .
SECTION B-B
Stiel pip* 4 ISO mm tobe pain|«d
Cement plast*r mix . >3.
5 10 15 20
Steel pipe fil l idwith concret* "mix 1-3-6
tach 50 cm long
COLUMN DETAIL
TWIN TAP TUBULAR STANDPOST

5 .5 .
BILL OF QUANTITIES OF CIVIL WORKS
ITEM DESCRIPTIONQUAN-
UNITTITY UNITPRICE AMOUNT
EXCAVATION
FORMWORK PLATFORM
WIREMESH NETTINGDIMENSIONS... x ...
CONCRETE PLATFORMMIX 1:3:6
STEEL PIPE COLUMNPOURED WITH CONCRETEMIX 1:3:6
PLASTER ON PLATFORMAND BUCKET STANDMIX 1:3
REFILLING
m
m
ea
m
m
1.3
4.1
2.6
0.9
2.8
0.3
TWIN TAP TUBULAR STANDPOST
r-
a
3
•r : "
t •i
—_
il A^*
il
1
— -- 1
Open channel ta drain
PLAN
40
•g:ffil-JF
Concrete blocks,size 15-22.5-45cmmix 1 7 , in c*m*nlmorior mix 1 :6.
REMARKS-Dimensions ore in centimeters, unless
otherwise stated
-AIL edges to be rounded off.
-tttr iâbl* tiz*s should b* adjusted to suitlocal customs and prot t i te* .
-eiockwork to bt C*m*nt piaster*d 1.5-2.5 cm
-In the absence of a natural drainaround th* public standpQit drainag»should be constructed.
5ECTI0N A-A
THREE TAP CONCRETE BLOCK MASONRY STANDPOST
5 . 6 .
BILL OF QUANTITIES OF CIVIL WORKS
ITEN DESCRIPTION2UAN-
UNIiriTY UNITPRICE AMOUNT
EXCAVATION
BRICKWORK OF CONCRETEBLOCKS IN CEMENTMORTAR MIX 1:6
PLASTER, MIX 1:3, ONCOLUMN, PLATFORM ANDGUTTER
REFILLING
m
m
1.7
3.S
14.2
0.4
THREE TAP CONCRETE BLOCK MASONRY STANDPOST
Open channel to drain-
PLAN
\
_J;50
/
\
/
S
1.É\ \
/
\
10 15 110 30 110
¿no * a bar* wrapped with
.._ Cover to wire mesh to be
REMARKS
otherwise stated.
-Variable size* thould be adjusted toSuit local customs and practices
-All edges to be rounded off or chomf*riij
the public standpost drainageb d t d
-Exposed surfaces of concrete to berubbed *v*r with a mixture ofcement and water after removal of shuttering.
Ground lev»! —
SECTION A-A
FOUR TAP CONCRETE STANDPOST

5 . 7 .
BILL OF QUANTITIES OF CIVIL WORKS
ITEf DESCRIPTION2UAN'
UNITTITY UNITPRICÏ AMOUNT
EXCAVATION
FORMWORK PLATFORM
WIREMESH NETTING FORPLATFORM AND COLUMNDIMENSIONS ...x...
CONCRETE PLATFORMMIX 1:3:6
FORMWORK COLUMN
CONCRETE COLUMNMIX 1:2:6
PLASTER ON PLATFORMMIX 1:3
REFILLING
m
m
m
m
m
2.7
8.U
6.2
2.1
1.0
0.1
7.9
0.5
FOUR TAP CONCRETE STANDPOST

T f
PLAN
\
Op«n channel to drain
50 100
REMARKS
-Variable sizes should b* adjusted
to tMii local custurns ond practices
Cement plastar \o b« minimum 2 cmth
IS VMV !P
the public standpûsl drainagee constructd
ubbed over with a mixture:ement and water after removal
SECTION A-A
Ground l«wel. .
25 55
SECTION B-B
FOUR TAP CONCRETE STANDPOST

5 . 8 .
BILL OF QUANTITIES OF CIVIL WORKS
ITEM DESCRIPTION JNITQUANTITY UNITPRICE AMOUNT
EXCAVATION
FORMWORK PLATFORM,INCLUDING CUTTERS
WIREMESH NETTINGDIMENSIONS... x ...
REINFORCING BARS0 8 mmLENGTH TO SUIT
CONCRETE PLATFORMMIX 1:3:6
FORMWORK WALL
CONCRETE WALLMIX 1:2:6 INCL.TROWELLING
PLASTERING ON PLAT-FORM, BUCKET STANDAND DRAINGUTTER
REFILLING
3 . 9
8 . 5
3 2 . 8
.12
2 . 1
4 . 3
0 . 3
5 . 7
1 .0
FOUR TAP CONCRETE STANDPOST

S A
PLAN
SECTION A-A
REMARKS—Dimensions art |n
tfhtrwitt ttattd.
-All «dflvs to b* i
Ctntimtttrt,
roundtd
-Variable sizts should btfuit total customs and pi
-Slants should bt(acts.
tooltd
Off.
on
unltss
jsttd to
»pot*d
-In tht a b » n » of a noturoi drainaround th* public Standfast. drainagtshould b* construct*d.
-Sl l is of fitontx shown on th« drawingor* only indicativt and may b* adjusted¿«pending on local availability.
inding concrttt mix 1:3:6
SECTION B-B
(•*''•• ?
100«jrmbu
/ I / 'I
^2
Optn çhanntl to drain
FOUR TAP ROCK MASONRY STANDPOST

5 . 9 ,
BILL OF QUANTITIES OF CIVIL WORKS
ITEM DESCRIPTIONQUAN-
UNI11'lTY UNITPRICE AMOUNT
7
8
EXCAVATION
BLINDING CONCRETEMIX 1:3:6
RQCKMASONRY INPLASTER MIX 1:3
PLASTER ON COLUMN,BUCKET STANDS ANDPLATFORM, INCLUDINGGUTTERS MIX 1:3
POINTING THE MASONRYWITH MORTAR MIX 1: 2
REFILLING
FORMWORK DRAINGUTTER
CONCRETE DRAINGUTTERMIX 1:3:6
CEMENT MORTAR DRAIN-GUTTER MIX 1:3
m
m
m
m
m
m
m
3.4
0.3
4.5
6.0
10.0
1.0
1.4
0.J
0.4
FOUR TAP ROCK MASONRY STANDPOST

O 50 1Û0 15ûcm
REMARKS
otherwise stated.
-Variable siles should t>9 adjusted tn suitlocal customs and practices
— All edg#s to be rounded off or thçjrnfered
-In the absence of a natural drainaround the public standpost drainage
— Exposed concr#t# surlaces to bn rubbedwith a mixture at cement and
wat*r after removal cf shuttering.
-Cover to reinforcement to bo minimum 20 mm
SECTION B-B
(a")5.#6-20-L=135cm I?) 25*6-2 Û L = JDQcm
_b) ¿ÜÍ6-Í0 L=165cm
(a) 12*6-20 L=135ci
SECTION C-C
BENDING SCHEDULE
a outside dimensions
straightstroightstraight
_;t"=
165 6600
300 | 7800
25 [ 100
660110
65
Bight
43,8 kg.
R E1NFORCEMENT PLATFORM
j |(a)5*6-20-L=135ci
! (a) 12*6 -2O-L-135 cm
TWIN TAP REINFORCED CONCRETE STANDPOST

5.10 ,
BILL OF QUANTITIES OF CIVIL WORKS
ITEM DESCRIPTION UNITQUANTITY JNITPRICE AMOUNT
EXCAVATION
BUILDING, CONCRETE,5 cm,MIX 1:3:6
FORMWORK PLATFORM
REINFORCEMENT COM-PLETE
CONCRETE PLATFORMMIX 1:2:4
FORMWORK COLUMN ANDBUCKET STANDS
CONCRETE COLUMN ANDBUCKET STANDSMIX 1:2:4
PLASTERING ON PLAT-FORM MIX 1:3 INCL.GUTTERS
REFILLING
m
m2
m2
kg
m3
m
m
3.0
5.2
5.6
50.5
1.8
2.3
0.2
3.5
0.7
TWIN TAP REINFORCED CONCRETE STANDPOST
REMARKS
-Variable s ix» should b* adjusted to suitlocal customs an d pract ices.
-Al l *dges to b* rounded oft.
-All brickwork to bv cement plQítíred 1.5-2.5 cm
-In the absence of a natural drainaround tht public standpost d raina g tshould be constructed.
-Cot tie grid should be painted withf#d oxide paint and tead point.
PLAN
40 to 100variable.
45 JO 65
SECTION A-A
THREE TAP CONCRETE / BRICKWORK CATTLE PROTECTED STANDPOST

5 . 1 1 ,
BILL OF QUANTITIES OF CIVIL WORKS
ITEN DESCRIPTION UNITQUANTIT Y UNITPRICE AMOUNT
EXCAVATION
FORMWORK PLATFORMINCLUDING PIT
WIREMESH NETTINGDIMENSIONS ... x
CONCRETE PLATFORMMIX 1:3:6
BJ<ICKWORK IN CEMENTMORTAR MIX 1:6 FORWALLS AND BUCKETSTAND
PLASTERING ON WALLS,PLATFORM AND BUCKETSTAND MIX 1:3
CATTLE GRATE, INCL.MOUNTING
REFILLING
m
m2
m3
m3
m2
ea
m3
3.7
7.2
10.0
2.8
3.0
22.0
1
0.6
THREE TAPS CATTLE PROTECTED STANDPOST

ÍLZ í IPET
5CHEHATK LAYOUTOf PIPEWORK
nitriu: I i or. IWI*>ID
ÏC M 15H MO ZiO 300 t i
bmrr bon. « MV. m a i ) H
ROOF DETAILPRECAST CONCRETE 5LAB CeTAI.
SECTIONAL PL AW B-B
WATER KIOSK WITH FOUR TAPS

5.12.
BILL OF QUANTITIES OF CIVIL WORKS
ITEM
1
2
3
4
5
6
7
8
9
10
11
12
13
14
DESCRIPTION
EXCAVATION
WIREMESH NETTINGFOUNDATION SLABSDIMENSIONS .. x .. ram
COMPACT HARDCORE 20 cm
EVT. REFILLING WITHCLEAN SAND
FORMWORK FLOORSLABINCLUDING GUTTERS
REINFORCEMENT FLOORWIRE MESHNETTINGDIMENSIONS .. x .. mm
CONCRETE FLOORMIX 1:3:6
BRICKWORK WALLS WATER-KIOSK, INCL. BUCKET-STAND IN CEMENT MOR-TAR MIX 1:6, 15 cmTHTCK
FRAMEWORK SHUTTERSAND DOOR, INCL.SHUTTERS, DOOR, IRON-MONGERIES ETC.
ROOFCONSTRUCTION WITHALL NECESSARY BEAMSAND ROOFSHEETINGINCL. FASTENINGS
PLASTERING ON WALLS,PLATFORM AND BUCKETSTAND WITH CEMENTMORTAR MIX 1:3
PAINTING OF KIOSK
REFILLING
PRECAST CONCRETESLABS100 x 75 x 35 mmINCL. REINFORCEMENT
UNIT
m3
m2
m 2
m3
m 2
m 2
m3
m 2
ir>2
—
m3
ea
QUANTITY
7.0
15.0
22.0
—
6.2
14.6
3.5
20.0
46
—
2.5
4
UNITPRICE
WATER KIOSK WITH 4 TAPS
AMOUNT


ANNEXES


LIST OF ANNEXES
1. Symbols and abbreviations
2. Units and conversion
3. Growth factor
4. Service radius
5. Pressure head losses
6. Hydraulic equations
7. Stopcock and waterroeter
8. Materials
9. Standpost drainage
10. Flow control mechanism
11. List of references


ANNEX 1
SYMBOLS AND ABBREVIATIONS
SYMBOLS
A = area (mz) or (ha)a = maximum walking distanceCd = average demand per capita (1/d)D = internal diameter of pipe (ra) or (mm)f = efficiency factor of a tapg = gravity factor (m/s )H = head, pressure head, headloss (mhw)Ha = available headi = hydraulic gradientk = roughness factor (m)L = length (m)m = growth factorN = design populationNo = initial populationn = number of users per standpostp = peak factorp = pressure (mhw)Q = flow rate (mVs) or (1/h)Qmax = required maximum discharge capacity (1/h)qspec = specific flow rate (m" /s)R = service radius (m)r = annual growth rate of population (?;)S = number of standpostsT = design periodt = number of peak hoursv = velocity (m/s)w = wastage factorX - coefficient in hydraulic gradient ip = specific density (kg/m3)v = 3,14S = equal to or larger than¿ = smaller than or equal to* = multiplied by
ABBREVIATIONS
GS = galvanized steelPVC = polyvinylchlorideled = litres per capita per daymhw = meter head of water
hi

ANNEX 2
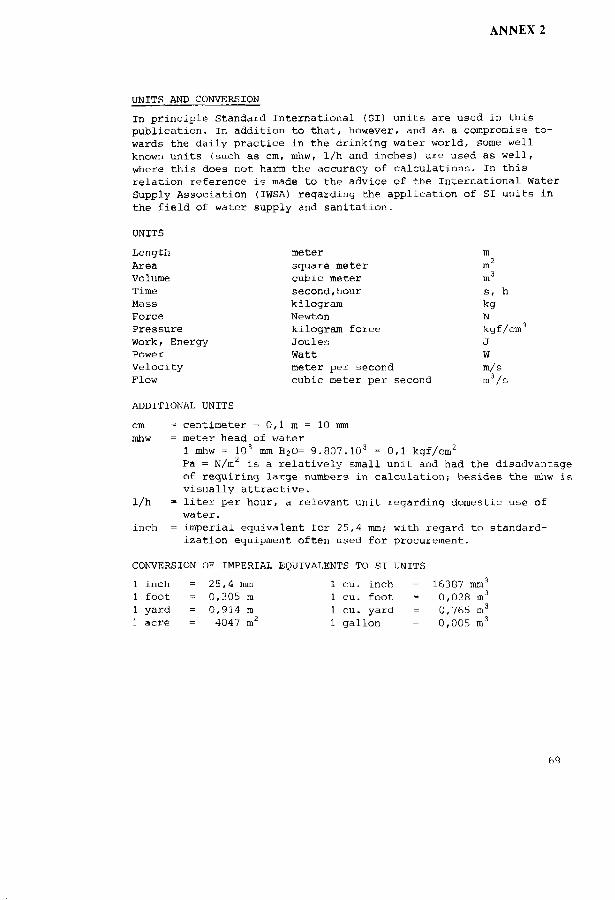
UNITS AND CONVERSION
In principle Standard International (SI) units are used in thispublication. In addition to that, however, and as a compromise to-wards the daily practice in the drinking water world, some wellknown units (such as cm, mhw, 1/h and inches) are used as well,where this does not harm the accuracy of calculations. In thisrelation reference is made to the advice of the International waterSupply Association (IWSA) regarding the application of SI units inthe field of water supply and sanitation.
UNITS
LengtliAreaVolumeTimeMassForcePressureWork, EnergyPowerVelocityFlow
metersquare metercubic metersecond,hourkilogramNewtonkilogram forceJoulesWattmeter per secondcubic meter per second
mm2
m3
s, hkgNkgf/cmJWm/sm3 /s
ADDITIONAL UNITS
cmmhw
centimeter =0,1 m = 10 mmmeter head of water1 mhw = 1 0 H2O= 9.807.10
o = 0,1 kgf/cm¿
Pa = N/m is a relatively small unit and had the disadvantageof requiring large numbers in calculation; besides the mhw isvisually attractive.
1/h = liter per hour, a relevant unit regarding domestic use ofwater.
inch = imperial equivalent for 25,4 mm; with regard to standard-ization equipment often used for procurement.
CONVERSION OF IMPERIAL EQUIVALENTS TO SI UNITS
1 inch = 25,4 mm1 foot = 0,305 m1 yard = 0,914 in1 acre 4047 m
1 cu. inch1 cu. foot.1 cu. yard1 gallon
= 16387 mm0,028 m3
0,765 m3
0,005 m3
69


ANNEX 3
GROWTH FACTOR AS A FUNCTION OF A DESIGN PERIOD AND THE ANNUAL
POPULATION GROWTH RATE IN PERCENTAGE
Design
Period
in years
0
5
10
15
20
Annual
0
1.00
1.00
1.00
1.00
1.00
population
2
1.00
1.00
1.22
1.35
1.45
3
1.00
1.16
1.34
1.56
1.81
growth
4
1.00
.122
1.48
1.80
2.19
rate
5
1.00
1.27
1.63
2.08
2.65
in %
10
1.00
1.61
2.59
4.18
6.83
The growth factor (m) depends on the annual growth rate (r) andrn
the design period (T): m = {l+r} .
In general the growth factor will be in the range of 1.0 to 1.6.
71

ANNEX 4
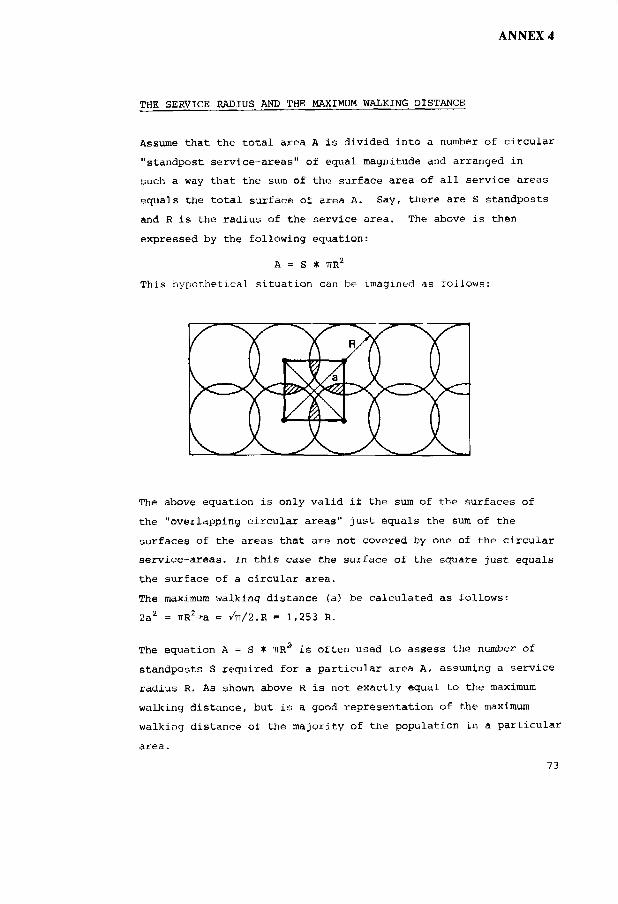
THE SERVICE RADIUS AND THE MAXIMUM WALKING DISTANCE
Assume that the total area A is divided into a number of circular
"standpost service-areas" of equal magnitude and arranged in
such a way that the sum of the surface area of all service areas
equals the total surface of area A. Say, there are S standposts
and R is the radius of the service area. The above is then
expressed by the following equation:
A - S * ÏÏR2
This hypothetical situation can be imagined as follows:
The above equation is only valid if the sum of the surfaces of
the "overlapping circular areas" just equals the sum of the
surfaces of the areas that are not covered by one of the circular
service-areas. In this case the surface of the square just equals
the surface of a circular area.
The maximum walking distance (a) be calculated as follows:
2a2 -rrR2-i-a = A/2.R = 1,253 R.
The equation A = S * TTRa is often used to assess the number of
standposts S required for a particular area A, assuming a service
radius R. As shown above R is not exactly equal to the maximum
walking distance, but is a good representation of the maximum
walking distance of the majority of the population in a particular
area.
73


ANNEX 5
PRESSURE HEAD LOSSES DUE TO THE FLOWING OF THE WATER
headloss due todifference inlevel betweenmain and taps
mainwatermeter pit
ser vice" pípiã"
head loss in service pipeheadloss in stopcockand/of watermeter
headloss in service pipe
available pressureon the taps
This diagram illustrates:
a) the difference in levai between the main and the taps
b) the total length of service pipe being greater than the
direct horizontal distance (the possible deviation in
the horizontal plan has also to be taken into account).
75


ANNEX 6
HYDRAULIC EQUATIONS
1. Equation of Bernoulli:
v2 p2g Pg
H = Total energy level ("total head")
V2 = head related to the velocity of the water2g
P = pressure head, being the pressure in the waterPg
Z = level in relation to a reference level
When the water in a pipe is in rest (V=o) the total head
is only determined by the pressure head and the level.
2. Hydraulia Gradient
i = X ~ . ̂ - in which V = 4Q/XD2
A =.0.25/{log ^~}Z and
k = roughness coefficient
The coefficient k is directly related to the kind of
material. For galvanised steel (GS): k - 0.001 and
for polyvinylchloride (PVC): k = 0.0001.
3. Definitions:
Hydraulic: "of water flowing through pipes and channels".
Hydrostatic: "of the equilibrium of liquids and the pressure
exerted by liquids at rest".
77


ANNEX 7STOPCOCK (VALVE) AND WATERMETER
washer
STOPCOCK
-cover
dial
gearmechanism
waterwheel flow
'-strainer
WATERMETER (dry dial)
79

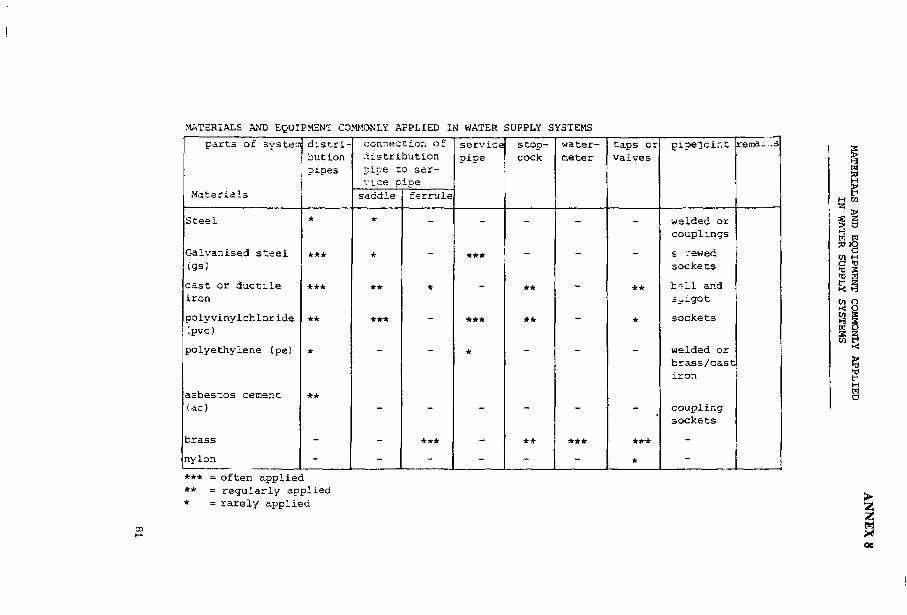
MATERIALS AND EQUIPMENT COMMONLY APPLIED IN WATER
parts of systen
Materials
Steel
Galvanised steel<gs)
cast or ductileiron
polyviny1ch1or ide(pvc)
polyethylene (pe)
asbestos cement(ac)
brass
nylon
distri-butionpipes
*
***
***
**
*
**
-
-
connection ofdistributionpipe to ser-vice pipesaddle
*
*
**
***
-
-
-
ferrule
-
-
*
-
-
***
-
servicepipe
-
***
-
***
*
-
-
-
SUPPLY SYSTEMS
scop-cock
-
-
**
*#
-
**
-
water-meter
-
-
-
-
-
***
-
taps orvalves
-
-
**
*
-
***
*
pipejoint
welded orcouplings
s rewedsockets
b-rll and3-i.got
sockets
welded orbrass/castiron
couplingsockets
-
-
raina- -s
*** = often applied** = regularly applied* = rarely applied 2
MX


ANNEX 9
STANDPOST DRAINAGE
/VAV
tap
7A\X
//M\NV///A\\W//A\\I approx. 1m I
e10cm agricultural drainpipescover from broken pipe ->
WV/X^N) K//1S\\V///,<W
Agricultural drainage-tiles laid in a 'soak-away' trench (urilesn a
more accurate figure in knoun, the rate of infiltration per m2 of
nidewall area may be estimated as 10 l/á).83


ANNEX 10
FLOW CONTROL MECHANISMS
A. SCREW TAFS3 such as the ordinary household type, have many
advantages including simplicity of maintenance, and will prob-
ably be the most widely chosen. The valvs washer in metal taps
must be replaced regularly to prevent leakage, but this task is
well within the capability of a local caretaker. The amount of
wear on the washer and on other parts depends on how the tap is
used, and whether it is sometimes closed too tightly. However,
once people have become used to the device, and if necessary
have been given instruction in its use, there should be no major
problems.
Screw taps may be of brass, iron or plastic. Brass taps are often
stolen because of the value of the material and can be easily
screwed off the end of the pipe unless welded to it. Experience
with nylon taps which have nylon valve-seats has been quite good,
and less wear has occurred than in metal taps.
There are, of course, many types and brands of screw taps on the
market. Small details like the quality of washers and finish of
seats can be very important for the amount of maintenance the
tap will require.
B. TAPS WITH A BALL VALVE appear to offer some advantages, because
the closing pressure is not dependent on the force excerted by
the user. Thus wear should vary less, and there are no small
washers which require frequent changing. Some authorities suggest
that such taps are more prone to leaking than well-maintained
screw taps. Generally, they give rise to a lower head loss and
so provide an adequate rate of flow even when water pressure
is relatively low.
85

A. SCREW TAPS
Al: ORDINARY SCREW TAPIN CLOSED POSITION
A2: NYLON TAP INCLOSED POSITION
M : IN CLOSED POSITION
86
B2: IN OPEN POSITION

C. SPRING-LOADED OR GRAVITI-OPERATED TAPS are devices with which
the user has to apply some force with the hand in order to keep
the water flowing. They appear to be an attractive option for
unsupervised standposts where it is of special importance that
water waste be avoided. The tap is closed by spring action or
by gravity immediately the user's hand is removed.
These taps are relatively cheap, simple to operate and present
no complex maintenance problems. However, their value in re-
ducing waste is not always as great as might appear, because
they are sometimes kept open by means of a rope, wire or stone
attached to the handle.
The gravity-operated taps is widely used in India. It has a
heavy mouthpiece which must be pushed up to open the tap. It
falls back as soon as the user ceases to hold it.
D. VOLUMETRIC OR DELAÏED-CLOSING TAPS are similar to spring-loaded
taps, but have a more complex mechanism which keeps the tap open
for a fixed period of time after the handle has been operated.
The tap cannot be held open by weights because it closes after
the fixed time interval even when pressure is continually applied.
To re-open the tap, the handle or knob has to be operated again.
Such taps may be the most effective at reducing wastage at un-
supervised standposts, but they are complicated devices requiring
regular maintenance by skilled staff. But it should also be
noted that delayed-closing or spring-loaded taps are not always
very acceptable to users. Some require considerable force to
operate, and it is not excluded that they cause minor injuries
when not operated properly.
87

C. SPRING-LOAPED OR GRAVITY-OPERATED TAPS
in closed position
GRAVITY OPERATED TAPS
(Jayson (Pat) Water Taps)
push button
Dl: SELF CLOSING TAP(Pordilla)
lever handle
spindle socketand completeplunjer withseating washer
seating andguide cage
D2: SELF CLOSING TAP
(Tylor wastenot)

The definition of a tap is that of a closing device at the end
of a pipe, whereas a. valve is fitted in a pipeline.
E. A DIAPHRAGM VALVE has a body made of either cast iron or poly-
vinylchloride and a diaphragm usually constructed of neoprene or
teflon. The advantages of the diaphragm valve are low pressure
losses in comparison with taps; the separation of the operation
mechanism from the water by the diaphragm; the glandless con-
struction of the operating mechanism and the low maintenance
requirements during its working life.


ANNEX 11
LIST OF REFERENCES
BACHMANN, A.
Manual for Water Systems and Pipe Work
A brief introduction course for the establishment of rural watersupplies in Nepal.Swiss Association for Technical Assistance (SATA), Katmandu.
BORJESSON, E.K.G.; BODEDA, C M .
New Concept in Water Service for Developing Countries
Journal of the American Water Works As aoovation, 56, 1964,pp. 853-862.
FAIR, G.M.; GEYER, J.C.; OKUN, D.A.
Water and Wastewater Engineering, Vol. I: Water Supply andWastewater Removal
John Wiley and Sons, Inc., New York, 1966.
JOHNSON, C.R.
Village Water Systems, Standards and Procedures for the Designof Water Supply Systems in Rural Areas of Nepal and Bhuthu
UNICEF, Katmandu, Nepal, 1976.
LAURIA, D.T.; KOLSKY, P.J.; MIDDLETON, R.N.
Design of Low-cost Water Distribution Systems
P.O. Report No. RES11, Energy, Water and TelecommunicationsDepartment, The World Bank, Washington D.C., 1977.
PITCHAI, R.
Water Distribution - Problem and Discussion
Paper presented at the Seminar on Improvement and Maintenance ofExisting Water Supply Systems, Manpur, U.P., India, 1978.World Health Organization, Regional Office for South-East Asia.
TASGAONKAR, S.K.
Norms for Design of Rural Pipes Water Supply Schemes
Journal of, the India Water Works Association, January/March 1978,pp. 97-102.
91