Public-private wage differentials in Tunisia: Consistency...
27
1 ERF’s 23rd Annual Conference, March 18, 2017 Dead Sea, Jordan (TBC) Regional Economic Cooperation, Peace and Development (Theme: Microeconomic and Sectoral studies) Public-private wage differentials in Tunisia: Consistency and decomposition Mohamed AMARA 1 , Wajih KHALLOULI 2 & Faicel ZIDI 3 Abstract In this paper we estimate and decompose the public-private wage differentials for both rural and urban areas, using the 2012 household survey on Tunisian youth. Oaxaca decomposition results suggest that the average public sector worker earns more than his/her private counterpart. The results suggest that a substantial part of the conditional gap in urban area is actually explained and that public sector employees in both urban and rural areas have, on average more education. Using unconditional quantile decomposition technique proposed by Firpo et al (2009), we find that in urban area the discrimination effect contributes more to the wage differentials than the characteristics effect at the higher end of the wage distribution. Separate analyses by gender and educational levels reveal a higher public-private sector earning gap for women. Less educated workers are compensated much more in the public sector than in the private sector, while the wage differential for university educated workers decreases rapidly through the distribution. JEL classification: J16, J31, J38, J45. Keywords: wage gap; Public-private sector; Quantile decomposition; Tunisia. 1,2,3 Higher School of Economic and Commercial Sciences of Tunis, (Tunisia), 4 Rue Abou Zakaria El Hafsi - 1089 Montfleury, Tunis, and MENA Youth Policy Research Center (MYPRC). 1 E-mail: [email protected]. 2 E-mail: [email protected] 3 Email : [email protected]
Transcript of Public-private wage differentials in Tunisia: Consistency...

1
ERF’s 23rd Annual Conference, March 18, 2017
Dead Sea, Jordan (TBC)
Regional Economic Cooperation, Peace and Development
(Theme: Microeconomic and Sectoral studies)
Public-private wage differentials in Tunisia: Consistency and decomposition
Mohamed AMARA1, Wajih KHALLOULI2 & Faicel ZIDI3
Abstract
In this paper we estimate and decompose the public-private wage differentials for both rural and urban areas, using the 2012 household survey on Tunisian youth. Oaxaca decomposition results suggest that the average public sector worker earns more than his/her private counterpart. The results suggest that a substantial part of the conditional gap in urban area is actually explained and that public sector employees in both urban and rural areas have, on average more education. Using unconditional quantile decomposition technique proposed by Firpo et al (2009), we find that in urban area the discrimination effect contributes more to the wage differentials than the characteristics effect at the higher end of the wage distribution. Separate analyses by gender and educational levels reveal a higher public-private sector earning gap for women. Less educated workers are compensated much more in the public sector than in the private sector, while the wage differential for university educated workers decreases rapidly through the distribution. JEL classification: J16, J31, J38, J45. Keywords: wage gap; Public-private sector; Quantile decomposition; Tunisia.
1,2,3 Higher School of Economic and Commercial Sciences of Tunis, (Tunisia), 4 Rue Abou Zakaria El Hafsi - 1089 Montfleury, Tunis, and MENA Youth Policy Research Center (MYPRC). 1 E-mail: [email protected]. 2 E-mail: [email protected] 3 Email : [email protected]

2
1. Introduction
Public-private wage gap within countries is a topic that has received a great attention in
economic literature. Wage parity and equal pay across sectors does not exist as yet within any
country, but the size of the wage gap varies considerably. The literature has provided some
arguments why private and public sectors employees can be paid differently. One body of
research argues that the monopolistic power of the governments could set wages in a non-
competitive way (Reder 1975). The relationship between the monopolistic power and non-
competitive wage is amplified by the fact that the objective function of the government and
the private sectors may differ. Hence, if the private sector is largely guided by the essence of
market forces and the principle of profit maximization, the public sector may be driven by
political motives such as vote, budget maximization, equity and fairness. Governments are
under pressure of being a model employer and not pay low wages to its less skilled workforce
(Melly 2005). In turn, another set of research stresses the fact that the wage setting
environment and the labour market structures substantially differ between both sectors. For
example, it has been shown that union density and collective bargaining tend to be higher in
the public sector than in the private sector. Other than the cited reasons, the productivity-
related characteristics of employees such as education or experience can also explain the wage
gap between the public and private sectors (public sector employees with high education
degree should have high wages). The government should ensure the principle of ‘equal pay
for work of equal value’ and target productivity as an instrument to enhance pay.
Nevertheless, the pursuit of this goal could have a serious impact on the efficiency of the
labour market. If the government pays too much, private-sector workers may be more
motivated to leave their sector to take advantage from relatively high-paying jobs in the
public sector. This scenario will lead to higher taxes and budget deficits. On the other hand, if
the public sector pays too low, it will not find skilled and loyal employees (Melly 2005).
We believe that this question represents a credible policy alternative that merits careful
consideration from Tunisian economists and policymakers. In fact, Tunisia has been
undergoing significant changes in its wage setting arrangements since the revolution of 14
January 2011. Right after the revolution, and in order to absorb the anger of the Tunisian
people and maintain socio-political stability, the government has significantly increased hiring
in the public sector. In 2011 and 2012, more than 90000 new hires joined the public sector.
Between 2010 and 2014, the total public sector employment rose by 20 percent to 615000

3
workers, and is today at 795000 corresponding to a ratio of total public employment to total
employed workforce of about 24 percent, a level that is three times higher than in Morocco or
merging markets such as Chile or Mexico (IMF 2015).4 The recruitment drive led to a 44
percent increase in the wage bill between 2010 and 2014 (much higher than the 28 percent
increase between 2006 and 2009), which has led later to macro-economic imbalances in the
country (Brockmeyer et al 2015) and has worsened more and more the public-private wage
gap. For example, the wage gap between public and private jobs reaches 40 percent for
university graduates (except engineers). Additionally, the public sector wage premium raises
public wage about 18 percent (between 24 and 30 percent for women) above those of the
private sector (Achy 2011). Governing the relationship between public and private sectors
becomes a priority for the government to ensure the labour market stability. Recently, the
Assembly of the Representatives of the People adopted the law on Public Private Partnership
(PPP) that aims to mobilize funds for the implementation of cooperative projects in
construction, financing and ongoing operation and maintenance of infrastructure assets. This
PPP law can play an important role for inclusive and sustainable growth for the case of
Tunisia, if it will be well operationalized.
In this paper, we use recently collected two separate household surveys in urban and rural
areas of Tunisia conducted in 2012 by the World Bank in collaboration with the National
Statistical Office and the General Commissariat for Regional Development. We use the
Oaxaca-Blinder and the unconditional quantile decomposition techniques to analyze the wage
differentials both at the mean and along the wage distribution. We find that public sector
employees earn more than their private counterpart. Moreover, a substantial part of the
conditional gap in urban area is explained by observed characteristics. Our findings reveal
also that in urban area the discrimination effect contributes more to the wage differentials than
the characteristics effect at the higher end of the wage distribution. Our decomposition results
by educational levels show that less educated workers are compensated much more in the
public sector than in the private sector.
The article is organized as follows. Section 2 offers a brief review of the existing literature on
public/private wage differentials. Section 3 briefly describes the Tunisia’s labour market
institutions. The data and the used methodology are presented in section 4. Section 5 outlines
the empirical results, and section 6 gives some policy implications and concluding remarks.
4 IMF Country Report No. 15/285.

4
2. Literature review
Several empirical works have already addressed the issue of the public-private wage
differentials in the case of developed countries. The pioneers’ works have focused on US
employees (Smith 1976, Quinn 1979, Bellante and Long 1981, Smith 1981). The main result
of these studies is the evidence that workers in public sector were paid more than those in
private sector. This differential is not explained by productivity’s differential but rather by
gender and specially by level of government (i.e. federal, state or local). Moreover, other
empirical studies addressed public-private wage differential in Europe focusing mostly on
mean of the wage distribution. For example, Dustmann and Van Soest (1997) used data from
the German Socio-Economic Panel for the years 1984-1993 in order to study the gender gap
between earnings distributions of public and private sector workers in Germany. They found
that women are better paid than men in the public sector in contrast with private sector.
Moreover, using data of Spain household budget survey 1990-1991, Lassibille (1998)
estimated separate equations of wage for each gender by public and private sectors. Results
confirmed that education and experience and being women are less remunerated in public
sector than in private sector in Spain. Recently, most of empirical works have used quantile
regressions to examine the varying of the public-private wage gap along the earnings
distribution (Cai and Lui, 2011). Muller (2000) has tried to estimate the earning surplus of
public sector which is the remaining part of wages differential that cannot be explained by
differences endowments. Using data of the Canadian Labour Market Activity Survey 1988-
1990, author found that rent payments is highest in public sector and for employees at the
lower end of the wage distribution. Melly (2005) used the German Socio-Economic Panel
data for the years 1984-2001 and found that employees with only basic schooling and those
with more experience do best in the public sector. In addition, quantile decomposition results
show that earnings gap between public and private sectors is less explained by employees'
characteristics for low end wages. Lucifora and Meurs (2006) used micro data for Great
Britan, France and Italy to investigate public-private pay determination. They used quantile
regression methods to analyse and decompose the public-private wage gap within and across
countries. Their results showed that for the three countries the public sector is found to pay
more to low skilled workers respect to the private sector, while the reverse is true for high
skilled workers. In addition, they found that females are much better off in the public sector as
compared to the private sector. In the same context of European countries, Depalo et al.

5
(2015) extended the public-private wage gap analyze using ten euro-area countries in the
period 2004-2007. Analyzing the specific covariates at different quantiles of wage
distribution, they found a great heterogeneity across countries. For some countries, public
wage distribution is less dispersed than in private sector. In addition, the public-private pay
gap is more explained by endowments in the upper end of and by higher returns at the low
end the wage distribution. Moreover, Cai and Liu (2011) used also the quantile regressions to
explore how sectoral wage effect varies along the wage distribution in Australia. They found
that the most significant proportion of the public-private wage gap is explained by the
differences in individual and job characteristics.
As regards the developing countries, recently an extensive literature was developed to
documenting the public-private sector wage differential. Many econometric tools have been
used but the most one used is the quantile regression in order to avoid with problems owing to
treatment of the organizational size, the endogeneous sorting of workers between sectors
(Morikawa 2016). Panizza and Qiang (2005) used household surveys for 13 Latin American
countries in order to investigate wage differential between the public and private sectors.
Basing on the quantile decomposition, they found that in majority of these countries, public
sector workers are spoiled given the existence of premium that is often higher for women than
for men. Mizala et al. (2011) estimated the public-private wage gap for urban workers in
eleven Latin American countries for the 1992-2007. They found that public sector employees
earn more than private sector counterpart, and that the gap has increased over the 1992-2007.
A little further from the Latin American, but always in the case of developing countries,
Glinskaya and Lokshin (2007) used the sector selection bias correction and the Propensity
score matching methods to investigate differences in wages between public sector, formal-
private and informal-causal sectors. They used 1993-94 and 1999-2000 India Employment
and Unemployment surveys. They found that public sector wages are higher than formal and
informal private sector and these differentials tend to be higher in rural areas, among women
and for low-skilled workers. San and Polat (2012) used the quantile decomposition method to
determine wage gap between public and private sectors during the 1990s and 2000s in
Turkey. Using the 1994 Household Income Distribution and Consumption Expenditure
survey and 2008 Household Budget Survey, they found that for lower quantiles the difference
in the endowments between sectors explains perfectly the wage gap. However, higer wage
gaps are explained more by the sector effect. Recently, following previous researches, Ahmed
and McGillivray (2015) investigate Labour Force Surveys for 1999-2000, 2005-2006 and

6
2009-2010 by using the quantile decomposition to study the public-private wage gap in
Bangladesh. They showed that the improvement of female education in Bangladesh and the
decline in discrimination against woman have had a substantial effect on reducing the gap in
average wages between men and women by 31 percent.
In contrast to developed and developing economies, few studies have explored the wage gap
between sectors or genders in African countries. There is Nielsen and Rosholm (2002) who
used three cross-sections of Zambian Household surveys from the early nineties which
corresponds to economic transition period for this African country. They used the quantile
decomposition in order to investigate how effects of the public-private wage gap determinants
change at points of the wage distribution and over the time. Their main result was that there is
higher gap for some groups of low-skilled employees than groups of high-skilled. Recently,
Kippra (2013)'s report investigates this issue about public-private wage gap for Kenyan labour
market. Many sources of data are used in this study such as the survey of private and public
institutions, the public sector wage data for 2010 from the government’s annual Economic
Survey and data from the National Human Resource survey of 2009. Using the matching
technique method, Kippra found that wages in private sector are higher than those in public
sector. Despite this pronounced inequalities workers in public sector, more specifically who
are highly educated, choose to stay in public sector because of job characteristics such as job
security, prestige, allowances and other non-wage benefits.
However, by the best of our knowledge there is no study which seeks to investigate the
public-private wage gap determinants in Arab countries. This paper tries to fill this gap by
analysing post-revolution public-private wage differentials distribution in Tunisia municipal
areas. In particular, this paper focuses on the differences in the relative wages by gender, age,
education and region to present evidence on the public-private wage gap structure. Moreover,
this paper examines changes in the public-private gas in Tunisia by decomposing wage
differentials both at the mean (into endowment and discrimination effects) and along the wage
distribution (quantile decomposition).
3. Institutional background and wage structures in Tunisia Tunisian job market suffers from inefficiencies due to numerous key reasons and many
imperfections. State wage policies and trade unions actions, which have made wages exceed

7
the market equilibrium wage, can be considered as sources of wage rigidity in the labor
market and may form distortions which can deter some employers and increase
unemployment accordingly. In fact, increasing public jobs and the wage gap of public/private
suggest that public sector trade unions are so powerful that they dictate their working
conditions to different governments especially after the events of January 14, 2011. Indeed,
according to the National Institute of Statistics and the Research Center and Social Studies,
the total average monthly remuneration in the public service is estimated at 1127 dinars
against only 557 dinars in the private sector (see Figure 1).
Figure 1: Average salary (TND/employee) for both public and private sectors
The earning gap depends in general on three key factors: Differences in qualifications
between the public and private sectors, the accumulation of advantages inherited since the
independence in the public sector and the role of trade unions in the negotiation of
employment contracts. Moreover, the Tunisian labor legislation and the collective bargaining
process may impact recruitment mechanisms, industrial relations in wage policies such as
minimum wage legislation, the indexation clauses…While the first two factors are non-
discriminatory, the last ones suggest that Tunisia is living an exorbitant trade union power that
is blocking the process of economic growth.
0
200
400
600
800
1000
1200
1400
1600
Average salary inpublic sector
Average salary inprivate sector

8
To explain the main sources of earning gap, we identify the wage determination policy in both
public and private sectors and we analyze the economic agents’ behavior and economic
conditions in Tunisian labor market. It is known that the existence of well-coordinated and
strong trade unions is therefore a crucial factor to provide stability of the wage share over
time. However, in times of crisis, strong trade unions can negatively affect the
macroeconomic stability and increase unemployment such as the current case of Tunisia.
a. Wage policy in Tunisia: main features
Overall, wage policy is the image of a certain balance between the interests of the employers
(state or enterprise) and workers. It also allows to better reconciling between a variety of
strategies: workers’ trade unions that aim on improving living standards and members
working conditions; concerned employers to master or reduce wage costs.
The objective of trade unions in the public or private sectors remains the same: wage review,
beneficial wage agreements and improving working conditions. To this end, trade unions act
as both government and employers interlocutors. However, wage-setting differs between
public and private sectors. In the private sector, collective bargaining will take place at the
national level following the institution of a signed framework collective agreement and a
signed social pact between the Tunisian General Labor Union (UGTT) and the Tunisian
Union for Commerce, Industry and Handicrafts (UTICA) under State control. These
collective bargaining agreements allow the organization of social relations, to fill some gaps
of Labor Code for maintaining of social peace. Sectoral agreements are largely inspired from
this framework collective agreement. In the case of public civil servants, even if there is no
collective bargaining, the trade union intervenes in developing their statutes through its
representatives in the establishments. As regards public enterprises employees, each
enterprise has its own statute which fixes the wages according to the categories and working
conditions.
The trade unions’ actions and State wage policies as manifested by collective bargaining
(private sector) and increases decreed by employees and public servants constitute distortions
to the free functioning of the labor market. The setting of the guaranteed interprofessional
minimum wage (SMIG monthly for both regimes 40h/week and 48h/week) is crucial. SMIG
is considered as reference in the development of conventional wages. Thus, the control of the
SMIG is essential to control the development of the rest of wage. Pay increases granted to
minimum wage (SMIG monthly 40h and 48h and the SMAG daily) reflect wage policy.

9
Other wage increases in public and private sectors are calculated based on the SMIG
increases,
The negotiation review and wage agreements between trade unions and employers show that
the situation differs between public and private employers. Agreements in both sectors are
subject to different constraints of the two employers. Those differences explain the public /
private wage gap in Tunisia. In the next two sections below, we briefly examine the
wage determination in both sectors.
b. Wage determination in Tunisian private sector
The main objective of the employers’ organization is to maintain the competitive position of
Tunisian domestic firms on the market during each wage negotiation cycles. To achieve this
objective, firm should keep its average costs comparable to those of the competing ones
following each wage agreement. Otherwise, if the wage rises more than productivity, there
will be an increase in the market price or a decrease in the profits and market share for firms.
Hence, the firm’s constraints consist in maintaining their market positions. However,
collectives bargaining are not aimed to realize firm’s expectations (employment, productivity,
rescuing firms in difficulty...). These collectives bargaining are intended primarily to improve
the purchasing power of workers. Mostly, the apparent contradiction between UGTT and
UTICA gives rise to difficult negotiations. In most cases, the state intervention is necessary to
bring the two parties together. Nevertheless, despite the resistance of the UTICA, the
tradeoffs setting after the revolution gave rise to increases in market prices.
c. Wage determination in Tunisian public sector
In Tunisia, public goods market is characterized by monopolistic behavior. The government
public services generate a wage cost but generally have not a market price. They are offered
to people with rates below than the market price. Sales prices of public goods are less /equal
to production costs. In the absence of any sanction by the market, the Tunisian government
exhibit more flexibility in the negotiations wage than to the private employer. After the
revolution, representatives of the public sector were less resistance degree than their
counterparts in the private sector in order to establish social cohesion. Since 2011, wage
increases had inflationary impacts and have only avoid negative effects on public finances
(budget deficit and taxation). In conclusion, the public/private wage gap in Tunisia can be

10
summarized in three main reasons. First, given that the government’s constraints are not to
control the budget deficit after revolution, the public employer was more generous than the
private employer in the wage agreements. This laxity of public sector in negotiations is the
main origin of the public/private wage gap. Second, the effects of unionization in the public
sector are more pronounced than in the private sector. Indeed, according to the recent
European Commission report on the social dialogue in Morocco, Tunisia and Jordan, the
degree of private-sector unionization is about 15% (250,000 of which 200,000 from UGTT)
compared to 60% for the public-sector (including public companies).5 Third, it remains
difficult for private sector unions to organize workers for two main reasons: workers are low-
paid and about 80 percent of them worked in small-scale activities (the predominance of small
companies).
4. Data and Methodology
a. Data description
We use data from two separate household surveys in urban and rural areas of Tunisia, called
respectively the Tunisia Household Survey on Youth in Urban Areas (THSYUA) and the
Tunisia Household Survey on Youth in Rural Areas (THSYRA). Both surveys have been
conducted in 2012 by the World Bank in collaboration with the National Statistical Office
(Institut National de la Statistique or INS) and the General Commissariat for Regional
Development (Commissariat Géneral au developpement Régional or CGDR). The aim of
those surveys was to deeply understand urban and rural inequalities, with a specific focus on
economic opportunities for young people aged 15-29 (World Bank 2014). The THSYUA and
THSYRA contain information on a range of individual (age, gender, education, marital status,
employment status, kind of job, wage earned, migration...) and household-level characteristics
(household size, household composition, governorate, and access to basic services). The
THSYUA included also information about perceptions and aspirations among youth.
The THSYUA was representative across the seven regions of Tunisia (Greater Tunis; North
East; North West; Central East; central West; South East and South West), while the
THSYRA was only representative on three regrouped survey regions. The first survey region
included coastal governorates in the North and the East of the country. The second survey
5 European Commission (2016) ‘Social Dialogue in Morocco, Tunisia and Jordan, regulations and realities of social dialogue’.

11
region included the southern governorates and the third survey region covered the rural
interior of Tunisia, the remote areas of central and western Tunisia including the Algerian
border (World Bank 2014).6 For the urban area, the survey covered 4214 households (16995
individuals of which 3936 aged 15-29 years) done in two stage random sampling. At the first,
352 enumeration areas (primary unit of sampling) were selected according the principle of
probability proportional to size. At the second, 12 households were randomly selected from
each primary unit. The second survey has a sample size of 1400 households (7821
individuals) in the entire rural area of Tunisia.
The sample used in this study, for both urban and rural areas, includes individuals between the
ages of 15 and 60 years. We exclude child workers and retired. The official age of retirement
is fixed at 60 years old since the independence, but it may be reduced from 60 to 55 years for
workers in arduous jobs or unhealthy or demanding tasks. We use the total net income in
normal month in Tunisian National Dinars (TND) during past 7 days. Income received in
exchange for work is classified in four different categories: work without pay; work with
fixed salary; work with variable income; and work with fixed salary and variable income.
Table 1 gives the distribution of different categories of work for public and private sectors.
Table 1: Distribution of work categories by sectors
Public sector Private sector
# observations % # observations %
Without pay 14 1 35 1.94
Fixed salary 1334 95 1229 67.28
Variable income 41 3 442 24.21
Fixed salary with variable income 13 1 120 6.58
Total 1402 1826
The average monthly earnings of public sector workers was 711 Tunisian Dinar (TND) in
urban area, while private sector workers earned an average of 419 TND, giving a public-
private wage differential (defined as a ratio of average public and private earnings) of 1.7
(Table 2). The public-private wage differentials were lower in rural than in urban areas (1.5 vs
1.7) (Table 3). Public-private wage differential was largest for urban women (1.94) followed
in order by urban and rural mean (1.61 and 1.55 respectively). It can also be seen that
differences in earnings between public and private sectors can vary depending on the level of
6 For more details see Annex 1 “Data Sources” of the World Bank 2014 report “Breaking the barriers to youth inclusion”.

12
education, region, and marital status. The higher differential is observed among the employees
in vocational training living in urban area (2.14). However, public sector workers in
vocational training living in rural area are paid less than private sector workers (0.516).
Table 2: Descriptive statistics of monthly earnings for public and private sectors (urban area)
Average Monthly earnings for
public sector (1)
Average Monthly earnings
for private sector (2)
Ratio ((1)/(2))
Monthly earnings 711 (984)
419 (464)
1.697
Education
Basic Education 432 (524) 331 (398) 1.305
Secondary education 589 (699) 411 (381) 1.433
Vocational Training 887 (1646) 415 (176) 2.137
University 955 (1180) 763 (732) 1.252
Region
Greater Tunis 787 (986) 477 (400) 1.650
North East 750 (1176) 393 (627) 1.908
North West 536 (271) 271 (137) 1.978
Central East 740 (1145) 390 (523) 1.897
Central West 564 (280) 381 (340) 1.480
South East 663 (1025) 377 (287) 1.759
South West 688 (1395) 355 (180) 1.938
Gender
Male 731 (1073) 453 (491) 1.614
Female 668 (756) 345 (389) 1.936
Marital Status
Single 469 (774) 387 (436) 1.212
Married 597 (915) 442 (430) 1.351
Widowed 522 (372) 584 (1413) 0.894
Divorced 454 (372) 278 (107) 1.633
Table 3: Descriptive statistics of monthly earnings for public and private sectors (rural area)
Average Monthly earnings for
public sector (1)
Average Monthly earnings
for private sector (2)
Ratio ((1)/(2))
Monthly earnings 476 (211)
315 (263)
1.511
Education
Basic Education 327 (134) 288 (206) 1.135
Secondary education 508 (202) 349 (278) 1.456
Vocational Training 228 (141) 442 (703) 0.516
University 562 (200) 490 (417) 1.147
Region
Greater Tunis 373 (203) 347 (195) 1.075

13
North East 605 (193) 314 (223) 1.927
North West 447 (202) 285 (164) 1.568
Central East 500 (219) 357 (368) 1.401
Central West 457 (196) 305 (239) 1.498
South East 404 (236) 304 (359) 1.329
South West 507 (195) 269 (126) 1.885
Gender
Males 507 (203) 326 (270) 1.555
Female 393 (211) 264 (222) 1.489
Marital Status
Single 450 (227) 309 (228) 1.456
Married 494 (213) 324 (302) 1.525
Widowed N.A 413 (254)
Divorced 391 (190) 311 (127) 1.257
Figure 2 and Figure 3 plot kernel density of the log of monthly earnings for both sectors and
genders for urban and rural areas. Figure 1a shows the kernel-density estimation of the log of
monthly wage distributions in the public and private sectors, respectively. For both sector, the
female earning distribution is shifted to the left with respect to the mean’s one, but the
difference is not very great specifically for the public sector. Figure 2b reports the wage
distribution across sectors. For both gender, the public sector earnings distribution is
characterized by a higher density function around the mode, which gives us a preliminary
evidence of a sector pay gap in Tunisia. In rural area, the public sector earning distribution is
shifted to the right of private sector distribution indicating that public sector workers are paid
higher than workers in private sector (Figure 3b). Although those figures are informative, they
represent unconditional earning distributions without controlling for observed characteristics
of workers in each sector that might significantly affect the wage gap (such as education,
region, age and marital status). To overcome this limitation, we use the Oaxaca-Blinder
decomposition and quantile decomposition to estimate the wage gap as a function of a number
of key observable characteristics, such as gender, age, age squared, region, education level
and marital status.

14
Figure 1a: Kernel density estimates of monthly net log-earnings, divided by sector (urban area)
Figure 1b: Kernel density estimates of monthly net log-earnings, divided by gender (urban area)
0.2
.4.6
.81
De
nsity
4 5 6 7 8log (wage)
Male
Female
Public
0.2
.4.6
.81
De
nsity
3 4 5 6 7 8log (wage)
Male
Female
Private
0.2
.4.6
.81
De
nsi
ty
4 5 6 7 8log (wage)
Public
Male
0.5
1D
en
sity
4 5 6 7 8log (wage)
Private
Female

15
Figure 2a: Kernel density estimates of monthly net log-earnings, divided by sector (rural area)
Figure 2b: Kernel density estimates of monthly net log-earnings, divided by gender (rural area)
0.2
.4.6
.81
Den
sity
4.5 5 5.5 6 6.5 7log (wage)
Male
Female
Public
0.2
.4.6
.81
Den
sity
3 4 5 6 7 8log (wage)
Male
Female
Private
0.2
.4.6
.81
De
nsi
ty
4 5 6 7 8log (wage)
Public
Male
0.2
.4.6
.81
De
nsi
ty
4 5 6 7 8log (wage)
Private
Female

16
b. Methodology We conduct a decomposition analysis at both the mean and quantiles. We start with an
Oaxaca-Blinder decomposition to analyse changes in the public-private and gender wage (for
shortness of presentation, we only present the equations for public-private wage
decomposition). This method decomposes the change in the wage gap (lnw lnw )
into the component of the raw difference attributable to differences in observed characteristics
or endowments (also called explained effect) and to differences in coefficients (unexplained
effect or discrimination) or ‘wage structure’ effect (eq.1 and eq.2). By using the Oaxaca-
Blinder decomposition, we can also identify the contribution of individual covariates to the
wage gap. Formally, the wage gap between public and private sectors is defined as follows:
lnw lnw α α X β β β X X , or as (eq.1)
lnw lnw α α X β β β X X (eq.2)
Where lnw , lnw and X , X are mean log monthly wage earnings and mean
characteristics of workers in public and private sectors, respectively. β and β are the
estimated vector of returns to worker characteristics.
Besides studying the contribution factors to the wage inequality at the mean, we perform
decomposition at different percentiles of the distribution using an Oaxaca-Blinder type
decomposition approach based on Recentered Influence Function (RIF) regressions proposed
by Firpo et al (2009). This method decomposes the wage gap between public and private
sector workers (or between female and male workers) at different points of the wage
distributions. Using unconditional quantile decomposition, the wage inequality at the th
quantile can be decomposed as follows:
, , , (eq. 3)
Where is the th quantile of distribution of log of wage ( = public; private), and
, is the estimate of unconditional quantile regression at the th quantile for sector type (

17
= public; private). The first term ( , ) represents the endowment effect,
that is, the sector wage gap at the th quantile due to endowment differentials. The second
term , , measures the public-private wage gap at the in the th quantile
due to the different returns (also known as discrimination effect). The estimation of equation
(3) comprises two steps. The first step of decomposition requires estimation of the RIF
regressions to generate unconditional quantile regression estimates for each sector. The RIF of
the dependent variable for each sector can be estimated according to following equation
(when the unconditional quantile regression is linear (Firpo et al. 2009)):
RIF ln ; , , and (eq. 4)
RIF ln ; , (eq. 5)
The second step decomposes the sector wage gap into explained and unexplained components
across quantiles in a similar spirit as the Oaxaca-Blinder decomposition under the linearity
assumption between the RIF and explanatory variables. More specifically, for any
unconditional quantile, the equivalent Oaxaca-Blinder decomposition can be written as:
∆ , , , (eq. 6)
Where ∆ is the estimated wage differential between public and private sectors at the th
quantile and , ; , are the estimated coefficients obtained by computing the RIF over
the set of variables of public and private sectors at the th quantile, respectively.
5. Empirical results
Table 4 provides the results of Oaxaca-Blinder decomposition at the mean of log-average
monthly wage gap between public and private sectors for both urban and rural areas. For each
area, the Table shows two findings: the magnitude of the total public-private wage gap, and
the decompositions of this gap into the portions due to explained attributes and returns to
observable attributes. The vector of regressors includes, age, age square/100, gender,
education level, region and marital status. The reference for region variable is greater Tunis,
the reference for educational category is ‘no education level’ and the reference for marital
status is ‘not married’.

18
The size of the total average log-wage gap between public and private sectors ranges from
0.448 in rural area to 0.502 in urban area when the wage equations are estimated with OLS.
The positive earning differential between the public and private sectors indicates that higher
wages are paid to public workers whatever the area. This first result is in line with most
previous studies on public-private wage gap showing that public sector worker earns more
than his/her private counterpart. For example, Mizala et al (2011) by using matching methods
confirmed this hypothesis for urban workers in eleven Latin American countries, for the
1992-2007 period. They added that the raw public-private gap increased in all the countries
except Coasta Rica and Paraguay. Melly (2005) argued that only public woman worker earns
more than her private counterpart, while men are paid more in private sector.
Table 4 suggests that a substantial part of the conditional gap in urban area is actually
explained (the explained part reaches 65% of the total gap), while for the rural area the
explained component is lower than the unexplained components (44% vs 56%). The
explained part of the decompositions can be broken down into the contribution of each
regressor. In light to the large number of regressors and in order to better interpret the
decomposition results, we divide the regressors into four sub-groups: demographic (including
age, age squared/100, and gender); education (basic education, secondary education,
vocational training, and higher education); marital status (single, married, widowed and
divorced) and region (Greater Tunis, Northeast, Northwest, central East, Central West,
Southeast and Southwest). As indicated in Table 4, public sector workers in urban area have,
on average, more education and this factor explains 0.56 of the 0.502 gap. The education
factor explains by it self 0.7 (70 percent) of the total explained attributes for urban workers.
The effect of education as a source of wage is much more important for rural workers. It
explains 1.25 of the total explained attributes and 0.58 of the total gap.
Table 4: Decomposition in mean of the monthly earnings between public and private sectors Urban
Area Rural Area
Coefficients Std.Err Coefficients Std.Err
Overall
Public sector 6.348*** (0.018) 6.023*** (0.062)
Private sector 5.846*** (0.016) 5.576*** (0.018)
Total wage gap 0.502*** (0.024) 0.448*** (0.064)
Explained attributes 0.327*** (0.025) 0.197** (0.079)
Unexplained 0.175*** (0.028) 0.251*** (0.084)
Explained attributes
Demog 0.106*** (0.019) -0.038 (0.038)

19
Education 0.226*** (0.017) 0.247*** (0.065)
Statut 0.026** (0.011) 0.001 (0.015)
Region -0.031*** (0.007) -0.014 (0.023)
Unexplained
Demog 0.366 (0.310) 0.595 (0.653)
Education 0.057*** (0.022) 0.012 (0.043)
Statut 0.031 (0.036) 0.015 (0.050)
Region 0.012 (0.025) 0.241 (0.176)
Constante -0.290 (0.306) -0.611 (0.690)
# Observations 2702 1186
Public 1192 89
Private 1510 1097
Note: Demographic: age, age-square/100, gender (male as reference modality); Education: basic education, secondary education, vocational training, university (basic education as reference modality); Marital Status: single, married, widowed, divorced (single as reference modality); Region: Northeast, Northwest, Central East, Central West, Southeast, Southwest (Greater Tunis as reference modality).
In addition to Oaxaca-Blinder decomposition of the average natural logarithms of monthly
wage gap between public and private sectors for both rural and urban areas, we decompose
differences in the distribution of the public and private sectors based on Recentered Influence
Function (RIF) regressions proposed by Firpo et al (2009). We provide decompositions only
for three quantiles: the 25th, the 50th (median) and the 75th. Table 5 and Figure 4 summarize
the results of unconditional quantile decomposition. Figure 4 shows that the public/private
wage gap becomes negative at the top of the distribution (from the p80) if we only consider
the fixed salary (without variable income such as commission, bonus as well as all other pay
supplements). This result seems logical, since many pay supplements represent an important
part of public’s earnings than private’s sector in Tunisia, which explains the low exit rate and
low mobility of workers from public to private sector. The results in Table 5 show the
existence of significant differences across the wage distribution, with the part explained by
observed characteristics greater at the bottom of the distribution (51% in p25) and lower and
non-significant at the top of the distribution (2% in p75). In the case of rural area, we also find
that the part explained by observed characteristics is greater at the bottom of the distribution
(135% in p25), although it tends to decrease along the wage distribution (70% in p75). In
summary, we find that the whole wage gap in favour of public workers is explained by
differences in characteristics for rural workers (even if the share of observed characteristics
has decreased for 135% to 70% among the wage distribution, it remains always significant
and greater than the part explained by unobserved attributes). However, for urban workers the

20
part of wage gap explained by observed characteristics has decreased rapidly from 51% to 2%
and becomes insignificant (the size of discrimination effect is larger at higher deciles).
Table 5: Quantile decomposition of monthly earnings between public and private sectors
Urban Area Rural Area
25th 50th 75th 25th 50th 75th
Overall
Public 5.616*** (0.048)
5.988*** (0.050)
6.205*** (0.051)
4.557*** (0.253)
5.095*** (0.254)
5.257*** (0.261)
Private 5.281*** (0.035)
5.540*** (0.037)
5.799*** (0.040)
3.994*** (0.062)
4.219*** (0.066)
4.407*** (0.0703
Total wage gap 0.335*** (0.060)
0.447*** (0.062)
0.406*** (0.065)
0.562** (0.261)
0.876*** (0.262)
0.849*** (0.270)
Explained attributes 0.172*** (0.067)
0.140** (0.069)
0.009 (0.071)
0.758** (0.345)
0.629* (0.345)
0.593* (0.354)
Unexplained 0.162* (0.089)
0.308*** (0.092)
0.396*** (0.095)
-0.196 (0.422)
0.247 (0.420)
0.257 (0.431)
% of explained part 51.34 31.32 2.22 134.88 71.80 69.85
Explained attributes
Demog 0.038 (0.059)
-0.004 (0.061)
-0.046 (0.062)
-0.042 (0.158)
0.076 (0.159)
0.059 (0.166)
Education 0.113*** (0.039)
0.102** (0.041)
0.016 (0.041)
0.722** (0.318)
0.445 (0.312)
0.4249 (0.320)
Statut 0.022 (0.037)
0.030 (0.038)
0.024 (0.039)
0.020 (0.046)
0.031 (0.051)
0.029 (0.051)
Region -0.001 (0.022)
0.012 (0.022)
0.016 (0.023)
0.057 (0.079)
0.077 (0.086)
0.080 (0.087)
Unexplained
demog 0.652 (0.978)
0.090 (1.014)
-0.493 (1.048)
-1.424 (3.429)
-1.261 (3.413)
-2.100 (3.503)
education 0.074 (0.069)
-0.0467 (0.072)
-0.250*** (0.075)
0.317 (0.208)
0.196 (0.207)
0.132 (0.213)
statut -0.018 (0.111)
-0.015 (0.115)
-0.066 (0.120)
0.014 (0.244)
0.066 (0.244)
0.050 (0.250)
region 0.013 (0.076)
0.083 (0.079)
0.093 (0.082)
0.373 (0.919)
0.058 (0.916)
0.058 (0.942)
cons -0.558 (0.972)
0.196 (1.001)
1.113 (1.040)
0.523 (3.634)
1.189 (3.618)
2.115 (3.714)
# observations 2889 2889 2889 1570 1570 1570
Public # observations 1287 1287 1287 108 108 108
Private # observations 1602 1602 1602 1462 1462 1462
21
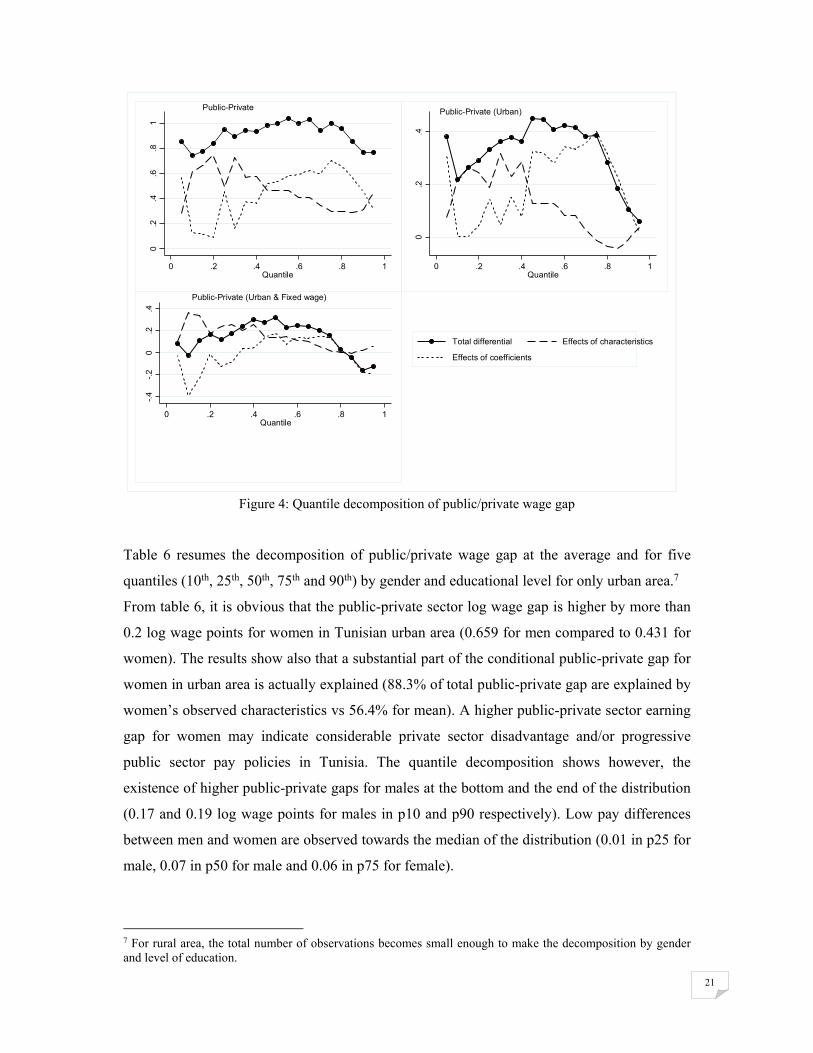
Figure 4: Quantile decomposition of public/private wage gap
Table 6 resumes the decomposition of public/private wage gap at the average and for five
quantiles (10th, 25th, 50th, 75th and 90th) by gender and educational level for only urban area.7
From table 6, it is obvious that the public-private sector log wage gap is higher by more than
0.2 log wage points for women in Tunisian urban area (0.659 for men compared to 0.431 for
women). The results show also that a substantial part of the conditional public-private gap for
women in urban area is actually explained (88.3% of total public-private gap are explained by
women’s observed characteristics vs 56.4% for mean). A higher public-private sector earning
gap for women may indicate considerable private sector disadvantage and/or progressive
public sector pay policies in Tunisia. The quantile decomposition shows however, the
existence of higher public-private gaps for males at the bottom and the end of the distribution
(0.17 and 0.19 log wage points for males in p10 and p90 respectively). Low pay differences
between men and women are observed towards the median of the distribution (0.01 in p25 for
male, 0.07 in p50 for male and 0.06 in p75 for female).
7 For rural area, the total number of observations becomes small enough to make the decomposition by gender and level of education.
0.2
.4.6
.81
0 .2 .4 .6 .8 1Quantile
Public-Private Public-Private (Urban)
0.2
.4
0 .2 .4 .6 .8 1Quantile
-.4
-.2
0.2
.4
0 .2 .4 .6 .8 1Quantile
Total differential Effects of characteristics
Effects of coefficients
Public-Private (Urban & Fixed wage)

22
For education, we divide our urban sample into primary, secondary and university educated
individuals. The Oaxaca-Blinder decomposition results (the last column in Table 6) show the
existence of significant wage differential whatever the level of education, and that public
workers are always paid more than private ones. The quantile decomposition shows however
that less educated workers are compensated much more in the public sector than in the private
sector. Among the five quantile of the distribution, the differential is significant for basic
education, while it is not significant for the secondary educated employees (except at the top
of the distribution, where the differential becomes significantly negative). It is also interesting
to note that the wage differential for university educated workers decreases rapidly through
the distribution and becomes negative but not significant at the p90. This result is of critical
importance, showing that Tunisia has an insignificant wage differential for university
educated employees at the high end of the wage distribution. Hence, the choice of the sector
has no significant effect on the wage differential for educated people.
Table 6: Quantile decomposition of monthly earnings between public and private sectors by gender and education
Urban Area
10th 25th 50th 75th 90th Average
By gender
Only Men (# observations = 1892)
Total wage gap 0.221*** (0.080)
0.290*** (0.071)
0.487*** (0.075)
0.392*** (0.078)
0.274*** (0.090)
0.431*** (0.029)
Explained attributes 0.167** (0.076)
0.097 (0.064)
0.067 (0.067)
-0.018 (0.068)
0.041 (0.077)
0.243*** (0.026)
Unexplained 0.054 (0.108)
0.193** (0.095)
0.421*** (0.099)
0.410*** (0.103)
0.232** (0.116)
0.189*** (0.032)
% of explained part 75.6 33.4 13.8 -4.6 15.0 56.4
% of unexplained part 24.4 66.6 86.2 104.6 85 43.6
Only Women (# observations = 810)
Total wage gap 0.105 (0.153)
0.310*** (0.114)
0.422*** (0.111)
0.450*** (0.115)
0.085 (0.140)
0.659*** (0.041)
Explained attributes 1.494*** (0.311)
0.904*** (0.223)
0.313 (0.217)
0.020 (0.221)
0.150 (0.233)
0.582*** (0.061)
Unexplained -1.390*** (0.339)
-0.593** (0.246)
0.109 (.241)
0.431 (0.247)
-0.065 (0.268)
0.077 (0.063)
% of explained part 1423.0 291.6 74.2 4.4 176.5 88.3
% of unexplained part -1323 -191.6 25.8 95.6 -76.5 11.7
By level of education
Basic Education (# observations = 259)
Total wage gap 0.355*** (0.109)
0.229** (0.098)
0.323*** (0.086)
0.355*** (0.095)
0.438*** (0.109)
0.260*** (0.037)
Explained attributes 0.013 (0.114)
0.065 (0.106)
0.007 (0.09)
-0.010 (0.100)
0.022 (0.114)
0.152*** (0.041)
Unexplained 0.342** (0.153)
0.164 (0.140)
0.316*** (0.122)
0.3648*** (0.137)
0.417*** (0.155)
0.108** (0.050)
% of explained part 3.7 28.4 2.2 -2.8 5.02 58.5

23
% of unexplained part 96.3 71.6 97.8 102.8 94.98 41.5
Secondary education (# observations = 777)
Total wage gap 0.010 (0.127)
0.087 (0.112)
0.051 (0.115)
0.040 (0.120)
-0.312** (0.160)
0.369*** (0.038)
Explained attributes 0.284** (0.142)
0.095 (0.122)
0.104 (0.126)
0.071 (0.129)
0.023 (0.134)
0.165*** (0.036)
Unexplained -0.274 (0.184)
-0.008 (0.163)
-0.054 (0.168)
-0.031 (0.173)
-0.335 (0.205)
0.205*** (0.048)
% of explained part 2840 109 204 178 -7.4 44.7
% of unexplained part -2740 -9 -104 -78 107.4 55.3
University education (# observations = 727)
Total wage gap 0.558*** (0.147)
0.398*** (0.146)
0.247* (0.150)
0.077 (0.158)
-0.041 (0.188)
0.225*** (0.048)
Explained attributes 0.131 (0.122)
0.041 (0.110)
-0.036 (0.111)
0.007 (0.115)
-0.058 (0.135)
0.079** (0.036)
Unexplained 0.427** (0.187)
0.357*** (0.180)
0.283 (0.184)
0.070 (0.192)
0.016 (0.230)
0.146*** (0.053)
% of explained part 23.5 10.3 14.6 9.1 141 35.11
% of unexplained part 76.5 89.7 85.4 90.9 -41 64.9
6. Conclusion and Policy implications
Using the 2012 Tunisia Household survey on youth in urban and rural areas, we find that
public employees tend to receive higher wages than those working in the private sector, with
this wage gap is greatly explained by the observed characteristics. Looking at the wage
differential by gender and by educational levels, our findings reveal that public/private gap is
more important for women than for men and that less educated employees are compensated
much more in the public sector.
The empirical results found in this study will help us to explore the determinants of wage gap
between public and private sectors as well as between men and women. The sign of overall
wage inequality, its decomposition into endowment and returns effects and their ranking at
various population quantiles can help policy makers develop targeted policies related to
employment, unemployment and wages policy that bring together all the actors including the
labour organisations and training (UGTT, UTICA, universities, research institutions, etc).
This would require a concerted and sustained effort of the government for both public and
private sectors in order to absorb the country’s growing workforce and maintain socio-
political stability for years to come.
Governing the relationship between public and private sectors is a priority for the government
to ensure the labour market stability. Recently, the Assembly of the Representatives of the
People adopted law on public private partnership (PPP) that aims to mobilize funds for the

24
implementation of major projects (covering the design, construction, financing and ongoing
operation and maintenance of infrastructure assets). This PPP law can play an important role
for inclusive and sustainable growth in the country, if it will be well-operationalized.

25
References
Achy, L. (2011). Tunisia's Economic Challenges. Washington, DC: Carnegie Endowment for
International Peace.
Ahmed, S., & McGillivray, M. (2015). Human capital, discrimination, and the gender wage
gap in Bangladesh. World Development, 67, 506-524.
Bellante, D., & Long, J. (1981). The political economy of the rent-seeking society: The case
of public employees and their unions. Journal of Labor Research, 2(1), 1-14.
Brockmeyer, A., Khatrouch, M., & Raballand, G. (2015). Public sector size and performance
management: a case-study of post-revolution Tunisia. World Bank Policy Research
Working Paper, (7159).
Cai, L., & Liu, A. Y. (2011). Public–private sector wage gap in Australia: variation along the
distribution. British Journal of Industrial Relations, 49(2), 362-390.
Depalo, D., Giordano, R., & Papapetrou, E. (2015). Public–private wage differentials in euro-
area countries: evidence from quantile decomposition analysis. Empirical
Economics, 49(3), 985-1015.
Dustmann, C., & Soest, A. (1997). Wage structures in the private and public sectors in West
Germany. Fiscal Studies, 18(3), 225-247.
Firpo, S., Fortin, N. M., & Lemieux, T. (2009). Unconditional quantile
regressions. Econometrica, 77(3), 953-973.
Glinskaya, E., & Lokshin, M. (2007). Wage differentials between the public and private
sectors in India. Journal of International Development, 19(3), 333-355.
Kippra (2013). A Comparative Study on Public-Private Sector Wage Differentials in Kenya.
Lassibille, G. (1998). Wage gaps between the public and private sectors in Spain. Economics
of Education Review, 17(1), 83-92.
Lucifora, C., & Meurs, D. (2006). The public sector pay gap in France, Great Britain and
Italy. Review of Income and wealth, 52(1), 43-59.
Melly, B. (2005). Public-private sector wage differentials in Germany: Evidence from
quantile regression. Empirical Economics, 30(2), 505-520.
Mizala, A., Romaguera, P., & Gallegos, S. (2011). Public-private wage gap in Latin America
(1992–2007): A matching approach. Labour Economics, 18, S115-S131.
Morikawa, M. (2016). A comparison of the wage structure between the public and private
sectors in Japan. Journal of the Japanese and International Economies, 39, 73-90.

26
Mueller, R. E. (2000). Public‐and Private‐Sector Wage Differentials in Canada
Revisited. Industrial Relations: A Journal of Economy and Society, 39(3), 375-400.
Nielsen, H. S., & Rosholm, M. (2002). The public-private sector wage gap in Zambia in the
1990s: A quantile regression approach. In Economic applications of quantile
regression (pp. 169-182). Physica-Verlag HD.
Panizza, U., & Qiang, C. Z. W. (2005). Public–private wage differential and gender gap in
Latin America: Spoiled bureaucrats and exploited women?. The Journal of Socio-
Economics, 34(6), 810-833.
Quinn, J. F. (1979). Wage differentials among older workers in the public and private
sectors. Journal of Human Resources, 41-62.
Reder, M. (1975) The theory of employment and wages in the public sector, in D. Hamermesh
(ed.) Labour in the Public and Nonprofit Sectors, Princeton University Press, Princeton,
p.1-48.
San, S., & Polat, Ö. (2012). Estimation of Public–Private Wage Differentials in Turkey with
Sample Correction. The Developing Economies, 50(3), 285-298.
Smith, R. S. (1981). Compensating differentials for pensions and underfunding in the public
sector. The Review of Economics and Statistics, 463-468.
Smith, S. P. (1976). Pay differentials between federal government and private sector
workers. Industrial and Labor Relations Review, 179-197.
World Bank. (2014) Tunisia-Breaking the barriers to youth inclusion. Washington, DC:
World Bank Group.

27
Appendix
Figure A1: Kernel density estimates of monthly net log-earnings (urban area)
Figure A2: Kernel density estimates of monthly net log-earnings (rural area)
0.2
.4.6
.81
De
nsity
4 5 6 7 8log (wage)
Public
Private
Public versus Private
0.2
.4.6
.8D
ens
ity
2 4 6 8 10log (wage)
Male
Female
Male versus female
0.2
.4.6
.81
De
nsity
4 5 6 7 8log (wage)
Public
Private
Public versus private
0.2
.4.6
.81
De
nsity
2 4 6 8log (wage)
Male
Female
Male versus female