Public-Private Partnerships in Financing and Providing ...
23
European Investment Bank Public-Private Partnerships in Financing and Providing Infrastructure Philippe Maystadt President, European Investment Bank Presentation at the Bridge Forum Dialogue Luxembourg, 20 January 2005
-
Upload
samanthafox -
Category
Documents
-
view
1.130 -
download
2
Transcript of Public-Private Partnerships in Financing and Providing ...

EuropeanInvestmentBank
Public-Private Partnerships in Financing and Providing Infrastructure
Philippe MaystadtPresident, European Investment Bank
Presentation at the Bridge Forum DialogueLuxembourg, 20 January 2005

2
Contents
How much has public investment declined?
Have public capital stocks been eroded?
Has lower public investment been offset by PPPs?
Economic pros and cons of PPPs

3
Public Investment in EU and US
2
3
4
5
1971 1981 1991 2001
% of GDP
Source: OECD
EU
US

4
Public Investment in Large EU Countries
1
2
3
4
5
6
1970 1980 1990 2000
France Germany Italy UK
% of GDP
Source: OECD
5
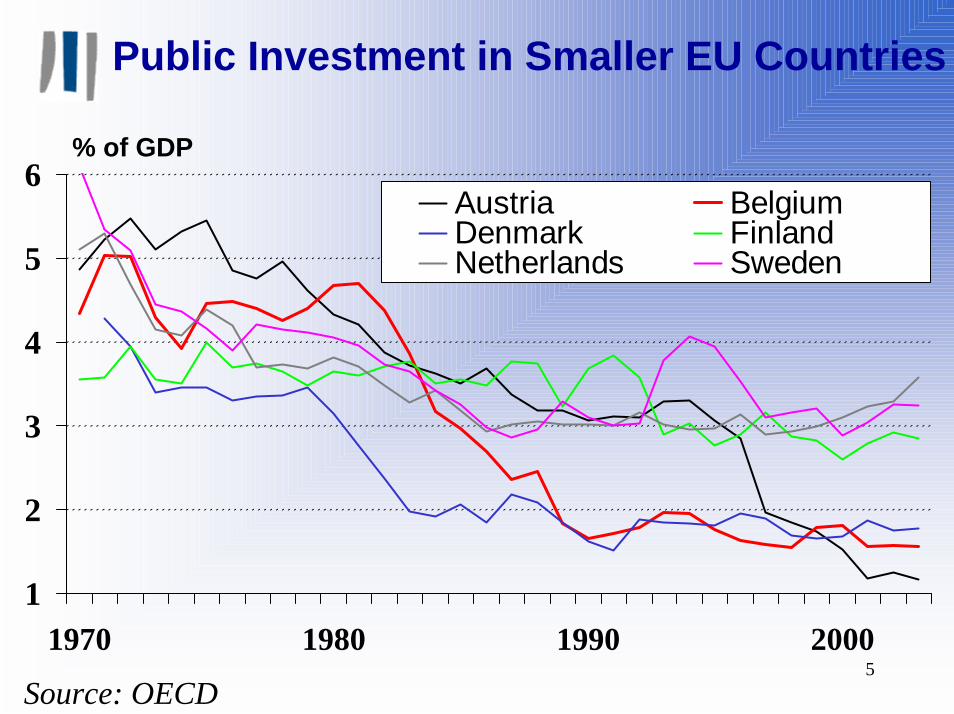
Public Investment in Smaller EU Countries
1
2
3
4
5
6
1970 1980 1990 2000
Austria BelgiumDenmark FinlandNetherlands Sweden
% of GDP
Source: OECD
6
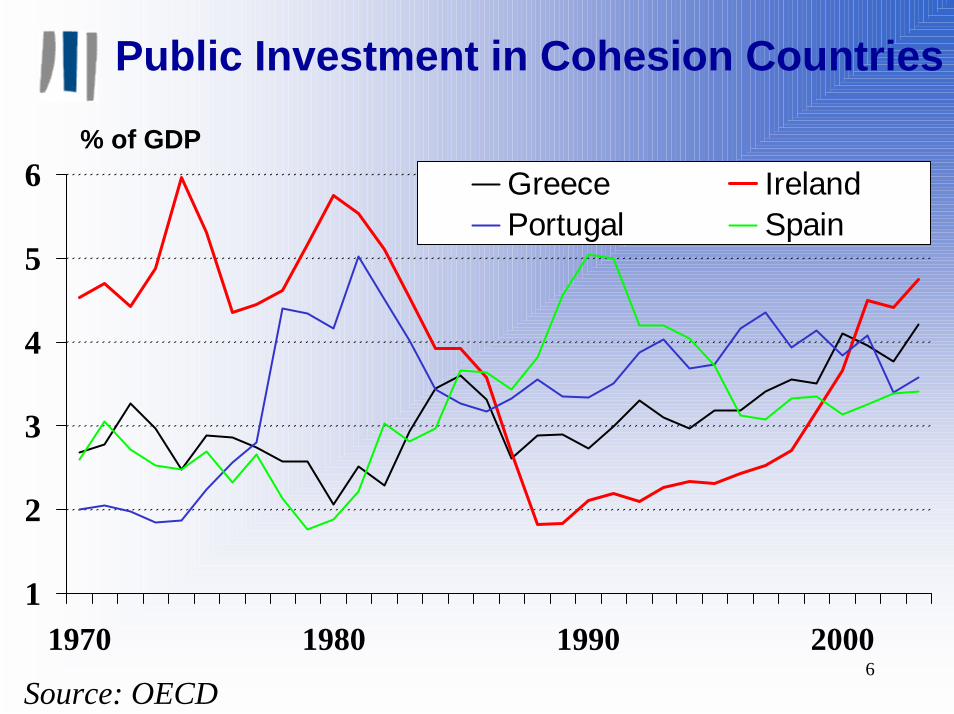
Public Investment in Cohesion Countries
1
2
3
4
5
6
1970 1980 1990 2000
Greece IrelandPortugal Spain
% of GDP
Source: OECD

7
Public Capital Stock in Large EU Countries
100
120
140
160
180
200
220
240
1970 1980 1990 2000
France Germany Italy UK
1970 = 100
Source: Kamps (2004)
8
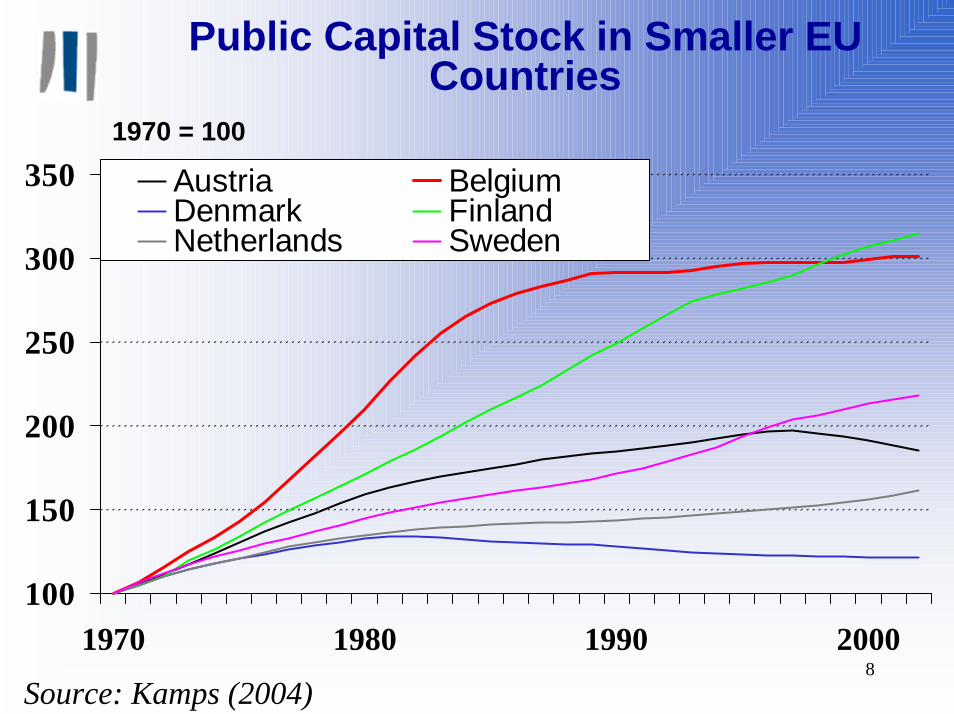
Public Capital Stock in Smaller EU Countries
100
150
200
250
300
350
1970 1980 1990 2000
Austria BelgiumDenmark FinlandNetherlands Sweden
1970 = 100
Source: Kamps (2004)
9
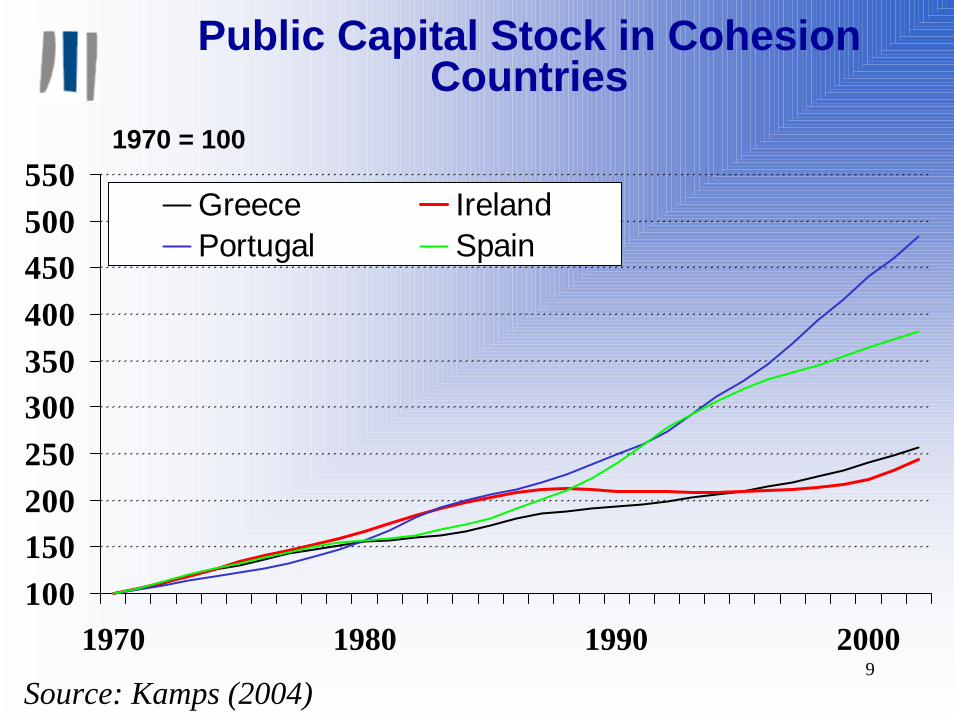
Public Capital Stock in Cohesion Countries
100150200250300350400450500550
1970 1980 1990 2000
Greece IrelandPortugal Spain
1970 = 100
Source: Kamps (2004)
10
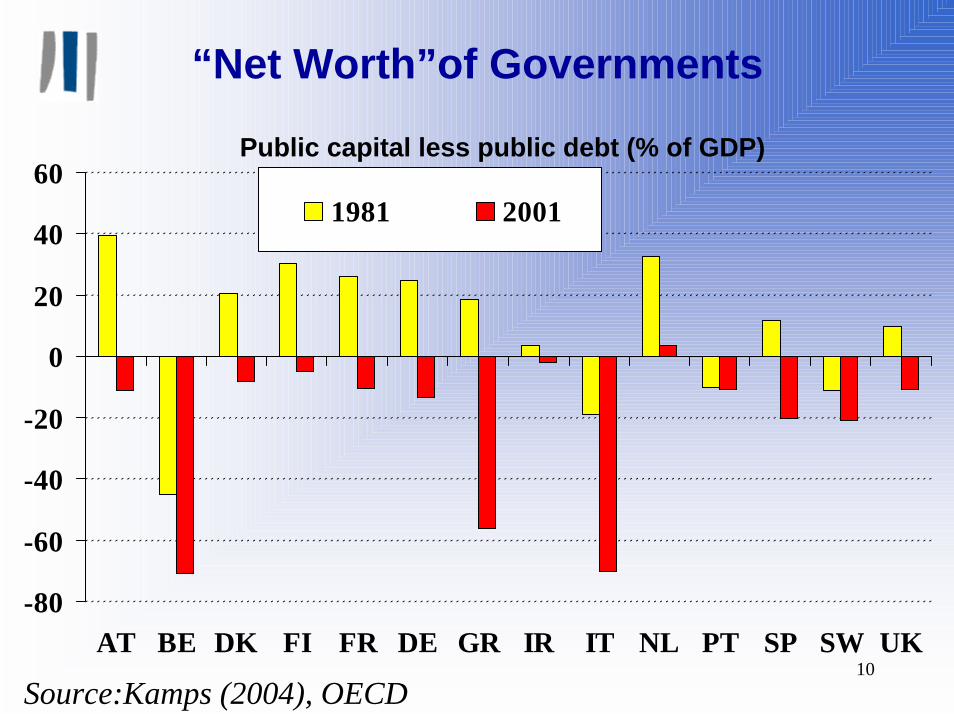
“Net Worth”of Governments
-80
-60
-40
-20
0
20
40
60
AT BE DK FI FR DE GR IR IT NL PT SP SW UK
1981 2001
Public capital less public debt (% of GDP)
Source:Kamps (2004), OECD

11
Characteristics of PPPs
Serves a public policy objective
Long-term arrangement
Private finance and ownership of asset
Risk and rewards shared

12
PPPs in Relation to Public Investment
0
5
10
15
20
25
30
35
LA GR IR IT NL PT SP UK
Signed value of PPP contracts (stock) to public investment (flow), average 1995-2003 (%)
Source: ProjectWare, HM Treasury, OECD
13
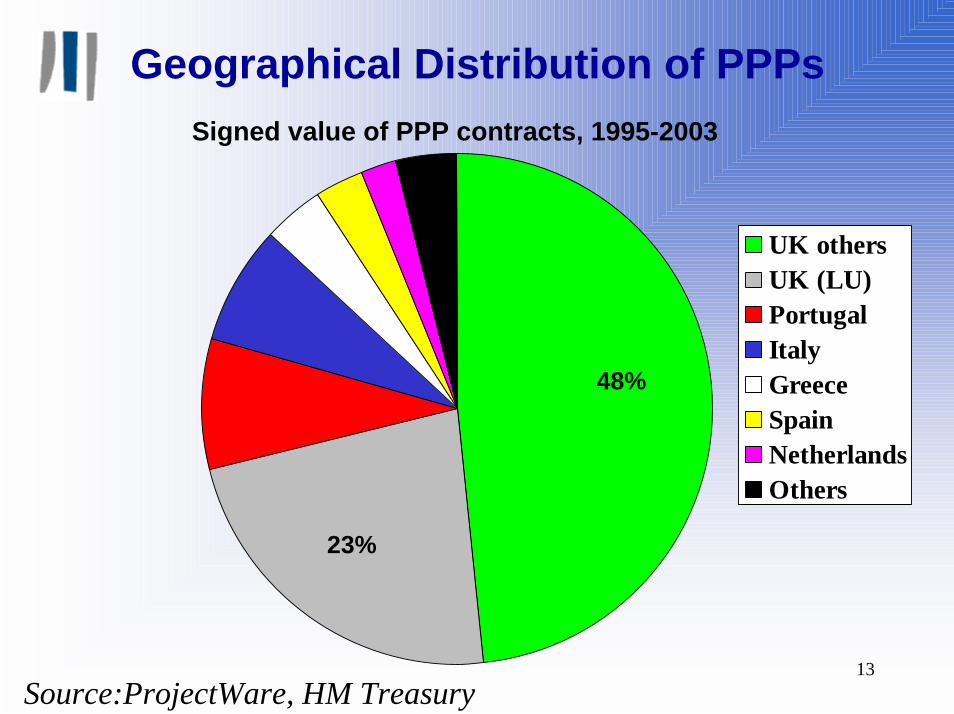
Geographical Distribution of PPPs
23%
48%
UK othersUK (LU)PortugalItalyGreeceSpainNetherlandsOthers
Signed value of PPP contracts, 1995-2003
Source:ProjectWare, HM Treasury

14
Sectoral Distribution of PPPs, Non-UK
Transport Water and SewageDefenceEducationHospitalOthers
Signed value of PPP contracts, 1995-2003
Source:ProjectWare

15
Sectoral Distribution of PPPs, UK
8%
11%
9%
7%
37%
12%
CTRLLondon Undergroundother transporthealthdefenceeducationpolice and prisonsothers
Signed value of PPP contracts, 1987-2004
Source:HM Treasury

16
Size Distribution of PPP Projects
0
20
40
60
80
100
0-75 75-150 150-750 750-1500 >1500
Non-UK UK
Number of projects by size (mill €)
Source: ProjectWare, HM Treasury
494

17
Pros: higher cost efficiency from...
Private ownership of infrastructure asset
Bundling and life-cycle planning
Sharing of risks and rewards
Economic Pros and Cons of PPPs
18
Cost savings may reduce service quality
Transaction costs
Institutional and administrative capacity requirements
Economic Pros and Cons of PPPs
Cons of PPPs:

19
Macroeconomics of PPPs
Accounting treatment
Do PPPs boost economic growth?

20
Experience with PPPs
Construction on-time and on-budget
High and underestimated bidding and negotiation costs
Key success factors:Competitiveness of bidding processAppropriateness of risk sharingPublic sector’s capacity to manage

21
EIB and PPPs
6%
7%
17%
39%
22%
RoadsTunnels, bridgesUrban trans., devel.AirportsRailwaySociasl infrastructureWaterEnergy
Source:EIB
Sectoral distribution of EIB’s PPP portfolio

22
EIB and PPPs
24%
19%
UKPortugalSpainGreeceDenmarkGermanyNetherlandsPolandSwedenIrelandAustria
Source:EIB
Geographical distribution of EIB’s PPP portfolio

EuropeanInvestmentBank
Public-Private Partnerships in Financing and Providing Infrastructure
Philippe MaystadtPresident, European Investment Bank
Presentation at the Bridge Forum DialogueLuxembourg, 20 January 2005