Public Policy Approaches to Health Inequalities Dennis Raphael, PhD School of Health Policy and...
69
Public Policy Approaches to Health Inequalities Dennis Raphael, PhD School of Health Policy and Management York University, Toronto, Canada Presentation at the Rammelkamp Center for Education and Research Symposium: Health Disparities: From Genetics to Health Policy September 27, 2006, Cleveland, Ohio
-
Upload
meagan-collins -
Category
Documents
-
view
215 -
download
0
Transcript of Public Policy Approaches to Health Inequalities Dennis Raphael, PhD School of Health Policy and...
Public Policy Approaches to Health Inequalities
Dennis Raphael, PhD
School of Health Policy and Management
York University, Toronto, Canada
Presentation at the Rammelkamp Center for Education and Research Symposium:
Health Disparities: From Genetics to Health Policy September 27, 2006, Cleveland, Ohio
Overview of Presentation• Health inequalities reflect differences in living
conditions• Living conditions are shaped by public policy decisions
concerned with the distribution of economic and social resources
• Health status – and living conditions – differ profoundly among Americans
• The USA has one of the worse population health profiles among developed nations
• The USA has one of the worse public policy profiles among developed nations
• The solution to health inequalities lies in the political sphere
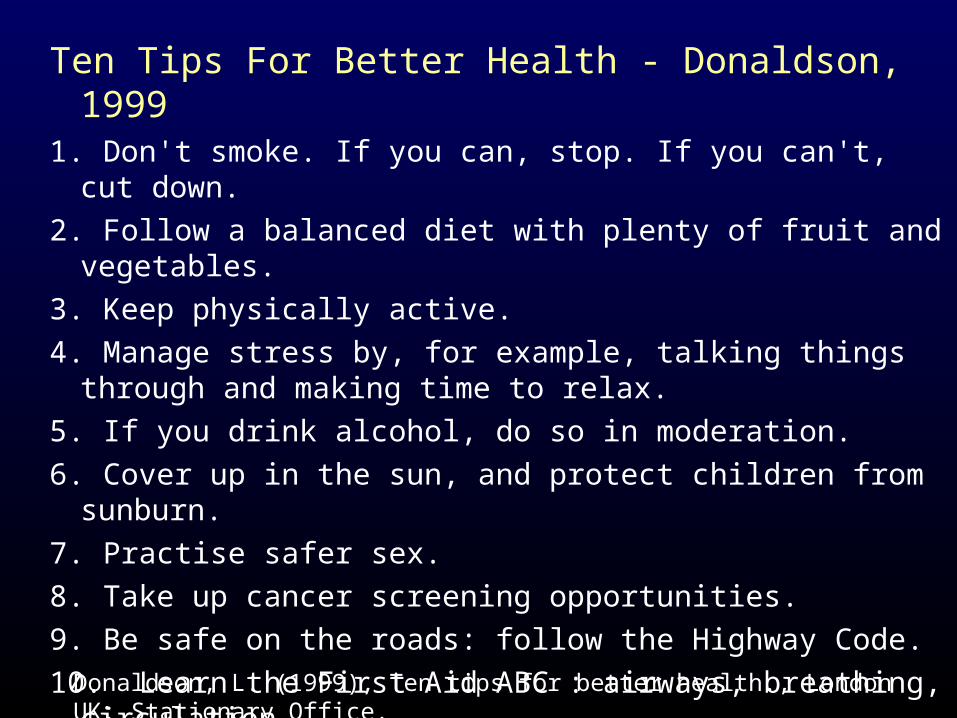
Ten Tips For Better Health - Donaldson, 1999 1. Don't smoke. If you can, stop. If you can't, cut down.
2. Follow a balanced diet with plenty of fruit and vegetables.
3. Keep physically active.
4. Manage stress by, for example, talking things through and making time to relax.
5. If you drink alcohol, do so in moderation.
6. Cover up in the sun, and protect children from sunburn.
7. Practise safer sex.
8. Take up cancer screening opportunities.
9. Be safe on the roads: follow the Highway Code.
10. Learn the First Aid ABC : airways, breathing, circulation.
Donaldson, L. (1999), Ten tips for better health., London UK: Stationary Office.
I: Health inequalities reflect differences in living
conditions
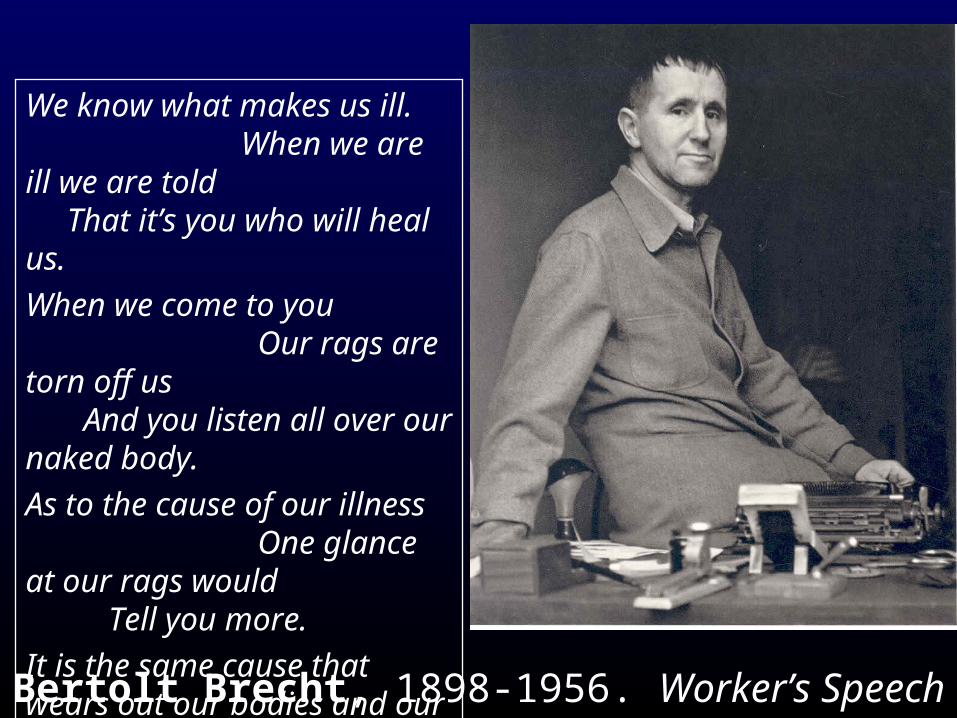
Bertolt Brecht, 1898-1956. Worker’s Speech to a Doctor
We know what makes us ill. When we are ill we are told That it’s you who will heal us.
When we come to you Our rags are torn off us And you listen all over our naked body.
As to the cause of our illness One glance at our rags would Tell you more.
It is the same cause that wears out our bodies and our clothes.
Disadvantage and Health: Academic Perspectives
It is one of the greatest of contemporary social injustices that people who live in the most disadvantaged circumstances have more illnesses, more disability and shorter lives than those who are more affluent.
-- Benzeval, Judge, & Whitehead, 1995, p.xxi, Tackling Inequalities in Health: An Agenda for Action.
0.18 0.20 0.22 0.24 Share of Income Held by Lower 50%
300
425
550
675
800R
ate
pe
r 1
00
,00
0 P
op
ula
tion
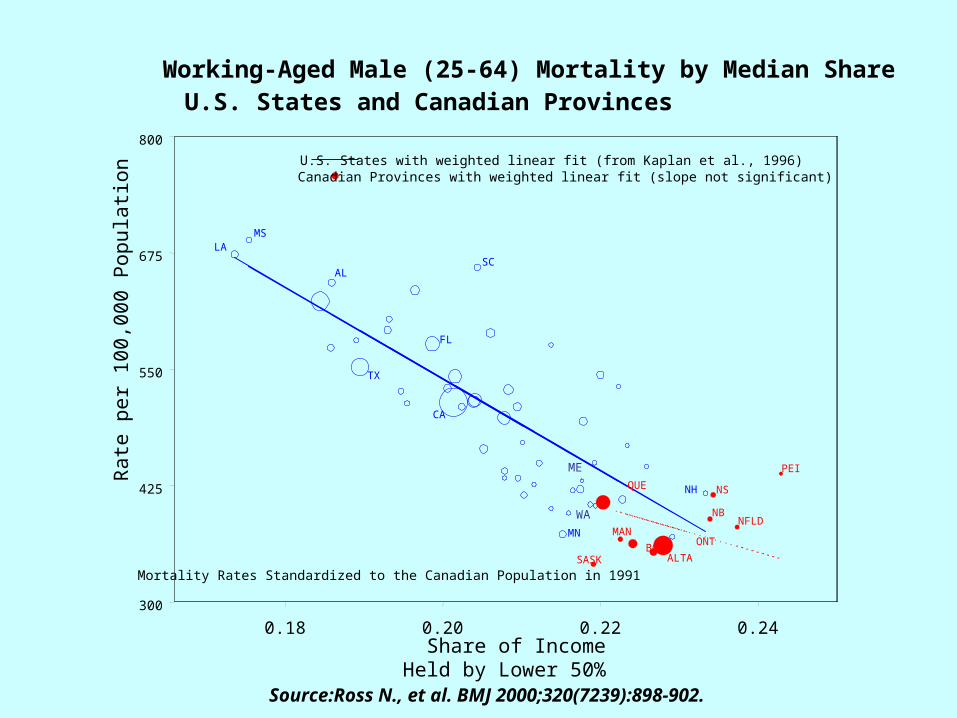
Working-Aged Male (25-64) Mortality by Median ShareU.S. States and Canadian Provinces
Mortality Rates Standardized to the Canadian Population in 1991
U.S. States with weighted linear fit (from Kaplan et al., 1996)Canadian Provinces with weighted linear fit (slope not significant)
MSLA
AL
CA
TX
FL
NH
MN
PEI
NFLDNB
SASK
ONT
ALTABC
MAN
QUE NS
SC
ME
Source:Ross N., et al. BMJ 2000;320(7239):898-902.
WA
0.15 0.19 0.23 0.27Median Share of Income
200
300
400
500
600
Rat
e pe
r 10
0,00
0 P
opul
atio
n
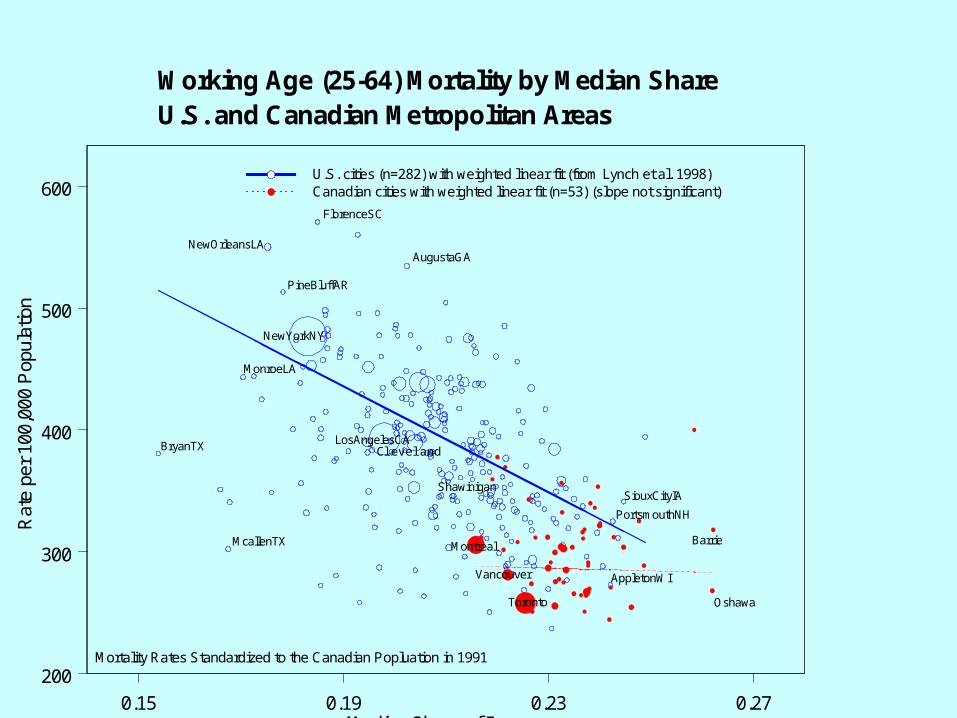
Working Age (25-64) Mortality by Median ShareU.S. and Canadian Metropolitan Areas
U.S. cities (n=282) with weighted linear fit (from Lynch et al. 1998)Canadian cities with weighted linear fit (n=53) (slope not significant)
Mortality Rates Standardized to the Canadian Popluation in 1991
FlorenceSC
JacksonvilleNC
SiouxCityIA
MonroeLA
ChicagoIL
TuscaloosaAL
Prince George
WashingtonDC
Oshawa
NewYorkNY
LosAngelesCA
NewOrleansLA
BryanTX
McallenTX
SiouxCityIA
AppletonWI
PortsmouthNH
PineBluffAR
FlorenceSC
MonroeLA
AugustaGA
Montreal
Vancouver
Toronto
Barrie
Oshawa
Shawinigan
WAWeightedCan&US June 29, 1999 12:53:18 PM
Cleveland
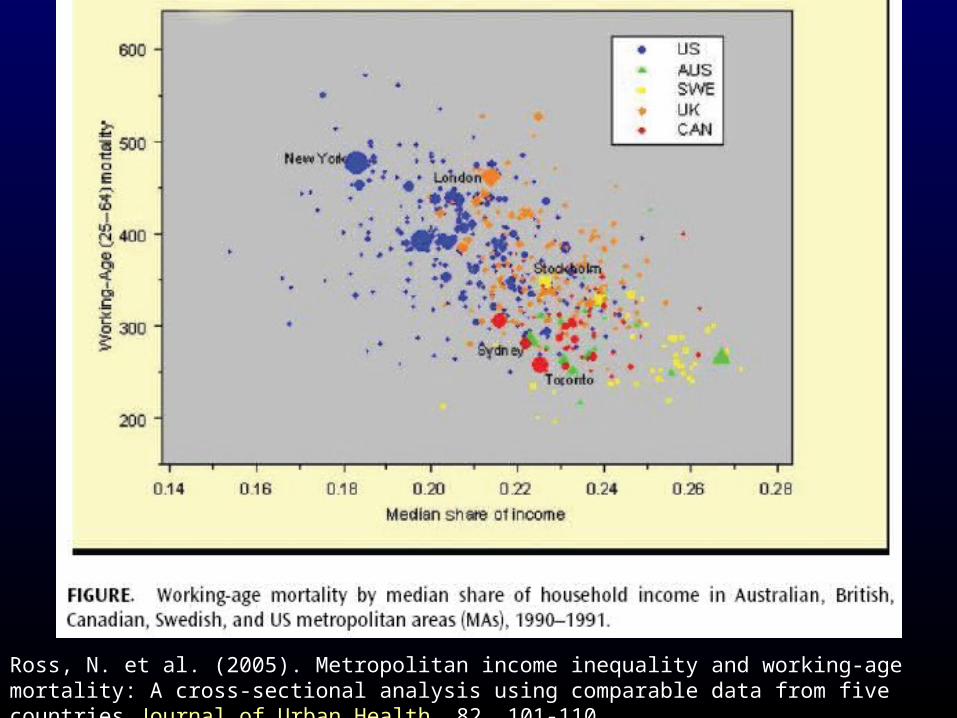
Ross, N. et al. (2005). Metropolitan income inequality and working-age mortality: A cross-sectional analysis using comparable data from five countries Journal of Urban Health, 82, 101-110.
Social determinants of health as a window into living conditions
What are SDOH?• Social determinants of health are the
economic and social conditions that influence the health of individuals, communities, and jurisdictions as a whole.
• Social determinants of health are about the quantity and quality of a variety of resources that a society makes available to its members.
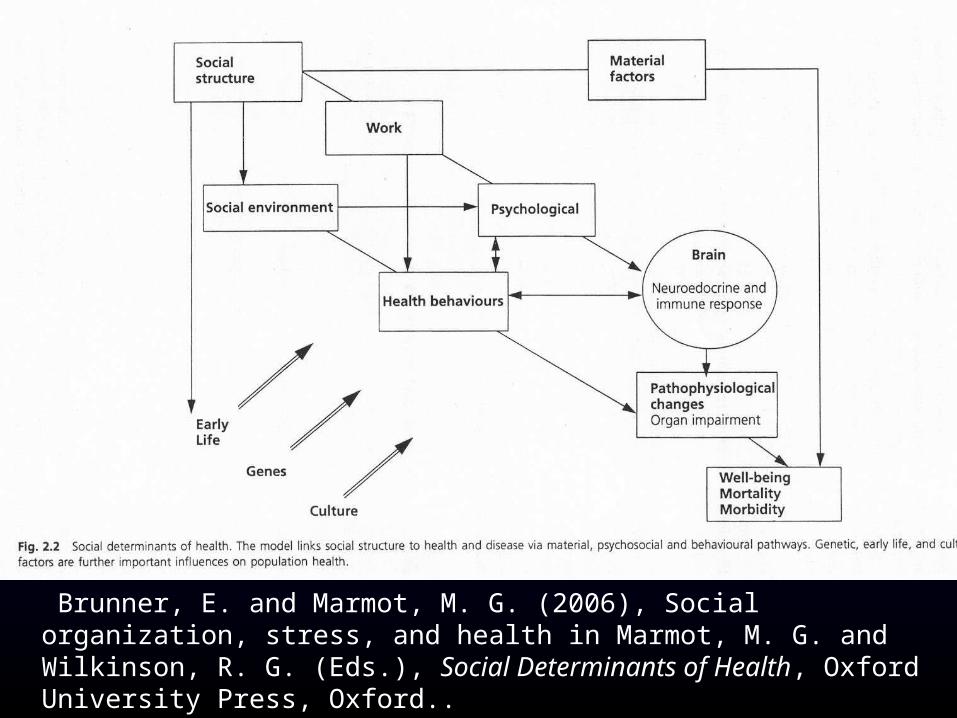
Brunner, E. and Marmot, M. G. (2006), Social organization, stress, and health in Marmot, M. G. and Wilkinson, R. G. (Eds.), Social Determinants of Health, Oxford University Press, Oxford..
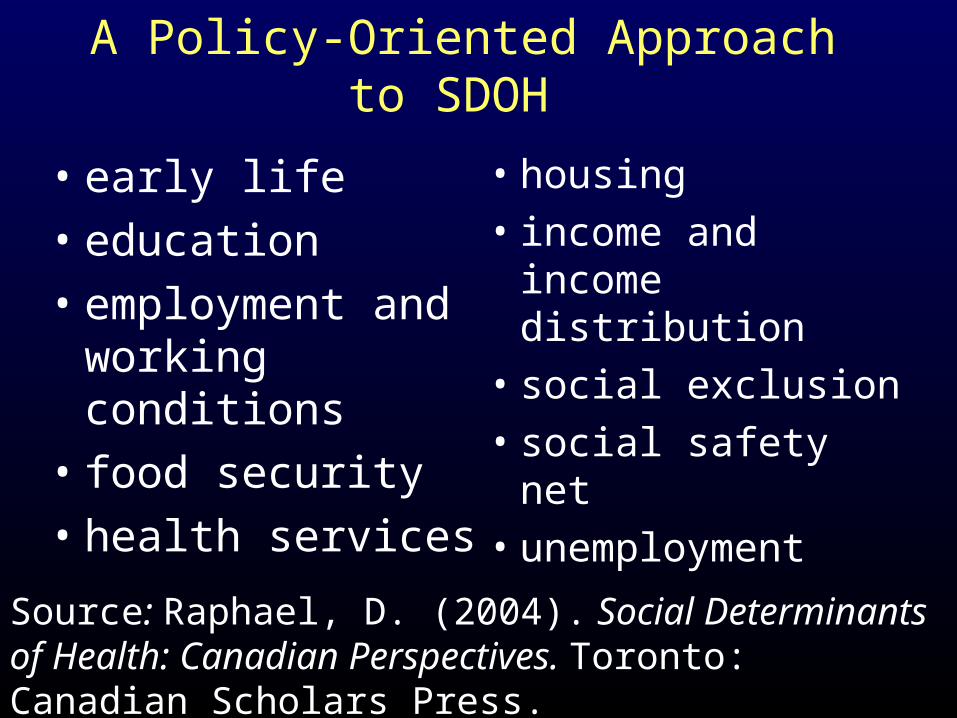
A Policy-Oriented Approach to SDOH
• early life• education• employment and
working conditions• food security• health services
• housing• income and income
distribution• social exclusion• social safety net• unemployment
Source: Raphael, D. (2004). Social Determinants of Health: Canadian Perspectives. Toronto: Canadian Scholars Press.
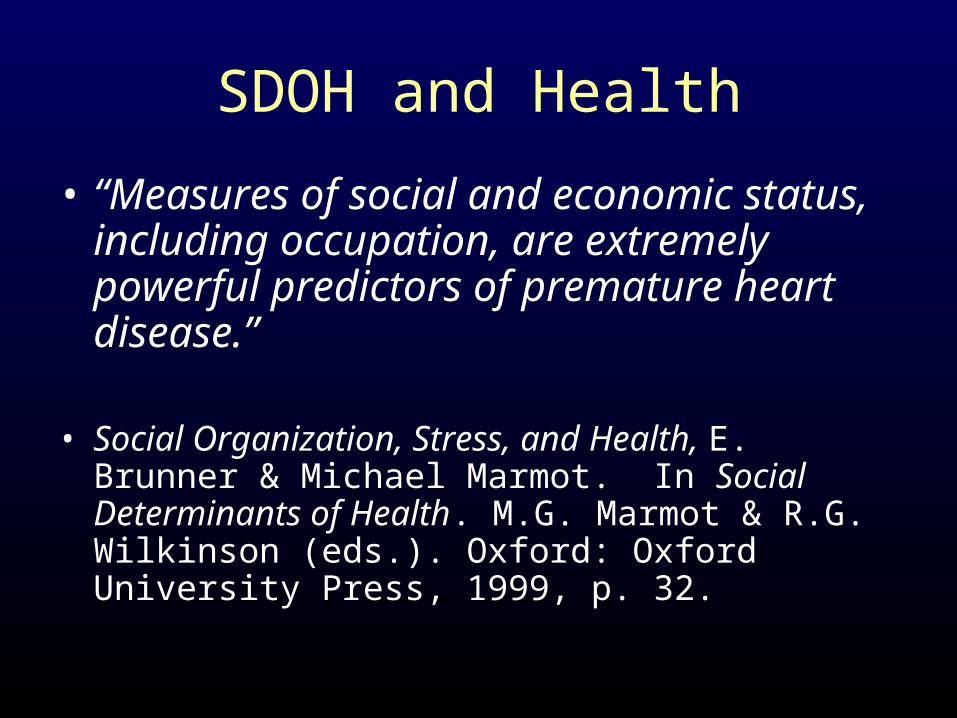
SDOH and Health
• “Measures of social and economic status, including occupation, are extremely powerful predictors of premature heart disease.”
• Social Organization, Stress, and Health, E. Brunner & Michael Marmot. In Social Determinants of Health. M.G. Marmot & R.G. Wilkinson (eds.). Oxford: Oxford University Press, 1999, p. 32.
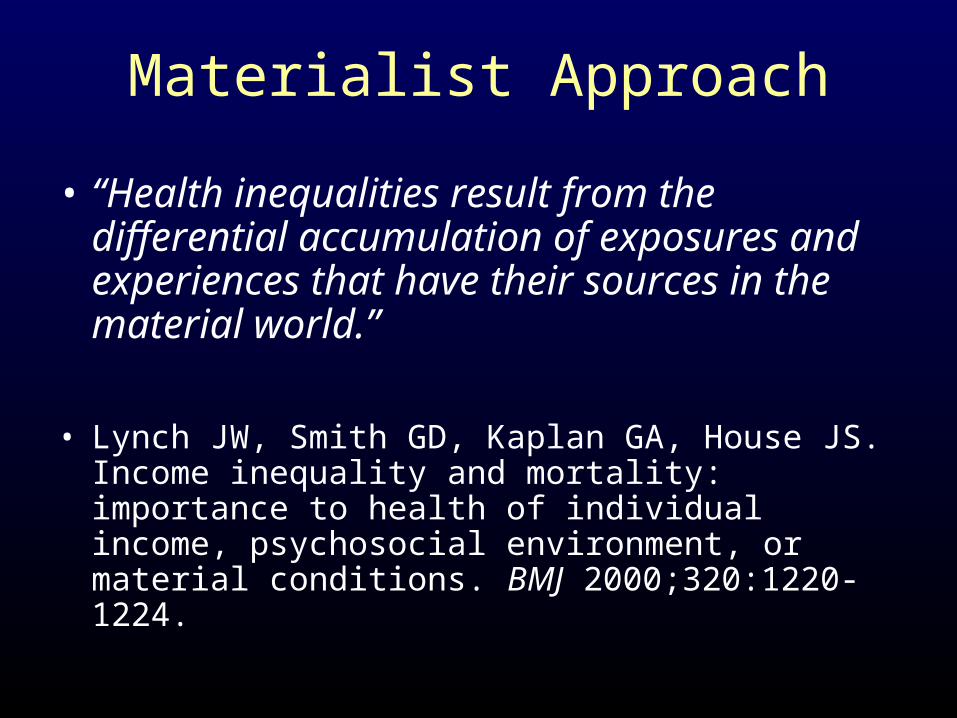
Materialist Approach
• “Health inequalities result from the differential accumulation of exposures and experiences that have their sources in the material world.”
• Lynch JW, Smith GD, Kaplan GA, House JS. Income inequality and mortality: importance to health of individual income, psychosocial environment, or material conditions. BMJ 2000;320:1220-1224.
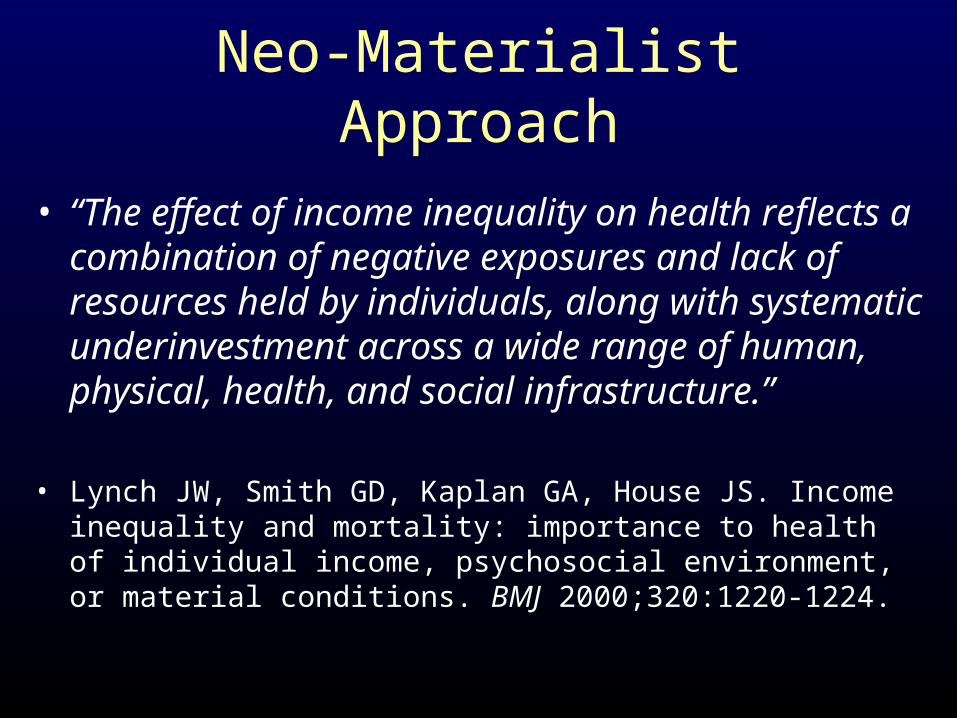
Neo-Materialist Approach
• “The effect of income inequality on health reflects a combination of negative exposures and lack of resources held by individuals, along with systematic underinvestment across a wide range of human, physical, health, and social infrastructure.”
• Lynch JW, Smith GD, Kaplan GA, House JS. Income inequality and mortality: importance to health of individual income, psychosocial environment, or material conditions. BMJ 2000;320:1220-1224.
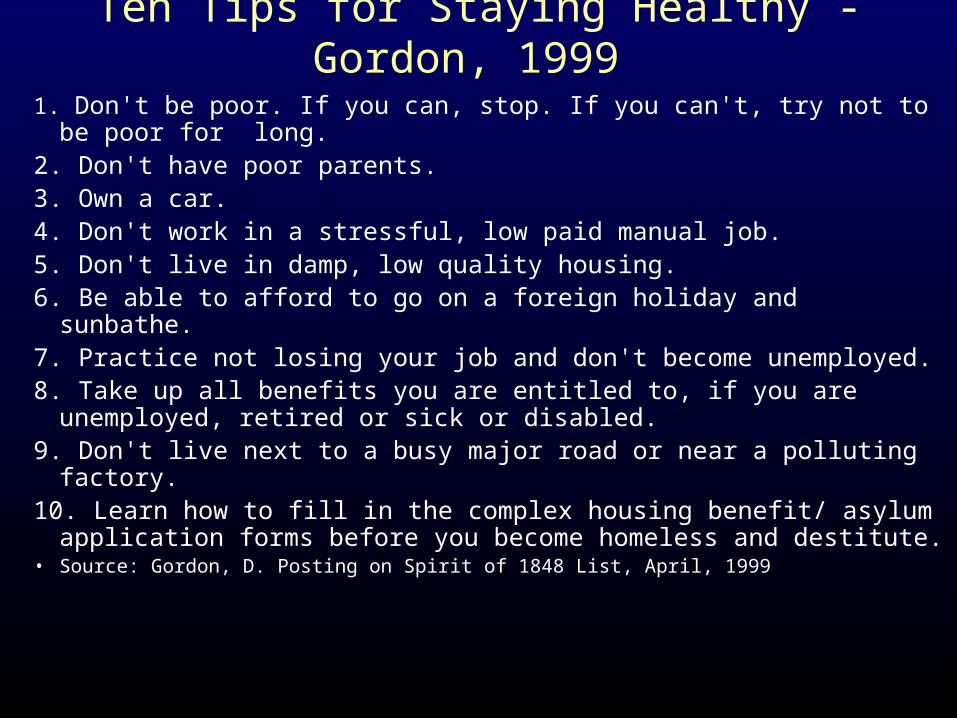
Ten Tips for Staying Healthy - Gordon, 1999
1. Don't be poor. If you can, stop. If you can't, try not to be poor for long.2. Don't have poor parents.3. Own a car.4. Don't work in a stressful, low paid manual job.5. Don't live in damp, low quality housing. 6. Be able to afford to go on a foreign holiday and sunbathe.7. Practice not losing your job and don't become unemployed.8. Take up all benefits you are entitled to, if you are unemployed, retired
or sick or disabled.9. Don't live next to a busy major road or near a polluting factory.10. Learn how to fill in the complex housing benefit/ asylum application
forms before you become homeless and destitute.• Source: Gordon, D. Posting on Spirit of 1848 List, April, 1999
II. Living Conditions are Shaped by Public Policy
Decisions
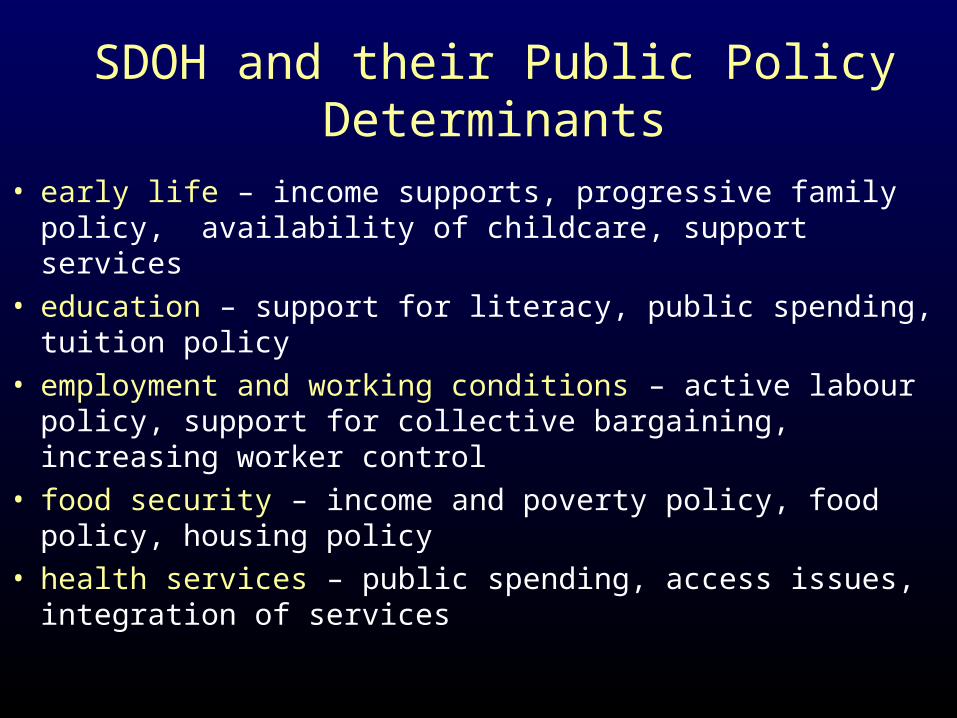
SDOH and their Public Policy Determinants
• early life – income supports, progressive family policy, availability of childcare, support services
• education – support for literacy, public spending, tuition policy
• employment and working conditions – active labour policy, support for collective bargaining, increasing worker control
• food security – income and poverty policy, food policy, housing policy
• health services – public spending, access issues, integration of services
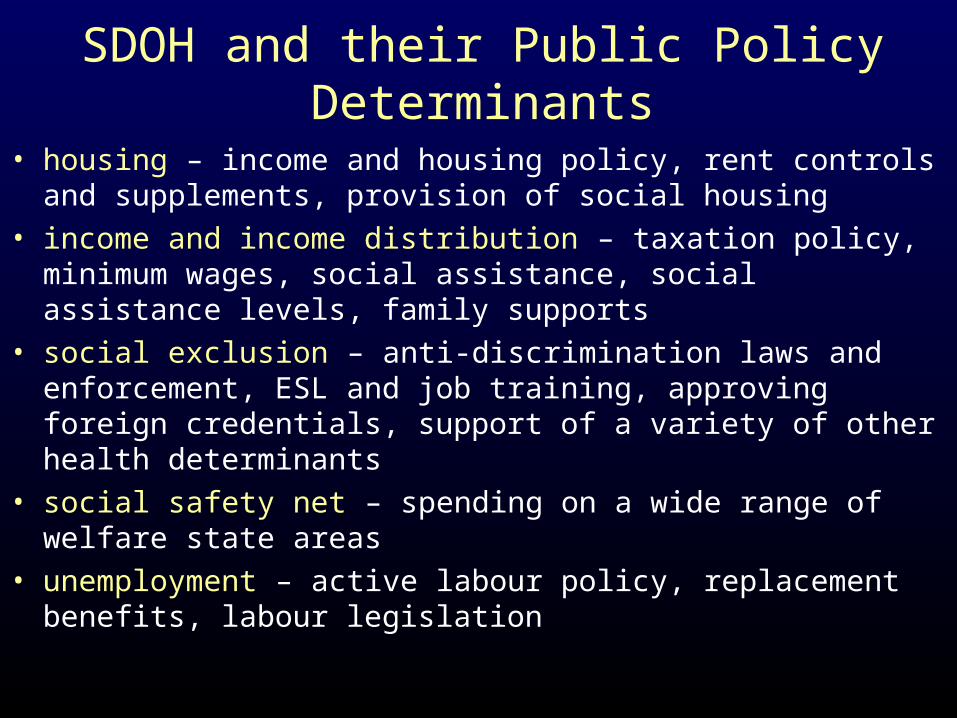
SDOH and their Public Policy Determinants
• housing – income and housing policy, rent controls and supplements, provision of social housing
• income and income distribution – taxation policy, minimum wages, social assistance, social assistance levels, family supports
• social exclusion – anti-discrimination laws and enforcement, ESL and job training, approving foreign credentials, support of a variety of other health determinants
• social safety net – spending on a wide range of welfare state areas
• unemployment – active labour policy, replacement benefits, labour legislation
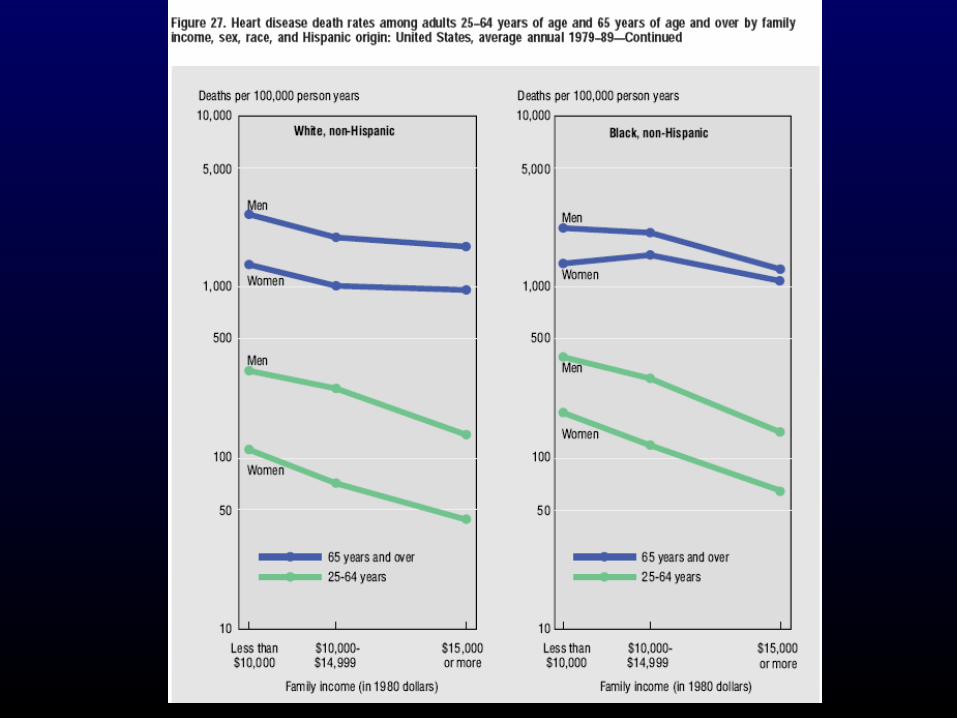
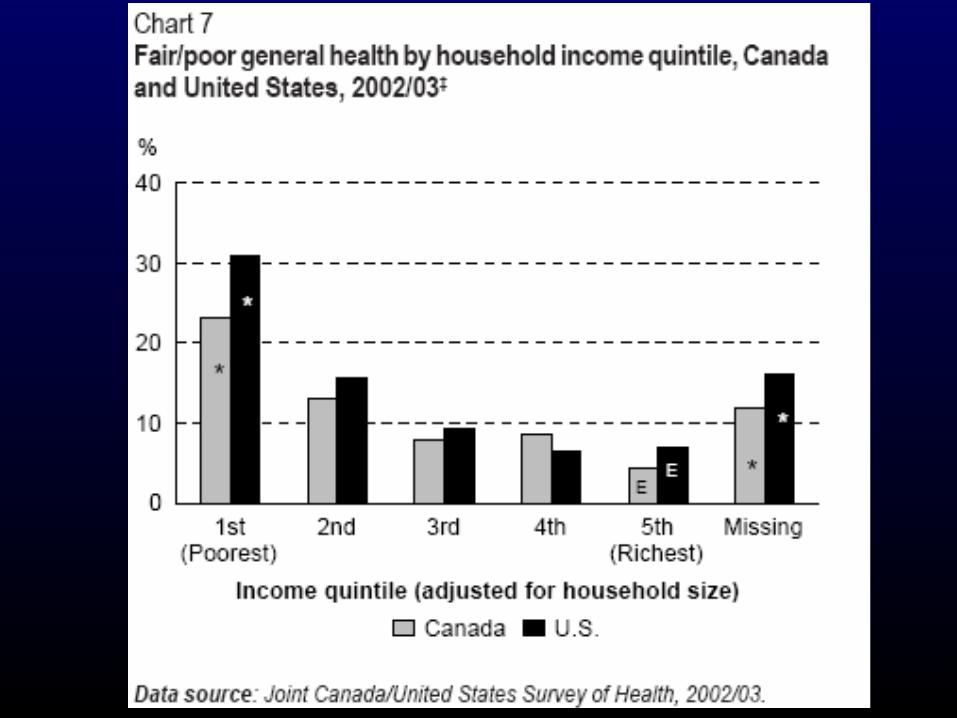
III. Health status – and living conditions – differ profoundly among
Americans
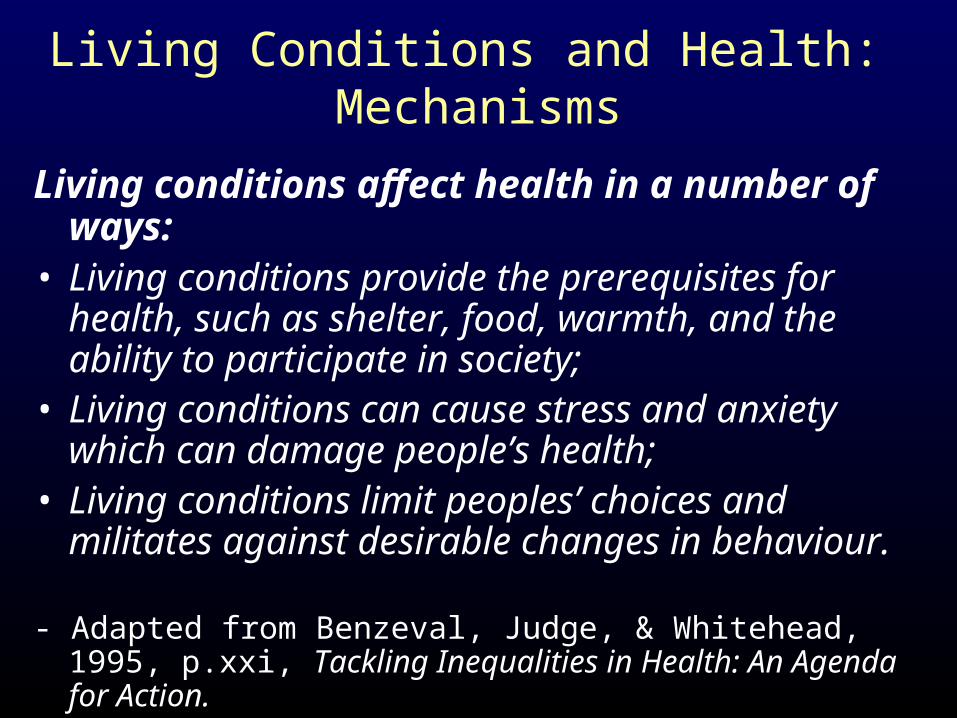
Living Conditions and Health: Mechanisms
Living conditions affect health in a number of ways:
• Living conditions provide the prerequisites for health, such as shelter, food, warmth, and the ability to participate in society;
• Living conditions can cause stress and anxiety which can damage people’s health;
• Living conditions limit peoples’ choices and militates against desirable changes in behaviour.
- Adapted from Benzeval, Judge, & Whitehead, 1995, p.xxi, Tackling Inequalities in Health: An Agenda for Action.
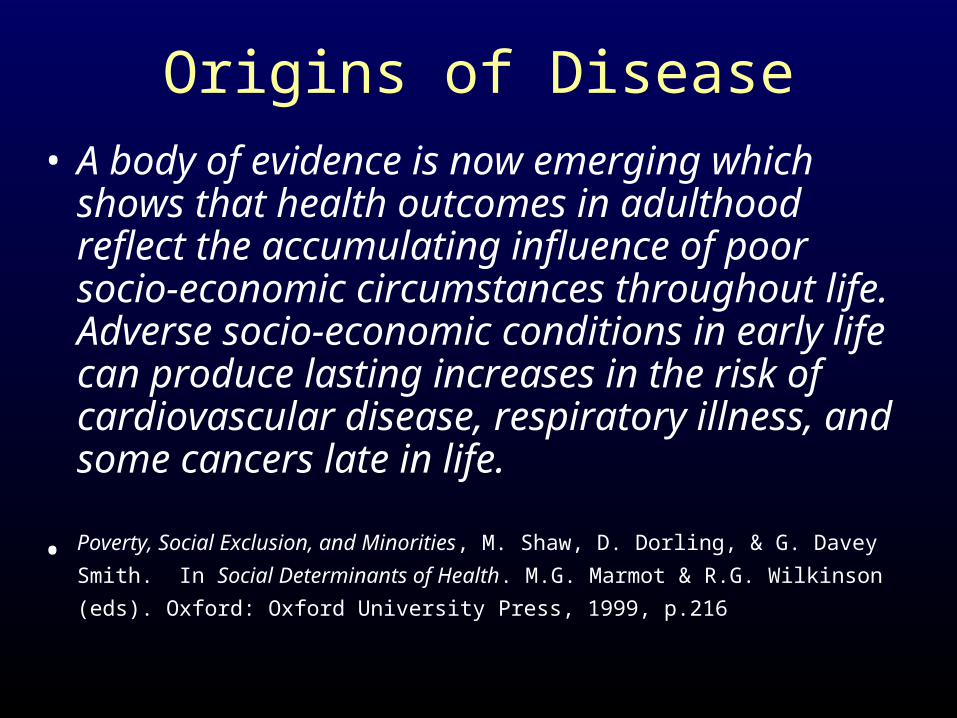
Origins of Disease• A body of evidence is now emerging which
shows that health outcomes in adulthood reflect the accumulating influence of poor socio-economic circumstances throughout life. Adverse socio-economic conditions in early life can produce lasting increases in the risk of cardiovascular disease, respiratory illness, and some cancers late in life.
• Poverty, Social Exclusion, and Minorities, M. Shaw, D. Dorling, & G. Davey Smith. In
Social Determinants of Health. M.G. Marmot & R.G. Wilkinson (eds). Oxford: Oxford
University Press, 1999, p.216
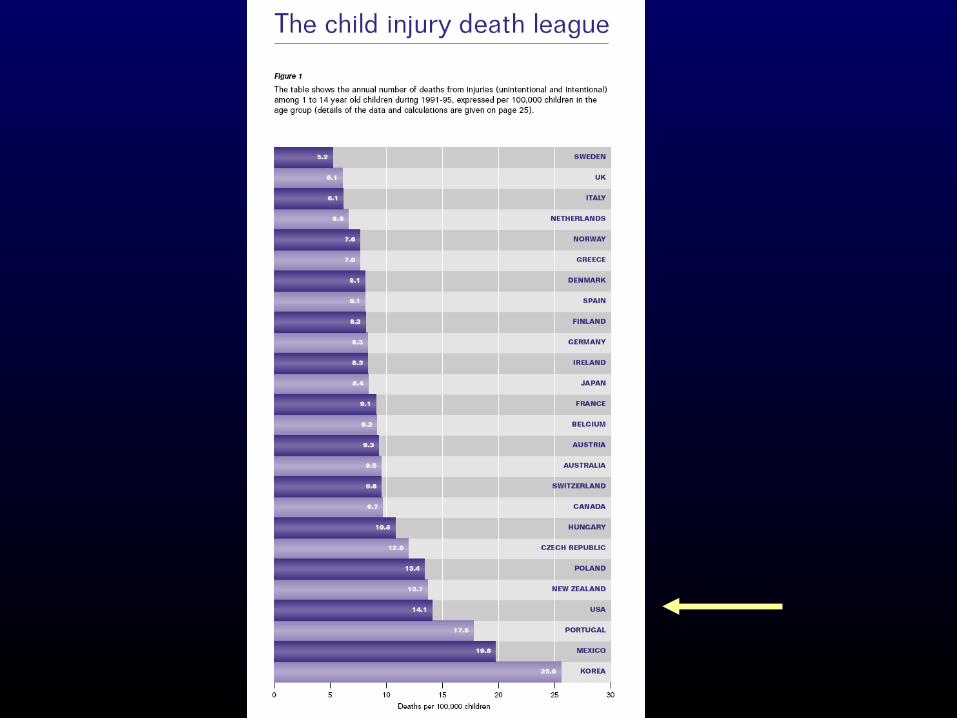
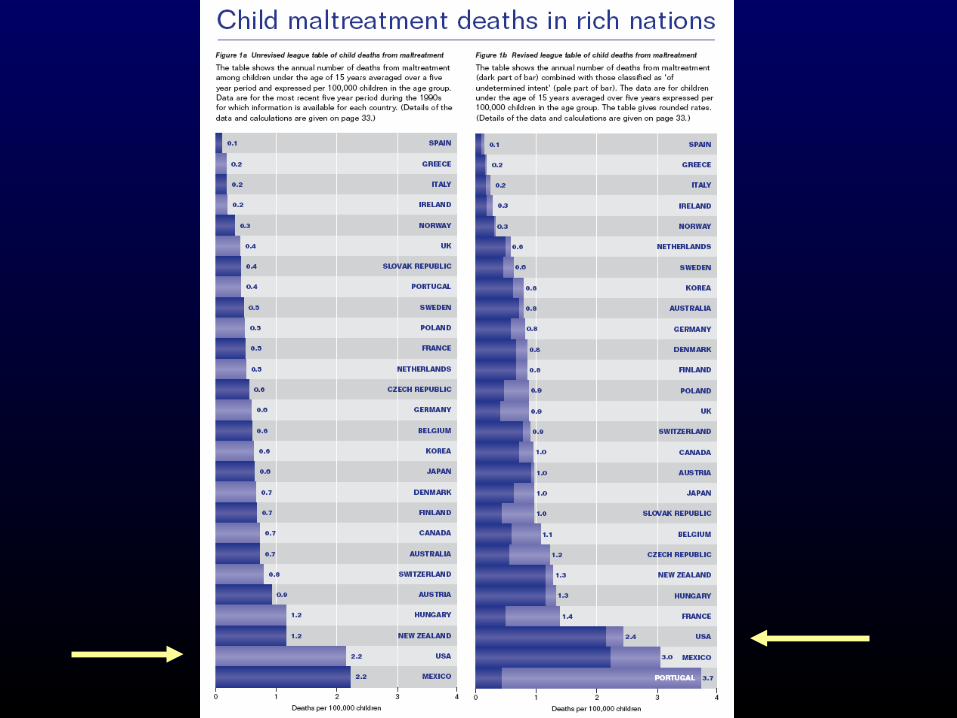
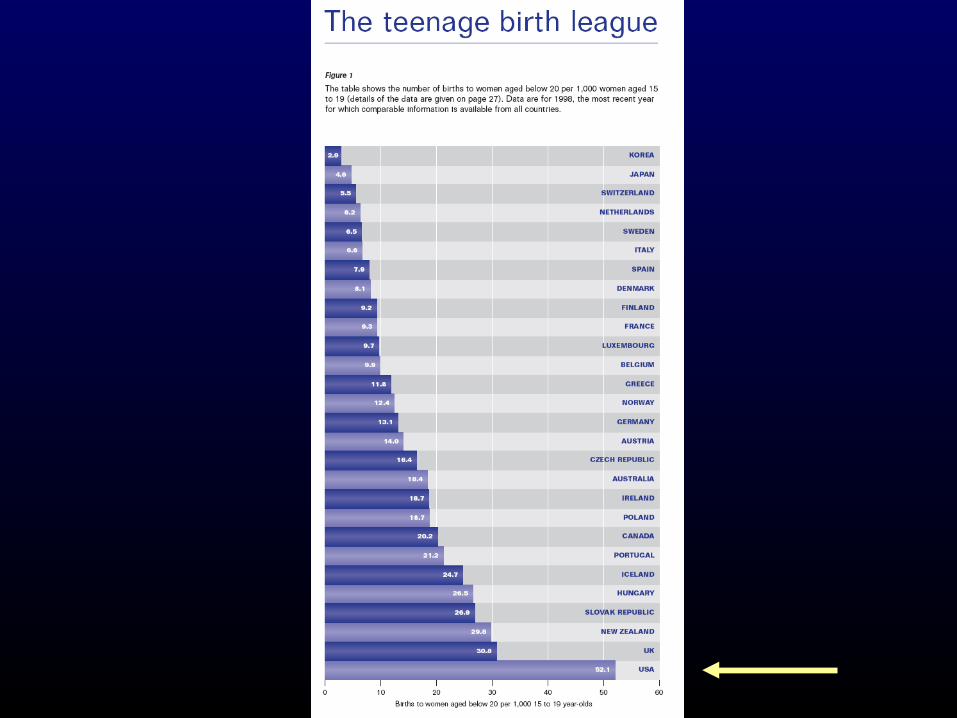
IV. The USA Population Health Profile
Sources: United Nations Human Development Reports (2005), Innocenti Report Cards (2000-2005) and Society at a Glance
(OECD, 2005)

V. The USA Public Policy Profile
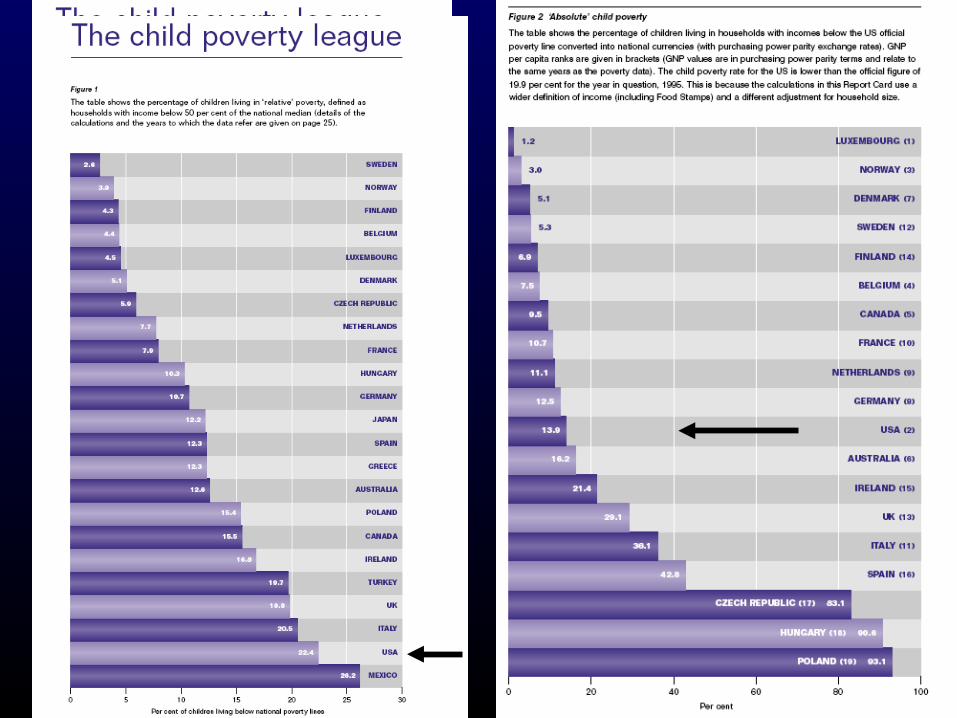
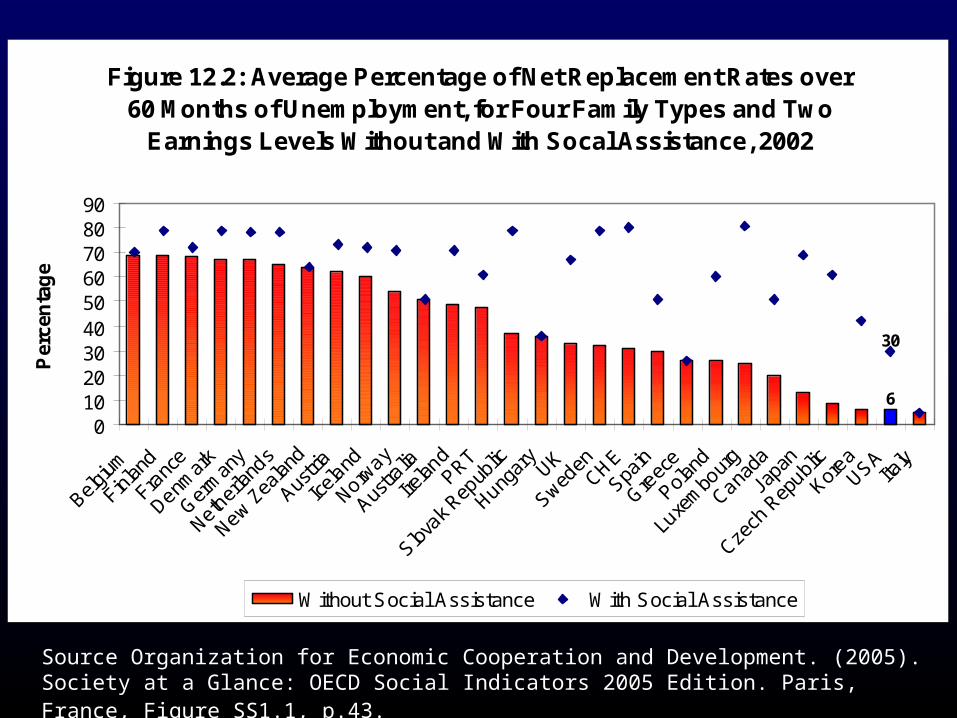
Figure 12.2: Average Percentage of Net Replacement Rates over 60 Months of Unemployment, for Four Family Types and Two
Earnings Levels Without and With Socal Assistance, 2002
6
30
0102030405060708090
Belgium
Finlan
d
Franc
e
Denmar
k
Germ
any
Nether
lands
New Zea
land
Austri
a
Icela
nd
Norway
Austra
lia
Irelan
dPRT
Slovak R
epub
lic
Hungar
yUK
Sweden
CHESpa
in
Greec
e
Poland
Luxe
mbo
urg
Canada
Japa
n
Czech
Rep
ublic
Korea
USAIta
ly
Per
cen
tag
e
Without Social Assistance With Social Assistance
Source Organization for Economic Cooperation and Development. (2005). Society at a Glance: OECD Social Indicators 2005 Edition. Paris, France, Figure SS1.1, p.43.
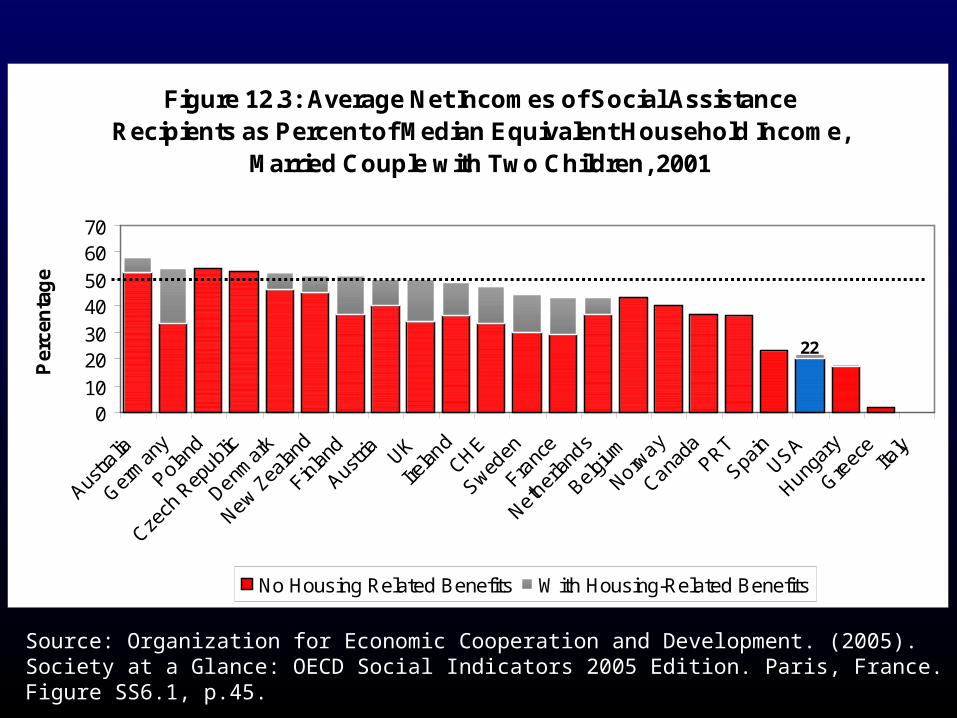
Figure 12.3: Average Net Incomes of Social Assistance Recipients as Percent of Median Equivalent Household Income,
Married Couple with Two Children, 2001
22
010203040506070
Austra
lia
Germ
any
Poland
Czech
Rep
ublic
Denmar
k
New Zea
land
Finlan
d
Austri
aUK
Irelan
dCHE
Sweden
Franc
e
Nether
lands
Belgium
Norway
Canada
PRTSpa
inUSA
Hungar
y
Greec
eIta
ly
Per
cen
tag
e
No Housing Related Benefits With Housing-Related Benefits
Source: Organization for Economic Cooperation and Development. (2005). Society at a Glance: OECD Social Indicators 2005 Edition. Paris, France. Figure SS6.1, p.45.
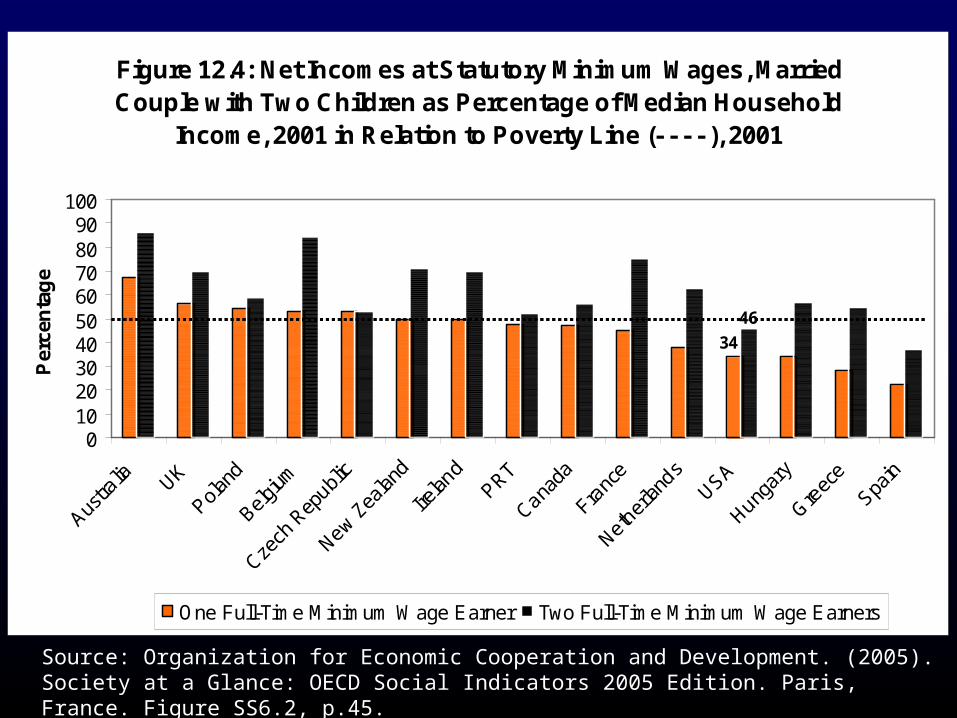
Figure 12.4: Net Incomes at Statutory Minimum Wages, Married Couple with Two Children as Percentage of Median Household
Income, 2001 in Relation to Poverty Line (- - - - ), 2001
34
46
0102030405060708090
100
Per
cen
tag
e
One Full-Time Minimum Wage Earner Two Full-Time Minimum Wage Earners
Source: Organization for Economic Cooperation and Development. (2005). Society at a Glance: OECD Social Indicators 2005 Edition. Paris, France. Figure SS6.2, p.45.
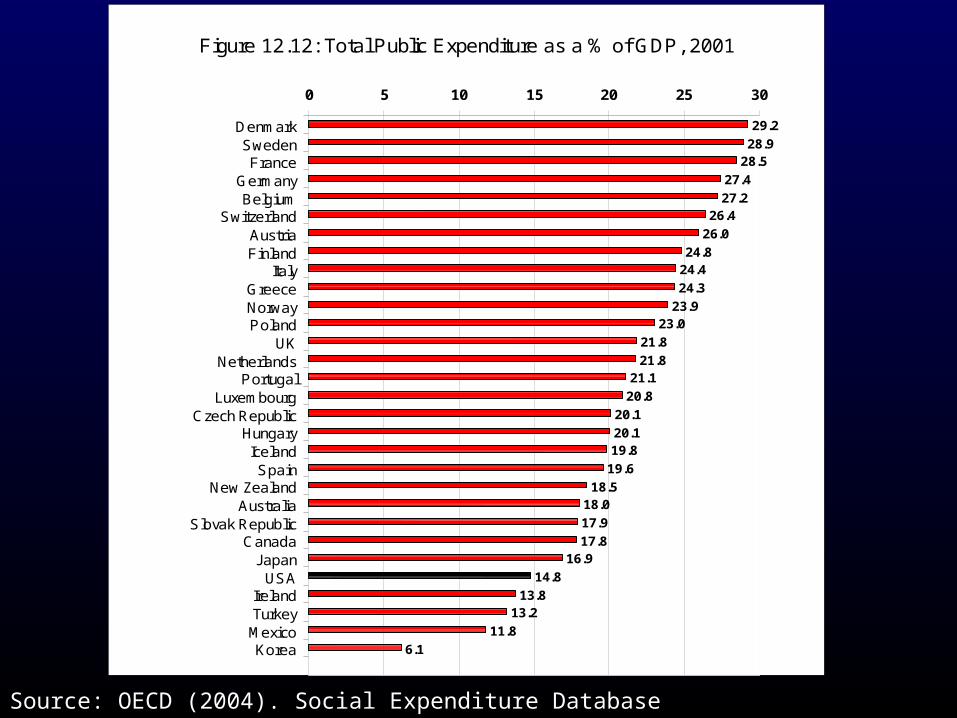
29.2
28.928.5
27.4
27.226.4
26.0
24.824.4
24.3
23.923.0
21.8
21.821.1
20.8
20.1
20.119.8
19.6
18.518.0
17.9
17.816.9
14.8
13.813.2
11.8
6.1
0 5 10 15 20 25 30
DenmarkSwedenFrance
GermanyBelgium
SwitzerlandAustriaFinland
ItalyGreeceNorwayPoland
UKNetherlands
PortugalLuxembourg
Czech RepublicHungaryIcelandSpain
New ZealandAustralia
Slovak RepublicCanada
JapanUSA
IrelandTurkeyMexicoKorea
Figure 12.12: Total Public Expenditure as a % of GDP, 2001
Source: OECD (2004). Social Expenditure Database www.oecd.org/els/social/expenditure
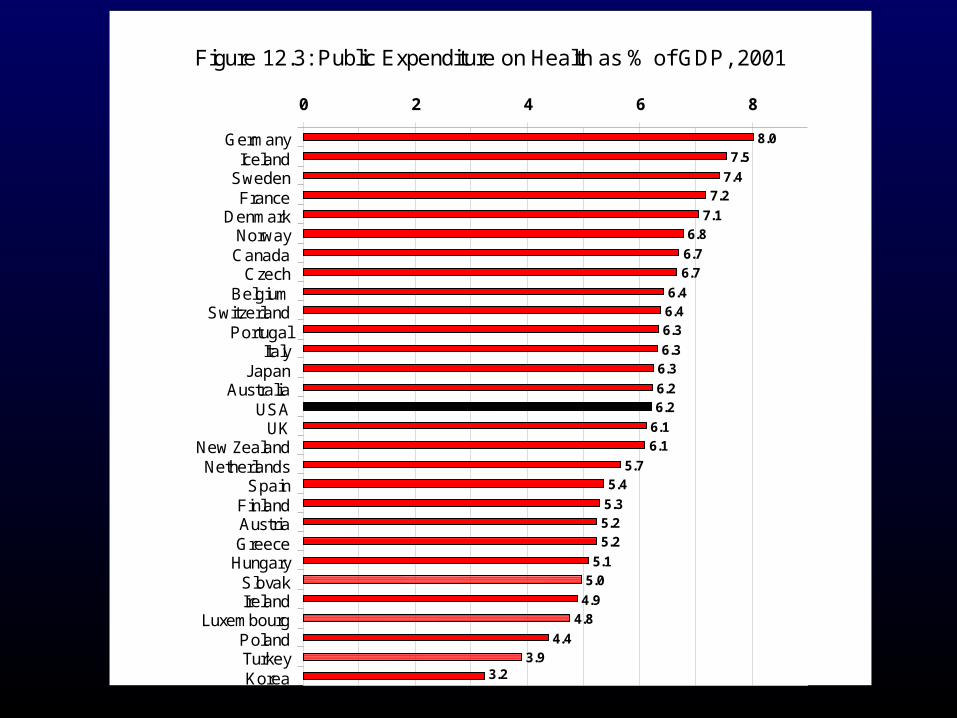
8.07.5
7.47.2
7.16.8
6.76.7
6.46.46.3
6.36.3
6.26.2
6.16.1
5.75.4
5.35.25.2
5.15.0
4.94.8
4.43.9
3.2
0 2 4 6 8
GermanyIceland
SwedenFrance
DenmarkNorwayCanada
CzechBelgium
SwitzerlandPortugal
ItalyJapan
AustraliaUSA
UKNew ZealandNetherlands
SpainFinlandAustriaGreece
HungarySlovakIreland
LuxembourgPolandTurkeyKorea
Figure 12.3: Public Expenditure on Health as % of GDP, 2001
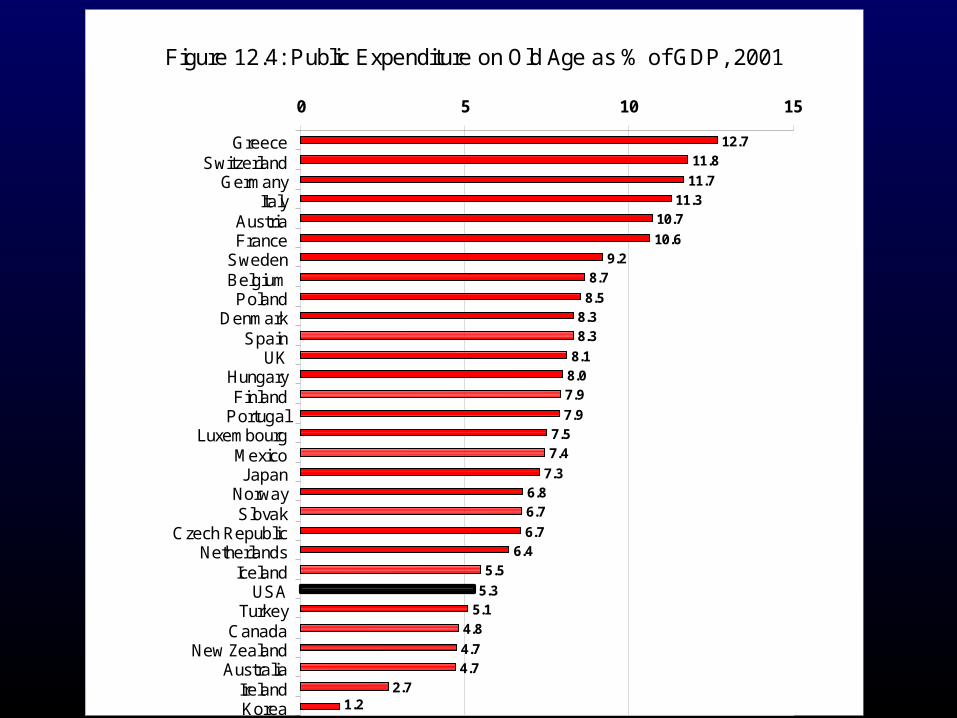
12.711.8
11.711.3
10.7
10.69.2
8.7
8.58.38.3
8.18.07.9
7.97.57.4
7.36.86.7
6.76.4
5.5
5.35.1
4.8
4.74.7
2.71.2
0 5 10 15
GreeceSwitzerland
GermanyItaly
AustriaFrance
SwedenBelgiumPoland
DenmarkSpain
UKHungaryFinland
PortugalLuxembourg
MexicoJapan
NorwaySlovak
Czech RepublicNetherlands
IcelandUSA
TurkeyCanada
New ZealandAustralia
IrelandKorea
Figure 12.4: Public Expenditure on Old Age as % of GDP, 2001
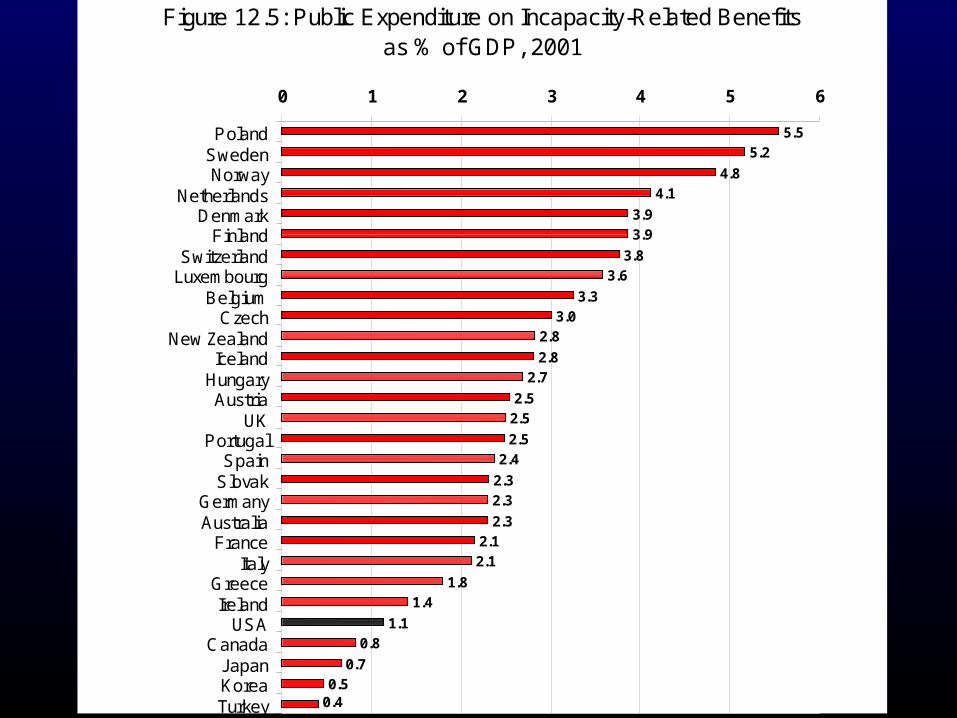
5.55.2
4.84.1
3.93.9
3.83.6
3.33.0
2.8
2.82.7
2.52.5
2.52.4
2.32.3
2.32.12.1
1.81.4
1.10.8
0.70.5
0.4
0 1 2 3 4 5 6
PolandSwedenNorway
NetherlandsDenmark
FinlandSwitzerland
LuxembourgBelgium
CzechNew Zealand
IcelandHungaryAustria
UKPortugal
SpainSlovak
GermanyAustralia
FranceItaly
GreeceIreland
USACanada
JapanKoreaTurkey
Figure 12.5: Public Expenditure on Incapacity-Related Benefits as % of GDP, 2001
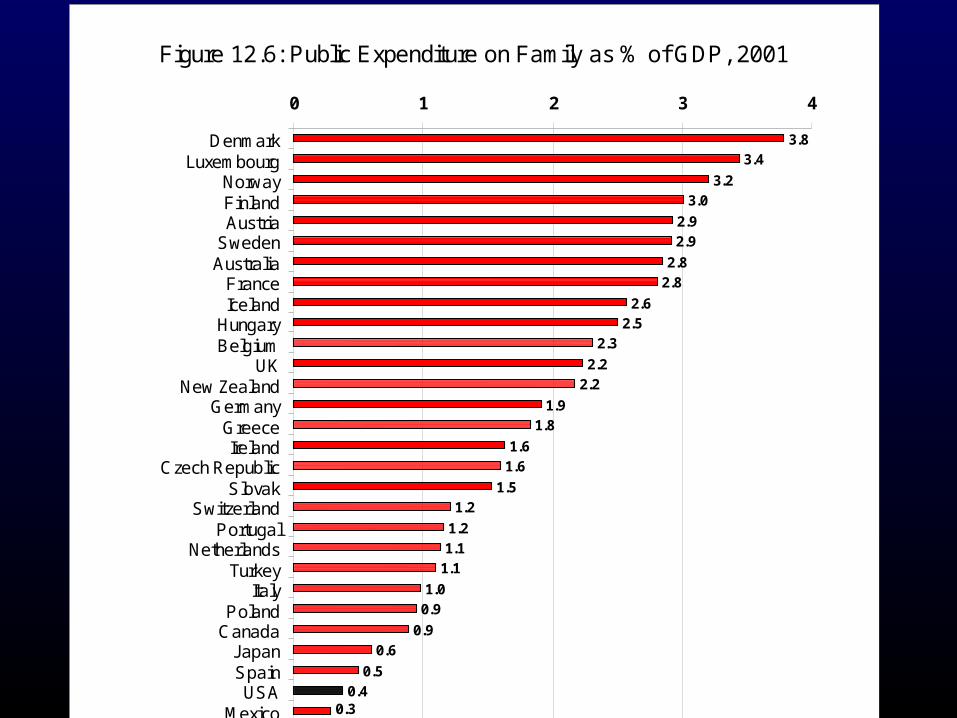
3.83.4
3.23.0
2.92.9
2.82.8
2.62.5
2.3
2.22.2
1.91.8
1.61.6
1.51.2
1.21.1
1.1
1.00.9
0.90.6
0.50.4
0.3
0 1 2 3 4
DenmarkLuxembourg
NorwayFinlandAustria
SwedenAustralia
FranceIceland
HungaryBelgium
UKNew Zealand
GermanyGreeceIreland
Czech RepublicSlovak
SwitzerlandPortugal
NetherlandsTurkey
ItalyPoland
CanadaJapanSpainUSA
Mexico
Figure 12.6: Public Expenditure on Family as % of GDP, 2001
4.42
3.75
3.68
3.46
3.01
2.85
2.51
2.19
2.09
2
1.95
1.8
1.67
1.32
1.14
1.13
0.89
0.79
0.61
0.53
0.45
0.3
0 1 2 3 4 5
DenmarkBelgium
NetherlandsGermany
FinlandFrance
SwedenSpain
IrelandAustria
PortugalSwitzerland
NorwayNew Zealand
CanadaAustralia
United KingdomJapan
Slovak RepublicUnited States
Czech RepublicKorea
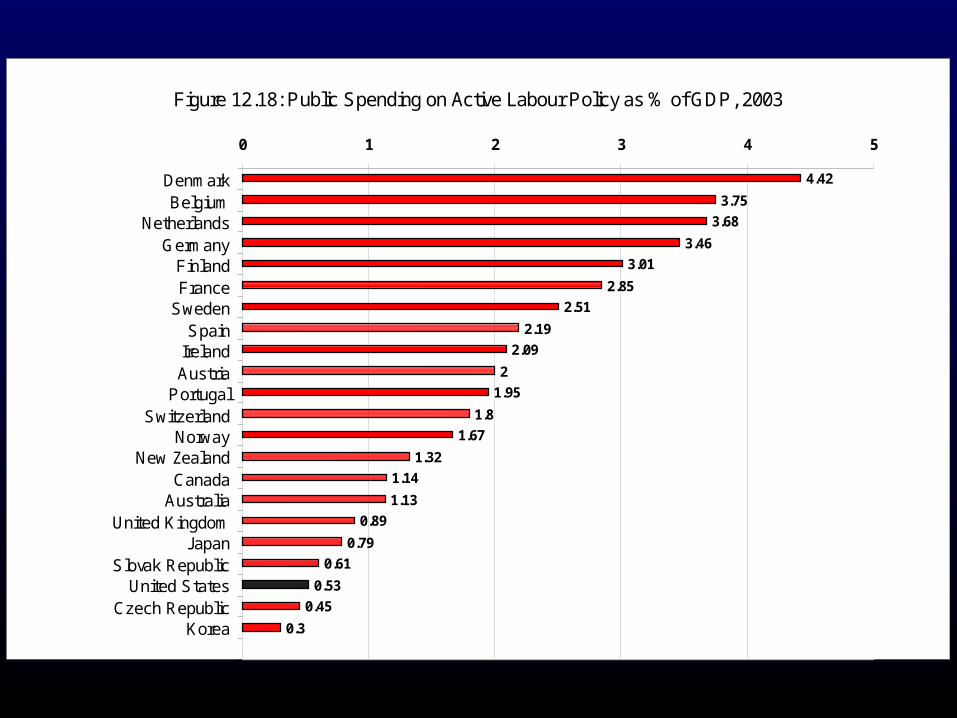
Figure 12.18: Public Spending on Active Labour Policy as % of GDP, 2003
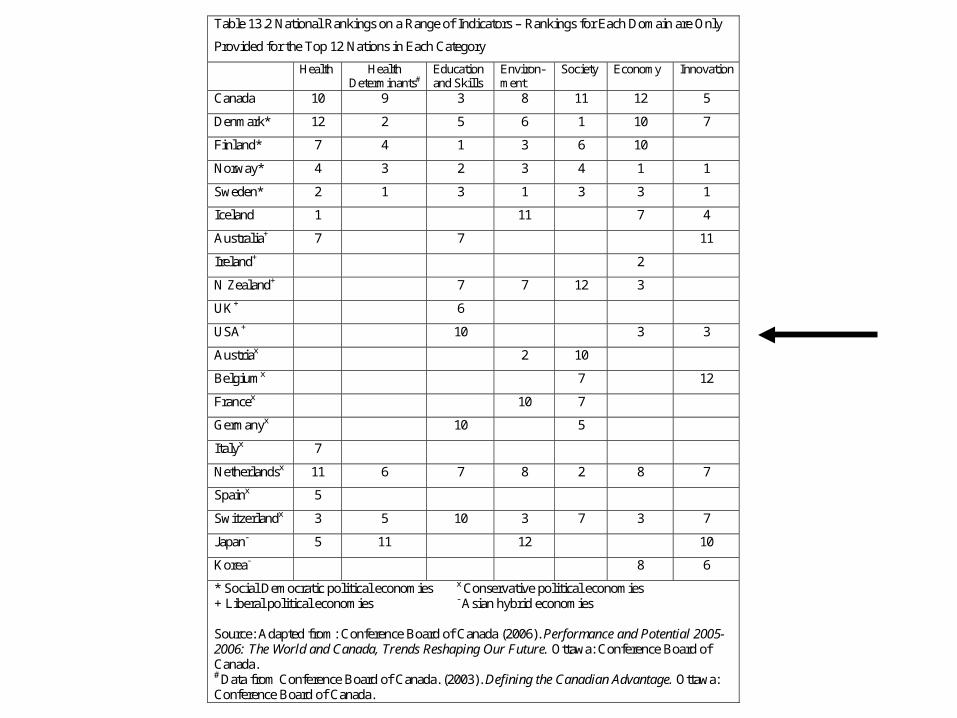
Table 13.2 National Rankings on a Range of Indicators – Rankings for Each Domain are Only
Provided for the Top 12 Nations in Each Category
Health Health Determinants#
Education and Skills
Environ-ment
Society Economy Innovation
Canada 10 9 3 8 11 12 5
Denmark* 12 2 5 6 1 10 7
Finland* 7 4 1 3 6 10
Norway* 4 3 2 3 4 1 1
Sweden* 2 1 3 1 3 3 1
Iceland 1 11 7 4
Australia+ 7 7 11
Ireland+ 2
N Zealand+ 7 7 12 3
UK+ 6
USA+ 10 3 3
Austriax 2 10
Belgiumx 7 12
Francex 10 7
Germanyx 10 5
Italyx 7
Netherlandsx 11 6 7 8 2 8 7
Spainx 5
Switzerlandx 3 5 10 3 7 3 7
Japan- 5 11 12 10
Korea- 8 6
* Social Democratic political economies x Conservative political economies + Liberal political economies - Asian hybrid economies Source: Adapted from: Conference Board of Canada (2006). Performance and Potential 2005-2006: The World and Canada, Trends Reshaping Our Future. Ottawa: Conference Board of Canada. # Data from Conference Board of Canada. (2003). Defining the Canadian Advantage. Ottawa: Conference Board of Canada.

VI. The solution to health inequalities lies in the
political sphere


Key Tenets of Neo-liberalism
• Markets are the most efficient allocators of resources in production and distribution;
• Societies are composed of autonomous individuals (producers and consumers) motivated chiefly by material or economic considerations;
• Competition is the major market vehicle for innovations
• “There is no such thing as society.”• Source: Coburn, D. (2000). Income inequality, social cohesion
and the health status of populations: The role of neo-liberalism. Social Science & Medicine, 51(1), 135-146.
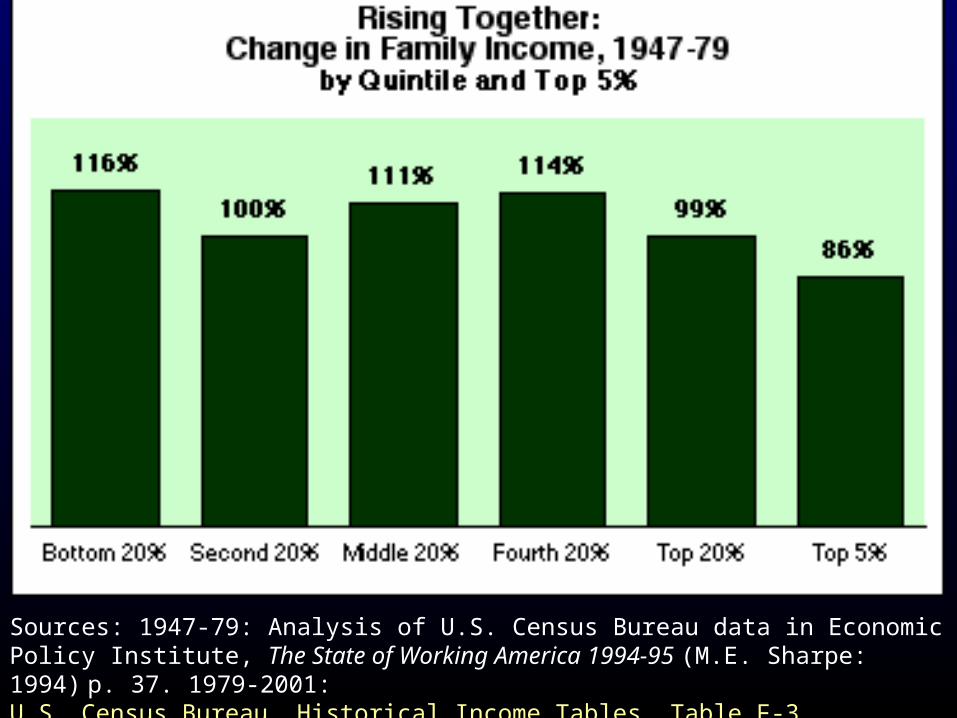
Sources: 1947-79: Analysis of U.S. Census Bureau data in Economic Policy Institute, The State of Working America 1994-95 (M.E. Sharpe: 1994) p. 37. 1979-2001: U.S. Census Bureau, Historical Income Tables, Table F-3
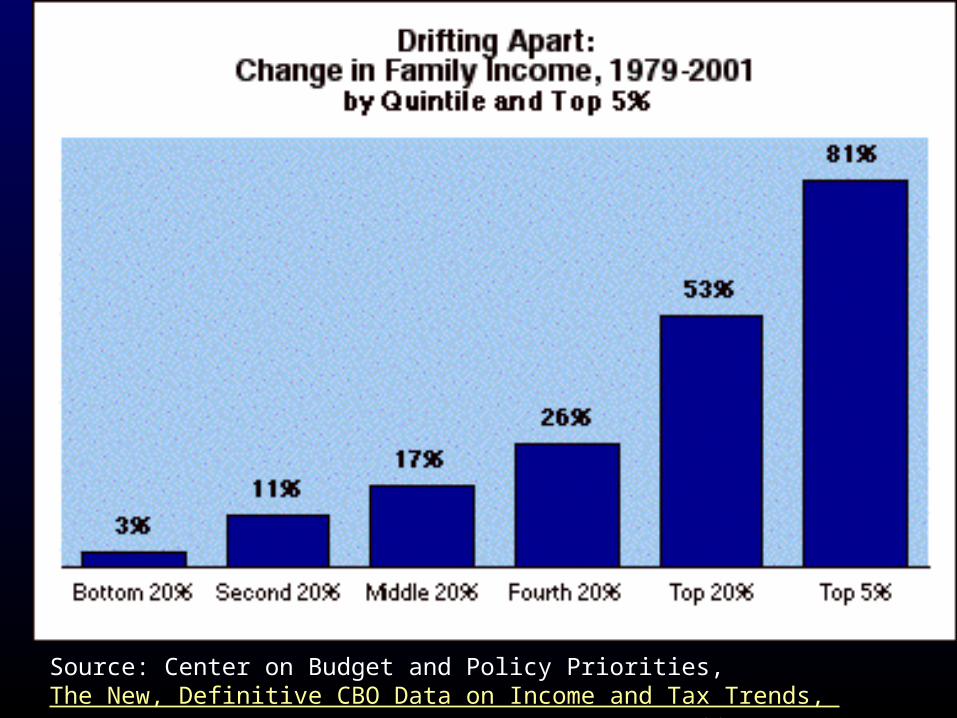
Source: Center on Budget and Policy Priorities, The New, Definitive CBO Data on Income and Tax Trends, Sept. 23, 2003, citing Congressional Budget Office data.
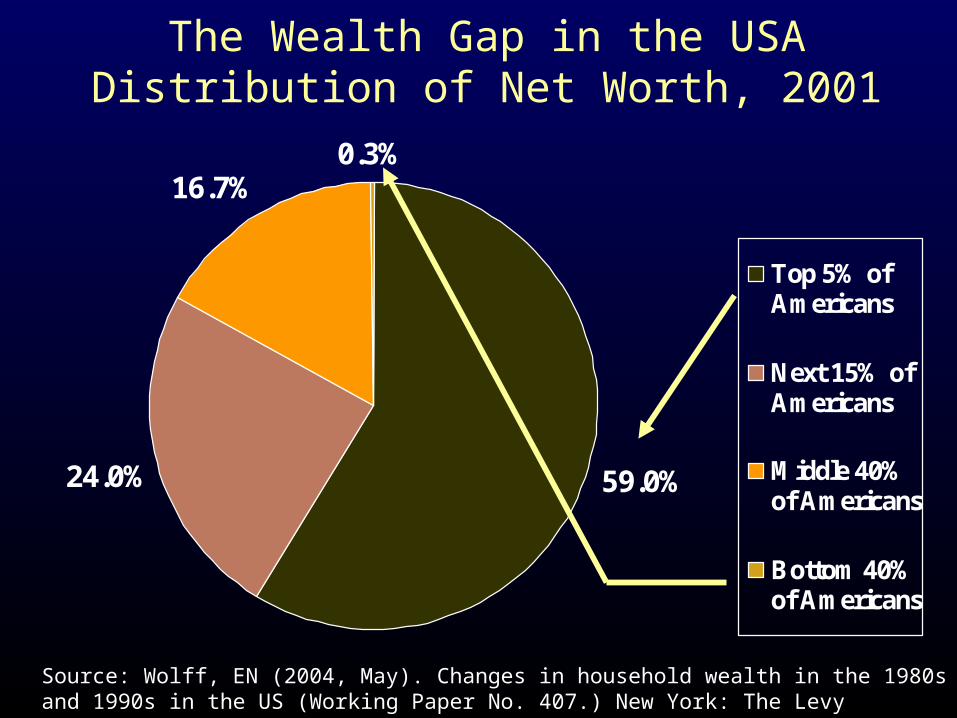
The Wealth Gap in the USADistribution of Net Worth, 2001
59.0%24.0%
16.7%0.3%
Top 5% ofAmericans
Next 15% ofAmericans
Middle 40%of Americans
Bottom 40%of Americans
Source: Wolff, EN (2004, May). Changes in household wealth in the 1980s and 1990s in the US (Working Paper No. 407.) New York: The Levy Economics Institute of Bard College
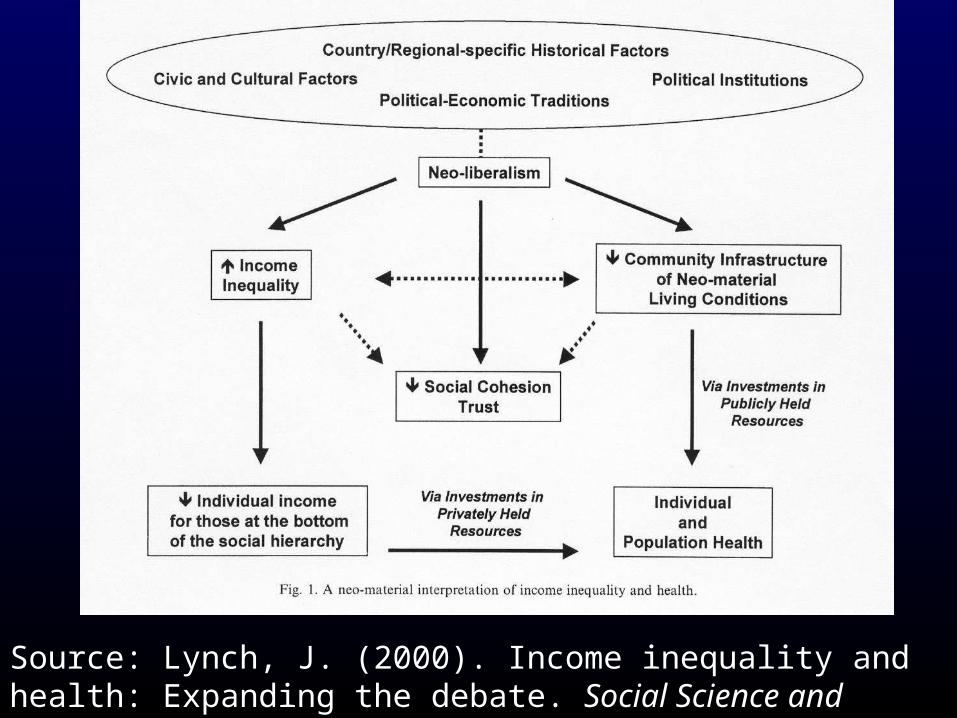
Source: Lynch, J. (2000). Income inequality and health: Expanding the debate. Social Science and Medicine, 51, 1001-1005, Figure 1, p. 1003.
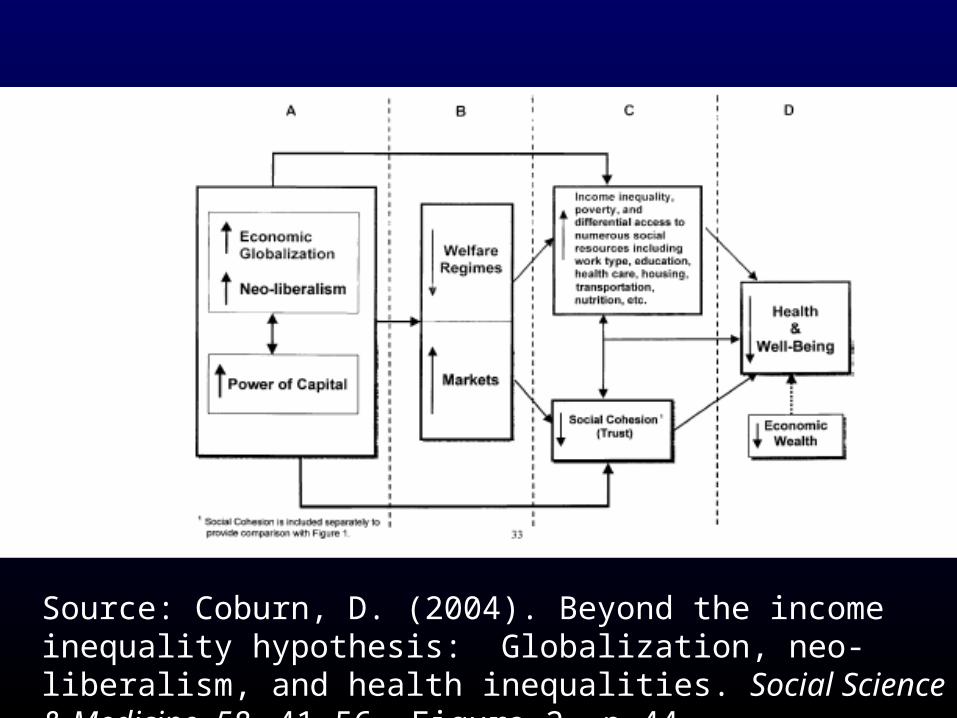
Source: Coburn, D. (2004). Beyond the income inequality hypothesis: Globalization, neo-liberalism, and health inequalities. Social Science & Medicine, 58, 41-56, Figure 2, p.44.
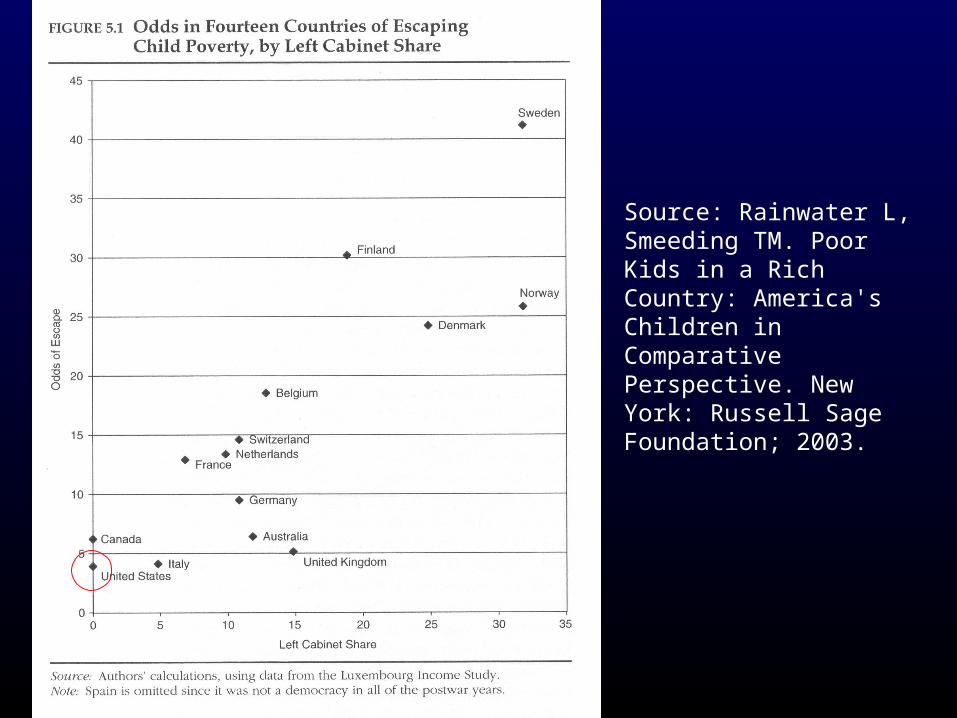
Source: Rainwater L, Smeeding TM. Poor Kids in a Rich Country: America's Children in Comparative Perspective. New York: Russell Sage Foundation; 2003.
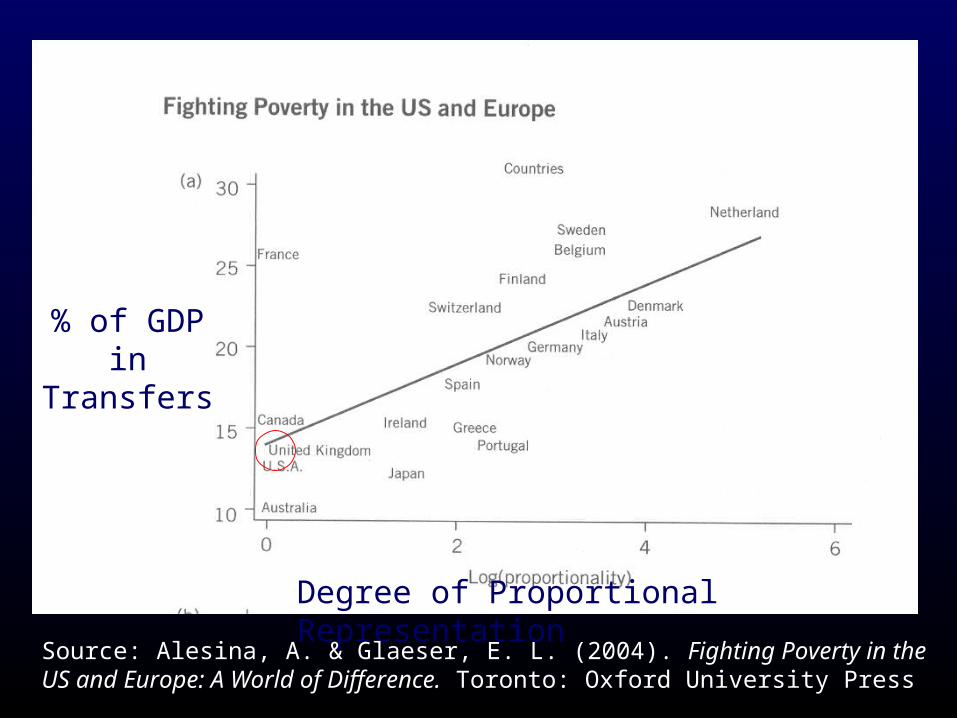
Degree of Proportional Representation
% of GDP in Transfers
Source: Alesina, A. & Glaeser, E. L. (2004). Fighting Poverty in the US and Europe: A World of Difference. Toronto: Oxford University Press
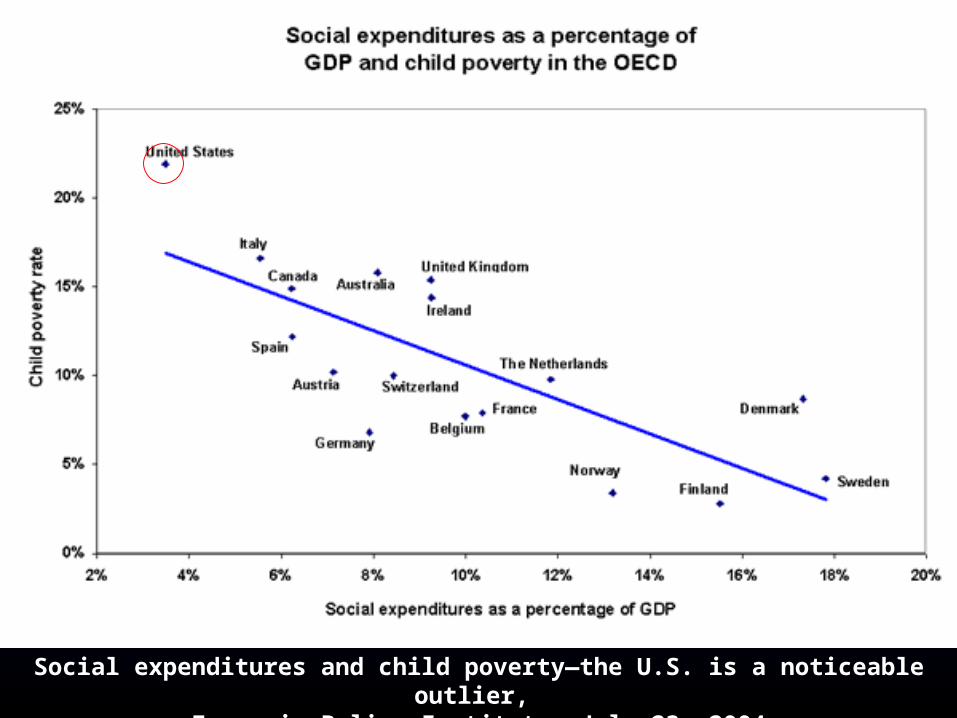
Social expenditures and child poverty—the U.S. is a noticeable outlier, Economic Policy Institute, July 23, 2004
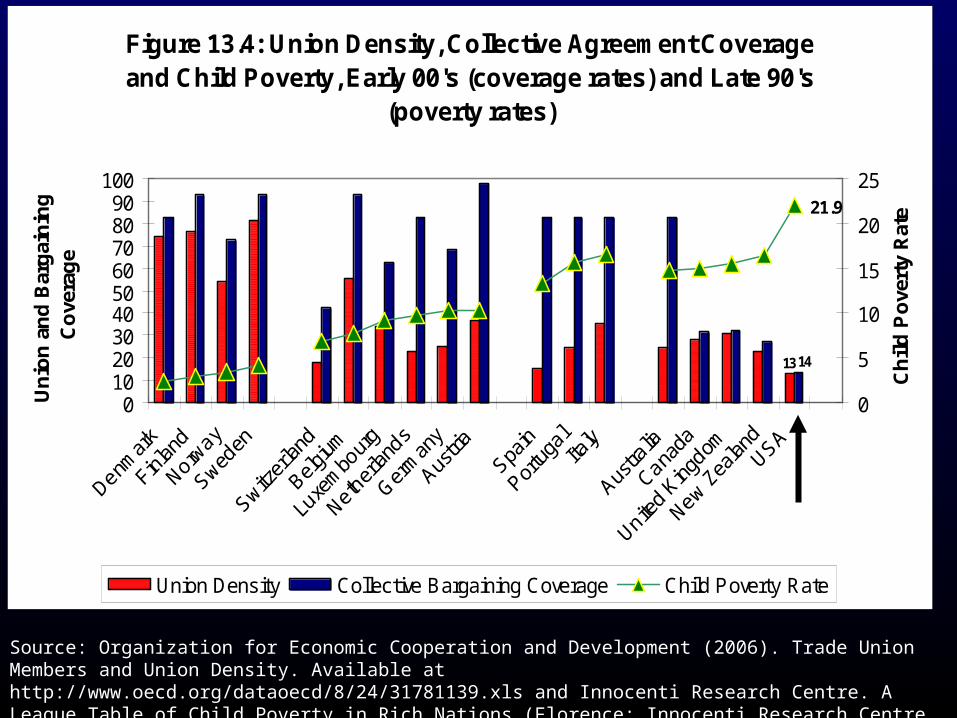
Figure 13.4: Union Density, Collective Agreement Coverage and Child Poverty, Early 00's (coverage rates) and Late 90's
(poverty rates)
1314
21.9
0102030405060708090
100
Un
ion
an
d B
arg
ain
ing
C
ove
rag
e
0
5
10
15
20
25
Ch
ild
Po
vert
y R
ate
Union Density Collective Bargaining Coverage Child Poverty Rate
Source: Organization for Economic Cooperation and Development (2006). Trade Union Members and Union Density. Available at http://www.oecd.org/dataoecd/8/24/31781139.xls and Innocenti Research Centre. A League Table of Child Poverty in Rich Nations (Florence: Innocenti Research Centre, 1999), Figure 1, p.4.
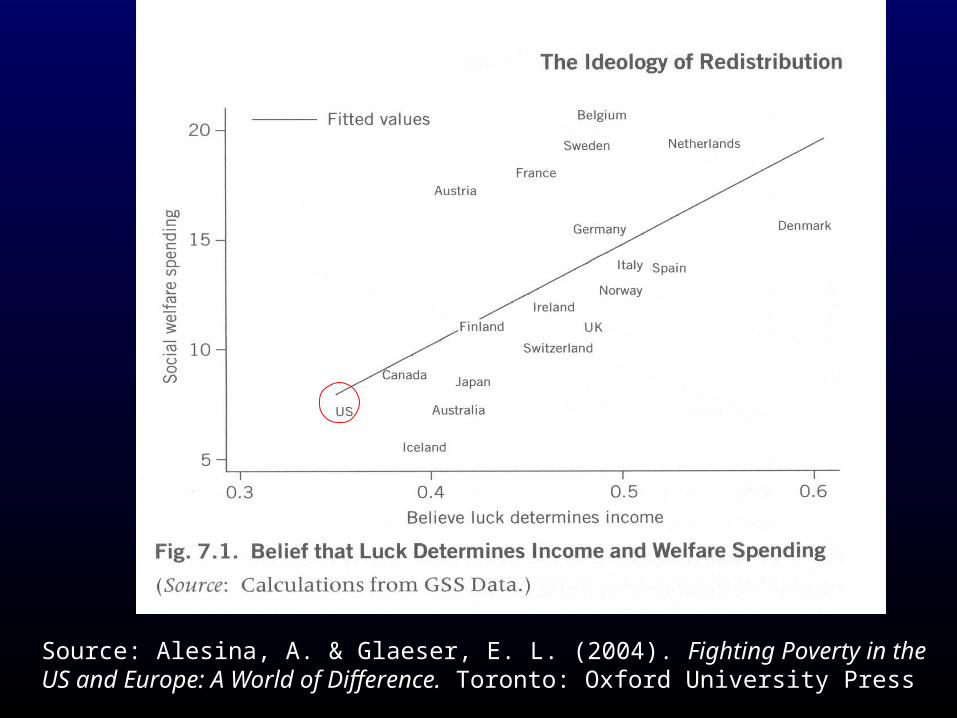
Source: Alesina, A. & Glaeser, E. L. (2004). Fighting Poverty in the US and Europe: A World of Difference. Toronto: Oxford University Press
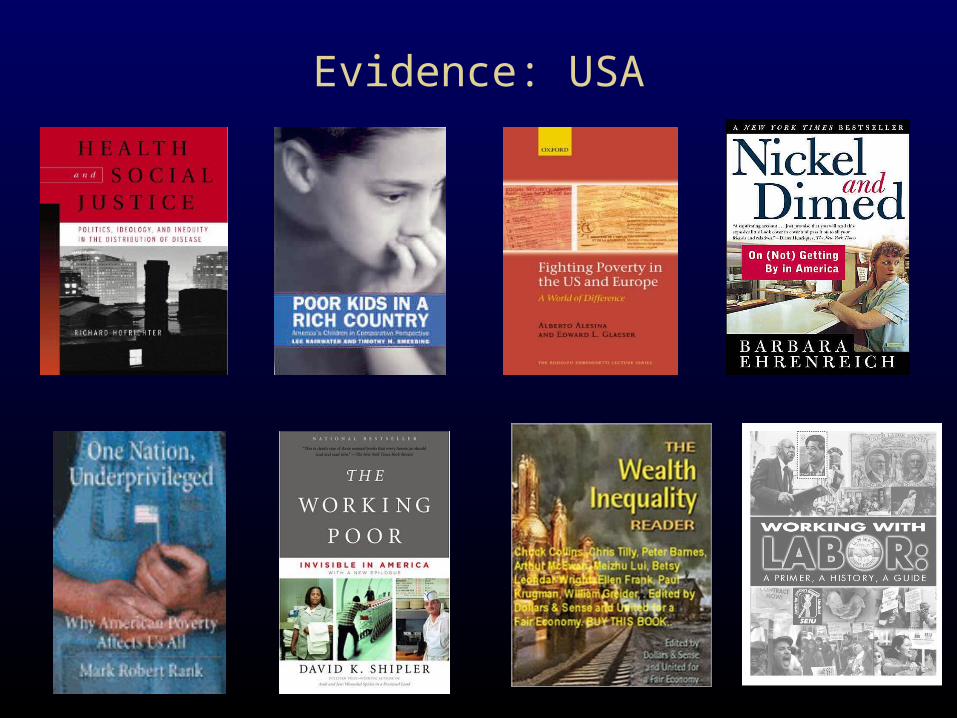
Evidence: USA
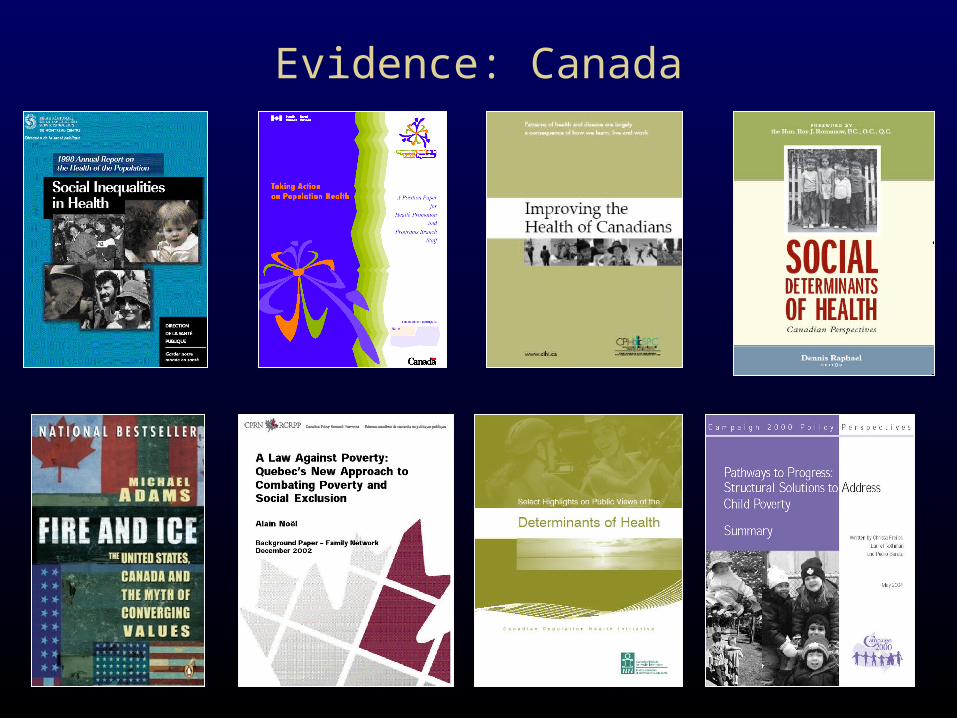
Evidence: Canada

Evidence: UK

And, finally…
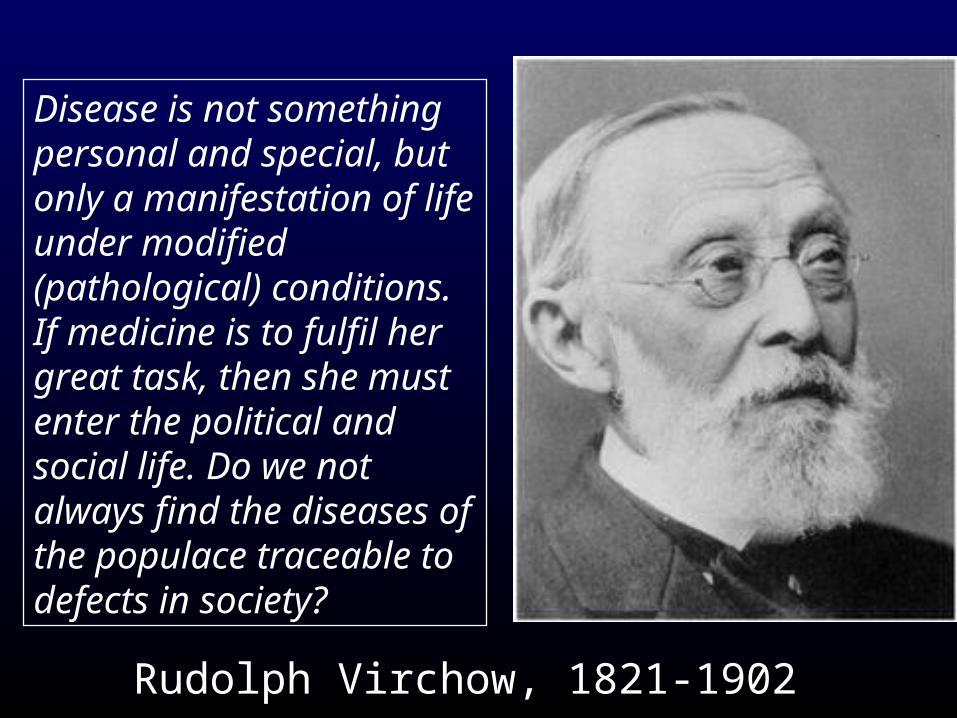
Rudolph Virchow, 1821-1902
Disease is not something personal and special, but only a manifestation of life under modified (pathological) conditions. If medicine is to fulfil her great task, then she must enter the political and social life. Do we not always find the diseases of the populace traceable to defects in society?

Dennis Raphael
This presentation and other presentations and related papers are available at:
http://www.atkinson.yorku.ca/draphael