
PUBLIC PERCEPTIONS OF WOMEN IN LEADERSHIP...2 | Public Perceptions of women in leadership 1...
52
PUBLIC PERCEPTIONS OF WOMEN IN LEADERSHIP A RESEARCH PROJECT OF THE FIJI WOMEN’S FORUM, IN PARTNERSHIP WITH INTERNATIONAL WOMEN’S DEVELOPMENT AGENCY (IWDA) RESEARCH REPORT NA I SOQOSOQO VAKAMARAMA I TAUKEI Non-Political Non-Sectarian Founded in 1924 DECEMBER 2014
Transcript of PUBLIC PERCEPTIONS OF WOMEN IN LEADERSHIP...2 | Public Perceptions of women in leadership 1...

PUBLIC PERCEPTIONS OF WOMEN IN LEADERSHIP A RESEARCH PROJECT OF THE FIJI WOMEN’S FORUM, IN PARTNERSHIP WITH INTERNATIONAL WOMEN’S DEVELOPMENT AGENCY (IWDA)
RESEARCH REPORT
NA I SOQOSOQO VAKAMARAMA I TAUKEI
Non-PoliticalNon-SectarianFounded in 1924
DECEMBER 2014

ii | Public Perceptions of women in leadership
This research was funded through the Funding Leadership and Opportunities for Women (FLOW) programme, 2013 and 2014. The research was led by Patrina Dumaru and Sarah Pene, who also wrote this report, with input from the Fiji Women’s Forum and IWDA. The research team included: Viola Lesi, Rachana Kumari, Funmike Lilo, Sindhu Lata, Kameli Koroivukivuki, Nandhini Vandana, Kavita Ragini, Ronil Latchman, Ayub Khan, Ashwin Prasad, Laite Toroki, Mereia Qovu, Alena Meo, Masilina Raumakita, Lepani Kaiwalu, Josaia Osborne, Daiana Taoba, Elimi Lesi, Nirmala Sharma and Ansu Rakesh.
contents
executive summary 1
1 introduction 2 1.1 context of the project 2 1.2 the status of women in fiji—an overview 3
2 methodology 4 2.1 research team 4 2.2 study areas 4 2.3 focus group discussions and key informant interviews 5 2.4 survey questionnaire 6
3 results 9 3.1 Perceptions and awareness of women’s political participation 9 3.2 Perceptions of leadership attributes and the capability of women to lead 17 3.3 women’s willingness to stand for election 26 3.4 attitudes towards voting for women 32
4 Synthesis of findings 37
5 conclusion 39
references 40

A Fiji Women’s Forum Research Project, in partnership with IWdA | 1
executive summary
The Fiji Women’s Forum was convened in 2012 by the Fiji Women’s Rights Movement, femLINKpacific, the National Council of Women and the Soqosoqo Vakamarama iTaukei. The objective of the Fiji Women’s Forum is to give women’s organisations space to collectively develop strategies to increase the number of women elected to parliament upon a return to democratic rule.
This study was commissioned under the Funding Leadership Opportunities for Women (FLOW) programme, a four year multi-country programme funded by the Government of the Netherlands, coordinated in the Pacific by the International Women’s Development Agency (IWDA), and implemented in Fiji in partnership with the Fiji Women’s Forum, Fiji Women’s Rights Movement (FWRM), femLINKpacific, and Commonwealth Local Government Forum Pacific. Its purpose was to provide the Fiji Women’s Forum with information on public perceptions of leadership and women in political leadership, in order to guide and inform the Women’s Forum and constituent organisations regarding directions for voter education and advocacy for greater female representation in politics.
The study comprised a survey questionnaire administered to 1211 men and women in rural and urban areas in Viti Levu and Vanua Levu, 25 focus group discussions (with a total of 187 participants) and 8 key informant interviews.
This was the first study in Fiji to explore community views about women in politics and leadership more generally. The findings provide a snapshot of attitudes and perspectives prior to the September 2014 election. Some significant findings of the study include:
• 81% of respondents agree that women are under-represented in Fiji, and 72% think it would be better for the country if there were more women in national government.
• Being hardworking, honest and intelligent were the three traits most frequently assessed as being absolutely essentially in a political leader. Over two thirds of respondents stated that these traits are equally true of men and women.
• The vast majority of respondents deemed fluency in English (96%) and a university education (89%) to be very important or absolutely essential in a political leader.
• The majority of respondents identified cultural barriers (60%), discrimination (59%) and a lack of support at community level (53%) as the major reasons why fewer women than men stand for elections, rather than a lack of education (15%) or experience (19%).
• 77% of respondents would not be influenced by a candidate’s sex when casting their vote. 17% of women would prefer to vote for a woman.
• 67% of respondents deem it likely or extremely likely that Fiji will have a female Prime Minister within the next ten years, and 65% said they would like to see that happen.
The results of the study can be encapsulated in three key statements:
1. the majority of people in fiji feel that women are under-represented in government and that changing this would be beneficial to the nation as a whole.
2. People recognise that the qualifications and attributes of leadership are not unique to men, but are common to both men and women.
3. conservative viewpoints that favour male leadership are a small but significant minority in certain demographics; the strongest support for female leadership is to be found amongst women and young people.
This research on perceptions of leadership generally and women’s leadership in particular provides important information about current attitudes, how these vary across the population in Fiji, and where change is happening. This will be valuable information to inform future action to support increased representation of women in politics and a baseline against which the success of such efforts can be assessed.
The study draws attention to the gender bias that lies at the heart of why women are under-represented in government and the necessity for definitive action to support women’s political participation in order to better reflect the public’s desire for more gender balanced political representation.

2 | Public Perceptions of women in leadership
1 introduction
1.1 context of the Project
In December 2006 the Government of Fiji, formed after the general elections of May that year, was removed from power in a military coup d’état. This was the fourth coup in Fiji since 1987. Since the December 2006 coup, human rights groups in Fiji, and the women’s movement, have advocated for a return to democratic government. In March 2014 the military regime announced an official election date of 17 September 2014.
In April 2012 the Fiji Women’s Forum was convened by the Fiji Women’s Rights Movement, femLINKpacific, the National Council of Women and the Soqosoqo Vakamarama iTaukei. The objective of the Fiji Women’s Forum was to give women’s organisations space to collectively develop strategies to increase women’s participation in constitutional development, electoral reform, and ultimately increase the number of women elected to parliament upon a return to democratic rule.
Funding Leadership and Opportunities for Women (FLOW) is a four year multi-country programme funded by the Government of the Netherlands. The FLOW programme has as its overall goal the improvement of the lives of women and girls in developing countries. The FLOW programme in the Pacific is coordinated by the International Women’s Development Agency (IWDA), and is being implemented in Fiji, Papua New Guinea and Solomon Islands to build the capacity and confidence of Pacific women, individually and collectively, and create new pathways and opportunities for leadership at the community, provincial, national and regional level.
The Pacific FLOW programme has learnt from previous initiatives in the women’s leadership space, which have been specific and short term. It aims for a holistic approach that builds on, complements and connects existing successful programs. It focuses on individuals and organisations, and spaces and pathways for leadership, from community to provincial, national and regional levels. The programme links organisations across four countries at different stages on the gender equality journey, to share strategies, experiences and achievements and to collaborate. Additional support from the Netherlands Government has enabled an exchange between organisations working in challenging and changing contexts in Fiji and on the Thai-Burma border.
In Fiji, IWDA currently partners with the Fiji Women’s Forum, Fiji Women’s Rights Movement (FWRM), femLINKpacific, and Commonwealth Local Government Forum Pacific to implement the FLOW programme. Women’s Action for Change (WAC) was also involved in the programme in 2012.
This study was commissioned under the FLOW programme in order to provide the Fiji Women’s Forum with information on public perceptions of leadership and women in political leadership. What do people in Fiji want from leaders? How do they understand leadership? To what extent do perspectives vary by sex, age, ethnicity or geographic location? Where are attitudes changing? What are productive entry points for supporting change towards improving women’s representation in political life? It was anticipated that the results of the study would inform and guide the Women’s Forum and its constituent organisations in developing voter education and advocating for greater female representation, generally and in the 2014 national elections.

A Fiji Women’s Forum Research Project, in partnership with IWdA | 3
1.2 the status of women in fiji—an overviewThe latest global Gender Gap Report (World Economic Forum, 2013) ranks Fiji at 117 out of 136 countries in terms of the Global Gender Gap Index, which measures gender disparity across four broad areas: economic participation and opportunity, educational attainment, political empowerment, and health and survival.
At the primary school level, girls have been consistently enrolled in higher numbers than boys since 1995 (Bureau of Statistics, 2012). In the period 2000-2005 the completion rate for primary schools was 100%, but this figure dropped in 2006 to 98% and again in 2007 to 90%. Primary school completion rates for girls were higher than for boys in the years 2001-2005, but lower in 2006-2007 (Ministry of National Planning, 2010).
Secondary school enrolment rates have been either equal or higher for girls than for boys since 2000. More girls than boys reached both the junior secondary school (Forms 2-4) and senior secondary school (Forms 3-7) levels.
In Fiji’s largest tertiary institution, the University of the South Pacific, women made up 37% of academic and comparable staff, and 36% of intermediate/junior staff in 2009 (Chandra, 2009).
Women undertake an estimated 52% of total work in the economy of Fiji, but receive only 27% of total income (Narsey, 2007a). Women’s participation in the labour force is approximately half that of men’s (41% compared to 81%), and women’s estimated earned income is 38% that of men’s (World Economic Forum, 2013). Women constitute 27% of wage earners in Fiji, and 37% of salary earners (Narsey, 2007b).
Reported rates of violence against women and girls in Fiji are very high: 64% of women who have ever been in an intimate relationship have experienced physical and/or sexual violence by a husband or intimate partner in their lifetime, and 24% were suffering physical or sexual partner violence at the time of the violence research (Fiji Women’s Crisis Centre, 2013).
Since Fiji gained independence from Great Britain in 1970 there have been 10 general elections. The number of parliamentary seats held by women has ranged from zero in 1987 to eight (11% of the 71-seat house) in the 1999 and 2006 elections.
Since FiJi’S independence in 1970, women’S repreSentation in parliament haS ranged
From 0% to 11% oF parliamentary SeatS

4 | Public Perceptions of women in leadership
2 methodology
This study used a mixed methods approach, comprising quantitative and qualitative methods: a questionnaire survey of 1,211 respondents, 25 focus group discussions and 8 key informant interviews.
2.1 research teamThe study was coordinated and authored by two lead researchers who live and work in Fiji. A team of researchers was recruited to carry out the questionnaire survey and to assist with the focus group discussions. The research team comprised people with prior experience in administering questionnaire surveys; most were students at the University of the South Pacific and staff or volunteers at NGOs within Fiji. A Fijian-speaking and a Hindi-speaking coordinator worked with their respective teams and also undertook the translation and transcription of the relevant focus group discussions.
The Women’s Forum and IWDA provided input and guidance, from the point of determining the focus and scope of the research to the presentation of findings and implications. Research partner organisations femLINKpacific and FWRM provided logistical support to the project.
2.2 study areasThe two urban centres from which the urban respondents were sampled were Labasa in Vanua Levu, and Suva in Viti Levu (which also includes the towns of Lami, Nasinu and Nausori). In Vanua Levu rural areas included in the sample were the villages and settlements in the Labasa cane farming areas. Rural-area respondents in Viti Levu were primarily sampled in the eastern part of the island, from north of the Suva-Nausori area, as far as the areas around Rakiraki.
Nasinu
Savusavu
Labasa
Suva
Viti LeVu
Vanua LeVu
LamiNausori
BaTevua
Rakiraki
Lautoka
Nadi
Nadi
Figure 1 urban centres on fiji’s two largest islands City town
0 40kilometres
80
Nz

A Fiji Women’s Forum Research Project, in partnership with IWdA | 5
Group profile Total
Sex Race Location
Men Women MixedIndo-Fijian Fijian Mixed Rural Urban
1 Professional urban males, tertiary educated, mid 20s to mid 40s; various races
6 6 6 6
2 Urban Methodist males, Fijian, 55-70 years 5 5 5 5
3 Urban Fijian male and female youth, 18-30 years 6 6 6 6
4 Urban Methodist male and female youth , Indo-Fijian, 18-27 years 9 9 9 9
5 Rural Fijian senior women from village A 9 9 9 9
6 Urban Methodist women, Fijian, 20-45 years 6 6 6 6
7 Rural male farm laborers, Indo-Fijian, 25-45 years 6 6 6 6
8 Rural male cane farmers, Indo-Fijian, 45 years and over 6 6 6 6
9 Rural farm laborers’ wives, Indo-Fijian, 23-43 years 8 8 8 8
10 Urban women, Indo-Fijian, 33-73 years 6 6 6 6
11 Rural cane farmer wives, Indo-Fijian, 35-60 years 6 6 6 6
12 Rural cane farmers’ sons, Indo-Fijian, 25-35 years 5 5 5 5
13 Urban males, Indo-Fijian, 25-65 years 9 9 9 9
14 Rural senior men from village A 15 15 15 15
15 Rural female youths from village A 6 6 6 6
16 Rural male youths from village A 7 7 7 7
17 Transgender women, various races, 25-40 years 7 7 7 7
18 Fijian youths, male and female, informal settlement, 25-40 years 8 8 8 8
19 Rural senior/married men from village B, 40-70 years 5 5 5 5
20 Rural women from village B, 25-75 years 6 6 6 6
21 Urban Fijian women from an informal settlement, 20-50 years 7 7 7 7
22 Fijian male rugby club members, some of whom were former prison inmates
7 7 7 7
23 Urban women, Indo-Fijian, from an informal settlement, 19-70 years 13 13 13 13
24 Female bank employees, various races, 25-50 years 11 11 11 11
25 Male bank employees, various races, 25-45 years 8 8 8 8
Total 187 79 78 30 68 87 32 79 108
table 1 focus group discussion participants
2.3 focus grouP discussions and key informant interviewsTwenty-five focus group discussions were facilitated, with a total of 187 participants. Each focus group discussion (FGD) was held with between five and fifteen participants. The focus groups were carried out mostly in groups of either men or women separately, in both rural and urban areas on Viti Levu and Vanua Levu. A breakdown of participants is provided in Table 1.
Eight key informant interviews were also conducted, with male and female past or aspiring political candidates, party leaders and leaders of religious and community organisations. All focus group discussions and key informant interviews were recorded with the permission of the participants. Recordings were then transcribed verbatim, and translated into English as necessary. Transcribed FGDs and key informant interviews were deconstructed for analysis using the program NVIVO 10.

6 | Public Perceptions of women in leadership
2.4 survey questionnaire
2.4.1 questionnaire compilation and pilotThe questionnaire was developed in dialogue with research partners in Fiji and Australia, and was constructed in such a way as to glean information from a wide scope of respondent’s perceptions on the subject of women in political leadership, and the factors that influence this. The principal components of the questionnaire focussed on the following material:
• overall agreement/disagreement with certain key statements surrounding women’s role in political leadership,
• the personal qualities and qualifications necessary for leadership, and whether these were perceived as gendered,
• awareness of the current political situation and familiarity with past political events and with historical and current female political participation,
• perceptions of women’s capabilities in various government roles,
• the factors perceived as barriers to women’s political participation,
• respondents’ personal level of political engagement and aspiration, and
• whether their voter preferences were influenced by candidate age, race and sex.
Many of the questions were phrased to be general enough to be repeated in the future to gain insight into any changes in perceptions that may be occurring.
A first draft of the questionnaire was compiled by the lead researchers and revised based on feedback from the Women’s Forum and IWDA. A workshop was then held with the research team to familiarise them with the questionnaire and give instructions on how it was to be administered. A pilot run was conducted with each member of the research team administering the questionnaire to 3-5 people. The researchers were asked to make a note of how long each questionnaire took to administer, and what problems were encountered. Based on their feedback the questionnaire was revised further.
In many cases researchers said the questionnaire took more than 40 minutes to administer and that respondents’ attention was not fully engaged as a result. In order to reduce the time taken to answer the questionnaire, certain questions were shortened and some omitted, following discussion with research partners about priorities.

A Fiji Women’s Forum Research Project, in partnership with IWdA | 7
2.4.2 language translationsThe questionnaires were translated into Fijian and Hindi. Researchers were instructed to use whichever language the respondent wished to use. The Fijian and Hindi questionnaires also had the English translation integrated so the researcher could switch between languages if necessary to ensure the respondent fully understood the questionnaire.
The Fijian dialect used was the official Bauan dialect. The Hindi used was Fiji Hindi rather than standard Hindi. Fiji Hindi is a more informal and simpler version of standard Hindi. The questionnaire was written in Latin script rather than Devanagri, as requested by the researchers.
The research team discussed potential translation problems prior to the pilot study, and translations were adjusted to reduce the potential for language nuance to impact respondents’ interpretation of the questions. For example, in Fijian a direct translation of ‘woman’ is marama. There is, however, a perception of a marama as being generally an older married woman of a certain social standing, and the word is not as inclusive as the word ‘woman’ is in English, which is taken to mean all adult females. Therefore the modification ‘marama/yalewa’ was used in the Fijian questionnaires (literally, ‘woman/girl’).
Because of the sensitive nature of some questions and the length of time taken to fully answer the questionnaire, it was essential to ensure a good rapport between respondent and researcher. To aid in this, researchers and respondents were matched in terms of gender and racial background/language fluency.
2.4.3 data entry and quality control Responses to multiple-choice questions were numerically scored and data was entered in an Access Database by two people trained by the lead researchers. The responses to open-ended questions were entered verbatim, and translated later as necessary, before being categorised for analysis.
Error rates for data entry were estimated by randomly selecting 100 questionnaires entered by each of the data entry operators, and having the other data entry operator enter them. The original and second entries were then compared and error rates calculated. As the entry of the open-ended questions was too variable in terms of capitalisation, spelling and typographical errors s to be accurate, only the numerically scored multiple-choice questions were compared. Error rates in all cases were less than 3%.
2.4.4 data analysis and report compilationData analysis was carried out in Excel, using pivot tables, and chi-square tests for determining statistical differences. Consultations with the co-convenors of the Women’s Forum and with IWDA were held at various stages of the project, to discuss the results of the survey and get feedback on how best to interpret and present them.
2.4.5 respondent demographicsA total of 1211 respondents completed the questionnaire survey. As far as practicable the demographics of the sample population matched those of Fiji’s general population in terms of gender, rural/urban distribution, race and age, as reported in the 2007 census.

8 | Public Perceptions of women in leadership
Figure 2 demographic composition of the survey questionnaire respondents, in terms of sex, location, ethnicity and age
sex Women were slightly oversampled compared with their representation in the population, constituting 53% of the total number surveyed.
2007 census: women (49%), men (51%).
rural/urban location The survey respondents were comprised of 630 urban dwellers and 571 rural dwellers (locational information was not captured for 10 respondents, 0.83% of the total sample). Researchers were instructed to ensure that respondents who identified themselves as rural dwellers were those living in settlements or villages more than 10km or a 20 minute drive away from an urban area. Villages and settlements in peri-urban areas were classified as urban.
2007 CeNSuS: urbaN DWeLLerS (51%), ruraL-DWeLLerS (49%).
age The age of legal majority in Fiji is 18 and this was taken as the minimum age for all respondents surveyed. For the purpose of analysis, respondents were grouped into three age cohorts, Under 31, 31-50, Over 50. Age data was not recorded for 7 respondents (0.58% of the sample).
2007 CeNSuS: uNDer 20 (39%), Over 20 (61%) – OF TheSe, aGeD 20-29 (30%), aGeD 30-49 (44%), aND aGeD 55 aND Over (26%).
ethnicity Fiji is a multi-ethnic country, the two largest groups being indigenous Fijians (iTaukei) and Indo-Fijians. The remainder of the population is made up of a broad mixture of other Pacific Islanders (Polynesians, Micronesians and Melanesians), as well as Asians and Caucasians (recent immigrants and descendants of colonial settlers). Racial data was unrecorded for 2 respondents. The sex ratio for each sample ethnic group was approximately 50:50.
2007 CeNSuS: FIjIaNS (57%), INDO-FIjIaNS (37%), OTher (6%).
sex
ethnicity
rural/urban location
age
Women
53% (n=642)
Fijian
56% (n=674)
31–50
41% (n=498)
urban
52% (n=630)
Men
47% (n=569)
indo-Fijian
38% (n=458)
under 31
41% (n=487)
Other
6% (n=77) Over 50
18% (n=219)
Rural
48% (n=571)

A Fiji Women’s Forum Research Project, in partnership with IWdA | 9
3 results
3.1 PercePtions and awareness of women’s Political ParticiPation
respondents were asked their level of agreement with certain statements regarding women’s status, roles and political participation, choosing one of four options: Strongly agree, Slightly agree, Slightly disagree or Strongly disagree. a neutral choice was not offered, but if respondents volunteered one (e.g. “I don’t agree or disagree”/ “It depends on the situation”), this was recorded.
Figure 3 respondents’ level of agreement to four key statements
There was strong overall agreement with the two statements that specifically addressed women’s political representation and the benefits of increasing it. A majority of respondents (61%) perceived men and women to have equal rights currently. A return to traditional roles for women was favoured by a minority (39%) of respondents, but a substantial minority.
3.1.1 under-representation of women in governmentThere was overall a high level of agreement (81%) that women are under-represented at the national government level (57% strongly agreed and 24% slightly agreed). A higher proportion of women (63%) than men (49%) strongly agreed with the statement.
3.1.2 Benefit of increased female representation72% of respondents (78% of women, 64% of men) considered that it would be better for the country if there were more women in national government. Only one in ten respondents strongly disagreed with the statement. There was a statistically significant difference in the extent of disagreement with this statement among respondents of different races: 28% of Fijians, compared to 15% of Indo-Fijians and 10% of Others, did not agree that it would benefit the country to have more women in government.
Women are under-represented in government in Fiji
it would be better for the country if there were more women in national government
in Fiji today men and women have equal rights
Women should return to their traditional roles in society
Strongly disagree
Slightly disagree Strongly agree
Slightly agree none of the above/no response
Proportion of respondents (n=1211)
7%
10%
18% 18%
38%
7%
12%
57%
45%
32%
26%19%
24%
27%
29%
13%
5%
6%
3%
4%

10 | Public Perceptions of women in leadership
Figure 4 respondents’ level of agreement with the statement ‘it would be better for the country if there were more women in national government’
Focus group participants discussing the advantages of increased female participation cited numerous reasons, mainly revolving around the idea that women bring in different perspectives and approaches from men, and that having both sexes represented leads to better decision-making and a better functioning government.
“When women are in an organisation, they normally come up with good ideas, with so much depth compared to that of the men. Some of their views are often better and different from that of men, they bring in a different perspective.”
rural Fijian woman (FGD 5, aged 40-60)
Other views, which did not favour increasing women’s participation in government, were also expressed. Some felt that although the number of women in government was much lower than the number of men, it was still a sufficient quantity.
“In my opinion it’s not proper for women to lead. The numbers are just too many, just a few should do, or better still no woman should stand at all.”
rural Fijian woman (FGD 5, aged 40-60)
“If there are more women there I feel that it will result in their being complacent and not work as hard and thus would just take up space, however if the numbers remain small, they would have to work hard.”
rural Fijian man (FGD 19, aged 40-70)
3.1.3 equal rights of men and womenOverall 61% of respondents feel that men and women currently have equal rights in Fiji, while 36% disagreed. More women than men agreed with the statement (66% of women, 56% of men), but there were no other statistically significant differences in terms of age, race or rural/urban location.
When equal rights were mentioned in the focus groups and interviews, there was a general feeling that in terms of laws and policies women had equal rights with men, but that this did not necessarily translate into full equality in practice.
“In Fiji the rights are given to the woman but I don’t think they have equal rights. We’re just saying they have equal rights but in practical ways, they are not given equal rights.”
urban youth group member (FGD 4)
total
Women
Men
indo-Fijian
indo-Fijian Women
indo-Fijian Men
Fijian
Fijian Women
Fijian Men
Other
Other Women
Other Men
Proportion of respondents, different demographic categories
Strongly disagree
Slightly disagree Strongly agree
Slightly agree none of the above/no response
12%
9%
16%
9%
14%
10%
4%
12%
59%
15%
16%
20%
10%
7%
14%
6%
14%
3%
9%
9%
20%
45%
55%
34%
55%
40%
38%
68%
47%
41%
31%
18%
27% 6%
23% 6%
30% 6%
25% 5%
25% 7%
51% 1%
19% 6%
25% 7%
41%
31% 4%
25% 8%
60% 2%

A Fiji Women’s Forum Research Project, in partnership with IWdA | 11
19%
17%23%
23%16%
29%
14%17%
22%
33%14%
35%
23%20%
11%
18%18%
9%
28%22%
13%
22%16%
15%17%
18%27%
38%
45%31%
47%30%
57%
63%32%
73%
31%28%
43%
43%37%
33%
51%47%
32%
33%26%
34%
43%33%
40%51%
25%36%
26%
25%26%
11%38%
5%
12%36%
11%40%
10%
19%24%
44%
17%21%
51%
22%27%
35%
18%34%
34%16 %
33%20%
13% 4%
10% 3%17% 3%
15% 4%13% 3%
8% 1%
9% 2%12% 3%
5%
21% 4%15% 3%
10% 2%
11% 4%17% 2%
10% 2%
10% 4%12% 2%
7% 1%
13% 4%22% 3%
14% 4%
12% 5%15% 2%
10% 1%11% 5%
22% 2%12% 5%
0% 20% 40% 60% 80% 100%
total
WomenMen
indo-FijianFijianOther
indo-Fijian womenFijian womenOther women
indo-Fijian menFijian menOther men
30 and under31–50Over 50
Women 30 and underWomen 31–50Women Over 50
Men 30 and underMen 31–50Men Over 50
Rural women
urban men
urban women
urbanRural
Rural men
Strongly disagree
Slightly disagree Strongly agree
Slightly agree none of the above/no response
Figure 5 respondents’ level of agreement with the statement ‘women should return to their traditional roles in society’

12 | Public Perceptions of women in leadership
3.1.4 women’s traditional rolesSome 39% of respondents were in favour of women returning to their traditional roles in society, compared to 57% who disagreed with this statement.
Of the four statements about women’s political representation, this generated the widest range of responses, and so responses were examined further according to demographic variables.
A return to traditional roles had higher support among men (43%) compared to women (35%), and among rural-dwellers (49%) compared to urban-dwellers (30%). There were also significant differences by race in responses to this statement: 38% of Fijians strongly agreed, compared to 11% of Indo-Fijians and only 5% of other races.
Age was also a factor with 44% of people aged over 50 in strong agreement with women returning to traditional roles, compared to 19% of the under 30s. The difference in perceptions between younger and older was more marked among women than among men: over half (51%) of women over 50 strongly favoured a return to traditional roles for women, compared to just 17% of women under 30.
Approximately half of all rural dwellers (49%) favoured a return to traditional roles for women, with one in three (34%) in strong agreement with the statement, nearly twice the rate of strong agreement (18%) among urban dwellers.
Almost a quarter (24%) of all respondents agreed (either slightly or strongly) with two of the previous statements simultaneously: that is, they saw benefit to the country in having a greater representation of women in government, but also felt that women should return to their traditional roles in society. While the survey did not allow for respondents to explain the reasons for their responses, these apparently contradictory perspectives suggest both that gender norms are changing, and that there is some ambivalence about these changes and their implications.
overall 61% oF reSpondentS Felt that men and women currently have equal rightS in FiJi,
while 36% diSagreed.

A Fiji Women’s Forum Research Project, in partnership with IWdA | 13
Figure 6 responses to the question ‘was the current government elected?’
3.1.5 general political awarenessThree questions were asked to gauge people’s broad understanding of the current political situation. Participants were first asked if the current government was elected. They were then asked to recall the year of the last national election and the last local government election.
Overall, 9% of respondents thought that the current government was elected. This viewpoint, while a minority one, was statistically more prevalent among women, Fijians and rural dwellers, as shown in Figure 7. There was no significant difference in response between age groups.
Figure 7 Proportion of respondents who think that the current government was elected
Prop
ortio
n of
resp
onde
nts (
n=12
11)
Don’t know/no response
Yes it was elected
no it was not elected
0
20
40
60
80
100
6% 9%
85%
0
3
6
9
12
15
Overall Female Male indo- Fijian
itaukei Other Rural urban
9%
13%
5%
7%
12%
1%
13%
6%

14 | Public Perceptions of women in leadership
Figure 8a what year were the last national government elections held?
Respondents were asked two separate questions, about the year in which the last national election, and the last local government election, was held.
The non-response rate was high for both questions; many respondents did not answer the question or said that they did not know or could not remember. The non-response rate was over a quarter of the sample (27%) for the question on the last national elections and almost three quarters (74%) for the question on the last local government elections. This suggests that the political constraints that have operated since the coup in 2006, including the absence of elections and constraints on organising and holding public meetings, have impacted on civic knowledge and on the willingness to speak about politics.
Figure 8b what year were the last local government elections held?
Respondents’ answers were grouped into three categories: the correct answer (2006 for national elections, 2005 for local elections), any year before the correct year, and any year after the correct year.
53% of respondents correctly identified the year of the last national elections, compared to only 10% for local government elections. Incorrect answers for the question on national elections ranged from ‘1987’ to ‘2011’, with the most frequent incorrect answers being the years 2005 (80 respondents) and 2000 (40 respondents). The most common incorrect answer for local government was 2006, presumably because most people assumed it had been the same year as the last national elections. Awareness was higher in urban areas: some 14% of respondents in urban areas correctly named the year of the most recent local elections, compared to 5% in rural areas.
0
10
20
30
40
50
60
70
80
no response/ don’t know
no response/ don’t know
Post-2006 Post-20052006 2005Pre-2006 Pre-2005
0
10
20
30
40
50
60
27%
4%
13%10% 3%
16%
74%53%

A Fiji Women’s Forum Research Project, in partnership with IWdA | 15
Figure 9 out of 71 seats contested in the 2006 national election, how many were won by women?
3.1.6 visibility/awareness of female participation in politicsIn both the questionnaire survey and the focus group discussions, women’s actual level of participation was generally underestimated. In the focus groups, when asked to guess how many of the 381 candidates standing in the national election in 2006 were women, over half the responses were numbers less than 10. Only 15 responses were over 26. Most participants who had guessed low numbers expressed surprise that as many as 27 women had stood for election.
“I thought a lot of women were just into housework, looking after the babies while the men do the work, so hearing that there were 27 running, it surprised me.”
urban Fijian woman (FGD 21, aged 20-50)
Figure 10 name a political leader in fiji whose leadership style you view positively
“In 2006, though there were a lot of women, but for us the voters, we didn’t know who they were, unless they came visiting to our communities or constituency, to come and talk and tell us of their manifesto.”
urban Fijian woman (FGD 6, aged 20-45)
In the survey, when asked how many of 71 seats contested in the 2006 election were won by women, 65% of respondents did not know or did not answer the question. Of the 35% of respondents who gave an answer, the vast majority of these (77% or 27% of the total sample) under-estimated the actual figure. Only 5% of respondents overall gave an answer between 6 and 10 (the correct figure being 8).
Respondents were asked to name “a political leader whose leadership style you view positively”. Overall 79% of respondents named a man and 6% named a woman. 15% of respondents did not name anyone. The breakdown of responses by sex is shown below. Female respondents were three times as likely to name a woman compared to male respondents (9% and 3% respectively).
named a male leader
named a female leader no response
0
10
20
30
40
50
70
80
60
90
Don’t know/ no answer
More than 10 6–10 1–5 none Overall Women Men
0
10
20
30
40
50
60
80
70
65%
3% 3% 3% 13%9%6%
15%5%
24%
75%79%
17%
84%

16 | Public Perceptions of women in leadership
Figure 11 name a political leader in fiji whose leadership style you view negatively
Figure 12 highlights the diversity of leadership figures identified.
Respondents were then asked to name “a political leader whose leadership style you view negatively”. The non-response rate this time was almost double that of the previous question (29%). The overall percentage of respondents who named a woman dropped to 1%, when asked about negative rather than positive leadership.
The diversity of male leaders named was greater than that of female leaders, for questions about both positive and negative examples of leadership. The total number of male and female leaders identified was greater when asked about positive leadership compared to when asked about negative leadership.
Figure 12 number of male and female leaders named by men and women when asked about positive and negative leadership
Three times as many male leaders were named when asked about positive leadership (36 compared to 12 female leaders).
Women named a greater diversity of female leaders, compared to men, when asked about positive leadership styles (women named 12, men named 5).
00
10
20
30
40
50
10
60
20
70
3080
Women
Positive leadership negative leadership
MenOverall WomenWomen MenMen
named a man
named a woman
no response
70%
1% 0.5% 1%
29%
76%
35%
23%
26%
12%
5%3% 3%
22%20%
28%
65%

A Fiji Women’s Forum Research Project, in partnership with IWdA | 17
3.2 PercePtions of leadershiP attributes and the caPability of women to lead
3.2.1 Political leadership capability – is it gendered?Respondents were asked to indicate their level of agreement with the statement “Men generally make better political leaders than women”. The majority of respondents (59%) disagreed with the statement, with almost a quarter (24%) in strong disagreement. Just over one in five respondents (21%) strongly agreed with the statement.
Agreement with the statement that men generally make better political leaders than women was more common among men, rural dwellers, Fijians and older people. There was also a significant generational difference: almost half (48%) all respondents aged over 50 felt that men were better political leaders, compared to 32% of the under 30s.
total
WomenMen
indo-FijianFijianOther
indo-Fijian womenFijian womenOther women
indo-Fijian menFijian menOther men
30 and under31–50Over 50
Women 30 and underWomen 31–50Women Over 50
Men 30 and underMen 31–50Men Over 50
Rural women
urban men
0% 20% 40% 60% 80% 100%
urban women
Ruralurban
Rural men
35% 24% 21% 17%
23%40% 21% 12%25%29% 22% 22%
25%39% 15% 16%23%31% 27% 17%
27%44% 10% 17%
22%46% 18% 8%24%35% 25% 14%
24%59% 16%
28%31% 13% 24%22%26% 30% 22%
30%30% 20% 18%
25%39% 16% 16%23%34% 23% 17%
23%26% 30% 18%
24%45% 15% 13%21%44% 23% 10%
26%25% 29% 16%
27%33% 18% 20%25%24% 23% 25%
18%29% 31% 22%
20%32% 27% 19%27%38% 16% 15%
19%38% 28% 12%27%43% 13% 12%
22%24% 26% 27%27%33% 19% 18%
3%
4%2%
5%2%2%
6%2%1%
4%
2%
4%3%3%
3%2%4%
2%3%
2%4%
3%5%1%3%
Figure 13 respondents’ level of agreement with the statement ‘men generally make better political leaders than women’
“Even though women may be well educated now, there are some things that I think they still lack such as some decisions or judgments that they make. I don’t think they have what it takes to ensure the safekeeping of our culture and all related matters.
Women will be easily swayed by others’ opinions when having to make a decision and would take some time to make a final decision or in some instance don’t make any at all.”
rural Fijian man (FGD14, over 50)
Strongly disagree
Slightly disagree Strongly agree
Slightly agree none of the above/no response

18 | Public Perceptions of women in leadership
3.2.2 leadership characteristics — what’s important? Respondents were given a list of certain personality traits and for each one were asked whether they thought that the trait was more true of men, more true of women or equally true of both men and women. Later in the questionnaire, they were given the same traits and asked how important each one was for a leader to have: absolutely essential, very important, slightly important or not important at all.
The three characteristics that respondents identified most often as absolutely essential in a political leader were hardworking, intelligent and honest. Over 80% of respondents also classified articulate, caring and creative as being absolutely essential or very important. Age and gender breakdowns mirrored the overall trend.
arrogant
aggressive
Stubborn
Submissive
emotional
ambitious
assertive
Religious
articulate
Humble
Honest
Creative
intelligent
Caring
Hardworking
absolutely essential
Very important
0% 20% 40% 60% 80% 100%
Figure 14 Proportion of respondents who felt these traits to be absolutely essential or very important in a leader
The focus group discussions yielded several other characteristics of good leaders that participants felt were very important, and which were mentioned several times across all groups. The most frequently mentioned was that a leader should treat everyone equally and not discriminate or treat some people better than others. In particular some participants mentioned that good leaders were not racist.
“The leader should be a patriotic person and should be equal to everyone regardless of their economic status - whether they are poor or rich, everyone should be treated with equality. The leader should look after their people first then themselves they should not be biased.”
rural Indo-Fijian man (FGD 7, aged 25-45)
Having empathy and being a good listener were also attributes raised in many of the focus groups. Being caring, and more specifically, providing help and service to the poor and needy, were also discussed at length.
Some traits were classified as being equally true of men and women more frequently than others. 81% of respondents said that being intelligent was equally true of men as of women, compared to just 32% who said the same of being aggressive (56% said it was more true of men). Other traits that were assigned most often to men were being arrogant (44%), assertive (29%) and stubborn (28%). Traits that were assigned most often to women were being emotional (64%), humble (46%), submissive (45%) and caring (43%).
7%
5%
7%
31%
40%
51%
45%
49%
44%
50%
53%
56%
71%
68%
72%
21%
28%
27%
34%
33%
35%
32%
24%
27%
25%
6%
9%
8%
27%
22%

A Fiji Women’s Forum Research Project, in partnership with IWdA | 19
Figure 15 Proportion of respondents who feel that certain characteristics are more true of men or of women
All three of the traits classified most frequently as absolutely essential in a leader (hardworking, honest, intelligent) were perceived as being equally typical of both men and women by more than two thirds of respondents. Of respondents who said that these traits were more true of either men or women, the trait was more often ascribed to women than to men; for example 22% said that being hardworking was more true of women, compared to 11% who said it was more true of men. Indeed, not only were the top three leadership traits regarded as either equally typical of men and women or more typical of women, 12 of the 15 leadership traits most commonly mentioned as essential or very important for a leader were considered as either equally typical of men and women or more typical of women.
These findings suggest that a focus on leadership characteristics, rather than specific examples of women ‘leaders’, may prove a more productive entry point for efforts to increase women’s leadership. While the results of this study show that most people continue to think of a political ‘leader’ as male, the leadership qualities they value are regarded as being equally or more often associated with women as with men.
Because women constituted a slightly larger proportion of the questionnaire sample than men, and to see whether a respondent’s sex had an influence on how they answered, responses to the top three traits (hardworking, intelligent and honest) were analysed separately by sex.
aggressive
emotional
Stubborn
Submissive
arrogant
Humble
assertive
Caring
Honest
ambitious
Hardworking
Creative
Religious
articulate
intelligent
More true of men
equally true of men and women
More true for women
Percentages may be greater than 100 due to rounding
0% 20% 40% 60% 80% 100%
56%
2%
28%
12%
44%
6%
29%
4%
18%
9%
14%
6%
11%
7%
6%
32%
34%
43%
43%
45%
48%
52%
53%
57%
60%
61%
67%
68%
70%
81%
12%
64%
29%
45%
11%
46%
19%
43%
24%
31%
26%
26%
22%
23%
13%

20 | Public Perceptions of women in leadership
Hardworking Intelligent Honest
Overall More true of men 11% 6% 6%
More true of women 22% 13% 26%
Equally true of men and women 68% 81% 67%
Female respondents More true of men 6% 3% 5%
More true of women 29% 19% 26%
Equally true of men and women 65% 78% 68%
Male respondents More true of men 15% 10% 8%
More true of women 14% 6% 26%
Equally true of men and women 71% 84% 66%
table 2 Perceptions of key leadership traits by sex of respondents
Female respondents Female respondents Female respondentsMale respondents Male respondents Male respondentsHardworking Intelligent Honest
0
5
10
15
20
30
25
More true of men
More true of women
6%
3%5%
8%
26%26%
6%
10%
19%
15% 14%
29%
Figure 16 Proportion of male and female respondents who feel that certain characteristics are more true of men or of women
Women were far more likely to classify being hardworking, intelligent and honest as more typically female traits than male traits. Men agreed with women that being Honest was a trait more true of women, but classified being intelligent and hardworking as more true of their own sex, although not to such a marked degree as women did.

A Fiji Women’s Forum Research Project, in partnership with IWdA | 21
Figure 17 Proportion of male and female respondents who feel that certain characteristics are more true of men or of women
The three characteristics that were least valued by respondents (and most often classified as being not important at all) were: arrogant, stubborn and aggressive. arrogant and aggressive were most often classified as typically male traits than female traits. Being stubborn was classified mostly as a male trait by women and mostly as a female trait by men.
Stubborn Aggressive Arrogant
0
20
40
80
60
More true of men
More true of women
35%
20% 20%
7% 7%
16%17%
40%
48% 47%40%
63%
Female respondents Female respondents Female respondentsMale respondents Male respondents Male respondents
22 | Public Perceptions of women in leadership
Speak English fluently
Have completed secondary school
Have a university education
Have a history of working with the local community to develop proposals
Have a strong and visible presence within the community
Speak Fijian fluently
Speak Hindi fluently
Have previous experience in politics
Come from a wealthy family
Come from a family with a strong political background
Come from a chiefly Fijian family
absolutely essential
Very important
0% 20% 40% 60% 80% 100%
46% 35%
35% 29%
32% 26%
24% 28%
6% 8%
4% 6%
4% 4%
69% 26%
68% 27%
62% 27%
50% 35%
Figure 18 Qualifications, abilities and experience deemed absolutely essential or very important in a political leader
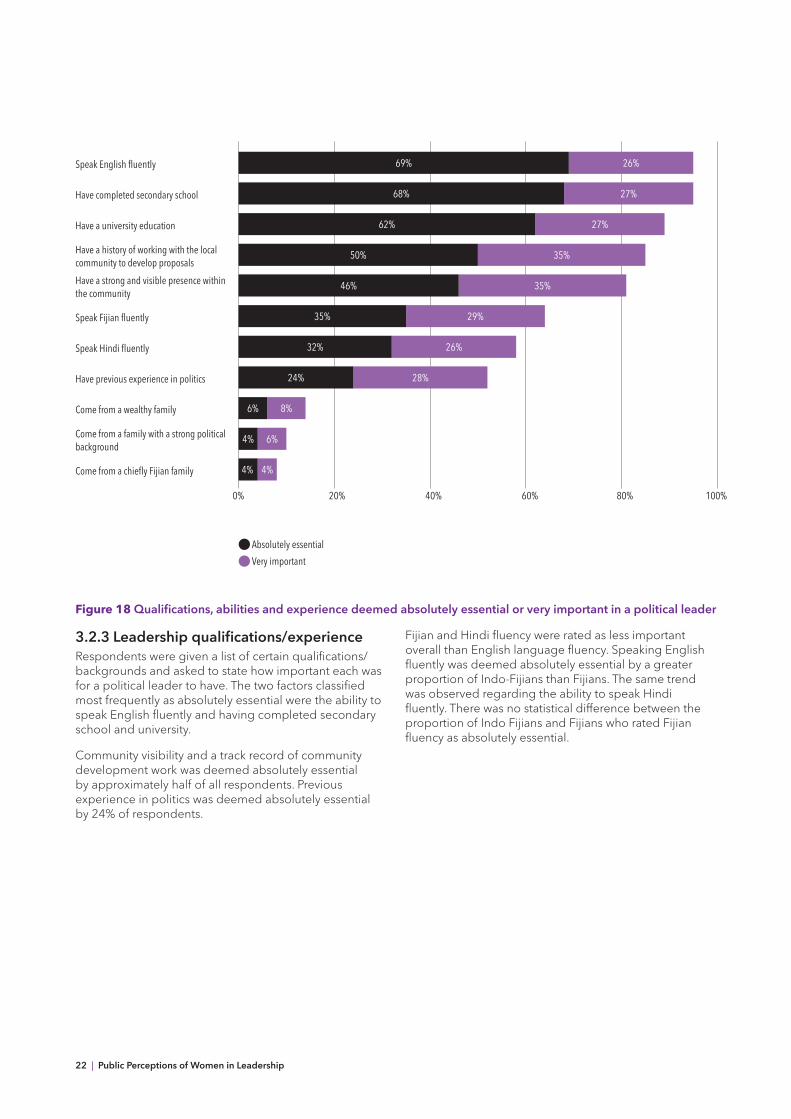
3.2.3 Leadership qualifications/experienceRespondents were given a list of certain qualifications/backgrounds and asked to state how important each was for a political leader to have. The two factors classified most frequently as absolutely essential were the ability to speak English fluently and having completed secondary school and university.
Community visibility and a track record of community development work was deemed absolutely essential by approximately half of all respondents. Previous experience in politics was deemed absolutely essential by 24% of respondents.
Fijian and Hindi fluency were rated as less important overall than English language fluency. Speaking English fluently was deemed absolutely essential by a greater proportion of Indo-Fijians than Fijians. The same trend was observed regarding the ability to speak Hindi fluently. There was no statistical difference between the proportion of Indo Fijians and Fijians who rated Fijian fluency as absolutely essential.

A Fiji Women’s Forum Research Project, in partnership with IWdA | 23
Figure 19 Proportion of respondents who consider the ability to speak English/Hindi/Fijian fluently as absolutely essential in a political leader
The factors that the majority of respondents classified as not important at all were those concerning family background and connections.
Coming from a chiefly Fijian family was deemed not important at all by 79% of respondents. A breakdown of responses by race showed that Fijians were more likely to assign some importance to this than Indo-Fijians, but 74% of Fijians still classified it as not important. The comment below, from a focus group discussion, indicates that traditional status can resonate differently in different contexts, and election to parliament may serve as a status equaliser.
“If I’m in parliament, and men with chiefly status were also in parliament, I would speak freely as being elected into parliament has given me that right. It depends on the context really; it’s different in the village setting and different in the political setting.”
rural Fijian woman (FGD 5, aged 40-60)
Speak English fluently Speak Hindi fluently Speak Fijian fluently
0
20
40
80
60
indo-Fijian respondents
Fijian respondents
77%
43%39%
63%
26%33%

24 | Public Perceptions of women in leadership
Figure 20 Perceptions regarding the ability of women and men to undertake particular roles or activities in government
3.2.4 actual government rolesRespondents were given a list of 13 roles or activities that are carried out by political leaders and asked to state in relation to each whether they considered it was better carried out by men or by women, or if both men and women were equally good at the role/activity.
Men’s and women’s responses were analysed separately. The three roles that both men and women considered were best done by men in government were representing Fiji overseas, unifying the people of Fiji and preventing further coups.
The roles that both men and women considered were best done by women tended to be the more specific roles that focussed on women and ‘women’s issues’, as well as financial management. Women were also deemed to be better at resolving conflicts and resisting bribes (which correlates well with the high proportion of respondents who felt that Honesty was a trait more true of women than men).
improving the status of women in Fiji
Resolving conflicts
Resisting bribes
addressing sexual and physical violence
Managing budgets and expenditure
Preventing further coups
Working out compromise
Representing Fiji overseas
Representing the poor
unifying the people of Fiji
Protecting the environment
Communicating with people
addressing the concerns of their constituents
Men are better at it
Men and women equally good at it
Women are better at it
0% 20% 40% 60% 80% 100%
7% 37% 56%
6% 48% 46%
12% 48% 39%
12% 49% 38%
13% 55% 32%
29% 58% 12%
20% 61% 19%
29% 62% 8%
9% 64% 27%
22% 68% 9%
13% 71% 15%
13% 62% 12%
9% 75% 16%

A Fiji Women’s Forum Research Project, in partnership with IWdA | 25
Female respondents Male respondents
Men better at it
Women better at it
Men better at it
Women better at it
Both male and female respondents agree that men are better at:
Representing Fiji overseas 24% 11% 36% 4%
Unifying the people of Fiji 16% 12% 29% 6%
Preventing further coups 28% 13% 31% 11%
Both men and women agree that women are better at:
Resisting bribes 14% 38% 10% 42%
Improving the status of women in Fiji 6% 61% 8% 51%
Resolving conflicts 4% 49% 8% 43%
Working to address issues of sexual and physical violence 11% 44% 14% 32%
Managing budgets and expenditure 10% 40% 17% 23%
Representing the interests of people living in poverty 6% 31% 11% 22%
Respondents each say their own sex is better at:
Working out compromises 15% 23% 25% 14%
Protecting the environment 8% 20% 19% 9%
Communicating with people 6% 21% 13% 10%
Listening to the concerns of their constituency and raising them in parliament 13% 16% 16% 8%
table 3 Perceptions regarding the ability of women and men to undertake governing roles or activities, by sex

26 | Public Perceptions of women in leadership
3.3 women’s willingness to stand for election
3.3.1 Public perceptions of what holds women backRespondents were given a prepared list of possible reasons why fewer women than men stand for election, and respondents were asked to classify them as a major reason, minor reason or not a reason for there being fewer women than men standing for election.
Figure 21 shows that those reasons associated with women’s individual abilities, personalities or aptitudes are viewed as less significant factors for their lower participation in politics than reasons that pertain to socioeconomic or cultural aspects/barriers.
Women don’t have encouragement and support from their communities
Women face cultural barriers to participating in politics
Women face discrimination
Political parties don’t encourage women to stand for election
Women don’t have the financial support necessary to stand for election
Women’s responsibilities in the home don’t leave time for politics
Women are not interested in politics
Women lack the confidence to stand for election
Women don’t have the necessary experience
Women don’t have the educational qualifications for politics
Major reason
Minor reason
not a reason
none of the above/no response
60%
59%
53%
46%
41%
39%
36%
32%
19%
15%
10% 1%
15% 1%
13% 1%
16% 1%
23% 1%
26% 1%
28% 1%
31% 1%
49% 1%
55% 2%
29%
25%
33%
37%
35%
34%
35%
36%
31%
28%
0% 20% 40% 60% 80% 100%
Figure 21 Participant perceptions of reasons why fewer women than men stand for election
Three reasons were assessed by over half of all respondents as being major explanations for why more women don’t stand for election: a lack of community support and encouragement, cultural barriers and discrimination.
The two lowest-ranked reasons were lack of experience and lack of education.
Some 55% of respondents said that lack of educational qualifications was not a factor explaining women’s lower participation as candidates in elections.
Overall men and women identified the same factors as being major reasons for why women were not putting themselves forward as candidates for political office to the same extent as men. Slightly more men (37%) than women (28%) cited women’s lack of confidence as being a major reason why they did not stand for election.

A Fiji Women’s Forum Research Project, in partnership with IWdA | 27
Figure 22 Perceptions of men and women on what constitutes major reasons why fewer women than men stand for election
Lack of interest in politics was considered a major reason that women didn’t stand for elections by 36% of respondents, as a minor reason by 35% and not a reason at all by 28%. Comments from focus group participants were broadly equivalent, with many stating that they thought women were not interested in politics, and that their lack of political representation was largely attributable to their own lack of motivation.
“If ladies can be CEOs in organizations then why can’t they be politicians? I haven’t seen any women trying to participate in politics…women are lazy, they haven’t tried.”
rural Indo-Fijian man (FGD12, aged 25-35)
“Women are educated, but they are not interested in politics, women don’t want the extra burden as they have already a lot of household responsibilities to fulfil.”
rural Indo-Fijian woman (FGD11, aged 35-60)
However, another common response from the focus groups was that women were stopped from doing work outside the home, in general and in relation to politics, by their husbands or families – either actively prohibited by their husbands, or prevented by a lack of time to do work aside from household duties.
“Women are interested in politics and they want to progress ahead, but they are stopped at home by their husbands, they are told to stay home and fulfil their household responsibilities.”
rural Indo-Fijian woman (FGD11, aged 35-60)
“Politics is not as easy as an 8 to 4 job. I can see that I come home at 11pm or 12am ...when you’re a public figure, people will think they own you; they call you up and demand the time off you and this can be a lot of pressure on women with families.”
(Key informant interview – political party member)
Women don’t have encouragement and support from their communities
Women face cultural barriers to participating in politics
Women face discrimination in politics
Political parties don’t encourage women to stand for election
Women’s responsibilities in the home don’t leave time for politics
Women don’t have the financial support necessary to stand for election
Women are not interested in politics
Women lack the confidence to stand for election
Women don’t have the necessary experience
Women don’t have the educational qualifications for politics
Men
Women
0% 20% 40% 60% 80% 100%
58%
59%
54%
48%
40%
45%
40%
37%
21%
16%
62%
59%
52%
45%
38%
38%
33%
28%
18%
15%

28 | Public Perceptions of women in leadership
3.3.2 would i stand? When asked if they would consider standing in the elections in 2014, 21% of respondents said yes. There were statistical differences in the demographics of those
who would consider standing: more males than females, more Others and Fijians than Indo-Fijians and the under 30s more than the over 50s. The rural-urban difference was not statistically significant.
Overall Female Male Rural urban indo-Fijian itaukel Other 30 and under
31–50 Over 50
0
5
10
15
20
30
25
21% 18% 19%17%
24% 23% 23%
30%
25%
19% 18%
Figure 23 breakdown of ‘yes’ response to question about standing for elections in 2014
Respondents had been previously asked whether anyone in their family had ever stood for election. Those that had a family member already stand for election were more likely to themselves say that they would consider standing for election (36%, compared to 20% of those who had no family member stand previously).
3.3.3 why wouldn’t i stand?The respondents who said that they would not consider standing in the 2014 elections were then asked ‘Why not?’. Their responses were grouped into the following 7 categories:
Lack of Education/Qualifications/Knowledge
31% of responses cited a lack of education, knowledge or qualifications as the reason why they would not consider standing in the next election. This category included responses such as “I don’t know anything about politics” and “Politics is only for the educated”.
not interested/don’t want to
30% of responses could be categorised as being uninterested in politics, or simply not wanting to go into politics. This category included responses such as “Politics isn’t for me” and “I don’t want to be a politician”.
too young/too old
11% of responses made reference to the respondent’s age, saying that they were either too young (42 responses) or too old (38 responses). 95% of the ‘too young’ responses came from respondents aged 30 and under. 89% of the ‘too old’ responses came from respondents aged over 50.
no time/have a job already
8% of responses comprised statements such as “I don’t have the time”, or “I am a student/have a job already”.
Lack of financial resources
A lack of money or financial backing was stated in 6% of responses.
family/household responsibilities
If the respondent specifically stated household responsibilities as the reason why they would not stand this was put in a separate category from “no time/have a job already”. Only 2% of responses fell into this category (all of them from women).
other
All other responses were categorised together and comprised 12% of the total, including a variety of responses such as: “I don’t know what party I would stand for”, and “Things will not change so there is no use”.

A Fiji Women’s Forum Research Project, in partnership with IWdA | 29
Figure 24 reasons given by respoondents for why they would not consider standing for election
Men and women were broadly similar in the reasons they cited, with a few key differences. A greater proportion of men stated that they were not interested in standing for election compared to women. Slightly more women considered themselves ruled out of standing by being either too young or too old.
Figure 25 sex breakdown of key reasons respondents would not stand for election
Other differences became apparent when comparing rural and urban respondents, the most striking being that rural-dwellers were more likely to refer themselves as lacking education or qualifications, whereas urban-dwellers more frequently expressed a lack of interest. Rural-dwellers also named a lack of financial resources more often than urban dwellers.
31%
12%
30%
11%
8%
6%2%
Dont have the education/qualification/knowledge
not interested/don’t want to
too young/too old
no time, have a job already
Lack of financial resources
Family/household responsibilites
Other
not interested/ don’t want to
too young/too old Family/household responsibilites
Men
Women
0
5
10
15
20
25
30
35
35%
8%
0%
26%
13%
4%
30 | Public Perceptions of women in leadership
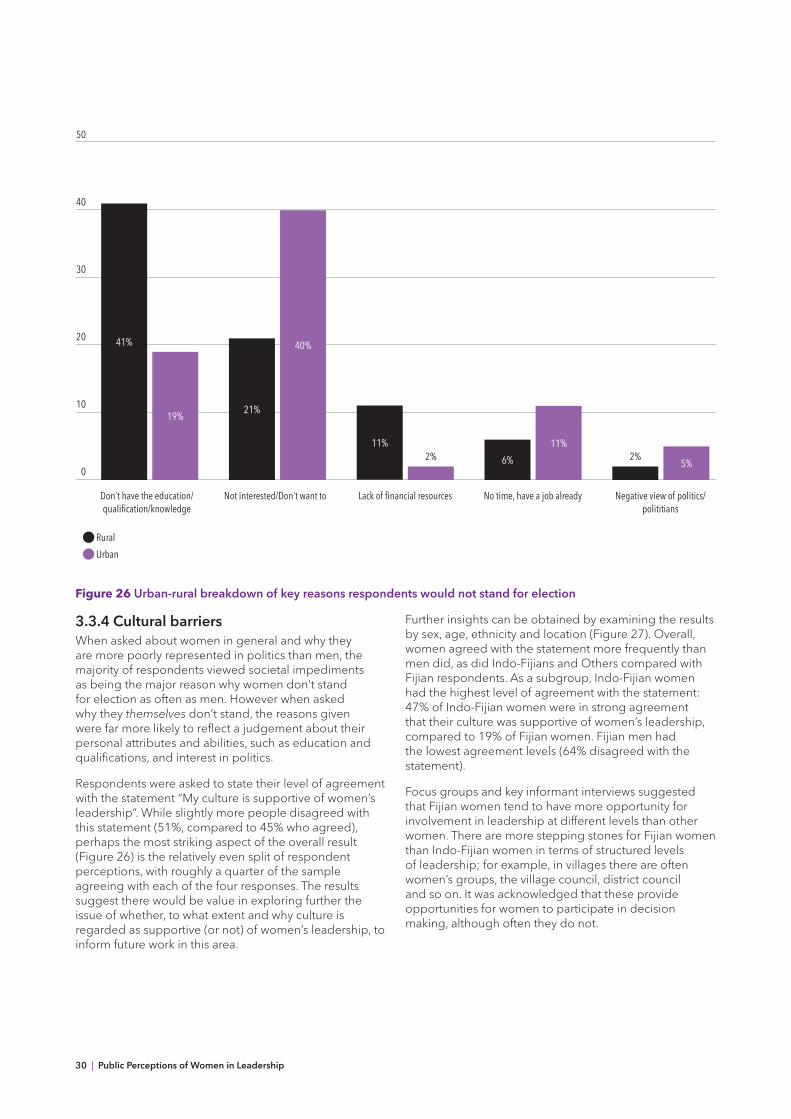
Figure 26 urban-rural breakdown of key reasons respondents would not stand for election
3.3.4 cultural barriersWhen asked about women in general and why they are more poorly represented in politics than men, the majority of respondents viewed societal impediments as being the major reason why women don’t stand for election as often as men. However when asked why they themselves don’t stand, the reasons given were far more likely to reflect a judgement about their personal attributes and abilities, such as education and qualifications, and interest in politics.
Respondents were asked to state their level of agreement with the statement “My culture is supportive of women’s leadership”. While slightly more people disagreed with this statement (51%, compared to 45% who agreed), perhaps the most striking aspect of the overall result (Figure 26) is the relatively even split of respondent perceptions, with roughly a quarter of the sample agreeing with each of the four responses. The results suggest there would be value in exploring further the issue of whether, to what extent and why culture is regarded as supportive (or not) of women’s leadership, to inform future work in this area.
Further insights can be obtained by examining the results by sex, age, ethnicity and location (Figure 27). Overall, women agreed with the statement more frequently than men did, as did Indo-Fijians and Others compared with Fijian respondents. As a subgroup, Indo-Fijian women had the highest level of agreement with the statement: 47% of Indo-Fijian women were in strong agreement that their culture was supportive of women’s leadership, compared to 19% of Fijian women. Fijian men had the lowest agreement levels (64% disagreed with the statement).
Focus groups and key informant interviews suggested that Fijian women tend to have more opportunity for involvement in leadership at different levels than other women. There are more stepping stones for Fijian women than Indo-Fijian women in terms of structured levels of leadership; for example, in villages there are often women’s groups, the village council, district council and so on. It was acknowledged that these provide opportunities for women to participate in decision making, although often they do not.
Rural
urban
Don’t have the education/qualification/knowledge
not interested/Don’t want to Lack of financial resources no time, have a job already negative view of politics/polititians
0
10
20
30
40
50
41%
19%21%
11%2% 2%6% 5%
11%
40%

A Fiji Women’s Forum Research Project, in partnership with IWdA | 31
Figure 27 my culture is supportive of women’s leadership
total
Women
urban
Men
Rural
indo-Fijian
indo-Fijian Women
indo-Fijian Men
30 and under
Women 30 and under
Men 30 and under
Fijian
Fijian Women
Fijian Men
31–50
Women 31–50
Men 31–50
Other
Other Women
Other Men
Over 50
Women Over 50
Men Over 50
Proportion of respondents, different demographic categories
26%
21%
32%
24%
29%
26%
27%
22%
10%
28%
10%
42%
26%
23%
23%
30%
25%
20%
21%
21%
25%
39%
31%
25%
24%
27%
20%
31%
16%
33%
17%
16%
28%
16%
15%
38%
13%
22%
26%
31%
22%
23%
28%
21%
29%
35%
23%
29%
17%
24%
22%
35%
15%
19%
47%
19%
47%
23%
11%
25%
26%
22%
20%
29%
30%
26%
22%
14%
12%
22% 4%
23% 3%
20% 4%
28% 4%
15% 3%
20% 3%
20% 5%
42%
21% 6%
22% 3%
21% 6%
19% 1%
19% 6%
40%
26% 3%
19% 3%
20% 4%
24% 5%
23% 4%
20% 5%
28% 4%
14% 4%
19% 3%
0% 20% 40% 60% 80% 100%
Strongly disagree
Slightly disagree Strongly agree
Slightly agree none of the above/ no response
Percentages may be greater than 100 due to rounding
32 | Public Perceptions of women in leadership
3.4 attitudes towards voting for women
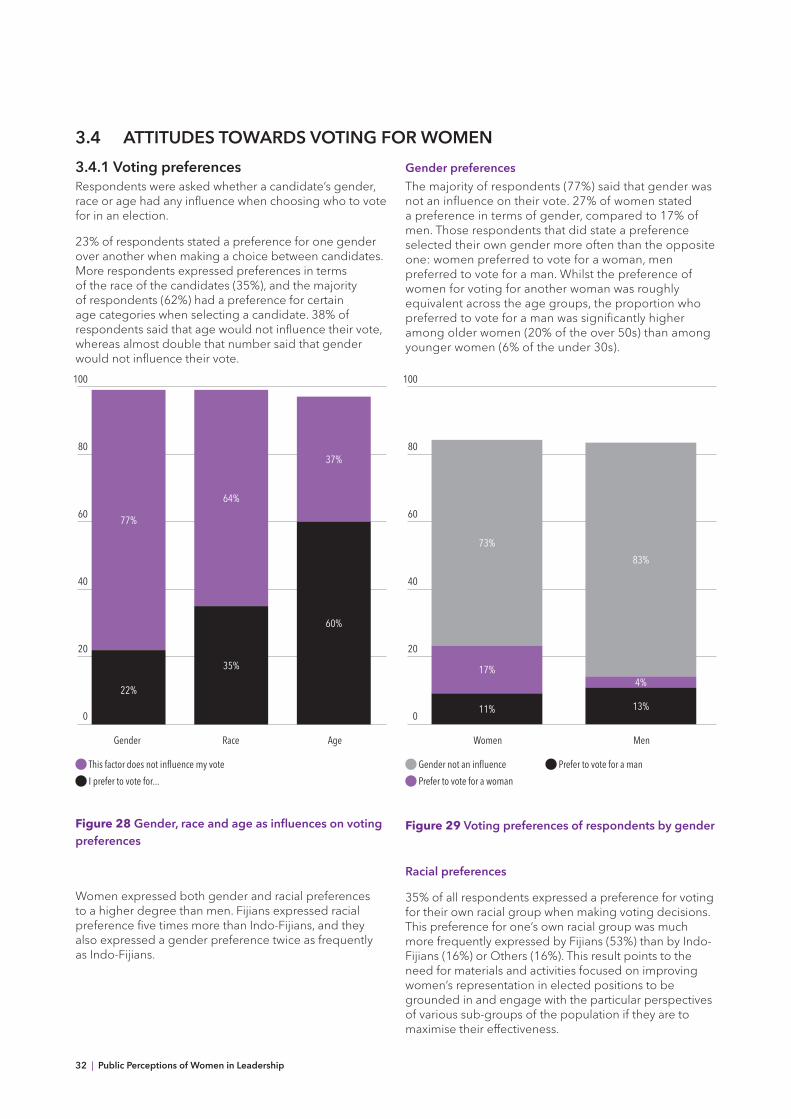
3.4.1 voting preferencesRespondents were asked whether a candidate’s gender, race or age had any influence when choosing who to vote for in an election.
23% of respondents stated a preference for one gender over another when making a choice between candidates. More respondents expressed preferences in terms of the race of the candidates (35%), and the majority of respondents (62%) had a preference for certain age categories when selecting a candidate. 38% of respondents said that age would not influence their vote, whereas almost double that number said that gender would not influence their vote.
gender preferences
The majority of respondents (77%) said that gender was not an influence on their vote. 27% of women stated a preference in terms of gender, compared to 17% of men. Those respondents that did state a preference selected their own gender more often than the opposite one: women preferred to vote for a woman, men preferred to vote for a man. Whilst the preference of women for voting for another woman was roughly equivalent across the age groups, the proportion who preferred to vote for a man was significantly higher among older women (20% of the over 50s) than among younger women (6% of the under 30s).
Gender
This factor does not influence my vote
i prefer to vote for...
22%
35%
60%
77%
64%
37%
0
20
40
60
80
100
Race age Women Men
Gender not an influence
Prefer to vote for a woman Prefer to vote for a man
35%
0
20
40
60
80
100
11%
17%
73%
83%
4%
13%
Figure 28 Gender, race and age as influences on voting preferences
Women expressed both gender and racial preferences to a higher degree than men. Fijians expressed racial preference five times more than Indo-Fijians, and they also expressed a gender preference twice as frequently as Indo-Fijians.
Figure 29 voting preferences of respondents by gender
racial preferences
35% of all respondents expressed a preference for voting for their own racial group when making voting decisions. This preference for one’s own racial group was much more frequently expressed by Fijians (53%) than by Indo-Fijians (16%) or Others (16%). This result points to the need for materials and activities focused on improving women’s representation in elected positions to be grounded in and engage with the particular perspectives of various sub-groups of the population if they are to maximise their effectiveness.

A Fiji Women’s Forum Research Project, in partnership with IWdA | 33
Figure 30 voting preferences of respondents by race
age preferences
38% of respondents stated that age was not an influence when choosing who they would vote for. Some 36% of respondents indicated a preference for candidates aged 45-60, whilst 20% favoured the age group 30-45.
When these figures were deconstructed according to the age of respondents it was clear that older respondents were more likely to have a preference for older candidates. Roughly equal numbers of the under 30s had preferences for the age groups 31-45 and 45-60. Amongst respondents aged over 50, almost four times as many preferred to vote for someone aged 45-60 than someone aged 30-45. Preference for the under 30s was higher amongst respondents aged below 30 themselves, but was still very low (only 3%).
Figure 31 voting preferences of respondents by age
Overall (n=1198)
Prop
ortio
n of
resp
onde
nts
indo-Fijian Fijian Other
Race not an influence
Prefer to vote for Other
Prefer to vote for indo-Fijian
Prefer to vote for itaukei
0
20
40
60
80
100
65%
90%
40%
84%
16%
53%
1%
30%
3%2%
7%2%
1%
Overall (n=1176) 30 and under 31–50 Over 50
Age not an influence
Prefer to vote for someone >60
Prefer to vote for someone 45–60
Prefer to vote for someone 30–45
Prefer to vote for someone <30
0
20
40
60
80
100
2% 3%
23%
26%
2%
45%
2%
21%
41%
3%
33%
1%
12%
47%
6%
35%
20%
36%
3%
38%
34 | Public Perceptions of women in leadership
3.4.2 future outlook on women in leadership rolesTo gauge people’s perceptions regarding possible shifts in public attitudes to women’s leadership in the future, respondents were given a list of leadership roles and asked how likely they thought it was that each would be held by a woman within the next 10 years.
The results as shown in Figure 32 clearly showed that positions that have been previously held by a woman were deemed more likely to be held by a woman again in the future.
The two positions that respondents considered most likely to be held by women were the cabinet posts of Minister for Education and Minister for Health, both of which were deemed likely or extremely likely to be held by a woman in the next 10 years by 93% of respondents. Both of these positions have been held by a woman for a number of years in previous governments: Seruwaia Hong-Tiy as Minister for Health, Taufa Vakatale and Ro Teimumu Kepa as Minister for Education.
Approximately 8 out of 10 respondents think it is likely or extremely likely that a woman could be an Ambassador, Minister for Foreign Affairs or Finance. No woman has previously held the position of Minister for Foreign Affairs, nor Minister for Finance, but Adi Samanunu Talakuli Cakobau was appointed Fiji’s Ambassador to Thailand.
A majority of people (approximately two thirds) also see a female Prime Minister or Attorney General as likely to happen within the next 10 years. This was also reflected in the focus groups when the possibility of a female prime minister was discussed; participants mostly expressed positive views on the likelihood of it happening within the next 10 years. The sentiment expressed most often was that if it could happen in other countries then there was no reason why it could not also happen in Fiji.
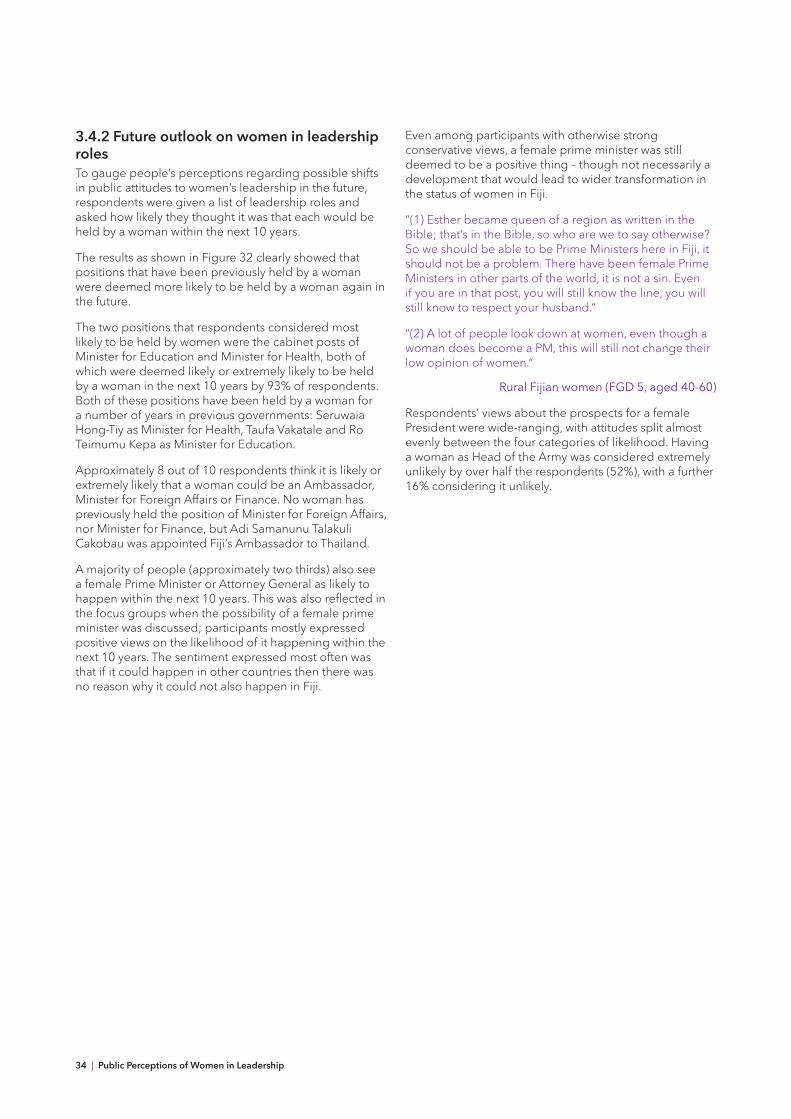
Even among participants with otherwise strong conservative views, a female prime minister was still deemed to be a positive thing – though not necessarily a development that would lead to wider transformation in the status of women in Fiji.
“(1) Esther became queen of a region as written in the Bible; that’s in the Bible, so who are we to say otherwise? So we should be able to be Prime Ministers here in Fiji, it should not be a problem. There have been female Prime Ministers in other parts of the world, it is not a sin. Even if you are in that post, you will still know the line, you will still know to respect your husband.”
“(2) A lot of people look down at women, even though a woman does become a PM, this will still not change their low opinion of women.”
rural Fijian women (FGD 5, aged 40-60)
Respondents’ views about the prospects for a female President were wide-ranging, with attitudes split almost evenly between the four categories of likelihood. Having a woman as Head of the Army was considered extremely unlikely by over half the respondents (52%), with a further 16% considering it unlikely.

A Fiji Women’s Forum Research Project, in partnership with IWdA | 35
Respondents were also asked to identify which (if any) of the scenarios they would like to see happen and which they would not like to see happen (respondents could pick as many as they wanted in either category). In every case, except Head of the Army, the number of respondents saying they would like to see a woman hold the post outnumbered the number who said they would not like it. This points to a consistent general willingness to see more women in leadership roles in government.
The position that most respondents were in favour of a woman holding was Prime Minister. Overall, 65% of respondents indicated they would like to see this happen, compared to 19% who said they would not. The proportion of respondents who would not like to see a woman as Prime Minister was significantly higher amongst men (28%), compared to women (12%).
Minister for education
Minister for Health ambassador Minister for Foreign affairs
Minister for Finance Prime Minister attorney General President Head of the army
extremely unlikely
unlikely
Likely
extremely likely
0
20
40
60
80
100
Figure 32 respondent perceptions of the likelihood of women holding different leadership positions in fiji within the next 10 years (non-responses are not included and were less than 2% overall).
44% 44%35% 32% 34%
30% 31%22%
16%
2% 1%
3% 4% 6% 6%6%
14% 12%
26%
52%
11%14% 16%
18% 21%
25%
16%
49% 49%
47%46% 44%
37% 34%
25%
13%

36 | Public Perceptions of women in leadership
Figure 33 respondent views on the desirability of a female Prime minister in the next 10 years
In the focus group discussions, when respondents were asked how they felt about Fiji having a female Prime Minister, the responses were generally very positive, with many (mostly women) saying they would feel a sense of great pride. Others said that it would be a good chance to see what women could do in the position, and if they could in fact do a better job than men.
“It can happen and we want to see it. It is possible. It will be a happy moment for us when a woman will run the country.“
rural Indo-Fijian woman (FGD11, aged 35-60)
“With the advocacy that seems to going on with the different women’s group... I am hopeful that we will have a woman Prime Minister... For the nation as a whole it would actually be a good thing, that we can actually draw comparisons to see who actually makes a better Prime Minster or a better leader. But we will not be able to tell if we don’t allow women the opportunity for a woman to become a Prime Minister.”
urban male (FGD1)
Overall Female Male Rural urban indo-Fijian itaukei Other 30 and under
31–50 Over 50
Would nOt like to see a woman as Prime Minister in the next 10 years
Would like to see a woman as Prime Minister in the next 10 years
0
20
40
60
80
100
19%
68%
12%
61%
28%
60%
25%
70%
14%
69%
10%
60%
27%
84%
10%
68%
16%
65%
20%
60%
26%
65%

A Fiji Women’s Forum Research Project, in partnership with IWdA | 37
4 synthesis of findings
The findings of this study are wide-ranging and provide a snapshot of the public’s perceptions in relation to the political participation of women, captured during the lead-up to the 2014 general elections. Three key findings that encapsulate the substance of the results are outlined here.
the majority of people in fiji feel that women are under-represented in government and that changing this would be beneficial to the nation as a whole.
There was clear consensus from respondents that there exists an under-representation of women in government in Fiji, and the majority are in favour of increasing that level of representation. The perception of the extent of the disparity between male and female political participation was evident not just in general terms, but when asked to estimate the numbers of women standing for elections or successfully elected in the past.
The perception that there are very few women in government is so strong that for many people it overshadows the gains made by women in the political sphere during the last elections at national and local levels. Most of the questionnaire respondents under-estimated the number of women elected in 2006. The majority of the focus group participants also underestimated the number of women who stood for election in that year.
This could be in part also due to the fact that the government elected in 2006 was in power for less than six months. The subsequent military overthrow and the passage of time has meant that the impressive gains made by women in that election have been largely forgotten by the majority of the public. It could also be the case that only those female MPs who went on to hold cabinet positions made an impression in the public’s memory.
When asked to name examples of leaders with leadership styles that respondents viewed positively, almost 80% named a man, compared to 6% who named a woman. Similarly a greater number of different male leaders were named compared to women. Since women comprise a much smaller percentage of past and current political leadership roles than men, this is unsurprising. However, it does confirm that the language of ‘leader’ continues to conjure images of men in the public imagination.
Overall the majority of people feel that having more women in government is of benefit to the country, and they also anticipate that change is inevitable. Most people see it as very likely that women will take on significant leadership roles in the future. Certain positions are seen as more likely to be held by women than others, particularly those that have been held by women before.
Based on the results of this study, the community is generally receptive to the idea of a woman becoming Prime Minister of Fiji. Three times as many people would like to see a woman become Prime Minister, than would not welcome it. A two-thirds majority consider that this is likely or extremely likely to happen within the next ten years.
People recognise that the qualifications and attributes of leadership are not unique to men, but are common to both men and women.
Perceptions of what ‘leadership’ is and what leadership qualities are valued are supportive of a greater role for women. Although the political landscape has been male-dominated throughout Fiji’s history, most people who participated in this study do not believe that men are inherently better at leadership than women.
When asked to assess the traits of a good leader, some traits were clearly more important than others. Some traits were classified as being more typically male traits, or more typically female traits, but these more ‘gendered’ traits were not the ones that were deemed most important for political leadership. Being hardworking, honest and intelligent were seen by the majority of people as being equally true of men and women, and were the three most frequently mentioned characteristics considered essential or very important for leadership. A sense of fairness and behaving in a non-discriminatory manner were also qualities that were highly valued and deemed important to leadership. This emphasis on fairness and equality were raised in the focus group discussions predominantly in the context of fairness to people of all ethnicities and social status.
In terms of the qualifications that people expected of their leaders, fluency in English and a university education are very highly valued. Since women in Fiji are now graduating from university in greater numbers than men (University of the South Pacific, 2014), it is clear that a disparity in education levels between men and women is not now, nor likely to be in the future, the reason why women play a significantly smaller role in political leadership.

38 | Public Perceptions of women in leadership
Most people did not consider family connections and backgrounds as important to leadership; generally, individual merit is what counts with both men and women. Fijian chiefly status was not deemed to be an essential or important qualification for leadership, including among indigenous Fijians. In the focus groups however, some participants felt that it did confer an advantage on a woman politically, but that women of non-chiefly status can also succeed with the right combination of education and commitment.
Generally women are seen as entirely capable of being involved in elected politics, if they have the interest and the confidence to do so, and if there is more encouragement from their communities and the wider society. The majority of respondents do not view a lack of experience or a lack of education as being the major reason why women have up to now stood for election less often than men. Twice to three times as many respondents considered that cultural barriers, discrimination and lack of community support were some of the major reasons women were not standing for election. Young women face an additional barrier in the form of their youth – people far more readily expressed a preference for election candidates aged 45-60 over younger candidates than they expressed a preference for either male or female candidates.
While lack of education and experience is not seen as a major reason for why women in general don’t participate in politics, it is the main reason that female respondents gave for why they themselves would not consider standing for election, perhaps reflecting their perception that a very high level of education is a pre-requisite for political participation.
conservative viewpoints that favour male leadership are a small but significant minority in certain demographics; the strongest support for female leadership is to be found amongst women and young people.
A small minority of people perceive men to be intrinsically better leaders than women, or in some other way oppose an increased role for women in politics. In terms of the demographic disaggregation of these views, they tended to be more often found among men, especially older men, and men in rural areas. Among women and the younger generation it was clear that there is a far greater acceptance of women’s increased political participation and more favourable views towards women’s leadership in general.
Women feel more strongly about the under-representation of women in government than men. A greater proportion of women than men also considered the country would benefit from increasing the number of women in government, and women were far less likely to favour women’s return to traditional roles in society. Women also disagreed to a greater extent than men with the proposition that men generally make better political leaders.
While the visibility of women in politics is generally low, it is higher among women. More women than men named women when asked about who they thought of as an example of positive leadership. Also when specifically asked to name a woman leader, the overall number of different women leaders named by women was much greater than named by men. Female political leaders seem to resonate more with women, and come to mind more readily than they do with men.
Women generally hold women and their leadership capacity in high regard. They more readily ascribed certain important leadership traits to women than to men; being hardworking, honest and intelligent. For each of those traits, between 4 and 6 times as many women said they were more true of women than they were of men.
Many women prefer to vote for a woman than for a man. Younger women in particular showed a marked preference for voting for a woman candidate rather than a man, compared to older women, possibly indicating that younger women are more aware of the potential necessity of their vote in getting women elected. Young people’s views in many instances differ from those of older people, and there are clear generational shifts in perception highlighted by some of the questions in the survey.
There is a general perception that ‘culture’ is a barrier to women’s greater political participation. Respondents acknowledge that woman have always been under-represented in leadership roles generally, and that this makes it harder for them to gain acceptance as leaders in new arenas such as politics. When asked whether their culture supported women’s leadership, Indo-Fijian women were the group most likely to say yes. Among Fijian respondents, and Fijian men in particular, the view that culture was not supportive of women’s leadership was more frequent. Very conservative views about women were not expressed as frequently in the Indo-Fijian community (compared to Fijian rural respondents, for example). Some of the most conservative viewpoints were most prevalent among older Fijian men, especially those in rural areas.
the maJority oF people in FiJi Feel that women are under-repreSented in government and that changing thiS would be beneFicial to the nation

A Fiji Women’s Forum Research Project, in partnership with IWdA | 39
5 conclusion
This research on perceptions of leadership generally and women’s leadership in particular provides important information about current attitudes, how these vary across the population in Fiji, and where change is happening. This will be valuable information to inform future action to support increased representation of women in politics and a baseline against which the success of such efforts can be assessed.
The findings are generally very heartening for individuals and organisations interested in seeing more women participating in elected politics. A clear majority of respondents believe that it would be better for Fiji if there were more women in national parliament; that women have leadership qualities valued by both women and men; and that women are considered equally good at or better than men at handling key governing responsibilities.
While most people do not readily name women ‘leaders’, reflecting the limited visibility of women in public leadership roles in Fiji, both women and men, of varying ages and across ethnicities, readily identify women’s leadership capacities and see these capacities as essential or very important for governing. Close to two-thirds of respondents (65%) would like to see a woman holding the position of Prime Minister in the next 10 years. This points to a significant level of openness to women making a much greater contribution to public life in Fiji in the future.
Although public perception readily acknowledges women’s capacity for leadership, politics remains an overwhelmingly male-dominated arena, which is indicative of the fundamental gender bias that continues to obstruct women’s progress in political participation. This study has highlighted the need for definitive action to support women’s political participation, in order to better reflect the public’s desire for more gender balanced political representation.
cloSe to two-thirdS oF reSpondentS (65%) would like to See a woman holding the poSition
oF prime miniSter in the next 10 yearS.

40 | Public Perceptions of women in leadership
references
Bureau of Statistics (2012) Key Statistics: School enrolment by ethnicity and sex [online] www.spc.int/prism/ fjtest/Social/education.htm [accessed March 9, 2014].
Chandra, R (2009) ‘Higher Education Developments in Fiji: global, regional and national imperatives and issues of quality and affordability’. IIEP Policy Forum 2–3 July 2009.
Fiji Women’s Crisis Centre (2013) ‘Somebody’s Life, Everybody’s Business!’ National research on Women’s Health and Life Experiences in Fiji (2010/2011): a survey exploring the prevalence, incidence and attitudes to intimate partner violence in Fiji.
Ministry of National Planning (2010) Millennium Development Goals 2nd Report for the Fiji Islands 1990–2008.
Narsey, W (2007a) Gender Issues in Employment, Underemployment and Incomes in Fiji. Vanuavou Publications, Suva.
Narsey, W (2007b) Report on the 2004–2005 Survey on Employment and Unemployment Survey. Vanuavou Publications, Suva.
University of the South Pacific (2014) Dashboard and Business Intelligence System [online] https:// planning.usp.ac.fj/pnq/Web/MainPages/Default.aspx [accessed June 15, 2014].
World Economic Forum (2013) The Global Gender Gap Report. Geneva, Switzerland.

A Fiji Women’s Forum Research Project, in partnership with IWdA | 41

42 | Public Perceptions of women in leadership

A Fiji Women’s Forum Research Project, in partnership with IWdA | 43

44 | Public Perceptions of women in leadership

A Fiji Women’s Forum Research Project, in partnership with IWdA | 45

46 | Public Perceptions of women in leadership

A Fiji Women’s Forum Research Project, in partnership with IWdA | 47

48 | Public Perceptions of women in leadership

Level 1, 250 Queen Street Melbourne vIC 3000
1300 661 812 [email protected] www.iwda.org.au
abN 19 242 959 685 aCN 126 216 165


