Public perceptions of New Zealand’s aquaculture industry, 2014 · Public perceptions of New...
95
Public perceptions of New Zealand’s aquaculture industry, 2014 Report prepared for: Ministry for Primary Industries Contact Andrew Robertson and Venise Comfort Date: 14 August 2014 Reference: 109108819 and 109105819 Level 1, 6-10 The Strand PO Box 33690, Takapuna 0740 Auckland. Ph 09 919 9200 Level 9, Legal House, 101 Lambton Quay PO Box 3622, Wellington Ph 04 913 3000 www.colmarbrunton.co.nz
Transcript of Public perceptions of New Zealand’s aquaculture industry, 2014 · Public perceptions of New...

Public perceptions of New Zealand’s aquaculture industry, 2014
Report prepared for: Ministry for Primary Industries
Contact Andrew Robertson and Venise Comfort
Date: 14 August 2014
Reference: 109108819 and 109105819
Level 1, 6-10 The Strand
PO Box 33690, Takapuna 0740
Auckland.
Ph 09 919 9200
Level 9, Legal House, 101 Lambton Quay
PO Box 3622, Wellington
Ph 04 913 3000
www.colmarbrunton.co.nz

Page 2
‹#›
Table of contents
1. Summary and conclusions ........................................................................................................................ 3
1.1 Introduction ........................................................................................................................................ 3
1.2 Summary of findings ........................................................................................................................... 3
2. Introduction and objectives ................................................................................................................... 11
3. Methodology.......................................................................................................................................... 12
3.1 Survey methodology ......................................................................................................................... 12
3.2 Qualitative forum methodology ........................................................................................................ 14
4. Knowledge of aquaculture ..................................................................................................................... 16
4.1 Awareness of aquaculture and aquaculture products ...................................................................... 16
4.2 Knowledge of aquaculture in key growing areas .............................................................................. 18
5. Consumption of aquaculture products ................................................................................................... 20
6. New Zealanders’ perceptions of the aquaculture industry ..................................................................... 22
6.1 Overall perceptions ........................................................................................................................... 22
6.2 Reasons for viewing the aquaculture industry positively ................................................................. 25
6.3 Reasons for viewing the aquaculture industry negatively ................................................................ 27
6.4 Perceptions of aquaculture in key growing areas ............................................................................. 29
6.5 How New Zealanders find out about aquaculture ............................................................................ 31
6.6 Overall perceptions of the importance of aquaculture to New Zealand .......................................... 34
7. The personal impact of aquaculture ....................................................................................................... 36
7.1 How New Zealanders are personally impacted by aquaculture ....................................................... 37
7.2 Personal impact of aquaculture in key growing areas ...................................................................... 39
8. Aquaculture and the environment ......................................................................................................... 41
8.1 Sustainability ..................................................................................................................................... 41
8.2 Risks to natural sea life...................................................................................................................... 46
8.3 Impact on New Zealand’s natural beauty ......................................................................................... 49
8.4 New Zealand’s clean, green image .................................................................................................... 51
9. Aquaculture and the economy ............................................................................................................... 53
9.1 Aquaculture as an employer ............................................................................................................. 53
9.2 The contribution aquaculture makes to the economy ...................................................................... 55
10. Public support for industry growth......................................................................................................... 58
10.1 Increasing public support for industry growth ............................................................................... 60
11. Appendix A: Survey questionnaire ......................................................................................................... 79
12. Appendix B: Survey sample profiles ....................................................................................................... 93
13. Appendix C: Qualitative forum sample profile........................................................................................ 95

Page 3
‹#›
1. Summary and conclusions
1.1 Introduction
Colmar Brunton was commissioned by the Ministry for Primary Industries (MPI) to carry out research to gauge
public understanding and perceptions of the effects of aquaculture and its benefits, with the end aim of
informing the aquaculture industry’s aim of improving community support and understanding of aquaculture
activities.
Two thousand and twenty eight New Zealanders aged 18 years and over took part in a telephone survey
between 20 January and 25 February 2014. The survey was designed to provide robust nationally
representative results, as well as robust results for residents of six key aquaculture growth areas; Northland
Regional Council territory, Auckland Council territory, Thames-Coromandel and Hauraki District Council
territories, Marlborough Regional Council territory, Tasman Regional Council territory, and Canterbury
Regional Council territory.
Following the survey an online qualitative forum was held with a selection of survey respondents. The forum
was held over two days in March 2014, and provided a more in-depth examination of feelings, impressions,
and understanding about aquaculture than was possible through the telephone survey. The forum also
provided the opportunity for participants to offer solutions to help industry manage the main concerns, and
obtained ideas on ways to communicate with communities about aquaculture.
The overall survey results have a maximum margin of error of +/-3.9 percentage points at the 95% confidence
level. The results for each key aquaculture growing area have a maximum margin of error of +/-5.7 percentage
points at the 95% confidence level.
1.2 Summary of findings
Knowledge of aquaculture
The majority of New Zealanders are aware of New Zealand aquaculture
Overall the survey results illustrate fairly high levels of public awareness that aquaculture exists in New
Zealand. Four in five (79%) New Zealanders are aware of aquaculture when it is described as the ‘farming of
seafood’. Similar to the 2008 research, without any prompting, New Zealanders are most commonly aware
that mussels (57%) and salmon (40%) are farmed New Zealand aquaculture products. Overall, three quarters
(74%) of New Zealanders are able to name at least one product farmed by the New Zealand aquaculture
industry. Two thirds of New Zealanders (66%) say they had purchased and eaten a farmed aquaculture product
during the previous 12 months.
OF NEW ZEALANDERS ARE AWARE OF AQUACULTURE WHEN IT IS
DESCRIBED AS THE FARMING OF SEAFOOD79%
Page 4
‹#›
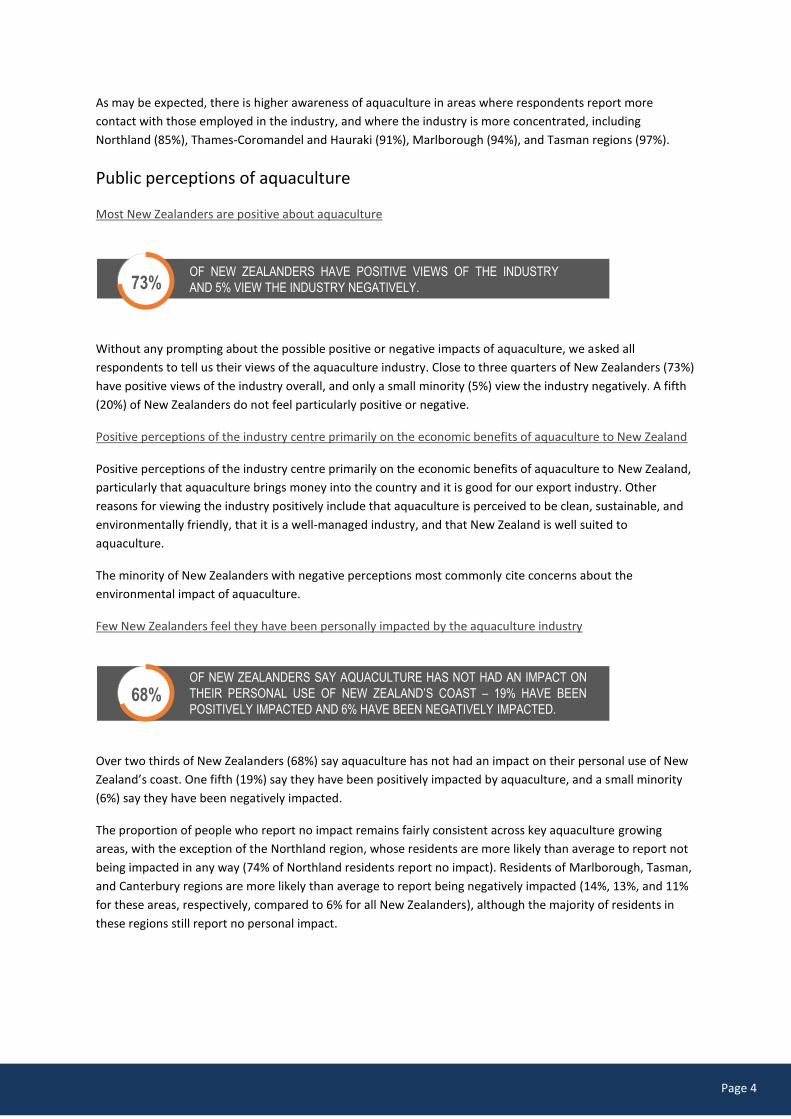
As may be expected, there is higher awareness of aquaculture in areas where respondents report more
contact with those employed in the industry, and where the industry is more concentrated, including
Northland (85%), Thames-Coromandel and Hauraki (91%), Marlborough (94%), and Tasman regions (97%).
Public perceptions of aquaculture
Most New Zealanders are positive about aquaculture
Without any prompting about the possible positive or negative impacts of aquaculture, we asked all
respondents to tell us their views of the aquaculture industry. Close to three quarters of New Zealanders (73%)
have positive views of the industry overall, and only a small minority (5%) view the industry negatively. A fifth
(20%) of New Zealanders do not feel particularly positive or negative.
Positive perceptions of the industry centre primarily on the economic benefits of aquaculture to New Zealand
Positive perceptions of the industry centre primarily on the economic benefits of aquaculture to New Zealand,
particularly that aquaculture brings money into the country and it is good for our export industry. Other
reasons for viewing the industry positively include that aquaculture is perceived to be clean, sustainable, and
environmentally friendly, that it is a well-managed industry, and that New Zealand is well suited to
aquaculture.
The minority of New Zealanders with negative perceptions most commonly cite concerns about the
environmental impact of aquaculture.
Few New Zealanders feel they have been personally impacted by the aquaculture industry
Over two thirds of New Zealanders (68%) say aquaculture has not had an impact on their personal use of New
Zealand’s coast. One fifth (19%) say they have been positively impacted by aquaculture, and a small minority
(6%) say they have been negatively impacted.
The proportion of people who report no impact remains fairly consistent across key aquaculture growing
areas, with the exception of the Northland region, whose residents are more likely than average to report not
being impacted in any way (74% of Northland residents report no impact). Residents of Marlborough, Tasman,
and Canterbury regions are more likely than average to report being negatively impacted (14%, 13%, and 11%
for these areas, respectively, compared to 6% for all New Zealanders), although the majority of residents in
these regions still report no personal impact.
OF NEW ZEALANDERS HAVE POSITIVE VIEWS OF THE INDUSTRY
AND 5% VIEW THE INDUSTRY NEGATIVELY.73%
OF NEW ZEALANDERS SAY AQUACULTURE HAS NOT HAD AN IMPACT ON
THEIR PERSONAL USE OF NEW ZEALAND’S COAST – 19% HAVE BEEN
POSITIVELY IMPACTED AND 6% HAVE BEEN NEGATIVELY IMPACTED.68%

Page 5
‹#›
What are the main positive and negative impacts?
Those whose use of the coast has been positively impacted most commonly mention good fishing near an
aquaculture farm or that aquaculture is generally good for recreational diving and fishing.
Those whose use of the coast has been negatively impacted most commonly mention restricted access to
coastal areas, and water quality around aquaculture farms.
A degree of misunderstanding exists about aquaculture, and this may be a barrier to enhancing community
support and understanding
Although overall awareness of seafood farming is high, and public perceptions of aquaculture are generally
positive, a number of findings throughout the survey and the follow-up qualitative forum illustrate a level of
public misconception or misunderstanding about aquaculture. Some relevant results from the survey are listed
below.
Although most New Zealanders are aware of the farming of seafood, the term aquaculture is unfamiliar to
many, with just over half (56%) saying they have heard of the term. Awareness of the term is particularly
low among young people and Asian people.
When asked to name an aquaculture product, almost a third (30%) of New Zealanders name a product
that is not farmed by the New Zealand aquaculture industry.
When asked if their view of the aquaculture industry is positive or negative, one fifth (20%) of New
Zealanders say they are neither positive nor negative. Some of these New Zealanders may not feel they
know enough about aquaculture to form a view.
When those who view the aquaculture industry negatively are asked about the reasons for their view, the
second most common reason does not relate to aquaculture, but to over-fishing. Similar comments arose
when we asked survey respondents why they felt aquaculture is not sustainable, and why they believe
aquaculture poses a risk to natural sea life.
This finding is an important one for the industry for two main reasons:
1. It raises the possibility that negative publicity surrounding non-aquaculture industries or activities (such as
commercial or recreational over-fishing) can have an impact on public perceptions of aquaculture,
especially among those who are less aware of the industry.
2. Those with less knowledge of aquaculture can be more easily swayed by seemingly credible evidence and
arguments against industry growth. Information communicated and publicised by a ‘vocal minority’ can
have a greater impact when relatively little is known about a topic or issue.
A key challenge for improving community support and understanding will be lifting the profile of aquaculture
in New Zealand, and differentiating it from other sea activities and seafood products. Increased public
knowledge of aquaculture would act as a ‘buffer’ for the industry when negative information is publicised both
about aquaculture and about non-aquaculture activities and industries.
Openness and public accessibility can help to enhance industry perceptions
Results suggest that openness and public accessibility can play a role in enhancing knowledge and generating
positive perceptions of the industry. Those who view the industry ‘very positively’ are more likely than average
to say they have received information about aquaculture through word of mouth and through visiting an
aquaculture farm.
Page 6
‹#›
Aquaculture and the environment
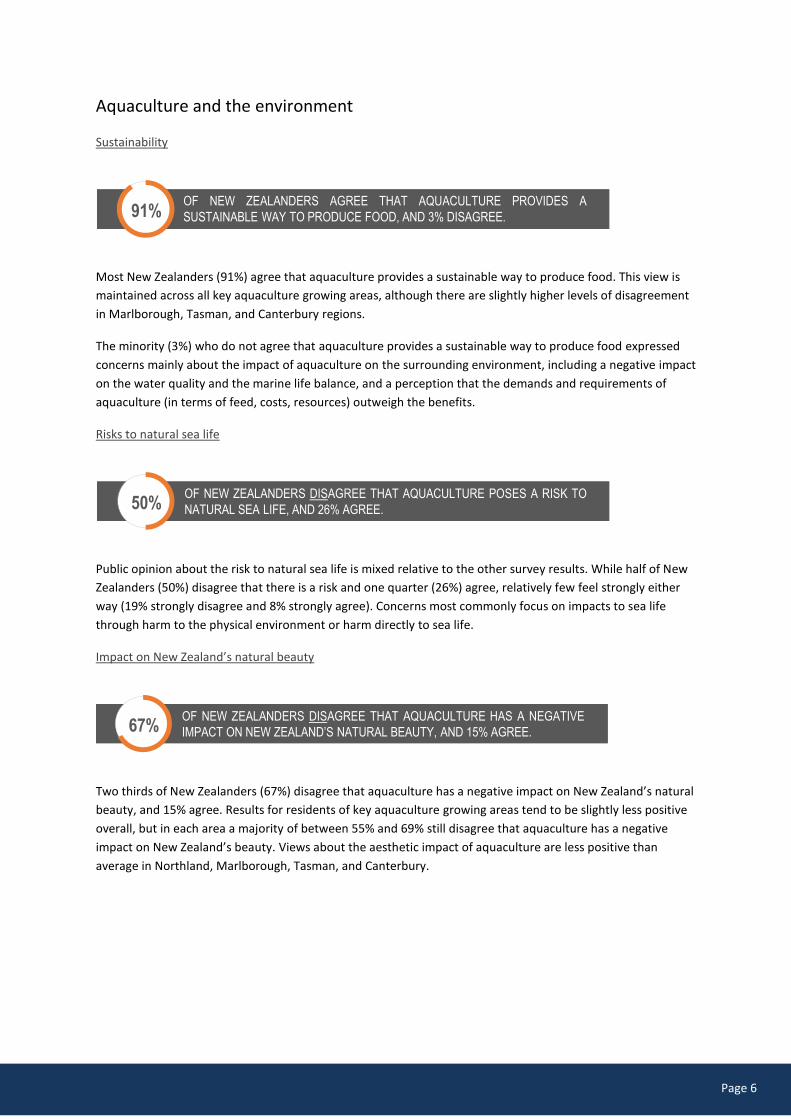
Sustainability
Most New Zealanders (91%) agree that aquaculture provides a sustainable way to produce food. This view is
maintained across all key aquaculture growing areas, although there are slightly higher levels of disagreement
in Marlborough, Tasman, and Canterbury regions.
The minority (3%) who do not agree that aquaculture provides a sustainable way to produce food expressed
concerns mainly about the impact of aquaculture on the surrounding environment, including a negative impact
on the water quality and the marine life balance, and a perception that the demands and requirements of
aquaculture (in terms of feed, costs, resources) outweigh the benefits.
Risks to natural sea life
Public opinion about the risk to natural sea life is mixed relative to the other survey results. While half of New
Zealanders (50%) disagree that there is a risk and one quarter (26%) agree, relatively few feel strongly either
way (19% strongly disagree and 8% strongly agree). Concerns most commonly focus on impacts to sea life
through harm to the physical environment or harm directly to sea life.
Impact on New Zealand’s natural beauty
Two thirds of New Zealanders (67%) disagree that aquaculture has a negative impact on New Zealand’s natural
beauty, and 15% agree. Results for residents of key aquaculture growing areas tend to be slightly less positive
overall, but in each area a majority of between 55% and 69% still disagree that aquaculture has a negative
impact on New Zealand’s beauty. Views about the aesthetic impact of aquaculture are less positive than
average in Northland, Marlborough, Tasman, and Canterbury.
OF NEW ZEALANDERS AGREE THAT AQUACULTURE PROVIDES A
SUSTAINABLE WAY TO PRODUCE FOOD, AND 3% DISAGREE.91%
50%OF NEW ZEALANDERS DISAGREE THAT AQUACULTURE POSES A RISK TO
NATURAL SEA LIFE, AND 26% AGREE.
67%OF NEW ZEALANDERS DISAGREE THAT AQUACULTURE HAS A NEGATIVE
IMPACT ON NEW ZEALAND’S NATURAL BEAUTY, AND 15% AGREE.

Page 7
‹#›
The contribution aquaculture makes to New Zealand’s clean, green image
Just over two thirds of New Zealanders (68%) agree that aquaculture contributes positively to New Zealand’s
clean, green image, and 11% disagree.
Results for residents in New Zealand’s key aquaculture areas are generally similar to the national results, with
a majority of between 62% and 68% of residents in each area agreeing that aquaculture contributes positively
to New Zealand’s clean, green image.
Aquaculture and the economy
The majority of New Zealanders appreciate that aquaculture makes a significant contribution to the national
economy, even if they believe aquaculture doesn’t make a significant contribution locally
Aquaculture is seen as a significant contributor to local economies in regions where greater proportions of
residents are employed in the industry. A strong majority of residents in Marlborough region, Tasman region,
Thames-Coromandel and Hauraki districts agree that aquaculture makes a significant contribution locally (92%,
89%, and 81% agree, respectively), and 61% of Northland residents agree.
Irrespective of their view on the contribution aquaculture makes locally, the majority of New Zealanders (80%)
agree that aquaculture makes a significant contribution nationally.
There is considerable public support for sustainably growing the New Zealand aquaculture industry
Nine in ten New Zealanders (91%) agree that New Zealand should look for opportunities to sustainably grow
the aquaculture industry. This level of public support also exists within key aquaculture growing areas,
although it is slightly lower in Tasman (86%) and Canterbury (86%) regions.
Information about sustainability practices and the size of the aquaculture industry can further improve support
for growth
We provided a smaller random sample of respondents with further information about sustainability practices
and the size of the aquaculture industry. This information positively impacted industry perceptions and
support for the industry.
68%OF NEW ZEALANDERS AGREE THAT AQUACULTURE CONTRIBUTES
POSITIVELY TO NEW ZEALAND’S CLEAN, GREEN IMAGE, AND 11% DISAGREE.
80%OF NEW ZEALANDERS AGREE THAT AQUACULTURE MAKES A SIGNIFICANT
CONTRIBUTION TO OUR NATIONAL ECONOMY, AND 5% DISAGREE.
91%OF NEW ZEALANDERS AGREE THAT NEW ZEALAND SHOULD LOOK FOR
OPPORTUNITIES TO SUSTAINABLY GROW THE AQUACULTURE INDUSTRY,
AND 3% DISAGREE.
Page 8
‹#›
The most notable increase was in views of the contribution that aquaculture makes to New Zealand’s
economy. After providing information about the size of the industry, the proportion of New Zealanders
agreeing that aquaculture makes a significant contribution increased from 80% to 91%.
After providing further information about the efficiency of aquaculture production and sustainability
practices in the industry:
Strong agreement that aquaculture provides a sustainable way to produce food increased from 52%
to 63%.
Strong agreement that New Zealand should look for opportunities to sustainably grow the
aquaculture industry increased from 57% to 70%.
Increasing public support for industry growth at the national level
A multivariate analysis technique was used to help identify priorities for improving public perceptions at the
national level. This analysis is discussed in more detail in the body of this report, however the main findings
were as follows:
1. Perceptions that aquaculture provides a sustainable way to produce food are most important for driving
sustainable industry growth. Maintaining the level of these already positive public perceptions is
important for maintaining support for sustainable aquaculture growth. If public perceptions of
aquaculture sustainability were to become less positive over time (perhaps as a result of negative media
coverage or misinformation), we would likely see a decrease in support for aquaculture growth at the
national level.
2. The contribution aquaculture makes to the economy and New Zealand’s clean, green image, and the
impact on New Zealand’s natural beauty, are all relatively important for driving support for industry
growth. If these public perceptions were to be improved, we would likely see a further improvement in
support for industry growth at the national level.
Enhancing public support in aquaculture growing areas
Overall the survey results show that aquaculture growth has support from a large majority of the population,
including those in key growing areas. Having said this, New Zealanders generally do not have a thorough and
detailed knowledge of the industry. In a situation where there is a low level of specific knowledge, it is easier
for people’s views to be swayed by seemingly credible evidence from a ‘vocal minority’, or by negative media
coverage. For this reason, we deliberately recruited some participants for the follow-up qualitative forum who
tended to have less positive views about aquaculture. This approach allowed us to explore and better
understand the concerns that exist, particularly in areas where aquaculture may expand in the future.
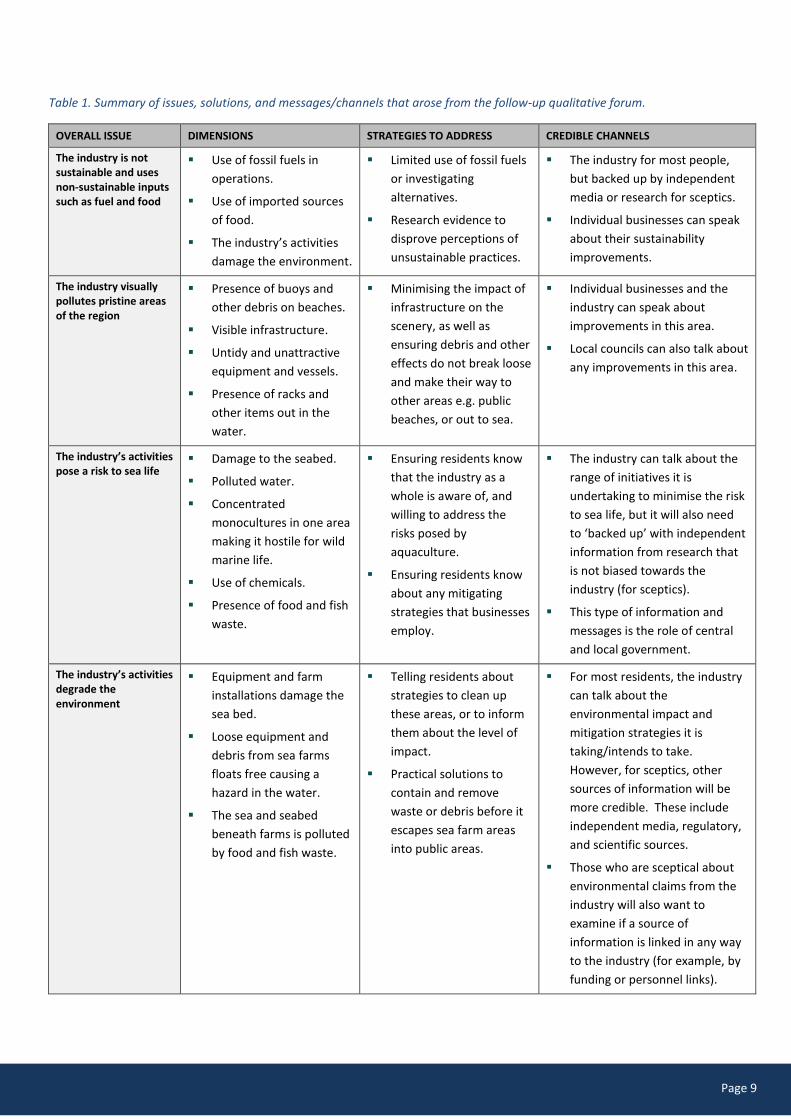
Table 1 summarises the issues discussed during the qualitative online forum, residents’ suggested solutions,
and the most credible channels to receive information on the issues. A more detailed discussion is provided
starting on Page 60.
Page 9
‹#›
Table 1. Summary of issues, solutions, and messages/channels that arose from the follow-up qualitative forum.
OVERALL ISSUE DIMENSIONS STRATEGIES TO ADDRESS CREDIBLE CHANNELS
The industry is not sustainable and uses non-sustainable inputs such as fuel and food
Use of fossil fuels in
operations.
Use of imported sources
of food.
The industry’s activities
damage the environment.
Limited use of fossil fuels
or investigating
alternatives.
Research evidence to
disprove perceptions of
unsustainable practices.
The industry for most people,
but backed up by independent
media or research for sceptics.
Individual businesses can speak
about their sustainability
improvements.
The industry visually pollutes pristine areas of the region
Presence of buoys and
other debris on beaches.
Visible infrastructure.
Untidy and unattractive
equipment and vessels.
Presence of racks and
other items out in the
water.
Minimising the impact of
infrastructure on the
scenery, as well as
ensuring debris and other
effects do not break loose
and make their way to
other areas e.g. public
beaches, or out to sea.
Individual businesses and the
industry can speak about
improvements in this area.
Local councils can also talk about
any improvements in this area.
The industry’s activities pose a risk to sea life
Damage to the seabed.
Polluted water.
Concentrated
monocultures in one area
making it hostile for wild
marine life.
Use of chemicals.
Presence of food and fish
waste.
Ensuring residents know
that the industry as a
whole is aware of, and
willing to address the
risks posed by
aquaculture.
Ensuring residents know
about any mitigating
strategies that businesses
employ.
The industry can talk about the
range of initiatives it is
undertaking to minimise the risk
to sea life, but it will also need
to ‘backed up’ with independent
information from research that
is not biased towards the
industry (for sceptics).
This type of information and
messages is the role of central
and local government.
The industry’s activities degrade the environment
Equipment and farm
installations damage the
sea bed.
Loose equipment and
debris from sea farms
floats free causing a
hazard in the water.
The sea and seabed
beneath farms is polluted
by food and fish waste.
Telling residents about
strategies to clean up
these areas, or to inform
them about the level of
impact.
Practical solutions to
contain and remove
waste or debris before it
escapes sea farm areas
into public areas.
For most residents, the industry
can talk about the
environmental impact and
mitigation strategies it is
taking/intends to take.
However, for sceptics, other
sources of information will be
more credible. These include
independent media, regulatory,
and scientific sources.
Those who are sceptical about
environmental claims from the
industry will also want to
examine if a source of
information is linked in any way
to the industry (for example, by
funding or personnel links).
Page 10
‹#›
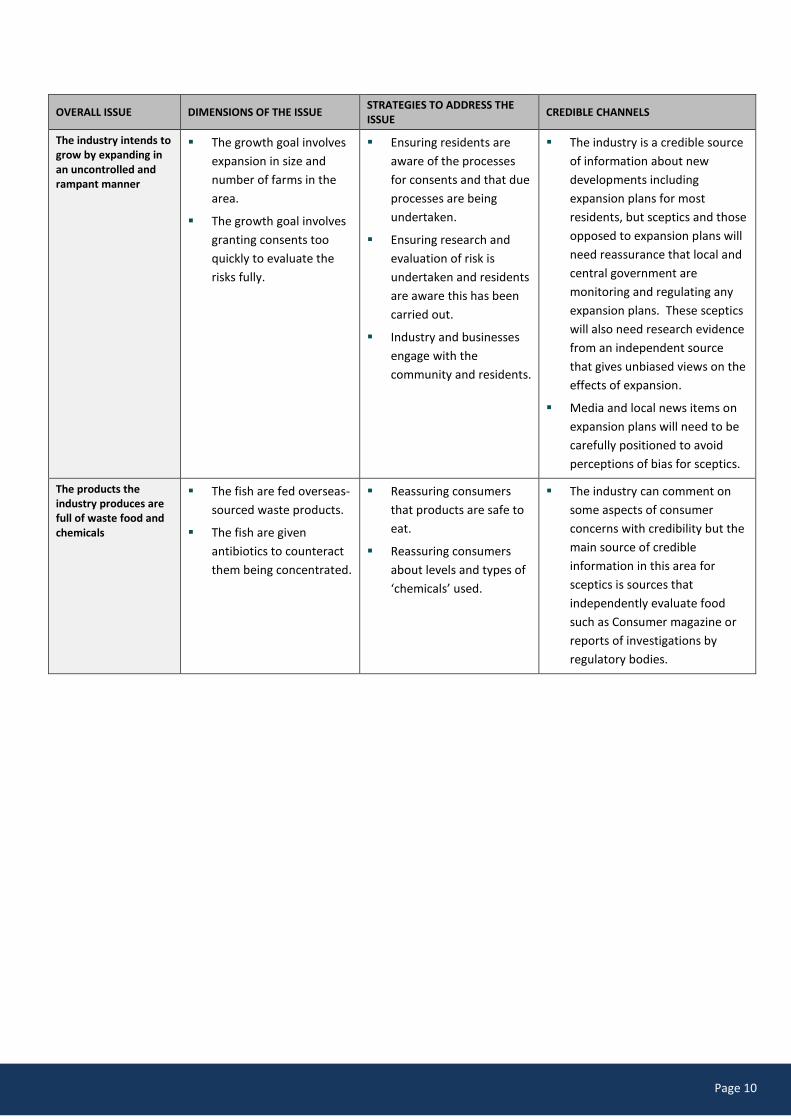
OVERALL ISSUE DIMENSIONS OF THE ISSUE STRATEGIES TO ADDRESS THE ISSUE
CREDIBLE CHANNELS
The industry intends to grow by expanding in an uncontrolled and rampant manner
The growth goal involves
expansion in size and
number of farms in the
area.
The growth goal involves
granting consents too
quickly to evaluate the
risks fully.
Ensuring residents are
aware of the processes
for consents and that due
processes are being
undertaken.
Ensuring research and
evaluation of risk is
undertaken and residents
are aware this has been
carried out.
Industry and businesses
engage with the
community and residents.
The industry is a credible source
of information about new
developments including
expansion plans for most
residents, but sceptics and those
opposed to expansion plans will
need reassurance that local and
central government are
monitoring and regulating any
expansion plans. These sceptics
will also need research evidence
from an independent source
that gives unbiased views on the
effects of expansion.
Media and local news items on
expansion plans will need to be
carefully positioned to avoid
perceptions of bias for sceptics.
The products the industry produces are full of waste food and chemicals
The fish are fed overseas-
sourced waste products.
The fish are given
antibiotics to counteract
them being concentrated.
Reassuring consumers
that products are safe to
eat.
Reassuring consumers
about levels and types of
‘chemicals’ used.
The industry can comment on
some aspects of consumer
concerns with credibility but the
main source of credible
information in this area for
sceptics is sources that
independently evaluate food
such as Consumer magazine or
reports of investigations by
regulatory bodies.
Page 11
‹#›
2. Introduction and objectives
In recognition of significant growth opportunities for New Zealand’s aquaculture industry, the Government has
set out to support sustainable aquaculture in New Zealand. As part of this plan, the Government identified a
need to build public understanding of the effects and benefits of aquaculture.
The most recent information MPI has describing public perceptions of aquaculture was collected in 2008.1
There was a need to update and refresh this information to determine changes in perceptions, and to inform a
strategy to improve community support and understanding for aquaculture. MPI commissioned Colmar
Brunton to carry out new public perceptions research in early 2014.
The objectives of the research were:
1. Gauge public understanding of the environmental and social effects and benefits of aquaculture.
2. Identify key concepts, themes or practical solutions that need to be conveyed or implemented by
industry to help improve and build a better understanding of the effects and benefits of aquaculture.
3. Report on the communication performance of the industry by tracking any changes to the public
perceptions of aquaculture compared to the baseline survey of 2008.
1 Research First (2008). Public Perceptions Regarding Aquaculture: Research Report. Report produced for Aquaculture New Zealand and the Ministry of Fisheries.
Page 12
‹#›
3. Methodology
The research comprised a telephone survey and follow-up online qualitative forum with a selection of people
who took part in the survey.
3.1 Survey methodology
Colmar Brunton carried out 2,028 Computer Assisted Telephone Interviews (CATI) with New Zealand residents
aged 18 years or over between 20 January and 25 February 2014. The average interview duration was 12
minutes and 28 seconds. The questionnaire was developed in close consultation with the Ministry for Primary
Industries and Aquaculture New Zealand, and is appended to this report (Appendix A). The overall response
rate to this survey was 24%.
Sampling and post-stratification weights
The survey used Random Digit Dialling (RDD). An RDD sample frame includes all households with landline
telephones, including those with unlisted numbers. Telephone numbers were randomly drawn from known
number ranges within New Zealand’s regions and interviewers asked to speak with the person in the
household aged 18 years or over who had the next birthday. A disproportionate sample scheme was
employed to enable separate analysis by key aquaculture growing areas, including Northland Regional Council
territory, Auckland Council territory, Thames-Coromandel and Hauraki District Council territories, Marlborough
Regional Council territory, Tasman Regional Council territory, and Canterbury Regional Council territory. This
disproportionate sample was corrected at the weighting stage, so the overall findings are representative of
New Zealand’s cities and regions.
A sampling scheme that selects only one person per household is subject to a household size bias, where
people from large households have a different chance of being included than people from small households.
To correct for this, the data were weighted by household size (defined as the number of eligible respondents
who live in the household).
As this was a random sample of the population, small variations will exist between the sample and the New
Zealand population. Percentages have therefore been post-weighted by age, gender, and ethnicity (Māori vs
non-Māori) to ensure that overall results represent the population on these key variables. The sample profile
can be found in Appendix B.
Margins of error
The estimated maximum margins of error are as follows:
All New Zealanders: +/-3.9 percentage points (based on a total sample size of 2,028, and an ‘effective
sample size’ of 794)2
Residents of each key aquaculture growing area: +/-5.7 percentage points (based on a sample size of 300).
These estimated margins of error have been calculated at the 95% confidence level.
2 A simple random national sample of 500 has a maximum margin of error of +/- 4.4 percentage points at the 95% confidence level. Oversampling residents in specific regions a) allows us to analyse these regions separately, and b) helps to improve the overall precision of the national sample, providing an ‘effective sample size’ 794 for the national sample. The maximum margin of error for the national sample has been calculated using the effective sample size.
Page 13
‹#›
Throughout this report, only statistically significant differences at the 95% confidence level between sub-
groups of the survey population are presented unless otherwise specified. Chi-square tests of difference were
used for all subgroup analysis.
Comparisons with the 2008 survey
The present survey was designed to be nationally representative, and to provide separate analyses for
Northland Regional Council territory, Auckland Council territory, Thames-Coromandel and Hauraki District
Council territories, Marlborough Regional Council territory, Tasman Regional Council territory, and Canterbury
Regional Council territory. The 2008 aquaculture survey sampled residents in Auckland, Northland, Thames-
Coromandel and Hauraki, Nelson-Marlborough, and Canterbury.
Although the samples for Northland, Thames-Coromandel and Hauraki, and Canterbury areas are broadly
comparable, questionnaire changes limit the extent to which direct comparisons will be useful and
interpretable.
Having said this, there are a number of general similarities between the overall findings of the present survey
and the 2008 survey, and we have commented on these where appropriate in the body of this report.
Events during the time of carrying out the telephone survey
On Sunday 16 February, the programme ‘Keeping it Pure’ was shown on Prime television. The programme
discussed proposals for additional aquaculture farms and vulnerability of aquaculture to disease. By 16
February 86% of the survey was complete, with just 280 interviews remaining mainly in Northland,
Marlborough, Canterbury, and Tasman regions. We carried out analyses to determine whether the programme
had impacted perceptions in these regions. Analysis across Q3a (overall perceptions of aquaculture) and the
statements at Q3g (aquaculture and the environment) showed no discernable impact.
Additional notes to the reader
In a number of the tables that present results to open-ended questions, categories that are similar have
been grouped together and presented as a ‘nett score’ (see bolded descriptions and figures) – each nett
score figure gives the percentage of respondents that gave at least one of the more detailed reasons
(which are listed below the nett score).
Please note that occasionally the percentages in the charts and tables do not add up to the nett
percentages presented within the text of the report. This is because each percentage in the charts and
tables has been rounded to a whole number. When calculating the nett percentages, only the final result
has been rounded to a whole number. This reduces the influence of rounding error in the final result.
The base sizes shown in the tables and graphs are unweighted (as the statistical reliability of results is
determined by unweighted base sizes). The percentages in the tables and graphs use weighted data to
ensure the survey results are representative of the population of interest.
Page 14
‹#›
3.2 Qualitative forum methodology
An online discussion forum conducted after the survey was complete
Colmar Brunton employed an online qualitative methodology to speak with residents of aquaculture growing
regions in more depth once they had completed the survey. Colmar Brunton has developed an online
qualitative discussion forum that allows respondents to respond using free-flow narrative to a range of
questions posed over a set period of time. The methodology is called e-Qual and is a secure invitation-only
website. Respondents are invited in and register under an anonymous user name. Their comments and
responses to the questions are visible to other users, and respondents can therefore read and comment on
others’ thoughts and views.
Recruitment and participation
The process for recruitment and participation was as follows:
Once respondents had completed the survey, those living in key aquaculture growing areas were asked if
they were interested in taking part in further research. Those who agreed were invited by email.
Respondents in the forum were tagged with their location, age and other information from their
responses in the survey.
A targeted subset of the survey
For the e-Qual phase, we targeted only respondents living in aquaculture growing regions. This approach was
taken to gather specific information about concerns that residents in these areas may have in order to develop
strategies to respond to their concerns. In order to gather residents’ concerns, we included a number of
people with less positive perceptions of the industry in the research, even though these perceptions are not
widespread (as the findings from the survey show). Of the 41 participants in the forum, 18 held ‘less positive’
perceptions of the industry. Māori respondents were also specifically selected to elicit any specific concerns
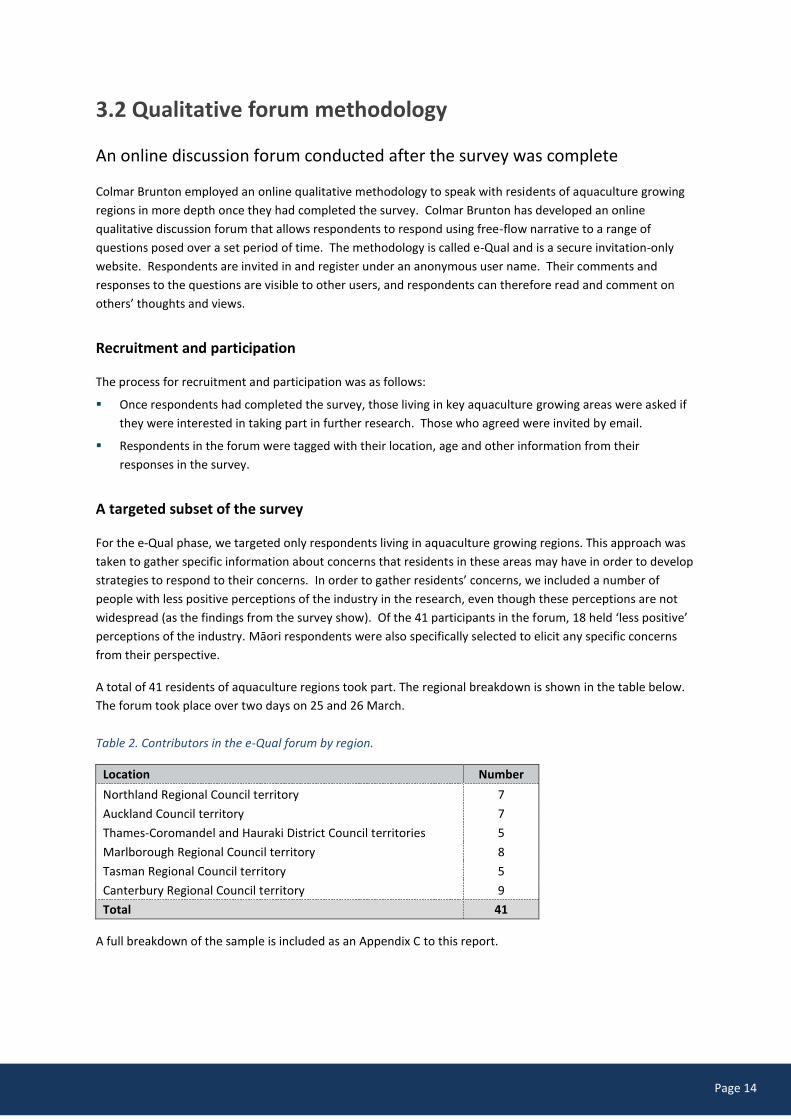
from their perspective.
A total of 41 residents of aquaculture regions took part. The regional breakdown is shown in the table below.
The forum took place over two days on 25 and 26 March.
Table 2. Contributors in the e-Qual forum by region.
Location Number
Northland Regional Council territory 7
Auckland Council territory 7
Thames-Coromandel and Hauraki District Council territories 5
Marlborough Regional Council territory 8
Tasman Regional Council territory 5
Canterbury Regional Council territory 9
Total 41
A full breakdown of the sample is included as an Appendix C to this report.

Page 15
‹#›
Topic guide areas of questioning
Colmar Brunton developed a topic guide that asked specific questions about particular topics of interest that
emerged from the findings from the survey. The topic guide was developed after the key results of the survey
had been identified, and in consultation with the Ministry and Aquaculture New Zealand.
The topic guide comprised six questions posed to residents of aquaculture regions over two days. The guide
was structured as follows:
Day 1
Views on the aquaculture industry
Views on the sustainability of the industry
Thoughts on the industry’s growth goal
Day 2
Views on risks to marine life
Concerns about the industry (using three of the concerns that emerged from the quantitative survey)3
Sources of information and most credible/trusted sources.
Residents could log on at any time over the course of the two days and make comments on any of the
questions. They were encouraged to logon each day at least once when questions were released.
Emphasis boxes
We have used green emphasis boxes in some instances throughout this report to highlight a finding. These are
intended to summarise the points raised in the section.
3 The concerns Colmar Brunton prompted people on were related to access to the coast, spoiling the scenery, and water quality and pollution.
Page 16
‹#›
4. Knowledge of aquaculture
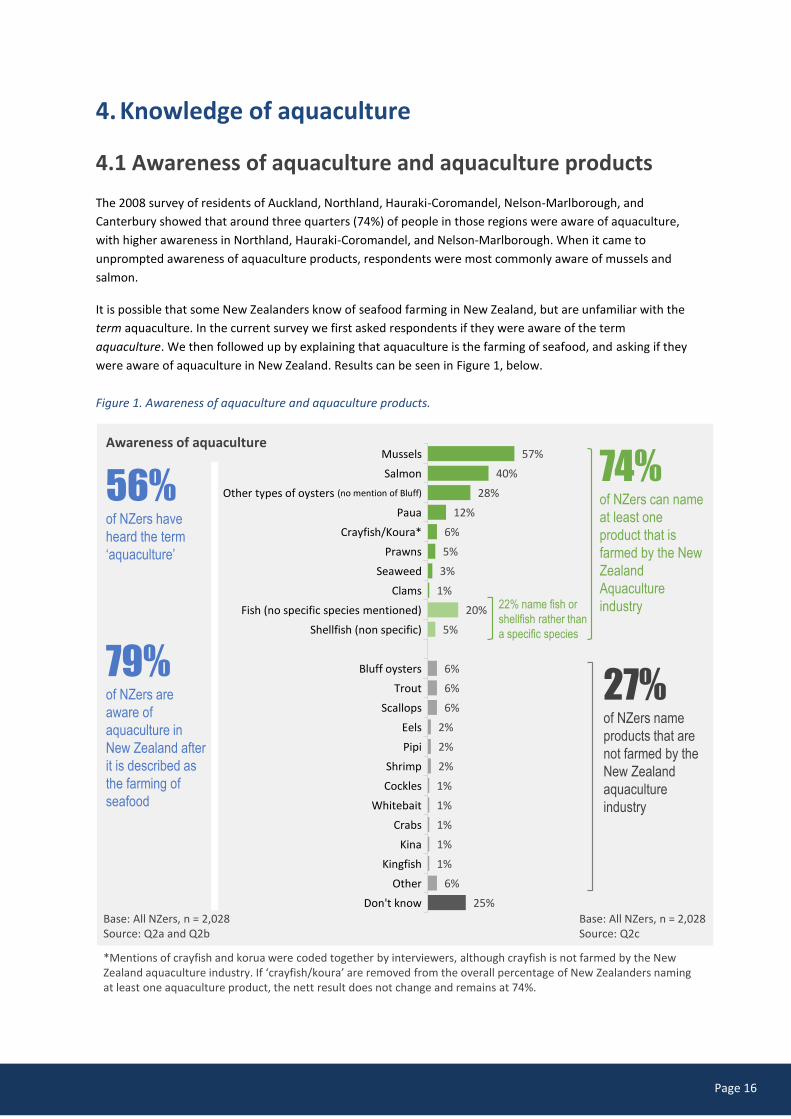
4.1 Awareness of aquaculture and aquaculture products
The 2008 survey of residents of Auckland, Northland, Hauraki-Coromandel, Nelson-Marlborough, and
Canterbury showed that around three quarters (74%) of people in those regions were aware of aquaculture,
with higher awareness in Northland, Hauraki-Coromandel, and Nelson-Marlborough. When it came to
unprompted awareness of aquaculture products, respondents were most commonly aware of mussels and
salmon.
It is possible that some New Zealanders know of seafood farming in New Zealand, but are unfamiliar with the
term aquaculture. In the current survey we first asked respondents if they were aware of the term
aquaculture. We then followed up by explaining that aquaculture is the farming of seafood, and asking if they
were aware of aquaculture in New Zealand. Results can be seen in Figure 1, below.
Figure 1. Awareness of aquaculture and aquaculture products.
Base: All NZers, n = 2,028Source: Q2a and Q2b
56%of NZers have
heard the term
‘aquaculture’
79%of NZers are
aware of
aquaculture in
New Zealand after
it is described as
the farming of
seafood
57%
40%
28%
12%
6%
5%
3%
1%
20%
5%
6%
6%
6%
2%
2%
2%
1%
1%
1%
1%
1%
6%
25%
74%of NZers can name
at least one
product that is
farmed by the New
Zealand
Aquaculture
industry
Base: All NZers, n = 2,028 Source: Q2c
Awareness of aquaculture
27%of NZers name
products that are
not farmed by the
New Zealand
aquaculture
industry
*Mentions of crayfish and korua were coded together by interviewers, although crayfish is not farmed by the New Zealand aquaculture industry. If ‘crayfish/koura’ are removed from the overall percentage of New Zealanders naming at least one aquaculture product, the nett result does not change and remains at 74%.
Mussels
Salmon
Other types of oysters (no mention of Bluff)
Paua
Crayfish/Koura*
Prawns
Seaweed
Clams
Fish (no specific species mentioned)
Shellfish (non specific)
Bluff oysters
Trout
Scallops
Eels
Pipi
Shrimp
Cockles
Whitebait
Crabs
Kina
Kingfish
Other
Don't know
22% name fish or
shellfish rather than
a specific species

Page 17
‹#›
Awareness of seafood farming and the term ‘aquaculture’
Four in five (79%) New Zealanders are aware of seafood farming in New Zealand, which is broadly similar to
the findings of the 2008 survey. The term aquaculture, however, is unfamiliar to many New Zealanders, with
just over half (56%) recognising the term.
Across all New Zealanders, lower than average awareness of the term aquaculture exists among:
females (51%)
younger New Zealanders, aged 18 to 34 years (35%)
those who identify with an Asian ethnic group (43%)
those who use the coast for recreation fewer than 10 times per year (51%)
those who do not own a boat (53%)
those who do not know someone working in the aquaculture industry (52%)
those who have not consumed aquaculture products in the last 12 months (42%).
Awareness of aquculture products
Also similar to the results of the 2008 survey, New Zealanders are most commonly aware that mussels (57%)
and salmon (40%) are farmed aquaculture products. Overall, three quarters (74%) of New Zealanders are able
to name at least one product farmed by the New Zealand aquaculture industry, although some of these
products are mentioned only at a general level, such as ‘fish’ and ‘shellfish’, and it’s possible New Zealanders
include wild-caught fish or shellfish within their conceptualisation of farmed seafood. This possibility was also
borne out through comments made by some contributors to the follow-up qualitative forum, and is discussed
further later in this report (see Page 43). In addition, a degree of public misconception exists about what
seafood products are farmed in New Zealand. More than a quarter (27%) of New Zealanders named products
that are not farmed by the aquaculture industry – most commonly Bluff oysters (6%), trout (6%) and scallops
(6%).
Page 18
‹#›
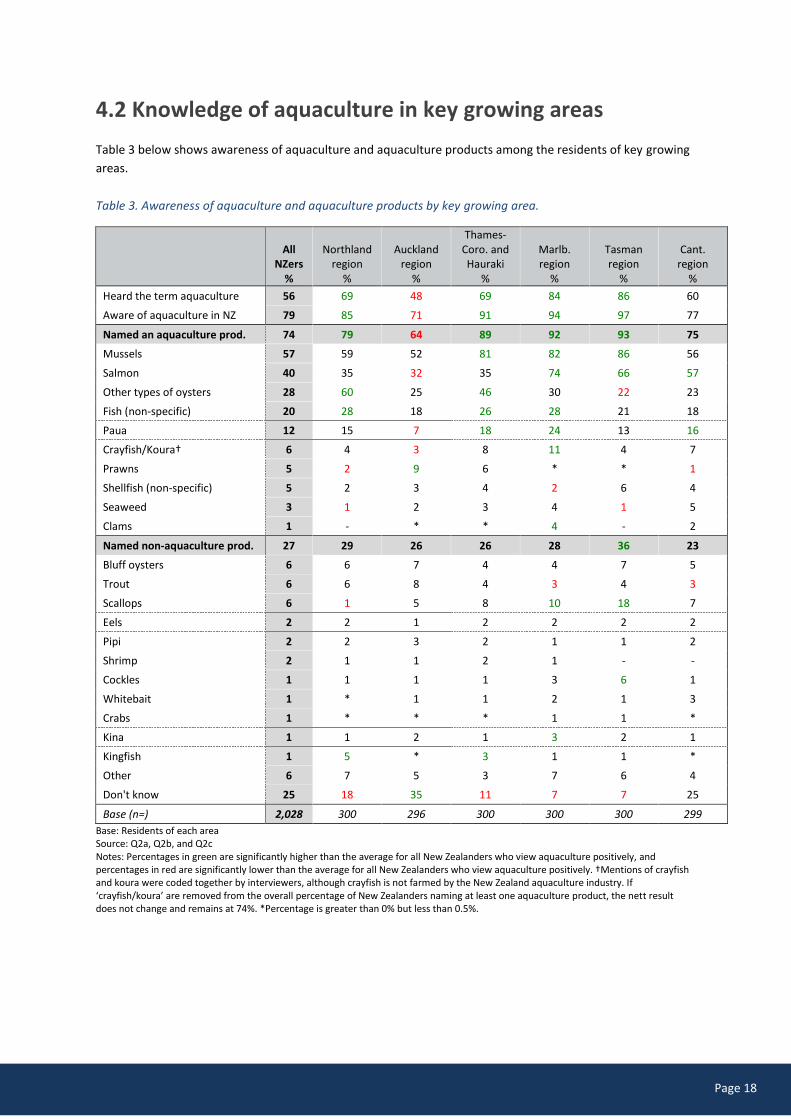
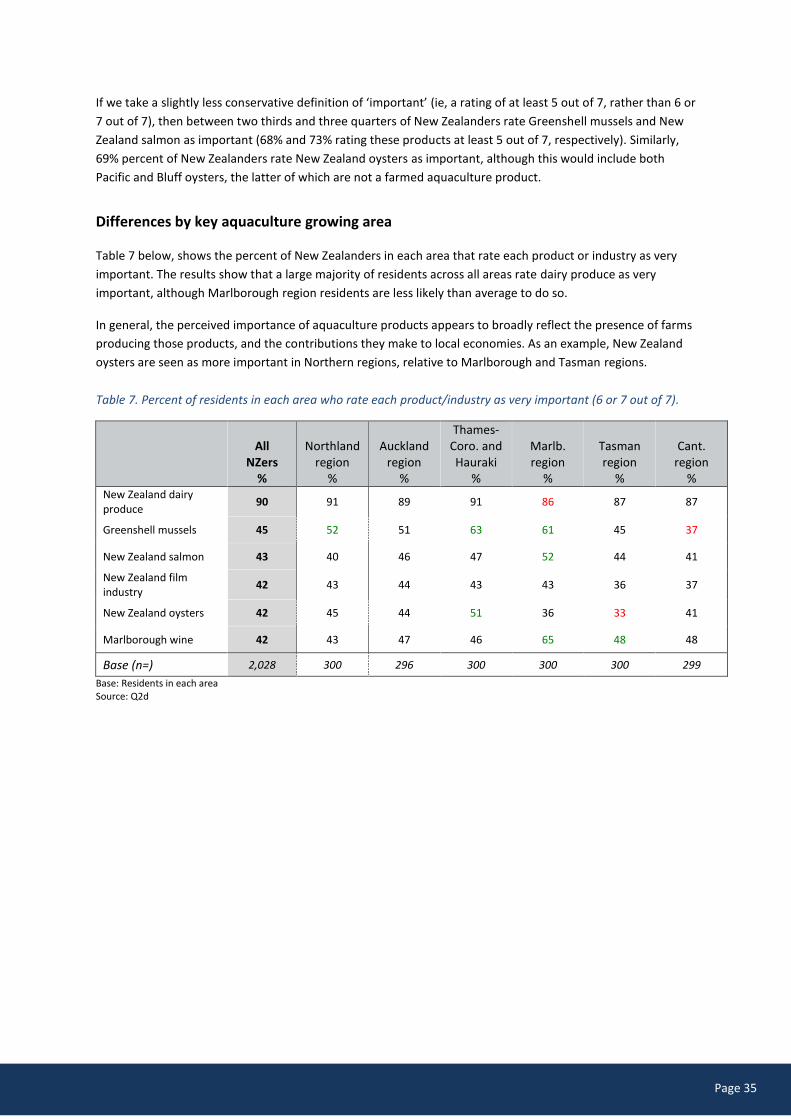
4.2 Knowledge of aquaculture in key growing areas
Table 3 below shows awareness of aquaculture and aquaculture products among the residents of key growing
areas.
Table 3. Awareness of aquaculture and aquaculture products by key growing area.
All
NZers %
Northland region
%
Auckland region
%
Thames-Coro. and Hauraki
%
Marlb. region
%
Tasman region
%
Cant. region
%
Heard the term aquaculture 56 69 48 69 84 86 60
Aware of aquaculture in NZ 79 85 71 91 94 97 77
Named an aquaculture prod. 74 79 64 89 92 93 75
Mussels 57 59 52 81 82 86 56
Salmon 40 35 32 35 74 66 57
Other types of oysters 28 60 25 46 30 22 23
Fish (non-specific) 20 28 18 26 28 21 18
Paua 12 15 7 18 24 13 16
Crayfish/Koura† 6 4 3 8 11 4 7
Prawns 5 2 9 6 * * 1
Shellfish (non-specific) 5 2 3 4 2 6 4
Seaweed 3 1 2 3 4 1 5
Clams 1 - * * 4 - 2
Named non-aquaculture prod. 27 29 26 26 28 36 23
Bluff oysters 6 6 7 4 4 7 5
Trout 6 6 8 4 3 4 3
Scallops 6 1 5 8 10 18 7
Eels 2 2 1 2 2 2 2
Pipi 2 2 3 2 1 1 2
Shrimp 2 1 1 2 1 - -
Cockles 1 1 1 1 3 6 1
Whitebait 1 * 1 1 2 1 3
Crabs 1 * * * 1 1 *
Kina 1 1 2 1 3 2 1
Kingfish 1 5 * 3 1 1 *
Other 6 7 5 3 7 6 4
Don't know 25 18 35 11 7 7 25
Base (n=) 2,028 300 296 300 300 300 299
Base: Residents of each area Source: Q2a, Q2b, and Q2c Notes: Percentages in green are significantly higher than the average for all New Zealanders who view aquaculture positively, and percentages in red are significantly lower than the average for all New Zealanders who view aquaculture positively. †Mentions of crayfish and koura were coded together by interviewers, although crayfish is not farmed by the New Zealand aquaculture industry. If ‘crayfish/koura’ are removed from the overall percentage of New Zealanders naming at least one aquaculture product, the nett result does not change and remains at 74%. *Percentage is greater than 0% but less than 0.5%.
Page 19
‹#›
As would be expected there is much greater awareness of aquaculture in areas where respondents report
more contact with those employed in the industry (see Figure 6, Page 31). Two thirds or more of residents of
Northland, Thames-Coromandel and Hauraki, Marlborough, and Tasman have heard of the term aquaculture,
and a large majority (85% to 97%) in each of these areas is aware of aquaculture in New Zealand. At least eight
in ten residents in these areas can also name one or more aquaculture products. Having said this, as at the
national level there also appears to be some degree of misconception within these areas about what is and is
not an aquaculture product. When asked to say what aquaculture they are aware of, around a third of
residents in these areas name a non-aquaculture product. Marlborough and Tasman residents, in particular,
are more likely than average to name scallops as a farmed seafood product (10% and 18%, respectively, cf. 6%
on average). This may be because some aquaculture farms in the Tasman region are used to catch scallop spat,
which are later transferred to the local seabed and form part of the wild commercial scallop fishery.
Overall, Auckland residents have less knowledge of aquaculture. Thirty five percent of Auckland residents
either say they are unaware of aquaculture in New Zealand or can’t name an aquaculture product, compared
to 25% nationally.
Results for Canterbury residents fairly closely mirror the national-level results, with the main exceptions that
Canterbury residents are more likely than average to mention that salmon (57%, cf. 40% on average) and paua
(16%, cf. 12% on average) are aquaculture products.

Page 20
‹#›
5. Consumption of aquaculture products
The 2008 survey of residents of Auckland, Northland, Hauraki-Coromandel, Nelson-Marlborough, and
Canterbury showed that around three quarters (76%) of respondents in these areas buy aquaculture products,
with the most common purchases being mussels, salmon and oysters.
In the present survey we asked respondents if they had purchased and eaten any farmed New Zealand
aquaculture products in the last 12 months. As can be seen in Figure 2 below, two thirds (66%) of New Zealand
residents have done so, and similar to the 2008 survey, the most common specific products consumed are
mussels (42%) and salmon (40%). A small proportion of respondents (13%) named non-aquaculture products
that they have consumed.
Figure 2. Consumption of aquaculture.
Base: All New Zealanders, n = 2,028Source: Q2e
*Mentions of crayfish and korua were coded together by interviewers, although crayfish is not farmed by the New Zealand aquaculture industry. If ‘crayfish/koura’ are removed from the overall percentage of New Zealanders consuming at least one aquaculture product, the nett result does not change and remains at 63%.
Consumption of aquaculture42%
40%
14%
6%
4%
2%
14%
4%
3%
1%
1%
1%
1%
4%
35%
66%of NZers have
consumed
aquaculture
products in the
last 12 months
63%of NZers have
consumed at least
one of these
aquaculture
products in the last
12 months
13%of NZers name
non-aquaculture
products they have
consumed
Mussels
Salmon
Other types of oysters (no mention of Bluff)
Prawns
Crayfish/Koura*
Paua
Fish (no specific species mentioned)
Bluff oysters
Scallops
Kina
Snapper
Shrimp
Tuna
Other
None / Don't know
Base: All New Zealanders, n = 2,028 Source: Q2f
Page 21
‹#›
Those more likely than average to say they have purchased and eaten aquaculture products in the last 12
months are:
Thames-Coromandel and Hauraki residents (73%)
males (70%)
those aged 60 years or over (74%)
those with an annual household income over $50,000 (72%)
boat owners (72%)
those who use the coastal area for recreation frequently, more than 10 times per year (73%)
those who know someone working in aquaculture (83%).
At the overall aquaculture consumption level, there are no differences by ethnic group, however differences
do exist at the product level.
New Zealand Europeans are more likely than average to have consumed salmon (44%, cf. 40% on
average).
Māori are considerably less likely than average to have consumed salmon (30%, cf. 40% on average), and
are more likely than average to have consumed oysters (not Bluff, 21%, cf. 14% on average) and prawns
(10%, cf. 6% on average).

Page 22
‹#›
6. New Zealanders’ perceptions of the aquaculture
industry
6.1 Overall perceptions
Without any prompting about the possible positive or negative impacts of aquaculture, we asked all
respondents to tell us the extent to which their views of the aquaculture industry are positive or negative.
Figure 3. New Zealanders’ overall perceptions of the aquaculture industry.
Close to three quarters (73%) of New Zealanders have positive views of the industry overall, and only a small
minority (5%) view the industry negatively. A fifth (20%) of New Zealanders do not feel particularly positive or
negative.
When analysed across all New Zealanders, those more likely than average (73%) to view the industry positively
include:
males (78%)
older New Zealanders, aged 60 years or more (83%)
those identifying with an Asian ethnic group (90%)
those in lower income households, with an annual household income up to $50,000 (76%)
those who know someone working in the aquaculture industry (79%)
those who have purchased and eaten an aquaculture product in the last 12 months (79%).
24% very positive
Overall perceptions of aquaculture
Base: All New Zealanders, n = 2,028Source: Q3a
49% quite positive
20% neither positive nor negative
3% quite negative
1% very negative
2% don’t know
73%Of NZers have
positive
perceptions
5%Of NZers
have
negative
perceptions*
*Percentages in the chart do not add to 5% due to rounding

Page 23
‹#›
Those less likely than average (73%) to view the industry positively include:
females (68%)
those aged 30 to 39 years (62%)
those who identify with a non-New Zealand European ethnic group (60%)
those who have not purchased and eaten an aquaculture product in the last 12 months (60%)
those who say their use of the coastal area has been negatively impacted by aquaculture (46%).
Perceptions of the industry by knowledge of the industry
Figure 4 below segments New Zealanders based on their perceptions of and knowledge about aquaculture. For
the purpose of this analysis, someone who knows about aquaculture was considered to be someone who
recognises the term aquaculture and can name at least one specific aquaculture product, including mussels,
salmon, (non-Bluff) oysters, paua, crayfish/koura, prawns, seaweed, or clams. To help differentiate
respondents based on their knowledge of aquaculture, we did not include general mentions of shellfish or fish
in this analysis.
Figure 4. Perceptions of aquaculture by knowledge of the industry.
Knows about aquaculture
Base: All New Zealanders, n = 2,028Source: Q2a, Q2c, and Q3a
2%
9%
36% 37%
14%
2%
Someone in this group either does not
recognise the term aquaculture or
cannot name at least one specific
aquaculture product.
Does not knowabout aquaculture
Someone in this group recognises the term aquaculture and can name at least one specific aquaculture product.
Note: Those who ‘don’t know’ their view of aquaculture have been placed in the neutral segment for this analysis.
Positive 70%
Neutral 26%
Negative 5%
Perceptions held by those who do not know about
aquaculture (n=721)
Positive 76%
Neutral 19%
Negative 5%
Perceptions held by those who know about aquaculture (n=1,307)

Page 24
‹#›
What is perhaps most important in this chart is that half of respondents (51%) have positive or neutral views of
the industry based on little to no understanding of what aquaculture is. Additionally, relative to those who
know about aquaculture, those who don’t are less likely to hold positive perceptions (70%, cf. 76% who know
about aquaculture) and more likely to hold neutral perceptions (26%, cf. 19% who know about aquaculture).
Although their views are not negative at this point, these New Zealanders will be more susceptible than others
to change as a result of negative publicity about aquaculture or other related industries.
A key challenge for improving community support and understanding will be lifting the profile of aquaculture
among New Zealanders who have low knowledge of the industry, and differentiating it from other sea
activities and seafood products.
Analysis of the demographic profile of respondents shows that the following groups are over-represented,
relative to the adult New Zealand population, among those who do not know about aquaculture:
Auckland residents (40%)
females (59%)
those aged 18 to 34 years (40%)
Pacific (10%) and Asian people (18%)
those who do not own a boat (95%)
those who do not own or live in coastal property (87%)
those who do not know someone who works in the aquaculture industry (90%)
those who have not purchased and eaten any aquaculture products in the previous 12 months (40%).
Page 25
‹#›
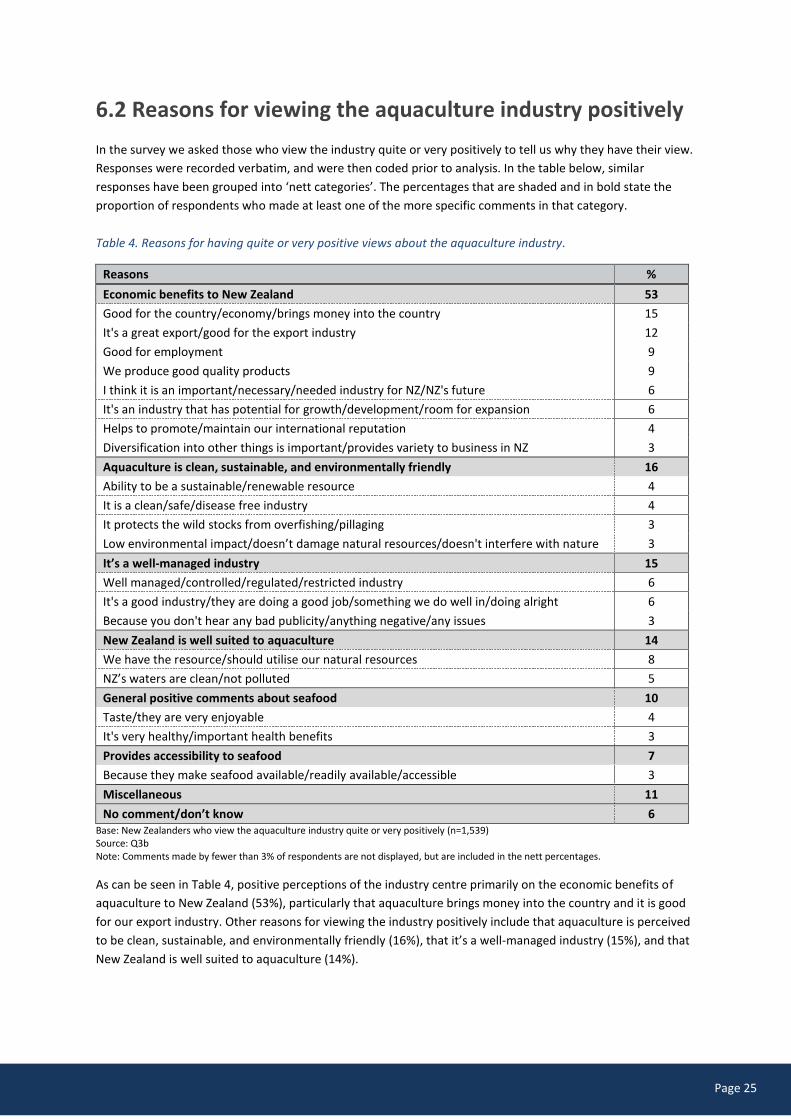
6.2 Reasons for viewing the aquaculture industry positively
In the survey we asked those who view the industry quite or very positively to tell us why they have their view.
Responses were recorded verbatim, and were then coded prior to analysis. In the table below, similar
responses have been grouped into ‘nett categories’. The percentages that are shaded and in bold state the
proportion of respondents who made at least one of the more specific comments in that category.
Table 4. Reasons for having quite or very positive views about the aquaculture industry.
Reasons %
Economic benefits to New Zealand 53
Good for the country/economy/brings money into the country 15
It's a great export/good for the export industry 12
Good for employment 9
We produce good quality products 9
I think it is an important/necessary/needed industry for NZ/NZ's future 6
It's an industry that has potential for growth/development/room for expansion 6
Helps to promote/maintain our international reputation 4
Diversification into other things is important/provides variety to business in NZ 3
Aquaculture is clean, sustainable, and environmentally friendly 16
Ability to be a sustainable/renewable resource 4
It is a clean/safe/disease free industry 4
It protects the wild stocks from overfishing/pillaging 3
Low environmental impact/doesn’t damage natural resources/doesn't interfere with nature 3
It’s a well-managed industry 15
Well managed/controlled/regulated/restricted industry 6
It's a good industry/they are doing a good job/something we do well in/doing alright 6
Because you don't hear any bad publicity/anything negative/any issues 3
New Zealand is well suited to aquaculture 14
We have the resource/should utilise our natural resources 8
NZ’s waters are clean/not polluted 5
General positive comments about seafood 10
Taste/they are very enjoyable 4
It's very healthy/important health benefits 3
Provides accessibility to seafood 7
Because they make seafood available/readily available/accessible 3
Miscellaneous 11
No comment/don’t know 6 Base: New Zealanders who view the aquaculture industry quite or very positively (n=1,539) Source: Q3b Note: Comments made by fewer than 3% of respondents are not displayed, but are included in the nett percentages.
As can be seen in Table 4, positive perceptions of the industry centre primarily on the economic benefits of
aquaculture to New Zealand (53%), particularly that aquaculture brings money into the country and it is good
for our export industry. Other reasons for viewing the industry positively include that aquaculture is perceived
to be clean, sustainable, and environmentally friendly (16%), that it’s a well-managed industry (15%), and that
New Zealand is well suited to aquaculture (14%).

Page 26
‹#›
Comments mentioned under miscellaneous included: aquaculture is part of our culture, comments about a
general (non-specific) awareness of aquaculture, comments about aquaculture being produced locally or in
New Zealand, and comments that aquaculture is acceptable as long as it is well-managed.
In the follow up qualitative forum, residents of aquaculture growing areas commented on their views of the
aquaculture industry. Comments below highlight some of the reasons that residents feel positive about the
industry.
Residents are positive because they see the employment benefits for their region.
“I have a positive view of the industry. We have a paua aquaculture business in our area, and it
provides jobs to locals (my neighbour included), and I presume provides a safe and environmentally
friendly way to reproduce paua for overseas sales.”
Resident of Northland, Pakeha, 30 to 34, female
Residents are positive about the economic benefits of the aquaculture industry.
“I feel very positive about the aquaculture industry. The Marlborough economy is very
reliant on aquaculture and any growth will ensure growth for this area. The economy
benefits not only from salaries paid to workers but there also are many small businesses
that have developed products and services especially for this industry. It is not as well
publicised as the viticulture industry but I understand the province benefits more from
aquaculture than wine.”
Resident of Marlborough, Pakeha, 50 to 59, female.

Page 27
‹#›
6.3 Reasons for viewing the aquaculture industry negatively
Table 5 below displays the reasons survey respondents gave for viewing the industry quite or very negatively.
Respondents most commonly mentioned concerns about the environmental impact of aquaculture (38%). This
was followed by the price of aquaculture products (16%), and concerns about genetic modification (13%).
Dissatisfaction with the aesthetic qualities of aquaculture farms was a top-of-mind concern for only 6% of
respondents who have negative views of the industry.
Interestingly, the second most common reason for having a negative view of the industry does not relate to
aquaculture. Seventeen percent of those with negative views provided comments about over-fishing. This
finding reinforces the results earlier in the report showing that a degree of misconception exists about
aquaculture. In addition, these comments raise the possibility the negative publicity surrounding non-
aquaculture industries or activities can have an impact on public perceptions of aquaculture, especially among
those with less knowledge of the industry.
Table 5. Reasons for having quite or very negative views about the aquaculture industry.
Reasons %
Not good for environment/causes pollution/rubbish/damage to the ocean/dirty water etc. 38
Need more control/penalties with people over-fishing/taking more than the quota 17
Too expensive/needs to be cheaper for New Zealanders 16
Not natural/genetically modified 13
They are an eyesore/concerns with aesthetic qualities of farms 6
Dislike seafood/don't eat seafood 4
It's an industry that has potential for growth/development/room for expansion 4
Contracts going to foreign companies/foreign companies fishing our fish 3
It encroaches on recreational areas 3
Not enough advertising/awareness about aquaculture 3
Other 2
No comment/don’t know 12 Base: New Zealanders who view the aquaculture industry quite or very negatively (n=99) Source: Q3b Note: Comments made by fewer than 3% of respondents are not displayed, but are included in the nett percentages.
In the follow up qualitative forum, residents of aquaculture regions commented on their views of the
aquaculture industry. Comments below highlight some of the concerns residents have with the environmental
impact of the industry.
“It is important to think hard about the long term impact of this industry. Sure, it might bring in some
jobs and money in the short term - but we must look very closely at environmental impacts long term.
There needs to be more research done into this, also time restrictions on aquaculture pursuits to allow
for ongoing risk assessment. No environment, no economy.”
Resident of Marlborough, Pakeha, 50 to 59, female

Page 28
‹#›
“The negative feelings I have toward the industry itself relate to short-term monetary greed overriding
any responsibility towards the long-term sustainability of the environment. Clean fresh water and
marine resources are critical to all life, and should be protected first and foremost for the benefit of
New Zealanders rather than allowing our own water resources to be stripped and polluted, and the
expensive products sent overseas to line the pockets of a few, rather than feeding New Zealanders
first.”
Resident of Auckland, other ethnicity, 35 to 39, female

Page 29
‹#›
6.4 Perceptions of aquaculture in key growing areas
Figure 5 below displays public perceptions of the aquaculture industry for residents of each key aquaculture
growing area. By and large, perceptions of the industry in key areas do not differ markedly from the national
result with around three quarters of those in each area viewing the industry positively overall. The one
exception is those living in Thames-Coromandel and Hauraki districts, who are particularly positive (84%).
Figure 5. Overall perceptions of the aquaculture industry nationally and for key aquaculture areas.
The economic significance of aquaculture in smaller regions
Further analysis of the survey results suggests that residents in smaller regions are most likely to appreciate
the economic benefits provided by the aquaculture industry, and in particular the employment benefits.
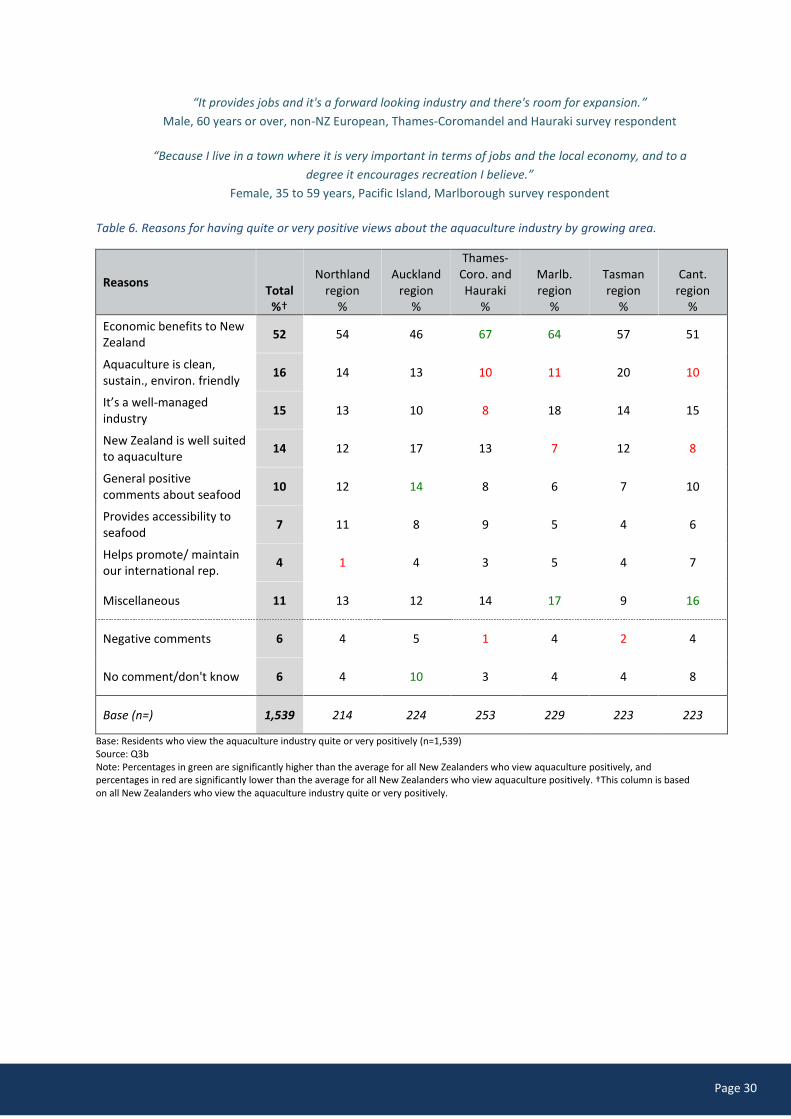
Table 6 on the following page displays the reasons for having positive views by aquaculture area. As can be
seen in the table, residents of both Thames-Coromandel and Hauraki districts (67%) and Marlborough region
(64%) are more likely than average (52%) to focus on the economic benefits of aquaculture. In particular,
residents in both areas tend to emphasise the employment benefits of aquaculture (24% and 16% in each
area, respectively, compared to a national average of 9%). The results in the following section also illustrate
that residents in these areas are more likely than average to pay attention to or receive information from
media, including newspapers, brochures and flyers, and over the radio.
Overall view of the aquaculture industry by area
24
35
27
24
23
24
25
49
49
48
49
51
48
46
20
12
17
19
20
22
20
3
1
3
5
3
3
5
1
3
2
1
2
2
2
2
1
2
2
2
0% 20% 40% 60% 80% 100%
Strongly agree Tend to agree Neither agree nor disagree Tend to disagree Strongly disagree Don't know
73% of Nzers agree 5% of NZers disagree
73
84
76
74
74
72
71
Agree%
Base: All New Zealanders, n = 2,028Source: Q3a
Note: indicates a result that is significantly higher or lower than the national result
All New Zealanders
Thames-Coromandel & Hauraki (n=300)
Auckland region (n=296)
Marlborough region (n=300)
Tasman region (n=300)
Canterbury region (n=299)
Northland region (n=300)
Page 30
‹#›
“It provides jobs and it's a forward looking industry and there's room for expansion.”
Male, 60 years or over, non-NZ European, Thames-Coromandel and Hauraki survey respondent
“Because I live in a town where it is very important in terms of jobs and the local economy, and to a
degree it encourages recreation I believe.”
Female, 35 to 59 years, Pacific Island, Marlborough survey respondent
Table 6. Reasons for having quite or very positive views about the aquaculture industry by growing area.
Reasons Total %†
Northland region
%
Auckland region
%
Thames-Coro. and Hauraki
%
Marlb. region
%
Tasman region
%
Cant. region
%
Economic benefits to New Zealand
52 54 46 67 64 57 51
Aquaculture is clean, sustain., environ. friendly
16 14 13 10 11 20 10
It’s a well-managed industry
15 13 10 8 18 14 15
New Zealand is well suited to aquaculture
14 12 17 13 7 12 8
General positive comments about seafood
10 12 14 8 6 7 10
Provides accessibility to seafood
7 11 8 9 5 4 6
Helps promote/ maintain our international rep.
4 1 4 3 5 4 7
Miscellaneous 11 13 12 14 17 9 16
Negative comments 6 4 5 1 4 2 4
No comment/don't know 6 4 10 3 4 4 8
Base (n=) 1,539 214 224 253 229 223 223
Base: Residents who view the aquaculture industry quite or very positively (n=1,539) Source: Q3b Note: Percentages in green are significantly higher than the average for all New Zealanders who view aquaculture positively, and percentages in red are significantly lower than the average for all New Zealanders who view aquaculture positively. †This column is based on all New Zealanders who view the aquaculture industry quite or very positively.
Page 31
‹#›
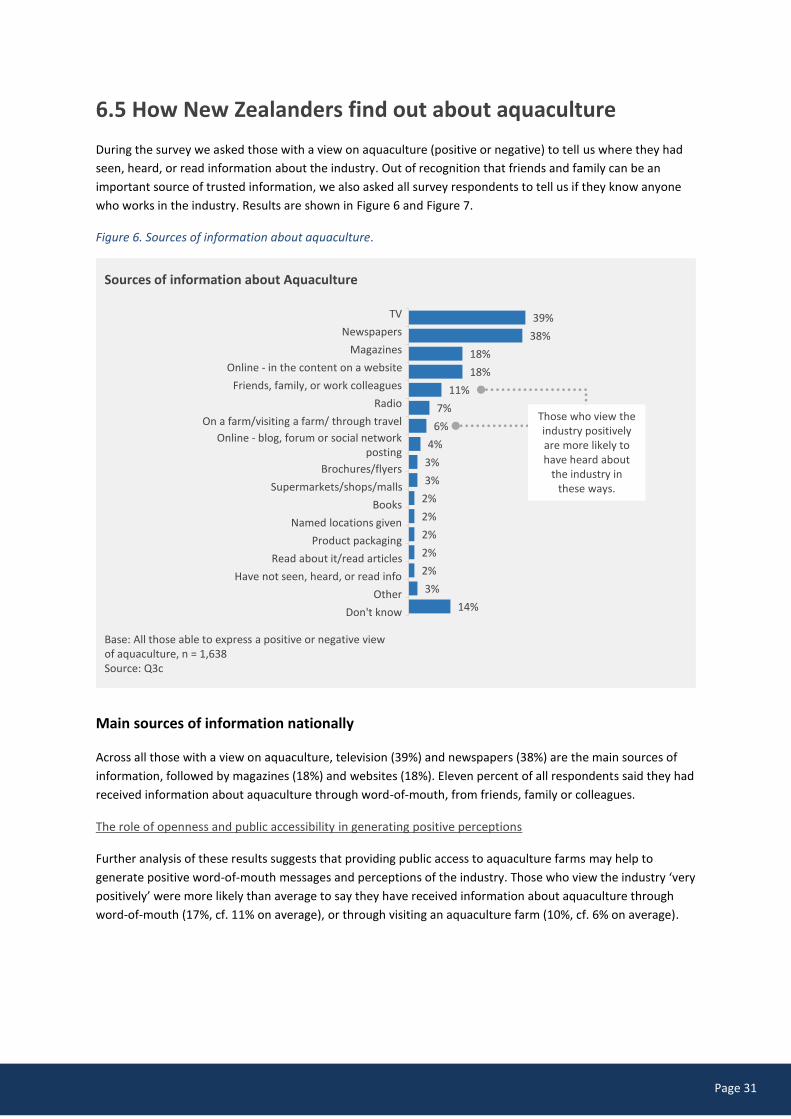
6.5 How New Zealanders find out about aquaculture
During the survey we asked those with a view on aquaculture (positive or negative) to tell us where they had
seen, heard, or read information about the industry. Out of recognition that friends and family can be an
important source of trusted information, we also asked all survey respondents to tell us if they know anyone
who works in the industry. Results are shown in Figure 6 and Figure 7.
Figure 6. Sources of information about aquaculture.
Main sources of information nationally
Across all those with a view on aquaculture, television (39%) and newspapers (38%) are the main sources of
information, followed by magazines (18%) and websites (18%). Eleven percent of all respondents said they had
received information about aquaculture through word-of-mouth, from friends, family or colleagues.
The role of openness and public accessibility in generating positive perceptions
Further analysis of these results suggests that providing public access to aquaculture farms may help to
generate positive word-of-mouth messages and perceptions of the industry. Those who view the industry ‘very
positively’ were more likely than average to say they have received information about aquaculture through
word-of-mouth (17%, cf. 11% on average), or through visiting an aquaculture farm (10%, cf. 6% on average).
Base: All those able to express a positive or negative view of aquaculture, n = 1,638Source: Q3c
39%
38%
18%
18%
11%
7%
6%
4%
3%
3%
2%
2%
2%
2%
2%
3%
14%
Sources of information about Aquaculture
TV
Newspapers
Magazines
Online - in the content on a website
Friends, family, or work colleagues
Radio
On a farm/visiting a farm/ through travel
Online - blog, forum or social network posting
Brochures/flyers
Supermarkets/shops/malls
Books
Named locations given
Product packaging
Read about it/read articles
Have not seen, heard, or read info
Other
Don't know
Those who view the industry positively are more likely to have heard about
the industry in these ways.
Page 32
‹#›
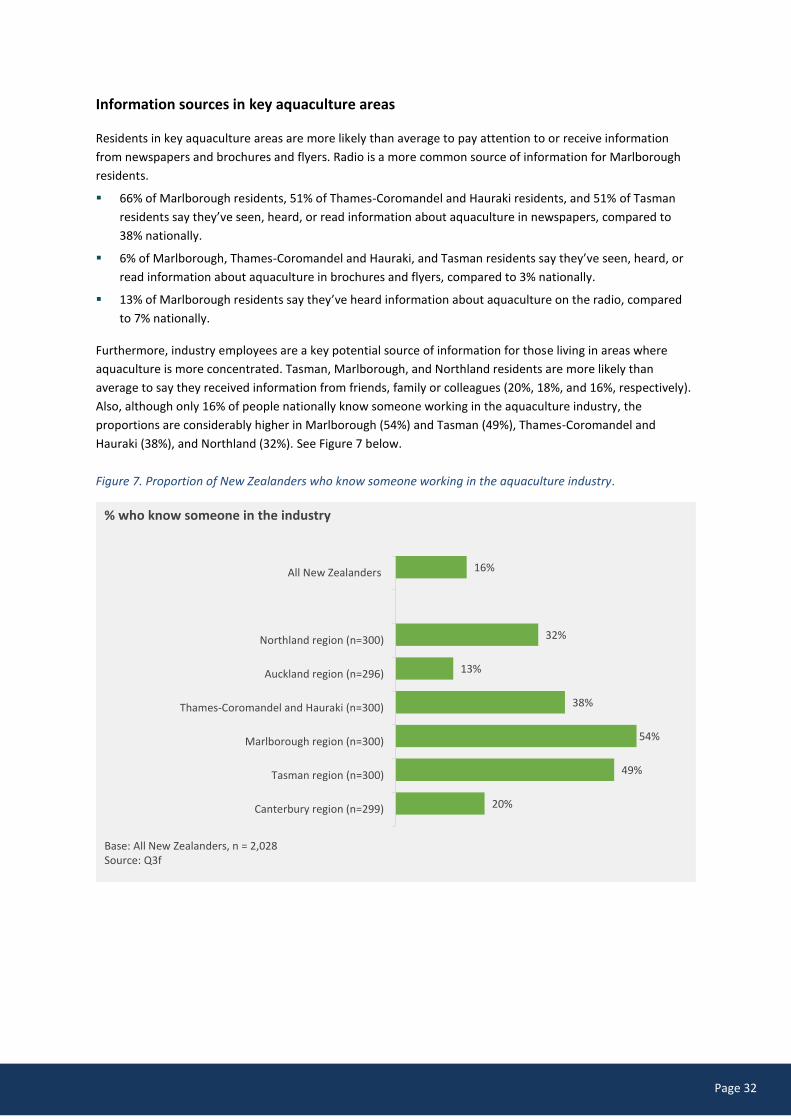
Information sources in key aquaculture areas
Residents in key aquaculture areas are more likely than average to pay attention to or receive information
from newspapers and brochures and flyers. Radio is a more common source of information for Marlborough
residents.
66% of Marlborough residents, 51% of Thames-Coromandel and Hauraki residents, and 51% of Tasman
residents say they’ve seen, heard, or read information about aquaculture in newspapers, compared to
38% nationally.
6% of Marlborough, Thames-Coromandel and Hauraki, and Tasman residents say they’ve seen, heard, or
read information about aquaculture in brochures and flyers, compared to 3% nationally.
13% of Marlborough residents say they’ve heard information about aquaculture on the radio, compared
to 7% nationally.
Furthermore, industry employees are a key potential source of information for those living in areas where
aquaculture is more concentrated. Tasman, Marlborough, and Northland residents are more likely than
average to say they received information from friends, family or colleagues (20%, 18%, and 16%, respectively).
Also, although only 16% of people nationally know someone working in the aquaculture industry, the
proportions are considerably higher in Marlborough (54%) and Tasman (49%), Thames-Coromandel and
Hauraki (38%), and Northland (32%). See Figure 7 below.
Figure 7. Proportion of New Zealanders who know someone working in the aquaculture industry.
Base: All New Zealanders, n = 2,028Source: Q3f
16%
32%
13%
38%
54%
49%
20%
All New Zealanders
Northland region (n=300)
Auckland region (n=296)
Thames-Coromandel and Hauraki (n=300)
Marlborough region (n=300)
Tasman region (n=300)
Canterbury region (n=299)
% who know someone in the industry
Page 33
‹#›
Other demographic differences
Other demographic differences in information sources are listed below.
Males are more likely than females to read information in newspapers (42%, cf. 35% of females).
Young people, aged 18 to 35 years, are more likely than average to read information online, on websites
(29%, cf. 18% on average) and through social media (7%, cf. 4% on average). They are less likely than
average to see, hear, or read information in traditional media, such as on TV (31%, cf. 39% on average), in
newspapers (21%, cf. 38% on average), and in magazines (12%, cf. 18% on average). Young people are also
less likely than average to have received information through word-of-mouth (6%, cf. 11% on average).
Conversely, those over 60 years of age are more likely than average to see, hear, or read information in
traditional media, such as in newspapers (51%, cf. 38% on average), in magazines (25%, cf. 18% on
average) and over the radio (9%, cf. 7% on average). They are much less likely to get information from
websites (8%, cf. 18% on average).
Asian people are more likely than average to read information on websites (34%, cf. 18% on average).
They are less likely than average to see, hear, or read information on TV (23%, cf. 39% on average) and in
newspapers (11%, cf. 38% on average).
Non-NZ Europeans are more likely than average to hear information through friends, family, or work
colleagues (19%, cf. 11% on average), and get information via social media (9%, cf. 4% on average).
Page 34
‹#›
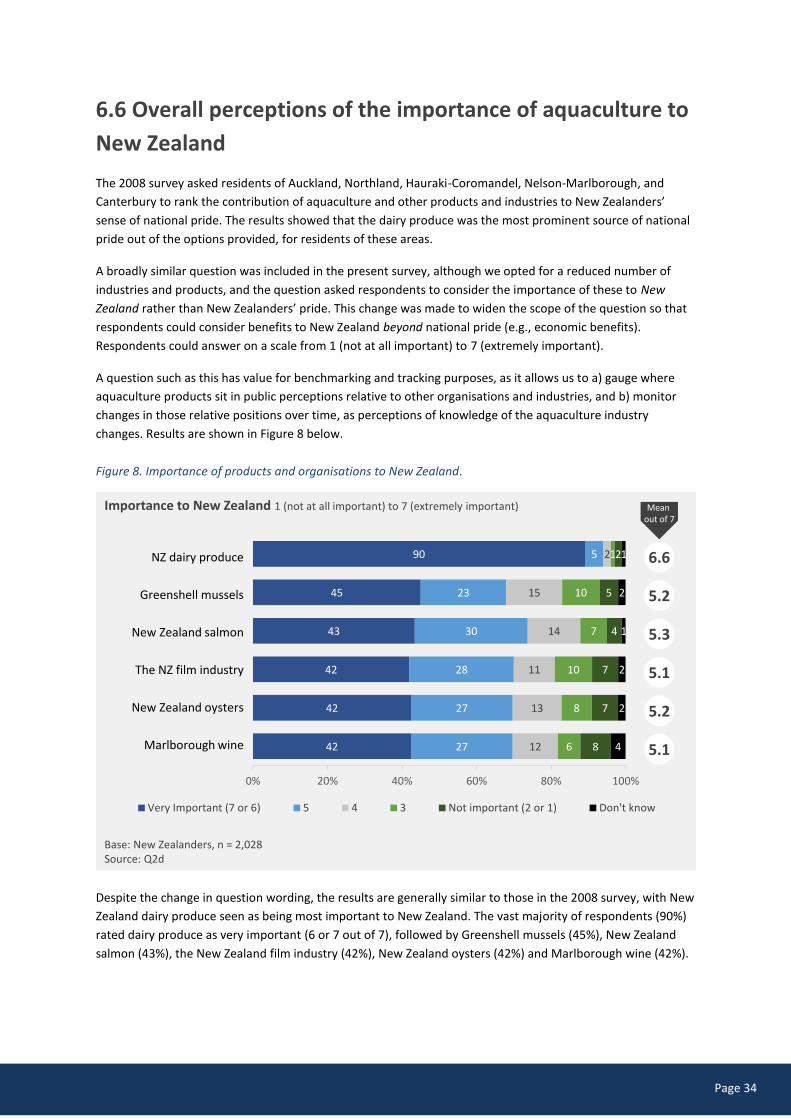
6.6 Overall perceptions of the importance of aquaculture to
New Zealand
The 2008 survey asked residents of Auckland, Northland, Hauraki-Coromandel, Nelson-Marlborough, and
Canterbury to rank the contribution of aquaculture and other products and industries to New Zealanders’
sense of national pride. The results showed that the dairy produce was the most prominent source of national
pride out of the options provided, for residents of these areas.
A broadly similar question was included in the present survey, although we opted for a reduced number of
industries and products, and the question asked respondents to consider the importance of these to New
Zealand rather than New Zealanders’ pride. This change was made to widen the scope of the question so that
respondents could consider benefits to New Zealand beyond national pride (e.g., economic benefits).
Respondents could answer on a scale from 1 (not at all important) to 7 (extremely important).
A question such as this has value for benchmarking and tracking purposes, as it allows us to a) gauge where
aquaculture products sit in public perceptions relative to other organisations and industries, and b) monitor
changes in those relative positions over time, as perceptions of knowledge of the aquaculture industry
changes. Results are shown in Figure 8 below.
Figure 8. Importance of products and organisations to New Zealand.
Despite the change in question wording, the results are generally similar to those in the 2008 survey, with New
Zealand dairy produce seen as being most important to New Zealand. The vast majority of respondents (90%)
rated dairy produce as very important (6 or 7 out of 7), followed by Greenshell mussels (45%), New Zealand
salmon (43%), the New Zealand film industry (42%), New Zealand oysters (42%) and Marlborough wine (42%).
Importance to New Zealand 1 (not at all important) to 7 (extremely important)
90
45
43
42
42
42
5
23
30
28
27
27
2
15
14
11
13
12
1
10
7
10
8
6
2
5
4
7
7
8
1
2
1
2
2
4
0% 20% 40% 60% 80% 100%
Very Important (7 or 6) 5 4 3 Not important (2 or 1) Don't know
Base: New Zealanders, n = 2,028Source: Q2d
NZ dairy produce
Greenshell mussels
New Zealand salmon
The NZ film industry
New Zealand oysters
Marlborough wine
6.6
5.2
5.3
5.1
5.2
5.1
Mean out of 7
Page 35
‹#›
If we take a slightly less conservative definition of ‘important’ (ie, a rating of at least 5 out of 7, rather than 6 or
7 out of 7), then between two thirds and three quarters of New Zealanders rate Greenshell mussels and New
Zealand salmon as important (68% and 73% rating these products at least 5 out of 7, respectively). Similarly,
69% percent of New Zealanders rate New Zealand oysters as important, although this would include both
Pacific and Bluff oysters, the latter of which are not a farmed aquaculture product.
Differences by key aquaculture growing area
Table 7 below, shows the percent of New Zealanders in each area that rate each product or industry as very
important. The results show that a large majority of residents across all areas rate dairy produce as very
important, although Marlborough region residents are less likely than average to do so.
In general, the perceived importance of aquaculture products appears to broadly reflect the presence of farms
producing those products, and the contributions they make to local economies. As an example, New Zealand
oysters are seen as more important in Northern regions, relative to Marlborough and Tasman regions.
Table 7. Percent of residents in each area who rate each product/industry as very important (6 or 7 out of 7).
All NZers
%
Northland region
%
Auckland region
%
Thames-Coro. and Hauraki
%
Marlb. region
%
Tasman region
%
Cant. region
% New Zealand dairy produce
90 91 89 91 86 87 87
Greenshell mussels 45 52 51 63 61 45 37
New Zealand salmon 43 40 46 47 52 44 41
New Zealand film industry
42 43 44 43 43 36 37
New Zealand oysters 42 45 44 51 36 33 41
Marlborough wine 42 43 47 46 65 48 48
Base (n=) 2,028 300 296 300 300 300 299
Base: Residents in each area Source: Q2d
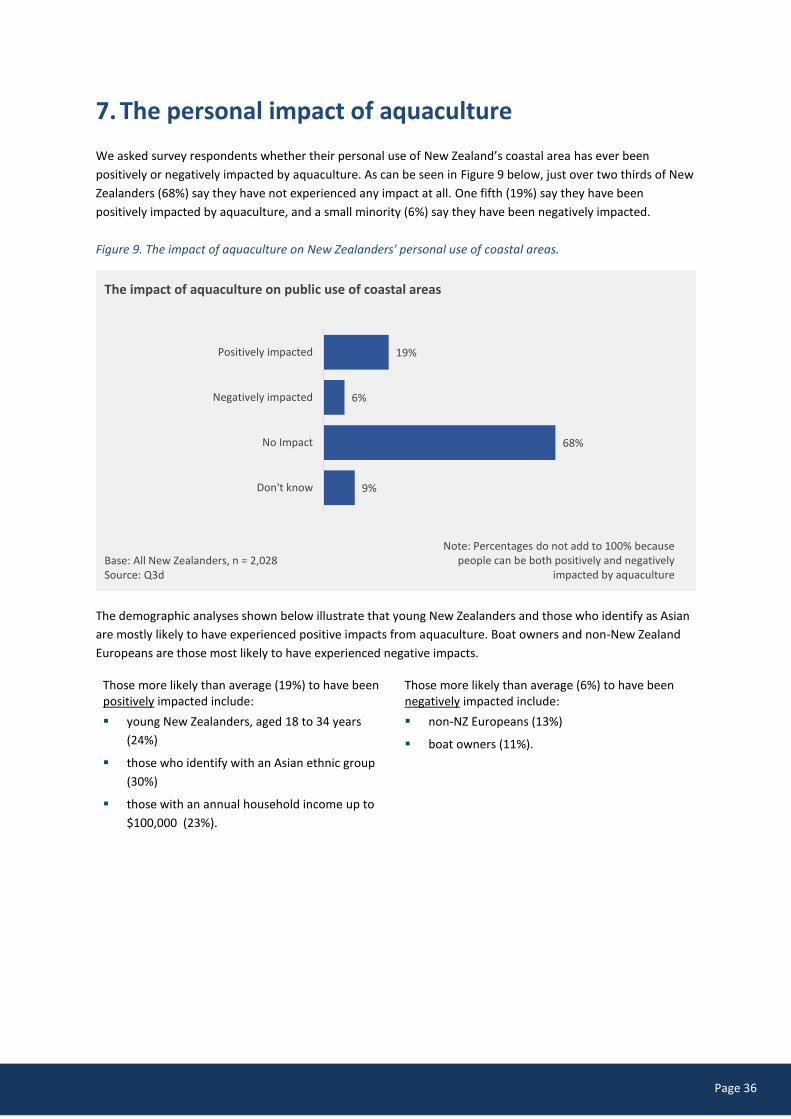
Page 36
‹#›
7. The personal impact of aquaculture
We asked survey respondents whether their personal use of New Zealand’s coastal area has ever been
positively or negatively impacted by aquaculture. As can be seen in Figure 9 below, just over two thirds of New
Zealanders (68%) say they have not experienced any impact at all. One fifth (19%) say they have been
positively impacted by aquaculture, and a small minority (6%) say they have been negatively impacted.
Figure 9. The impact of aquaculture on New Zealanders' personal use of coastal areas.
The demographic analyses shown below illustrate that young New Zealanders and those who identify as Asian
are mostly likely to have experienced positive impacts from aquaculture. Boat owners and non-New Zealand
Europeans are those most likely to have experienced negative impacts.
Those more likely than average (19%) to have been positively impacted include:
young New Zealanders, aged 18 to 34 years
(24%)
those who identify with an Asian ethnic group
(30%)
those with an annual household income up to
$100,000 (23%).
Those more likely than average (6%) to have been negatively impacted include:
non-NZ Europeans (13%)
boat owners (11%).
Base: All New Zealanders, n = 2,028Source: Q3d
19%
6%
68%
9%
Positively impacted
Negatively impacted
No Impact
Don't know
The impact of aquaculture on public use of coastal areas
Note: Percentages do not add to 100% because people can be both positively and negatively
impacted by aquaculture
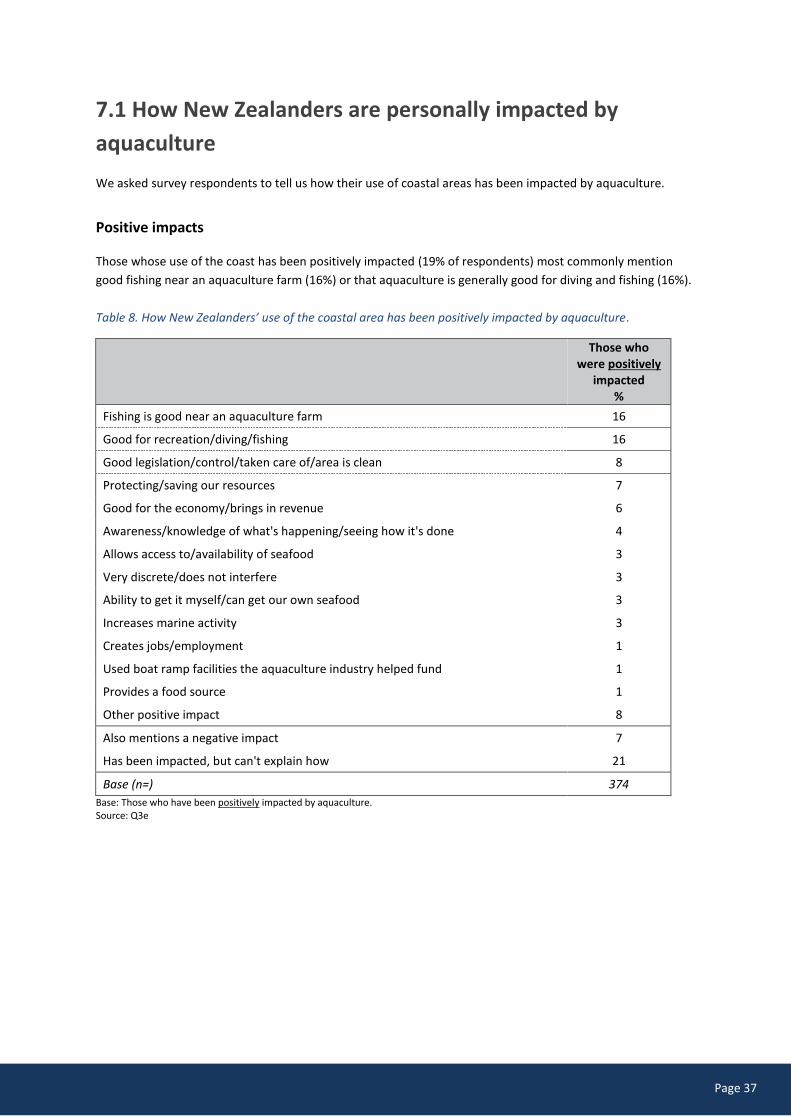
Page 37
‹#›
7.1 How New Zealanders are personally impacted by
aquaculture
We asked survey respondents to tell us how their use of coastal areas has been impacted by aquaculture.
Positive impacts
Those whose use of the coast has been positively impacted (19% of respondents) most commonly mention
good fishing near an aquaculture farm (16%) or that aquaculture is generally good for diving and fishing (16%).
Table 8. How New Zealanders’ use of the coastal area has been positively impacted by aquaculture.
Those who were positively
impacted %
Fishing is good near an aquaculture farm 16
Good for recreation/diving/fishing 16
Good legislation/control/taken care of/area is clean 8
Protecting/saving our resources 7
Good for the economy/brings in revenue 6
Awareness/knowledge of what's happening/seeing how it's done 4
Allows access to/availability of seafood 3
Very discrete/does not interfere 3
Ability to get it myself/can get our own seafood 3
Increases marine activity 3
Creates jobs/employment 1
Used boat ramp facilities the aquaculture industry helped fund 1
Provides a food source 1
Other positive impact 8
Also mentions a negative impact 7
Has been impacted, but can't explain how 21
Base (n=) 374
Base: Those who have been positively impacted by aquaculture. Source: Q3e

Page 38
‹#›
Negative impacts
Those whose use of the coast has been negatively impacted (6% of respondents) most commonly mention
restricted access to coastal areas (14%), and impact on water quality around an aquaculture farm (10%).
Table 9. How New Zealanders’ use of the coastal area has been negatively impacted by aquaculture.
Those who were negatively
impacted %
Restricts my access to the beach/coastal areas/public space 14
Impacted the water quality/polluted the water 10
Over farming/depleting resources 8
Not safe/clean/disease free 6
Didn't like the look of them/spoilt the scenery 6
Changed natural/recreational area to an industrial area 5
Pollution/litter/rubbish 4
The farm was a safety hazard/dangerous for boats/ships 4
Environmental impacts/doesn't look after the environment 4
Harmed the natural/local fish in the area 2
The smell/didn't like the smell 1
Rubbish produced by farms on the beach 1
Impacts traditional/customary Māori interaction with foreshore/coast 1
Other negative impact 15
Also mentions a positive impact 21
Has been impacted, but can't explain how 14
Base (n=) 190
Base: Those who have been negatively impacted by aquaculture. Source: Q3e
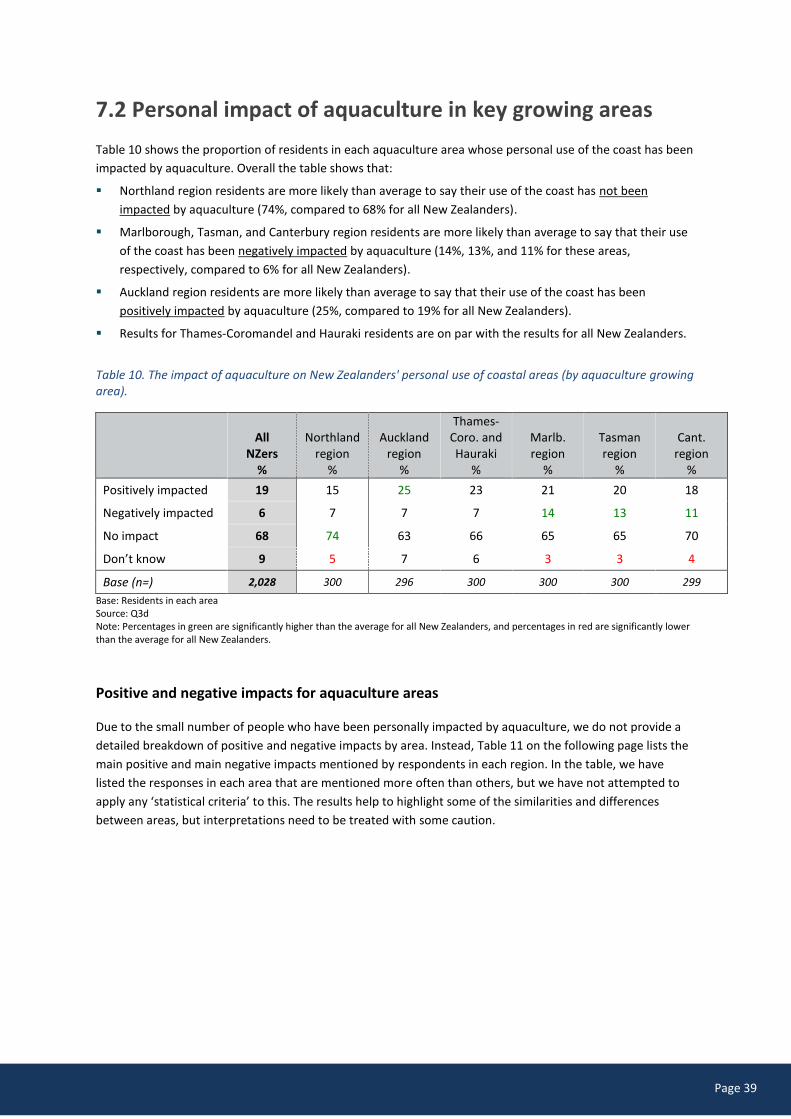
Page 39
‹#›
7.2 Personal impact of aquaculture in key growing areas
Table 10 shows the proportion of residents in each aquaculture area whose personal use of the coast has been
impacted by aquaculture. Overall the table shows that:
Northland region residents are more likely than average to say their use of the coast has not been
impacted by aquaculture (74%, compared to 68% for all New Zealanders).
Marlborough, Tasman, and Canterbury region residents are more likely than average to say that their use
of the coast has been negatively impacted by aquaculture (14%, 13%, and 11% for these areas,
respectively, compared to 6% for all New Zealanders).
Auckland region residents are more likely than average to say that their use of the coast has been
positively impacted by aquaculture (25%, compared to 19% for all New Zealanders).
Results for Thames-Coromandel and Hauraki residents are on par with the results for all New Zealanders.
Table 10. The impact of aquaculture on New Zealanders' personal use of coastal areas (by aquaculture growing area).
All NZers
%
Northland region
%
Auckland region
%
Thames-Coro. and Hauraki
%
Marlb. region
%
Tasman region
%
Cant. region
%
Positively impacted 19 15 25 23 21 20 18
Negatively impacted 6 7 7 7 14 13 11
No impact 68 74 63 66 65 65 70
Don’t know 9 5 7 6 3 3 4
Base (n=) 2,028 300 296 300 300 300 299
Base: Residents in each area Source: Q3d Note: Percentages in green are significantly higher than the average for all New Zealanders, and percentages in red are significantly lower than the average for all New Zealanders.
Positive and negative impacts for aquaculture areas
Due to the small number of people who have been personally impacted by aquaculture, we do not provide a
detailed breakdown of positive and negative impacts by area. Instead, Table 11 on the following page lists the
main positive and main negative impacts mentioned by respondents in each region. In the table, we have
listed the responses in each area that are mentioned more often than others, but we have not attempted to
apply any ‘statistical criteria’ to this. The results help to highlight some of the similarities and differences
between areas, but interpretations need to be treated with some caution.

Page 40
‹#›
What the results tell us
The main positive impacts personally experienced across all aquaculture areas are that fishing and diving tend
to be good near aquaculture farms. Residents in Northland and Marlborough regions are particularly likely to
mention the benefits of aquaculture to employment.
The main negative impacts personally experienced across all aquaculture areas are restricted access to coastal
recreational areas, and impacts that relate to pollution, water quality and cleanliness.
The impact of aquaculture farms on scenery appears to be a particular issue for Marlborough, Tasman and
Canterbury region residents, and Marlborough and Tasman region residents were more likely to comment on
harm caused to natural sea life.
Other negative impacts cited by residents in key aquaculture areas include that farms are a hazard for boats
and ships (Tasman region residents), and a more general concern about natural resources being allocated to
aquaculture (Canterbury region residents).
Table 11. Top positive and negative impacts for each aquaculture area.
Area Main positive impacts mentioned Main negative impacts mentioned
Northland region Fishing is good near farm Creates jobs/employment
Restricted access to recreational areas Pollution/litter/rubbish
Auckland region Fishing is good near farm Good for diving/fishing
Restricted access to recreational areas Not safe/clean/disease free
Thames-Coromandel and Hauraki districts
Fishing is good near farm Impact on water quality
Restricted access to recreational areas
Marlborough region Creates jobs/employment Fishing is good near farm Good for diving/fishing
Restricted access to recreational areas Didn’t like the look/spoilt the scenery
Harmed natural or local fish Impact on water quality
Tasman region Fishing is good near farm Good for diving/fishing
Didn’t like the look/spoilt the scenery Hazardous to boats/ship
Harmed natural or local fish Restricted access to recreational areas
Canterbury region Fishing is good near farm Good for diving/fishing
Restricted access to recreational areas Didn’t like the look/spoilt the scenery Over farming/demising of resources
Impact on water quality
Base: Residents in each area Source: Q3e Note: Percentages are not shown due to the small number of people in each area who cited positive and negative impacts (i.e., most residents in each area said they had experienced no personal impact)
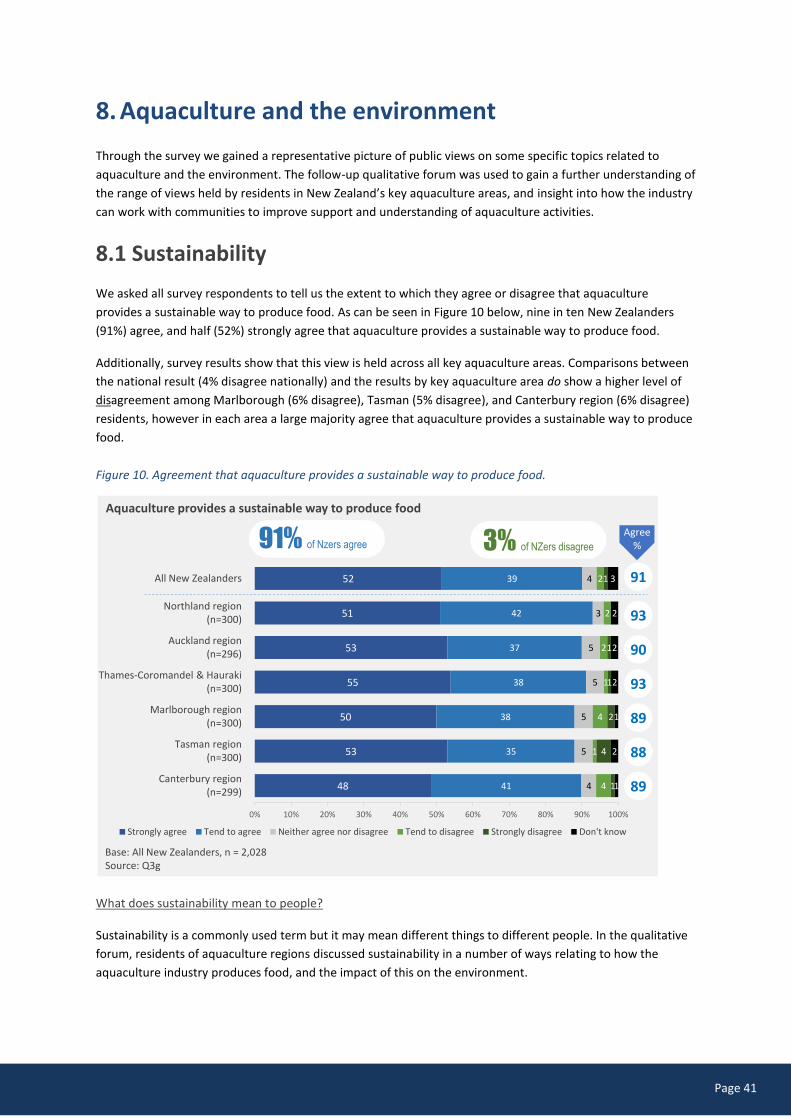
Page 41
‹#›
8. Aquaculture and the environment
Through the survey we gained a representative picture of public views on some specific topics related to
aquaculture and the environment. The follow-up qualitative forum was used to gain a further understanding of
the range of views held by residents in New Zealand’s key aquaculture areas, and insight into how the industry
can work with communities to improve support and understanding of aquaculture activities.
8.1 Sustainability
We asked all survey respondents to tell us the extent to which they agree or disagree that aquaculture
provides a sustainable way to produce food. As can be seen in Figure 10 below, nine in ten New Zealanders
(91%) agree, and half (52%) strongly agree that aquaculture provides a sustainable way to produce food.
Additionally, survey results show that this view is held across all key aquaculture areas. Comparisons between
the national result (4% disagree nationally) and the results by key aquaculture area do show a higher level of
disagreement among Marlborough (6% disagree), Tasman (5% disagree), and Canterbury region (6% disagree)
residents, however in each area a large majority agree that aquaculture provides a sustainable way to produce
food.
Figure 10. Agreement that aquaculture provides a sustainable way to produce food.
What does sustainability mean to people?
Sustainability is a commonly used term but it may mean different things to different people. In the qualitative
forum, residents of aquaculture regions discussed sustainability in a number of ways relating to how the
aquaculture industry produces food, and the impact of this on the environment.
Base: All New Zealanders, n = 2,028Source: Q3g
52
51
53
55
50
53
48
39
42
37
38
38
35
41
4
3
5
5
5
5
4
2
2
2
1
4
1
4
1
1
1
2
4
1
3
2
2
2
1
2
1
0% 10% 20% 30% 40% 50% 60% 70% 80% 90% 100%
Strongly agree Tend to agree Neither agree nor disagree Tend to disagree Strongly disagree Don't know
Aquaculture provides a sustainable way to produce food
All New Zealanders
Northland region (n=300)
Auckland region (n=296)
Thames-Coromandel & Hauraki (n=300)
Marlborough region (n=300)
Tasman region (n=300)
Canterbury region (n=299)
91% of Nzers agree 3% of NZers disagree
91
93
90
93
89
88
89
Agree%
Page 42
‹#›
Forum contributors expressed that, in the context of the aquaculture industry, sustainability relates to:
the long-term ability to conduct aquaculture activities in an area
the long-term ability to fish in an area where aquaculture is present
ensuring the natural habitat and wildlife in an area is not compromised by aquaculture activities
balancing the economic demands of the aquaculture industry with the impact on the environment
farm-produced seafood being more sustainable than commercially fished seafood.
The following comments illustrate how residents of aquaculture regions discuss sustainability – whether they
believe the industry is sustainable or not.
“Aquaculture is a sustainable way to provide seafood providing it is managed carefully and all
possible care is taken to minimise any environmental impact. It provides jobs in the regions and
valuable export dollars as well.”
Resident of Tasman, Pakeha, 50 to 59, female
“To be sustainable, we have to achieve a balance of what the environment can sustain at a level that
we consider acceptable. As that level is a subjective one, differing from individual to individual, we
must turn to the vision and policy of the RMA. District Plans are also important in prescribing what the
local population has determined for their own region.”
Resident of Marlborough, Pakeha, 60 to 69, male
Residents of aquaculture areas who feel positive about the sustainability of the industry suggest part of the
reason for this is that the industry, and regulatory bodies like MPI, play a role in ensuring aquaculture activities
are sustainable.
“I believe this industry is sustainable due to the amount of natural resource available. As long as the
industry is managed well and monitored effectively, it should do very well.”
Resident of Auckland, Māori, 30 to 34, male
What reasons do people give for aquaculture not being sustainable?
In the survey we asked people to tell us why they thought aquaculture is not a sustainable way to produce
food. Results are shown in Table 12. We received a fairly diverse range of responses. Comments most
commonly revolved around the impact of aquaculture farms on the surrounding environment (32%), including
a negative effect on the water quality and the marine-life balance, and a perception that the demands and
requirements of aquaculture (in terms of feed, costs, resources) outweigh the benefits (17%).
Around one fifth of these survey respondents simply state that aquaculture is ‘not sustainable’ (22%), and 13%
provide comments that do not relate to aquaculture.

Page 43
‹#›
Contributors to the follow-up forum who feel the industry is not sustainable tend to have negative views on
the industry overall, and view it as ‘greedy’ or concerned only with financial gain. They are sceptical about the
industry’s claims to sustainability. Some feel that any source of animal protein is an unsustainable and
inefficient means of providing food. This includes farmed seafood, but is not a view that is isolated to
aquaculture.
“There are moves afoot for live fish farming, and I have some serious reservations about that. I
understand that we will import food for them made from fish caught off South America, and that it
will take five Kilos of this to produce 1 Kilo of high value local fish. From the perspective of a world
running out of food and energy, and suffering from climate change and pollution, this is about as daft
as it gets. On the other hand if they can feed them on a meal made from the waste from local freezing
works, that is another matter.”
Resident of Thames-Coromandel, Pakeha 60 to 69, male
Table 12. Reasons for disagreeing that aquaculture is a sustainable way to produce food.
Reasons %
Concern about impact on the local environment 32
Upsets the natural eco system/marine life balance 18
Environmental impact 16
Water pollution/affects the quality of the water 14
Concern about the quality of the farmed seafood 12
It's not a natural resource/artificial/added antibiotics/chemicals 11
Other concerns
Not sustainable (no further information provided) 22
The demands of aquaculture (e.g., feed, cost, resource allocation) outweigh its benefits 17
How they are fed/you need fish to feed fish/the amount of fish needed to feed them 9
Mass production is not good 5
Need to be better managed/more monitoring/control in the industry 4
Don't need to farm it to get it 1
Other 14
Comments unrelated to aquaculture 13
Overfishing/people taking too much 8
By catch/catching other species/throwing away fish they don't need 5
No comment 5
Don't know 10 Base: New Zealanders who disagree that aquaculture is a sustainable way to produce food (n=77) Source: Q3h
As in the survey, a number of contributors to the follow-up qualitative forum confused aquaculture activities
with commercial and recreational fishing activities. An often negative perception of the commercial fishing
industry may affect some residents’ perceptions of aquaculture activities.
“Our current practise of commercial fishing is unsustainable therefore we have to have better
management including marine reserves to build fish stock, reserves for recreational fishing only eg.
excluding the large commercial fleets from our bays.”
Resident of Tasman, Pakeha, 50 to 59 years, male

Page 44
‹#›
“The balance is finely tuned to sustainable quantities at present but vigilance is needed for both deep
sea policing our extended limit from overseas interests and inshore fisheries inspectors ensuring that
people are not being greedy and self-serving. The balance should reflect private and commercial
interests. More should be made of the family aspect of gathering kai moana - picnic, cook on beach
etc. It would appear that we are quite lenient on infringements - I think the time for 'warnings' of gross
over taking of seafood is over - monetary fine, confiscate vehicles, boats etc. immediately and sell as
well as fines.”
Resident of Tasman, Pakeha, 60 to 69, female
Who is less likely to agree that aquaculture is a sustainable means of food production?
We carried out further demographic analysis of the survey results to better understand which New Zealanders
have less positive views about aquaculture as a sustainable means of food production. Because the majority of
New Zealanders agree with the statement, our analysis focused on understanding who is more or less likely to
‘strongly’ agree.
Who has more positive views about sustainability in aquaculture?
Who has less positive views about sustainability in aquaculture?
Those more likely than average (52%) to strongly agree that aquaculture is a sustainable means of food production are:
males (60%)
older New Zealanders, aged 60 years+ (58%)
those with an annual household income up to $50,000 (59%)
those who live/own a coastal property (58%).
Those less likely than average (52%) to strongly agree that aquaculture is a sustainable means of food production are:
females (45%)
Māori (35%).
As can be seen above, results show that females and Māori are more resistant to the idea that aquaculture is a
sustainable source of food production. Residents of aquaculture regions who identified as Māori provided
some comments in the qualitative forum.4 Like non-Māori, some Māori confuse fishing activities with
aquaculture activities, which may explain the perception that aquaculture is unsustainable, as these comments
illustrate.
“Any man and his dog can go out and fish within limits but still taking quite a decent amount of fish on
top of the fact that chartered fishing boats can take even more. Although there are regulations on the
amount of fish you can take I think the aquaculture industry still poses a major threat to the life living
in our waters.”
Resident of Thames-Coromandel, Māori, 18 to 24, female
4 Note that only seven people of the total of 41 people who took part in the forum identified as Māori.
Page 45
‹#›
“We always have room for improvement and I feel by limiting our catch quota with fish and taking
more care in cleaning up our shores is a positive step to keeping the New Zealand we know and love
healthy for the future.”
Resident of Auckland, Māori, 35 to 39, female
However, other Māori residents of aquaculture regions (who recognise the difference between fishing and
farming) in the forum feel positively about the industry, considering it a sustainable source of food for people.
They consider aquaculture activities also take pressure off fishing of wild stocks, allowing better regeneration
of these wild stocks for themselves and future generations to harvest recreationally.
Māori contributors to the online forum are also positive about the economic impacts and benefits of the
aquaculture industry in their region, including employment opportunities.
“I have a positive view of aquaculture in New Zealand from the view point of maintaining sustainable
seafood or kai moana resources for our future generations. Being "farmers of the sea" is a natural part
of human nature. We do it on land so why not the ocean?”
Resident of Auckland, Māori, 30 to 34, female
“The aquaculture industry is a "no brainer" for the future of New Zealand, provided it is managed
responsibly and in a sustainable way. I am of the view that Māori and iwi can contribute greatly to the
development of this industry. There needs to be a focus on developing capability and capacity within
the industry.”
Resident of Northland, Māori, 40 to 49, male
Improving perceptions of sustainability
In the qualitative forum, residents of aquaculture growing regions had some suggestions regarding
improvements to the sustainability of the industry. These include:
providing independent scientific evidence of the impact (or lack of it) on the environment surrounding
aquaculture activities. This will counter claims that aquaculture activities are unsustainable.
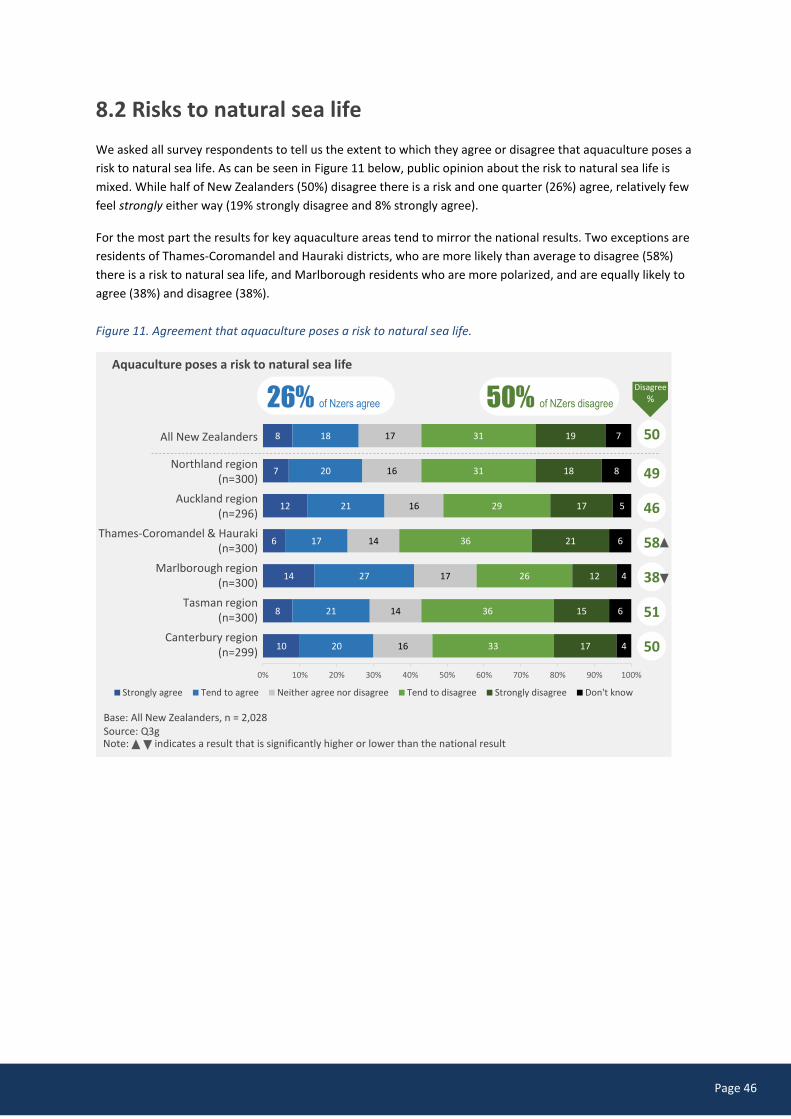
Page 46
‹#›
8.2 Risks to natural sea life
We asked all survey respondents to tell us the extent to which they agree or disagree that aquaculture poses a
risk to natural sea life. As can be seen in Figure 11 below, public opinion about the risk to natural sea life is
mixed. While half of New Zealanders (50%) disagree there is a risk and one quarter (26%) agree, relatively few
feel strongly either way (19% strongly disagree and 8% strongly agree).
For the most part the results for key aquaculture areas tend to mirror the national results. Two exceptions are
residents of Thames-Coromandel and Hauraki districts, who are more likely than average to disagree (58%)
there is a risk to natural sea life, and Marlborough residents who are more polarized, and are equally likely to
agree (38%) and disagree (38%).
Figure 11. Agreement that aquaculture poses a risk to natural sea life.
8
7
12
6
14
8
10
18
20
21
17
27
21
20
17
16
16
14
17
14
16
31
31
29
36
26
36
33
19
18
17
21
12
15
17
7
8
5
6
4
6
4
0% 10% 20% 30% 40% 50% 60% 70% 80% 90% 100%
Strongly agree Tend to agree Neither agree nor disagree Tend to disagree Strongly disagree Don't know
Aquaculture poses a risk to natural sea life
All New Zealanders
Northland region (n=300)
Auckland region (n=296)
Thames-Coromandel & Hauraki (n=300)
Marlborough region(n=300)
Tasman region (n=300)
Canterbury region (n=299)
26% of Nzers agree 50% of NZers disagree
50
49
46
58
38
51
50
Disagree
%
Base: All New Zealanders, n = 2,028Source: Q3gNote: indicates a result that is significantly higher or lower than the national result
Page 47
‹#›
Who is more concerned about the risks to natural sea life?
We carried out further demographic analysis of the survey results to better understand who is particularly
concerned about aquaculture. As can be seen below, those more concerned include young New Zealanders,
Pacific people and non-NZ Europeans, and those who know somebody who works in aquaculture.
Who is less concerned about risks to sea life? Who is more concerned about risks to sea life?
Those more likely than average (50%) to disagree that aquaculture poses a risk to natural sea life include:
males (59%)
those over aged 35 years (57%)
those with an annual household income over $100,000 (57%)
boat owners (61%).
Those more likely than average (26%) to agree that aquaculture poses a risk to natural sea life there are risks include:
younger New Zealanders, aged 18 to 34 (37%)
Pacific people (56%)
Non-NZ Europeans (35%)
those with an annual household income up to $50,000 (35%)
those who know someone working in aquaculture (30%).
What are the perceived risks to natural sea life?
During the survey we asked people to tell us how they think aquaculture poses a risk to natural sea life. We did
not prompt respondents with possible responses. In Table 13 over the page, similar responses have been
grouped into ‘nett categories’. The percentages that are shaded and in bold state the proportion of
respondents who made at least one of the more specific comments in that category.
As can be seen in the table, concerns about risk to sea life most commonly focus on impacts to sea life through
harm to the physical environment (40%), or harm directly to sea life (29%). Thirteen percent of respondents
provided comments that related to fishing rather than aquaculture.
In the qualitative follow-up forum residents of aquaculture growing areas were asked to explain their views on
risks to sea life. The concerns raised relate to:
pollution of areas of intensive production from waste products, food, and chemical use (and the potential
for pollutants to be uncontained in that area).
use of areas for aquaculture that mean wild species can no longer live in the area, or are at risk from
disease (see below).
spread of disease from crowding and monocultures.
Comments about pollution relate to risks to sea life from intensive concentrations of one species.
“Badly managed it can pollute waters, bring diseases (one species in a concentrated area can lead to
diseases developing and spreading) and it can damage the seabed. Any damage to the seabed and
pollution disturbs the natural growth/food cycle/health of young marine life.”
Resident of Tasman, Pakeha, 50 to 59, female
“Yes if it [is] too concentrated in one area.”
Resident of Northland, Pakeha, 50 to 59, male
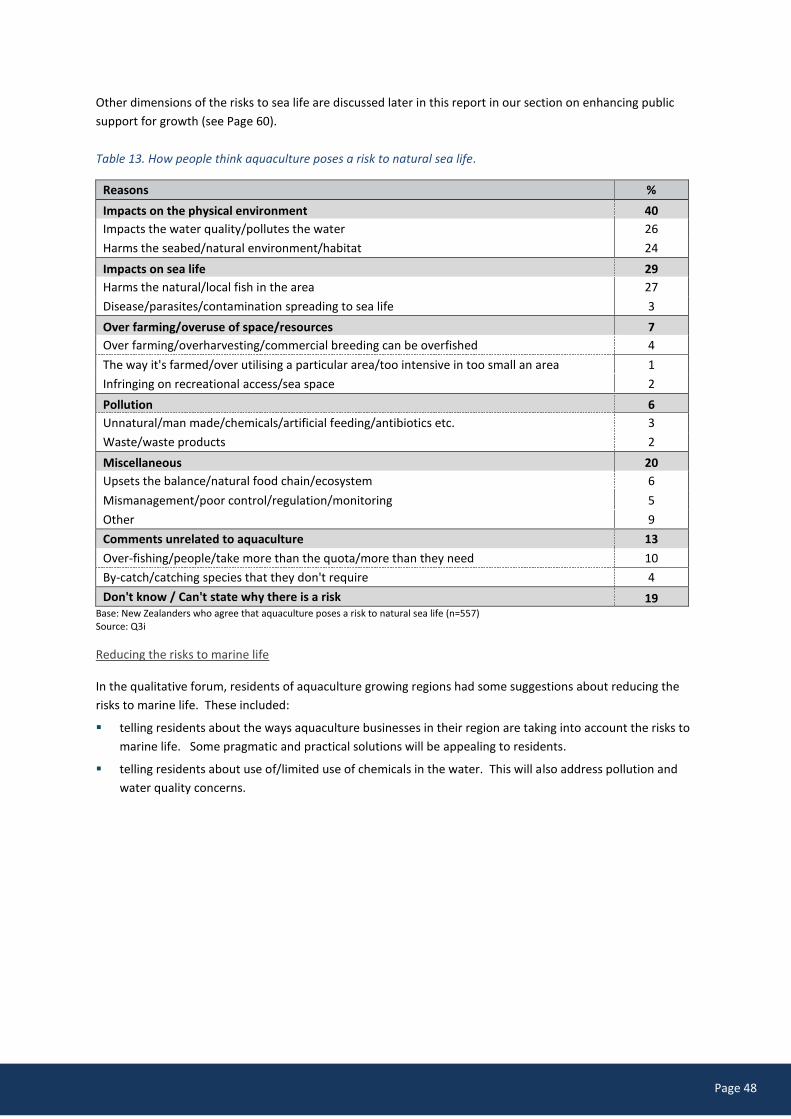
Page 48
‹#›
Other dimensions of the risks to sea life are discussed later in this report in our section on enhancing public
support for growth (see Page 60).
Table 13. How people think aquaculture poses a risk to natural sea life.
Reasons %
Impacts on the physical environment 40
Impacts the water quality/pollutes the water 26
Harms the seabed/natural environment/habitat 24
Impacts on sea life 29
Harms the natural/local fish in the area 27
Disease/parasites/contamination spreading to sea life 3
Over farming/overuse of space/resources 7
Over farming/overharvesting/commercial breeding can be overfished 4
The way it's farmed/over utilising a particular area/too intensive in too small an area 1
Infringing on recreational access/sea space 2
Pollution 6
Unnatural/man made/chemicals/artificial feeding/antibiotics etc. 3
Waste/waste products 2
Miscellaneous 20
Upsets the balance/natural food chain/ecosystem 6
Mismanagement/poor control/regulation/monitoring 5
Other 9
Comments unrelated to aquaculture 13
Over-fishing/people/take more than the quota/more than they need 10
By-catch/catching species that they don't require 4
Don't know / Can't state why there is a risk 19 Base: New Zealanders who agree that aquaculture poses a risk to natural sea life (n=557) Source: Q3i
Reducing the risks to marine life
In the qualitative forum, residents of aquaculture growing regions had some suggestions about reducing the
risks to marine life. These included:
telling residents about the ways aquaculture businesses in their region are taking into account the risks to
marine life. Some pragmatic and practical solutions will be appealing to residents.
telling residents about use of/limited use of chemicals in the water. This will also address pollution and
water quality concerns.
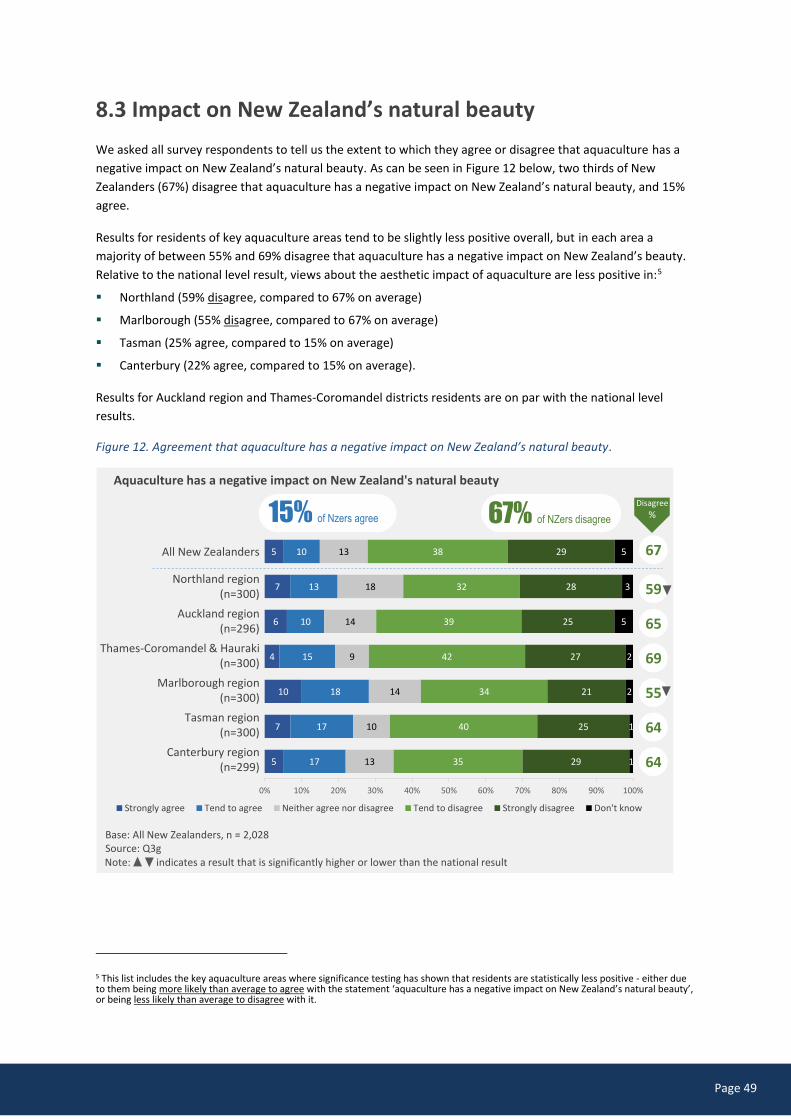
Page 49
‹#›
8.3 Impact on New Zealand’s natural beauty
We asked all survey respondents to tell us the extent to which they agree or disagree that aquaculture has a
negative impact on New Zealand’s natural beauty. As can be seen in Figure 12 below, two thirds of New
Zealanders (67%) disagree that aquaculture has a negative impact on New Zealand’s natural beauty, and 15%
agree.
Results for residents of key aquaculture areas tend to be slightly less positive overall, but in each area a
majority of between 55% and 69% disagree that aquaculture has a negative impact on New Zealand’s beauty.
Relative to the national level result, views about the aesthetic impact of aquaculture are less positive in:5
Northland (59% disagree, compared to 67% on average)
Marlborough (55% disagree, compared to 67% on average)
Tasman (25% agree, compared to 15% on average)
Canterbury (22% agree, compared to 15% on average).
Results for Auckland region and Thames-Coromandel districts residents are on par with the national level
results.
Figure 12. Agreement that aquaculture has a negative impact on New Zealand’s natural beauty.
5 This list includes the key aquaculture areas where significance testing has shown that residents are statistically less positive - either due to them being more likely than average to agree with the statement ‘aquaculture has a negative impact on New Zealand’s natural beauty’, or being less likely than average to disagree with it.
5
7
6
4
10
7
5
10
13
10
15
18
17
17
13
18
14
9
14
10
13
38
32
39
42
34
40
35
29
28
25
27
21
25
29
5
3
5
2
2
1
1
0% 10% 20% 30% 40% 50% 60% 70% 80% 90% 100%
Strongly agree Tend to agree Neither agree nor disagree Tend to disagree Strongly disagree Don't know
Aquaculture has a negative impact on New Zealand's natural beauty
All New Zealanders
Northland region (n=300)
Auckland region (n=296)
Thames-Coromandel & Hauraki (n=300)
Marlborough region(n=300)
Tasman region (n=300)
Canterbury region (n=299)
15% of Nzers agree 67% of NZers disagree
67
59
65
69
55
64
64
Disagree
%
Base: All New Zealanders, n = 2,028Source: Q3gNote: indicates a result that is significantly higher or lower than the national result
Page 50
‹#›
Who is more concerned about the aesthetic impact of aquaculture?
We carried out further demographic analysis of the survey results to better understand who is particularly
concerned about the aesthetic impact of aquaculture farms. As can be seen on the following page, those more
concerned include Māori and non-New Zealand Europeans.
Who is less concerned about the aesthetic impact? Who is more concerned about the aesthetic impact?
Those more likely than average (67%) to disagree that aquaculture has a negative impact on New Zealand’s natural beauty include:
those aged 35 to 59 (73%)
NZ Europeans (71%).
Those more likely than average (15%) to agree that aquaculture has a negative impact on New Zealand’s natural beauty include:
Māori (21%)
Non-NZ Europeans (25%).
One Māori contributor in the follow-up forum mentioned the aesthetic aspect of aquaculture, however they
did not express significant concern about it. They feel that while these activities will impact on scenery, there
are processes in place to ensure these effects are mitigated.
“Aquaculture will impact on scenery, however, with a robust resource consent process this may be
mitigated.”
Resident of Northland, Māori, 40 to 49, male
Reducing the visual impact of aquaculture activities
In the follow-up qualitative forum, some residents of aquaculture regions who have concerns about the visual
impact of marine farms appeared to be less positive about aquaculture activities overall, and generally resent
their presence in their regions. However some are positive about the presence of farms, but feel the visual
impact could be lessened.
Some of the residents in these areas suggest ways to reduce the visual impact of aquaculture activities. These
include:
Well maintained boats and equipment (not rusty, old and potentially polluting) e.g. equipment that looks
new, clean, modern, and well-maintained.
Limiting the visual impact of buoys, ropes, nets and other equipment so it blends better into the seascape.
Page 51
‹#›
8.4 New Zealand’s clean, green image
Finally in this section, we asked all survey respondents to tell us the extent to which they agree or disagree
that aquaculture contributes to New Zealand’s clean, green image. As can be seen in Figure 13 below, just over
two thirds of New Zealanders (68%) agree that aquaculture contributes positively to New Zealand’s clean,
green image.
Results for residents in New Zealand’s key aquaculture areas are generally similar to the national results, with
a majority of between 62% and 68% of residents in each area agreeing that aquaculture contributes positively
to New Zealand’s clean, green image. Having said this, Marlborough and Canterbury residents are slightly less
likely to agree (62% of residents in each region agree, compared to 68% on average), and Northland,
Marlborough, and Canterbury residents are more likely to disagree (16%, 22%, and 16% disagree, respectively.
compared to 11% on average).
Figure 13. Agreement that aquaculture contributes positively to New Zealand’s clean, green image.
The following comments made in the qualitative forum demonstrate how some residents of aquaculture
regions link aquaculture activities with our clean, green image and are positive that aquaculture enhances our
image with overseas markets.
“I feel positive about the industry, creating a sustainable sea food environment will be a huge boost to
the economy and put some substance to the green and pure image we are trying to maintain.”
Resident of Auckland, Pakeha, 40 to 49, male
30
31
33
28
25
28
30
37
36
35
40
37
40
32
16
15
16
15
14
16
21
9
13
9
10
15
10
11
3
3
4
3
7
4
4
5
4
4
3
3
2
2
0% 10% 20% 30% 40% 50% 60% 70% 80% 90% 100%
Strongly agree Tend to agree Neither agree nor disagree Tend to disagree Strongly disagree Don't know
Aquaculture contributes positively to New Zealand's clean, green image
All New Zealanders
Northland region (n=300)
Auckland region (n=296)
Thames-Coromandel & Hauraki (n=300)
Marlborough region(n=300)
Tasman region (n=300)
Canterbury region (n=299)
68% of Nzers agree 11% of NZers disagree
68
66
68
68
62
68
62
Agree%
Base: All New Zealanders, n = 2,028Source: Q3gNote: indicates a result that is significantly higher or lower than the national result
Page 52
‹#›
“I do not feel the aquafarms spoil the natural beauty of NZ. They are not everywhere, and when I do
see them I find them an interesting part of the view. In the future their placement should be managed
so they don't impact on our scenery.”
Resident of Northland, Pakeha, 40 to 49, female
Who is less positive about the contribution aquaculture makes to New Zealand’s clean, green image?
We carried out further demographic analysis of the survey results to better understand who is less positive
about the contribution aquaculture makes to New Zealand’s clean, green image. As can be seen below, those
less positive include older New Zealanders and those more closely connected to the coast (ie, live near, own a
property near, or frequently use the coast).
Who is more positive about the contribution aquaculture makes to New Zealand’s clean, green image?
Who is less positive about the contribution aquaculture makes to New Zealand’s clean, green image?
Those more likely than average (68%) to agree aquaculture contributes positively include:
males (72%)
those who know someone working in aquaculture (75%).
Those more likely than average (11%) to disagree aquaculture contributes positively include:
older New Zealanders, aged 60+ (15%)
those who live in/own a coastal property (17%)
those who frequently use the coastal area for recreation, more than 10 times per year (14%).

Page 53
‹#›
9. Aquaculture and the economy
9.1 Aquaculture as an employer
Through the survey we gauged New Zealanders’ perceptions of the importance of the aquaculture industry for
providing employment opportunities in local communities. Results are shown in Figure 14, below. Nationally,
around half of New Zealanders (53%) agree that aquaculture provides jobs in their local community. The
results for Auckland and Canterbury regions mirror the national results (56% and 55% of people in these
regions agree, respectively).
Not surprisingly, there is a much greater appreciation of aquaculture as an employer in the regions where
residents are more likely to know people working in the industry (see Figure 6, Page 31). Nearly all residents in
Marlborough and Tasman regions agree (94% and 92%, respectively), and a strong majority agree in Thames-
Coromandel and Hauraki districts (85%) and Northland region (70%).
Figure 14. Agreement that aquaculture provides jobs in local communities.
In the qualitative follow-up forum, residents of aquaculture regions mentioned employment as a benefit of the
aquaculture industry, either for themselves and family or friends, or their region as a whole. These residents
feel the employment opportunities offered by the industry are positive because they bring opportunities to
areas that may otherwise have limited employment opportunities.
“The aquaculture industry in our area has created some employment and brought extra money into
the area. I hope this will long continue.”
Resident of Tasman, Pakeha, 50 to 59, female
24
31
20
54
67
65
23
30
40
37
31
27
27
33
9
6
10
2
2
2
9
19
12
16
8
3
3
19
11
5
8
2
0
1
11
8
6
10
3
1
2
5
0% 10% 20% 30% 40% 50% 60% 70% 80% 90% 100%
Strongly agree Tend to agree Neither agree nor disagree Tend to disagree Strongly disagree Don't know
Aquaculture provides jobs in your local community
All New Zealanders
Northland region (n=300)
Auckland region (n=296)
Thames-Coromandel & Hauraki (n=300)
Marlborough region(n=300)
Tasman region (n=300)
Canterbury region (n=299)
53% of Nzers agree 30% of NZers disagree
53
70
56
85
94
92
55
Agree%
Base: All New Zealanders, n = 2,028Source: Q3j
Note: indicates a result that is significantly higher or lower than the national result

Page 54
‹#›
“I am very positive about this industry, I live in an area that has a very visible aquaculture industry.
This is providing meaningful employment and career prospects for the young people of the district.”
Resident of Thames-Coromandel, Pakeha, 60 to 69, male

Page 55
‹#›
9.2 The contribution aquaculture makes to the economy In the survey we also gauged public views about the contribution aquaculture makes to local economies and
the national economy. Results are shown in Figure 15 and Figure 16.
Figure 15. Agreement that aquaculture contributes significantly to local economies.
20
22
22
47
59
52
20
28
39
25
35
34
37
30
16
11
19
6
3
3
17
20
15
20
6
2
6
20
8
5
7
3
1
1
8
6
7
8
4
2
2
3
0% 10% 20% 30% 40% 50% 60% 70% 80% 90% 100%
Strongly agree Tend to agree Neither agree nor disagree Tend to disagree Strongly disagree Don't know
Aquaculture contributes significantly to your local economy
All New Zealanders
Northland region (n=300)
Auckland region (n=296)
Thames-Coromandel & Hauraki (n=300)
Marlborough region(n=300)
Tasman region (n=300)
Canterbury region (n=299)
49% of Nzers agree 29% of NZers disagree
Base: All New Zealanders, n = 2,028Source: Q3jNote: indicates a result that is significantly higher or lower than the national result
49
61
46
81
92
89
50
Agree%
Page 56
‹#›
Figure 16. Agreement that contributes significantly to the national economy.
Taken together, the results from these two survey questions show that the majority of New Zealanders
appreciate that aquaculture makes a significant contribution to the national economy, even if they believe
aquaculture doesn’t make a significant contribution locally.
Findings in Figure 15 tend to mirror those for the importance of aquaculture to local employment. Aquaculture
is seen as a significant contributor to local economies in regions where greater proportions of residents are
employed in the industry. A strong majority of residents in Marlborough region, Tasman region, Thames-
Coromandel and Hauraki districts agree that aquaculture makes a significant contribution locally (92%, 89%,
and 81% agree, respectively), and 61% of Northland residents agree.
Irrespective of their view on the contribution aquaculture makes locally, the results displayed in Figure 16
show that the majority of New Zealanders (80%) agree that aquaculture makes a significant contribution
nationally. Again residents in Marlborough region, Tasman region, and Thames-Coromandel and Hauraki
districts are particularly likely to agree (93%, 90%, and 89% agree, respectively)
Who is less likely to agree that aquaculture contributes to the national economy?
We carried out further demographic analysis of the survey results to better understand which New Zealanders
are less likely to believe aquaculture contributes significantly to the national economy. Because the majority of
New Zealanders agree with the statement, our analysis focused on understanding who is more or less likely to
‘strongly’ agree.
39
35
40
44
54
47
37
42
42
42
45
39
43
44
9
10
10
4
4
6
8
4
5
2
3
2
2
6
1
2
1
1
2
5
6
5
3
1
3
4
0% 10% 20% 30% 40% 50% 60% 70% 80% 90% 100%
Strongly agree Tend to agree Neither agree nor disagree Tend to disagree Strongly disagree Don't know
Aquaculture contributes significantly to New Zealand’s economy
All New Zealanders
Northland region (n=300)
Auckland region (n=296)
Thames-Coromandel & Hauraki (n=300)
Marlborough region(n=300)
Tasman region (n=300)
Canterbury region (n=299)
80% of Nzers agree 5% of NZers disagree
Base: All New Zealanders, n = 2,028Source: Q3jNote: indicates a result that is significantly higher or lower than the national result
80
77
82
89
93
90
81
Agree%

Page 57
‹#›
As can be seen below, age is a key differentiating factor, with middle aged New Zealanders being less likely to
strongly agree. Interestingly, those who use coastal areas frequently are less likely to believe that aquaculture
makes a significant contribution to the national economy. It is difficult to know why this pattern of results
exists, but one reason could be that there are larger proportion of frequent users of the coast who live either
in Auckland (38%) or outside the key aquaculture areas (42%), so they have had little chance to see
aquaculture farms first hand.
Who is more likely to believe aquaculture contributes significantly?
Who is less likely to believe aquaculture contributes significantly?
Those more likely than average (39%) to strongly agree that aquaculture contributes significantly to the national economy are:
older New Zealanders, aged 60 years+ (50%)
those who use coastal areas less than 6 times per year (48%)
those who know someone who works in aquaculture (44%).
Those less likely than average (39%) to strongly agree that aquaculture contributes significantly to the national economy are:
those aged 35 to 59 years (33%)
those who use coastal areas more frequently, 6 or more times per year (32%).

Page 58
‹#›
10. Public support for industry growth
All survey respondents were asked if they agreed or disagreed that New Zealand should look for opportunities
to sustainably grow the aquaculture industry. As can be seen in Figure 17, there is considerable public support
for sustainably growing the industry, with nine in ten New Zealanders agreeing (91%). This level of public
support also exists within the six key aquaculture growing areas, although it is slightly lower in Tasman (86%)
and Canterbury (86%) regions.
Figure 17. Agreement that New Zealand should look to sustainably grow the aquaculture industry.
We deliberately recruited participants for the follow-up qualitative forum who had both positive and negative
views about industry growth. Most contributors generally supported carefully managed and considered
growth of the industry and see benefits for regions where the industry is located. They feel growth is
important for the industry because it is still a young industry and they feel it has more potential to fulfil.
“The aquaculture industry has a goal to expand and grow - in order to be sustainable, any industry
needs to grow. The markets will always be changing; our currency alone fluctuates.”
Resident of Auckland, positive, Pakeha, 50 to 59, male
57
60
56
57
60
54
56
34
30
35
35
28
32
31
4
5
3
3
6
6
7
2
2
2
2
2
2
3
1
1
2
1
3
3
2
2
3
1
2
3
1
0% 10% 20% 30% 40% 50% 60% 70% 80% 90% 100%
Strongly agree Tend to agree Neither agree nor disagree Tend to disagree Strongly disagree Don't know
New Zealand should look to sustainably grow the aquaculture industry
All New Zealanders
Northland region (n=300)
Auckland region (n=296)
Thames-Coromandel & Hauraki (n=300)
Marlborough region(n=300)
Tasman region (n=300)
Canterbury region (n=299)
91% of Nzers agree 3% of NZers disagree
91
90
90
92
88
86
86
Agree%
Base: All New Zealanders, n = 2,028Source: Q3kNote: indicates a result that is significantly higher or lower than the national result

Page 59
‹#›
“I don't think I was aware of this goal but took it for granted that it would happen anyway, I can see
what it does for our country and how important it is to have this happen. As I have said it’s all about
the trickle affect, one feeds one thing that feeds another, opportunities are made and sustained as
long as everyone is on the same page as far as looking after this industry. I don't see why it would be
a bad thing. With any country the biggest problem I feel is employment, there never seems to be
enough. I feel this industry offers employment in so many areas, which in turn helps our debts and
unemployment issues. I hope to think that a lot of research has been put into how to keep this going
without doing irretrievable damage to the sea and sea life.”
Resident of Thames-Coromandel, Pakeha, 50 to 59, female
“There is a lot of potential for growth in this industry. I think it is a positive step for the industry and
for the economy. All farming comes with risks, and aquaculture is no exception.”
Resident of Tasman, Māori, 40 to 49, male
Having said this, some of the contributors to the follow-up qualitative forum feel that growth (particularly if
this is achieved by expansion of farms and consents to occupy sea space) should be well planned, researched
and thought out. They feel this can be achieved by local and central government control, as well as through
the industry’s own self-management of risk. Residents of aquaculture regions feel that growth and expansion
are important to their region, but do not want this to be detrimental to their quality of life, or the
environment. One resident of Marlborough is concerned that a combination of growth and speed will cause
harm to the region.
“Fast tracking - I am really concerned about the fact that the current government is putting in place
measures to fast track industry expansion applications. The whole purpose of the RMA is for resource
management. Haste is not consistent with protection. Any growth should be slow and cautious, and
independently monitored: no gung-ho approaches, please, which could result in harm, even
irreversible damage.”
Resident of Marlborough, Pakeha, 50 to 59, male
Who is less likely to support sustainably growing the industry?
We carried out further demographic analysis of the survey results to better understand which New Zealanders
are less likely to support sustainably growing the industry. Because the majority of New Zealanders agree with
the statement, our analysis focused on understanding who is more or less likely to ‘strongly’ agree.
As can be seen below, gender is the main differentiating factor, with females less positive than males about
industry growth. Earlier in this report results also showed that males were less concerned about risks to sea
life and sustainability (see Section Risks to Natural Sea Life, starting on Page 6).
Who is more likely to support industry growth? Who is less likely to support industry growth?
Those more likely than average (57%) to strongly agree that New Zealand should look for opportunities to sustainably grow the aquaculture industry are:
males (63%).
those who know someone working in aquaculture (68%).
Those less likely than average (57%) to strongly agree that New Zealand should look for opportunities to sustainably grow the aquaculture industry are:
females (51%).
Page 60
‹#›
10.1 Increasing public support for industry growth
During the follow-up qualitative forum we explored ways that the Ministry for Primary Industries and the
aquaculture industry could further increase support for industry growth in key aquaculture areas. We also
carried out some additional analyses of the survey results to understand the ways support could be
maintained or increased at the national level.
Increasing public support in key aquaculture growing areas
The survey results show that aquaculture growth has support from a large majority of the population,
including those in key growing areas. Having said this, New Zealanders generally do not have a thorough and
detailed knowledge of the industry. In a situation where there is a low level of specific knowledge, it is easier
for people’s views to be swayed by seemingly credible evidence from a ‘vocal minority’, or by negative media
coverage. For this reason, we deliberately recruited participants for the follow-up qualitative forum who
tended to be less positive about aquaculture. This approach allowed us to explore and understand the
concerns that exist, particularly in areas where aquaculture may expand in the future. Comments in this
section should not be interpreted as being representative of all aquaculture growing area residents.
The following section lists the types of concerns and issues raised by residents in aquaculture areas, and the
dimensions of these concern. We then provide thoughts on messages and practical solutions for the industry
to counteract these concerns and increase public support and understanding. The most credible sources of
information for each issue are included at the end of the discussion of each concern.
This section is framed in terms of issues and concerns and therefore strategies for increasing public support
are directly linked to addressing these issues and concerns where they exist among residents of aquaculture
growing regions.
Table 14 is a summary of the issues of concern to residents of aquaculture regions. These are not prioritised in
any way. The concerns are:
1. Sustainability
2. Visual pollution
3. Risks to sea life
4. Pollution and environmental degradation
5. Uncontrolled expansion
6. Product quality.
Note that strategies for counteracting residents’ concerns are sourced both from comments in the forum and
interpretation/suggestions by Colmar Brunton.
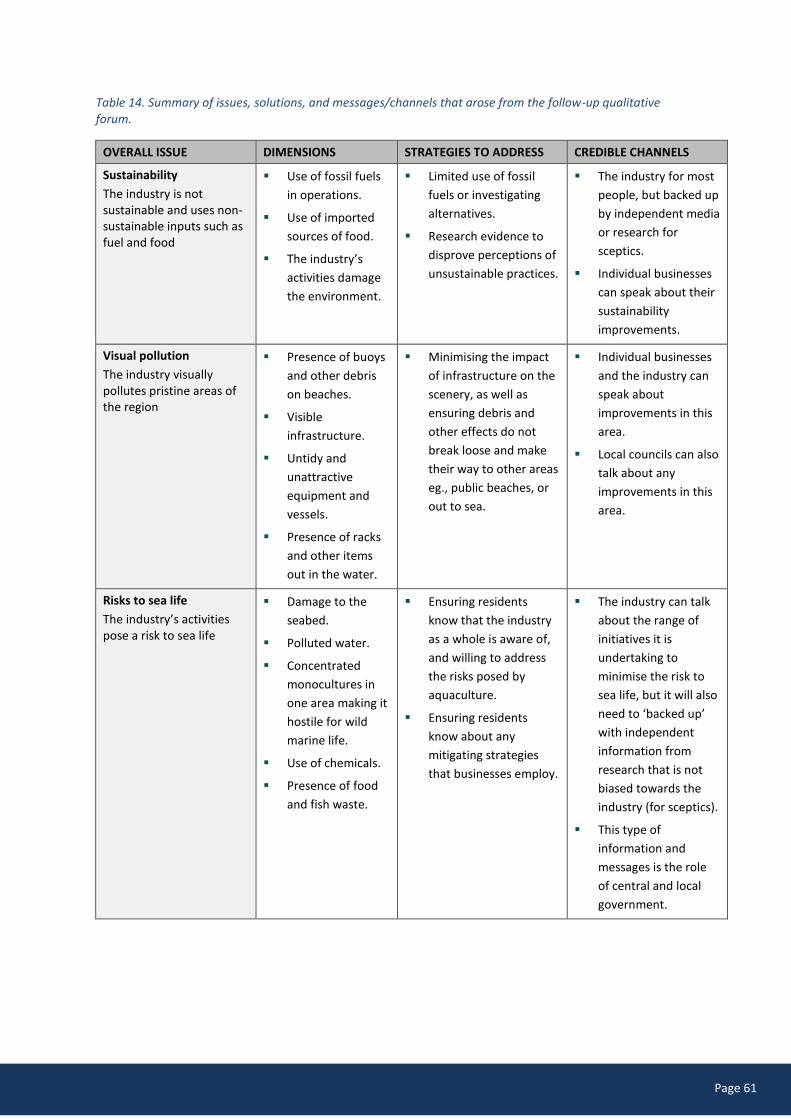
Page 61
‹#›
Table 14. Summary of issues, solutions, and messages/channels that arose from the follow-up qualitative forum.
OVERALL ISSUE DIMENSIONS STRATEGIES TO ADDRESS CREDIBLE CHANNELS
Sustainability
The industry is not sustainable and uses non-sustainable inputs such as fuel and food
Use of fossil fuels
in operations.
Use of imported
sources of food.
The industry’s
activities damage
the environment.
Limited use of fossil
fuels or investigating
alternatives.
Research evidence to
disprove perceptions of
unsustainable practices.
The industry for most
people, but backed up
by independent media
or research for
sceptics.
Individual businesses
can speak about their
sustainability
improvements.
Visual pollution
The industry visually pollutes pristine areas of the region
Presence of buoys
and other debris
on beaches.
Visible
infrastructure.
Untidy and
unattractive
equipment and
vessels.
Presence of racks
and other items
out in the water.
Minimising the impact
of infrastructure on the
scenery, as well as
ensuring debris and
other effects do not
break loose and make
their way to other areas
eg., public beaches, or
out to sea.
Individual businesses
and the industry can
speak about
improvements in this
area.
Local councils can also
talk about any
improvements in this
area.
Risks to sea life
The industry’s activities pose a risk to sea life
Damage to the
seabed.
Polluted water.
Concentrated
monocultures in
one area making it
hostile for wild
marine life.
Use of chemicals.
Presence of food
and fish waste.
Ensuring residents
know that the industry
as a whole is aware of,
and willing to address
the risks posed by
aquaculture.
Ensuring residents
know about any
mitigating strategies
that businesses employ.
The industry can talk
about the range of
initiatives it is
undertaking to
minimise the risk to
sea life, but it will also
need to ‘backed up’
with independent
information from
research that is not
biased towards the
industry (for sceptics).
This type of
information and
messages is the role
of central and local
government.

Page 62
‹#›
OVERALL ISSUE DIMENSIONS STRATEGIES TO ADDRESS CREDIBLE CHANNELS
Pollution
The industry’s activities degrade the environment
Equipment and
farm installations
damage the sea
bed.
Loose equipment
and debris from
sea farms floats
free causing a
hazard in the
water.
The sea and
seabed beneath
farms is polluted
by food and fish
waste.
Telling residents about
strategies to clean up
these areas, or to
inform them about the
level of impact.
Practical solutions to
contain and remove
waste or debris before
it escapes sea farm
areas into public areas.
For most residents,
the industry can talk
about the
environmental impact
and mitigation
strategies it is
taking/intends to
take. However, for
sceptics, other
sources of
information will be
more credible. These
include independent
media, regulatory,
and scientific sources.
Those who are
sceptical about
environmental claims
from the industry will
also want to examine
if a source of
information is linked
in any way to the
industry (for example,
by funding or
personnel links).
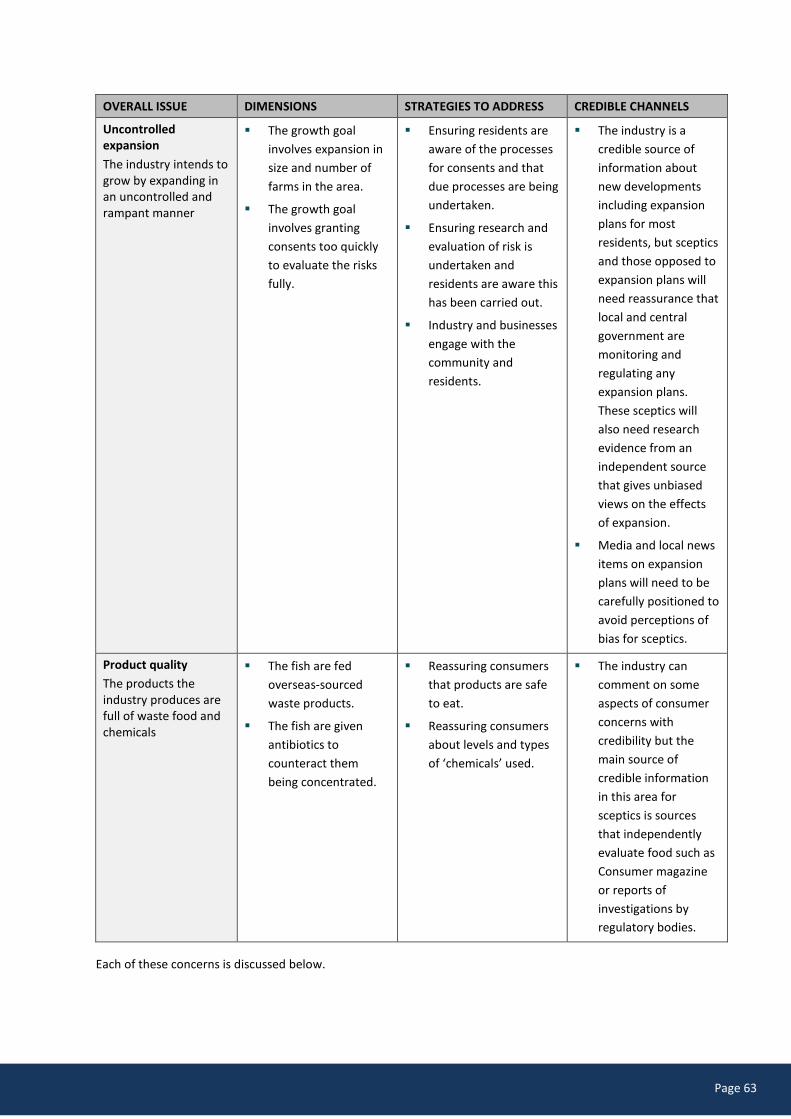
Page 63
‹#›
OVERALL ISSUE DIMENSIONS STRATEGIES TO ADDRESS CREDIBLE CHANNELS
Uncontrolled expansion
The industry intends to grow by expanding in an uncontrolled and rampant manner
The growth goal
involves expansion in
size and number of
farms in the area.
The growth goal
involves granting
consents too quickly
to evaluate the risks
fully.
Ensuring residents are
aware of the processes
for consents and that
due processes are being
undertaken.
Ensuring research and
evaluation of risk is
undertaken and
residents are aware this
has been carried out.
Industry and businesses
engage with the
community and
residents.
The industry is a
credible source of
information about
new developments
including expansion
plans for most
residents, but sceptics
and those opposed to
expansion plans will
need reassurance that
local and central
government are
monitoring and
regulating any
expansion plans.
These sceptics will
also need research
evidence from an
independent source
that gives unbiased
views on the effects
of expansion.
Media and local news
items on expansion
plans will need to be
carefully positioned to
avoid perceptions of
bias for sceptics.
Product quality
The products the industry produces are full of waste food and chemicals
The fish are fed
overseas-sourced
waste products.
The fish are given
antibiotics to
counteract them
being concentrated.
Reassuring consumers
that products are safe
to eat.
Reassuring consumers
about levels and types
of ‘chemicals’ used.
The industry can
comment on some
aspects of consumer
concerns with
credibility but the
main source of
credible information
in this area for
sceptics is sources
that independently
evaluate food such as
Consumer magazine
or reports of
investigations by
regulatory bodies.
Each of these concerns is discussed below.
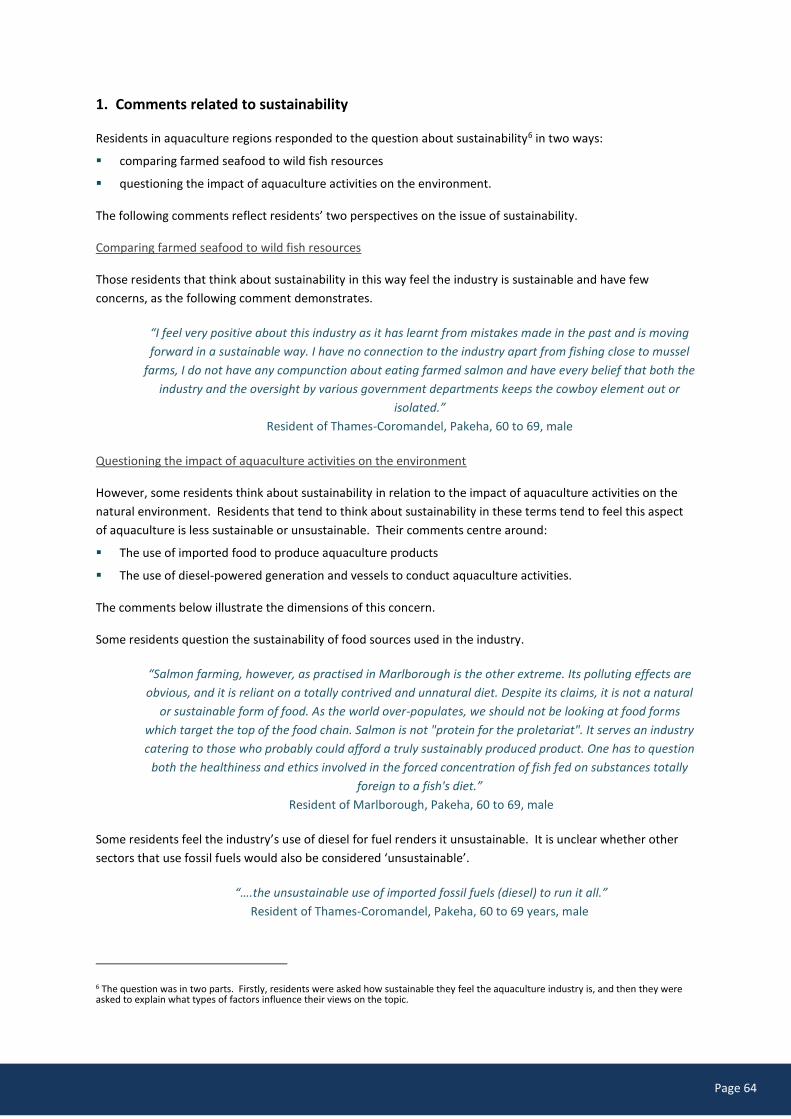
Page 64
‹#›
1. Comments related to sustainability
Residents in aquaculture regions responded to the question about sustainability6 in two ways:
comparing farmed seafood to wild fish resources
questioning the impact of aquaculture activities on the environment.
The following comments reflect residents’ two perspectives on the issue of sustainability.
Comparing farmed seafood to wild fish resources
Those residents that think about sustainability in this way feel the industry is sustainable and have few
concerns, as the following comment demonstrates.
“I feel very positive about this industry as it has learnt from mistakes made in the past and is moving
forward in a sustainable way. I have no connection to the industry apart from fishing close to mussel
farms, I do not have any compunction about eating farmed salmon and have every belief that both the
industry and the oversight by various government departments keeps the cowboy element out or
isolated.”
Resident of Thames-Coromandel, Pakeha, 60 to 69, male
Questioning the impact of aquaculture activities on the environment
However, some residents think about sustainability in relation to the impact of aquaculture activities on the
natural environment. Residents that tend to think about sustainability in these terms tend to feel this aspect
of aquaculture is less sustainable or unsustainable. Their comments centre around:
The use of imported food to produce aquaculture products
The use of diesel-powered generation and vessels to conduct aquaculture activities.
The comments below illustrate the dimensions of this concern.
Some residents question the sustainability of food sources used in the industry.
“Salmon farming, however, as practised in Marlborough is the other extreme. Its polluting effects are
obvious, and it is reliant on a totally contrived and unnatural diet. Despite its claims, it is not a natural
or sustainable form of food. As the world over-populates, we should not be looking at food forms
which target the top of the food chain. Salmon is not "protein for the proletariat". It serves an industry
catering to those who probably could afford a truly sustainably produced product. One has to question
both the healthiness and ethics involved in the forced concentration of fish fed on substances totally
foreign to a fish's diet.”
Resident of Marlborough, Pakeha, 60 to 69, male
Some residents feel the industry’s use of diesel for fuel renders it unsustainable. It is unclear whether other
sectors that use fossil fuels would also be considered ‘unsustainable’.
“….the unsustainable use of imported fossil fuels (diesel) to run it all.”
Resident of Thames-Coromandel, Pakeha, 60 to 69 years, male
6 The question was in two parts. Firstly, residents were asked how sustainable they feel the aquaculture industry is, and then they were asked to explain what types of factors influence their views on the topic.

Page 65
‹#›
Solutions to enhance sustainability perceptions
Residents’ negative perceptions of the industry’s sustainability centre around the perception that aquaculture
has a negative impact on the environment, as opposed to comparing it to the sustainability of wild fish stocks.
Residents of aquaculture regions will need ‘proof’ that the industry is working to minimise the impact of its
activities on the environment.
This will mean strategies such as:
providing independent scientific evidence of the impact (or lack of it) on the environment surrounding
aquaculture activities. This will counter claims that aquaculture activities are unsustainable.
Any activities that improve food energy efficiency.
Messages and channels to enhance sustainability perceptions
Those residents of aquaculture regions with less positive views of the industry will need to be informed about
sustainability issues from established and credible sources. They will be sceptical of messages from the
industry and will look to other sources to verify information. Organisations with established sustainability
credentials are considered credible sources of information.
In addition, sceptics will want to see independent and verifiable information from scientific research that
provides evidence that supports claims. They will seek connections between scientific research and the
industry to ‘prove’ bias if they suspect it. If they feel the research has been funded by the industry, it will not
be seen as credible, particularly if this is not noted upfront. Collaborative research between the industry and
the scientific community is valued and trusted, but some residents of aquaculture areas can be sceptical of
motives for positioning research, or may question findings that favour the aquaculture industry.
Some residents are comfortable receiving information about sustainability from the government, seeing this
source of information as credible and reliable. Others mistrust the government, because they feel it is
invested in the industry’s desire for growth and cannot be independent as a result.
Some sceptics will be open to ‘seeing for themselves’ the industries’ operations, and therefore accessibility will
be important. The industry should be seen to be open and transparent and capable of being scrutinised by the
public.
Some messages about use of biofuels or non-fossil fuels used in the industry can safely come from the industry
at a local level (for example, if a company converts to biofuel or develops efficiencies in their operations). The
industry itself is a credible source of this type of sustainability message.
Residents who think of sustainability in terms of comparing wild fish stocks to farmed seafood tend to be more
positive about the industry.
Page 66
‹#›
Concerns relating to sustainability for residents of aquaculture regions in the forum centre around beliefs that
aquaculture activities use fossil fuels and are an inefficient way to produce protein because it uses imported
food sources. These residents also feel the sustainable production of farmed seafood products involves
ensuring the long-term viability of the environment to support these activities. To residents of aquaculture
regions, this means that the industry restricts itself to farming seafood at the level that allows the sea and local
environment to support production without being damaged. Demonstrating behaviours that indicate
sustainability in this context will be important to gaining stronger community support to operate in these
regions. Sustainable practices (demonstrated and visible to residents) enhance perceptions of the industry
overall.
2. Concerns related to visual pollution
Some residents of aquaculture regions feel that some aspects of the industry are unsightly. They feel this way
because some farms and activities are located in prime recreational areas, including areas where tourists visit.
The competing priorities for use of the space can make residents feel less positive about the elements of the
industry that are necessary for production and processing (for example, the presence of racks, boats, jetties,
buoys and processing facilities). The comments which follow illustrate the dimensions of this concern.
Some feel the seascape is changed from ‘scenery’ to ‘production/factory’.
“The effect on scenery is a form of visual pollution. Our once majestic Marlborough Sounds are now
speckled with floats and rafts, the surface of the sea is affected by human pursuits. We are losing
touch with nature which nurtures us. Just as the plains of Marlborough are now almost one
continuous vineyard, widespread aquaculture would be further evidence that we are losing our
biodiversity.”
Resident of Marlborough, Pakeha 50 to 59, female
Some feel concerned about the concentration of farms in an area (visual as well as water pollution).
“The main thing that worries me about the aquaculture industry in the Marlborough Sounds, the one
area I know a little about, is if it increases any more due to visual pollution. This could eventually
overwhelm the native species and spoil the tourist industry.”
Resident of Marlborough, Pakeha, 70+, female
Concerns about visual pollution are driven by two elements:
not wanting to see aquaculture activities interrupt the scenery, but also
not wanting aquaculture activities to take up large areas of public space.
It will be important for the industry to be aware of both these elements in order to counteract them.
Solutions to reduce perception of visual pollution
The main counter to visual pollution is to minimise this as much as possible. For example:
keeping boats and equipment well maintained (not rusty and ‘falling apart’).
removing old and broken buoys, racks, and other plastic equipment so it is not visible, and so that it does
not float outside farm areas.
situating farms in more remote areas so they are less visible to the majority of visitors to an area.

Page 67
‹#›
Messages and channels for visual pollution concerns
Messages about reductions in visual pollution and strategies for solving this can be generated by the industry.
That is, residents are comfortable with the industry telling them about this type of activity. They would trust
it/find it credible. It is one of the areas where messages from the farm or industry itself would be an
appropriate source of information. This is because the farmer or business is best able to talk about the
improvements they have made and also because residents can see improvements for themselves and so can
trust the information. For example, if they see new, well maintained and quiet vessels out on the water, or
they notice less farm debris washing up on their local beach.
News and articles in local media would be acceptable channels for communicating about any innovations or
technical improvements in visual impact. Employees and employers within the industry would also be
valuable and credible sources of information as residents of aquaculture regions value local sources of
information from within their community.
For residents of aquaculture regions, perceptions of the unacceptability of visual pollution are correlated to
negative perceptions of the industry as a whole. However, the industry can enhance residents’ perceptions
with changes to practices and messages that highlight improvements in this area.
3. Risk to sea life
As noted earlier in this report, residents of aquaculture areas are concerned about the impact on sea life of
large concentrations of one species in an area. Comments about their concerns are illustrated below.
Some are concerned about the chemicals used to manage farm populations.
“My concern would be related to any chemicals used in the process which could impact on marine life
as well as the shellfish being produced.”
Resident of Canterbury, Pakeha, 60 to 69, female
Some are concerned about effluent and pollution as well as the impact on sea life of large concentrations of
species.
“Fish farming concentrates introduced nutrients, uneaten nutrient material, and fish waste into
regions where a delicate ecological balance can no longer exist. Because of the nature of tides and
water flows, the effects of aquaculture spread further than the immediate farmed areas. Water and
seabed conditions are changed. Some species will thrive while others will decline. An example is the
presence of certain starfish on the seabed replacing a more diverse natural biota prior to farming.
Jellyfish, described as “the cockroach of the sea", proliferate exponentially in damaged environments –
for example leachates from dairy industry into the sea… so many forms of food production are linked:
dairy and aquaculture industries both need to be questioned, in my view. I have read articles which
have influenced how I feel about the risk to marine life. I think we need to reconsider how we farm
generally - what type of food we produce, how and in what quantity. (And why? - to allow us to
consume more cheap consumerist goods exploitatively produced by poor Chinese workers?) Current
intensive dairying practices produce effluent and leachates which run over deforested land into the
sea, setting up nutrification which in turn contributes to toxic algal blooms and "Paralytic Shellfish
Poisoning". Oysters are dying out from a form of herpes which is linked to human activities in the same
way. Human practices including terrestrial farming, forestry and aquaculture are all interlinked, and
Page 68
‹#›
threaten marine life. Furthermore, I am old enough to remember when rivers were potable, rivers,
lakes and seas all swimmable, and marine life abundant. Our farming practices in general, including
aquaculture, are contributing to the steady demise of natural marine life.
Resident of Marlborough, Pakeha, 50 to 59, female
While residents in aquaculture regions were prompted to comment on the risk to sea life, many did not feel
that risk to sea life was a concern. A number of residents noted the term ‘risk’. These residents feel that risk is
an inherent part of any human activity in the environment, whether that be on land or at sea. They feel that
as long as the risks are understood, taken into account, avoided or mitigated as much as possible, that
aquaculture activities pose an acceptable level of risk. That is, they need to know and trust that the industry
and regulatory authorities are managing these risks. Many feel this is occurring now, and hope it will continue
in the future.
The following comments highlight that while there is a risk to sea life, residents of aquaculture areas feel this
can be mitigated by the industry and regulatory bodies.
“My feeling is that aquaculture doesn't pose a risk, but I only say this because I presume there are
some sort of regulations in place and water testing etc done to prove there is no risk to the
environment. I have no idea whether this happens or not. I presume in order to get council consent to
build a salmon farm they have to prove they are not harming the local environment? What has
influenced how I feel is possibly just naivety/ignorance of how this stuff is run, and a belief [that] the
councils and governments have rules around this sort of thing.”
Resident of Auckland, Māori, 30 to 35, female
“I don't think that anyone would dispute that aquaculture, or any industrial activity, can pose a risk. It
is how the risks are managed that is important. Because we are terrestrial beings, we actually know
stuff all about what goes on beneath the sea surface, in fact we hardly have an instinctive feel for life
in the sea, and can’t actually see much of the effects that go on there. Because our knowledge is so
limited, we don't yet really know what the risks are. For me the obvious risks are: degradation of
water quality, threat to other marine species, negative effect on the amenity value of the seaside, by
visual, smell, noise issues, all of which aquaculture already has known effects on. The sea is public
space, yet marine farming consents give a certain amount of control and occupancy to the industry
and removes the freedom of the public to use this public space. Think of it like a private business
erecting barriers that exclude the public from say footpaths or parks so that they can carry out
activities which degrade that space for their own financial gain….Both industry and legislators have to
ensure that these impacts are minimalized, thus minimalizing the risks.
Finally, known risks are much easier to deal with, and therefore strict compliance should be part and
parcel to the expansion of the industry. To avoid the unknown risks, we must always take a
precautionary approach.”
Resident of Marlborough, Pakeha, 60 to 69, male
Note that as in the survey, some of the concerns raised by residents of aquaculture regions relate to
commercial fishing activities. For example, residents mentioned over-fishing as a risk in response to this
question.
Solutions to concerns about risks to sea life
Residents of aquaculture regions will need reassurance and evidence that the industry is taking the risks to sea
life into account in undertaking its operations. This will mean telling them about what the industry is doing.
Page 69
‹#›
Some ways to mitigate concerns in this area are:
tell residents about the ways aquaculture businesses in their region are taking into account the risks to
marine life. Some pragmatic and practical solutions will be appealing to residents.
tell residents about use of/limited use of chemicals in the water. This will also address pollution and water
quality concerns.
Messages and channels to counteract perceptions of risks to sea life
Messages about how the industry is managing the risks to sea life need to come from an independent source.
This could be the Ministry, a research institute, or the media. Residents will need to trust the source of
information is not attempting to hide any issues. For residents in aquaculture regions, some of the most
credible sources of information are located in the region themselves. This might be a local but well respected
media commentator, or independent researcher.
The key message that residents with this concern will need to hear is that the industry has identified (and is
addressing) the risk its activities pose to marine life. The industry can enhance perceptions by demonstrating
any strategies that mitigate risks to sea life. This will provide residents in aquaculture growing regions with
reassurance that the industry is capable of, and willing to, manage the risks to sea life.
4. Concerns related to environmental degradation and pollution
Concerns raised by residents of aquaculture regions about pollution and environmental degradation stem from
concerns that the industry is not considering the long term implications of its activities and is only concerned
with short term gains at the expense of the environment.
Residents with these concerns fear the industry is acting without awareness or research regarding the
environmental impacts of its activities, and that these activities will impact negatively on natural or wild sea
life (for example, by polluting and rendering an area hostile to other marine life).
The dimensions of this topic relate to concerns that:
equipment and sea farm installations damage the environment (such as the sea bed)
loose equipment and debris from sea farms float free of the area causing a hazard/pollution
the sea bed is polluted from intensive farming (waste products and food waste).
The comments below provide illustration of residents’ concerns about pollution and environmental
degradation.
Some are concerned about damage to the sea bed.
“I am also concerned about the detrimental effect on the sea bed of such farms and the risk to boating
of large buoys and ropes coming loose from often poorly marked rafts of buoys in the open ocean.”
Resident of Canterbury, less positive, Pakeha, 50 to 59, female
Some are concerned about rubbish and equipment being released into the sea and landscape.
“Some negatives are the quantities of plastic rubbish washed up that comes from them (though in
fairness it has reduced a lot in recent times).”
Resident of Thames-Coromandel, positive, Pakeha, 60 to 69, male
Page 70
‹#›
Some are concerned about the effect of fish waste and food waste.
“There is enough pollution in our waters already. They are not pristine. They need to be cleaned up.
Aquaculture as I understand it currently, will add to the pollution. What could be done about it?
Farmed fish food would need to be made of totally natural foods - no chemicals, animal waste,
synthetic in them. Farmed fish would need to be fed in only those amounts which are absolutely
necessary for them to be healthy, so there's little wastage going elsewhere. The structures used need
to be well-maintained, removed when not in use, and disposed of safely on land.”
Resident of Northland, Pakeha, 60 to 69, female
Solutions to concerns about environmental degradation and pollution
Residents of aquaculture regions need to feel confident that the industry:
knows and is mindful of the risks and impacts of their activities (for example, has commissioned research)
is working to mitigate any risks (for example, by looking at reducing use of chemicals).
The aim of messages and strategies about pollution and environmental degradation should be to reassure
residents of aquaculture regions that the industry is both aware of the issues, and is taking measures to
address them.
Residents of aquaculture regions need to see individual farms cleaning up after themselves and not allowing
waste or equipment to escape from the area. Any items they see floating in the sea (such as buoys or ropes)
will impact negatively on their perceptions.
Residents’ perceptions of the industry would be enhanced by a number of strategies:
communications about the impact of fish waste/food waste (e.g. how it is being limited, reduced or
managed in specific areas).
research that shows regeneration or limited impact on the seabed or areas around farms.
Messages and channels for pollution and environmental degradation concerns
Residents of aquaculture regions with these types of concerns have observed the impact themselves. For
example, they have seen debris or equipment washed up on the beach from farm activities. Any
improvements in this area need to be observable for them.
In addition, either specific businesses in the area, or the industry as a collective, will need to communicate
with residents about actions taken to clear away and reduce debris. For example, telling residents about
strategies that have been employed.
Some of the other environmental concerns in this area, such as the impact of fish waste/food waste are more
of a sustainability issue and are best communicated via the Ministry or an independent source (local council,
research organisation) to enhance credibility.
As noted earlier, for some residents, research is not considered independent if links to the aquaculture
industry (and sources of funding) are evident, or not disclosed.

Page 71
‹#›
Some residents of aquaculture regions will need reassurance that the aquaculture industry is not polluting or
degrading the environment in areas where there are operations. The industry can, and should, communicate
about any improvements or enhancements in this area. However, in order to provide balance and credibility,
some residents of aquaculture regions will need to hear about improvements in this area from an independent
source. Any independent information that verifies messages from the industry will enhance perceptions.
5. Concerns relating to uncontrolled expansion to facilitate growth
Residents of aquaculture regions tend to be positive about the industry’s growth goal and feel this will
enhance the region by providing employment and income.
Some residents of aquaculture regions however, feel expansion of space will be the main strategy the industry
will employ to increase production. While they are positive about the growth goal itself, there are some
concerns that economic growth means expansion into greater proportions of the seascape. Expansion in and
of itself is not a concern, but the uncontrolled proliferation of farms would be of concern to some residents.
Residents are concerned about the potential for the industry to encroach on even more public space. This
concern relates both to visual pollution and the sense that aquaculture activities and farms will ‘take over’ the
natural environment.
Residents of aquaculture regions want to see measured, considered and well-researched growth in the
industry. The following comments highlight their views on growth.
“It’s alright to grow the industry but we got to take a look at visual pollution if we have too many
farms in one area.”
Resident of Northland, Pakeha, 50 to 59, male
“I think we have the room to do it (as long as it is done cleanly and not having a detrimental effect on
local areas).”
Resident of Northland, Pakeha, 30 to 34, female
“Again being in Marlborough provided adequate precautions are taken to prevent over farming by the
Local Authority this is OK”
Resident of Marlborough, Pakeha,70+, male
“I feel mostly positive about aquaculture but feel we need to keep a close watch on how efficiently
they are operated and should be monitored by someone independent.”
Resident of Auckland, Pakeha, 60to 69, female
The following comment shows that some residents in aquaculture regions are concerned that the growth goal
will bypass the normal consent processes in the pursuit of rapid growth.
“I am aware that the aquaculture industry wants to expand, and knew that it contributes to the
economy and exports products to many countries. Any industry has a goal of expanding and earning
more money, that is the nature of capitalism. I feel apprehensive about this goal because I'm not
confident that we know enough about aquaculture's long-term environmental effects. Also if adverse
environmental impacts became evident, I'm not confident that the resource consents would be
reviewed or revoked adequately to protect the environment because once a business is established it is
much more difficult to remove it than to have stopped it in the first place. It would only be good to
Page 72
‹#›
grow the industry if we are confident that there absolutely won't be adverse impacts, and that
consents are reviewed/reduced if impacts become evident. It should be a very slow and considered
approach to growth of the industry. ….I am not sure what the aquaculture industry intends to do to
achieve this goal but I imagine that it would involve lobbying politicians and government to get them
on-side and elevate the importance of their industry to the country, and then trying to change the
Resource Management Act (RMA) in their favour to make it easier to get consents, as well as using
recent changes to the RMA to try and get their consents seen as nationally significant and therefore
bypass regional council’s processing and go straight to the new EPA (Environmental Protection
Authority) for consents.”
Resident of Auckland, other ethnicity, 35 to 39, female
Solutions to uncontrolled growth concerns
Residents of aquaculture areas want reassurance that:
expansion and farm resource consents are being granted after careful consideration of all the factors, not
just the economic benefits.
the government (MPI) and local councils are managing and regulating the industry to the benefit of all
residents, not just the owners of the aquaculture businesses. They want assurances that the benefits of
growth in the industry will be to New Zealand as a whole, not just those with direct investment in the
industry.
Some strategies to overcome this concern are:
information about the profits and benefits to the region (e.g. local ‘good news’ stories)
signs that indicate that a business is ‘locally owned and operated’, if applicable, as this provides residents
with a sense that economic benefits are staying in the region.
comment in the media from the Ministry and local councils to show visibility and regulation or
collaboration with the industry (but still independent and capable of regulating).
indication from the Ministry and local councils that growth is measured and researched. This may involve
publishing RMA decisions when an application is granted (in layperson’s terms) and any mitigating
strategies promoted and publicised.
Any indication that a business or farm has bypassed the application process in order to expand will be met
with resistance unless residents of aquaculture regions have assurances that research and other due diligence
has been properly completed.
Messages and communication channels to address uncontrolled growth concerns
The most trusted and credible sources of information on this issue involve communication from both local and
central government. While many residents will be positive about headlines about an aquaculture venture
expanding in their region, a number of residents in these areas will be concerned that economic interests have
overtaken environmental or social impacts. Some residents are suspicious that local government and central
government officials are ‘in the pockets’ of the industry. The industry will need to maintain independence and
distance from government to ensure residents feel that local and central government has more than the
industry’s growth interests at heart.

Page 73
‹#›
The industry’s growth goal is generally supported by residents of aquaculture regions, but any expansion plans
and other means of achieving this goal that are visible to residents will need to be carefully positioned. The
industry should aim to reassure residents that due process has taken place, and that benefits will flow to the
local community as a result. Residents of aquaculture regions need to feel that the Ministry/government is
facilitating economic growth of the industry, but not at the expense of the environment or residents in these
areas (for example, restricting their access to the coast for recreation, or degrading the environment). Their
main concern is that the industry is not allowed to expand its footprint without considering the effects on
those living near these areas.
6. Concerns relating to product quality
Issues that concern residents of aquaculture regions include:
the content of food fed to farmed fish (e.g., does it contain ingredients from non-marine sources?)
the use of antibiotics and other chemicals to manage and control disease.
These concerns stem from their worries about consuming aquaculture products, as well as concerns about
pollution and the effects of using chemicals and antibiotics in the water surrounding a farm.
The following comments illustrate some of these concerns.
Some feel the content of food fed to fish is unnatural.
“In addition, I have heard that salmon in salmon farms are fed a type of animal bone (i.e. cattle, pig,
whatever). I don't know if this is true, but if it is it doesn't sound a natural type of food for fish. In their
natural element, they would not be eating animals - although of course big fish eat smaller fish and
there are bones in that.”
Resident of Northland, Pakeha, 60 to 69, female
Some are concerned about the use of chemicals and antibiotics.
“My concern would be in relation to the safety of any chemicals used.”
Resident of Canterbury, Pakeha, 60 to 69, female
“This would be in crowding of stock, improper feeding products, and the improper use of chemicals
and drugs.”
Resident of Thames-Coromandel, Pakeha, 60 to 69, male
“Fish farmers used to combat these outbreaks with antibiotics and other chemicals in fish feed, but
this created concern about the effect of the drugs on the ecosystems around the cages, as well as
residual antibiotics winding up on consumers plates.”
Resident of Canterbury, other ethnicity, 18 to 24, male
Similar to the focus on these issues in other sectors (for example, use of growth hormones and antibiotics in
chickens) the aquaculture industry faces accusations of promoting its products as healthy and pure, but
sceptics do not necessarily feel this is true. Some comments in the forum relate to concerns about chemicals
remaining in the product consumed, as well as chemicals polluting the water and regions around aquaculture
activities.

Page 74
‹#›
Solutions relating to product quality
Residents of aquaculture regions will need assurances that the food provided to farmed fish for consumption
makes the fish healthy to eat. Some are opposed to the idea of producing protein in this way. Messages and
strategies to counteract this issue might be:
developing or researching fish food that is locally produced (not imported)
providing an understanding to the public about the benefits of farmed fish as a food source
emphasis on premium product that commands a premium price that can then be used for investment in
better production options i.e. not doing things on the cheap, but making sure quality is achieved at all
stages of production.
Messages and channels related to consumption concerns
Magazines and websites that promote premium products and how to cook them can counteract some of the
perceptions about the way the products are produced. Those that enjoy seafood want to know it is healthily
and ethically produced and does not harm the environment.
Messages from the food industry (e.g. Cuisine magazine) can help alleviate concerns about the quality of
aquaculture products. Some of the concerns relate to intensive farming, so messages need to emphasise size
or space allowed for, as well as minimal use of chemicals such as antibiotics. Or, the use of these chemicals
needs to be considered an appealing aspect of the industry for the consumer, rather than a downside.
The industry will need to assure customers that food produced by the industry is safe and healthy to eat. This
will enhance perceptions of the products themselves as premium and high quality, but will also enhance
perceptions about reducing or avoiding use of chemicals and antibiotics in the water. If this is unavoidable,
the industry should develop messages that address and acknowledge this aspect of production.
Increasing public support at the national level
Key drivers of national support for industry growth
Figure 18 below displays the results of a multivariate analysis technique that helps in identifying priorities for
improving public perceptions. Survey results for all agree/disagree statements were analysed, and the results
have been placed along two axes in the chart.
Relative perceptions of the aquaculture industry are plotted along the horizontal axis. Attributes perceived
more positively by the New Zealand public are shown to the right. Attributes perceived less positively
(relative to the other attributes) are shown to the left.
The importance of each attribute for driving national support of industry growth is plotted along the
vertical axis. A combination of correlation and regression analyses were used to determine the
relationship between each attribute and public support for industry growth. Those attributes that are
more important are those that are more closely related to support for growth, and they are shown nearer
to the top of the vertical axis. Attributes that are less closely related to support for industry growth are
shown near the bottom of the vertical axis.
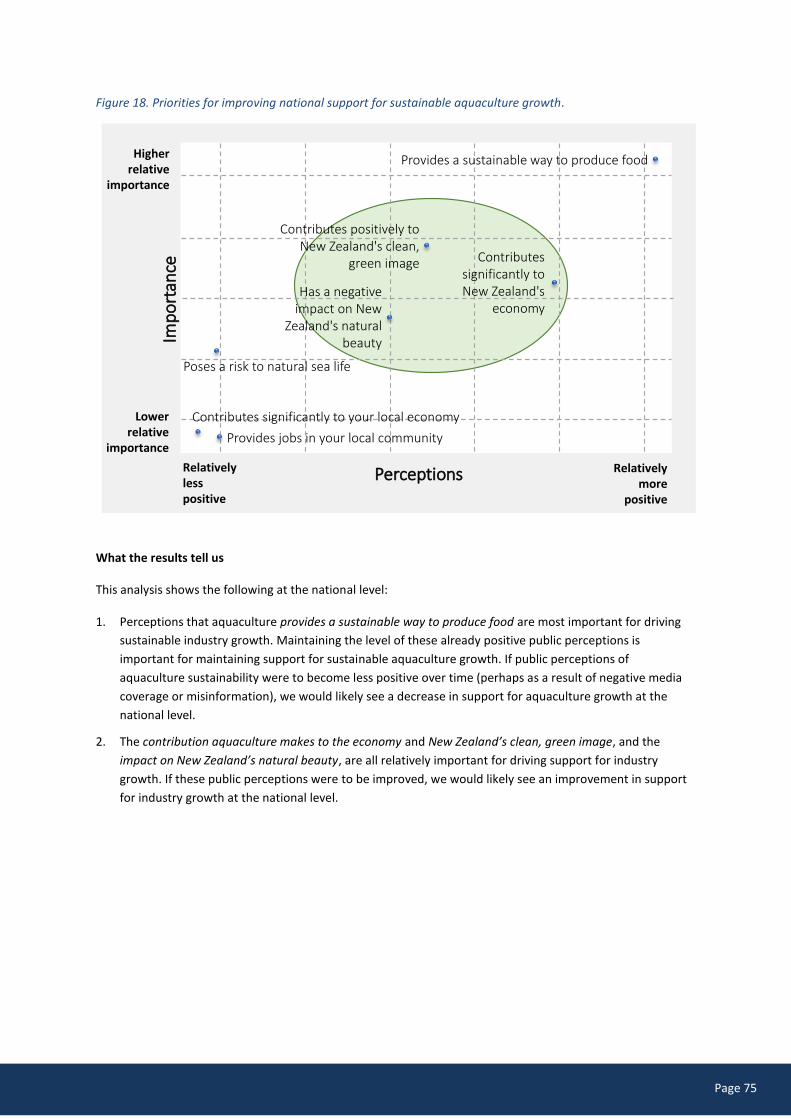
Page 75
‹#›
Figure 18. Priorities for improving national support for sustainable aquaculture growth.
What the results tell us
This analysis shows the following at the national level:
1. Perceptions that aquaculture provides a sustainable way to produce food are most important for driving
sustainable industry growth. Maintaining the level of these already positive public perceptions is
important for maintaining support for sustainable aquaculture growth. If public perceptions of
aquaculture sustainability were to become less positive over time (perhaps as a result of negative media
coverage or misinformation), we would likely see a decrease in support for aquaculture growth at the
national level.
2. The contribution aquaculture makes to the economy and New Zealand’s clean, green image, and the
impact on New Zealand’s natural beauty, are all relatively important for driving support for industry
growth. If these public perceptions were to be improved, we would likely see an improvement in support
for industry growth at the national level.
Perceptions
Imp
ort
ance
Provides a sustainable way to produce food
Poses a risk to natural sea life
Contributes positively to New Zealand's clean,
green image
Has a negative impact on New
Zealand's natural beauty
Provides jobs in your local community
Contributes significantly to your local economy
Contributes significantly to New Zealand's
economy
Relatively more
positive
Relatively less positive
Higher relative
importance
Lower relative
importance

Page 76
‹#›
The impact of information about sustainability practices and the size of the aquaculture
industry
During the design stages of this research we suspected that most New Zealanders would not know specific
information about the aquaculture industry, such as information about its size, the efficiency of food
production, and international certifications for environmental standards.7 We wanted to determine the impact
that this information might have on New Zealander’s perceptions of the sustainability, the economic
contribution made by aquaculture, and support for industry growth. We randomly selected a group of 300
survey respondents, and provided this additional information. We then asked explicitly whether this
information changed their views.
As can be seen in Figure 19 and Figure 20 of this report, the provision of information about the industry
positively impacts industry perceptions and support for industry growth. The most notable increase is in views
of the contribution that aquaculture makes to New Zealand’s economy. After providing information about the
size of the industry, the proportion of New Zealanders agreeing that aquaculture makes a significant
contribution to New Zealand’s economy increased from 80% to 91%.
When it came to views on sustainability of aquaculture and support for industry growth, there was limited
opportunity for overall agreement to become more positive. This is because nine in ten New Zealanders
already agreed with the two statements. However, after providing information about the efficiency of
aquaculture production and sustainability practices, the proportions of New Zealanders strongly agreeing with
each statement increased considerably:
Strong agreement that aquaculture provides a sustainable way to produce food increased from 52% to
63%.
Strong agreement that New Zealand should look for opportunities to sustainably grow the aquaculture
industry increased from 57% to 70%.
7 The Ministry for Primary Industries and Aquaculture New Zealand provided information about the size of the industry, published studies
on the efficiency of aquaculture production, and references to New Zealand certifications for environmental practices. See Hall, S.J., A.
Delaporte, M. J. Phillips, M. Beveridge and M. O’Keefe. 2011. Blue Frontiers: Managing the Environmental Costs of Aquaculture. The
WorldFish Center, Penang, Malaysia. See also Costa-Pierce, B.A., Bartley, D.M., Hasan, M., Yusoff, F., Kaushik,S.J., Rana, K., Lemos, D.,
Bueno, P. and Yakupitiyage, A. (2011). Responsible use of resources for sustainable aquaculture. Global Conference on Aquaculture 2010,
Sept. 22-25, 2010, Phuket, Thailand. For commentary and a research programme on protein production efficiency see
http://www.foodsecurity.ac.uk/blog/index.php/2013/05/aquaculture-protein-production-and-efficiency/ and
http://seatglobal.eu/2013/06/aquaculture-protein-production-and-efficiency/. The following website lists New Zealand aquaculture
companies that have achieved international environmental best practise certification http://www.gaalliance.org/.
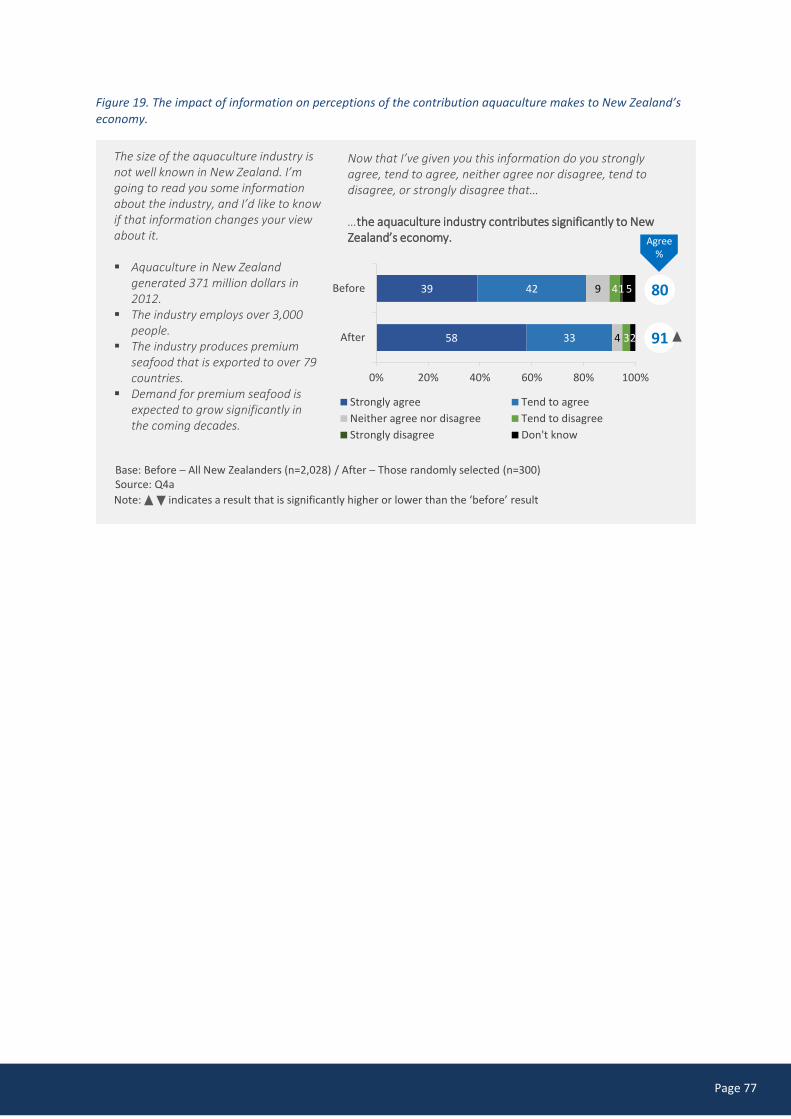
Page 77
‹#›
Figure 19. The impact of information on perceptions of the contribution aquaculture makes to New Zealand’s economy.
Base: Before – All New Zealanders (n=2,028) / After – Those randomly selected (n=300)Source: Q4a
The size of the aquaculture industry is not well known in New Zealand. I’m going to read you some information about the industry, and I’d like to know if that information changes your view about it.
Aquaculture in New Zealand generated 371 million dollars in 2012.
The industry employs over 3,000 people.
The industry produces premium seafood that is exported to over 79 countries.
Demand for premium seafood is expected to grow significantly in the coming decades.
39
58
42
33
9
4
4
3
1 5
2
0% 20% 40% 60% 80% 100%
Before
After
Strongly agree Tend to agree
Neither agree nor disagree Tend to disagree
Strongly disagree Don't know
Now that I’ve given you this information do you strongly agree, tend to agree, neither agree nor disagree, tend to disagree, or strongly disagree that…
…the aquaculture industry contributes significantly to New Zealand’s economy.
Note: indicates a result that is significantly higher or lower than the ‘before’ result
80
91
Agree%

Page 78
‹#›
Figure 20. The impact of information on perceptions of sustainability and support for industry growth.
Base: Before – All New Zealanders (n=2,028) / After – Those randomly selected (n=300)Source: Q4b (i) and (ii)
Studies have shown that aquaculture is one of the world’s most efficient forms of animal food production, and New Zealand aquaculture companies have received international certification for their high environmental standards.
Now that I’ve given you this information, do you strongly agree, tend to agree, neither agree nor disagree, tend to disagree, or strongly disagree that…
52
63
57
70
39
30
34
26
4
4
4
2
2
1
2
1
1
3
2
2
2
0% 20% 40% 60% 80% 100%
Before
After
Before
After
Strongly agree Tend to agree Neither agree nor disagree
Tend to disagree Strongly disagree Don't know
…New Zealand should look for opportunities to sustainably grow the aquaculture industry.
…aquaculture provides a sustainable way to produce food.
Note: indicates a result that is significantly higher or lower than the ‘before’ result
91
94
Agree%
91
96
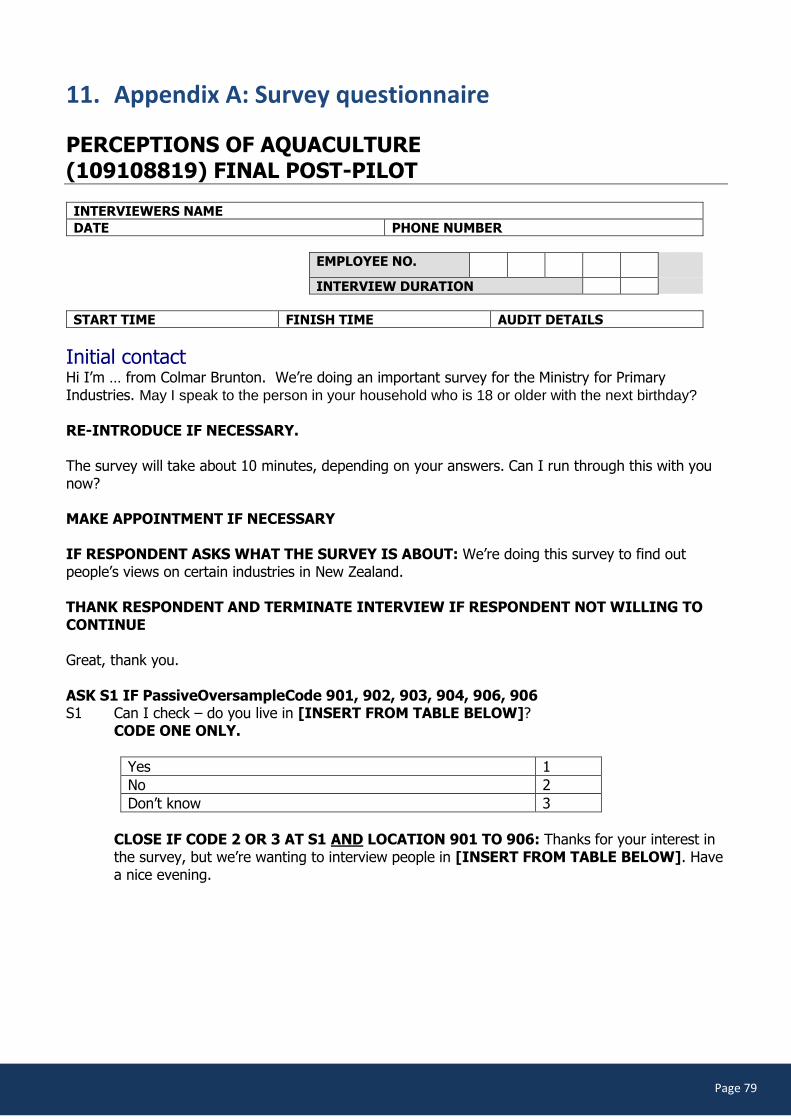
Page 79
‹#›
11. Appendix A: Survey questionnaire
PERCEPTIONS OF AQUACULTURE
(109108819) FINAL POST-PILOT INTERVIEWERS NAME
DATE PHONE NUMBER
EMPLOYEE NO.
INTERVIEW DURATION
START TIME FINISH TIME AUDIT DETAILS
Initial contact Hi I’m … from Colmar Brunton. We’re doing an important survey for the Ministry for Primary Industries. May I speak to the person in your household who is 18 or older with the next birthday? RE-INTRODUCE IF NECESSARY. The survey will take about 10 minutes, depending on your answers. Can I run through this with you now? MAKE APPOINTMENT IF NECESSARY IF RESPONDENT ASKS WHAT THE SURVEY IS ABOUT: We’re doing this survey to find out people’s views on certain industries in New Zealand. THANK RESPONDENT AND TERMINATE INTERVIEW IF RESPONDENT NOT WILLING TO CONTINUE Great, thank you. ASK S1 IF PassiveOversampleCode 901, 902, 903, 904, 906, 906 S1 Can I check – do you live in [INSERT FROM TABLE BELOW]? CODE ONE ONLY.
Yes 1
No 2
Don’t know 3
CLOSE IF CODE 2 OR 3 AT S1 AND LOCATION 901 TO 906: Thanks for your interest in the survey, but we’re wanting to interview people in [INSERT FROM TABLE BELOW]. Have a nice evening.
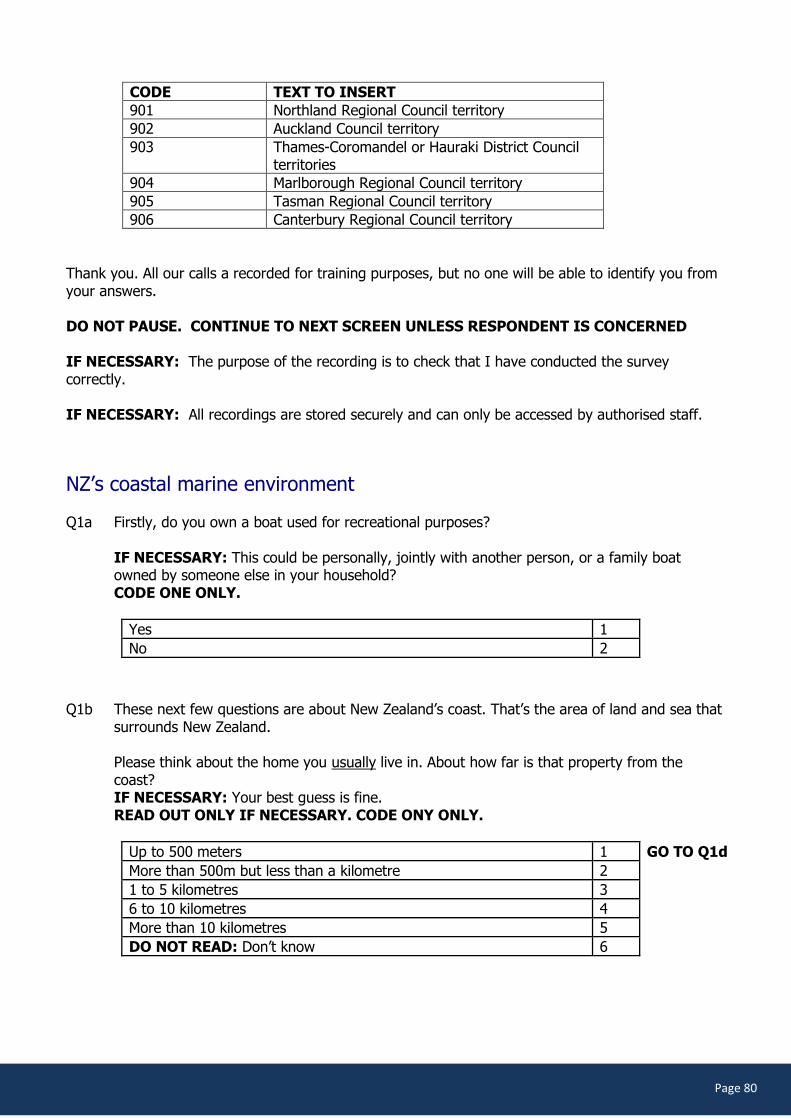
Page 80
‹#›
CODE TEXT TO INSERT
901 Northland Regional Council territory
902 Auckland Council territory
903 Thames-Coromandel or Hauraki District Council territories
904 Marlborough Regional Council territory
905 Tasman Regional Council territory
906 Canterbury Regional Council territory
Thank you. All our calls a recorded for training purposes, but no one will be able to identify you from your answers. DO NOT PAUSE. CONTINUE TO NEXT SCREEN UNLESS RESPONDENT IS CONCERNED IF NECESSARY: The purpose of the recording is to check that I have conducted the survey correctly. IF NECESSARY: All recordings are stored securely and can only be accessed by authorised staff.
NZ’s coastal marine environment Q1a Firstly, do you own a boat used for recreational purposes?
IF NECESSARY: This could be personally, jointly with another person, or a family boat owned by someone else in your household?
CODE ONE ONLY.
Yes 1
No 2
Q1b These next few questions are about New Zealand’s coast. That’s the area of land and sea that
surrounds New Zealand. Please think about the home you usually live in. About how far is that property from the coast? IF NECESSARY: Your best guess is fine. READ OUT ONLY IF NECESSARY. CODE ONY ONLY.
Up to 500 meters 1 GO TO Q1d
More than 500m but less than a kilometre 2
1 to 5 kilometres 3
6 to 10 kilometres 4
More than 10 kilometres 5
DO NOT READ: Don’t know 6

Page 81
‹#›
Q1c And do you own any other property that’s within 500 metres of the coast? CODE ONE ONLY.
Yes 1
No 2
Don’t know 3
Q1d And about how often do you use New Zealand’s coastal areas for recreation?
IF NECESSARY: Your best guess is fine. READ OUT. CODE ONE ONLY.
Never 1
1 to 5 times a year 2
6 to 10 times a year 3
More than 10 times a year 4
DO NOT READ: Don’t know 5
Awareness and consumption of aquaculture Q2a Have you heard of the term aquaculture?
CODE ONE ONLY.
Yes 1
No 2
Don’t know 3
Q2b Aquaculture is the farming of seafood. Are you aware of aquaculture in New Zealand? CODE ONE ONLY.
Yes 1
No 2 GO TO Q2d
Don’t know 3 GO TO Q2d

Page 82
‹#›
Q2c What New Zealand aquaculture are you aware of? DO NOT READ OUT. PROBE TO NO. CODE EACH MENTIONED.
INTERVIEWER NOTE: ANY MENTION OF FARMING A SPECIFIC PRODUCT CAN BE CODED BELOW. EG. ‘SALMON FARMS’ CAN BE CODED AS CODE 2.
Mussels 1
Salmon 2
Bluff oysters 3
Other types of oysters 4
Trout 5
Paua 6
Eels 7
Crayfish/Koura 8
Prawns 9
Seaweed 10
Scallops 11
Pipi 12
Cockles 13
Fish (no specific species mentioned) 14
Other (please specify) 15
Don’t know 16
Q2d I’m going to read out a list that includes products, organisations, and industries. I’d like to
know how important you think each is to New Zealand. Please use a scale from 1 to 7, where 1 is not at all important and 7 is extremely important.
CODE ONE ONLY FOR EACH STATEMENT.
RANDOMISE STATEMENTS.
Not
at
all
import
ant
Extr
em
ely
im
port
ant
DO
NO
T R
EA
D
Don’t k
now
New Zealand oysters 1 2 3 4 5 6 7 8
Marlborough Wine 1 2 3 4 5 6 7 8
Greenshell Mussels 1 2 3 4 5 6 7 8
New Zealand dairy produce 1 2 3 4 5 6 7 8
New Zealand salmon 1 2 3 4 5 6 7 8
The New Zealand film industry 1 2 3 4 5 6 7 8
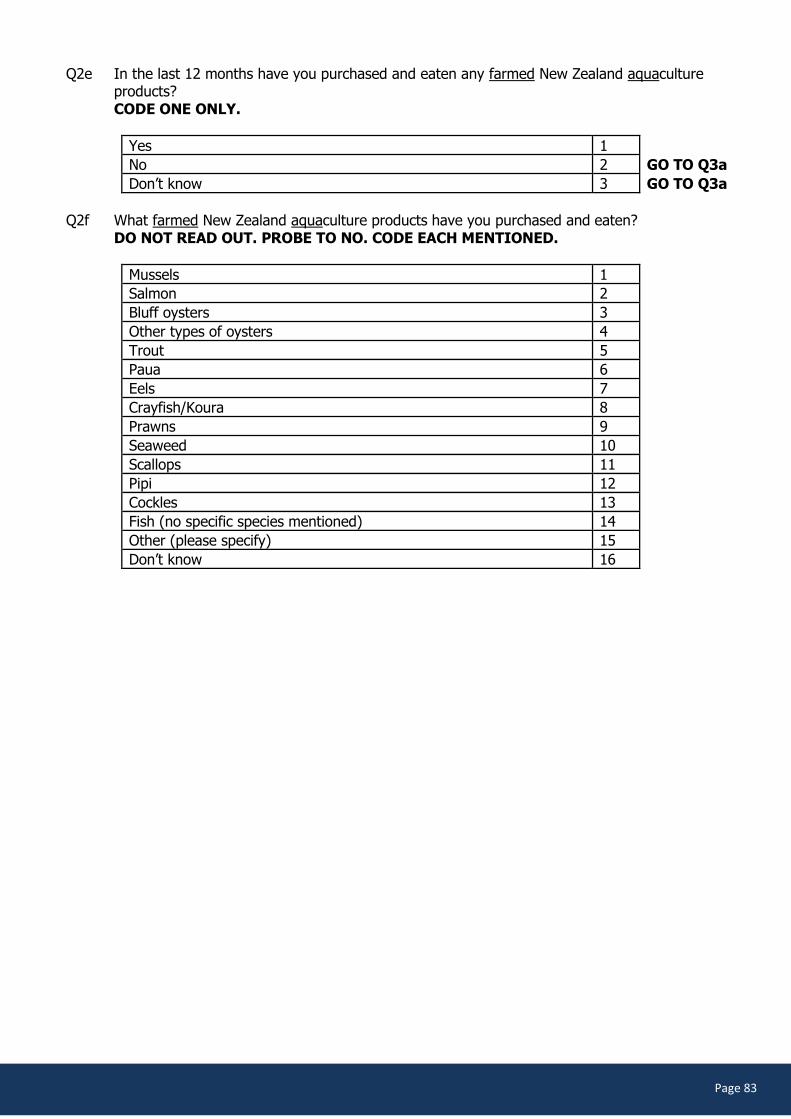
Page 83
‹#›
Q2e In the last 12 months have you purchased and eaten any farmed New Zealand aquaculture products? CODE ONE ONLY.
Yes 1
No 2 GO TO Q3a
Don’t know 3 GO TO Q3a
Q2f What farmed New Zealand aquaculture products have you purchased and eaten?
DO NOT READ OUT. PROBE TO NO. CODE EACH MENTIONED.
Mussels 1
Salmon 2
Bluff oysters 3
Other types of oysters 4
Trout 5
Paua 6
Eels 7
Crayfish/Koura 8
Prawns 9
Seaweed 10
Scallops 11
Pipi 12
Cockles 13
Fish (no specific species mentioned) 14
Other (please specify) 15
Don’t know 16
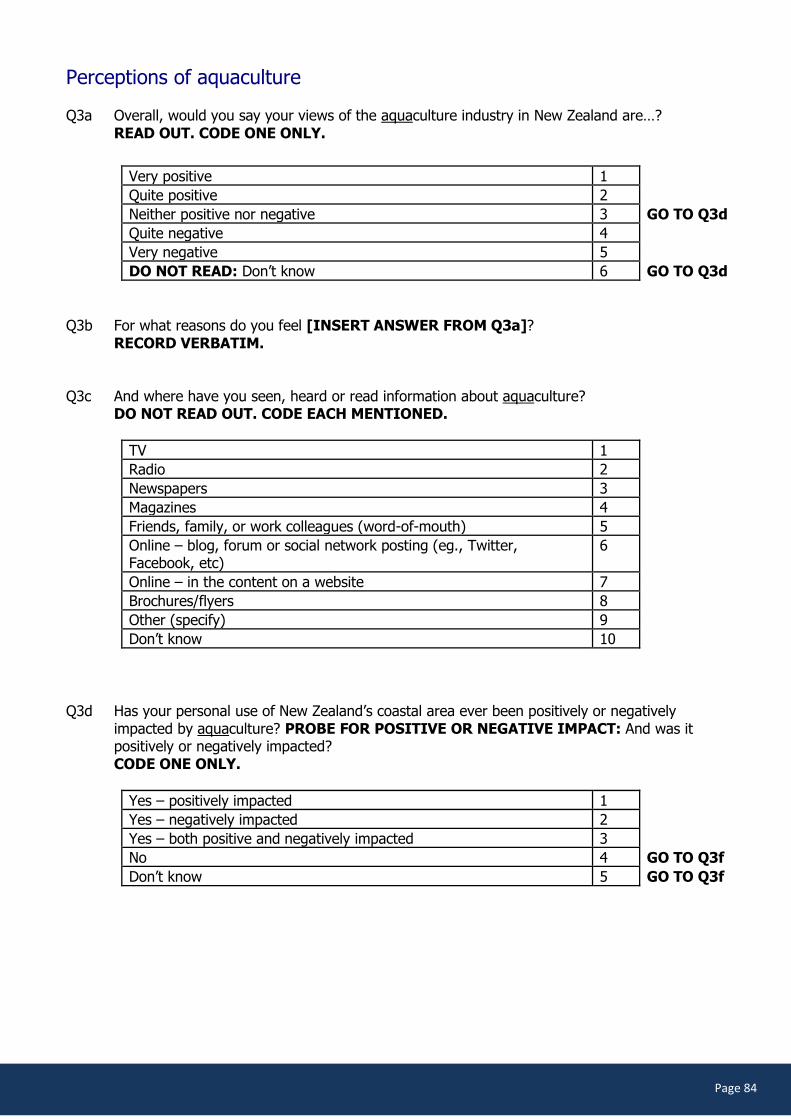
Page 84
‹#›
Perceptions of aquaculture Q3a Overall, would you say your views of the aquaculture industry in New Zealand are…? READ OUT. CODE ONE ONLY.
Very positive 1
Quite positive 2
Neither positive nor negative 3 GO TO Q3d
Quite negative 4
Very negative 5
DO NOT READ: Don’t know 6 GO TO Q3d
Q3b For what reasons do you feel [INSERT ANSWER FROM Q3a]? RECORD VERBATIM. Q3c And where have you seen, heard or read information about aquaculture?
DO NOT READ OUT. CODE EACH MENTIONED.
TV 1
Radio 2
Newspapers 3
Magazines 4
Friends, family, or work colleagues (word-of-mouth) 5
Online – blog, forum or social network posting (eg., Twitter, Facebook, etc)
6
Online – in the content on a website 7
Brochures/flyers 8
Other (specify) 9
Don’t know 10
Q3d Has your personal use of New Zealand’s coastal area ever been positively or negatively
impacted by aquaculture? PROBE FOR POSITIVE OR NEGATIVE IMPACT: And was it positively or negatively impacted? CODE ONE ONLY.
Yes – positively impacted 1
Yes – negatively impacted 2
Yes – both positive and negatively impacted 3
No 4 GO TO Q3f
Don’t know 5 GO TO Q3f

Page 85
‹#›
Q3e In what way was your use of the coastal area impacted by aquaculture? DO NOT READ OUT. PROBE TO NO. CODE EACH MENTIONED.
POSITIVE IMPACTS
Fishing is good near an aquaculture farm 1
Received help from aquaculture farm workers on the water 2
Used boat ramp facilities the aquaculture industry helped fund 3
Other positive impact (specify) 4
NEGATIVE IMPACTS
Restricts my access to the beach/coastal areas/public space 5
The smell/didn’t like the smell 6
Didn’t like the look of them/spoilt the scenery 7
Rubbish produced by farms on the beach 8
Changed natural/recreational area to an industrial area 9
The farm was a safety hazard/dangerous for boats/ships 10
Impacted the water quality/polluted the water 11
Harmed the natural/local fish in the area 12
Impacts traditional/customary Māori interaction with foreshore/coastal areas
13
Other negative impact (specify) 14
Don’t know 15
Q3f Do you know anyone who works in aquaculture? CODE ONE ONLY.
Yes 1
No 2
Don’t know 3
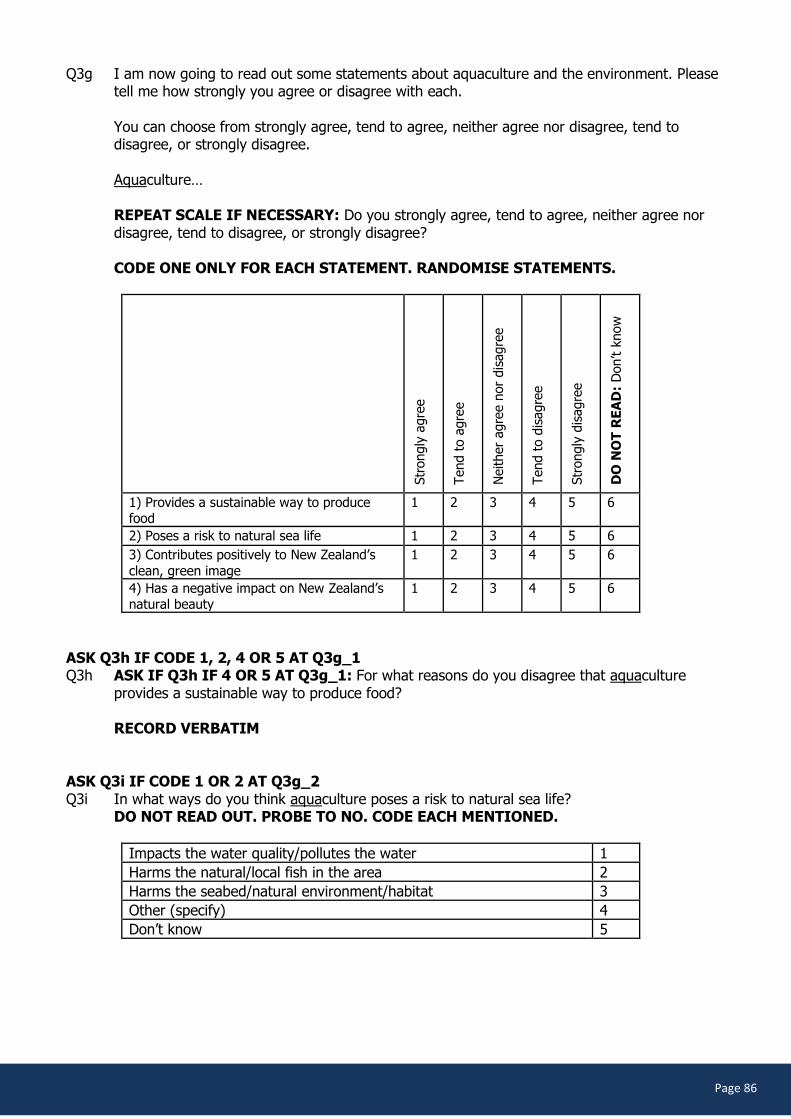
Page 86
‹#›
Q3g I am now going to read out some statements about aquaculture and the environment. Please tell me how strongly you agree or disagree with each.
You can choose from strongly agree, tend to agree, neither agree nor disagree, tend to disagree, or strongly disagree.
Aquaculture…
REPEAT SCALE IF NECESSARY: Do you strongly agree, tend to agree, neither agree nor
disagree, tend to disagree, or strongly disagree?
CODE ONE ONLY FOR EACH STATEMENT. RANDOMISE STATEMENTS.
Str
ongly
agre
e
Tend t
o a
gre
e
Neither
agre
e n
or
dis
agre
e
Tend t
o d
isagre
e
Str
ongly
dis
agre
e
DO
NO
T R
EA
D:
Don’t k
now
1) Provides a sustainable way to produce food
1 2 3 4 5 6
2) Poses a risk to natural sea life 1 2 3 4 5 6 3) Contributes positively to New Zealand’s
clean, green image
1 2 3 4 5 6
4) Has a negative impact on New Zealand’s natural beauty
1 2 3 4 5 6
ASK Q3h IF CODE 1, 2, 4 OR 5 AT Q3g_1 Q3h ASK IF Q3h IF 4 OR 5 AT Q3g_1: For what reasons do you disagree that aquaculture
provides a sustainable way to produce food? RECORD VERBATIM
ASK Q3i IF CODE 1 OR 2 AT Q3g_2 Q3i In what ways do you think aquaculture poses a risk to natural sea life?
DO NOT READ OUT. PROBE TO NO. CODE EACH MENTIONED.
Impacts the water quality/pollutes the water 1
Harms the natural/local fish in the area 2
Harms the seabed/natural environment/habitat 3
Other (specify) 4
Don’t know 5
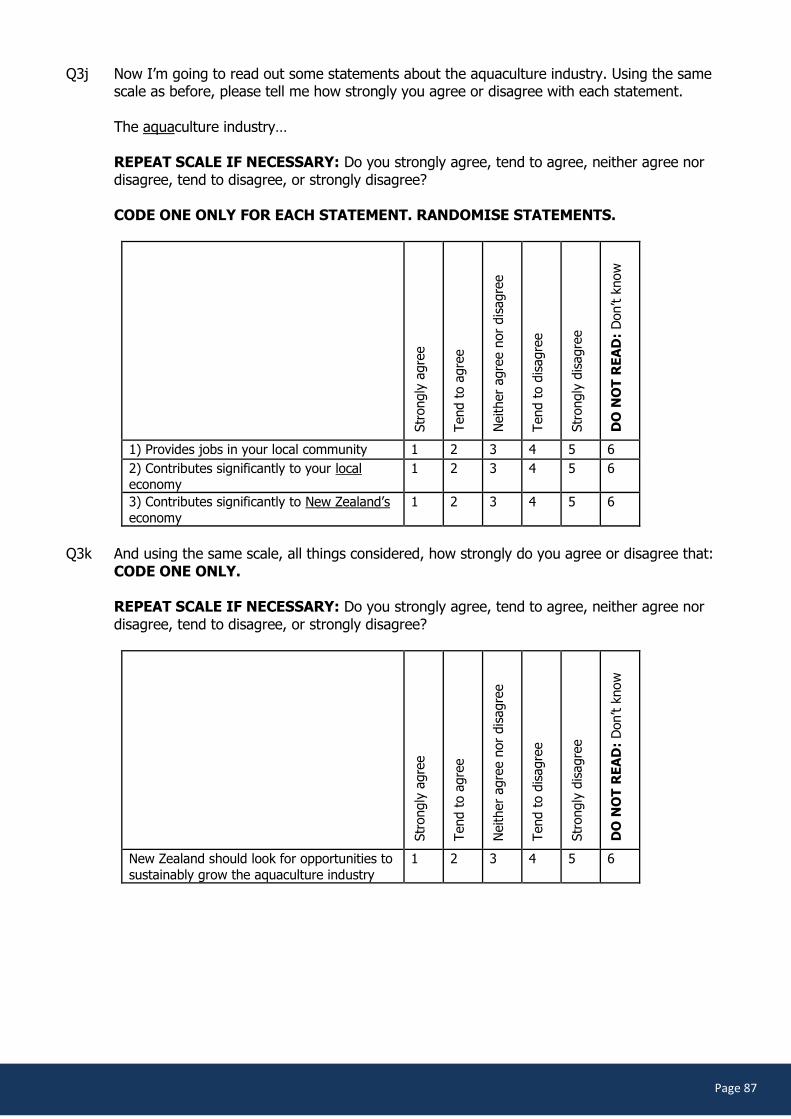
Page 87
‹#›
Q3j Now I’m going to read out some statements about the aquaculture industry. Using the same scale as before, please tell me how strongly you agree or disagree with each statement. The aquaculture industry…
REPEAT SCALE IF NECESSARY: Do you strongly agree, tend to agree, neither agree nor
disagree, tend to disagree, or strongly disagree?
CODE ONE ONLY FOR EACH STATEMENT. RANDOMISE STATEMENTS.
Str
ongly
agre
e
Tend t
o a
gre
e
Neither
agre
e n
or
dis
agre
e
Tend t
o d
isagre
e
Str
ongly
dis
agre
e
DO
NO
T R
EA
D:
Don’t k
now
1) Provides jobs in your local community 1 2 3 4 5 6 2) Contributes significantly to your local economy
1 2 3 4 5 6
3) Contributes significantly to New Zealand’s
economy
1 2 3 4 5 6
Q3k And using the same scale, all things considered, how strongly do you agree or disagree that:
CODE ONE ONLY. REPEAT SCALE IF NECESSARY: Do you strongly agree, tend to agree, neither agree nor disagree, tend to disagree, or strongly disagree?
Str
ongly
agre
e
Tend t
o a
gre
e
Neither
agre
e n
or
dis
agre
e
Tend t
o d
isagre
e
Str
ongly
dis
agre
e
DO
NO
T R
EA
D:
Don’t k
now
New Zealand should look for opportunities to
sustainably grow the aquaculture industry
1 2 3 4 5 6
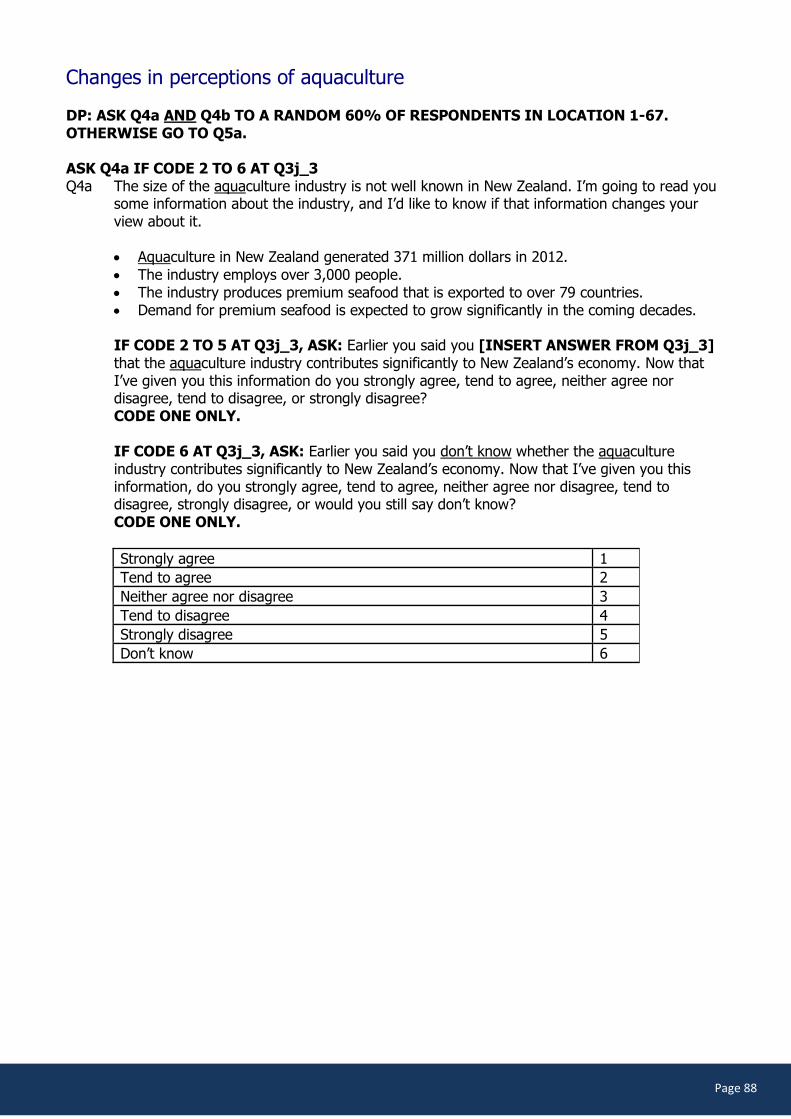
Page 88
‹#›
Changes in perceptions of aquaculture DP: ASK Q4a AND Q4b TO A RANDOM 60% OF RESPONDENTS IN LOCATION 1-67. OTHERWISE GO TO Q5a. ASK Q4a IF CODE 2 TO 6 AT Q3j_3 Q4a The size of the aquaculture industry is not well known in New Zealand. I’m going to read you
some information about the industry, and I’d like to know if that information changes your view about it.
Aquaculture in New Zealand generated 371 million dollars in 2012.
The industry employs over 3,000 people. The industry produces premium seafood that is exported to over 79 countries. Demand for premium seafood is expected to grow significantly in the coming decades. IF CODE 2 TO 5 AT Q3j_3, ASK: Earlier you said you [INSERT ANSWER FROM Q3j_3] that the aquaculture industry contributes significantly to New Zealand’s economy. Now that I’ve given you this information do you strongly agree, tend to agree, neither agree nor disagree, tend to disagree, or strongly disagree? CODE ONE ONLY. IF CODE 6 AT Q3j_3, ASK: Earlier you said you don’t know whether the aquaculture industry contributes significantly to New Zealand’s economy. Now that I’ve given you this information, do you strongly agree, tend to agree, neither agree nor disagree, tend to disagree, strongly disagree, or would you still say don’t know? CODE ONE ONLY.
Strongly agree 1
Tend to agree 2
Neither agree nor disagree 3
Tend to disagree 4
Strongly disagree 5
Don’t know 6

Page 89
‹#›
ASK Q4b IF CODE 2 TO 6 AT Q3g_1 OR CODE 2 TO 6 AT Q3k Q4b Studies have shown that aquaculture is one of the world’s most efficient forms of animal food
production, and New Zealand aquaculture companies have received international certification for their high environmental standards.
(i) IF CODE 2 TO 5 AT Q3g_1, ASK: Earlier you said you [INSERT ANSWER FROM
Q3g_q] that aquaculture provides a sustainable way to produce food. Now that I’ve given you this information, do you strongly agree, tend to agree, neither agree nor disagree, tend to disagree, or strongly disagree?
IF CODE 6 AT Q3g_1, ASK: Earlier you said you don’t know whether aquaculture provides a sustainable way to produce food. Now that I’ve given you this information, do you strongly agree, tend to agree, neither agree nor disagree, tend to disagree, strongly disagree, or would you still say don’t know? CODE ONE ONLY.
Strongly agree 1
Tend to agree 2
Neither agree nor disagree 3
Tend to disagree 4
Strongly disagree 5
Don’t know 6
(ii) IF CODE 2 TO 5 AT Q3k, ASK: Earlier you said you [INSERT ANSWER FROM Q3k] that New Zealand should look for opportunities to sustainably grow the aquaculture industry. Now that I’ve given you this information do you strongly agree, tend to agree, neither agree nor disagree, tend to disagree, or strongly disagree? CODE ONE ONLY.
IF CODE 6 AT Q3k, ASK: Earlier you said you don’t know whether New Zealand should look for opportunities to sustainably grow the aquaculture industry. Now that I’ve given you this information, do you strongly agree, tend to agree, neither agree nor disagree, tend to disagree, strongly disagree, or would you still say don’t know? CODE ONE ONLY.
Strongly agree 1
Tend to agree 2
Neither agree nor disagree 3
Tend to disagree 4
Strongly disagree 5
Don’t know 6

Page 90
‹#›
Demographic questions Q5a So that we can check that we’ve surveyed a range of people, I have a few background
questions. CODE RESPONDENT’S GENDER
Male 1
Female 2
Q5b Which of these following age groups are you in?
READ OUT. CODE ONE ONLY.
18 to 24 years 1
25 to 29 years 2
30 to 34 years 3
35 to 39 years 4
40 to 49 years 5
50 to 59 years 6
60 to 69 years 7
70+ years 8
DO NOT READ: Refused 9
Q5c Which of the following ethnic groups do you belong to? You can choose more than one.
READ ENTIRE LIST BEFORE ACCEPTING ANSWER. CODE EACH MENTIONED.
New Zealand European/Pakeha 1
Māori 2
Samoan 3
Cook Island Māori 4
Tongan 5
Niuean 6
Chinese 7
Indian 8
Another ethnic group (specify) 9
DO NOT READ: Don’t know 10
DO NOT READ: Refused 11
Q5d And, can you please tell me how many people aged 18 years and over live in your household,
including yourself? WRITE IN TOTAL NUMBER AGED 18 YEARS AND OVER
IF ONLY ONE PERSON AGED 18 OR OVER, SKIP TO Q5g
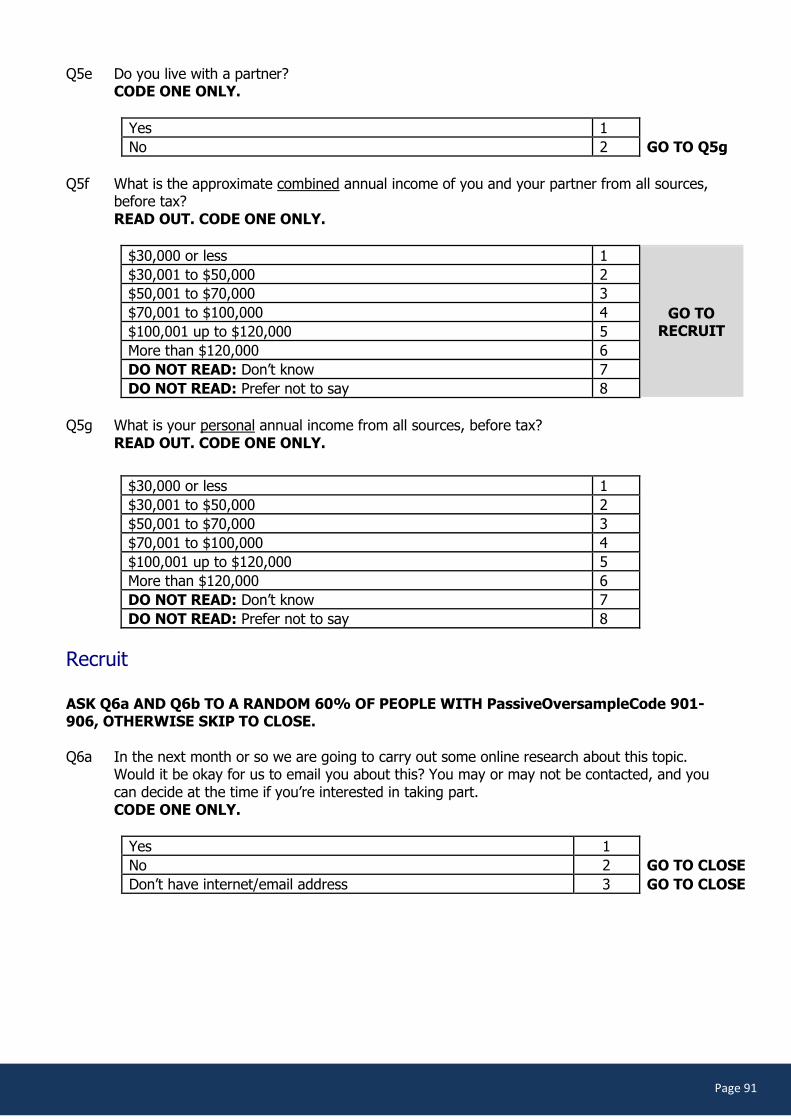
Page 91
‹#›
Q5e Do you live with a partner? CODE ONE ONLY.
Yes 1
No 2 GO TO Q5g
Q5f What is the approximate combined annual income of you and your partner from all sources,
before tax? READ OUT. CODE ONE ONLY.
$30,000 or less 1
GO TO RECRUIT
$30,001 to $50,000 2
$50,001 to $70,000 3
$70,001 to $100,000 4
$100,001 up to $120,000 5
More than $120,000 6
DO NOT READ: Don’t know 7
DO NOT READ: Prefer not to say 8
Q5g What is your personal annual income from all sources, before tax?
READ OUT. CODE ONE ONLY.
$30,000 or less 1
$30,001 to $50,000 2
$50,001 to $70,000 3
$70,001 to $100,000 4
$100,001 up to $120,000 5
More than $120,000 6
DO NOT READ: Don’t know 7
DO NOT READ: Prefer not to say 8
Recruit ASK Q6a AND Q6b TO A RANDOM 60% OF PEOPLE WITH PassiveOversampleCode 901-906, OTHERWISE SKIP TO CLOSE. Q6a In the next month or so we are going to carry out some online research about this topic.
Would it be okay for us to email you about this? You may or may not be contacted, and you can decide at the time if you’re interested in taking part.
CODE ONE ONLY.
Yes 1
No 2 GO TO CLOSE
Don’t have internet/email address 3 GO TO CLOSE

Page 92
‹#›
Q6b Thank you. May I please have your first name and email address? IF NECESSARY: This information will only be used to contact you about this research project. FIRST NAME: EMAIL:
TICK BOX: CANNOT REMEMBER EMAIL ADDRESS
Close
That’s the end of the survey. Thank you very much for your time today. My name is … . If you have any further questions about this research please feel free to call my supervisor on… INTERVIEWER DECLARATION: ‘I certify that I have conducted this interview in accordance with the guidelines set out in the Market Research Society Code of Practice and in accordance with the instructions from Consumer Link. I have thoroughly checked the questionnaire and it is complete in all respects.’
Yes 1
No 2
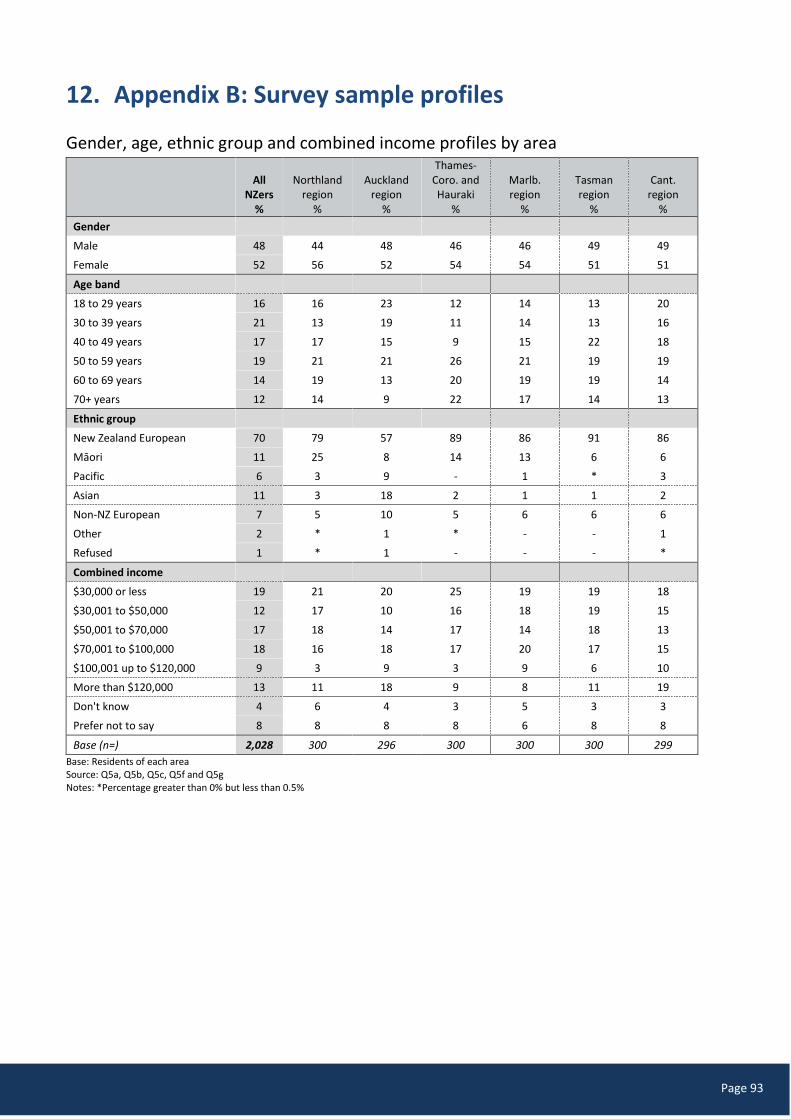
Page 93
‹#›
12. Appendix B: Survey sample profiles
Gender, age, ethnic group and combined income profiles by area
All
NZers %
Northland region
%
Auckland region
%
Thames-Coro. and Hauraki
%
Marlb. region
%
Tasman region
%
Cant. region
%
Gender
Male 48 44 48 46 46 49 49
Female 52 56 52 54 54 51 51
Age band
18 to 29 years 16 16 23 12 14 13 20
30 to 39 years 21 13 19 11 14 13 16
40 to 49 years 17 17 15 9 15 22 18
50 to 59 years 19 21 21 26 21 19 19
60 to 69 years 14 19 13 20 19 19 14
70+ years 12 14 9 22 17 14 13
Ethnic group
New Zealand European 70 79 57 89 86 91 86
Māori 11 25 8 14 13 6 6
Pacific 6 3 9 - 1 * 3
Asian 11 3 18 2 1 1 2
Non-NZ European 7 5 10 5 6 6 6
Other 2 * 1 * - - 1
Refused 1 * 1 - - - *
Combined income
$30,000 or less 19 21 20 25 19 19 18
$30,001 to $50,000 12 17 10 16 18 19 15
$50,001 to $70,000 17 18 14 17 14 18 13
$70,001 to $100,000 18 16 18 17 20 17 15
$100,001 up to $120,000 9 3 9 3 9 6 10
More than $120,000 13 11 18 9 8 11 19
Don't know 4 6 4 3 5 3 3
Prefer not to say 8 8 8 8 6 8 8
Base (n=) 2,028 300 296 300 300 300 299
Base: Residents of each area Source: Q5a, Q5b, Q5c, Q5f and Q5g Notes: *Percentage greater than 0% but less than 0.5%

Page 94
‹#›
Engagement with coastal areas by area
All
NZers %
Northland region
%
Auckland region
%
Thames-Coro. and Hauraki
%
Marlb. region
%
Tasman region
%
Cant. region
%
Boat ownership
Owns boat 13 31 12 33 24 27 14
Does not 87 69 88 67 76 73 86
Coastal property
Owns/lives in coastal property 16 25 19 32 16 21 13
Does not 84 75 81 68 84 79 87
Use of coastal areas for recreation
Never 8 5 9 5 9 4 9
1-5 times p/year 34 21 24 17 31 18 42
6-10 times p/year 14 15 17 10 15 14 15
More than 10 times p/year 44 59 49 69 45 65 34
Knows someone employed in aquaculture industry
Knows someone 16 32 13 38 54 49 20
Does not know someone 84 68 87 62 46 51 80
Consumption of aquaculture
Consumed in last 12 months 66 64 66 73 69 69 70
Not consumed 34 36 34 27 31 31 30
Base (n=) 2,028 300 296 300 300 300 299
Base: Residents of each area Source: Q1a, Q1b, Q1c, Q1d, and Q2e Notes: *Percentage greater than 0% but less than 0.5%
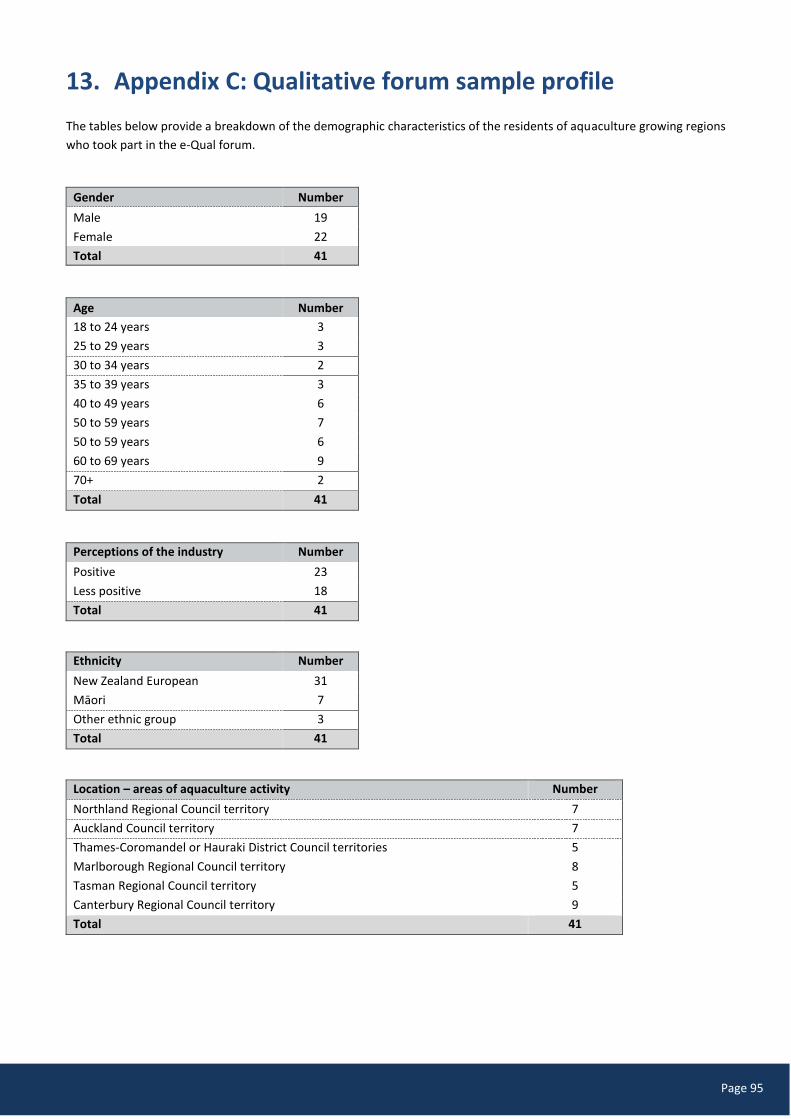
Page 95
‹#›
13. Appendix C: Qualitative forum sample profile
The tables below provide a breakdown of the demographic characteristics of the residents of aquaculture growing regions
who took part in the e-Qual forum.
Gender Number
Male 19
Female 22
Total 41
Age Number
18 to 24 years 3
25 to 29 years 3
30 to 34 years 2
35 to 39 years 3
40 to 49 years 6
50 to 59 years 7
50 to 59 years 6
60 to 69 years 9
70+ 2
Total 41
Perceptions of the industry Number
Positive 23
Less positive 18
Total 41
Ethnicity Number
New Zealand European 31
Māori 7
Other ethnic group 3
Total 41
Location – areas of aquaculture activity Number
Northland Regional Council territory 7
Auckland Council territory 7
Thames-Coromandel or Hauraki District Council territories 5
Marlborough Regional Council territory 8
Tasman Regional Council territory 5
Canterbury Regional Council territory 9
Total 41