Learning Disabilities LD-Learning Disabled Student with a Learning Disability.

Public Perceptions of Disabled People
Evidence from the British Social Attitudes Survey 2009
Luke Staniland
AcknowledgementsThe author is grateful to Miranda Phillips and Liz Clery at the National Centre for Social Research (Natcen) for their help and assistance. The support of Jane Francis from the Department for Work and Pensions (DWP) during the cognitive testing of the survey questions was also greatly appreciated. The author would also like to thank Chris Gunning, Bairbre Kelly, Ashley Kershaw, Sarah Kissack, Rita Patel and Stephen Thrower from the Office for Disability Issues (ODI) who provided helpful comments and guidance during the production of this report.
About the authorLuke Staniland was a Senior Research Officer at the Office for Disability Issues (ODI) at the time of writing.The Office for Disability Issues leads the government’s vision of achieving equality for disabled people.
1
Public Perceptions of Disabled PeopleEvidence from the British Social Attitudes Survey 2009
ContentsList of figures and tables 3
Executive summary 7
Chapter 1 – Introduction 121.1 Attitudes and Disability Equality
in Current Policy 131.2 Examining attitudes towards disability through
the 2009 British Social Attitudes Survey 141.3 Why attitudes matter 151.4 How to measure attitudes 161.5 Reporting and Methodology 18
1.5.1 Outline of the report 181.5.2 British Social Attitudes Survey 191.5.3 Defining disability 201.5.4 Sample sizes and significance testing 21
Chapter 2 – The nature of prejudice against disabled people 22
2.1 How prejudiced are people and how have attitudes changed over time? 23
2.2 Views of capability and productivity 262.3 Attitudes towards the social model
of disability 292.4 Comfort with expressing prejudice 33
2
Public Perceptions of Disabled PeopleEvidence from the British Social Attitudes Survey 2009
Contents
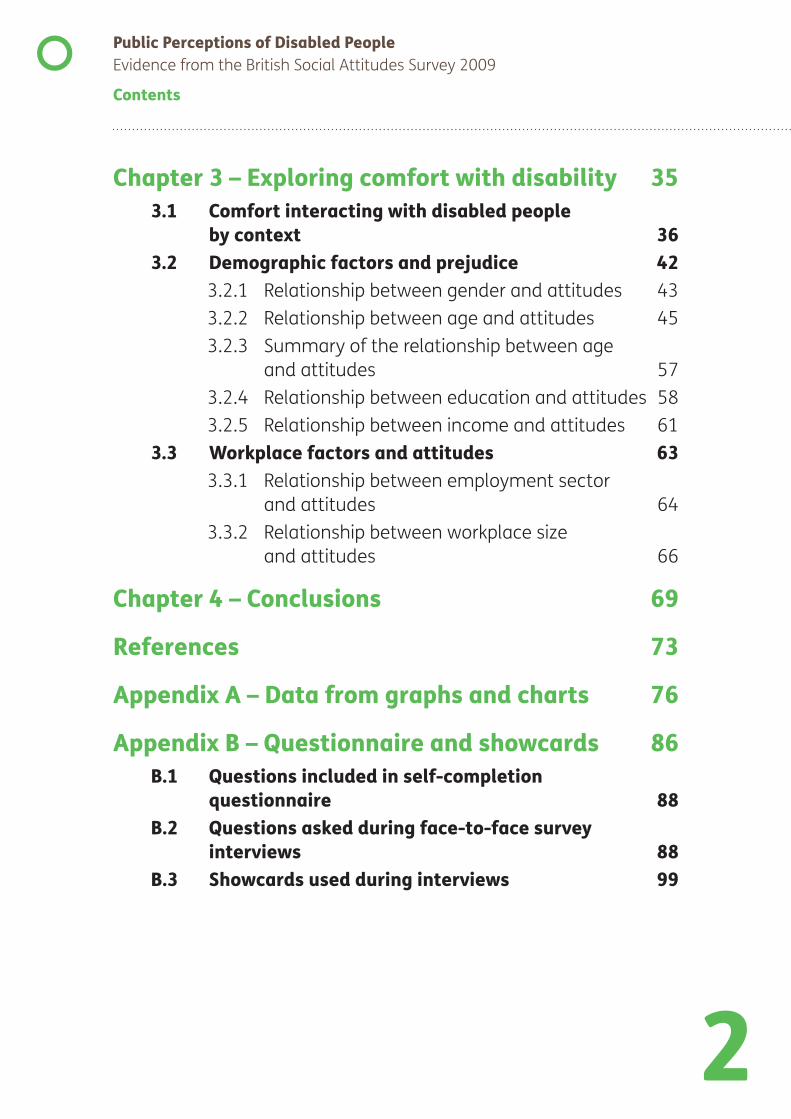
Chapter 3 – Exploring comfort with disability 353.1 Comfort interacting with disabled people
by context 363.2 Demographic factors and prejudice 42
3.2.1 Relationship between gender and attitudes 433.2.2 Relationship between age and attitudes 453.2.3 Summary of the relationship between age
and attitudes 573.2.4 Relationship between education and attitudes 583.2.5 Relationship between income and attitudes 61
3.3 Workplace factors and attitudes 633.3.1 Relationship between employment sector
and attitudes 643.3.2 Relationship between workplace size
and attitudes 66
Chapter 4 – Conclusions 69
References 73
Appendix A – Data from graphs and charts 76
Appendix B – Questionnaire and showcards 86B.1 Questions included in self-completion
questionnaire 88B.2 Questions asked during face-to-face survey
interviews 88B.3 Showcards used during interviews 99
3
List of figures and tables

4
Public Perceptions of Disabled PeopleEvidence from the British Social Attitudes Survey 2009
2: The nature of prejudice against disabled peopleTable 2.1: How much prejudice people feel there is against disabled people, by year Page 23Table 2.2: How much prejudice people feel there is towards disabled people, by disability status and year Page 24Table 2.3: Percentage of people who think of disabled people in the following ways some or most of the time, by year Page 26Table 2.4: Percentage of people who think of disabled people in the following ways some or most of the time, by year Page 27Figure 2.5: Reason why disabled people can’t live as full a life as non-disabled people Page 31Figure 2.6: How comfortable respondents report that most people would feel if someone said negative things about disabled people in different situations Page 34
3: Exploring comfort with disabilityTable 3.1: Percentage of people saying they would be very or fairly comfortable interacting with people with a range of impairments in different situations Page 38Figure 3.2: Percentage of people saying they would feel very comfortable interacting with people with a range of impairments in different situations Page 40Table 3.3: Percentage of people saying they would be very comfortable interacting with people with a range of impairments in different situations, by gender Page 44Figure 3.4: Percentage of people saying they would be very comfortable if a disabled person attended a club, group or team of which they were a member, by age Page 46
Public Perceptions of Disabled PeopleEvidence from the British Social Attitudes Survey 2009
List of Figures and Tables
5
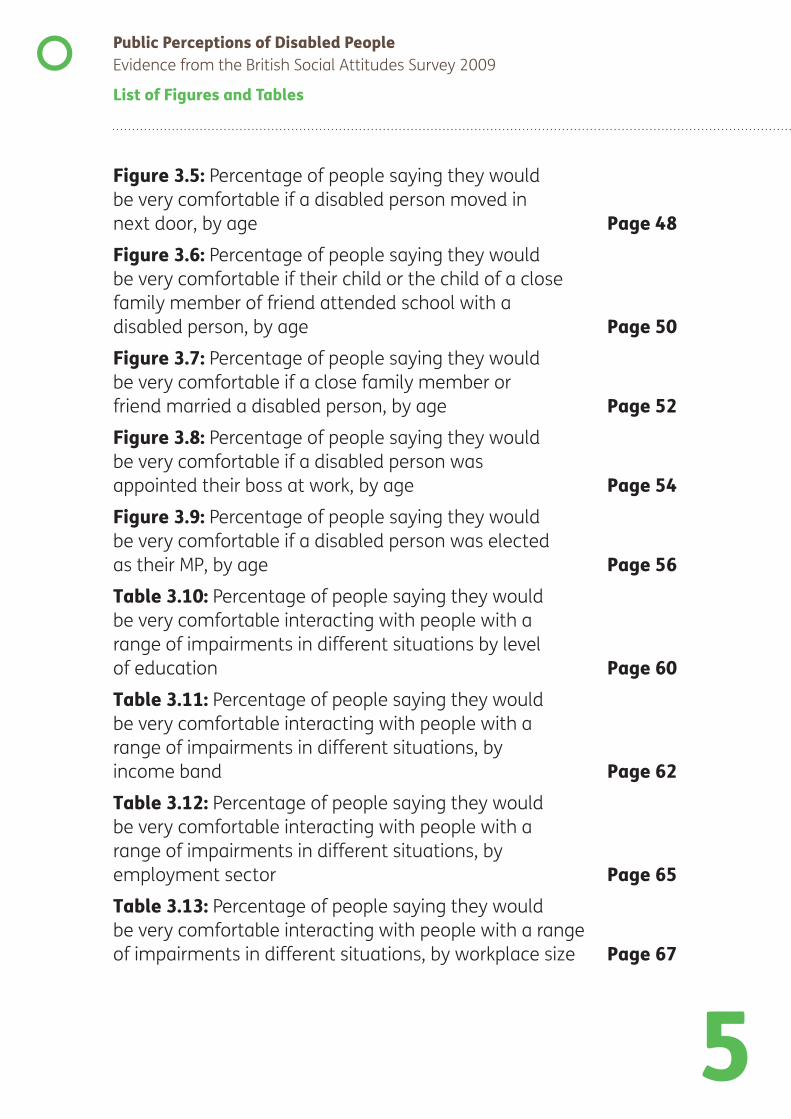
Figure 3.5: Percentage of people saying they would be very comfortable if a disabled person moved in next door, by age Page 48Figure 3.6: Percentage of people saying they would be very comfortable if their child or the child of a close family member of friend attended school with a disabled person, by age Page 50Figure 3.7: Percentage of people saying they would be very comfortable if a close family member or friend married a disabled person, by age Page 52Figure 3.8: Percentage of people saying they would be very comfortable if a disabled person was appointed their boss at work, by age Page 54Figure 3.9: Percentage of people saying they would be very comfortable if a disabled person was elected as their MP, by age Page 56Table 3.10: Percentage of people saying they would be very comfortable interacting with people with a range of impairments in different situations by level of education Page 60Table 3.11: Percentage of people saying they would be very comfortable interacting with people with a range of impairments in different situations, by income band Page 62Table 3.12: Percentage of people saying they would be very comfortable interacting with people with a range of impairments in different situations, by employment sector Page 65Table 3.13: Percentage of people saying they would be very comfortable interacting with people with a range of impairments in different situations, by workplace size Page 67

Public Perceptions of Disabled PeopleEvidence from the British Social Attitudes Survey 2009
List of Figures and Tables
6
Appendix ATable A.1: Reason why disabled people can’t live as full a life as non-disabled people, by disability status Page 77Table A.2: How comfortable respondents report that most people would feel if someone said negative things about disabled people in different situations Page 78Table A.3: Percentage of people saying they would feel very comfortable interacting with people with a range of impairments in different situations Page 79Table A.4: Percentage of people saying they would be very comfortable if a disabled person attended a club, group or team of which they were a member, by age Page 80Table A.5: Percentage of people saying they would be very comfortable if a disabled person moved in next door, by age Page 81Table A.6: Percentage of people saying they would be very comfortable if their child or the child of a close family member of friend attended school with a disabled person, by age Page 82Table A.7: Percentage of people saying they would be very comfortable if a close family member or friend married a disabled person, by age Page 83Table A.8: Percentage of people saying they would be very comfortable if a disabled person was appointed their boss at work, by age Page 84Table A.9: Percentage of people saying they would be very comfortable if a disabled person was elected as their MP, by age Page 85
7
Executive summary
Public Perceptions of Disabled PeopleEvidence from the British Social Attitudes Survey 2009
Executive summary
8
The UK Government is party to the United Nations Convention on the Rights of Persons with Disabilities. This requires us to collect research data in order to formulate and implement policies to combat stereotypes, prejudices and harmful practices relating to disabled people. The planned disability legacy for the London 2012 Olympic and Paralympic games also includes a commitment to improve public perceptions of disabled people.
In line with this the Office for Disability Issues, the cross government unit leading the government’s vision of achieving equality for disabled people, included a module of questions on both the 2005 and 2009 British Social Attitudes Surveys (BSAS)1. The aim of these questions was to measure public attitudes towards disabled people and disability.
Respondents answering questions on BSAS were asked questions along five themes:
• How much prejudice they think there is towards disabled people
• How often they think of disabled people in a range of different ways
• If they think disabled people can live as full a life as non-disabled people and if not, why not
• How comfortable they think most people would be if someone said something negative about disabled people in different situations
• How comfortable they would be in interacting in a range of different situations with disabled people with different impairments
1 http://www.natcen.ac.uk/series/british-social-attitudes

Public Perceptions of Disabled PeopleEvidence from the British Social Attitudes Survey 2009
Executive summary
9
Prejudice towards disabled peopleThe results show that attitudes towards disabled people have improved since 2005, when comparable questions were last included on BSAS. In 2009 a smaller proportion of people said that they thought of disabled people as getting in the way (7 per cent compared with 9 per cent in 2005) or with discomfort and awkwardness (17 per cent compared with 22 per cent in 2005). People were also more likely to think of disabled people as the same as everybody else (85 per cent compared with 77 per cent in 2005).
There is, however, belief that prejudice towards disabled people is widespread. Almost 8 out of 10 respondents felt that there is either a lot or a little prejudice towards disabled people.
Whilst few people reported openly negative views, many respondents expressed views that suggest they see disabled people as less capable than non-disabled people. Respondents were least comfortable with people with learning disabilities or mental health conditions in situations where disabled people were in positions of authority, such as being a Member of Parliament or a boss at work. These scenarios were also amongst those that respondents found least comfortable in respect of people with physical or sensory impairments.
Furthermore, nearly four in ten people thought of disabled people as less productive than non-disabled people and three quarters of people thought of disabled people as needing to be cared for some or most of the time. This suggests that a degree of ‘benevolent prejudice’ exists towards disabled people.
However almost 8 out of 10 people thought that most people would feel very or fairly uncomfortable if someone said something negative about disabled people either in the local shops, with their close friends or at work in front of their boss or colleagues.
Public Perceptions of Disabled PeopleEvidence from the British Social Attitudes Survey 2009
Executive summary
10
Attitudes to the social model of disabilityDisabled people were more likely than non-disabled people to feel that it is a health condition alone that prevents disabled people living a full life (46 per cent compared to 36 per cent respectively), and less likely to think it is a mixture of a health condition and attitudes and barriers in society (38 per cent of disabled people compared with 47 per cent of non-disabled people). This suggests disabled people are less likely to express views in line with the social model view of disability than non-disabled people. However, a majority of both disabled and non-disabled people feel that attitudes and barriers in society play some part in preventing disabled people living a full life.
Comfort interacting with disabled peopleThe level of comfort people reported if interacting with disabled people varied depending on both the impairment type and the scenario in which the interaction would take place.
At least nine out of ten respondents said they would be very or fairly comfortable interacting with people with sensory or physical impairments in all the scenarios asked about.
Prejudice towards people with mental health conditions and learning disabilities was considerably higher and varied more depending on the scenario in which respondents would interact with the disabled person. Eight out of ten respondents said they would be very or fairly comfortable being in a club or team with someone with a mental health condition and nine out of ten with a person with a learning disability. However, less than half would be comfortable with someone with a learning disability or mental health condition being their MP.
Public Perceptions of Disabled PeopleEvidence from the British Social Attitudes Survey 2009
Executive summary
11
Overall the data suggests that people with learning disabilities or mental health conditions are more likely to encounter prejudice from members of the public in their day-to-day life than those with sensory or physical impairments.
Prejudice by demographic characteristicsThere is no clear relationship between age and prejudice. However, in general it was people in the youngest (18 to 24) and oldest (65+) age groups who were least likely to be comfortable in interacting with disabled people.
In general, those respondents with higher levels of education and those with higher incomes had more positive attitudes towards disabled people. However, both these groups were less comfortable than people with lower earnings and lower education with the idea of people with learning disabilities or mental health conditions being their boss at work.
Women and public sector employees had more positive attitudes towards disabled people than men and private sector employees.
Blanket assertions that people have either ‘negative’ or ‘positive’ attitudes to disabled people do not hold up to scrutiny. Respondents’ demographic characteristics interacted with both the situation in which a disabled person would be encountered and the impairment that they have in influencing the attitudes people hold.

12
Chapter 1Introduction

Public Perceptions of Disabled PeopleEvidence from the British Social Attitudes Survey 2009
Chapter 1: Introduction
13
1.1 Attitudes and Disability Equality in Current Policy
On the 8th June 2009 Britain ratified the United Nations Convention on the Rights of Persons with Disabilities. This Convention is an international human rights treaty that makes it clear that disabled people have, and should be able to enjoy, the same human rights as others. The Convention sets an internationally recognised benchmark for the human rights of disabled people against which countries, including the UK, will be measured.
Article 8 of the Convention requires States that are party to the Convention to:
• raise awareness throughout society, including at the family level, regarding persons with disabilities and foster respect for the rights and dignity of disabled people;
• combat stereotypes, prejudices and harmful practices relating to disabled people, including those based on sex and age, in all areas of life; and
• promote awareness of the capabilities and contributions of disabled people (UN, 2009).
Monitoring implementation of this Article therefore requires, amongst other things, collection of data on public attitudes towards disabled people and their human rights.
The Coalition Government is committed to improving attitudes towards disabled people. The current Disability Equality Duty places a specific duty on all public bodies to promote positive attitudes towards disabled people. The Equality Act 2010, which is expected to commence from April 2011, places a duty on public authorities to advance equality of opportunity for disabled people alongside the other characteristics protected by the Act – race, gender, gender reassignment, age, sexual orientation and religion or belief.

Public Perceptions of Disabled PeopleEvidence from the British Social Attitudes Survey 2009
Chapter 1: Introduction
14
The planned disability legacy for the London 2012 Olympic and Paralympic games also includes a commitment to improve perceptions of disabled people. Several high profile campaigns have also been instigated in the field of mental health where stigma and discrimination are recognised as being most prevalent, including the Time to Change campaign led by the charities Mind and Rethink.
1.2 Examining attitudes towards disability through the 2009 British Social Attitudes Survey
As monitoring and understanding public attitudes towards disabled people forms part of the Government’s obligations under the UN Convention, and because the Government is concerned with improving attitudes towards disabled people, the Office for Disability Issues2 sponsored a suite of questions in the 2009 British Social Attitudes Survey (BSAS 2009). The main aims of this research were:
• To measure how much prejudice there is in Great Britain towards disabled people and how this is changing over time.
• To understand in more detail what attitudes (positive and negative) the public hold towards disabled people.
• To understand what demographic factors relate to people’s attitudes towards disabled people.
These aims were informed by the following considerations. Firstly, as some of the questions included in BSAS 2009 have been run in previous versions of the survey it is possible to examine how attitudes have changed over time. The new questions in the 2009 survey can also act as a baseline for future monitoring of attitudes.
2 The Office for Disability Issues (ODI) is the cross government unit within the Department of Work and Pensions, leading the government’s vision of achieving equality for disabled people.
Public Perceptions of Disabled PeopleEvidence from the British Social Attitudes Survey 2009
Chapter 1: Introduction
15
Secondly, measuring prejudice towards disabled people is not a simple task. As this paper demonstrates, attitudes towards disabled people are not straightforward. They are made up of a complex mix of presumptions and stereotypes alongside unconscious norms and social factors. They vary depending upon the impairment the disabled person has and the context. Another aim of this study, therefore, was to investigate in more detail what attitudes the public hold towards disabled people.
Finally, demographic factors are widely recognised as having an impact on people’s attitudes. Women are generally seen as exhibiting less prejudice towards disabled people than men (Disability Rights Commission, 2007). Similarly, the Disability Equality Duty applies only to organisations in the public sector. It could therefore be expected that attitudes towards disabled people may be more positive amongst public than private sector employees. The final aim of this study was, therefore, to identify which demographic groups hold what attitudes.
1.3 Why attitudes matterAttitudes are feelings or predispositions held by people or individuals towards something or someone. Attitudes are seen to play a key role in achieving equality because they may translate into behaviour towards individuals and groups in society which have negative consequences (such as discrimination and hate crime). Attitudes are linked to, but are not the same as, knowledge. It is often presumed that negative attitudes and behaviour come from people not having adequate knowledge. For example, people may avoid people with mental health conditions because they think they are prone to violence even though this is not true.

Public Perceptions of Disabled PeopleEvidence from the British Social Attitudes Survey 2009
Chapter 1: Introduction
16
Public attitudes and perceptions have been regularly reported as barriers to achieving equality. For example, staff attitudes were found to be a key factor affecting disabled people’s experiences of accessing goods and services (DWP, 2002). However, the relationship between people’s attitudes, their knowledge and their behaviour is complex and not well understood and it is often the desire to change behaviour, not attitudes per se, that drives policy makers. For example, whilst new information may lead to changes in attitudes, it is also possible that existing attitudes may cause people to reject or ignore any new information. Similarly, legislation can lead to people with negative attitudes changing their behaviour - and changes in behaviour can lead, in time, to changes in attitudes.
1.4 How to measure attitudesDeveloping an effective measure of public attitudes (and prejudice) towards disabled people is far from simple. Because surveys rely on people self-reporting their own attitudes, responses are likely to be affected by social desirability bias. Social desirability bias occurs when people are questioned on sensitive subjects and do not answer questions truthfully, but instead give the answers they think are publicly acceptable. As prejudice against disabled people is generally seen as unacceptable, it is likely that people may not accurately report negative views towards disabled people and consequently the true level of prejudice will be under-reported.
To reduce the impact of social desirability bias this study adopted two approaches. Firstly, people were asked a set of straightforward questions about how often they think about disabled people in different ways. However, rather than being asked by an interviewer during the main survey these questions were included on an anonymous self-completion questionnaire that was mailed back to the researchers. Because people do not have to admit to negative attitudes to an interviewer this helps increase the likelihood of respondents answering truthfully.

Public Perceptions of Disabled PeopleEvidence from the British Social Attitudes Survey 2009
Chapter 1: Introduction
17
Secondly, a set of questions was included in the main face-to-face survey. However, rather than simply asking people how in general they feel about disabled people, these questions asked ‘how comfortable’ they would feel interacting with disabled people in a range of different situations. By asking about real life situations it was hoped that people would give more careful consideration to their interactions with disabled people and would therefore give more truthful answers. The situations chosen involved disabled people taking part in a broad cross section of activities, chosen to reflect disabled people exercising their rights under the United Nations Convention on the Rights of Persons with Disabilities. Furthermore, the questions did not ask about ‘disabled people’ in general. Instead they asked separately about people with different impairments.
Full details of all questions asked are included in Appendix B of this report.
In analysing the responses to the ‘how comfortable would you feel’ questions, a lack of comfort interacting with disabled people has been taken as a proxy for prejudice. This is because when respondents say they would be uncomfortable interacting with disabled people they are expressing the view that there is something different about disabled people which makes them uncomfortable. By including different situations and impairments, these questions also allow us not simply to say whether there is prejudice towards disabled people, but also to more fully understand the nature of prejudice. This is because we can see whether prejudice is more prevalent towards people with different impairments and also whether there are any patterns in the situations in which people are most and least likely to feel prejudice.
Public Perceptions of Disabled PeopleEvidence from the British Social Attitudes Survey 2009
Chapter 1: Introduction
18
However, it is important to note that these two methods of gathering data have their limitations. Firstly, it is difficult to be certain that similar responses necessarily reflect similar attitudes. When these questions were cognitively tested, for example, one respondent said she would not be very comfortable with a disabled person moving in next door. However, when explaining why this was, the respondent said that they would want to be able to help their neighbour if required but because they were older they would not be able to do so (DWP 2009). Whilst this could be seen to still reflect a form of prejudice, it is not the same as someone who feels uncomfortable because they feel disabled people are inferior. Care needs to be taken, therefore, when interpreting the results of the survey.
Secondly, it is unlikely that social desirability bias will have been completely eradicated and the level of prejudice reported in both the face-to-face and self-completion questionnaires is likely to be lower than actually exists.
1.5 Reporting and Methodology
1.5.1 Outline of the reportIn order to measure how much prejudice there is in Great Britain towards disabled people, and how this is changing over time, the report starts with a comparison of data from BSAS 2009 with earlier waves of the survey where the same questions have been asked. The report then examines how widely accepted the social model of disability is, and the relationship between being disabled and expressing social model views. It also looks at respondents’ responses with regard to how comfortable they say people would feel if someone was to express negative views in a range of public situations. The paper then examines in more detail the nature of public attitudes towards disability.
Public Perceptions of Disabled PeopleEvidence from the British Social Attitudes Survey 2009
Chapter 1: Introduction
19
This includes a discussion of the relationship between different social situations, impairments and how comfortable people report feeling in interacting with disabled people. The final part of the paper reports the relationship between a range of demographic factors and people’s attitudes. This includes age, education, income, employer sector and size, and gender. A range of other demographic variables were examined during the analysis but are not reported in this paper, either because they did not have a clear impact on attitudes, or because sample sizes were too small for reliable analysis.
1.5.2 British Social Attitudes SurveyThe British Social Attitudes Survey (BSAS) is a general household survey run since 1983 by the National Centre of Social Research (NatCen). Every year approximately 3,600 people take part through a face-to-face interview and a self-completion questionnaire to gather information on public attitudes across a broad range of topics.
The 2009 wave of the survey contained a set of questions, funded by the Office for Disability Issues (ODI), aimed at examining public attitudes towards disability and disabled people. To ensure that these questions were easy to understand and accurately measured people’s views they underwent cognitive testing before their inclusion (DWP, 2009).
Two methods were used for collection of this data. Firstly, a set of questions was included in the main face-to-face survey. This included a series of questions asking ‘how comfortable’ respondents would feel interacting with disabled people in a range of different situations. By asking about real life situations it was hoped that people would give more careful consideration to their interactions with disabled people and give more truthful answers than if they were simply asked how they felt about disabled people.
Public Perceptions of Disabled PeopleEvidence from the British Social Attitudes Survey 2009
Chapter 1: Introduction
20
The situations chosen involved disabled people with a range of impairments taking part in a broad cross section of activities, chosen to reflect disabled people exercising their rights under the recently ratified United Nations’ Convention on the Rights of Persons with Disabilities.
Secondly, questions about how often people think about disabled people in a range of different ways were included on an anonymous self-completion questionnaire to increase the likelihood of respondents answering truthfully and reduce the impact of social desirability bias.
1.5.3 Defining disabilityAs a key part of the analysis was examining how attitudes varied between disabled and non-disabled respondents it was necessary to use a consistent definition of disability. Respondents who reported that they had a long-standing physical or mental health condition or disability (lasting for, or likely to last, 12 months) which has a substantial effect on their ability to carry out normal day-to-day activities were classified as disabled. This is based on the definition of disability under the Disability Discrimination Act (DDA) which was still in force at the time of fieldwork.
Section 1(2) of the DDA generally defined someone as disabled if ‘he or she has a physical or mental impairment which has a substantial and long term adverse effect on her or his ability to carry out normal day-to-day activities’. From 1 October 2010, provisions in the Equality Act 2010 (EA) replaced the majority of provisions in the DDA. In general, the definition of disability in the EA is similar to that which applied for the purposes of the DDA. Unlike the DDA, it does not require a disabled person to demonstrate that, where their impairment adversely affects their ability to carry out a normal day-to-day activity, that activity involves one of a specified list of capacities, such as mobility, speech, or the ability to understand.
Public Perceptions of Disabled PeopleEvidence from the British Social Attitudes Survey 2009
Chapter 1: Introduction
21
1.5.4 Sample sizes and significance testingFieldwork for BSAS 2009 ran from June to September 2009. The questionnaire was made up of three versions, each being asked to approximately 1,200 respondents. Some questions were included on all three versions, whilst others were run on just one or two versions. Consequently, base sizes and confidence intervals vary between questions.
Analysis was undertaken on weighted data and weighted figures were used for significance testing. Results highlighted in the text have been significance tested to the 95 per cent level, unless otherwise stated. Statistical significance is a test of whether or not the difference between two results occurred by chance. A significance level of 95 per cent means that there is only a one in twenty chance that differences between two results occurred by chance.
Unweighted base numbers are reported in all tables. Base numbers exclude those who refused to answer the question.
Confidence intervals for the data in this report are not provided, however all stated figures are subject to sampling variability.
22
Chapter 2The nature of prejudice against disabled people
Public Perceptions of Disabled PeopleEvidence from the British Social Attitudes Survey 2009
Chapter 2: The nature of prejudice against disabled people
23
2.1 How prejudiced are people and how have attitudes changed over time?
The general public believe that prejudice towards disabled people is widespread. People were asked:
“Generally speaking, do you think there is a lot of prejudice towards disabled people in general, a little, hardly any or none?”
Table 2.1: How much prejudice people feel there is against disabled people, by year
A lot A little Hardly Any None Don’t
KnowSample Size
2009 26% 53% 15% 5% 1% 2282
2005 25% 50% 17% 8% 1% 3193
2000 35% 51% 9% 3% 2% 3422
1998 25% 51% 15% 6% 2% 3139
Source: National Centre for Social Research
Table 2.1 shows that in 2009 over a quarter of people reported believing that there was a lot of prejudice against disabled people, and overall 79 per cent of people felt there was a lot or a little prejudice. This represents an increase of 4 percentage points since 2005. Interestingly, public perceptions of the level of prejudice towards disabled people have remained relatively stable since the questions were first asked in 1998, excluding figures from 2000 which saw 35 per cent of respondents report the belief that there was a lot of prejudice.
Public Perceptions of Disabled PeopleEvidence from the British Social Attitudes Survey 2009
Chapter 2: The nature of prejudice against disabled people
24
However, public belief that there is prejudice is not the same as the existence of prejudice. Previous analysis of British Social Attitudes data from 2005 showed that respondents who knew a disabled person were more likely to believe there was prejudice towards disabled people, but were less likely to express prejudiced views themselves (Rigg, 2007). It is possible, therefore, that an increased belief in prejudice represents more awareness of disability issues, rather than an increase of prejudice in society. Due to changes in the question module it was not possible to reproduce this analysis.
However, to investigate this issue a comparison of how much prejudice disabled and non-disabled people reported between 2005 and 2009 was undertaken.
Table 2.2: How much prejudice people feel there is towards disabled people, by disability status and year
A lot A little Hardly Any None Don’t
KnowSample Size
Disabled 2009 36% 38% 19% 6% 2% 366
Disabled 2005 33% 42% 16% 8% 1% 586
Non-disabled 2009
24% 56% 14% 5% 1% 1912
Non-disabled 2005
23% 51% 17% 8% 1% 2603
Source: National Centre for Social Research

Public Perceptions of Disabled PeopleEvidence from the British Social Attitudes Survey 2009
Chapter 2: The nature of prejudice against disabled people
25
Table 2.2 shows an increase of six percentage points (from 74 per cent to 80 per cent) between 2005 and 2009 in the proportion of non-disabled people feeling there is a lot or a little prejudice towards disabled people, whilst amongst disabled people there was no significant change (74 per cent in 2009). This suggests that it is increasing awareness of prejudice amongst non-disabled people, rather than increased experience of prejudice amongst disabled people themselves, that has led to this increase.
Whilst public perceptions are that there is considerable prejudice towards disabled people, when people report their own views the level of prejudice reported is far lower. Table 2.3 shows how often people thought of disabled people in the following ways in 2009 and 2005:
• as getting in the way• with discomfort and awkwardness• as the same as everybody elseThese questions were included in the self-completion questionnaire in order to reduce the impact of social desirability bias.
Table 2.3 shows that the proportion of people expressing views which could be considered negative has reduced since 2005. The proportion of people thinking of disabled people as getting in the way decreased from 9 per cent to 7 per cent between 2005 and 2009. Similarly, the proportion of people thinking of disabled people with discomfort and awkwardness has also decreased from 22 per cent to 17 per cent over the same time period.
Public Perceptions of Disabled PeopleEvidence from the British Social Attitudes Survey 2009
Chapter 2: The nature of prejudice against disabled people
26
Table 2.3: Percentage of people who think of disabled people in the following ways some or most of the time, by year
As getting in the way
With discomfort & awkwardness
As the same as everyone else
Sample Size
2009 7% 17% 85% 1894
2005 9% 22% 77% 2608
This table displays answers to multiple questions and base numbers apply to each question.
Source: National Centre for Social Research
At the same time the proportion expressing positive views, and thinking of disabled people as the same as everybody else, has increased from 77 per cent in 2005 to 85 per cent in 2009. This further supports the view that in general attitudes towards disabled people are improving and that the increase in the public’s belief in prejudice is not a simple reflection of growing levels of prejudice.
2.2 Views of capability and productivityTable 2.4 shows the results of two questions that were included in the self-completion section of the questionnaire asking respondents how often they thought of disabled people in general as:
• Not as productive as non-disabled people (asked for the first time in 2009)
• As needing to be cared for
Public Perceptions of Disabled PeopleEvidence from the British Social Attitudes Survey 2009
Chapter 2: The nature of prejudice against disabled people
27
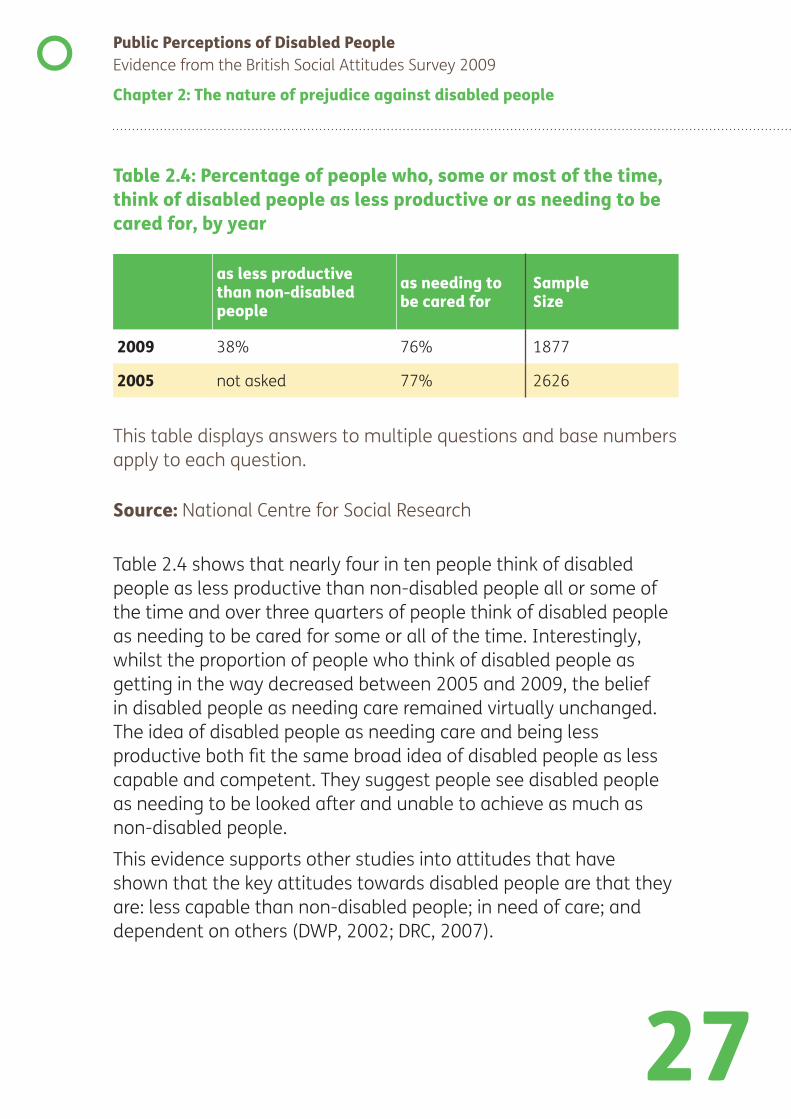
Table 2.4: Percentage of people who, some or most of the time, think of disabled people as less productive or as needing to be cared for, by year
as less productive than non-disabled people
as needing to be cared for
Sample Size
2009 38% 76% 1877
2005 not asked 77% 2626
This table displays answers to multiple questions and base numbers apply to each question.
Source: National Centre for Social Research
Table 2.4 shows that nearly four in ten people think of disabled people as less productive than non-disabled people all or some of the time and over three quarters of people think of disabled people as needing to be cared for some or all of the time. Interestingly, whilst the proportion of people who think of disabled people as getting in the way decreased between 2005 and 2009, the belief in disabled people as needing care remained virtually unchanged. The idea of disabled people as needing care and being less productive both fit the same broad idea of disabled people as less capable and competent. They suggest people see disabled people as needing to be looked after and unable to achieve as much as non-disabled people.
This evidence supports other studies into attitudes that have shown that the key attitudes towards disabled people are that they are: less capable than non-disabled people; in need of care; and dependent on others (DWP, 2002; DRC, 2007).
Public Perceptions of Disabled PeopleEvidence from the British Social Attitudes Survey 2009
Chapter 2: The nature of prejudice against disabled people
28
Similarly, a survey comparing attitudes towards people with a range of protected characteristics (age, gender, ethnicity, sexuality, disability, religion or belief) found that:
• disabled people were considered the least economically successful of all the groups and only people over 70 were felt to be less capable
• disabled people were seen to attract feelings of ‘pity’ and ‘admiration’
• 35 per cent of people felt disabled people took more from the economy than they put in (Abrams & Houston, 2006).
Such beliefs are often referred to as benevolent prejudice because they are based on the belief that people need looking after rather than overt hostility. However, such benevolent prejudice can be just as consequential as more hostile prejudice. Benevolent prejudice makes it likely disabled people will be treated less favourably with regards to opportunity for advancement because they are seen as less capable. Similarly, such groups may also be excluded from making decisions about their own lives such as healthcare decisions (Kent, 2006). It has also been suggested that perceptions of disabled people’s vulnerability can play a role in them being targeted in crimes (EHRC, 2009).
Public Perceptions of Disabled PeopleEvidence from the British Social Attitudes Survey 2009
Chapter 2: The nature of prejudice against disabled people
29
2.3 Attitudes towards the social model of disability
A key development in the way in which people have thought about disability since the 1980s is the emergence of the social model of disability. When considering disabled people, and the disadvantage they experience, many people focus primarily upon their impairment, seeing a person’s medical condition as the main barrier they experience in their day-to-day lives. However, in contrast to this ‘medical model’, the social model argues that the main barriers disabled people face come from the way in which society is organised, not their impairment. A wheelchair user who wants to use a bus, for example, is not disadvantaged because they have a physical impairment, but because the bus is not designed to accommodate wheelchairs.
In response to disability campaigners, the social model has achieved increasing influence in Government and lies behind a range of different initiatives. Independent living approaches to disability, for example, often focus on how to provide the necessary support and adaptations to overcome the barriers that disabled people face in exercising the same choice and control over their lives as non-disabled people. Further, the Right to Control is a new legal right for disabled people aimed at giving disabled people more choice and control over the support they need to go about their daily lives.
To measure how widely accepted the social model is amongst the public, the survey asked respondents how much of the time disabled people could live as full a life as non-disabled people. Those who said disabled people could not lead as full a life as non-disabled people were asked why they thought this was.
Public Perceptions of Disabled PeopleEvidence from the British Social Attitudes Survey 2009
Chapter 2: The nature of prejudice against disabled people
30
The available responses were:
• Because of their health problem/disability• Because of attitudes, barriers and behaviours in society• Because of their health problem/disability and because of
attitudes, barriers and behaviours in societyIn general, the first response could be seen to equate to the medical model, the second response the social model approach and the final response a mix of the two. The overall results of this question are shown in Figure 2.5. Responses are separated by whether the respondents reported being disabled or not. Figure 2.5 shows that overall the pure social model view of disability is only accepted by less than one sixth of all respondents, whilst the pure medical model is accepted by over one third. The most commonly held view, however, is that it is a mixture of societal barriers and an individual’s medical condition that disadvantages disabled people (46 per cent of respondents). Overall, most people felt that societal barriers played some part (63 per cent of respondents).
When analysed by disability, a similar proportion of disabled (15 per cent) and non-disabled people (17 per cent) see social barriers alone as the cause of disabled people’s inability to lead a full life. However, the proportion of disabled people who see a health condition alone as the cause is ten percentage points higher than for non-disabled people (46 per cent compared with 36 per cent respectively) and the most commonly cited reason by disabled people. The most commonly cited reason by non-disabled respondents was both health problems and attitudes and barriers in society (47 per cent compared to 38 per cent of disabled respondents). Overall, 53 per cent of disabled respondents and 63 per cent of non-disabled respondents felt societal barriers played some part.


Public Perceptions of Disabled PeopleEvidence from the British Social Attitudes Survey 2009
Chapter 2: The nature of prejudice against disabled people
32
This suggests that impairments play an important role in disabled people’s lives. This question had not previously been included on BSAS so direct comparison with earlier data is not possible. However, evidence from the 2007 Experiences and Expectations of Disabled People Survey (EEDP) showed that of those disabled respondents who said they were not able to lead a full life, 87 per cent said it was because of their disability, only two per said that it was due to attitudes and barriers in society and 8 per cent said it was due to both (ODI, 2008).
As disabled respondents on BSAS 2009 were more likely to view attitudes and barriers in society alone as preventing them from living a full life than those on EEDP in 2007, this may suggest that the proportion of disabled people taking the social model view is increasing. However, the EEDP question was about disabled people’s views only of their own lives, whereas the BSAS question asked for a response on the lives of disabled people in general. Therefore the results are not directly comparable and inclusion of the BSAS question in future editions of the survey would be required to establish if social model views are actually increasing amongst disabled people.
Interim results from the 2009/10 Life Opportunities Survey3 show that reasons related to “health condition, disability or impairment” were regarded as a barrier to participation in services and activities such as education, employment and sport and leisure by disabled respondents. However, other barriers to participation more in line with the social model were also given, such as lack of finances, lack of accessible information and the attitudes of other people (ONS, 2010).
3 The Life Opportunities Survey (LOS), commissioned by the Office for Disability Issues, is a major new national longitudinal survey of disability in Britain. Further analysis of LOS data will allow us to explore the full extent of barriers to participation for disabled people.
Public Perceptions of Disabled PeopleEvidence from the British Social Attitudes Survey 2009
Chapter 2: The nature of prejudice against disabled people
33
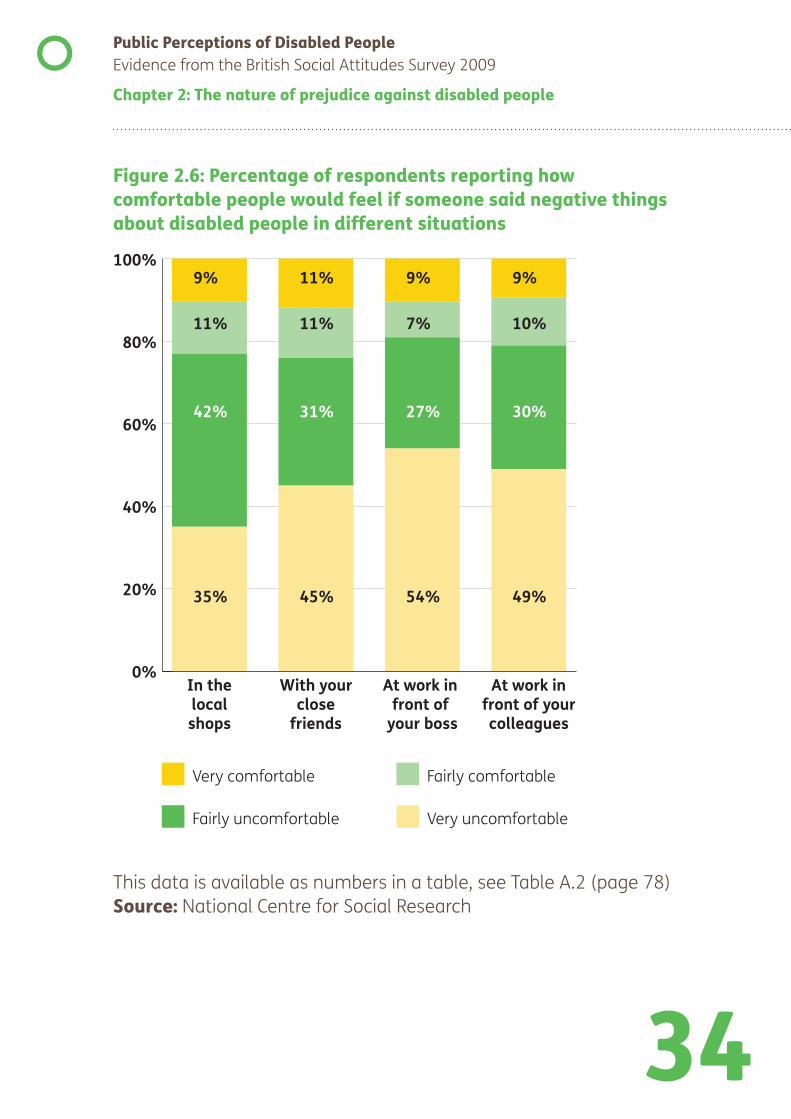
2.4 Comfort with expressing prejudiceAs outlined in the introduction, whilst many people argue for the need to change negative attitudes, often it is behaviour change that is the ultimate goal. Therefore, alongside asking people what attitudes they hold towards disabled people, the question module also sought to uncover how publicly acceptable people feel it is to express negative views towards disabled people. The following question was asked:
“Sometimes people refer to disabled people in a negative way. This could include making jokes or using offensive language. What do you think most people would feel if somebody referred to disabled people in this way…
• at your local shops • with your close friends • at work – in front of your boss• at work – in front of your colleagues”This question allows us to examine the situations in which people believe expressing negative attitudes are likely to be least and most acceptable. It also indicates where people feel they are most likely to be exposed to negative attitudes and, perhaps, where they are most likely to be passed on. The results from this question are outlined in Figure 2.6.
The proportion of respondents who feel that most people would be very or fairly comfortable with negative references to disabled people fluctuates from 16 per cent in front of a boss to 22 per cent when with close friends. However, the majority (three-quarters or more) feel that expressing negative views about disabled people is seen as unacceptable in all the situations given. It is also worth noting that levels of comfort are lowest, and discomfort highest, in work based situations, whilst the highest levels of comfort are reported in relation to expressing negative views amongst friends.

35
Chapter 3Exploring comfort with disability
Public Perceptions of Disabled PeopleEvidence from the British Social Attitudes Survey 2009
Chapter 3: Exploring comfort with disability
36
3.1 Comfort interacting with disabled people by context
Whilst the overall level of prejudice towards disabled people is relatively low, and the number of people expressing negative views since 2005 appears to have fallen, this does not catch the full complexity of public attitudes. Attitudes can vary towards people with different impairments. They can also vary depending upon the context in which people interact with disabled people. For example, someone may be happy to live next door to a wheelchair user, but they could be far less comfortable if their son was to marry someone with a mental health condition.
In order to investigate the way in which attitudes varied by impairment and in different scenarios, the survey asked people how comfortable they would feel if they were to interact with people with different impairments in a range of different situations. These scenarios were chosen because they involve disabled people undertaking activities which reflect some of the human rights identified in the United Nations Convention on the Rights of Persons with Disabilities. The different scenarios and the respective UN Convention article are listed in below.
How comfortable would respondent feel if someone with an impairment:
• attended a quiz team, community group or swimming club of which they were a member (Article 30: Participation in cultural life, recreation, leisure and sport)
• were to move in next door (Article 19: Living independently and being included in the community)
• was in a class at school with their son or daughter or the son or daughter of a close family member or friend (assuming the necessary assistance was in place) (Article 24: Education)
Public Perceptions of Disabled PeopleEvidence from the British Social Attitudes Survey 2009
Chapter 3: Exploring comfort with disability
37
• married a close family member or friend (Article 23: Respect for home and the family)
• was appointed as their boss (Article 27: Employment)• was their local MP (Article 29: Participation in political and
public life)The impairments asked about were:
• a person with a physical disability such as difficulty using their arms or somebody who uses a wheelchair;
• a person with a sensory impairment such as being partially or fully blind or partially or fully deaf;
• a person with a mental health condition such as depression or a personality disorder (this was changed to ‘depression or Attention Deficit Hyperactivity Disorder’ for the school scenario);
• a person with a learning disability such as Down’s syndrome or autism.
Each impairment was asked in combination with each scenario. People could respond that they would be very comfortable, fairly comfortable, fairly uncomfortable or very uncomfortable.

Public Perceptions of Disabled PeopleEvidence from the British Social Attitudes Survey 2009
Chapter 3: Exploring comfort with disability
38
y w
ould
be
very
or f
airl
y yi
ng th
eta
ge o
f peo
ple
satin
g w
ith p
eopl
e w
ith a
rang
e of
impa
irmen
ts in
te
rac
erce
nta
ble
int s
ituat
ions
Tabl
e 3.
1: P
orco
mf
diff
eren
Ph
ysic
al
Disa
bilit
ySe
nsor
y Im
pairm
ent
Lear
ning
Di
sabi
lity
Men
tal H
ealt
h Co
nditi
onSa
mpl
e Si
ze
Club
or
team
97%
96%
88%
79%
2282
Mov
e in
ne
xt d
oor
98%
98%
90%
67%
1128
In c
lass
at
scho
ol97
%96
%82
%65
%11
28
Mar
ry91
%92
%66
%54
%22
82
Boss
92%
89%
52%
44%
2282
MP
95%
92%
39%
39%
1128
ers
to m
ultip
le q
uest
ions
and
bas
e nu
mbe
rs a
pply
to
ches
ear
t typ
e.s
answ
yer
s fo
r eac
h im
pairm
en
e fo
r Soc
ial R
tr N
atio
nal C
en
able
dis
pla
This
tan
sw
Sour
ce:

Public Perceptions of Disabled PeopleEvidence from the British Social Attitudes Survey 2009
Chapter 3: Exploring comfort with disability
39
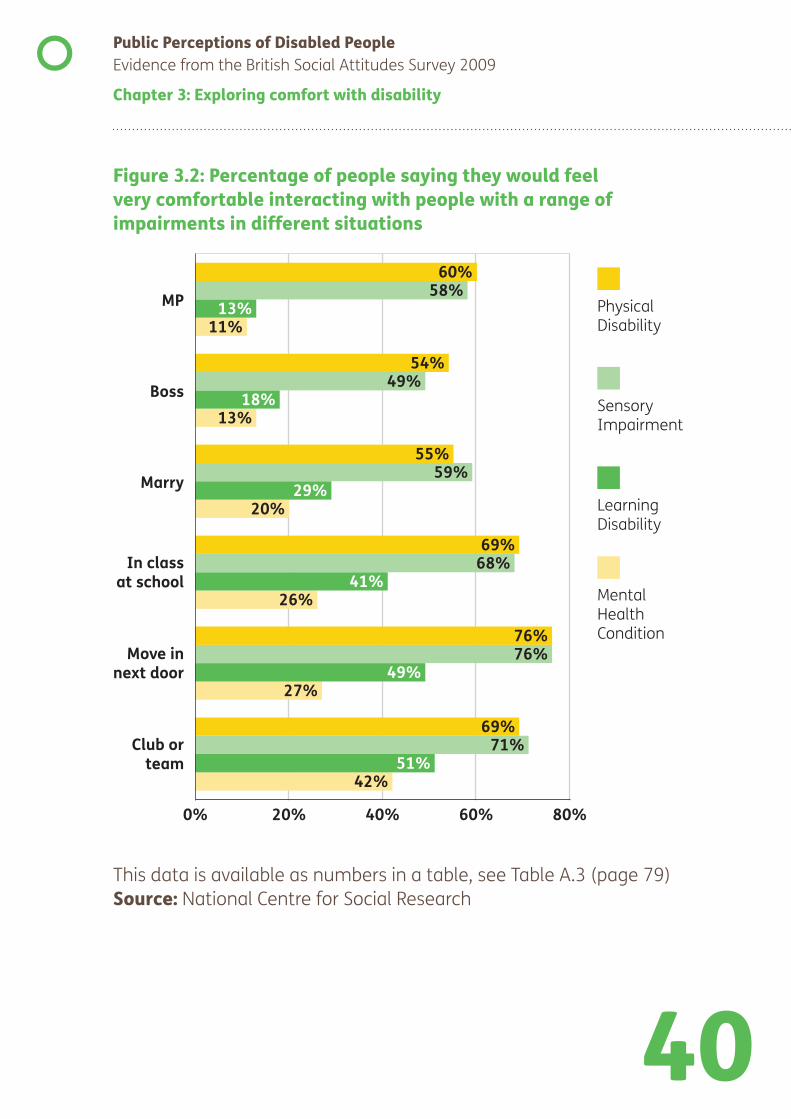
Table 3.1 shows the proportion of people saying they would be very or fairly comfortable by impairment and scenario. The proportion of people who report being very or fairly comfortable with people with physical or sensory impairments is at least 89 per cent. However, levels of comfort interacting with people with learning disabilities were lower and lower still for mental health conditions in most scenarios. Only 39 per cent of people said that they would be very or fairly comfortable having an MP with a learning disability or mental health condition – the lowest of any impairment and scenario combination.
Figure 3.2 shows the proportion of people who say they would be very comfortable by impairment and scenario. There is more variation when considering just the proportion of people who are very comfortable, ranging from 76 per cent for someone with a physical or sensory impairment moving in next door, to 11 per cent for an MP with a mental health condition.
Public Perceptions of Disabled PeopleEvidence from the British Social Attitudes Survey 2009
Chapter 3: Exploring comfort with disability
41
More people are very comfortable with people with sensory or physical impairments than with people with learning disabilities or mental health conditions in each of the scenarios. Overall, the data suggests that people with learning disabilities or mental health conditions are more likely to encounter prejudice from members of the public in their day-to-day life than those with sensory or physical impairments.
However, whilst attitudes vary by impairment it is also important to note that people’s attitudes also vary depending upon the specific scenario that they are asked to consider. The general pattern of this variation is relatively consistent for all the impairment types. People are most comfortable being in a club or team with a disabled person, if they move in next door, or if they are in a class with a child. In contrast they are less comfortable with the idea of someone close to them marrying a disabled person and the idea of a disabled person as a boss or MP.
It has been suggested in past work on attitudes that it is how personal the contact is that plays a key role in the level of prejudice – people are most comfortable in situations, such as the moving next door scenario, where the disabled person remains relatively distant, and least comfortable in scenarios that are more personal, such as a disabled person marrying a friend or family member (Rigg, 2007). However, the evidence from BSAS 2009 shows a slightly different picture. Whilst in one situation in which the respondent would have limited contact with the disabled person (move in next door) prejudice is low, it is also low in the club/team scenario, where there is likely to be a fair amount of personal contact. Furthermore, the situation in which people are least comfortable is having a disabled person as an MP. This is also the least personal of all the situations as very few people have regular, if any, contact with their MP.
Public Perceptions of Disabled PeopleEvidence from the British Social Attitudes Survey 2009
Chapter 3: Exploring comfort with disability
42
The high levels of reported comfort in the club scenario could be explained by the fact that whilst the situation involves personal contact, that contact is voluntary. In the marriage scenario the respondent cannot fully control the interaction, whilst in a club or team the respondent could simply not attend if they did not want to.
The lower levels of comfort for the MP and boss scenarios may also reflect a lack of control. In addition, these scenarios both involve disabled people in positions of authority, though opposite in terms of contact.
3.2 Demographic factors and prejudiceThe final aim of the question module was to identify the relationship between different demographic factors and the views that people hold. This allows us to see whether particular groups of people are more likely to express prejudice. Such differences can be meaningful in a range of different ways. Firstly, identifying groups with high levels of prejudice could help inform where any attitude change programmes should focus. For example, if private sector employees have more negative attitudes than public sector employees then work with private sector employer organisations may be appropriate. Secondly, some demographic variables will naturally change over time. Educational levels have been rising over time and therefore, if level of education is related to more positive attitudes, it could be expected that attitudes will improve naturally as the level of education in the population rises.

Public Perceptions of Disabled PeopleEvidence from the British Social Attitudes Survey 2009
Chapter 3: Exploring comfort with disability
43
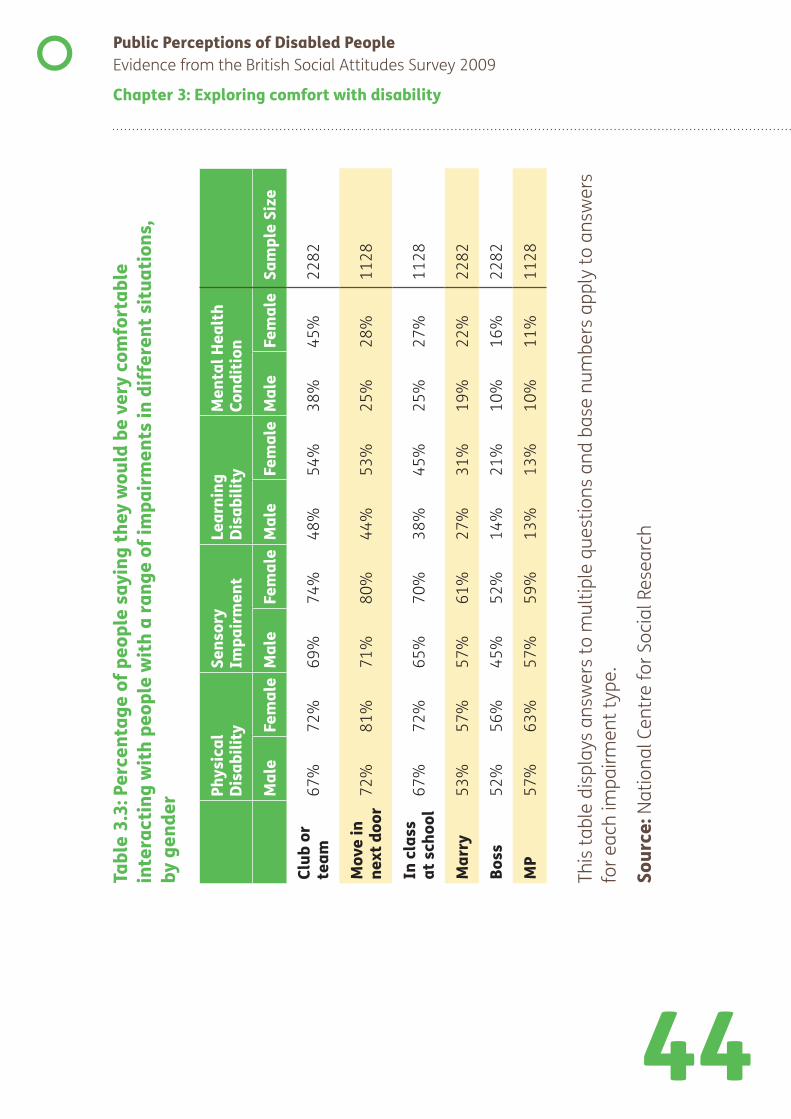
3.2.1 Relationship between gender and attitudesTable 3.3 looks at the relationship between the respondent’s gender and their comfort with disability. The findings were in line with a range of other studies that have shown that women are more likely than men to express positive attitudes towards disabled people. For almost all scenarios and impairments women are more likely to say they are very comfortable than men and in no scenarios or impairments are they less likely to be very comfortable. However, the overall pattern of comfort by impairment and scenario is similar for both women and men.
For example, over 8 out of 10 women say they are very comfortable with someone with a physical or sensory impairment moving in next door, compared to just over 7 out of 10 men. These proportions fall to 53 per cent of women and 44 per cent of men for a neighbour with a learning disability and to 28 per cent of women and 25 per cent of men for a neighbour with a mental health condition.
Just over half of women say they are very comfortable with someone with a physical disability or sensory impairment as their boss (56 per cent and 52 per cent respectively) compared with 52 per cent and 45 per cent of men. These proportions fall to 21 per cent of women and 14 per cent of men for a boss with a learning disability and 16 per cent of women and 10 per cent of men for a boss with a mental health condition.
Public Perceptions of Disabled PeopleEvidence from the British Social Attitudes Survey 2009
Chapter 3: Exploring comfort with disability
44
ta
ble
y w
ould
be
very
com
for t s
ituat
ions
, ts
in d
iffer
enyi
ng th
eta
ge o
f peo
ple
saer
cen
Tabl
e 3.
3: P
ting
with
peo
ple
with
a ra
nge
of im
pairm
ente
rac
in by g
ende
r Phys
ical
Di
sabi
lity
Sens
ory
Impa
irmen
tLe
arni
ng
Disa
bilit
yM
enta
l Hea
lth
Cond
ition
M
ale
Fem
ale
Mal
eFe
mal
eM
ale
Fem
ale
Mal
eFe
mal
eSa
mpl
e Si
ze
Club
or
team
67%
72%
69%
74%
48%
54%
38%
45%
2282
Mov
e in
ne
xt d
oor
72%
81%
71%
80%
44%
53%
25%
28%
1128
In c
lass
at
sch
ool
67%
72%
65%
70%
38%
45%
25%
27%
1128
Mar
ry53
%57
%57
%61
%27
%31
%19
%22
%22
82
Boss
52%
56%
45%
52%
14%
21%
10%
16%
2282
MP
57%
63%
57%
59%
13%
13%
10%
11%
1128
ers
to m
ultip
le q
uest
ions
and
bas
e nu
mbe
rs a
pply
to a
nsw
ers
ches
ear
or S
ocia
l R
t typ
e.s
answ e
ftr
for e
ach
impa
irmen
Nat
iona
l Cen
yab
le d
ispl
aTh
is t
Sour
ce:
Public Perceptions of Disabled PeopleEvidence from the British Social Attitudes Survey 2009
Chapter 3: Exploring comfort with disability
45
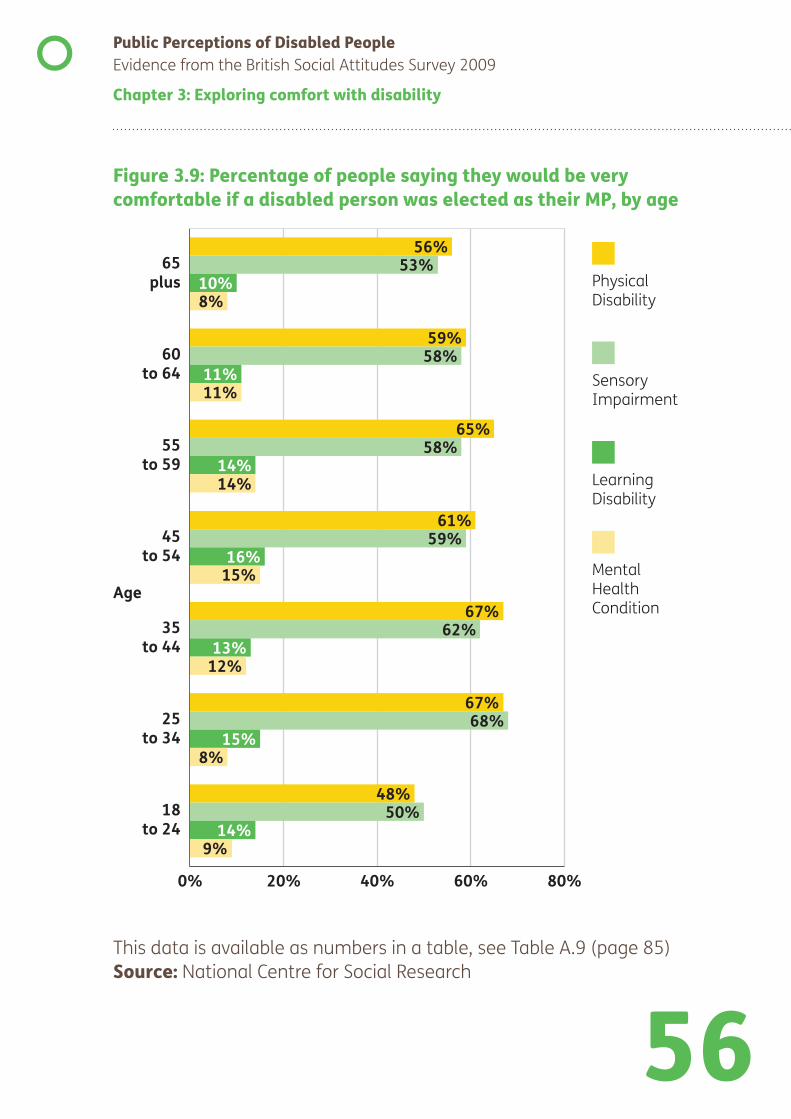
3.2.2 Relationship between age and attitudesThe relationship between age and attitudes was also explored. Figures 3.4 to 3.9 display the relationship between age and comfort with a disabled person in each of the six scenarios outlined in Section 3.1.

Public Perceptions of Disabled PeopleEvidence from the British Social Attitudes Survey 2009
Chapter 3: Exploring comfort with disability
47
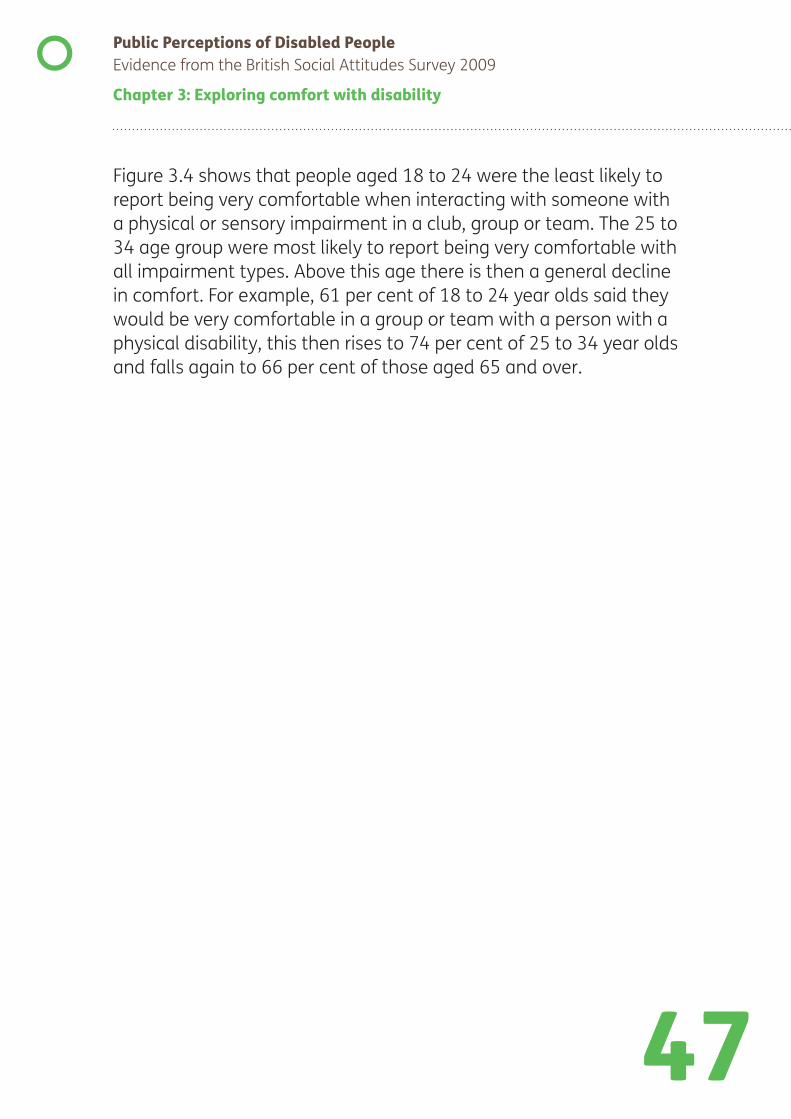
Figure 3.4 shows that people aged 18 to 24 were the least likely to report being very comfortable when interacting with someone with a physical or sensory impairment in a club, group or team. The 25 to 34 age group were most likely to report being very comfortable with all impairment types. Above this age there is then a general decline in comfort. For example, 61 per cent of 18 to 24 year olds said they would be very comfortable in a group or team with a person with a physical disability, this then rises to 74 per cent of 25 to 34 year olds and falls again to 66 per cent of those aged 65 and over.
Public Perceptions of Disabled PeopleEvidence from the British Social Attitudes Survey 2009
Chapter 3: Exploring comfort with disability
49
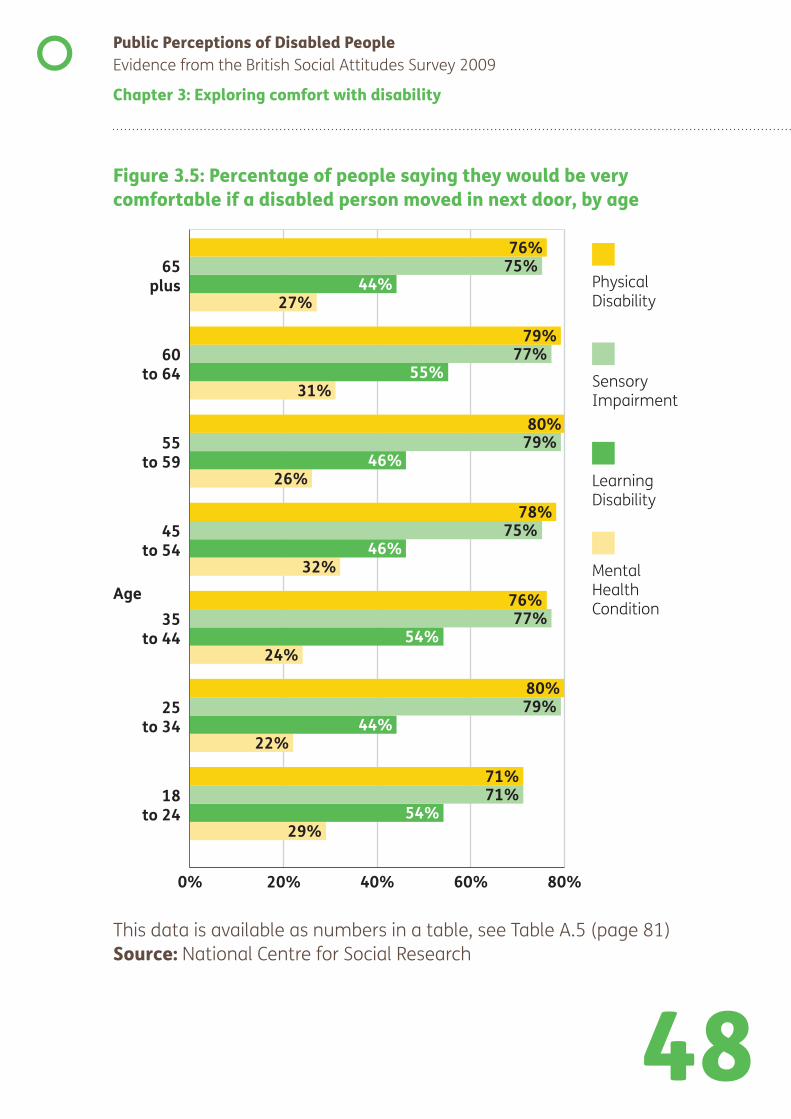
In the scenario of a disabled person moving in next door, as shown in Figure 3.5, there is no clear relationship between age and comfort for any of the impairment types. Over 7 out of 10 of all age groups said they would be very comfortable if a person with a physical or sensory impairment was their neighbour. However, only 22 per cent of 25 to 34 year olds were very comfortable with a person with a mental health condition moving in next door, and this level of comfort remained low across all age groups.

Public Perceptions of Disabled PeopleEvidence from the British Social Attitudes Survey 2009
Chapter 3: Exploring comfort with disability
51
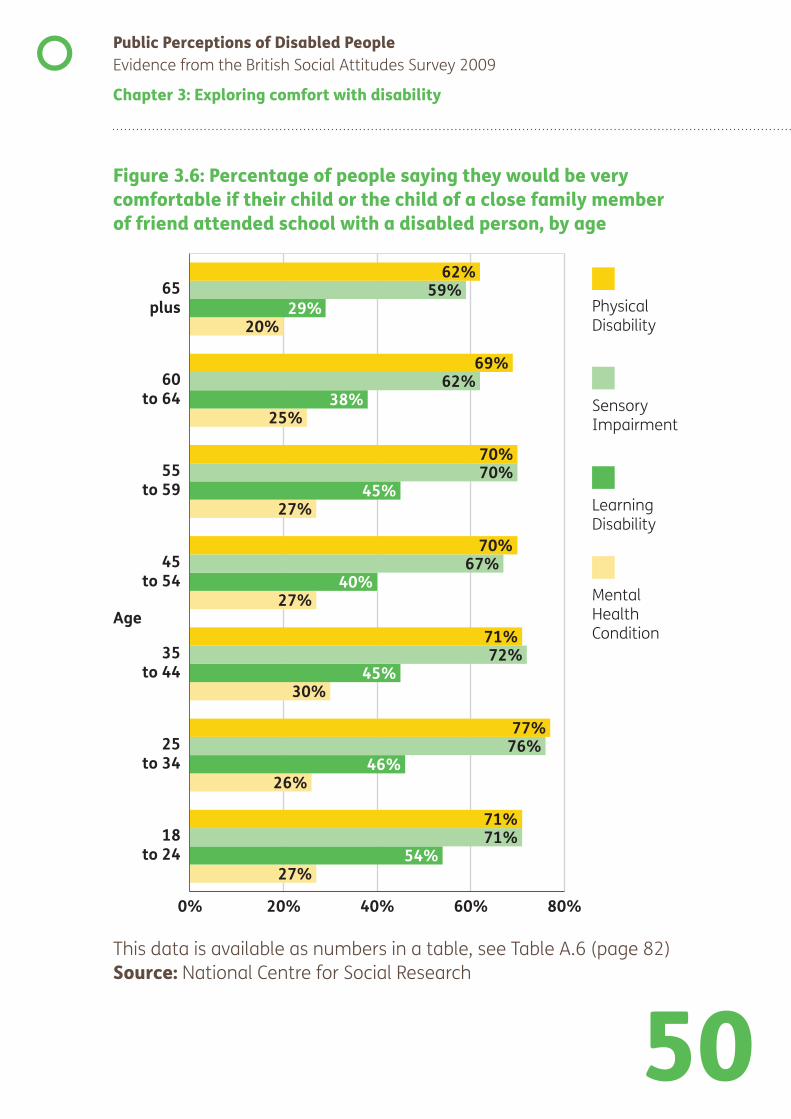
Figure 3.6 shows the relationship between age and comfort with having a child attend school with a disabled person by different impairment types. It shows that, in general, the older a respondent, the less likely they are to say they would be very comfortable. 77 per cent of 25 to 34 year olds said they would be very comfortable if their child, or the child of a close family member or friend attended school with a person with a physical disability compared to 62 per cent of those over 65. Levels of comfort with people with learning disabilities also decreased with age. For example, 54 per cent of those aged 18 to 24 were very comfortable with a child attending school with someone with a learning disability, compared to 29 per cent of those aged 65 or over.
Respondents of all ages were least likely to say they would be very comfortable having a child attend school with a person with a mental health condition, with those aged 65 and over having the lowest level at 20 per cent.
Public Perceptions of Disabled PeopleEvidence from the British Social Attitudes Survey 2009
Chapter 3: Exploring comfort with disability
53
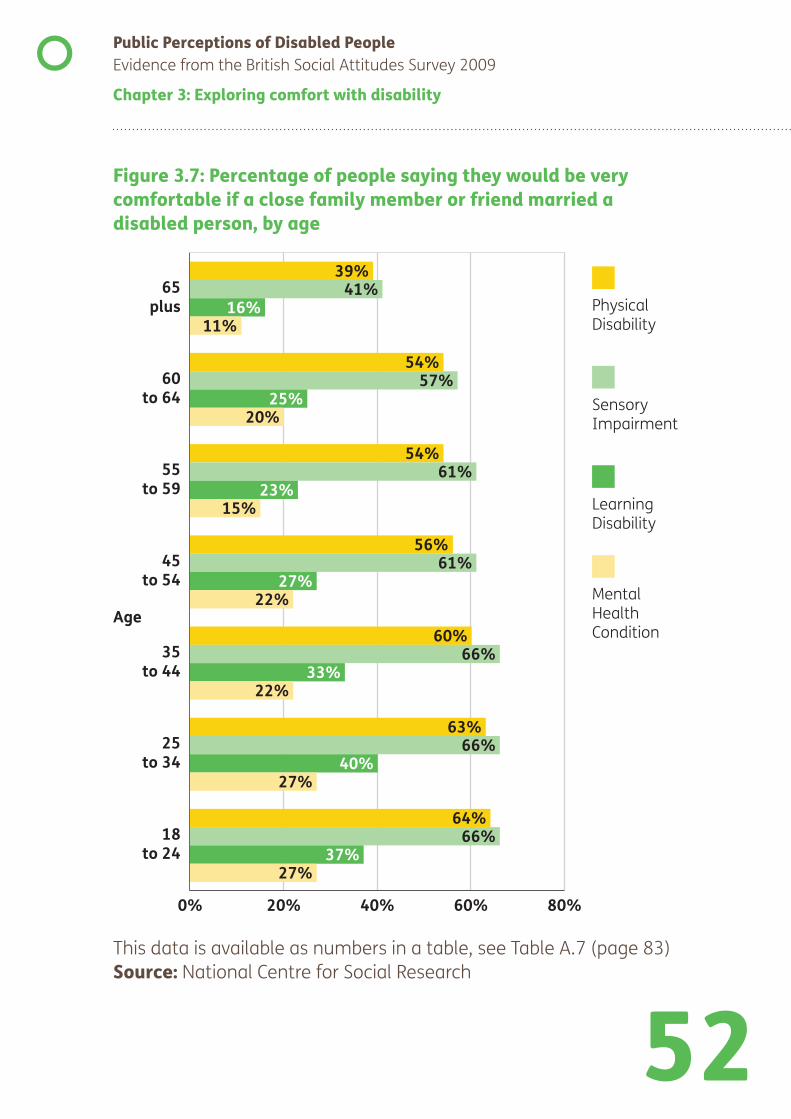
Figure 3.7 shows the proportion of people saying they would be very comfortable if a close family member or friend married a disabled person. It shows that, in general, the older a respondent the less likely they are to say they would be very comfortable. 66 per cent of 18 to 24 year olds said they would be very comfortable if a close family member or friend married a person with a sensory impairment, compared to 41 per cent of those over 65.
The proportion of people saying they would be very comfortable having a person with a mental health condition marry a close friend or relative was low across the board. Only 11 per cent of those aged 65 and over said they would be very comfortable with this scenario – the lowest of all age groups.

Public Perceptions of Disabled PeopleEvidence from the British Social Attitudes Survey 2009
Chapter 3: Exploring comfort with disability
55
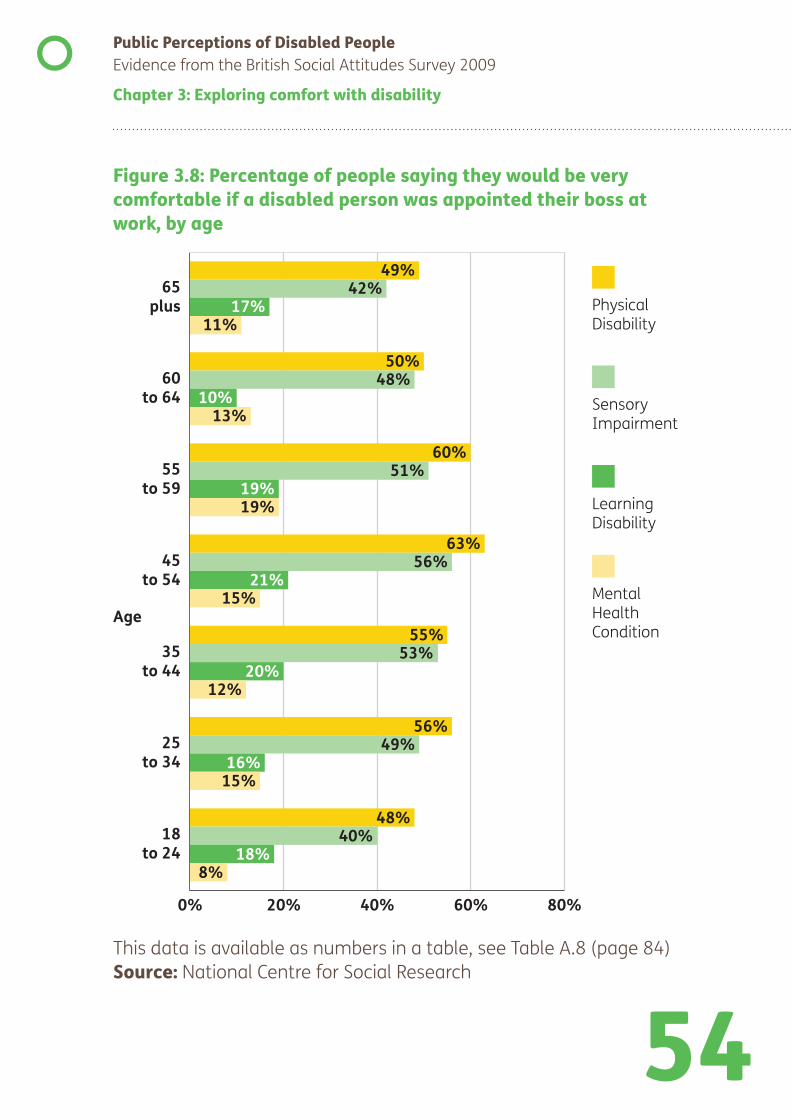
In the scenario of a disabled person being appointed the respondent’s boss, shown in Figure 3.8, there is a clear pattern with regard to people with physical or sensory impairments, where it is the youngest age group that reports the lowest level of comfort. For example, 40 per cent of 18 to 24 year olds said they would be very comfortable with a person with a sensory impairment as their boss compared to 56 per cent of those aged 45 to 54, and 48 per cent of those aged 60 to 64.
A similar, though less pronounced pattern is observable with regard to mental health conditions, though the proportion of people saying they would be very comfortable having a person with a mental health condition as their boss was low across all age groups. 8 per cent of 18 to 24 year olds, 15 per cent of 45 to 54 year olds and 11 per cent of those aged 65 and over said they would be very comfortable with a person with a mental health condition as their boss.
Unlike the other impairment groups there appears to be no clear relationship between age and comfort with a boss with a learning disability. The lowest figure was the 10 per cent of 60 to 64 year olds saying they would be very comfortable with a person with a learning disability being appointed their boss.
Public Perceptions of Disabled PeopleEvidence from the British Social Attitudes Survey 2009
Chapter 3: Exploring comfort with disability
57
Finally, Figure 3.9 shows the relationship between age and being very comfortable if a disabled person was elected as the respondent’s MP. This relationship again varies depending on impairment type. For physical and sensory impairments respondents aged 18 to 24 were the least likely to report being very comfortable – 48 per cent were very comfortable with a person with a physical impairment and 50 per cent with a person with a sensory impairment as their MP. The 25 to 34 age group were the most likely to report being very comfortable – 67 per cent were very comfortable with a person with physical impairment and 68 per cent with a person with a sensory impairment. The level of reported comfort then broadly declined with age.
The proportion of people saying they would be very comfortable having a person with a learning disability as their MP was low across the board with no statistically significant differences between any of the age groups. Similarly, respondents were least likely to be very comfortable in respect of mental health conditions across all age groups, with the only statistically significant difference being that people aged 45 to 54 were more likely to report being very comfortable – 15 per cent – compared to 9 per cent of 18 and 24 year olds and 8 per cent of those aged 65 and over.
3.2.3 Summary of the relationship between age and attitudesThe above discussion reveals that the impact of age on attitudes towards disabled people is not consistent across scenarios and impairments. For example, the youngest age group are the most comfortable in the schooling and marriage scenarios, whilst for the boss scenario they are least comfortable. The youngest age group is also least comfortable interacting with people with physical or sensory impairments in all scenarios except marriage and school. The oldest age group is least comfortable, in most scenarios, interacting with people with learning disabilities or mental health conditions.
Public Perceptions of Disabled PeopleEvidence from the British Social Attitudes Survey 2009
Chapter 3: Exploring comfort with disability
58
Without further research it is difficult to fully understand why the relationship between age and attitudes varies depending on scenario and impairment. However, what is clear is that blanket assertions that people have either ‘negative’ or ‘positive’ attitudes to disabled people do not hold up to scrutiny. Respondents’ demographic characteristics (in this case age) interact with both the situation in which a disabled person is encountered, and the impairment that they have, in influencing the attitudes people hold.
3.2.4 Relationship between education and attitudesThe relationship between respondents’ educational level and attitudes was also examined.
Table 3.10 shows respondents’ level of comfort interacting with people with a range of impairments in different situations by their level of education – those respondents with educational qualifications below O level, and those with O level or above4.
Table 3.10 reveals that like gender, there is, in most scenarios, a positive relationship between educational level and the proportion of respondents saying they would be very comfortable with disabled people. In general, a larger proportion of people with O level qualifications or above reported that they would be very comfortable interacting with disabled people across the scenarios, particularly when interacting with people with physical or sensory impairments. For example, 74 per cent of people in the higher education group, and 60 per cent in the lower education group said they would be very comfortable with someone with a physical impairment marrying a close friend or relative. This compares to 31 per cent in the higher education group and 26 per cent in the lower education group being very comfortable with someone with a learning disability marrying a close friend or relative.
4 BSAS 2009 uses the term “O level or equivalent”, which also includes the current GCSE level of qualification
Public Perceptions of Disabled PeopleEvidence from the British Social Attitudes Survey 2009
Chapter 3: Exploring comfort with disability
59
Differences between the higher and lower education groups tend to be smaller when looking at attitudes towards people with mental health conditions or learning disabilities, with lower figures across the board. For example, 22 per cent of people with O level qualifications or above would be very comfortable if a person with a mental health condition married a close friend or relative, compared to 19 per cent in the lower education group.
The only situation in which people with O level qualifications or above were significantly less likely to say they would be very comfortable than those in the lower education group was if a person with learning disabilities was appointed as their boss - 16 per cent of those with O level qualifications or above said they would be very comfortable with this compared to 23 per cent in the lower education group. Interestingly this is a situation in which the disabled person would be in a position of authority with a direct impact on the respondent.
Whilst the relationship between education and attitudes is complex a couple of patterns worthy of comment emerge. It appears that having O level education makes a larger difference to the likelihood of being prejudiced towards people with sensory or physical impairments than it does to the likelihood of being prejudiced towards people with mental health conditions or learning disabilities.
Secondly, people with higher levels of education are significantly less likely to say they would be very comfortable if a person with learning disabilities was their boss at work. This evidence adds further weight to the argument that prejudice towards disabled people is influenced by negative assessments of disabled people’s capability. People with higher levels of education are more likely to be in positions of greater responsibility in the work place. Consequently, their boss is likely to be in a more responsible position than the boss of someone without O level education. It is possible that it is a concern over the ability of a disabled person to deliver in such roles that lies behind the lower level of comfort. However, without further research these differences cannot be fully explained.

Public Perceptions of Disabled PeopleEvidence from the British Social Attitudes Survey 2009
Chapter 3: Exploring comfort with disability
60
ta
ble
y
wou
ld b
e ve
ry c
omfo
rt s
ituat
ions
ts
in d
iffer
enyi
ng th
eta
ge o
f peo
ple
saer
cen
able
3.1
0: P
ting
with
peo
ple
with
a ra
nge
of im
pairm
ente
rac vel o
f edu
catio
ny
le
T in b
Phys
ical
Di
sabi
lity
Sens
ory
Impa
irmen
tLe
arni
ng
Disa
bilit
yM
enta
l Hea
lth
Cond
ition
Be
low
O
Leve
lO
Leve
l an
d ab
ove
Belo
w
O Le
vel
O Le
vel
and
abov
eBe
low
O
Leve
lO
Leve
l an
d ab
ove
Belo
w
O Le
vel
O Le
vel
and
abov
eSa
mpl
e Si
ze
Club
or
team
61%
73%
62%
75%
42%
56%
32%
46%
2063
Mov
e in
ne
xt d
oor
70%
80%
71%
78%
46%
51%
28%
27%
1031
In c
lass
at
sch
ool
60%
74%
60%
72%
38%
44%
22%
29%
1031
Mar
ry44
%60
%49
%63
%26
%31
%19
%22
%20
63
Boss
50%
57%
48%
49%
23%
16%
15%
13%
2063
MP
49%
65%
49%
63%
14%
13%
9%11
%10
31
ers
to m
ultip
le q
uest
ions
and
bas
e nu
mbe
rs a
pply
to a
nsw
ers
ches
ear
or S
ocia
l R
t typ
e.s
answ e
ftr
for e
ach
impa
irmen
Nat
iona
l Cen
yab
le d
ispl
aTh
is t
Sour
ce:
Public Perceptions of Disabled PeopleEvidence from the British Social Attitudes Survey 2009
Chapter 3: Exploring comfort with disability
61
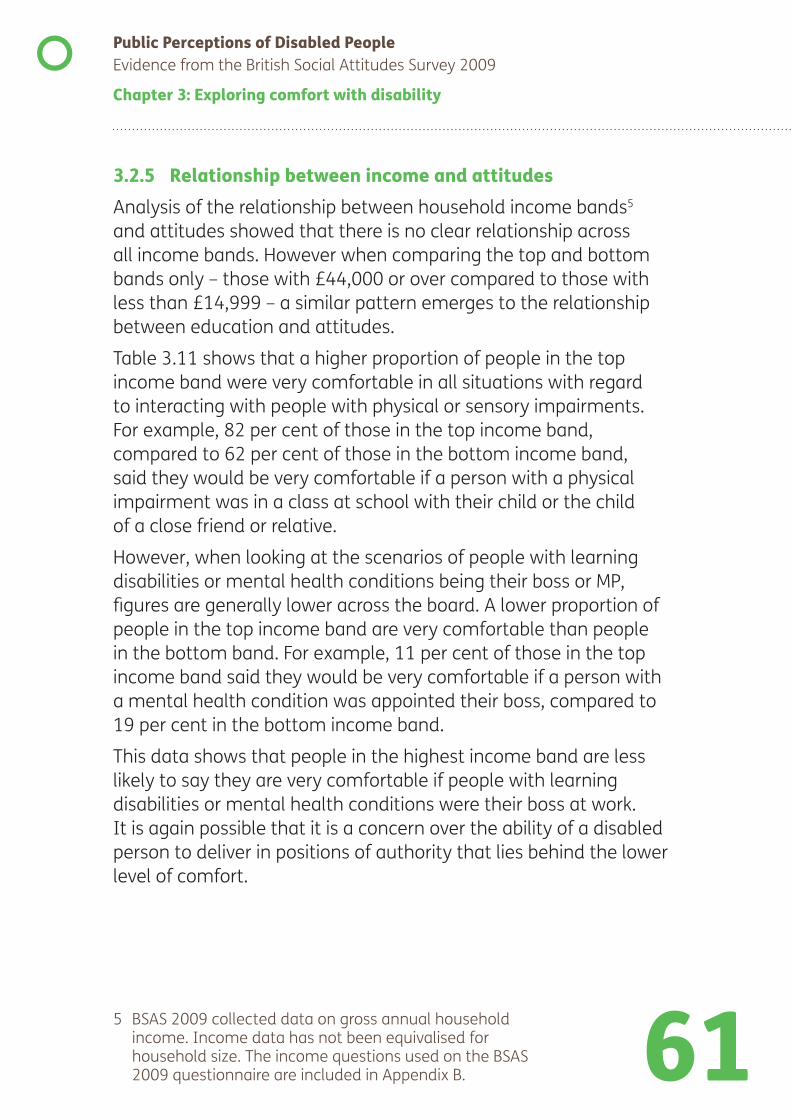
3.2.5 Relationship between income and attitudesAnalysis of the relationship between household income bands5 and attitudes showed that there is no clear relationship across all income bands. However when comparing the top and bottom bands only – those with £44,000 or over compared to those with less than £14,999 – a similar pattern emerges to the relationship between education and attitudes.
Table 3.11 shows that a higher proportion of people in the top income band were very comfortable in all situations with regard to interacting with people with physical or sensory impairments. For example, 82 per cent of those in the top income band, compared to 62 per cent of those in the bottom income band, said they would be very comfortable if a person with a physical impairment was in a class at school with their child or the child of a close friend or relative.
However, when looking at the scenarios of people with learning disabilities or mental health conditions being their boss or MP, figures are generally lower across the board. A lower proportion of people in the top income band are very comfortable than people in the bottom band. For example, 11 per cent of those in the top income band said they would be very comfortable if a person with a mental health condition was appointed their boss, compared to 19 per cent in the bottom income band.
This data shows that people in the highest income band are less likely to say they are very comfortable if people with learning disabilities or mental health conditions were their boss at work. It is again possible that it is a concern over the ability of a disabled person to deliver in positions of authority that lies behind the lower level of comfort.
5 BSAS 2009 collected data on gross annual household income. Income data has not been equivalised for household size. The income questions used on the BSAS 2009 questionnaire are included in Appendix B.
Public Perceptions of Disabled PeopleEvidence from the British Social Attitudes Survey 2009
Chapter 3: Exploring comfort with disability
62
ting
tera
cta
ble
iny
wou
ld b
e ve
ry c
omfo
r y in
com
e ba
ndt s
ituat
ions
, bts
in d
iffer
enyi
ng th
eta
ge o
f peo
ple
saer
cen
Tabl
e 3.
11: P
with
peo
ple
with
a ra
nge
of im
pairm
en
Phys
ical
Di
sabi
lity
Sens
ory
Impa
irmen
tLe
arni
ng
Disa
bilit
yM
enta
l Hea
lth
Cond
ition
Le
ss
than
£1
4,99
9
£44,
000
and
over
Less
th
an
£14,
999
£44,
000
and
over
Less
th
an
£14,
999
£44,
000
and
over
Less
th
an
£14,
999
£44,
000
and
over
Sam
ple
Size
Club
or
team
62%
77%
63%
78%
45%
59%
38%
48%
950
Mov
e in
ne
xt d
oor
76%
87%
75%
87%
48%
56%
30%
32%
467
In c
lass
at
sch
ool
62%
82%
62%
79%
39%
47%
25%
33%
467
Mar
ry50
%60
%53
%66
%31
%29
%24
%20
%95
0
Boss
52%
60%
48%
50%
23%
15%
19%
11%
950
MP
57%
73%
56%
70%
16%
10%
13%
10%
467
or
ers
to m
ultip
le q
uest
ions
and
bas
e nu
mbe
rs a
pply
to a
nsw
ers
f
ches
ear
or S
ocia
l R
ys a
nsw e
f
t typ
e. tr N
atio
nal C
en
able
dis
pla
This
tea
ch im
pairm
en
Sour
ce:
Public Perceptions of Disabled PeopleEvidence from the British Social Attitudes Survey 2009
Chapter 3: Exploring comfort with disability
63
3.3 Workplace factors and attitudesThe relationship between the employment context of respondents, such as industry and workplace size, and their views was also considered. Work plays a major part in many people’s lives and it is possible that negative (and positive) attitudes may be acquired by interaction in the workplace. Knowing whether people in different workplaces are more likely to hold positive or negative views may, therefore, help identify whether any specific consideration needs to be given towards particular categories of employees.
This is of additional interest because the Disability Discrimination Act 2005 requires public sector organisations to promote positive attitudes towards disabled people and the Equality Act 2010, which is expected to commence from April 2011, places a duty on public authorities to advance equality of opportunity for disabled people. However, there is no such duty for private sector organisations. More positive attitudes may be expected amongst public than private sector workers therefore.

Public Perceptions of Disabled PeopleEvidence from the British Social Attitudes Survey 2009
Chapter 3: Exploring comfort with disability
64
3.3.1 Relationship between employment sector and attitudesTable 3.12 shows the percentage of people expressing the belief that they would be very comfortable interacting with disabled people in each scenario and impairment type by whether they work in the public or private sector6.
Table 3.12 shows that in general a higher proportion of people in the public sector than private sector report being very comfortable interacting with disabled people. Differences are most marked with regards to attitudes towards people with physical or sensory impairments. Attitudes are less positive and vary less towards people with learning disabilities or mental health conditions.
The largest percentage point difference in attitudes by employment sector was towards someone with a physical impairment being an MP. 68 per cent of those in the public sector reported being very comfortable with this compared to 55 per cent of those in the private sector. However, just 13 per cent of people in both the public and private sector said they would be very comfortable if a person with a learning disability was appointed their MP.
6 Employees of nationalised industries and people working in the third sector were excluded because small sample sizes did not allow robust analysis.
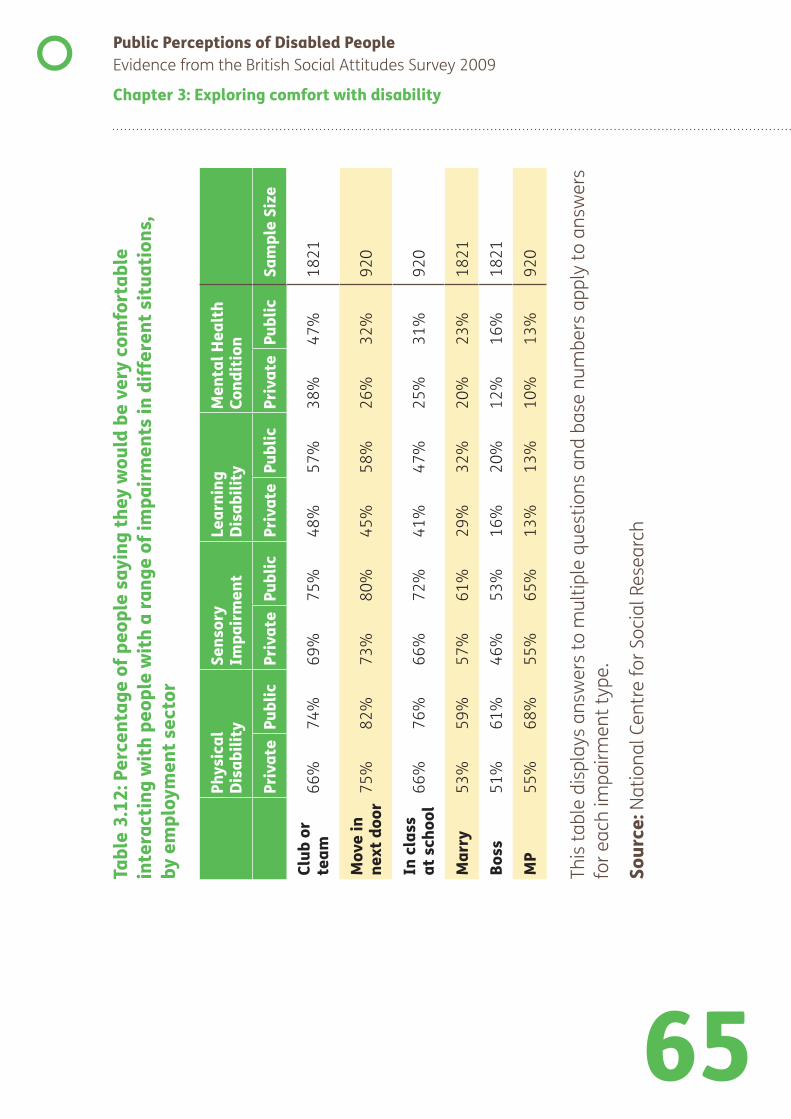
Public Perceptions of Disabled PeopleEvidence from the British Social Attitudes Survey 2009
Chapter 3: Exploring comfort with disability
65
ta
ble
y w
ould
be
very
com
for
t situ
atio
ns,
ts in
diff
eren
ying
the
tage
of p
eopl
e sa
tor
erce
n
t sec
able
3.1
2: P
ting
with
peo
ple
with
a ra
nge
of im
pairm
enym
ente
rac
in by e
mpl
o
T
Phys
ical
Di
sabi
lity
Sens
ory
Impa
irmen
tLe
arni
ng
Disa
bilit
yM
enta
l Hea
lth
Cond
ition
Pr
ivat
ePu
blic
Priv
ate
Publ
icPr
ivat
ePu
blic
Priv
ate
Publ
icSa
mpl
e Si
ze
Club
or
team
66%
74%
69%
75%
48%
57%
38%
47%
1821
Mov
e in
ne
xt d
oor
75%
82%
73%
80%
45%
58%
26%
32%
920
In c
lass
at
sch
ool
66%
76%
66%
72%
41%
47%
25%
31%
920
Mar
ry53
%59
%57
%61
%29
%32
%20
%23
%18
21
Boss
51%
61%
46%
53%
16%
20%
12%
16%
1821
MP
55%
68%
55%
65%
13%
13%
10%
13%
920
ers
to m
ultip
le q
uest
ions
and
bas
e nu
mbe
rs a
pply
to a
nsw
ers
ches
ear
or S
ocia
l R
t typ
e.s
answ e
ftr
for e
ach
impa
irmen
Nat
iona
l Cen
yab
le d
ispl
aTh
is t
Sour
ce:
Public Perceptions of Disabled PeopleEvidence from the British Social Attitudes Survey 2009
Chapter 3: Exploring comfort with disability
66
3.3.2 Relationship between workplace size and attitudesThe relationship between workplace size and comfort when interacting with disabled people was also investigated. For this analysis workplace size was broken down into three groups – 1 to 49 employees, 50 to 199 employees and 200 or more employees.
Table 3.13 shows the percentage of people saying they would be very comfortable interacting with people with different disabilities by their workplace size.
Those working in the largest workplaces were generally more likely to express being very comfortable with people with physical or sensory impairments. For example, 57 per cent of those in workplaces with less than 50 employees reported being very comfortable if a person with a physical impairment was appointed their MP, compared to 61 per cent of those in workplaces with 50 to 199 employees and 65 per cent in organisations with 200 or more employees.
There is no clear pattern evident when interacting with people with learning disabilities or mental health conditions. For example, 30 per cent of those from the largest workplaces said they would be very comfortable with a person with a mental health condition in the class at school scenario compared to 24 per cent of those in the smallest workplace. However when looking at this scenario for people with learning disabilities, those from the largest workplaces were the least likely to be very comfortable – 39 per cent compared to 46 per cent of those in workplaces with between 50 and 199 employees.
The one clear pattern that emerges when looking at attitudes by workplace size is that those employed in workplaces with 200 or more employees are generally more likely to report being very comfortable interacting with people with sensory or physical impairments, compared to those employed in workplaces with less than 50 people.
However, as workplaces with over 200 employees are more likely to be in the public sector, and those with less than 50 employees in the private sector, it is possible that this is also affecting the results here.
Public Perceptions of Disabled PeopleEvidence from the British Social Attitudes Survey 2009
Chapter 3: Exploring comfort with disability
67
ts in
ta
ble
y w
ould
be
very
com
for
ying
the
ysic
al d
isab
ilitie
s or
sen
sory
impa
irmen
tage
of p
eopl
e sa
plac
e si
zey
wor
k
erce
ntin
g w
ith p
eopl
e w
ith p
ht s
ituat
ions
, b
able
3.1
3: P
tera
cT in di
ffer
en
Phys
ical
Dis
abili
tySe
nsor
y Im
pairm
ent
1
to 4
9 em
ploy
ees
50 to
199
em
ploy
ees
200
or
mor
e em
ploy
ees
1 to
49
empl
oyee
s50
to 1
99
empl
oyee
s20
0 or
m
ore
empl
oyee
sSa
mpl
e Si
ze
Club
or
team
6868
7370
6976
2026
Mov
e in
ne
xt d
oor
7380
8073
7779
1009
In c
lass
at
sch
ool
6870
7067
6968
1009
Mar
ry53
5458
5660
6220
26
Boss
5251
6147
4553
2026
MP
5761
6554
5965
1009
ers
to m
ultip
le q
uest
ions
and
bas
e nu
mbe
rs a
pply
to a
nsw
ers
ches
ear
or S
ocia
l R
t typ
e.s
answ e
ftr
for e
ach
impa
irmen
Nat
iona
l Cen
yab
le d
ispl
aTh
is t
Sour
ce:
Public Perceptions of Disabled PeopleEvidence from the British Social Attitudes Survey 2009
Chapter 3: Exploring comfort with disability
68
tabl
e y
wou
ld b
e ve
ry c
omfo
rta
l hea
lth
cond
ition
s in
yi
ng th
eta
ge o
f peo
ple
satin
g w
ith p
eopl
e w
ith le
arni
ng d
isab
ilitie
s or
men
plac
e si
ze
erce
n
y w
ork
tinue
d: P
t situ
atio
ns b
able
3.1
3 co
nte
rac
T in diff
eren
Lear
ning
Dis
abili
tyM
enta
l Hea
lth
Cond
ition
1
to 4
9 em
ploy
ees
50 to
199
em
ploy
ees
200
or
mor
e em
ploy
ees
1 to
49
empl
oyee
s50
to 1
99
empl
oyee
s20
0 or
m
ore
empl
oyee
sSa
mpl
e Si
ze
Club
or
team
5050
5439
4444
2026
Mov
e in
ne
xt d
oor
4952
4827
2631
1009
In c
lass
at
sch
ool
4146
3924
2530
1009
Mar
ry28
2931
2023
2020
26
Boss
1717
1913
1413
2026
MP
1114
1511
1112
1009
ers
to m
ultip
le q
uest
ions
and
bas
e nu
mbe
rs a
pply
to a
nsw
ers
ches
ear
or S
ocia
l R
t typ
e.s
answ e
ftr
for e
ach
impa
irmen
Nat
iona
l Cen
yab
le d
ispl
aTh
is t
Sour
ce:

69
Chapter 4Conclusions
Public Perceptions of Disabled PeopleEvidence from the British Social Attitudes Survey 2009
Chapter 4: Conclusions
70
This paper started with the following aims:
• To measure how much prejudice there is in Great Britain towards disabled people and how this is changing over time.
• To understand in more detail the attitudes the public hold towards disabled people.
• To understand what demographic factors affect people’s attitudes towards disabled people.
This research has shown that since the last data was collected in 2005, attitudes towards disabled people have improved, on the whole. People are less likely to think of disabled people as getting in the way or with discomfort and awkwardness. Conversely, they are more likely to think of disabled people as the same as everybody else.
Further, in 2009 almost eight out of ten people felt that most people would feel very or fairly uncomfortable if people said negative things about disabled people at the shops, with their friends and at work. Comparative data was not available from 2005.
Considering the nature of attitudes towards disabled people several key messages have emerged.
Firstly, whilst very few people express openly prejudiced views the evidence suggests that a degree of ‘benevolent prejudice’ exists towards disabled people. Over three quarters of respondents reported thinking that disabled people need caring for some or all of the time. The evidence also suggests that amongst many respondents the capabilities of disabled people were considered lower than those of non-disabled people. Nearly four in ten respondents felt that disabled people were not as productive as non-disabled people some or most of the time. Similarly, the lowest levels of comfort were expressed when people were asked about how they would feel if a disabled person was their boss or an MP, both scenarios where disabled people would be in positions of responsibility.
Public Perceptions of Disabled PeopleEvidence from the British Social Attitudes Survey 2009
Chapter 4: Conclusions
71
Secondly, attitudes towards the social model of disability were investigated and it was found that disabled people were more likely to see medical conditions as the main barrier stopping disabled people in general living a full life than non-disabled people. However, a majority of both disabled and non disabled people felt that social barriers played some part.
Thirdly, people do not simply have positive or negative attitudes. Instead the type of impairment and scenario both play a critical role in influencing how comfortable people feel interacting with disabled people. People are most comfortable interacting with people with physical or sensory impairments and in social situations. People are less comfortable interacting with people with learning disabilities or mental health conditions and in situations where disabled people are in positions of responsibility.
Finally, the influence of respondent characteristics on attitudes is complex and also varies depending on the impairment and scenario considered. Gender and employment sector were the only demographic variables with a consistent relationship to attitudes. Women and public sector employees were either more likely, or no less likely, than men and private sector employees to say they would be very comfortable in all the scenario/impairment combinations.
Income and education presented a more complex picture. In general people with higher incomes and those with higher levels of education were more likely to be very comfortable interacting with disabled people. However, they were less likely to be very comfortable with people with learning disabilities or mental health conditions as their boss. Again this may reflect a belief that people with these impairments are less capable than non-disabled people, with respondents in higher earning jobs fearing that a disabled boss will be less effective than a non-disabled boss.
Public Perceptions of Disabled PeopleEvidence from the British Social Attitudes Survey 2009
Chapter 4: Conclusions
72
It is worth noting that the greatest variation in attitudes was between those with physical or sensory impairments and those with learning disabilities or mental health conditions. The effect of demographic characteristics on attitudes was smaller.
It is clear that blanket assertions that people have either ‘negative’ or ‘positive’ attitudes to disabled people do not hold up to scrutiny. Respondents’ demographic characteristics interact with both the situation in which a disabled person is encountered, and the impairment that they have, in influencing the attitudes people hold.
73
References

74
Public Perceptions of Disabled PeopleEvidence from the British Social Attitudes Survey 2009
References
Abrams, D & Houston, D M (2006), Equality Diversity and Prejudice in Britain: Results from the 2005 National Survey
Department for Work and Pensions (2002), ‘Disabled for Life?’: Attitudes Towards, and Experiences of, Disability in Britain, http://research.dwp.gov.uk/asd/asd5/rrep173.pdf
Department for Work and Pensions (2009), British Social Attitudes Survey – Attitudes Towards the Rights of Disabled People: Findings from Cognitive Interviews, http://research.dwp.gov.uk/asd/asd5/rports2009-2010/rrep588.pdf
Disability Rights Commission (2007), Attitudes Towards and Perceptions of Disabled People – Findings from a Module included in the 2005 British Social Attitudes Survey
Equality and Human Rights Commission (2009), Disabled People’s Experiences of Targeted Violence and Hostility, http://www.equalityhumanrights.com/uploaded_files/research/disabled_people_s_experiences_of_targeted_violence_and_hostility.pdf
Great Britain (2005), Disability Discrimination Act 2005: Elizabeth II. Chapter 13, London: The Stationery Office, http://www.legislation.gov.uk/ukpga/2005/13
Great Britain (2010), Equality Act 2010: Elizabeth II. Chapter 15, London: The Stationery Office, http://www.legislation.gov.uk/ukpga/2010/15/contents
75
Public Perceptions of Disabled PeopleEvidence from the British Social Attitudes Survey 2009
References
Office for Disability Issues (2008), Experiences and Expectations of Disabled People, http://www.odi.gov.uk/docs/res/eedp/eedp-full-report.pdf
Office for National Statistics, (2010), Life Opportunities Survey: Interim Results 2009/10, http://www.statistics.gov.uk/statbase/Product.asp?vlnk=15386
Rigg, J (2007), Disabling Attitudes? Public Perspectives on Disabled People, in ed Park, A, British Social Attitudes: The 23rd Report
United Nations (2009), Convention on the Rights of Persons with Disabilities and Optional Protocol. Ratified June 2009, optional protocol ratified August 2009, http://www.un.org/disabilities/documents/convention/convoptprot-e.pdf
76
Appendix AData from graphs and chartsThis appendix contains tabulated data from all graphs and charts used in this report.
77
Public Perceptions of Disabled PeopleEvidence from the British Social Attitudes Survey 2009
Appendix A
Table A.1: Reason why disabled people can’t live as full a life as non-disabled people (%)
Attitudes and barriers in society
Health problems only
Both health problems and attitudes
Don’t know
Sample Size
Disabled respondents 15% 46% 38% 2% 318
Non disabled respondents 17% 36% 47% 1% 1752
All respondents 17% 37% 46% 1% 2073
This data is presented as a chart in the main report, see Figure 2.5 (page 31)
Source: National Centre for Social Research

78
Public Perceptions of Disabled PeopleEvidence from the British Social Attitudes Survey 2009
Appendix A
Table A.2: Percentage of respondents reporting how comfortable people would feel if someone said negative things about disabled people in different situations
very comfort-able
fairly comfort-able
fairly uncomfort-able
very uncomfort-able
Sample Size
In the local shops 9% 11% 42% 35% 2282
With your close friends
11% 11% 31% 45% 2282
At work in front of your boss
9% 7% 27% 54% 1263
At work in front of your colleagues
9% 10% 30% 49% 1263
This data is presented as a chart in the main report, see Figure 2.6 (page 34)
Source: National Centre for Social Research
79
Public Perceptions of Disabled PeopleEvidence from the British Social Attitudes Survey 2009
Appendix A
Table A.3: Percentage of people saying they would feel very comfortable interacting with people with a range of impairments in different situations
Physical Disability
Sensory Impairment
Learning Disability
Mental Health Condition
Sample Size
Club or team 69% 71% 51% 42% 2282
Move in next door
76% 76% 49% 27% 1128
In class at school 69% 68% 41% 26% 1128
Marry 55% 59% 29% 20% 2282
Boss 54% 49% 18% 13% 2282
MP 60% 58% 13% 11% 1128
This data is presented as a chart in the main report, see Figure 3.2 (page 40)
Source: National Centre for Social Research
80
Public Perceptions of Disabled PeopleEvidence from the British Social Attitudes Survey 2009
Appendix A
Table A.4: Percentage of people saying they would be very comfortable if a disabled person attended a club, group or team of which they were a member, by age
Physical Disability
Sensory Impairment
Learning Disability
Mental Health Condition
Sample Size
18 to 24 61% 63% 52% 40% 144
25 to 34 74% 77% 63% 50% 358
35 to 44 69% 72% 55% 41% 458
45 to 54 73% 77% 53% 47% 425
55 to 59 71% 76% 49% 40% 182
60 to 64 68% 70% 44% 37% 191
65 plus 66% 64% 39% 34% 523
This data is presented as a chart in the main report, see Figure 3.4 (page 46)
Source: National Centre for Social Research
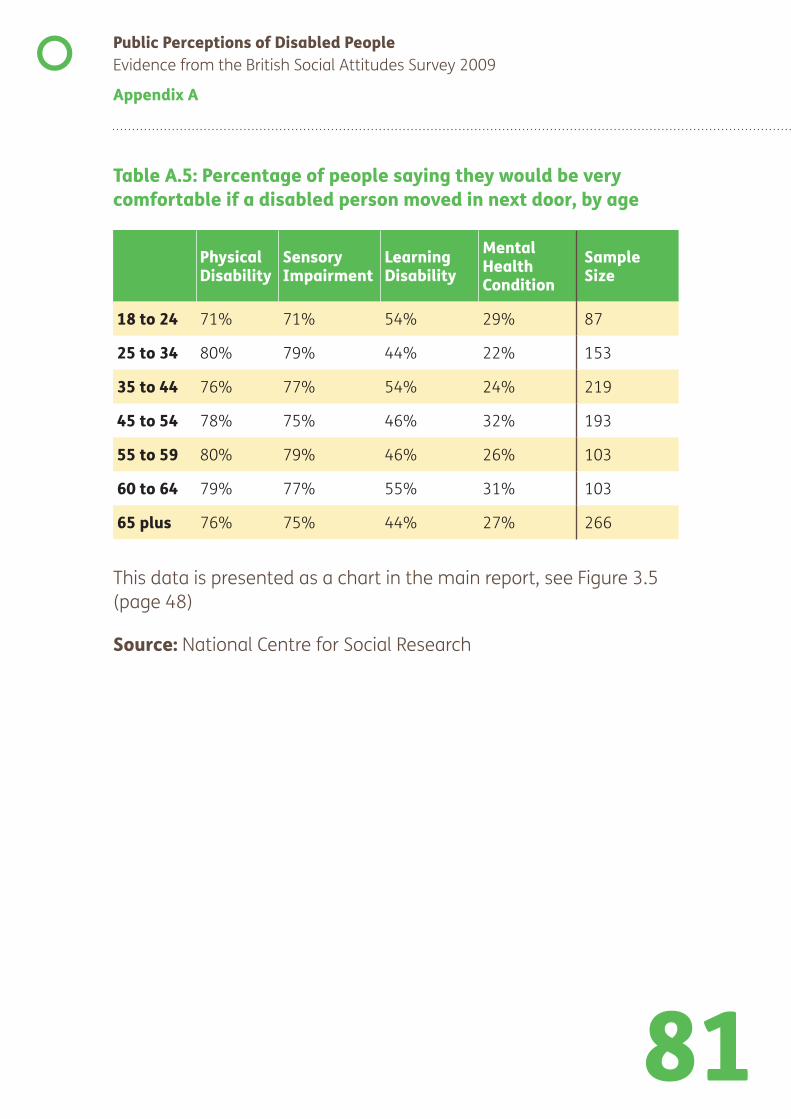
81
Public Perceptions of Disabled PeopleEvidence from the British Social Attitudes Survey 2009
Appendix A
Table A.5: Percentage of people saying they would be very comfortable if a disabled person moved in next door, by age
Physical Disability
Sensory Impairment
Learning Disability
Mental Health Condition
Sample Size
18 to 24 71% 71% 54% 29% 87
25 to 34 80% 79% 44% 22% 153
35 to 44 76% 77% 54% 24% 219
45 to 54 78% 75% 46% 32% 193
55 to 59 80% 79% 46% 26% 103
60 to 64 79% 77% 55% 31% 103
65 plus 76% 75% 44% 27% 266
This data is presented as a chart in the main report, see Figure 3.5 (page 48)
Source: National Centre for Social Research

82
Public Perceptions of Disabled PeopleEvidence from the British Social Attitudes Survey 2009
Appendix A
Table A.6: Percentage of people saying they would be very comfortable if their child or the child of a close family member of friend attended school with a disabled person, by age
Physical Disability
Sensory Impairment
Learning Disability
Mental Health Condition
Sample Size
18 to 24 71% 71% 54% 27% 87
25 to 34 77% 76% 46% 26% 153
35 to 44 71% 72% 45% 30% 219
45 to 54 70% 67% 40% 27% 193
55 to 59 70% 70% 45% 27% 103
60 to 64 69% 62% 38% 25% 103
65 plus 62% 59% 29% 20% 266
This data is presented as a chart in the main report, see Figure 3.6 (page 50)
Source: National Centre for Social Research
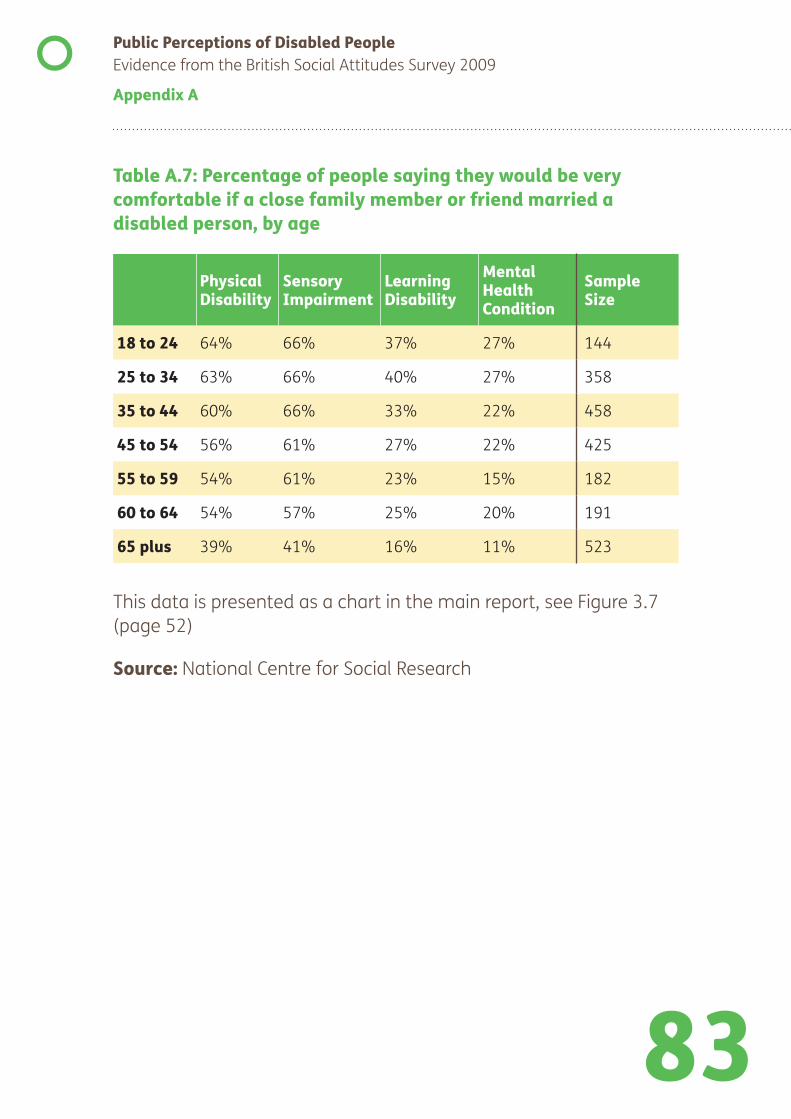
83
Public Perceptions of Disabled PeopleEvidence from the British Social Attitudes Survey 2009
Appendix A
Table A.7: Percentage of people saying they would be very comfortable if a close family member or friend married a disabled person, by age
Physical Disability
Sensory Impairment
Learning Disability
Mental Health Condition
Sample Size
18 to 24 64% 66% 37% 27% 144
25 to 34 63% 66% 40% 27% 358
35 to 44 60% 66% 33% 22% 458
45 to 54 56% 61% 27% 22% 425
55 to 59 54% 61% 23% 15% 182
60 to 64 54% 57% 25% 20% 191
65 plus 39% 41% 16% 11% 523
This data is presented as a chart in the main report, see Figure 3.7 (page 52)
Source: National Centre for Social Research
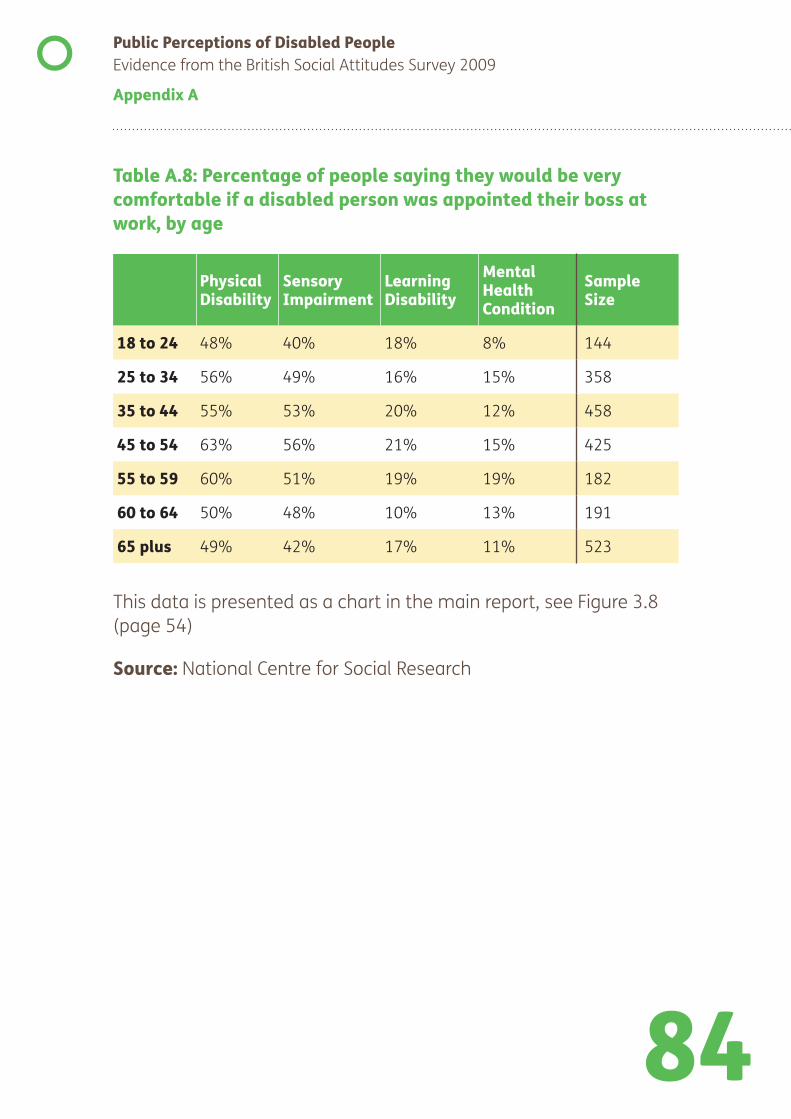
84
Public Perceptions of Disabled PeopleEvidence from the British Social Attitudes Survey 2009
Appendix A
Table A.8: Percentage of people saying they would be very comfortable if a disabled person was appointed their boss at work, by age
Physical Disability
Sensory Impairment
Learning Disability
Mental Health Condition
Sample Size
18 to 24 48% 40% 18% 8% 144
25 to 34 56% 49% 16% 15% 358
35 to 44 55% 53% 20% 12% 458
45 to 54 63% 56% 21% 15% 425
55 to 59 60% 51% 19% 19% 182
60 to 64 50% 48% 10% 13% 191
65 plus 49% 42% 17% 11% 523
This data is presented as a chart in the main report, see Figure 3.8 (page 54)
Source: National Centre for Social Research
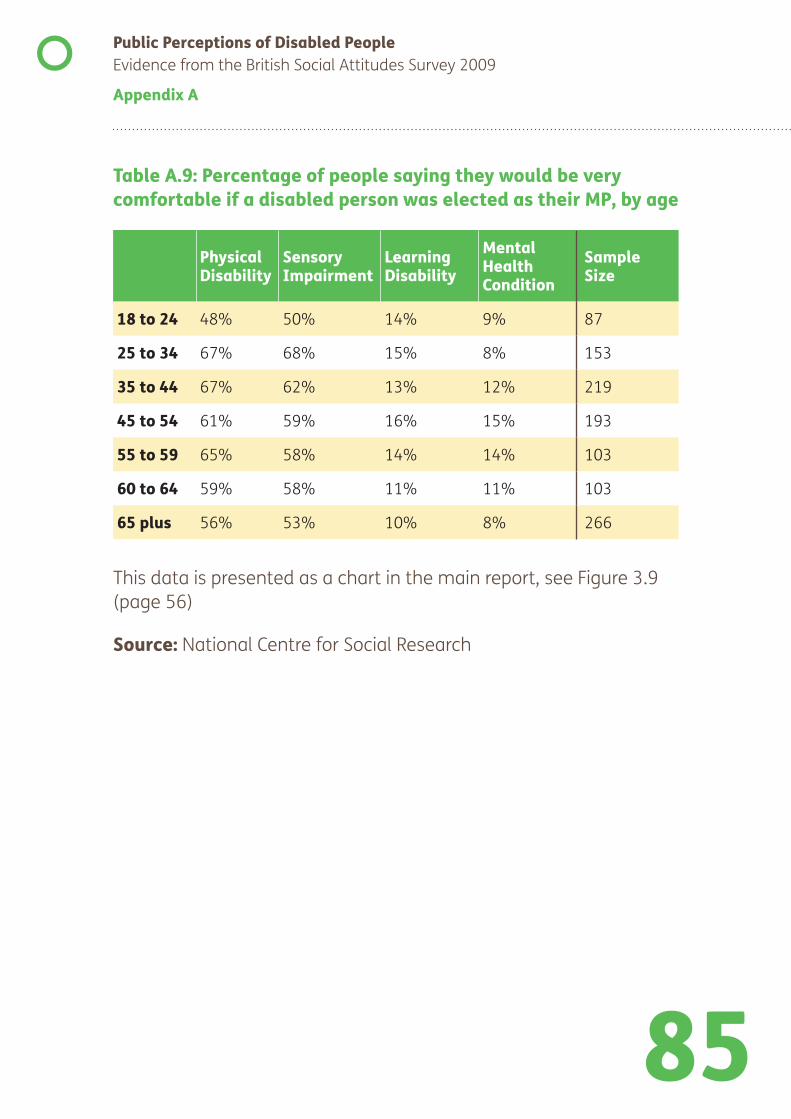
85
Public Perceptions of Disabled PeopleEvidence from the British Social Attitudes Survey 2009
Appendix A
Table A.9: Percentage of people saying they would be very comfortable if a disabled person was elected as their MP, by age
Physical Disability
Sensory Impairment
Learning Disability
Mental Health Condition
Sample Size
18 to 24 48% 50% 14% 9% 87
25 to 34 67% 68% 15% 8% 153
35 to 44 67% 62% 13% 12% 219
45 to 54 61% 59% 16% 15% 193
55 to 59 65% 58% 14% 14% 103
60 to 64 59% 58% 11% 11% 103
65 plus 56% 53% 10% 8% 266
This data is presented as a chart in the main report, see Figure 3.9 (page 56)
Source: National Centre for Social Research
86
Appendix BQuestionnaire and showcards
87
Public Perceptions of Disabled PeopleEvidence from the British Social Attitudes Survey 2009
Appendix B
The data used for this analysis was collected from the British Social Attitudes Survey 2009. Fieldwork was carried out by the National Centre for Social Research (NatCen) from June to September 2009, with a small number of additional interviews in October and November 2009.
Two methods were used for data collection. Firstly, people were asked a set of straightforward questions about how often they think about disabled people in different ways. These questions were included on an anonymous self-completion questionnaire that was mailed back to the researchers. Because people do not have to admit to negative attitudes to an interviewer this helps increase the likelihood of respondents answering truthfully and reduces the impact of social desirability bias.
Secondly, a set of questions was included in the main face-to-face survey with NatCen interviewers. There were three versions of the BSAS 2009 interview questionnaire and respondents answered different questions on disability depending on whether they were selected for version A or versions B/C of the questionnaire.
During the interviews showcards were used to help respondents answer the questions. The showcards, along with the disability questions asked on both the self-completion questionnaire and during the interviews are included in this appendix.
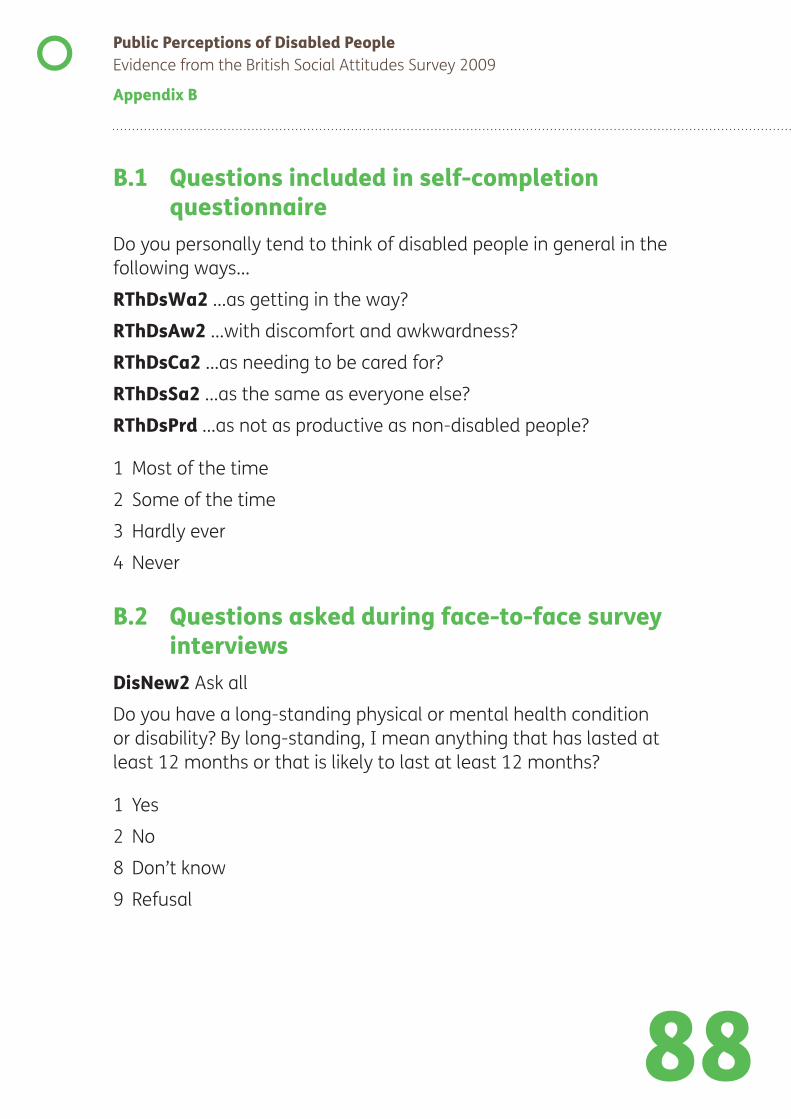
88
Public Perceptions of Disabled PeopleEvidence from the British Social Attitudes Survey 2009
Appendix B
B.1 Questions included in self-completion questionnaire
Do you personally tend to think of disabled people in general in the following ways…
RThDsWa2 …as getting in the way?
RThDsAw2 ...with discomfort and awkwardness?
RThDsCa2 ...as needing to be cared for?
RThDsSa2 ...as the same as everyone else?
RThDsPrd …as not as productive as non-disabled people?
1 Most of the time
2 Some of the time
3 Hardly ever
4 Never
B.2 Questions asked during face-to-face survey interviews
DisNew2 Ask all
Do you have a long-standing physical or mental health condition or disability? By long-standing, I mean anything that has lasted at least 12 months or that is likely to last at least 12 months?
1 Yes
2 No
8 Don’t know
9 Refusal
89
Public Perceptions of Disabled PeopleEvidence from the British Social Attitudes Survey 2009
Appendix B
DisAct If answered ‘Yes’ AT DisNew2
Does this condition or disability have a substantial adverse effect on your ability to carry out normal day-to-day activities?
1 Yes
2 No
8 Don’t know
9 Refusal
DisPrj Asked on Versions B and C
Generally speaking, do you think there is a lot of prejudice in Britain against disabled people in general, a little, hardly any or none?
1 A lot
2 A little
3 Hardly any
4 None
8 Don’t know
9 Refusal
Dis100 Asked on Versions B and C
Out of every 100 people living in the UK, how many do you think are disabled?
Interviewer: Encourage best estimate if unsure.
Record number between 0 and 100
998 Don’t know
999 Refusal
90
Public Perceptions of Disabled PeopleEvidence from the British Social Attitudes Survey 2009
Appendix B
ScenInt Ask all
Now some questions about how you would feel if you came across disabled people in particular situations. The questions ask about people with a range of different disabilities in a number of situations.
1 Press 1 and <Enter> to continue.
8 Don’t know
9 Refusal
DMPSens Asked on Version A
Taking your answer from this card, how do you think you would feel if your local Member of Parliament (MP) had a sensory impairment such as being partially or fully blind or partially or fully deaf?
Showcard H1
DMPPhys Asked on Version A
And what if it was a person with a physical disability such as difficulty using their arms or was someone who uses a wheelchair (who was your local Member of Parliament (MP))?
(How comfortable or uncomfortable do you think you would feel?)
Showcard H1
DMPMent Asked on Version A
And what if it was a person with a mental health condition such as depression or a personality disorder (who was your local Member of Parliament (MP))?
(How comfortable or uncomfortable do you think you would feel?)
Showcard H1

91
Public Perceptions of Disabled PeopleEvidence from the British Social Attitudes Survey 2009
Appendix B
DMPLdis Asked on Version A
And what if it was a person with a learning disability such as Down’s syndrome or autism (who was your local Member of Parliament (MP))?
(How comfortable or uncomfortable do you think you would feel?)
Showcard H1
DNeiSens Asked on Version A
Thinking now of a different situation, how do you think you would feel if a person with a sensory impairment such as being partially or fully blind or partially or fully deaf were to move in next door?
Showcard H2
DNeiPhys Asked on Version A
And what if it was a person with a physical disability such as difficulty using their arms or someone who uses a wheelchair (who moved in next door)?
(How comfortable or uncomfortable do you think you would feel?)
Showcard H2
DNeiMent Asked on Version A
And what if it was a person with a mental health condition such as depression or a personality disorder (who moved in next door)?
(How comfortable or uncomfortable do you think you would feel?)
Showcard H2

92
Public Perceptions of Disabled PeopleEvidence from the British Social Attitudes Survey 2009
Appendix B
DNeiLdis Asked on Version A
And what if it was a person with a learning disability such as Down’s syndrome or autism (who moved in next door)?
(How comfortable or uncomfortable do you think you would feel?)
Showcard H2
DSchSens Asked on Version A
And now a different situation. Assuming the necessary help and assistance was in place, how do you think you would you feel if your son or daughter (or the son or daughter of a close family member or friend) was in a class at school with a child with a sensory impairment such as being partially or fully blind or partially or fully deaf?
Showcard H3
DSchPhys Asked on Version A
And what if it was a child with a physical disability such as difficulty using their arms or a child who uses a wheelchair (who was in a class at school with your son or daughter or the son or daughter of a close family member or friend. Again, assume the necessary help and assistance was in place)?
(How comfortable or uncomfortable do you think you would feel?)
Showcard H3
93
Public Perceptions of Disabled PeopleEvidence from the British Social Attitudes Survey 2009
Appendix B
DSchMent Asked on Version A
And what if it was a child with a mental health condition such as depression or Attention Deficit Hyperactivity Disorder (ADHD) (who was in a class at school with your son or daughter or the son or daughter of a close family member or friend. Again, assume the necessary help and assistance was in place)?
(How comfortable or uncomfortable do you think you would feel?)
Showcard H3
DSchLdis Asked on Version A
And what if it was a child with a learning disability such as Down’s syndrome or autism (who was in a class at school with your son or daughter or the son or daughter of a close family member or friend. Again, assume the necessary help and assistance was in place)?
(How comfortable or uncomfortable do you think you would feel?)
Showcard H3
DBosSens Asked on Versions B and C
Taking your answer from this card, how do you think you would (feel/have felt) if a person with a sensory impairment, such as being partially or fully blind or partially or fully deaf, (was/had been) appointed as your boss (when you were working)?
Showcard H4
94
Public Perceptions of Disabled PeopleEvidence from the British Social Attitudes Survey 2009
Appendix B
DBosPhys Asked on Versions B and C
And what if it was a person with a physical disability such as difficulty using their arms or someone who uses a wheelchair (who (was/had been) appointed as your boss (when you were working))?
(How comfortable or uncomfortable do you think you would (feel/have felt)?)
Showcard H4
DBosMent Asked on Versions B and C
And what if it was a person with a mental health condition such as depression or a personality disorder (who (was/had been) appointed as your boss (when you were working))?
(How comfortable or uncomfortable do you think you would (feel/have felt)?)
Showcard H4
DBosLdis Asked on Versions B and C
And what if it was a person with a learning disability such as Down’s syndrome or autism (who (was/had been) appointed as your boss (when you were working))?
(How comfortable or uncomfortable do you think you would (feel/have felt)?)
Showcard H4
DGrpSens Asked on Versions B and C
Imagine you were a member of a quiz team, community group or swimming club. How do you think you would feel if a person with a sensory impairment such as being partially or fully blind or partially or fully deaf also attended this club?
Showcard H5
95
Public Perceptions of Disabled PeopleEvidence from the British Social Attitudes Survey 2009
Appendix B
DGrpPhys Asked on Versions B and C
And what if it was a person with a physical disability such as difficulty using their arms or someone who uses a wheelchair (who attended this quiz team, community group or swimming club)?
(How comfortable or uncomfortable do you think you would feel?)
Showcard H5
DGrpMent Asked on Versions B and C
And what if it was a person with a mental health condition such as depression or a personality disorder (who attended this quiz team, community group or swimming club)?
(How comfortable or uncomfortable do you think you would feel?)
Showcard H5
DGrpLdis Asked on Versions B and C
And what if it was a person with a learning disability such as Down’s syndrome or autism (who attended this quiz team, community group or swimming club)?
(How comfortable or uncomfortable do you think you would feel?)
Showcard H5
DMarSens Asked on Versions B and C
Thinking now of a different situation, how do you think you would feel if one of your close relatives were to marry and have a family with a person with a sensory impairment such as being partially or fully blind or partially or fully deaf?
Showcard H6
96
Public Perceptions of Disabled PeopleEvidence from the British Social Attitudes Survey 2009
Appendix B
DMarPhys Asked on Versions B and C
And what if it was a person with a physical disability such as difficulty using their arms or someone who uses a wheelchair (who were to marry and have a family with one of your close relatives)?
(How comfortable or uncomfortable do you think you would feel?)
Showcard H6
DMarMent Asked on Versions B and C
And what if it was a person with a mental health condition such as depression or a personality disorder (who were to marry and have a family with one of your close relatives)?
(How comfortable or uncomfortable do you think you would feel?)
Showcard H6
DMarLdis Asked on Versions B and C
And what if it was a person with a learning disability such as Down’s syndrome or autism (who were to marry and have a family with one of your close relatives)?
(How comfortable or uncomfortable do you think you would feel?)
Showcard H6

97
Public Perceptions of Disabled PeopleEvidence from the British Social Attitudes Survey 2009
Appendix B
DisFull Ask All
Thinking about disabled people in general, how much of the time, if at all, do you think they can lead as full a life as non-disabled people?
1 All of the time
2 Most of the time
3 Some of the time
4 Rarely
5 Never
8 Don’t know
9 Refusal
Showcard H7
DisFWhy If answered ‘Most of the time’, ‘Some of the time’, ‘Rarely’ or ‘Never’ at DisFull.
You have said that in general disabled people cannot always lead as full a life as non-disabled people. Why do you think this is. Please choose the answer from the card that comes closest to your view?
1 Because of their health problem/disability
2 Because of attitudes, barriers and behaviours in society
3 Because of their health problem/disability AND because of attitudes, barriers and behaviours in society
8 Don’t know
9 Refusal
Showcard H8

98
Public Perceptions of Disabled PeopleEvidence from the British Social Attitudes Survey 2009
Appendix B
DNegShp Asked on Versions B and C
Sometimes people refer to disabled people in a negative way. This could include making jokes or using offensive language. What do you think most people would feel if somebody referred to disabled people in this way in different situations. First...
…at your local shops. What do you think most people would feel (if someone referred to disabled people in a negative way)?
Showcard H9
DNegFr Asked on Versions B and C
...with your close friends?
(What do you think most people would feel if someone referred to disabled people in a negative way?)
Showcard H9
DNegBoss Ask if currently in paid work
...at work – in front of your boss?
(What do you think most people would feel if someone referred to disabled people in a negative way?)
Showcard H9
DNegColl Ask if currently in paid work
...at work – in front of your colleagues?
(What do you think most people would feel if someone referred to disabled people in a negative way?)
Showcard H9
99
Public Perceptions of Disabled PeopleEvidence from the British Social Attitudes Survey 2009
Appendix B
HHincome Ask All
Which of the letters on this card represents the total income of your household from all sources before tax?
Please just tell me the letter.
Note: Iincludes income from benefits, savings, etc.
Showcard L13
HHIncQ Household income variable derived from HHincome
Range: 1 ... 4
1 Less than £14,999
2 £15,000 to 25,999
3 £26,000 to 43,999
4 £44,000 or more
8 (Don’t know)
9 (Refusal)
B.3 Showcards used during interviewsShowcard H1Thinking about your local Member of Parliament (MP)…
Very comfortable with this
Fairly comfortable with this
Fairly uncomfortable with this
Very uncomfortable with this

100
Public Perceptions of Disabled PeopleEvidence from the British Social Attitudes Survey 2009
Appendix B
Showcard H2Thinking about someone moving in next door…
Very comfortable with this
Fairly comfortable with this
Fairly uncomfortable with this
Very uncomfortable with this
Showcard H3Assume the necessary help and assistance was in place.
Thinking about your son/daughter (or the son/daughter of a close family member or friend) being in a class at school with someone…
Very comfortable with this
Fairly comfortable with this
Fairly uncomfortable with this
Very uncomfortable with this
Showcard H4Thinking about someone appointed as your boss…
Very comfortable with this
Fairly comfortable with this
Fairly uncomfortable with this
Very uncomfortable with this
101
Public Perceptions of Disabled PeopleEvidence from the British Social Attitudes Survey 2009
Appendix B
Showcard H5Thinking about someone attending this quiz team, community group or swimming club …
Very comfortable with this
Fairly comfortable with this
Fairly uncomfortable with this
Very uncomfortable with this
Showcard H6Thinking about one of your close relatives marrying and having a family with someone…
Very comfortable with this
Fairly comfortable with this
Fairly uncomfortable with this
Very uncomfortable with this
Showcard H7All of the time
Most of the time
Some of the time
Rarely
Never
102
Public Perceptions of Disabled PeopleEvidence from the British Social Attitudes Survey 2009
Appendix B
Showcard H8I think disabled people cannot lead as full a life as non-disabled people…
1 …because of their health problem/disability
2 …because of attitudes, barriers and behaviours in society
3 …because of their health problem/disability AND because of attitudes, barriers and behaviours in society
Showcard H9Most people would feel very comfortable
Most people would feel fairly comfortable
Most people would feel fairly uncomfortable
Most people would feel very uncomfortable
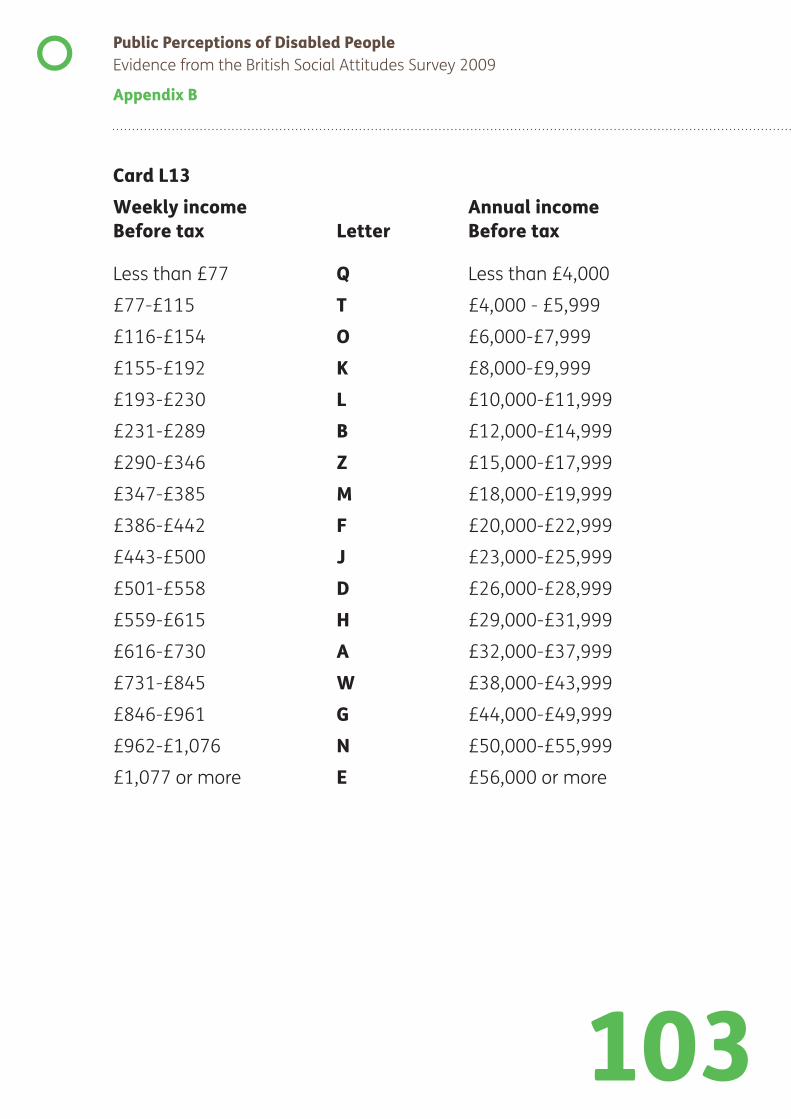
103
Public Perceptions of Disabled PeopleEvidence from the British Social Attitudes Survey 2009
Appendix B
Card L13Weekly income Annual incomeBefore tax Letter Before tax
Less than £77 Q Less than £4,000
£77-£115 T £4,000 - £5,999
£116-£154 O £6,000-£7,999
£155-£192 K £8,000-£9,999
£193-£230 L £10,000-£11,999
£231-£289 B £12,000-£14,999
£290-£346 Z £15,000-£17,999
£347-£385 M £18,000-£19,999
£386-£442 F £20,000-£22,999
£443-£500 J £23,000-£25,999
£501-£558 D £26,000-£28,999
£559-£615 H £29,000-£31,999
£616-£730 A £32,000-£37,999
£731-£845 W £38,000-£43,999
£846-£961 G £44,000-£49,999
£962-£1,076 N £50,000-£55,999
£1,077 or more E £56,000 or more

If you would like this publication in an alternative format, please contact us. Web: www.odi.gov.ukPost: Office for Disability Issues, Ground Floor, Caxton House, 6-12 Tothill Street, London, SW1H 9NAEmail: [email protected]: 020 7340 4000ISBN: 978-1-84947-501-3Produced by the Office for Disability Issues, January 2011© Crown Copyright 2010
You may re-use this publication (not including images or logos) free of charge in any format or medium, under the terms of the Open Government Licence. To find out more about this licence visit www.odi.gov.uk/copyright