PUBLIC PERCEPTIONS OF BIOENERGY IN THE UK
19
An insights report from the Energy Technologies Institute PUBLIC PERCEPTIONS OF BIOENERGY IN THE UK
Transcript of PUBLIC PERCEPTIONS OF BIOENERGY IN THE UK

An insights report from the Energy Technologies Institute
PUBLIC PERCEPTIONS OF BIOENERGY IN THE UK

www.eti.co.ukEnergy Technologies Institute02 0302 03 Energy Technologies Institute
Contents
04 Key Headlines
06 Context
08 Bioenergy is well supported but targeted efforts to raise public awareness would benefit the sector
16 Bioenergy is associated with several positive features, but two areas of concern need to be addressed
20 Public perceptions towards domestic and imported biomass feedstocks
32 There is no strong preference for technologies to be built at a particular scale or location – allowing the UK to pursue optimal choices
34 Next Steps: Growing the bioenergy sector
35 About the authors
35 Acknowledgements
PUBLIC PERCEPTIONS OF BIOENERGY IN THE UK
Bioenergy makes up
Results from a YouGov survey of 5,307 GB adults
Context
Conclusions
and
of the UK’s renewables sources
‘Generating energy from waste’ and being a ‘renewable source of energy’ are seen as the most positive features of bioenergy
The Government is the most popular choice to lead the development of the UK bioenergy sector
Building a UK bioenergy sector with continued public backing will require greater support for domestic production and increased awareness of the benefits bioenergy can bring
The public would be comfortable with a mix of imported and domestic biomass feedstocks, provided imports are used in addition to, not instead of, domestic resources
of respondents were concerned about biomass competing with other land uses such as food production, but ETI case studies have shown that they can complement each other
Over
of the renewable energy produced in the UK
73% 59%of respondents support an increase in bioenergy use in the UK
support producing bioenergy from biomass and
support producing bioenergy from waste
80% 74%
1/3
81%(Source: Dukes 2016)

www.eti.co.ukEnergy Technologies Institute04 05
Key Headlines
There is strong public support for producing bioenergy in the UK from both biomass and waste, with 80% of respondents in favour of bioenergy playing a bigger part in the UK energy mix. Levels of support for bioenergy compare favourably with levels of support seen for other renewable energy technologies.
Respondents associate bioenergy with a wide range of positive features, particularly the fact that bioenergy can be generated from waste materials. It is also seen as a renewable source of energy that can reduce the UK’s dependence on fossil fuels.
Over a third of respondents were concerned about the potential for biomass feedstocks to compete with other land uses, such as food production. However, over half of respondents thought that land in the UK could be used more productively. ETI case studies have shown that biomass feedstocks can be planted successfully on otherwise low-yielding land, and when sited considerately, can complement, rather than compete with, food production.
A significant reliance on imported biomass was viewed negatively by survey respondents. However, respondents were also concerned about the impacts of importing food and other fuels, suggesting that concerns over imports are not limited to biomass feedstocks. Some concerns may be alleviated by demonstrating that imported biomass is used in addition to, rather than instead of, feedstocks that can be sourced in the UK.
There is no significant preference for bioenergy to be generated in either rural or urban locations, or at a particular scale.
The UK Government is the most popular choice to lead the development of the bioenergy sector. However respondents also value the role of scientists/academics, environmental groups and consumer/industry watchdogs, and identified them as the most reliable sources of information about bioenergy. This presents an opportunity for different organisations to work together to increase awareness and understanding of bioenergy, in parallel to developing the bioenergy sector in the UK.
Source: Iggesund Paperboard Workington, Cumbria. SRC Willow planting. www.biofuel.iggesund.co.uk

www.eti.co.ukEnergy Technologies Institute06 07
Why bioenergy?
Bioenergy can play a significant and valuable role in the future UK energy system, helping reduce the cost of meeting the UK’s 2050 greenhouse gas (GHG) emissions reduction targets by more than 1% of gross domestic product (GDP).
The Energy Technologies Institute’s (ETI) analysis using its internationally peer-reviewed national energy system design and planning capability Energy System Modelling Environment (ESME)1 suggests that bioenergy, in combination with Carbon Capture and Storage (CCS), could meet around 10% of projected UK energy demand, which is consistent with the conclusions of the UK’s Bioenergy Strategy2, whilst delivering net negative emissions of approximately -55Mt CO2 per year in the 2050s. This is roughly equivalent to half the UK’s emissions target in 2050 and reduces the need for more expensive decarbonisation measures in other sectors such as aviation and shipping. In the absence of CCS, bioenergy is still a cost-effective means of decarbonisation and should play an important role in meeting the 2050 emissions target.
The role of the eTi
The ETI was established in 2007 to identify and accelerate the development of low carbon technologies to help the UK address its long term emissions reduction targets, as well as delivering nearer term benefits. Given the importance of bioenergy in decarbonising the wider energy
system, the ETI’s bioenergy programme was established to address knowledge gaps within the sector, in order to better assess and understand the potential for bioenergy in the UK. In particular, the programme has sought to increase understanding of the ability for UK bioenergy value chains to deliver genuine carbon savings, and identify and accelerate technologies and pathways offering greatest potential3.
Public opinion
Along with Government support, delivering a bioenergy sector of the scale suggested by our ESME analysis, will be dependent on levels of public support, not just in terms of ensuring new bioenergy generation facilities can obtain planning permission, but also in determining the number of farmers and foresters prepared to plant new bioenergy crops, and whether individuals are willing to install biomass boilers in their homes or workplaces.
To complement its existing analysis of the bioenergy sector, the ETI wanted to find out more about current public opinion of bioenergy in the UK and the potential drivers behind those opinions. To do this the ETI developed a survey which was carried out by YouGov in 20154. An extended version of the survey was repeated in 2016. This insights report presents findings from both surveys, with an emphasis on the 2016 survey results.
COnTeXT
1 For more information about ESME, please see: http://www.eti.co.uk/programmes/strategy/esme
2 HM Government (2012). UK Bioenergy Strategy. Available at: https://www.gov.uk/government/publications/uk-bioenergy-strategy
3 Newton-Cross, G. (2016). Delivering greenhouse gas emission savings through UK bioenergy value chains. Available at: http://www.eti.co.uk/insights/delivering-greenhouse-gas-emission-savings-through-uk-bioenergy-value-chains
4 ETI (2016). Public Perceptions of Bioenergy in the UK. Available at: https://d2umxnkyjne36n.cloudfront.net/insightReports/Public-Perceptions-of-Bioenergy-_-August-2015_V2-1.pdf?mtime=20161115150205
survey details
In 2015, the survey was carried out between the 21st and 24th August. The total sample size was 3,105 GB adults. In 2016, the survey was undertaken between the 7th and 12th September. The total sample size was 5,307 GB adults. In both years the survey was carried out online by YouGov.
Survey figures, unless otherwise stated, are from YouGov and represent the 2016 results. The figures have been weighted and are representative of all GB adults (aged 18+).
Any percentages calculated based on fewer than 50 respondents do not represent a wide enough cross-section of the target population to be considered statistically reliable.
The questionnaires used in the 2015 and 2016 surveys are provided on the ETI website.
The questionnaire was developed by the ETI and reviewed by specialists in social science research.
2015
3,105In 2015, the survey was carried out between the 21st and 24th August. The total sample size was 3,105 GB adults
2016
5,307In 2016, the survey was undertaken between the 7th and 12th September. The total sample size was 5,307 GB adults

www.eti.co.ukEnergy Technologies Institute08 09
There is consistent, strong public support for producing bioenergy in the UK from both biomass and waste.
In 2016, 74% of respondents supported producing bioenergy from biomass (a small increase from 72% in 2015), while 81% supported biomass from waste in both years. Levels of opposition to bioenergy from both biomass
and waste were extremely low in both years at around 2% (Figure 1). When asked whether respondents thought the use of bioenergy in the UK should increase, decrease, stay the same, or not be used at all, 80% supported an increase in bioenergy use in the UK, with only 2% in favour of reducing or stopping the use of bioenergy5.
support for bioenergy compares favourably with other renewable energy technologies.
Figure 2 shows that the majority of respondents were in favour of using a range of renewable technologies in the UK with bioenergy from waste gaining the greatest support (81%), closely followed by solar panels on roofs (80%). Bioenergy
from biomass (74%) had similar levels of support to offshore wind (75%) and marine turbines (73%). Onshore wind and solar panels on fields were least supported, but still gained the support of 65% and 67% of respondents, respectively.
BiOenergy is Well sUPPOrTed BUT TargeTed effOrTs TO raise PUBliC aWareness WOUld BenefiT THe seCTOr
5 Respondents were asked this question after being informed that bioenergy currently meets 5% of the UK’s total energy demand.
figure 1 Q. In general, to what extent do you support or oppose the use of waste/biomass to produce bioenergy in the UK?
figure 2Q. In general, to what extent do you support or oppose the use of each of the following renewable energy technologies to produce energy in the UK?
Bioenergy from biomass
Bioenergy from waste
5%
10%
15%
20%
25%
45%41% 41%40%
16%
12%
2% 1% 0.4%1%
8%
6%
32%
40%
35%
30%
0%
Strongly support
% re
spon
dent
s
Tend to support
Tend to oppose
Neither support nor
oppose
Strongly oppose
Don’t know
Solar parks – panels installed in fields
Marine turbines
Bioenergy from biomass
Offshore wind energy
Solar panels installed on roofs
Bioenergy from waste
0% 10% 20% 30% 40% 50% 60% 70% 80% 90% 100%
Onshore wind energy
% respondents
Support
Neither support nor oppose
Oppose
Don’t know

www.eti.co.ukEnergy Technologies Institute10 11
The Department for Business, Energy and Industrial Strategy (BEIS)6 Energy and Climate Change Public Attitudes Tracking Survey, a quarterly survey carried out to gauge public opinion of energy and climate change issues, has tracked support for different forms of renewable energy since March 20127, 8 (Figure 3). Interestingly, while the BEIS tracker and the ETI survey report similar levels of support for onshore and offshore wind, the ETI’s surveys in 2015 and 2016 reported much higher levels of support for bioenergy (72-81% across bioenergy from biomass and waste) than have ever been reported in the BEIS tracker (60-65%). While it is impossible, without further investigation, to understand the reason for this difference, given that the ETI’s survey found that most people said
they knew little, if anything, about bioenergy prior to taking the survey, the difference in response may have been influenced by differences in the way the questions were presented and the explanation of bioenergy that was provided with each questionnaire9.
Support for solar energy in the BEIS tracker (80-85%) is similar to the level of support for solar panels on roofs seen in the 2016 ETI survey (80%). However, the ETI survey found significantly lower levels of support for solar parks (panels installed in fields, 67%) – a distinction not made in the BEIS tracker, but one which perhaps could be considered in the future.
6 Department for Business, Energy and Industrial Strategy
7 All sources in this document that contain public sector information are available licensed under the Open Government Licence V3.0. Available at: https://www.nationalarchives.gov.uk/doc/open-government-licence/version/3/
8 BEIS (2016). Energy and Climate Change Public Attitudes Tracking Survey (formerly the DECC Public Attitudes Tracking Survey). Available at: https://www.gov.uk/government/collections/public-attitudes-tracking-survey
9 In the BEIS tracker, respondents are asked, “Generally speaking, do you support or oppose the use of the following renewable energy developments [order randomised]: a) onshore wind, b) biomass – this includes any plant or animal base material such as wood, specially grown energy crops, and other organic wastes that can be used in the process of creating energy, c) offshore wind, d) wave and tidal, e) solar. In the ETI survey respondents were asked, “In general, to what extent do you support or oppose the use of waste/biomass to produce bioenergy in the UK?”. Prior to this question they were provided with a short explanation of bioenergy which is set out in the questionnaire available on the ETI website.
10 DECC (2014). Public attitudes tracking survey: technical note. Available at: https://www.gov.uk/government/publications/public-attitudes-tracker-technical-note-on-use-of-wave-1-and-wave-2-datasets
figure 3Q. Generally speaking, do you support or oppose the use of the following renewable energy developments? (BEIS tracker, waves 1-17, sample size 1,981 – 2,124, weighted for UK adult population aged 16+. Data were weighted for the following characteristics: sex, age, social grade, region and tenure)10.
Bioenergy is well supported but targeted efforts to raise public awareness would benefit the sector Continued
60
55
65
70
75
80
85
90
50
Mar-
12
May
-12Ju
l-12
Sep-12
Nov-12
Jan-13
Mar-
13
May
-13Ju
l-13
Sep-13
Nov-13
Jan-14
Mar-
14
May
-14Ju
l-14
Sep-14
Nov-14
Jan-15
Mar-
15
May
-15Ju
l-15
Sep-15
Nov-15
Jan-16
Mar-
16
% re
spon
dent
s w
ho s
uppo
rt e
ach
tech
nolo
gy
Solar
Offshore wind
Wave and tidal
Onshore wind
Biomass

www.eti.co.ukEnergy Technologies Institute12 13
in the 2016 eTi survey, over 70% of the respondents had heard of bioenergy prior to the survey, but 61% said they knew little, or nothing, about it.
More people associate bioenergy with waste feedstocks such as agricultural waste (45%), than with biomass feedstocks such as forestry (21%), but bioenergy is not associated with a single end vector.
When asked what forms bioenergy could take11, 44% associated bioenergy with electricity and 42% with heat, followed by transport fuels (37%) and gas (33%). This suggests that there is some awareness of the flexibility bioenergy can
provide in the UK energy system. However, 27% of respondents said that they didn’t know what forms bioenergy could take.
There was very limited public awareness of the size of the role bioenergy currently plays in meeting our renewable energy targets, as shown in Figure 4. Bioenergy actually makes up 73% of renewable energy sources (Figure 5) and (after accounting for losses in the production of bioelectricity) 59% of renewable energy produced in the UK12. These results show that there is scope to increase public understanding of the role of bioenergy in the UK and its importance in the current, as well as future, energy mix.
11 Selecting multiple options from a randomised list: Transport fuels, Heat, Electricity, Gas, Industrial chemicals, Household insulation, Food or Other. Respondents could also select ‘Don’t know’.
12 BEIS (2016). Digest of UK Energy Statistics (DUKES). [online]. Available at: https://www.gov.uk/government/collections/digest-of-uk-energy-statistics-dukes
13 BEIS (2016). Digest of UK Energy Statistics (DUKES) [online]. Available at: https://www.gov.uk/government/collections/digest-of-uk-energy-statistics-dukes
figure 4 Q. Approximately, what percentage, if any, of renewable energy currently used in the UK do you think comes from bioenergy?
figure 5 Sources of renewable energy in the UK, 2015. Figures represent total supply used for energy in TWh13
Bioenergy is well supported but targeted efforts to raise public awareness would benefit the sector Continued
Hydro 6.29
solar PV 7.56
Wind 40.31
Bioelectricity 98.27
Bioheat 41.18
Biofuels 11.67
Heat pumps 1.96
solar Thermal 0.60
Electricity Heat Transport98.27
41.18
11.67
40.31
76-100
51-75
26-50
11-25
0-10
0% 20% 40% 60% 80% 100%90%70%50%30%10%
1%
1%
12%
23%
62%
% U
K re
new
able
ene
rgy
% respondents
Correct answer = 59%

www.eti.co.ukEnergy Technologies Institute14 15
figure 6Q. In general, to what extent do you support or oppose the use of biomass to produce bioenergy in the UK? Results shown by level of pre-existing knowledge of bioenergy (where n = number of respondents in each knowledge category).
figure 7Q. The use of bioenergy in the UK is increasing. Some people believe that the direction and expansion of the bioenergy sector should be led by an organisation. Which ONE, if any, of the following do you think should be the MAIN leader of the bioenergy sector?
figure 8Q. Please imagine you were interested in finding out more information on bioenergy... Which, if any, of the following would you trust to give you reliable information? Select all that apply.When asked who, if anyone, should lead
the expansion of the bioenergy sector, the Government was the most popular choice, selected by 31% of respondents. 17% of respondents selected industry/energy companies, 15% chose academics and environmental scientists, while 12% said a biomass supplier association would be their preferred leader (Figure 7). However, when asked who they would trust to give them reliable information about
bioenergy, respondents most valued the role of scientists/academics, independent consumer/industry watchdogs, and environmental groups, as reliable, trustworthy sources of information (Figure 8). This presents an opportunity for different organisations to work together to increase awareness and understanding of bioenergy, in parallel to developing the bioenergy sector in the UK.
Bioenergy is well supported but targeted efforts to raise public awareness would benefit the sector Continued
Not applicable – no one should lead the
direction and expansion of the bioenergy sector
Other
Don’t know
A biomass supplier association
Academics and environmental
scientists
Industry/energy companies
The UK Government
0% 20% 40% 60%
% respondents
% respondents
80% 100%90%70%50%30%10%
5%
1%
20%
12%
17%
15%
31%
Not applicable – I wouldn’t trust anyone to give me reliable
information about bioenergy
Other
Don’t know
Social media
A close friend and/or relative
Scientists/academics or experts in the field
An independent consumer or industry watchdog
Conservation/environmental interest groups
The UK Government
Television programmes
Newspapers
A company operating in the bioenergy sector
0% 20% 40% 60% 80% 100%90%70%50%30%10%
7%
2%
19%
11%
6%
20%
11%
43%
7%
31%
16%
51%
Strongly support
Tend to support
Neither support nor oppose
Tend to oppose
Strongly oppose
Don’t know
increasing public awareness and understanding of bioenergy appears to improve public opinion of it, as those who had heard of bioenergy (prior to the survey) were more likely to support it than those who had not. The more knowledgeable respondents were more likely to strongly support bioenergy than those who said they knew nothing about it (figure 6).
Slightly higher levels of opposition were also seen amongst those who said they knew a great deal about bioenergy; however, due to the small number of people who said they opposed bioenergy from biomass, the difference between levels of opposition across the knowledge categories cannot be said to be statistically significant14.
14 Any percentages calculated on bases fewer than 50 respondents do not represent a wide enough cross-section of the target population to be considered statistically reliable.
Yes – I had heard of it, and I know a great deal about it
n = 496
n = 1,847
n = 1,402
n = 1,432
n = 130
Yes – I had heard of it, and I know a fair amount about it
Yes – I had heard of it, and I know a little about it
Yes – I had heard of it, but I know nothing about it
0% 10% 20% 30% 40% 50% 60% 70% 80% 90% 100%
No – I had never heard of bioenergy
% respondents
www.eti.co.ukEnergy Technologies Institute16 17
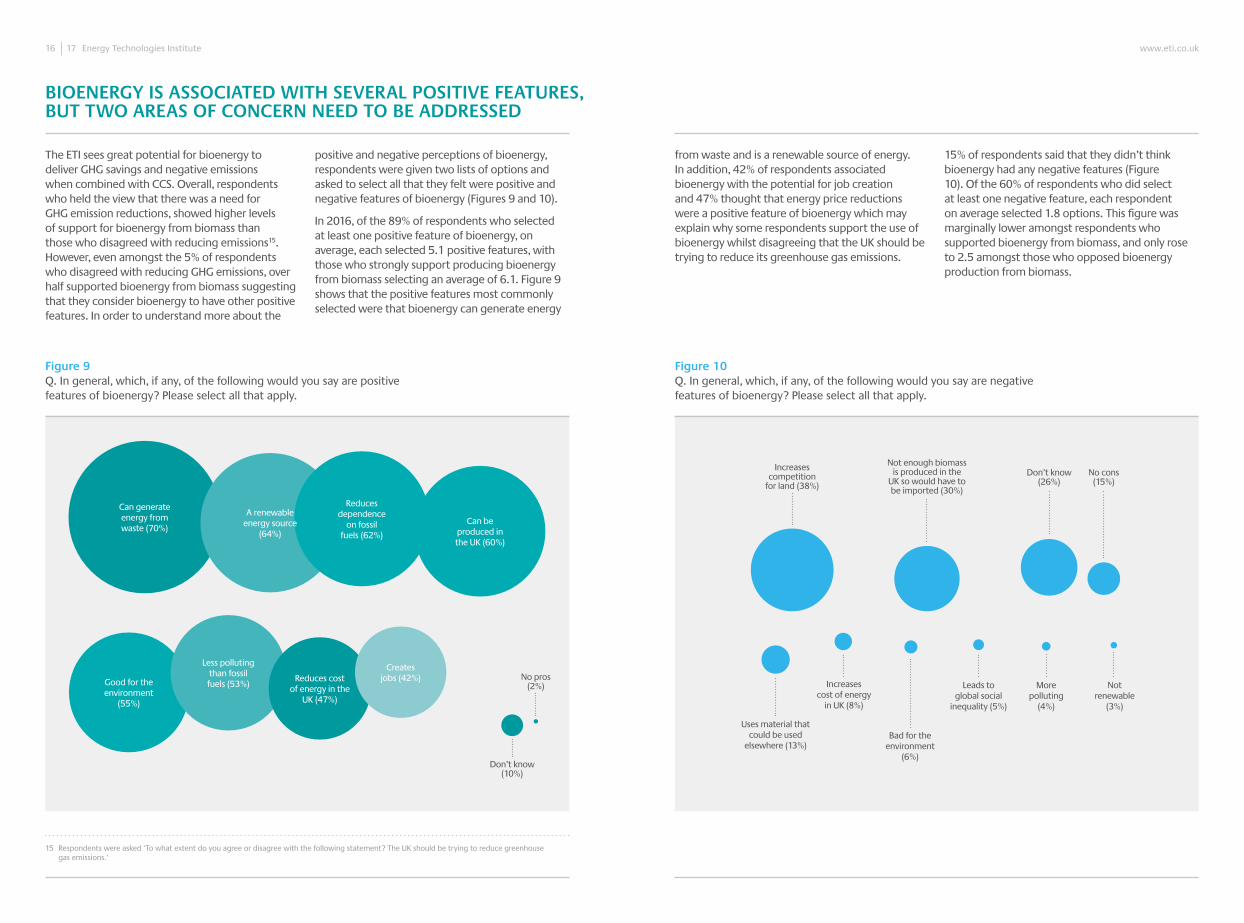
The ETI sees great potential for bioenergy to deliver GHG savings and negative emissions when combined with CCS. Overall, respondents who held the view that there was a need for GHG emission reductions, showed higher levels of support for bioenergy from biomass than those who disagreed with reducing emissions15. However, even amongst the 5% of respondents who disagreed with reducing GHG emissions, over half supported bioenergy from biomass suggesting that they consider bioenergy to have other positive features. In order to understand more about the
positive and negative perceptions of bioenergy, respondents were given two lists of options and asked to select all that they felt were positive and negative features of bioenergy (Figures 9 and 10).
In 2016, of the 89% of respondents who selected at least one positive feature of bioenergy, on average, each selected 5.1 positive features, with those who strongly support producing bioenergy from biomass selecting an average of 6.1. Figure 9 shows that the positive features most commonly selected were that bioenergy can generate energy
from waste and is a renewable source of energy. In addition, 42% of respondents associated bioenergy with the potential for job creation and 47% thought that energy price reductions were a positive feature of bioenergy which may explain why some respondents support the use of bioenergy whilst disagreeing that the UK should be trying to reduce its greenhouse gas emissions.
15% of respondents said that they didn’t think bioenergy had any negative features (Figure 10). Of the 60% of respondents who did select at least one negative feature, each respondent on average selected 1.8 options. This figure was marginally lower amongst respondents who supported bioenergy from biomass, and only rose to 2.5 amongst those who opposed bioenergy production from biomass.
BiOenergy is assOCiaTed WiTH seVeral POsiTiVe feaTUres, BUT TWO areas Of COnCern need TO Be addressed
15 Respondents were asked ‘To what extent do you agree or disagree with the following statement? The UK should be trying to reduce greenhouse gas emissions.‘
figure 9Q. In general, which, if any, of the following would you say are positive features of bioenergy? Please select all that apply.
figure 10Q. In general, which, if any, of the following would you say are negative features of bioenergy? Please select all that apply.
A renewable energy source
(64%)Can be
produced in the UK (60%)
Less polluting than fossil fuels (53%)
Reduces cost of energy in the
UK (47%)
Don’t know (10%)
No pros (2%)
Can generate energy from waste (70%)
Reduces dependence
on fossil fuels (62%)
Good for the environment
(55%)
Creates jobs (42%)
Increases competition
for land (38%)
Uses material that could be used
elsewhere (13%)
Increases cost of energy
in UK (8%)
Leads to global social
inequality (5%)
Not renewable
(3%)
Bad for the environment
(6%)
More polluting
(4%)
Not enough biomass is produced in the
UK so would have to be imported (30%)
Don’t know (26%)
No cons (15%)

www.eti.co.ukEnergy Technologies Institute18 19
Concerns around potential increases in competition for land and the need to rely on imported biomass feedstock were prominent regardless of a respondent’s level of support for bioenergy. Only amongst those who opposed the use of bioenergy did other factors such as concerns over the impact on the environment, or using materials that could be used elsewhere, feature as highly (Figure 11).
Delivering a bioenergy sector of the scale anticipated to cost-effectively meet the UK’s 2050 GHG targets is likely to rely on both domestic and imported biomass feedstocks. Therefore, in 2016 additional questions were asked in order to understand more about respondents’ attitudes towards land use in the UK and imported goods. Findings from these questions are addressed in the next section.
figure 11Q. In general, which, if any, of the following would you say are negative features of bioenergy? Responses show by level of support for bioenergy from biomass, where n=number of respondents in each category. Responses from those who ‘tend to oppose’ and ‘strongly oppose’ bioenergy have been combined due to the small (<50) number of responses in the strongly oppose category. For clarity, ‘strongly support’ and ‘tend to support’ have also been combined.
Bioenergy is associated with several positive features, but two areas of concern need to be addressed Continued
Increases competition for land (e.g. biomass might displace food crops)
More polluting (i.e. it has higher greenhouse gas emissions than fossil fuels)
Uses material that could be used elsewhere
Bad for the environment
Leads to global social inequality
Not enough biomass is produced in the UK, so it would have to be imported
Increases the cost of energy in the UK
Not a renewable source of energy
Other
Don’t know
Not applicable – I think bioenergy has no negative features
10%
20%
30%
40%
50%
70%
60%
0%
Support n = 3,901
% o
f res
pond
ents
with
in e
ach
leve
l of s
uppo
rt
cate
gory
who
sel
ecte
d ea
ch fe
atur
e
Neither support nor oppose n = 846
Don’t know n = 449
Oppose n = 111
Source: Iggesund Paperboard Workington, Cumbria - SRC Willow Crop Harvested October 2016

www.eti.co.ukEnergy Technologies Institute20 21
PUBliC PerCePTiOns TOWards dOmesTiC and imPOrTed BiOmass feedsTOCKs
16 The ETI’s Energy from Waste project analysis estimates that there will be around 8Mt/yr available waste arisings in the near term. This is in line with findings from the Green Investment Bank who have estimated that in 2020 there will be an annual capacity gap of between 4 – 7.7 Mt of residual waste arisings, based on existing and planned developments at the time of writing. GIB (2014). The UK Residual Waste Market. Available at: http://www.greeninvestmentbank.com/media/25376/gib-residual-waste-report-july-2014-final.pdf
17 The Waste Hierarchy states that firstly waste arisings should be prevented. Where this is not possible waste should be re-used or recycled. Only then should waste be considered for energy recovery. The final option in the waste hierarchy is disposal (landfill).
18 BEIS (2016). Digest of UK Energy Statistics (DUKES) [online]. Available at: https://www.gov.uk/government/collections/digest-of-uk-energy-statistics-dukes
figure 12Bioenergy feedstock sources in the UK, 201518
The ETI’s analysis emphasises the importance of bioenergy in meeting the UK’s 2050 GHG targets cost-effectively. For bioenergy to fulfil its potential, the UK will need to increase its use of both biomass and waste feedstocks, initially making use of available waste arisings, but in the longer term increasing the use of biomass feedstocks to meet demand. While there are opportunities to use waste resources more effectively and divert additional waste from landfill16, energy from waste should be carried out in accordance with the principles of the Waste Hierarchy17 and therefore there will always be a constraint on the total amount of waste material that can be used to
generate energy. As recycling rates increase, the amount of material available to the Energy from Waste market is likely to decrease and the quality (or calorific value) of the waste ‘fuel’ will also be affected as its composition changes. This trend is already being seen in the UK bioenergy sector where, in recent years, the proportion of energy generated from biomass feedstocks, from both domestic and imported sources, has increased at a greater rate than that from waste. In 2015, plant-based biomass contributed 47% of all bioenergy feedstock inputs (Figure 12).
Source: DUKES (2016), Table 6.1 Renewables and Waste Commodity Balances 2015 / Summarised by Energy Technologies Institute LLP

www.eti.co.ukEnergy Technologies Institute22 23
19 Current area of energy crops taken from: Defra (2015). Area of crops grown for bioenergy in England and the UK: 2008-2014. Available at: https://www.gov.uk/government/statistics/area-of-crops-grown-for-bioenergy-in-england-and-the-uk-2008-2014
20 Newton-Cross, G. (2016). Delivering greenhouse gas emission savings through UK bioenergy value chains. Available at: http://www.eti.co.uk/insights/delivering-greenhouse-gas-emission-savings-through-uk-bioenergy-value-chains
21 Newton-Cross, G. (2016). The evidence for deploying bioenergy with CCS (BECCS) in the UK. Figure 2, page 12. Available at: http://www.eti.co.uk/insights/the-evidence-for-deploying-bioenergy-with-ccs-beccs-in-the-uk
22 Evans, H. (2016). Bioenergy crops in the UK. Case studies of successful whole farm integration. Available at: http://www.eti.co.uk/library/an-eti-perspective-bioenergy-crops-in-the-uk-case-studies-of-successful-whole-farm-integration
UK land should be managed to increase productivity
ETI analysis suggests that steadily increasing the area of land in the UK used to grow energy crops, from the current area of 122 kha19, to around 1.4 Mha in the 2050s will make a significant contribution to delivering a bioenergy sector of the scale required to meet our emissions target. The ETI’s Ecosystem Land Use Modelling project has significantly increased understanding of the impacts of land-use change on soil carbon stocks, and enabled locations and land-use transitions that increase soil carbon stocks, or result in minimal soil carbon losses, to be identified20. The ETI’s Refining Estimates of Land for Biomass21 project has also identified opportunities to free up land for bioenergy crops out to 2050, including improvements in the productivity of grassland, and reductions in the surplus production of cereal crops. In the near term, there are examples of energy crop plantings which have demonstrated that, when sited sensibly, bioenergy crops can have minimal impact on food production and bring whole farm benefits in terms of income diversification and increased profits22.
The potential for bioenergy production to compete with other uses of land was perceived as a negative feature by 38% of respondents. However, when asked how their opinion of bioenergy would change under different import/domestic mixes, the majority of respondents (72%) said that their opinion of bioenergy would improve or stay the same if the UK sourced around half of its own biomass domestically. This increased to 83% if the UK sourced all of its bioenergy domestically, but 58% of respondents said their opinion of bioenergy would worsen if all biomass was imported (Figure 13). To try and understand more about how the public perceive land use in the UK and their concerns over importing biomass, we asked additional questions in 2016 to explore views on food and fuel self-sufficiency, land availability and use in the UK, and attitudes towards imported goods.
figure 13Q. Would your opinion of the use of bioenergy in the UK improve, worsen or stay the same if you were told that…
Public perceptions towards domestic and imported biomass feedstocks Continued
Improve significantly
Improve slightly
Stay the same
Worsen slightly
Worsen significantly
Don’t know
...the UK sourced about half of its own supply of biomass domestically
...the UK imported all of its biomass from overseas
% respondents
0% 10% 20% 30% 40% 50%
30%
41%
33%
18%
25%
27%
29%
11%
2%
2%
2%
1%
23%
15%
15%
14%
60% 70% 80% 90% 100%
...the UK sourced all of its biomass domestically
7%
7%

Over half of respondents (55%) think that there are opportunities to improve land management in the UK to increase productivity (figure 14) and, while most people would like to see the UK produce more of its own food and fuel, if agricultural land were to be ‘spared’, there is no clear preference amongst the public for how that land should be used.
www.eti.co.ukEnergy Technologies Institute24 25
Most respondents underestimated the extent to which the UK is self-sufficient in both food and fuel23. When asked to state (to the nearest 10%) the level of food self-sufficiency in the UK, 51% of respondents selected 50% or less. Only 13% correctly selected 60%24, while 21% thought food
self-sufficiency was 70% or higher and 15% said they didn’t know. A similar pattern was seen when respondents were asked about fuel for energy self-sufficiency (Figure 15)25.
23 Food self-sufficiency is measured as the value of food produced in the UK as a percentage of the value of food consumed in the UK. Fuel for energy self-sufficiency is measured as the energy content of fuel produced in the UK as a percentage of the energy content of fuel used in the UK to generate energy. Fuels include fossil fuels such as coal, oil and gas, biomass & waste, nuclear fuel and electricity produced directly from renewable sources such as wind turbines and solar panels. Energy includes heat, electricity, gas and transport fuels.
24 In 2015, self-sufficiency of food in the UK was 61%. Source: Defra (2016). Agriculture in the United Kingdom Datasets [online]. Available at: https://www.gov.uk/government/statistical-data-sets/agriculture-in-the-united-kingdom
25 The UK was 62% self-sufficient in fuel for energy in 2015. Source: BEIS (2016). Digest of UK Energy Statistics. Available at: https://www.gov.uk/government/collections/digest-of-uk-energy-statistics-dukes
Public perceptions towards domestic and imported biomass feedstocks Continued
figure 14Q. Still thinking about agricultural land availability in the UK... Which ONE, if any, of the following statements BEST describes your view?
Don’t know
There are significant areas of unused land in the UK and land that is used could be
better managed to increase productivity
None of these
There are significant areas of unused land in the UK, but the land that is used is already used productively
Almost all agricultural land in the UK is used for a purpose; however, there are opportunities to improve
land management and increase productivity
Almost all agricultural land in the UK is used productively – there is very little ‘spare’ land
or opportunity to increase productivity
0% 20% 40% 60% 80% 100%90%70%50%30%10%
23%
25%
2%
12%
7%
30%
% respondents
figure 15Q. Approximately, which ONE of the following percentages do you think represents the [food/fuel for energy] self-sufficiency of the UK?
4%
2%
8%
6%
10%
12%
14%
16%
20%
18%
0%
0% 10% 20% 30% 40% 50% 60% 70% 80% 90% 100% 110% 120% 130% 140% 150%or
more
Don’t know
% re
spon
dent
s
% self-sufficiency
Food
Fuel for Energy
Food and fuel self-sufficiency in the UK in 2015 (to the nearest 10%)

www.eti.co.ukEnergy Technologies Institute26 27
While these results suggest that the public would like to see an increase in food and fuel production in the UK, when asked about land use specifically, 36% of respondents were happy for land to be used in the most productive way for the country as a whole, with only 10% stating that food production should always be the priority (Figure 17) and when asked how ‘spare’ land in the UK should be used (in a situation where the UK was able to increase productivity to produce the same amount of food from a smaller area of land) only
15% (Figure 18) said they thought more food should be grown. As Figure 18 shows, 18% would favour the spare land being managed for nature and conservation, while 17% would use it to grow biomass for energy and 12% would like to see it planted with trees. Of course, these categories aren’t necessarily mutually exclusive – some previous studies have shown that forestry and second generation bioenergy crops26 can provide enhanced ecosystem services, including benefits to biodiversity27.
26 Second generation bioenergy crops are perennial grasses and woody crops such as Miscanthus, Short Rotation Coppice (SRC) Willow and Short Rotation Forestry (SRF)
27 Desirée J. Immerzeel, Pita A. Verweij, Floor van der Hilst and André P. C. Faaij (2013). Biodiversity impacts of bioenergy crop production: a state-of-the-art review. GCB Bioenergy, doi: 10.1111/gcbb.12067
McCalmont, J.P., Hastings, A., McNamara, N.P., Richter, G.M., Robson, P., Donnison, I.S. and Clifton-Brown, J. (2015) Environmental costs and benefits of growing Miscanthus for bioenergy in the UK. GCB Bioenergy, doi: 10.1111/gcbb.12294
Public perceptions towards domestic and imported biomass feedstocks Continued
figure 16Q. Please imagine the UK was to choose whether it used land (i.e. spare land, that was not being used) to increase its self-sufficiency in either food or energy... Which, if either, do you think the UK should prioritise, or do you think they should have equal priority?
% respondents
Increasing energy self-sufficiency
should be the priority
Increasing food self-sufficiency
should be the priority
They should have equal priority
Don’t know
10% 20% 30% 40% 50% 60% 70% 80% 90% 100%0%
26%
20%
43%
12%
figure 17Q. Which ONE, if any, of the following statements BEST describes how you think agricultural land (i.e. farmland) should be used in general?
Land should be used in a way that is most productive
for the country as a whole
Only when land is unsuitable for producing food should it be used to grow crops that will be used for bioenergy
Decisions on agricultural land use should be left to farmers
Food production should always be the priority, even if it results in a surplus (i.e.
there is too much of it)
Other
Don’t know
10% 20% 30% 40% 50% 60% 70% 80% 90% 100%0%
% respondents
10%
0.5%
15%
36%
26%
13%
After being informed of current levels for food and fuel self-sufficiency in the UK, 77% of respondents said that it matters to them a ‘great deal’ or a ‘fair amount’ that the UK is self-sufficient in food, and 71% said they would like to see the UK increase the amount of food it produces. Very similar results were seen when respondents were asked the same questions about fuel for energy self-sufficiency (78% and 70% respectively).
If the UK had the option to use land to increase food or fuel self-sufficiency, 43% of respondents thought they should have equal priority, while 26% thought fuel self-sufficiency should be prioritised and 20% opted for food self-sufficiency as their priority, as shown in Figure 16.

www.eti.co.ukEnergy Technologies Institute28 29
figure 18For the following question, please imagine that improvements in farming allowed the UK to produce the same amount of food on a smaller area of land, freeing up additional agricultural land (i.e. farmland) for other purposes... Which ONE, if any, of the following statements BEST describes how you think that additional land should be used?
These results suggest that, while there is a desire to improve production levels in the UK, thereby reducing reliance on imports, this is coupled with a range of opinions on how spare land should be used, reflecting the variety of purposes for which land is utilised. The desire to increase domestic food and fuel production raises an interesting question about the perceived link between self-sufficiency and security and whether respondents equate greater self-sufficiency with an equivalent increase in security of supply of that product.
In reality the self-sufficiency ratio is not an accurate proxy for food security as it fails to take into account many aspects of this complex issue. Defra28, who compile statistics on food self-sufficiency, note that:
The United Kingdom sources foods from diverse stable countries, mainly European countries, and imports can make up for domestic supply shortages. Diversity of supply enhances security.
A high food production to supply ratio (the self-sufficiency ratio) fails to insulate a country against many possible disruptions to its supply chain.
Production potential is more relevant at European Union (EU) level than United Kingdom level, given the amount of food the UK sources from the EU. The EU as a whole has a food production to supply ratio of around 90%29.
Overall, Figure 13 (page 22) would suggest that the majority of the public would accept a bioenergy sector that used roughly equal proportions of both domestic and imported biomass (although there is a preference for domestic feedstocks to be used where possible), and while there is a desire to increase domestic food and fuel production, the findings across Figures 14-18 (pages 24-28) also indicate a willingness for land to be used productively for a variety of purposes. Acceptance of biomass production in the UK could be increased by improving awareness of the additional benefits planting energy crops can bring. For example, highlighting how, when sited appropriately, second generation energy crops such as Short Rotation Coppice (SRC) Willow and Miscanthus, can improve local biodiversity and increase the productivity and profitability of otherwise low yielding land. This dialogue with the public needs to be maintained as the bioenergy sector grows, to demonstrate and provide reassurance that bioenergy cropping is being managed alongside food production to maximise productivity of land.
28 Defra (2016). Agriculture in the United Kingdom 2015. Available at: https://www.gov.uk/government/statistics/agriculture-in-the-united-kingdom-2015
29 As the UK Government prepares the framework for the UK exiting the EU, it must decide how farming in the UK will be supported outside of the EU’s Common Agricultural Policy (CAP) and the basis on which it will trade with the EU. However, given that the EU is currently the single largest source of imported food, EU food production and supply ratios will remain relevant to UK food security for the foreseeable future.
Public perceptions towards domestic and imported biomass feedstocks Continued
Managed for conservation and nature
Farmed to grow biomass for energy
Farmed to produce more food
Forested (i.e. grow trees)
Used for building new houses or other infrastructure
Other
Don’t know
Not applicable – I don’t have a preference for how additional
land should be used
10% 20% 30% 40% 50% 60% 70% 80% 90% 100%0%
% respondents
1%
18%
10%
18%
17%
15%
12%
7%

www.eti.co.ukEnergy Technologies Institute30 31
The public would be comfortable with a mix of imported and domestic biomass feedstocks, provided imports are used in addition to, not instead of, domestic resources.
The majority of respondents in 2016 (72%) said that their opinion of bioenergy from biomass would improve or stay the same if the UK sourced around half of its own biomass domestically. This increased to 83% if the UK sourced all of its bioenergy domestically, but 58% of respondents said their opinion of bioenergy would worsen if all biomass was imported (Figure 13).
In the 2016 survey we sought to understand whether respondents were concerned about a particular aspect or impact of importing biomass feedstock30, and whether they held the same concerns about other categories of import, namely food and fossil fuels.
The results found broadly similar levels of concern for imported food, fossil fuels and biomass across the four areas asked, but there were consistently slightly lower levels of concern associated with biomass compared to food and fossil fuel. These results show that concerns don’t relate to bioenergy alone, but are common to other goods which the UK has been importing for decades.
A separate question which asked respondents when they thought imports should be brought into the UK, found that over half of respondents felt that imports should only be used when production in the UK is not possible or to balance seasonal supply. This would suggest that demonstrating that imported biomass is used in addition to, rather than instead of, feedstocks that can be sourced in the UK, could alleviate some concerns around imports competing with UK production.
resources summary
Overall, there is strong support for bioenergy. Responses to the survey suggest that there would be broad acceptance of a mixture of domestic and imported feedstocks, such that the UK is not overly reliant on imports but can maintain at least current levels of food self-sufficiency. Whilst there are concerns over competition for land the responses also show a general desire to use land most productively and not always reserve it exclusively for food production.
Public perceptions towards domestic and imported biomass feedstocks Continued
Overall, there is strong support for bioenergy. reponses to the survey suggest that there would be broad acceptance of a mixture of domestic and imported feedstocks, such that the UK is not overly reliant on imports but can maintain at least current levels of food self-sufficiency.
30 Respondents were asked about their levels of concern regarding the security of supply, global environmental impact, food availability in the country of origin, and impact on UK production of importing food, fossil fuels and biomass for energy

www.eti.co.ukEnergy Technologies Institute32 33
THere is nO sTrOng PreferenCe fOr TeCHnOlOgies TO Be BUilT aT a ParTiCUlar sCale Or lOCaTiOn – allOWing THe UK TO PUrsUe OPTimal CHOiCes
The ETI’s Bioenergy Value Chain Model (BVCM) model was designed to answer variants of the question: What is the most effective way of delivering a particular bioenergy outcome in the UK, taking into account the available biomass resources, the geography of the UK, time, technology options and logistics networks?
The ETI’s insights paper on the future UK bioenergy sector31, shows that there is a role for bioenergy in a number of value chains, from large scale power and hydrogen with CCS clustered in coastal areas near to onshore hubs (the location at which CO2 is piped offshore to permanent geological stores), to smaller scale heat applications distributed throughout the country.
In the 2016 survey, respondents were asked what types of bioenergy technologies they would be in favour of using in the UK. Figure 19 shows that while installing biomass boilers in large buildings (schools, hospitals etc.) was the most popular option (supported by 49% of respondents), there was not a huge difference in the levels of support seen for other technology options. There also did not appear to be a correlation between size of installation and level of support, with the largest and smallest scale of technology receiving very similar levels of support (37% for domestic biomass boilers and 38% for large power stations).
A separate question was asked on the siting of biomass power stations. The results suggest that there is no significant preference for biomass power stations to be built in urban or rural locations (Figure 20). Comparing answers to both statements, less than 3% of respondents said that they disagreed with biomass stations being built in both rural and urban locations. Levels of opposition or support may vary with individual projects, however our experience through the three waste gasification projects32 which sought planning permission, was that little or no opposition was encountered at a local level.
Over the next 10 years as the UK prepares to transition to a low carbon energy system33, it is important that bioenergy can retain the flexibility to develop in a way that delivers the greatest benefit to the wider energy system. The responses to these questions suggest that there is no strong preference or opposition to bioenergy deployment at a particular scale or in a particular type of location, enabling the government to pursue deployments that produce the end vectors that are most valuable to the wider energy system, at the required scale, subject to local support for specific developments.
figure 19Bioenergy installations that generate electricity or heat come in various sizes. Which, if any, of the following bioenergy installations would you be in favour of being used in the UK? (Select all that apply)
figure 20Thinking about the construction of new biomass power stations... To what extent do you agree or disagree with the following statement?
31 Newton-Cross, G. (2015). Insights into the future UK bioenergy sector, gained using the ETI’s Bioenergy Value Chain Model (BVCM). Available at: http://www.eti.co.uk/insights/bioenergy-insights-into-the-future-uk-bioenergy-sector-gained-using-the-etis-bioenergy-value-chain-model-bvcm
32 ETI Bioenergy Waste Gasification Project. http://www.eti.co.uk/programmes/bioenergy/waste-gasification
33 Coleman, J and Haslett, A. (2015) Targets, technologies, infrastructure and investments – preparing the UK for the energy transition. Available at: http://www.eti.co.uk/insights/development-insight
Biomass boilers providing heat for large buildings (e.g. in/near schools, offices, hospitals etc.)
Small power stations providing electricity
for smaller areas
Biomass boilers providing heat for groups of houses (i.e. district
heating in/near households)
Large power stations providing electricity for larger areas
Domestic biomass boilers providing heat
for individual houses
Other
Don’t know
Not applicable – I wouldn’t be in favour of any bioenergy
installations being used in the UK
10% 20% 30% 40% 50% 60% 70% 80% 90% 100%0%
% respondents
% respondents
0.2%
23%
3%
49%
42%
40%
38%
37%
Strongly agree
Tend to agree
Neither agree nor disagree
Tend to disagree
Strongly disagree
Don’t know
36% 32% 11% 12%7%
30% 34% 15% 13%
10% 20% 30% 40% 50% 60% 70% 80% 90% 100%0%
Biomass power stations should be built in rural locations (e.g. close to where
biomass is grown)
Biomass power stations should be
built near urban centres (e.g. close
to where energy demand is greatest)
3%
2%
5%

www.eti.co.ukEnergy Technologies Institute34 35
neXT sTePs: grOWing THe BiOenergy seCTOr
Bioenergy is currently the largest source of renewable energy in the UK and can play a significant and valuable role in the future UK energy system, helping reduce the cost of meeting the UK’s 2050 GHG emissions reduction targets by more than 1% of gross domestic product (GDP).
The results from both the 2015 and 2016 public perceptions of bioenergy surveys show that there is strong support for bioenergy to be generated in the UK from both biomass and waste. Our findings would suggest that the majority of the public would accept a bioenergy sector that uses a mix of domestic and imported biomass, with a preference for domestic feedstocks to be used where possible. There is no strong preference for bioenergy being deployed at a particular scale or
in a particular location, enabling the UK to look to deploy those technologies that most benefit a transition to a low-carbon energy system.
These findings suggest that building a bioenergy sector in the UK whilst retaining public backing, will require the UK to increase support for domestic supply chains as well as enabling sustainably sourced imported biomass to be used to meet demand. In building a larger UK biomass feedstock sector, targeted awareness raising of bioenergy and the wider benefits it can bring is likely to increase support for it in the UK. Finally, the UK should continue to identify optimal sites for deployment of bioenergy, taking into account suitable locations for biomass feedstock production.
Hannah evans BSc, MSc
Strategy Analyst Bioenergy
Hannah joined the ETI in April 2014 as a Bioenergy Strategy Analyst. She has a background in energy policy with a BSc in Natural Sciences and a MSc in Environmental Technology.
01509 202040
aBOUT THe aUTHOrs
acknowledgements The ETI is grateful to all those who provided input and feedback to the public perceptions of bioenergy project, including Jack Moss (Imperial College London), Matt Lipson (Energy Systems Catapult), Darrick Evensen and Christina Demski (University of Cardiff), and Anna Wilson (YouGov).
fUrTHer reading frOm THe eTi
An insights report from the Energy Technologies Institute
THE EvIdENCE FOR dEPLOYING BIOENERGY wITH CCS (BECCS) IN THE UK
The evidence for deploying bioenergy with CCs (BeCCs) in the UKwww.eti.co.uk/insights/the-evidence-for-deploying-bioenergy-with-ccs-beccs-in-the-uk
delivering greenhouse gas emission savings through UK bioenergy value chainswww.eti.co.uk/insights/delivering-greenhouse-gas-emission-savings-through-uk-bioenergy-value-chains
an eTi Perspective Bioenergy crops in the UK. Case studies of successful whole farm integration.www.eti.co.uk/library/an-eti-perspective-bioenergy-crops-in-the-uk-case-studies-of-successful-whole-farm-integration
insights into the future UK Bioenergy sector, gained using the eTi’s Bioenergy Value Chain model (BVCm)http://www.eti.co.uk/insights/bioenergy-insights-into-the-future-uk-bioenergy-sector-gained-using-the-etis-bioenergy-value-chain-model-bvcm
An insights report by the Energy Technologies Institute
BioenergyInsights into the future UK Bioenergy Sector, gained using the ETI’s Bioenergy Value Chain Model (BVCM)
geraldine newton-Cross BSc, MRes, PhD
Strategy Manager Bioenergy
Geraldine joined the ETI in 2008. She is a multi-disciplined scientist with a PhD and Masters of Research, and has over 13 years experience in managing research and development.
01509 202052

Energy Technologies Institute36 36
© 2016 Energy Technologies Institute LLP
Energy Technologies Institute Holywell Building Holywell Way Loughborough LE11 3UZ
01509 202020
www.eti.co.uk
@the_ETI