Stormwater Management For Developed Municipalities What Residents Can Do What Towns Can Do.
Upload
kerry-reedCategory
view
214download
0
Public MeetingPublic MeetingNovember 9, 2010November 9, 2010
Agenda What is the Water Integrated Resources Plan
(WIRP)? How was the WIRP developed? What are the WIRP major findings? What are the WIRP Recommendations? How to provide input on the draft report? What are your thoughts on what is presented
today?

WIRP Mission StatementThe Pasadena Water Integrated Resources Plan will provide an achievable, long-term strategy to meet current and future water needs. The goals of the WIRP are to sustainably and cost-effectively address local and regional water supply and demand issues, reflect community values, and adapt to changing conditions.
Why is the WIRP Needed? Reliability and costs for imported water are
becoming more uncertain
Pasadena’s local groundwater is being reduced
WIRP is the source document for the City’s 2010 Urban Water Management Plan, which is required by state law to be submitted every five years

WIRP Stakeholder Input A WIRP Advisory
Committee, appointed by the Mayor, met 7 times to provide direction, input and ideas
Three (including this one) public meetings
Outreach via public polling on internet
Planning Assumptions All plans require projections and forecasts to
be made regarding growth, availability of water, price of water, etc.
California requires that utilities planning for water utilize “official” demographic projections
Pasadena recognizes these assumptions may not unfold exactly as planned

PWP’s Service Area Pasadena Water &
Power (PWP) serves the City and several other communities
WIRP represents a strategy to meet the entire service area
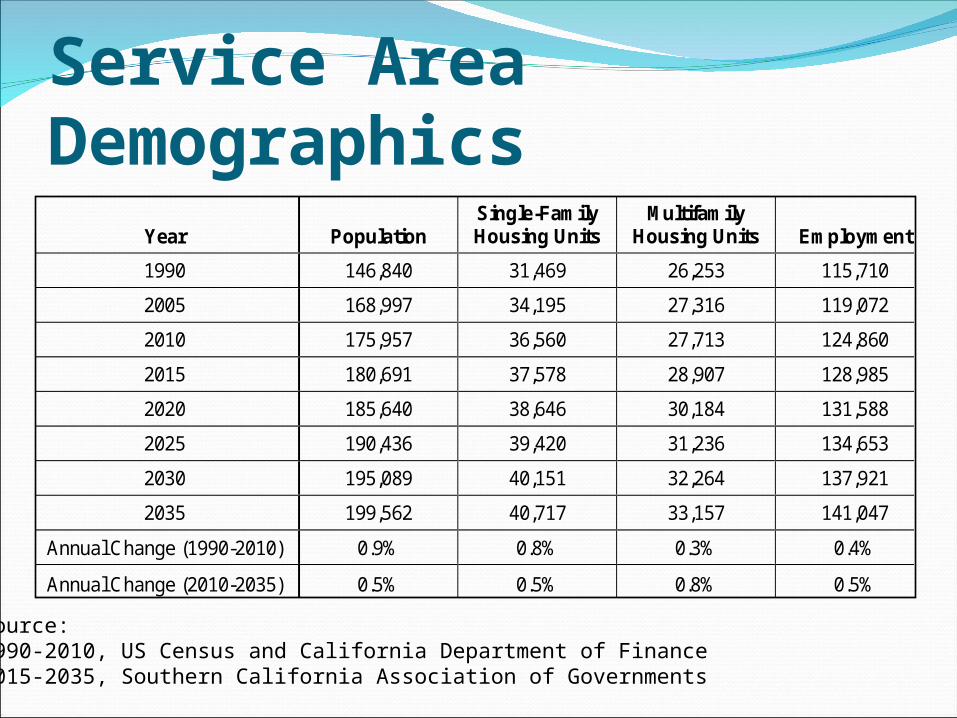
Service Area Demographics
Source:1990-2010, US Census and California Department of Finance2015-2035, Southern California Association of Governments
Year Population Single-Family Housing Units
Multifamily Housing Units Employment
1990 146,840 31,469 26,253 115,710
2005 168,997 34,195 27,316 119,072
2010 175,957 36,560 27,713 124,860
2015 180,691 37,578 28,907 128,985
2020 185,640 38,646 30,184 131,588
2025 190,436 39,420 31,236 134,653
2030 195,089 40,151 32,264 137,921
2035 199,562 40,717 33,157 141,047
Annual Change (1990-2010) 0.9% 0.8% 0.3% 0.4%
Annual Change (2010-2035) 0.5% 0.5% 0.8% 0.5%

-
5,000
10,000
15,000
20,000
25,000
30,000
35,000
40,000
45,000
50,000
1990 1995 2000 2005 2010 2015 2020 2025 2030 2035
Wat
er D
eman
d (A
cre-F
eet P
er Y
ear)
Actual Projected (average weather, no economicrecession, no additional conservation)
mandatory water restrictions & economic recession
mandatory water restrictions & economic recession
very wet & cool weather

Define Planning Objectives & Performance
Measures
RefineAnalysis(createhybrids)
AnalyzeAnalyzePortfoliosPortfolios
Raw PerformanceScore Card
RankRankPortfoliosPortfolios
Identify Supply Options(building blocks)
Build Portfolios(Combinations of Options)
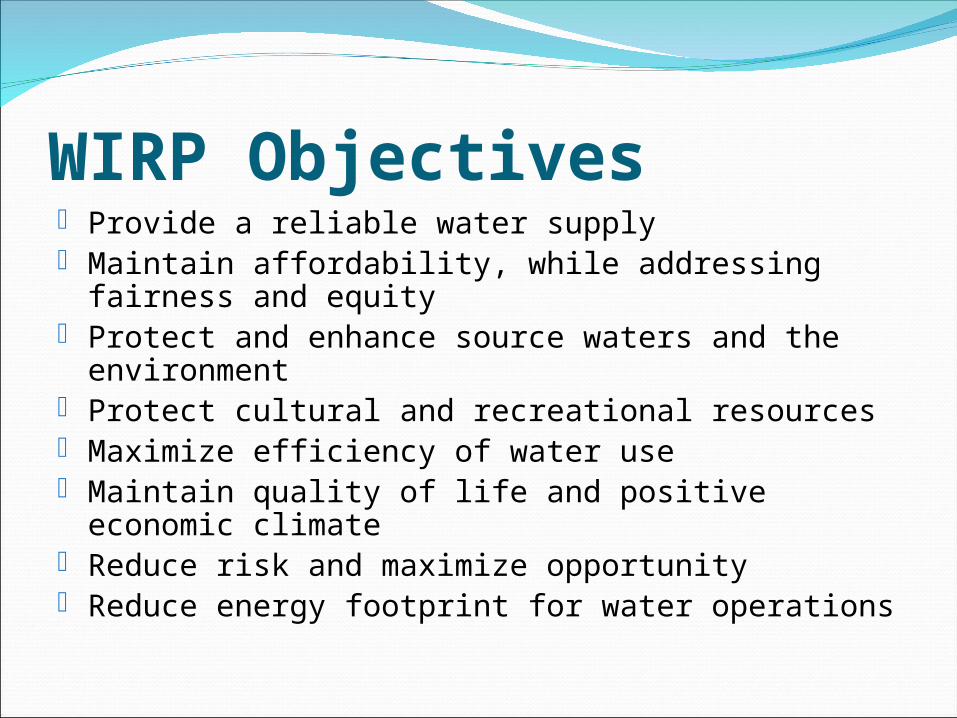
WIRP Objectives Provide a reliable water supply Maintain affordability, while addressing fairness and
equity Protect and enhance source waters and the
environment Protect cultural and recreational resources Maximize efficiency of water use Maintain quality of life and positive economic climate Reduce risk and maximize opportunity Reduce energy footprint for water operations
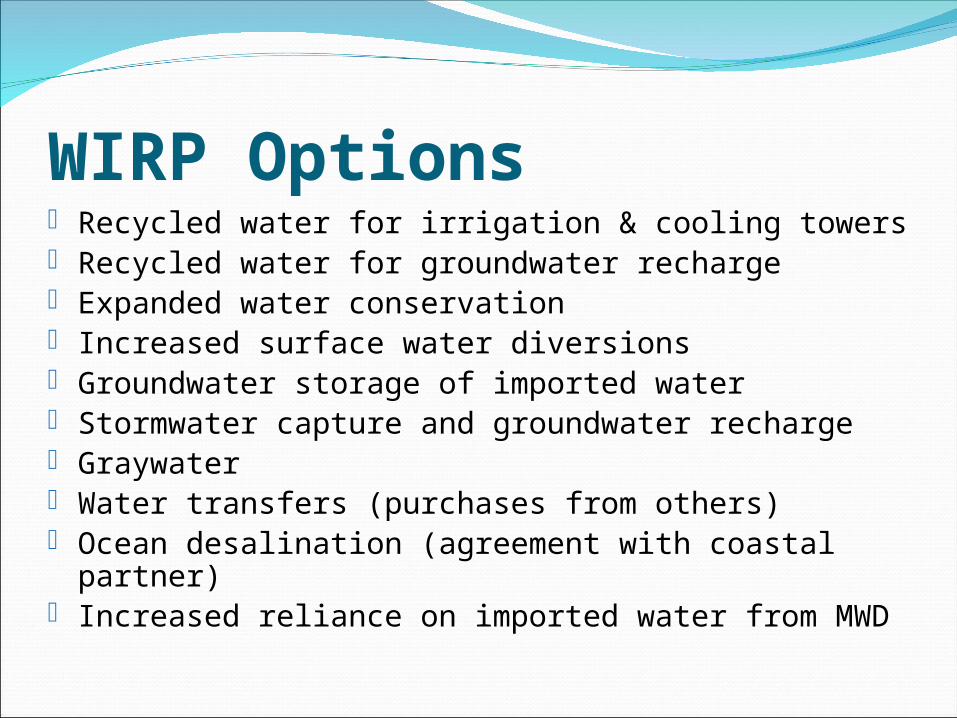
WIRP Options Recycled water for irrigation & cooling towers Recycled water for groundwater recharge Expanded water conservation Increased surface water diversions Groundwater storage of imported water Stormwater capture and groundwater recharge Graywater Water transfers (purchases from others) Ocean desalination (agreement with coastal partner) Increased reliance on imported water from MWD

Initial PortfoliosStatus Quo
Represents the “do nothing” future, and includes only existing groundwater and surface water diversions (it has the heaviest emphasis on imported water from MWD).
Minimize MWD SupplyRepresents the “do everything” future by maximizing use of all local options, as well as water transfers and ocean desalination.
Maximize StewardshipMaximizes “green” solutions such as maximum water conservation, all stormwater best management practices and graywater, and also enhances habitat restoration with environmental streamflows.
Low CostConsists of all options that have lower or comparable unit costs to the current price of MWD water.
Maximize Surface Water Supply and Groundwater Recharge
Maximizes use of local surface water diversions and enhanced groundwater recharge.
Non-potable Reuse (NPR)Maximizes recycled water to meet non-potable demands via a new non-potable water distribution system.
Combined NPR and Indirect Potable Reuse (IPR)
Maximizes recycled water for indirect potable reuse (via groundwater recharge), coupled with a smaller non-potable reuse system.

Hybrid PortfoliosAfter initial portfolios were analyzed, several other portfolios were created and evaluated
Hybrid 1Combines best elements of top performing initial alternatives and optimizes the size of projects in order to provide maximum benefits at lower cost
Hybrid 2
Starts by targeting top 10% of single-family residential users and applies very aggressive pricing in order to reduce demands by 70%, then implements other conservation programs to multifamily, commercial and the rest (90%) of single-family users.

Portfolio Rankings0 0.1 0.2 0.3 0.4 0.5 0.6 0.7 0.8 0.9
8 Hybrid 1
5 Maximize SW Supply/GW Recharge
2 Minimize MWD Supply
3 Maximize Stewardship
4 Low Cost
9 Top User Conservation
6 Non-potable Reuse (NPR)
7 Combined NPR and IPR
1 Status Quo
Ranking Score
Provide a reliable water supply Maintain affordability, while addressing fairness and equityProtect & enhance source waters and the environment Protect cultural & recreational resourcesMaximize efficiency of water use Maintain quality of life & positive economic climateReduce risk & maximize opportunities Reduce energy footprint for water operations
Hybrid 1
Max SW/GW
Min MWD Supply
Max Stewardship
Low Cost
Hybrid 2
NPR Recycled
NPR/IPR Recycled
Status Quo
The larger the color bar, the better it achieves the objective below
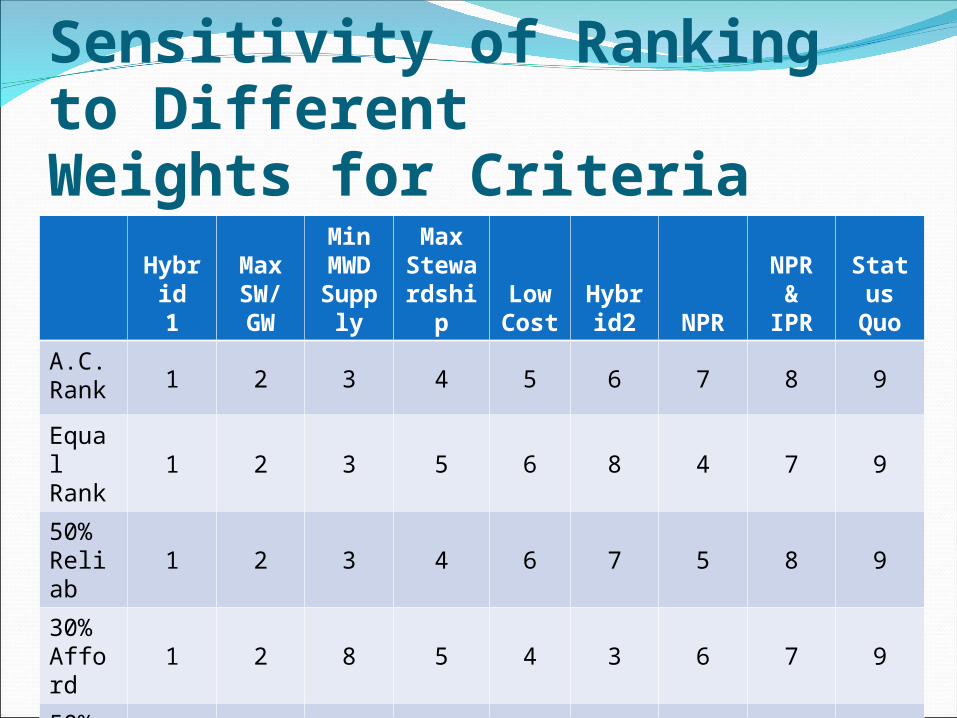
Sensitivity of Ranking to DifferentWeights for Criteria
Hybrid1
MaxSW/GW
MinMWD
Supply
MaxSteward
shipLowCost
Hybrid2 NPR
NPR &IPR
StatusQuo
A.C.Rank 1 2 3 4 5 6 7 8 9
EqualRank 1 2 3 5 6 8 4 7 9
50%Reliab 1 2 3 4 6 7 5 8 9
30%Afford 1 2 8 5 4 3 6 7 9
50%Efficen 3 5 1 2 6 4 7 8 9

Sensitivity of Ranking to DifferentWeights for Criteria
Hybrid1
MaxSW/GW
MinMWD
Supply
MaxSteward
shipLowCost
Hybrid2 NPR
NPR &IPR
StatusQuo
A.C.Rank 1 2 3 4 5 6 7 8 9
EqualRank 1 2 3 5 6 8 4 7 9
50%Reliab 1 2 3 4 6 7 5 8 9
30%Afford 1 2 8 5 4 3 6 7 9
50%Efficen 3 5 1 2 6 4 7 8 9
This portfolio ranks This portfolio ranks number 1 in all but number 1 in all but
one of the scenarios, one of the scenarios, making it a preferred making it a preferred
strategy for PWPstrategy for PWP
Overview of what is in the Preferred Strategy (Hybrid 1) Aggressive water conservation Devils Gate diversion to Eaton Canyon Groundwater storage of imported water Small phase 1 non-potable recycled water,
with tunnel augmentation Tertiary-treated recycled water for
groundwater recharge Stormwater projects

Aggressive Conservation Program Convert about 70% of existing SF homes to comply with California Model
Landscape Ordinance – through PWP rebates and rate structures
All new SF homes will have drought landscaped front yards, with warm season lawn (model landscape compliant) back yards – through ordinances and PWP rebates
Convert 60-70% of existing MF and Commercial landscapes to comply with California Model Landscape Ordinance – through PWP rebates and rate structures
Double the implementation of PWP’s current indoor conservation for single-family – through PWP rebates and ordinances
Continuation of PWP’s current indoor conservation for MF and Commercial – through PWP rebates
Individual meters for all new MF accounts – through ordinance

Devil’s Gate to Eaton Canyon County conservation project
to reduce discharges to ocean by storing water behind Devil’s Gate Dam (along Arroyo Seco)
Recharge water behind dam and provide environmental releases
Convey stored water to Eaton Wash spreading basins to help with flood management and additional recharge
Collect urban runoff/ stormwater flows along pipe conveyance
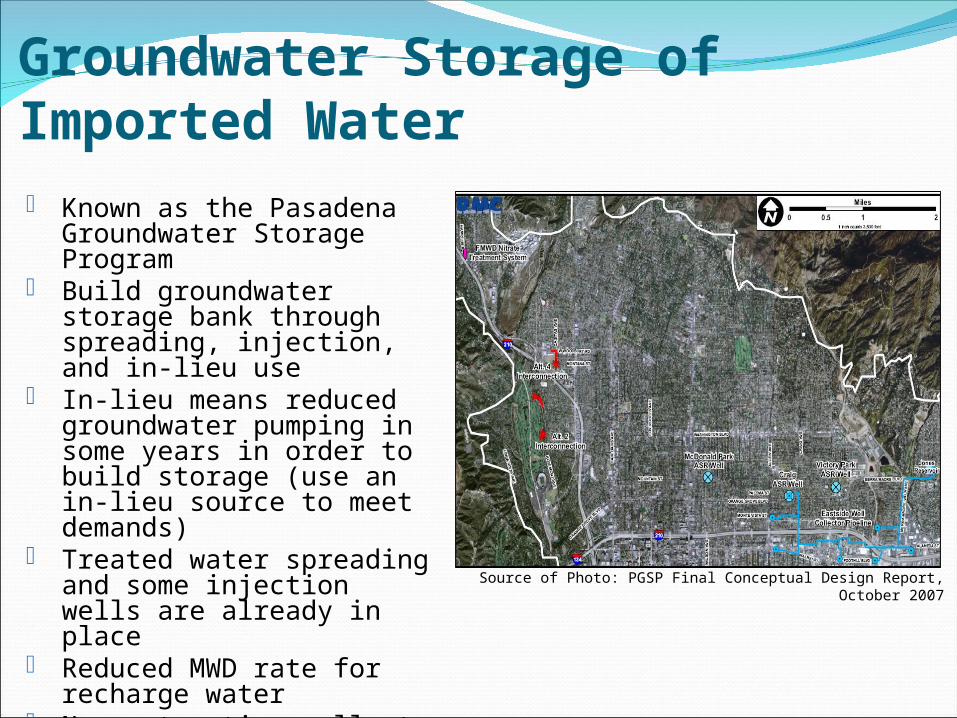
Groundwater Storage of Imported Water
Source of Photo: PGSP Final Conceptual Design Report, October 2007
Known as the Pasadena Groundwater Storage Program
Build groundwater storage bank through spreading, injection, and in-lieu use
In-lieu means reduced groundwater pumping in some years in order to build storage (use an in-lieu source to meet demands)
Treated water spreading and some injection wells are already in place
Reduced MWD rate for recharge water
New extraction wells to recover stored water during shortage periods
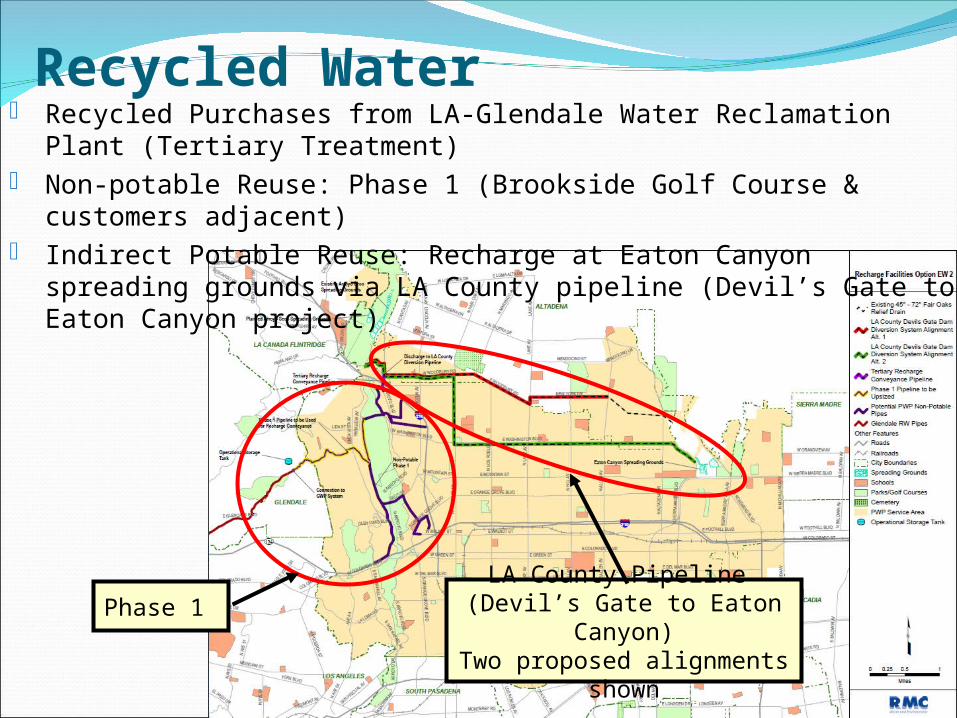
Recycled Water Recycled Purchases from LA-Glendale Water Reclamation Plant (Tertiary Treatment) Non-potable Reuse: Phase 1 (Brookside Golf Course & customers adjacent) Indirect Potable Reuse: Recharge at Eaton Canyon spreading grounds via LA County
pipeline (Devil’s Gate to Eaton Canyon project)
Phase 1 LA County Pipeline (Devil’s Gate to Eaton Canyon)
Two proposed alignments shown
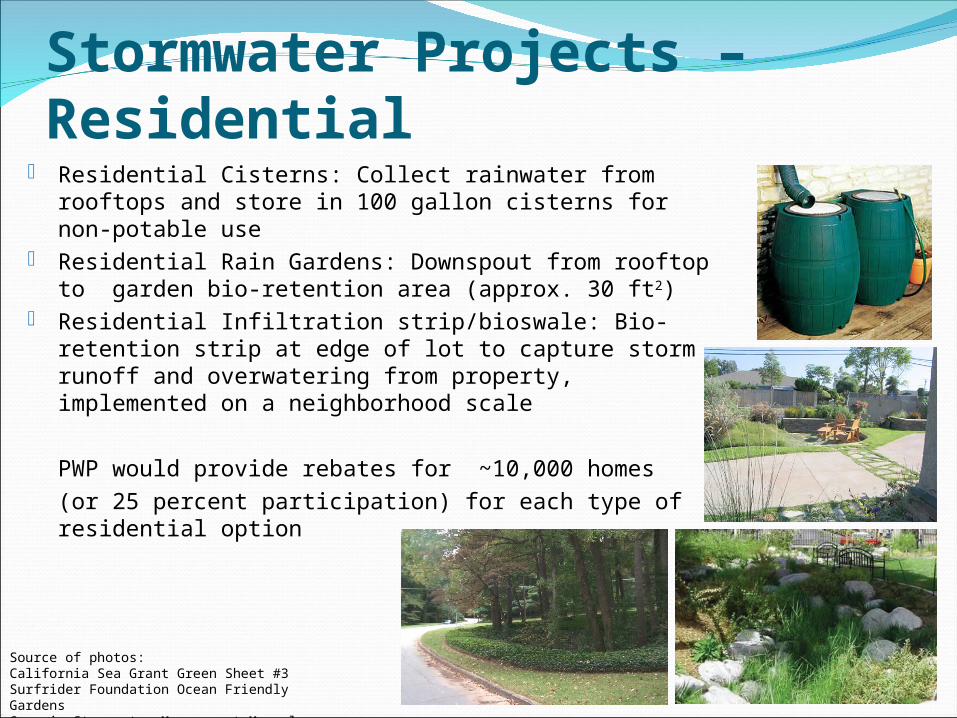
Stormwater Projects – Residential Residential Cisterns: Collect rainwater from rooftops and
store in 100 gallon cisterns for non-potable use Residential Rain Gardens: Downspout from rooftop to
garden bio-retention area (approx. 30 ft2) Residential Infiltration strip/bioswale: Bio-retention strip at
edge of lot to capture storm runoff and overwatering from property, implemented on a neighborhood scale
PWP would provide rebates for ~10,000 homes (or 25 percent participation) for each type of residential option
Source of photos: California Sea Grant Green Sheet #3Surfrider Foundation Ocean Friendly GardensGeorgia Stormwater Management Manual
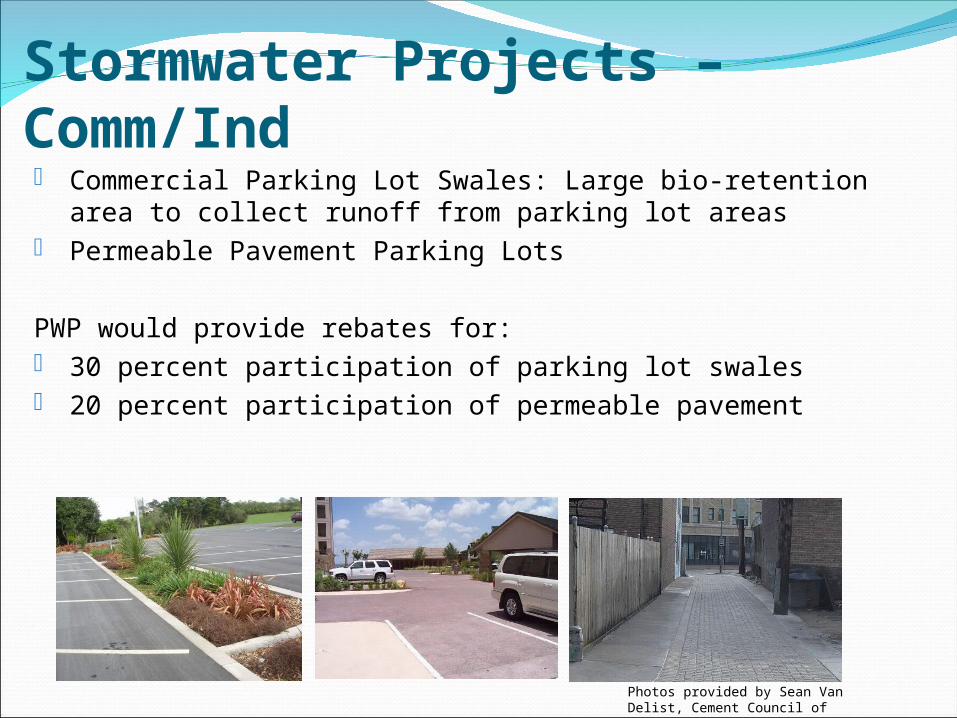
Stormwater Projects – Comm/Ind Commercial Parking Lot Swales: Large bio-retention area to collect runoff
from parking lot areas Permeable Pavement Parking Lots
PWP would provide rebates for: 30 percent participation of parking lot swales 20 percent participation of permeable pavement
Photos provided by Sean Van Delist, Cement Council of Texas

2035 Average Annual Supply Mix
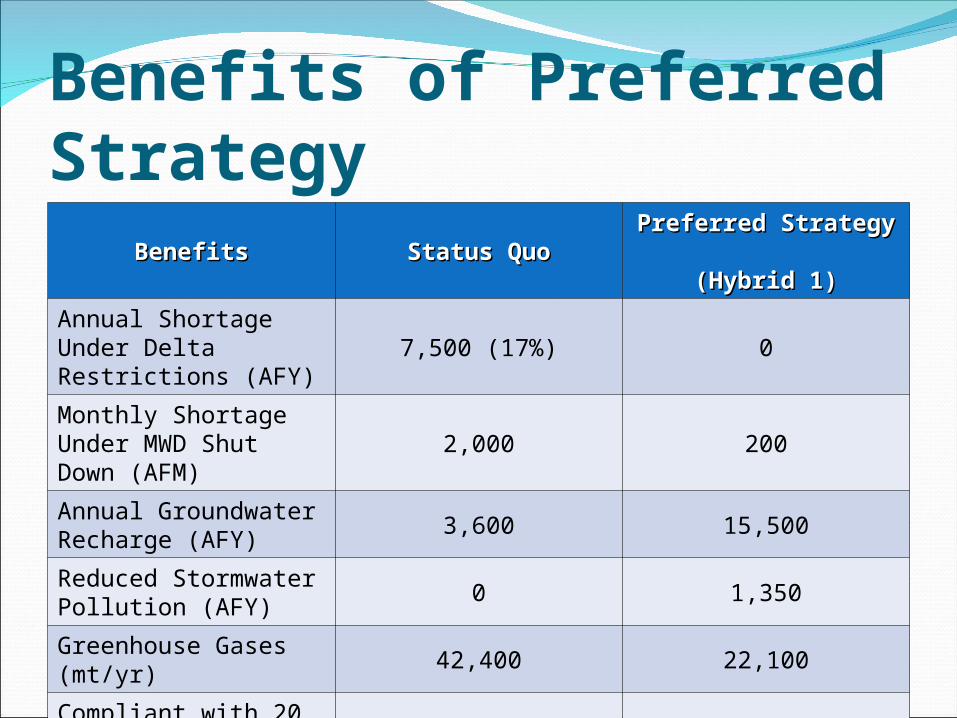
Benefits of Preferred StrategyBenefitsBenefits Status QuoStatus Quo
Preferred Strategy Preferred Strategy (Hybrid 1)(Hybrid 1)
Annual Shortage Under Delta Restrictions (AFY) 7,500 (17%) 0
Monthly Shortage Under MWD Shut Down (AFM) 2,000 200
Annual Groundwater Recharge (AFY) 3,600 15,500
Reduced Stormwater Pollution (AFY) 0 1,350
Greenhouse Gases (mt/yr) 42,400 22,100
Compliant with 20 x 2020 NO YES
Compliant with MWD Regional Planning (IRP) NO YES

Average Cost to PWP
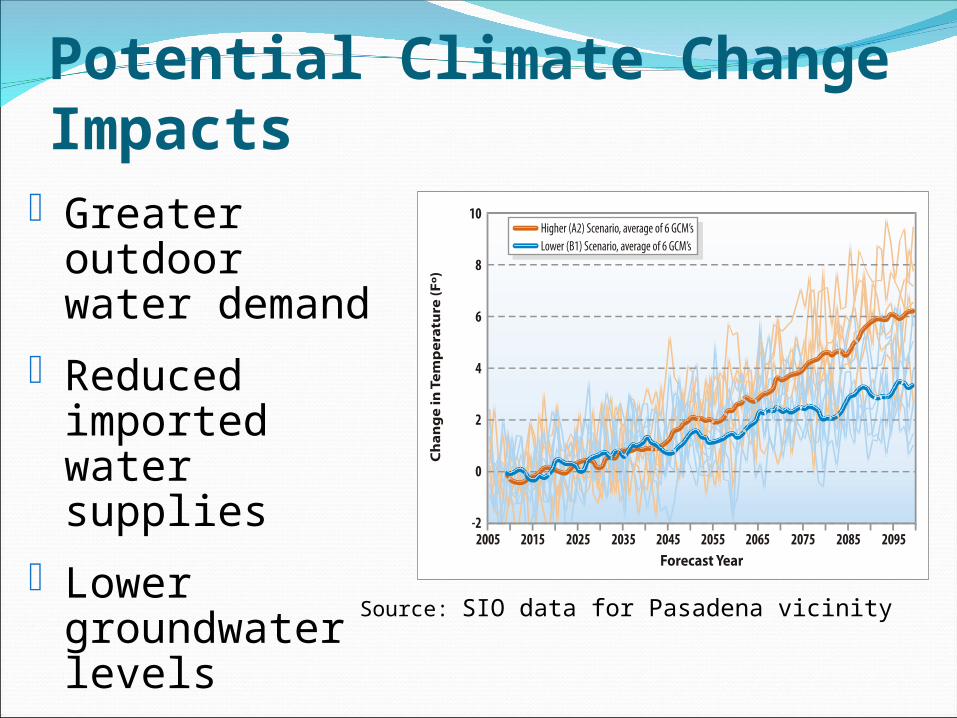
Potential Climate Change Impacts Greater outdoor
water demand Reduced imported
water supplies Lower
groundwater levels
Source: SIO data for Pasadena vicinity
Benefits of Preferred Strategy in Mitigating Climate Change Impacts
Reduces greenhouse gas emissions by almost 50% by 2035
Reduces outdoor demands through conservation, lessening impact of hotter temperatures
Develops recycled water, which is not affected by climate change
Increases storage in Raymond Basin
Implementation Issues Uncertainty in growth projections Rate structure re-examination New conservation ordinances Partnerships with Los Angeles County &
Pasadena Public Works Regulatory approval for indirect potable reuse Outside funding from MWD, state & others
Adaptive Implementation If growth and water supply issues unfold as
assumed, implementation of Hybrid 1 should occur within next 20 years
If water demands do not increase as planned, only elements of Hybrid 1 that cost less than MWD imported water should be implemented
Other elements should then be phased in as needed

Draft WIRP Report Review Draft report posted at:
www.pwpweb.com/waterplanSections 1-6 available nowSection 7 available on Dec 9th
Public comments via on-line survey will be possible from Dec 9th – Dec 16th
WIRP will be presented to City Council in January 2011.

Comments On What You Have Seen So Far?