Public Health Service DEPARTMENT OF HEALTH & · PDF filePublic Health Service DEPARTMENT OF...
74
__________________________________________________________________________________ _____________________________________________________________________________________ Public Health Service DEPARTMENT OF HEALTH & HUMAN SERVICES Centers for Disease Control and Prevention (CDC) Date: August 2005 To: Forrest Smith, MD State Epidemiologist Ohio Department of Health Nancy Osborn, RN, MPA Health Commissioner Ottawa County Health Department From: National Center for Environmental Health, Division of Emergency and Environmental Health Services, Environmental Health Services Branch, Technical Assistance Team Subject: Environmental Health Assessment for Epi-Aid 2004-076: Outbreak of gastroenteritis with multiple etiologies among resort island visitors and residents—Ohio, 2004. Background On August 27, 2004, the Ohio Department of Health (ODH) contacted the National Center of Environmental Health (NCEH) at the Centers for Disease Control and Prevention (CDC) for technical assistance in conducting an environmental health assessment. ODH wanted to identify potential sources of water contamination on South Bass Island, in Lake Erie. On August 29, 2004, four environmental health scientists from NCEH arrived in Port Clinton, Ohio, to assist in the ongoing water-related gastroenteritis outbreak investigation. A team of epidemiologists from CDC’s National Center for Infectious Diseases (NCID) had been in Ohio working with the multiagency outbreak response team since August 19, 2004. The Ottawa County Commissioner of Health led the investigation, with critical support from the ODH, the Ohio Environmental Protection Agency (OEPA), and the Ohio Department of Agriculture (ODA). On August 29, 2004, the ODH/NCID epidemiological report identified 1,031 ill individuals ages 7 months to 83 years. The ill persons reported a sudden onset of symptoms that included diarrhea, cramps, nausea, and vomiting. The median duration of illness was 4 days. The index case became ill on May 30, 2004. All of the ill individuals were visitors or 1
Transcript of Public Health Service DEPARTMENT OF HEALTH & · PDF filePublic Health Service DEPARTMENT OF...

__________________________________________________________________________________
_____________________________________________________________________________________
Public Health Service DEPARTMENT OF HEALTH amp HUMAN SERVICES Centers for Disease Control and Prevention (CDC)
Date August 2005
To Forrest Smith MD State Epidemiologist
Ohio Department of Health
Nancy Osborn RN MPA Health Commissioner
Ottawa County Health Department
From National Center for Environmental Health Division of Emergency and Environmental Health Services Environmental Health Services Branch Technical Assistance Team
Subject Environmental Health Assessment for Epi-Aid 2004-076 Outbreak of gastroenteritis with multiple etiologies among resort island visitors and residentsmdashOhio 2004
Background
On August 27 2004 the Ohio Department of Health (ODH) contacted the National Center of Environmental Health (NCEH) at the Centers for Disease Control and Prevention (CDC) for technical assistance in conducting an environmental health assessment ODH wanted to identify potential sources of water contamination on South Bass Island in Lake Erie On August 29 2004 four environmental health scientists from NCEH arrived in Port Clinton Ohio to assist in the ongoing water-related gastroenteritis outbreak investigation A team of epidemiologists from CDCrsquos National Center for Infectious Diseases (NCID) had been in Ohio working with the multiagency outbreak response team since August 19 2004 The Ottawa County Commissioner of Health led the investigation with critical support from the ODH the Ohio Environmental Protection Agency (OEPA) and the Ohio Department of Agriculture (ODA)
On August 29 2004 the ODHNCID epidemiological report identified 1031 ill individuals ages 7 months to 83 years The ill persons reported a sudden onset of symptoms that included diarrhea cramps nausea and vomiting The median duration of illness was 4 days The index case became ill on May 30 2004 All of the ill individuals were visitors or
1
residents of Lake Eriersquos South Bass Island (see Attachment 1) Pathogenic agents isolated from 19 stool samples submitted by ill persons included Campylobacter (14) norovirus (3) Salmonella Group B (1) and Giardia (1) The fecalndashoral route is the usual means of transmission for these enteric pathogens Epidemiological evidence collected by the multiagency outbreak response team implicated drinking water consumed on South Bass Island as the vehicle of this outbreak Before the NCEH team arrived the local outbreak response team began to collect information on the various South Bass Island water sources and systems and sewage management practices and procedures
South Bass Island (Longitude ndash8284970 Latitude 416021) in Ottawa County Ohio is located in Western Lake Erie approximately 50 miles east of Toledo and 72 miles west of Cleveland Ohio South Bass Island Middle Bass Island and North Bass Island are collectively referred to as the Bass Islands of Ohio According to the 2000 US Census the population of South Bass Island is 763 people
South Bass Island a popular vacation destination from April through October attracts visitors from Ohio neighboring states and Canada Island activities include fishing boating swimming golfing camping bird watching and exploring caves and the unique geology of South Bass Island Vineyards and a winery are located on South Bass Island These and the many other South Bass Island activities and special events bring an estimated 15000 visitors to the island each week of the tourist season South Bass Island visitorrsquos information identifies 21 tourist and recreational attractions 25 restaurants and taverns 14 shopping venues 11 providers of transportation services 11 bed-and-breakfast operations 15 short-term rental homes 11 hotels and 2 campgrounds (PIB Chamber of Commerce 2005)
South Bass Island has 1264 single-family dwellings (US Census Bureau 2000) Services on the island include a bank six boat docking and marina facilities two churches a fuel distributor two grocery stores a hardware store laundry police fire and emergency medical services post office library and a school
Public service infrastructure includes the Put-in-Bay public water system and wastewater treatment facility operated and managed by the municipality Portions of the island not served by public water and sewer utilize groundwater wells and onsite wastewater treatment and disposal systems (Graham et al 1998) Additional information on South Bass Island is available in Attachment 2 of this report
Purpose of Environmental Health Assessment
NCEH conducted this outbreak-related environmental health assessment to 1) identify the source(s) of the suspected etiologic agent(s) 2) determine how the suspected etiologic agent(s) entered the water source andor water
distribution system 3) determine why the suspected etiologic agent(s) were able to survive in the potable
water system and 4) isolate the suspected etiologic agent(s) from drinking water
2
The environmental health assessment conducted by NCEH and partners was completed in two phases
Phase 1mdashA rapid field assessment (RFA) determined water quality and evaluated water supply systems and sewage disposal methods The RFA was conducted on South Bass Island from August 29ndashSeptember 2 2004 with follow-up work data organization and analysis completed in Atlanta Georgia
Phase 2mdashA groundwater quality assessment (GWQA) was conducted September 7ndash10 2004 This assessment included the collection organization and analyses of historical and recent outbreak groundwater quality data precipitation trends and hydrogeologic information
Phase 1mdashRapid Field Assessment Determination of Water Quality
Methods
Between August 30 and September 2 2004 the NCEH field team collected 1 wastewater sample and 11 water samples on South Bass Island The number of samples collected was limited to 12 because of field time needed to process each sample An aerial photograph showing the 11 sample locations is found in Attachment 3 of this report Collected samples included a 250-mL container of raw sewage from the Put-in-Bay wastewater treatment facility This sample was collected to determine if wastewater generated and treated on the island would give an indication of pathogens circulating in the human population working residing on and visiting South Bass Island The 11 water samples included bull one from the raw water intake of the Put-in-Bay water treatment plant (Sample 1) bull one treated water sample from the water distribution system (Sample 2) bull five groundwater samples from transient noncommunity (TNC) public water
supplies (Samples 3ndash7) located near to the Septage disposal site and bull four private wells (Samples 8ndash11) also located near the Septage disposal site
The ultrafiltration method was used to collect the drinking water samples The ultrafiltration technique allows analysis for several potential microbial contaminants (viruses bacteria and parasites) from a single sample by processing a high volume of water and concentrating it down to a 200ndash250 mL sample Attachment 4 explains this process in greater detail and provides additional information on the results summarized here Site-specific environmental data were recorded before each water sample was collected The visual environmental health assessment for each sample location documented the location of house well septic tank and drainfield driveway roads outbuilding and other features Distances between septic tanksdrainfields and wells also were measured Attachment 5 is the form used to record sampling data
CDC laboratories analyzed collected water samples for total coliforms Escherichia coli
3
Campylobacter (by culture genus and species DNA) fecal coliforms somatic coliphages F-specific coliphages Clostridium perfringens Salmonella DNA Salmonella culture Cryptosporidium DNA Cryptosporidium Cryptosporidium oocysts Giardia cysts GI norovirus GII norovirus norovirus DNA adenovirus DNA enterovirus DNA and enterococci
Results
bull Analyses of the wastewater sample found concentrations of microbial indicators typical of untreated domestic wastewater
bull Water collected at the raw water intake at the Put-in-Bay water treatment facility was positive for four microbial indicators and Cryptosporidium spp (by polymerase chain reaction [PCR] and microscopy)
bull Cryptosporidium DNA was detected in finished water collected from the Put-in-Bay distribution system We do not know whether this detection reflects the presence of viable or infectious Cryptosporidium PCR results are a very conservative indicator of fecal contamination and health risks as the PCR test can detect DNA that is not associated with viable or infectious pathogens
bull Of the five TNC system wells sampled three were found to contain fecal coliforms and E coli Two of these wells (Samples 5 and 7) contained relatively high concentrations of E coli In addition three of the five wells contained either somatic coliphages or F-specific coliphages which are enteric viruses that infect coliform bacteria and are considered an indicator of fecal contamination One of the wells contained Clostridium perfringens (a spore forming enteric bacterium) C perfringens spores somatic coliphages and F-specific coliphages represent indicator microbes They are generally more environmentally persistent than are standard indicators such as fecal coliform and E coli and may represent contamination that occurred weeks (or longer) before sampling
bull Sample 3 did not contain a culturable microbial indicator of fecal contamination However Sample 3 and three other TNC system well samples (2 6 and 7) were found to be positive for Salmonella by PCR (using two different PCR assays) The CDC laboratory was not able to culture Salmonella from any of these samples This is not necessarily surprising as the PCR technique can detect nonviable and viable but not culturable (VBNC) microbes
bull Three other pathogens were detected in the five TNC system wells using PCR Cryptosporidium (in three of five wells) adenovirus (in one of five wells) and enterovirus (in one of five wells) However when more specific PCR assays immunomagnetic separation (IMS) and an immunofluorescent antibody (IFA) were conducted samples from the wells were negative for Cryptosporidium
4
bull A single Giardia cyst in Sample 5 was detected by IMS and IFA This sample was also found positive by genotyping nested PCR for Cryptosporidium hominis
bull A single Cryptosporidium cyst was detected by IMS and IFA in Sample 1 (water treatment plant surface water influent from Lake Erie)
bull Samples from the four private wells (Samples 8ndash11) were received at CDC on Friday September 3 2004 They were stored in a refrigerator until Tuesday September 7 before further processing and analysis While significant microbial die-off likely occurred during this holding period over a holiday weekend two of the four samples were still found to be positive for E coli Beyond fecal coliforms and E coli none of the private well samples were positive for any other indicator organisms
bull When cultured none of the NCEH-collected water samples were found to contain Campylobacter species A strain of Arcobacter butzleri was confirmed biochemically and by 16S sequencing in groundwater Sample 5
bull Five of the water samples collected (Samples 3 4 9 10 and 11) from TNC public and private water systems when tested for chlorine before sampling had a detectable available chlorine residual of 001ndash004 mgL The TNC public water system at sample location 3 had a chlorinator installed The chlorinator was turned-off before sampling The water system was flushed for at least 1 hour before the sample was collected Prior to sample collection the water was tested frequently for chlorine residual A chlorine residual of 004 PPM was consistently measured The other TNC public water supply system sample location 4 pumped water from a cave The cave is 52 feet below the ground surface and 208 feet long by 165 feet wide The water level in the cave fluctuates according to the water level of Lake Erie indicating a subterranean connection between Lake Erie and the cave system This TNC public water supply system was not chlorinated Although the water system was flushed for more than 40 minutes chlorine residual was continually detected and measured at 002 PPM Three of the four private residences (Samples 9 10 and 11) had a chlorine residual of 001ndash002 PPM Owners of these systems report their well water was not recently treated or disinfected
bull Several of the groundwater samples were collected from wells located near an island septic tank sludge (septage) disposal site Septage pumped from business and privately owned septic tanks by a local service was disposed of in a sink holelow depression located between Catawba Road and Put-in-Bay Road near the middle of the island This disposal site was reported to be in use for several years NCEH was unable to obtain septage dumping records for the site More than half of the TNC public and private well water samples (Samples 5 and 7ndash11) were collected from locations adjacent and relatively near the septage disposal property
5
Discussion
The Giardia cyst identified in Sample 5 is a significant finding The presence of this parasite (which is fairly large with a diameter of 12 microm) indicates that enteric parasites and smaller pathogens (ie bacteria and viruses) can enter and be transported through the subsurface aquifer of South Bass Island (Gerba et al 1984 Moe 1997)
Chlorine was detected in several wells even those wells that were not chlorinated This finding strongly supports the hypothesis that chlorine used to treat other wells on the island found its way to the aquifer so that it was being detected in wells not recently disinfected with a chlorine product Similarly pathogens present in on-site wastewater system effluent may find their way into the aquifer and ultimately into drinking water supplies
Local reports indicate that during the summer months approximately 15000 tourists visit the island each week Most visitors arrive Friday evening and depart on Sunday The weekend visitation peak places an extraordinary demand on the islandrsquos groundwater aquifers The increased demand for water from TNC public and private water systems will draw the aquifer down over time When this occurs a cone of depression extends around a well resulting in water being ldquopulled inrdquo from other sources such as the lake That could also pull in effluent from on-site wastewater systems (Fetter 1980 Freeze et al 1979) Due to the high seasonal demand on the aquifer the thin-to-absent soils severe limitations for septic tank absorption fields and known karst geology (interconnected fractures channels and caves) pathogens could reach and contaminate drinking water supplies (Malard et al 1994) The limited number of groundwater samples collected by NCEH found multiple indicators of a sewage contaminated aquifer
Raw untreated surface water from Lake Erie collected at the Put-in Bay community water treatment plant is positive for Cryptosporidium Raw water was also positive for E coli fecal coliform somatic coliphages and C perfringens The presence of these organisms in surface water is not uncommon Proper operation of the water treatment plant process effectively removes these organisms
The water source for the public water system is Lake Erie Finished water samples collected from the water distribution system are negative for all organisms tested with one exception Cryptosporidium DNA was found in the finished water sample collected by NCEH on August 30 2004 Cryptosporidium oocysts often present in surface water are broken and inactivated by water treatment processes The analysis process used by CDC may detect DNA on nonviable oocyst particles and fragments present in treated water The detection of Cryptosporidium DNA does not differentiate live from dead oocysts Finished water from the Put-in-Bay community water system was analyzed by two additional methods for Cryptosporidium Michigan State University also analyzed finished water for
6
Cryptosporidium These follow-up tests found no evidence of viable Cryptosporidium oocysts in the public water system
Phase 1mdashRapid Field Assessment Assessment of Water Sources and Supplies
Methods
Put-in-Bayrsquos water treatment plant operation records from May to August 2004 were reviewed to determine if plant or distribution system operation could have contributed to the gastrointestinal disease outbreak All aspects of the records were reviewed including operator logs loading rates filter operations chlorination bacteriological tests and OEPA inspection reports
The Village of Put-in-Bay water treatment facility processes water at a rate of 0216 million gallons per day (MGD) The facility originally constructed in 1977 was upgraded in 2000 with the installation of a Culligan Multi-Tech treatment system Water treated at the facility is drawn from lake and groundwater sources Lake Erie surface water is the primary water source A groundwater well was developed as an emergency back-up source Raw (untreated) water pumped from Lake Erie passes through five Culligan Multi-Tech treatment trains This treatment system consists of clarification rapid sand filtration and granular activated carbon filtration Water is then chlorinated and pumped to a 200000-gallon elevated storage tank for gravity flow through the Put-in-Bay water distribution system The distribution system is connected to 104 commercial meters and 95 residential water meters
Results
bull The August 2004 OEPA inspection of the facility discovered that the raw water (low service) pumping system was not installed according to proposed plans The 2000 upgrade plan called for the installation of a 200-gallon per minute (gpm) pump However when construction took place a 150-gpm pump was installed thus limiting production to 0216 MGD (150 gpm) Although this does not to affect the quality of the water produced it did lower the production rate of the overall plant from 0288 MGD (200 gpm) to 0216 MGD (150 gpm)
bull Records indicate the water from the emergency groundwater supply well is highly corrosive Corrosive water if used for long periods can leach lead and copper from water distribution lines and building service pipes Records indicate the groundwater well was used on occasion to meet the demand for water Because of the corrosiveness of the water and the related lead and copper issues OEPA ordered this well not be used on a routine basis
bull Michigan State University collected samples from the back-up groundwater well at the Put-in-Bay community water facility These water samples were negative
7
for all tested biological parameters
bull OEPA records report all bacteriological analysis results of treated water leaving the facility as negative The review of plant operation logs and records indicated compliance with OEPA standards and reporting requirements
Discussion
Although some operational issues were identified they did not affect the ability of the facility to provide adequate quantities of treated water All routine water tests indicate compliance with OEPA water treatment and quality standards The pump capacity issue did limit total water production but there is no evidence of inability to meet water demand (ie lack of water low flow loss of pressure in distribution system) There is no evidence in material reviewed and from discussions with the facility operator of pumping rates exceeding the design capacity of the treatment facility
If the water treatment facility is operating as designed the mixing of groundwater from the emergency backup well with surface water at the facility does not present a pathogen exposure risk because the groundwater enters the treatment system at the beginning of the process and receives full treatment including chlorination It was because of its high corrosivity that the use of water from the emergency well was discontinued Analyses of groundwater collected from the emergency well by Michigan State University showed no indicators of microbial contamination
Phase 1mdashRapid Field Assessment Assessment of Community Water Distribution System and Auxiliary Wells
Methods
NCEH reviewed Put-in-Bay community water distribution system operation and maintenance records and water quality data NCEH also reviewed available information on auxiliary wells developed and utilized by several commercial establishments
Results
bull The review of available information found no indications of water line breaks leaks or significant loss of pressure in the water distribution system
bull Water quality data maintained on the Put-in-Bay community water distribution system from 2000 to August 2004 report 2 of 196 (1) samples as total coliform positive No total coliform bacteria positive sample results were reported for the community water distribution system during the first 8 months of 2004
bull The auxiliary wells provided groundwater for cooling watering grass flushing
8
toilets and other activities Four of the auxiliary wells were cross-connected to the Put-in-Bay community water distribution system
bull Three of the four cross-connected auxiliary wells were sampled by OEPA One auxiliary well is positive for total coliforms and E coli and another is positive for Campylobacter jejuni OEPA ordered these businesses to disconnect all identified cross-connected plumbing
bull Backflow prevention devices were installed on the four cross-connected auxiliary wells Each was fitted with either a reduced pressure zone (RPZ) valve or a check valve assembly Properly installed and functioning backflow prevention devices allow water to move in one direction These devices are installed to prevent water from building supply lines to flow back into the distribution system
bull OEPA examined one of the RPZ valves after it was removed and determined that it was malfunctioning The condition of the other valves is unknown Building owners did not maintain valve operation maintenance and test records
Discussion
The results of routine water samples collected from the Put-in-Bay water distribution system found no recent indicators of bacterial contamination
There is no direct evidence of loss of pressure in the water distribution system to the extent necessary to cause backflow However the cross-connections between groundwater supply lines and community water system service lines the finding of a malfunctioning PRZ valve and the presence of fecal indicators and C jejuni in samples collect from auxiliary wells are factors that may have contributed to this outbreak
Phase 1mdashRapid Field Assessment Assessment of Water Sources and Suppliesmdash Development of Groundwater Wells
Methods
To characterize groundwater well development on South Bass Island NCEH reviewed 503 groundwater well drilling reports provided by the Ohio Department of Health The most recent information from the 1990 US Census indicates a total of 679 drilled wells and 27 dug wells in Put-in-Bay Township Characteristics of interest included well and casing depth grouting and remarks from well formation logs Remarks from well formation logs were reviewed for evidence of subsurface openings crevices voids caves and other geological conditions that may influence the collection movement and mixing of groundwater with recharge waters The reviewed logs dated from 1948 to 2003
Among those reports the detailed and clear records developed by the Island Well
9
Drilling Company provide an excellent source of information on well construction practices and geologic formations of South Bass Island Island Well Drilling Company records were examined to collect information not consistently recorded by other well drillers The Island Well Drilling Company developed 82 wells on South Bass Island from 1961 to 1971
Results
bull The review of the Island Well Drilling Company well logs found 56 (2036) of the wells had openings crevices or caves below the protective casing depth (Attachment 6)
bull A review of all 503 well log and drilling reports found 172 (34) wells with a recorded grout seal A proper grouting seal can prevent contaminants from entering groundwater
bull Of the well logs reporting grouting 64 did not record type of grout used
bull Well logs report the use of the following grouting materials 22 well cuttings 34 cement 34 bentonite clay and 10 bentonite mixed with well cuttings
bull The detailed well logs maintained by the Island Drilling Company do not record the use of grout or the grouting of drilled wells The older well log and drilling report form used by Island Drilling Company did not require the reporting of well grouting so it is unknown if grouting was used
Discussion
Island Drilling Company records indicate 56 of the developed wells have openings crevices or caves below the protective casing depth This may allow surface water to quickly reach and enter the drill hole (Attachment 7) Contaminants seeping into the ground from septic tanks or others sources could mix with water in the drill hole (Keswick 1984 US Department of the Interior 1985)
Additionally the lack of a proper grouting seal could allow contaminants to enter the well A gap often exists between the well casing and the soil and layers of rock in the well hole It is common practice to place a grout (cement clay well cuttings) seal around the upper portion of well casing to help prevent contaminated surface water from entering the well Grout also helps to seal crevices or openings in formations to prevent water or other contaminants from entering the well along the casing The absence of grouting could lead to well contamination In that case the casing acts as a funnel allowing contaminants to flow along the casing sides into the well (Salvato 1992 US Department of the Interior 1985)
Environmental laws well now prohibit cuttings (material removed in the process of drilling) from being used as a grouting material in Ohio Well cuttings were found to be
10
less effective in providing a proper seal Only 34 of wells recorded a grout seal The lack of grouting and the use of ineffective grouting materials such as well cuttings could allow contaminants to enter the well
Phase 1mdashRapid Field Assessment Sewage Disposal Methods
Methods
Information on South Bass Island wastewater treatment and disposal methods and septage management practices was obtained from OEPA the Ottawa County Health Department and from operators during site visits to sewage disposal facilities Soils information for South Bass Island was obtained from the 1985 Soil Survey of Ottawa County Ohio conducted by the US Department of Agriculture Soil Conservation Service (now the Natural Resources Conservation Service) (Musgrave et al 1985) This information was organized and reviewed to determine if sewage management on the island may have contributed to the outbreak
Village of Put-in-Bay Community Wastewater Treatment Facility
Results
bull The Village of Put-in-Bayrsquos wastewater treatment facility is the largest sewage system on the island It has a design capacity of 025 MGD The facility uses a sequencing batch reactor (SBR) activated sludge treatment process followed by chlorination of the final effluent The effluent is discharged into Lake Erie at the Put-in-Bay Harbor Design is underway for an expansion of the wastewater treatment facility by converting a portion of the aerobic sludge process into a membrane-type system This will increase the design capacity of the facility by an additional 0200ndash0250 MGD for a total capacity of 0450ndash0500 MGD The project is scheduled for completion by the end of 2006 The membrane system will be evaluated for performance the community may then opt to convert one or two of the SBR tanks into a membrane system If both SBR tanks are converted the facility could have a design capacity of up to 20 MGD
bull No discharge violations were reported in recent years or during the time of the outbreak The facility appeared to be well operated and maintained
Discussion
The effluent discharged from the treatment plant met discharge standards and records indicate the facility was operating properly at the time of this outbreak There is no evidence to support a connection between the village wastewater treatment facility and the outbreak
11
On-site Wastewater Systems for Residences and Businesses
Results
bull Individual on-site septic tank systems are the most common type of wastewater disposal method on South Bass Island Ottawa County Health Department records indicate there are 476 on-site septic tank systems used at individual homes on South Bass Island
bull On-site septic tank systems are also the most common method of wastewater disposal for businesses on South Bass Island Several different types of on-site disposal systems have been installed and are in use at business establishments
bull Information provided by OEPA on sewage disposal methods used by 32 businesses on South Bass Island finds 25 of 32 (78) discharge their wastewater into the subsurface
bull The following information shows the distribution of wastewater disposal methods for businessesmdashlodging food service convenience storesmdashon South Bass Island
Type of System Total Number Aerator system (surface water discharge) 2
Leach beds (soil absorption) 9 Leach fields (soil absorption) 9 Mound systems (soil absorption) 4
Subsurface sand filter (soil absorption) 3 Subsurface sand filter (surface water discharge) 2 Rock filter (surface water discharge) 1
Holding tanks 2 Unknown type 16
Package treatment plants (surface water discharge) 10
bull OEPA ordered two businesses to install holding tanks and discontinue discharging wastewater to existing systems due to high potential for groundwater contamination One of these systems discharged wastewater directly to a dry well that provided a direct conduit to the groundwater aquifer
bull Five business operations discharge effluent to surface water (Lake Erie)
bull Ten of the 32 systems are permitted by OEPA The wastewater disposal method used by 16 businesses is unknown
bull According to OEPA 10 businesses use package wastewater treatment plants that discharge effluent to Lake Erie These systems range in their designed flow
12
capacity from 1500 gpd to 29000 gpd The total design capacity of these 10 package plants is 88600 gpd All of these systems were inspected between August 10 and August 27 Minor to serious problems were identified at each plant Some of the more severe problems identified included aeration tank contents being black and septic blowers malfunctioning tanks leaking and disinfection not being applied Four of the 10 package treatment plants were operating under OEPA permits The Federal Clean Water Act requires all owners of wastewater systems that discharge to surface waters to obtain a permit under the National Pollutant Discharge Elimination System (NPDES) OEPA ordered all owners of package plants who did not have an NPDES permit to make application At the time of this assessment 9 of the 10 package systems are either operating under an NPDES permit or have applied for a permit One system has not applied and is reported to have repeated operational problems
bull Eleven bed-and-breakfast operations and 15 short-term rentals exist on the island Due to small lot sizes adequate room for on-site wastewater systems may not available Therefore many of these systems use leach beds instead of leach line systems This practice concentrates the amount of effluent over a much smaller area It can result in higher rates of failure even in suitable soil and geologic environments due to a great reduction in the soil sidewall area of the disposal system (Salvato 1992 Yates 1987) The use of leach beds is even more problematic on South Bass Island because of severe soil and geologic limitations
Discussion
A high number of homes and businesses discharge wastewater into the thin soils of the island through conventional on-site wastewater systems The 476 on-site wastewater systems and the islandrsquos karst geology provide a means for wastewater to enter the South Bass Island groundwater aquifer (Gunn et al 1997 Keswick 1984 Lance 1984 Tranter 1997)
Operational problems were noted with package plants that discharge into Lake Erie These operational issues could affect the quality of wastewater treatment and allow insufficiently treated sewage to enter the lake creating a potential health hazard (Hunter et al 2003)
Soil Limitations for Onsite Wastewater Disposal
Results
bull The most recent Soil Survey of Ottawa County Ohio was conducted by the US Department of Agriculture Soil Conservation Service in 1985 The survey shows that five series of soilsmdashCastalia Dunbridge Milton Nappanee and Rawsonmdash are native to South Bass Island
13
bull All five soil types identified on South Bass Island have ldquosevererdquo limitations for septic tank system use according to the Soil Survey (Attachment 8) Attachment 9 provides a complete description and primary limitations for each of the soils types found on South Bass Island
bull Chapter 3701 of the Ohio Administrative Code Section 29-10 ldquoInstallation requirements for soil absorption and percolationrdquo (effective 711977) establishes the following restrictions for the use of onsite wastewater systems
(A) Leaching systems utilizing soil absorption or percolation shall not be permitted where the depth to normal groundwater table or rock strata is less than four feet below the bottom of the proposed system
(B) Leaching systems utilizing soil absorption or percolation shall not be installed where the texture structure or permeability of the soil is not suitable to provide internal drainage The health commissioner may require the owner at the ownerrsquos expense to provide a written site evaluation by a qualified person before a final decision is made in issuing a permit The criteria of the national cooperative soil survey shall be used as a guideline by the health commissioner to determine the suitability of the soils in lieu of a more detailed guideline relating to the code requirements and soil characteristics
Discussion
According to the most recent soil survey of Ottawa County and the Ohio Administrative Code all soils located on South Bass Island are unsuitable for conventional onsite wastewater disposal systems (Musgrave et al 1985)
In addition to severe limitations for on-site wastewater posed by the native soils of South Bass Island an additional limitation and threat to groundwater is the karst topography and geology of the area (Myers et al 2000) Karst is a distinctive topography in which the landscape is largely shaped by the dissolving action of water on carbonate bedrock (usually limestone dolomite or marble) This geologic process occurring over many thousands of years results in unusual surface and subsurface features Those range from sinkholes vertical shafts disappearing streams and springs to complex underground drainage systems and caves (Jack 1999 Maire 1994 Malard 1994)
The combination of karst geology and thin soil depths make the island unsuitable for conventional onsite septic systems (Musgrave et al 1985 Myers et al 2000)
Septage Disposal
14
Results
bull Septage was pumped from business and privately owned septic tanks by a local septic tank pumping service and discharged on land into a sink holelow depression located between Catawba Road and Put-in-Bay Road This disposal site was reported to be in use for several years NCEH was unable to obtain septage dumping records for the site More than half of the water samples (Samples 5 and 7ndash11) were collected from TNC public water supplies and private wells that were located adjacent to and within 1 mile of the property where septage was discharged
bull None of the private well water samples (8ndash11) taken from properties adjacent to the septage disposal site were positive for bacterial or viral contamination
bull The TNC public water supplies sampled near the septage disposal site showed significant levels of contamination (Samples 5 and 7)
Discussion
OEPA reports that septage disposal at this site is not allowed under Title 40 of CFR Part 503 and has stopped It is unknown if the septage disposal site contributed to the contamination of the TNC public water supplies Given the karst geology of the island including large pores channels and caves through which surface water and contaminants can travel it is possible that the septage disposal site may have contributed to contamination of the groundwater aquifer (Keswick 1984 Kowel 1982 Lance 1984)
Phase 2mdashGroundwater Quality Assessment ODHNCEH Assessment
Methods
The ODHNCEH groundwater quality assessment included only private residential wells The assessment conducted water source sanitary surveys and collected groundwater samples (US Environmental Protection Agency 1999) The island was divided into 22 sections and a total of 77 water samples were collected Attachment 10 provides a description of the sampling protocol
Samples were analyzed for total coliforms E coli Campylobacter Salmonella chloride and nitrate The primary purpose of collecting a water sample was to support the finding of a sanitary survey The South Bass Island water quality assessment was designed to collect information on selected well characteristics and conditions that could affect water quality CDCrsquos water quality assessment of Midwestern private wells which yielded valuable information on private well use in the United States focused on well characteristics such as pitless adapters backflow devices sanitary seal cracked casing proximity to potential contamination sources and other data This protocol was used as a model in the design of the South Bass Island assessment (Centers for Disease Control and
15
Prevention 1998) However limited resources and time prevented the collection of accurate and complete sanitary survey data on South Bass Island
The results of this groundwater sample collection activity are compared to South Bass Island outbreak and existing historical groundwater quality data
Results
bull Of the groundwater samples collected by the ODHNCEH assessment 31 were E coli positive (Attachment 11)
bull Historical data for South Bass Island reports 9 of private wells as E coli positive
bull Outbreak response water quality data from August and September 2004 report 30 of private wells E coli positive and 35 of the TNC public water systems as E coli positive
bull Of the groundwater samples collected by the ODHNCEH assessment 78 were total coliform positive (Attachment 12) Historical data reports 51 total coliform positive for private wells
bull Outbreak response water quality data from August and September 2004 reports 42 of private wells to be total coliform positive and 48 of the TNC public water systems tested positive
bull A statistically significant relationship exists between wells that are less than 52 feet deep and positive results for E coli (OR = 77 (95 CI 224ndash2706) P value = 00002) Wells constructed with depths less than 52 feet are almost 8 times more likely to be contaminated with E coli than wells with depths of 52 feet or greater (Attachment 13)
bull A statistically significant relationship also exists between wells developed in the aquifer above lake bottom and E coli positive results (OR = 321 (95 CI 113ndash909 P value = 0039) Groundwater wells developed in the aquifer above the lake level are 321 times more likely to be contaminated with Ecoli than wells drilled below the lake bottom
Discussion
The bacteriological results of the private well groundwater assessment are similar to those obtained in groundwater collection activities implemented in response to the
16
outbreak but higher than the historical data on private wells
The results obtained in the ODHNCEH groundwater quality assessment of 31 E coli and 78 total coliform positive exceed those obtained in the CDC Midwestern states well study of 11 E coli and 41 total coliform positive (Centers for Disease Control and Prevention 1998)
Wells less than 52 feet were more likely to be contaminated with E coli Deeper wells may provide some protection against contamination
A comparison of location of well in relation to shoreline and E coli positive results found no association (Attachment 14) Although no association was found with this analysis a mixing of ground and lake water in the aquifers under South Bass Island occurs through interconnected caves and fractures in the geology Historical studies of the island show increased water levels in caves rise as lake levels rise This shows evidence of interconnectivity of lake water and groundwater on the island (Newell 1999 Verber et al 1953)
Phase 2mdashGroundwater Quality Assessment Collection Organization and Analysis of Available Water Quality Data
Methods
Available historical and recent outbreak response groundwater quality records for South Bass Island provided by the Ottawa County Health Department Ohio Department of Health Ohio Environmental Protection Agency and the Ohio Department of Agriculture were combined organized and reviewed The number and percent of total coliform and E Coli positive water samples in the historical database were compared to outbreak sample results to determine if groundwater quality had recently deteriorated
Review of Existing Historical Private Groundwater Well Sampling Results
Results
Total coliform
bull Of the groundwater samples collected from private wells on South Bass Island during 2001 2002 and 2003 51 (4180) are total coliform positive (Attachment 15)
bull Of the groundwater samples collected from private wells on South Bass Island during the first 8 months of 2004 69 (4667) are total coliform positive
bull Private groundwater well total coliform positive results increased from 50 in 2003 to 77 during the first 7 months (JanuaryndashJuly) of 2004 and remained
17
elevated at 67 during August 2004
E coli
bull Of the groundwater samples collected from private wells on South Bass Island during 2001 2002 and 2003 9 (780) are E coli positive (Attachment 15)
bull Of the groundwater samples collected from private wells on South Bass Island during the first 8 months of 2004 24 (1667) are E coli positive
bull Of the 64 water samples collected by the Ottawa County Health Department at the end of August and the beginning of September 2004 30 (1964) were E coli positive
bull The Ottawa County Health Department collected 55 water samples in 2000 from private water wells on South Bass Island Sample results are reported as safe or unsafe Of the samples collected 56 (3155) were recorded as unsafe
Discussion
A comparison of recent to historical groundwater quality data found an increase in the number of both total coliform and E coli positive results for samples collected from private groundwater wells during the first 8 months of 2004 Total coliform positive results increased from 51 (2001ndash2003) to 69 for the first 8 months of 2004 E coli which is a stronger indicator of fecal contamination increased from 9 in 2001ndash2003 to 24 from January through August 2004
In a 1994 CDC private well study conducted in nine Midwestern states 413 of the wells (N = 5520) were positive for total coliforms and 111 were positive for E coli Although other studies have been conducted in the United States this study is most comparable because it was conducted in the same region Using this study as a comparison rates were higher for South Bass Island in all categories except E coli in 2001ndash2003 The percent of total coliform and E coli positive test were higher than the Midwestern states study A nationwide study conducted by EPA in 1984 showed rural wells with 78 total coliform and 12 E coli positive results This nation-wide study had higher total coliform rates than South Bass Island but E coli rates were higher for the island from January through August 2004 (US Environmental Protection Agency 1984)
Historical Review of Transient and Noncommunity Public Water Sample Results
Results
bull Of the groundwater samples collected from 11 TNC public water systems (2000ndash 2003) 7 (19284) were total coliform positive In comparison 51 of the
18
private well samples collected during this same period were total coliform positive
bull Of the groundwater samples collected from 11 TNC public water systems during the first 8 months of 2004 21 (735) are total coliform positive Of the private well samples collected during this same period 69 are total coliform positive
Discussion
The much higher percent of total coliform positive groundwater samples in the private wells compared to the TNC public water systems (51 vs 7) for the years 2000ndash2003 is difficult to explain Further investigation is needed One explanation might be that TNC water systems typically have to provide more water than private wells Consequently they may be drilled to greater depths drawing from deeper aquifers which are generally more protected than shallow aquifers (Gerba et al 1984 US Department of the Interior 1985)
Association between Precipitation and Water Quality
Methods
Precipitation data were examined for South Bass Island to determine if rainfall trends may have contributed to this outbreak The karst geology of the island containing caves cracks and fractures along with a thin soil layer increase the risk of groundwater contamination Large amounts of rainfall or melting snow may flush contaminants such as septic tank discharge from the upper soils into groundwater wells Ohio Department of Natural Resources monthly regional precipitation reports for the years 1951ndash2000 and 2004 were reviewed This regional data provides an average of precipitation for several sample points in north central Ohio South Bass Island rainfall data collected at Perryrsquos Monument from 1977 through 1997 were also reviewed Island-specific data were compared to the regional precipitation data to identify major differences and existing trends
Results
bull Average monthly precipitation on South Bass Island is 020ndash058 inches less than north central Ohio precipitation for all months except August September and October During these months the rainfall on South Bass Island is greater (Attachment 16)
bull The average yearly precipitation for the north central Ohio region is 3509 inches compared to the South Bass Island yearly average of 3177 inches
bull In 2004 north central Ohio precipitation exceeded the historical average for the region by 458 inches in May 123 inches in June 034 inches in July and 040
19
inches in August
Discussion
Regional precipitation for the months of March May June July and August 2004 is higher than historical measures and may have contributed to contamination of groundwater wells on South Bass Island Periods of high precipitation can cause contaminants from sewage treatment facilities to be flushed into the groundwater aquifer Periods of high snow melt may have the same effect on groundwater quality Although higher then normal precipitation may exacerbate the problem of groundwater contamination on the island it should not be considered the single contributing factor to this outbreak Continued use of on-site systems in this type of soil and geologic environment will result in continued contamination of the groundwater regardless of variations in precipitation (National Research Council 2001 Rose et al 2001)
Conclusions
Conclusion 1 Suspected Source of Etiological Agent
Sewage has contaminated the groundwater aquifers that provide drinking water to South Bass Island Inadequate soil depth to bedrock which is fractured and contains numerous solution channels contributes to the problem This increases the likelihood that on-site subsurface sewage disposal systems at homes and businesses are introducing sewage directly into groundwater supplies The karst formation of the island facilitates the movement of sewage into the aquifer and the movement of contaminated groundwater within the aquifer (Gunn et al 1997 Jack 1999 Malard et al 1994 Yates 1987)
The subsurface disposal of sewage is not the only contributor to the contamination of the aquifer Another source could be poorly maintained malfunctioning and possibly undersized package wastewater treatment plants In addition on-site wastewater disposal systems designed to discharge to surface water could be introducing untreated or poorly treated wastewater to the shoreline of the island Depending on the location duration and volume of discharge this situation may expose swimmers and recreational water enthusiasts to contaminated water Considering the apparent influence of surface water on South Bass Island groundwater supplies contaminated surface water could be mixing with groundwater
Because of the thin layer of soils on the island water runoff may move contaminants from the ground surface into the aquifer through openings and cracks near the ground surface (Centers for Disease Control 1999 Michaud et al 2004) The possible connection between the septage disposal site and contamination of the aquifer has not been adequately investigated (Keswick 1984 Kowel 1982)
Conclusion 2 Suspected Mode of Contamination of Water Supply
20
A review of operational records and bacteriological results for water leaving the water treatment plant does not support a link between drinking water from this source and illness Cross connections were found between auxiliary wells and the village water distribution system These cross connections could have allowed contaminated groundwater to enter the public water distribution system However a review of routine bacteriological results maintained on the distribution system did not find evidence of wide-spread contamination in the distribution system All water samples collected from the distribution system before and during the outbreak are negative for standard indicator organisms In addition water from the public water systems was not implicated in the outbreak by the epidemiologic investigation
Backflow prevention devices were installed at cross-connected auxiliary wells A properly functioning backflow prevention device prevents water from flowing back into the water service line that connects the building to the distribution main After removing the cross connections one reduced pressure zone (RPZ) valve was examined At the time of inspection the valve was found to not be working properly Reports did not indicate that other backflow prevention devices were tested If backflow prevention devices were not operating properly contaminated groundwater could have entered the buildingrsquos water service line and the public water distribution system
Two auxiliary wells that were discovered to be cross-connected at the time of the outbreak were sampled One of these auxiliary wells was positive for total coliform and E coli The second well was positive for C jejuni The cross connected wells may have provided contaminated groundwater a mode of entry into the public water distribution system
Drinking water from a groundwater well on South Bass Island is identified in the epidemiological investigation as the likely source of exposure for those individuals reporting illness The environmental investigation supports this conclusion Groundwater samples collected in response to this outbreak found strong indicators of fecal contamination (Haas et al 1999 National Research Council 2004) E coli was positive in 30 to 40 of collected groundwater samples The geographical distribution of these sample locations indicates widespread contamination of the groundwater aquifer On-site wastewater systems are installed in soils identified as having severe limitations for septic tank absorption fields (Musgrave et al 1985) The karst geology of the island provides a direct connection between on-site wastewater system effluent and the drinking water aquifer Well logs report numerous subsurface voids openings crevices and caves many below the protective casing depth This facilitates the mixing of sewage with groundwater in well holes and the movement of lake water into the aquifer (Gunn et al 1997 Maire 1994 Malard 1994 Tranter 1997)
Conclusion 3 Possible Reasons the Etiological Agents Survived in the Water Supply
The demand on island sewage and water systems during peak visitation periods especially summer weekends increases when an average of 15000 tourists visit the island In a short period (2-day weekends) large volumes of ground and surface water are used and returned
21
to the subsurface of the island or to the lake as wastewater This surge of wastewater into the islandrsquos many small on-site wastewater treatment and disposal systems may result in the discharge of inadequately treated sewage into the subsurface of the island and the lake The thin soil layer and the fractured karst geology allow sewage discharged to the subsurface to move quickly (days to weeks) into the drinking water aquifer Sewage contaminated lake water may also move under the island and mix with groundwater used for drinking
This weekly surge of sewage into the islandrsquos subsurface and surrounding lake water may contain a heavy concentration of pathogens Hardy pathogens including Cryptosporidium Giardia Campylobacter and Salmonella were detected in South Bass Island groundwater samples Cryptosporidium and Giardia were also detected in the untreated wastewater sample collected from the municipal wastewater treatment facility
The protozoa Cryptosporidium and Giardia do not easily move through soils Their detection in groundwater is an indication that other organisms may also be moving through the subsurface unimpeded Consuming as few as 10ndash25 Giardia cysts can cause infection Giardia cysts maintain viability for up to 3 months in cold water Studies conducted on Cryptosporidium found oocysts surviving in soils for 60ndash180 days and in surface water and groundwater for 176 days (Salvato 1992 Percival et al 2004) As few as 30 oocysts can cause infection in healthy individuals (Moe 1997 Percival et al 2004 Salvato 1992)
The infectious dose of Campylobacter is a few hundred organisms Studies have isolated Campylobacter from surface water and this bacterium is commonly found in high numbers in domestic sewage The survival of Campylobacter in the environment is dependent upon temperature and other factors with the range being a few days to weeks (Fricker 1999 Moe 1997 Percival et al 2004)
Salmonella can survive in soils for 1ndash120 days in surface water from days to 2 months and in groundwater for 70 days In addition to being able to survive in water for prolonged periods Salmonella is also able to grow in warm polluted waters Studies have identified large numbers of Salmonella in the effluent of wastewater treatment plants The infective dose of Salmonella can be as few as 1000 organisms (Gerba et al 1984 Percival et al 2004 Salvato 1992)
The geology of South Bass Island provides an avenue of connection between surface water runoff sewage lake water and the groundwater aquifer (Graham et al 1998 Musgrave et al 1985 Myers et al 2000) The influx of visitors on weekends to the island creates a demand for water that draws available recharge water to groundwater wells This demand for water may facilitate contamination of groundwater from on-site systems and increase the mixing of lake water with groundwater These periods of high water use also generate a high volume of sewage that existing systems may be unable to adequately treat This cycle of water demand and sewage discharge in the unique geology of South Bass Island creates a system that may allow a heavy concentration of viable pathogens to move quickly from host to susceptible persons
22
The lack of a treatment barrier also influences the survival of pathogens in water The number of households and business establishments using point-of-use water treatment equipment is unknown Groundwater may not be filtered or disinfected before consumption
Conclusion 4 Isolation of Suspected Etiological Agent From Water Supply
Indicators of fecal contamination were found in groundwater samples collected from South Bass Island Total coliforms Ecoli fecal coliforms somatic coliphages F-specific coliphages Clostridium perfringens Salmonella DNA Cryptosporidium DNA Giardia adenovirus DNA enterovirus DNA enterococci and Campylobacter (by culture genus and species DNA) were detected in water samples Campylobacter jejuni Arcobacter butzleri Campylobacter upsaliensis and Acinetobacter were also detected in South Bass Island water samples
Campylobacter Salmonella Group B norovirus and Giardia were isolated from ill persons Molecular sub-typing of C jejuni found the pattern of clinical isolates to differ from the pattern of C jejuni isolated from water This investigation was unable to genetically match a pathogen isolated from an environmental sample with a clinical isolate collected from an ill individual Considering the number and variety of pathogens and indicators of fecal contamination identified in South Bass Island water samples this lack of a genetic match should not be taken as evidence that groundwater is not linked to the illnesses (Baumann 1968 Hunter et al 2003 National Research Council 2004 Percival et al 2004)
Recommendations
Recommendation 1 All housing units and commercial establishments on the island should be served by a public sewage collection and disposal systems and a public water supply system Extending public water supply lines without provision of public sewer system could result in higher water use and an increase in the volume of wastewater generated per household and business Extending water supply lines to most of the island could result in additional residential and commercial development This growth may increase water use and wastewater production on the island If such development took place without adequate sewage disposal system expansion contamination of the aquifer could actually increase In addition increased water use would require expansion of the existing public water treatment facility
Recommendation 2 The septage disposal site should be closed and septage be disposed of at the sewage treatment facility or off the island at a site and methods approved of by local and state health and environmental authorities An assessment should be made to determine if the septage disposal site is contributing to the contamination of the aquifer If pathogens are present on the ground surface in the soil or in the subsurface at this location action should be implemented to remove this contamination source
Recommendation 3 Residents should not consume groundwater unless the source has a
23
demonstrated history of negative bacteriological results All Island groundwater should be treated before consumption The Pennsylvania Department of Environmental Protection document listed in the reference section of this report provides treatment guidelines (Pennsylvania Department of Environmental Protection 2003)
Recommendation 4 For all groundwater supplies on South Bass Island local and state environmental and health authorities should determine the influence of surface water on groundwater Inform those that plan to use groundwater that may be under the influence of surface water of precautions and actions needed to ensure safe drinking water Surface water treatment methods and procedures may need to be implemented when regulated systems use groundwater under the influence of surface water
Recommendation 5 Local and state environmental and health authorities should develop a sewage management plan for South Bass Island The severe soil and geologic limitations for conventional soil-based on-site wastewater disposal systems on South Bass Island may preclude the continued use of these types of systems (Ohio Department of Health 2005) Continued use of existing on-site wastewater disposal systems will likely result in persistent contamination of groundwater supplies and present a serious risk to public health A moratorium on the construction of new on-site wastewater treatment and disposal systems should be imposed until a sewage management plan is developed and implemented
Recommendation 6 Repair and alteration of existing on-site systems or the permitting of any new construction on the island would require extensively engineered alternative systems to overcome soil depth and permeability issues These systems would likely need to be elevated pressure-dosed alternative wastewater systems such as mounds However mound-type systems are often costly and require much more maintenance than conventional systems They also have a high probability of failure when used in high water use or ldquoshock-loadingrdquo situations such as those that typically occur in the summer months for business establishments located on South Bass Island Increased monitoring of existing package treatment plants during high use periods should be part of the sewage management plan
Recommendation 7 Another possible alternative to on-site wastewater disposal would be the development of one or more centralized wastewater treatment system (package plant) with surface water discharge Given the extreme fluctuation in island population during the summer months treatment facilities would need to be designed to accommodate maximum wastewater loading during peak wastewater discharge periods These systems are often costly and must comply with the NPDES provisions of the Clean Water Act Extensive maintenance and monitoring would be required along with the hiring of certified operators to manage and maintain the systems The greatest advantage to using surface water discharge as the primary method of wastewater disposal is that it reduces the threat of further groundwater contamination from on-site wastewater disposal This threat is not entirely eliminated however because of the characteristics of karst environments Any discharge that reaches losing or disappearing streams (a stream reach in which the water table adjacent to the stream is lower than the water surface in
24
the stream causing infiltration from the stream channel recharging the groundwater aquifer and decreasing the stream flow) that feed groundwater could then contaminate the aquifer
Recommendation 8 Local and state environmental and health authorities should develop and implement a public information effort to inform business owners and residents using groundwater wells of the potential exposure and health risks Provide information on protective measures and options available to reduce exposure to contaminated drinking water
Recommendation 9 Local and state environmental and health authorities should identify all private and business auxiliary wells to ensure that no additional cross connections exist within the distribution system
Recommendation 10 To ensure that all cross connections have been removed a tracer test using an inert substance should be considered The inert tracer would be added to the auxiliary well Drinking water within the home or business would then be analyzed for presence of the tracer
Recommendation 11 Local and state environmental and health authorities should identify and properly close abandoned wells and all improperly developed dug wells Place a moratorium on new well installation until appropriate well development guidelines can be written for South Bass Island
Recommendation 12 Local and state environmental and health authorities should assess water supplies and wastewater treatment facilities located on other islands with karst geology to determine if similar groundwater contamination issues exist
This Trip Report summarizes the field component of our EIP-AID investigation Because of the preliminary nature of this investigation future correspondence MMWR articles or other published reports might present results interpretation and recommendations
that are different from those contained in this document
25
References
Baumann P 1968 Isolation of acinetobacter from soil and water J Bacteriol 96 39ndash42
Blackburn BG Craun GF Yoder JS Hill V Levy DA Chen N et al 2004 Surveillance for waterborne-disease outbreaks associated with drinking watermdashUnited States 2001ndash 2002 MMWR 53(8) 23ndash39
Centers for Disease Control and Prevention 1999 Public health dispatch outbreak of escherichia coli 0157H7 and campylobacter among attendees of the Washington County FairmdashNew York 1999 MMWR 48(36)803
Centers for Disease Control and Prevention 1998 A survey of the quality of water drawn from private wells in the nine Midwestern states Atlanta GA US Department of Health and Human Services
Fetter CW 1980 Applied hydrogeology Columbus OH Charles E Merrill Publishing Company
Freeze RA Cherry JA 1979 Groundwater Englewood Cliffs NJ Prentice-Hall Inc
Fricker C 1999 Campylobacter In Waterborne pathogens AWWA Manual M48 Denver CO American Water Works Association
Gerba PG Bitton G 1984 Microbial pollutants their survival and transport pattern to groundwater In Britton G Gerba CP editors Groundwater pollution microbiology New York NY John Wiley amp Sons Inc p 65ndash84
Graham GW NrsquoDeye MN Brown LC 1998 Ohio State University fact sheet water resources of Ottawa County Retrieved on September 24 2004 from httpohiolineosueduaex-fact0480_62html
Gunn J Tranter J Perkins J 1997 Sanitary bacterial dynamics in a mixed karst aquifer Proceedings of workshop W2 held at Rabat Morocco AprilMay 1997 24761ndash70
Haas CN Rose JB Gerba CP 1999 Quantitative microbial risk assessment New York NY John Wiley amp Sons Inc
Hunter PR Waite M Ronchi E 2003 Drinking water and infections diseasendashestablishing the links Boca Raton FL CRC Press LLC
Jack JD 2005 Environmental problems in karst lands Retrieved on February 3 2005 from httpcwxprenhallcombookbindpubbooksnebel2medialibupdate13html
Keswick BH 1984 Sources of groundwater pollution In Britton G Gerba CP editors
26
Groundwater pollution microbiology New York NY John Wiley amp Sons Inc p 39ndash64
Kowel NE 1982 Health effects of land treatment microbiological Cincinnati OH Environmental Protection Agency Health Effects Research Laboratory Washington DC US Environmental Protection Agency (EPA) 6001-82-007
Lance JC 1984 Land disposal of sewage effluents and residues In Britton G Gerba CP editors Groundwater pollution microbiology New York NY John Wiley amp Sons Inc p 198ndash220
Maire R Pomel S 1994 Karst geomorphology and environment In Gilbert J Danielopol DL Stanford JA editors Groundwater ecology San Diego CA Academic Press
Malard F Reygrobbellet JL Soulie M 1994 Transport and retention of fecal bacteria at sewage-polluted fractured rock sites J Environ Qual 231352ndash63
Michaud S Menard S Arbeitt RD 2004 Campylobacteriosis Eastern townships Quebec Emerging Infectious Diseases 10(10)1844ndash7
Moe CL 1997 Waterborne Transmission of infectious agents In Hurst CJ Knudsen GR McInerney MJ Stetzenbach LD Walter MV editors Manual of environmental microbiology Washington DC American Society of Microbiology
Musgrave DK Derringer GD 1985 Soil survey of Ottawa County Ohio Washington DC Government Printing Office
Myers DN Thomas MA Frey JW Rheaume SJ Button DT 2000 Water quality in the Lake Erie-Lake Saint Clair DrainagesmdashMichigan Ohio Indiana New York and Pennsylvania 1996ndash98 US Geological Survey Denver CO US Geological Survey Circular
National Research Council 2004 Indicators for waterborne pathogens Washington DC The National Academies Press
National Research Council 2001 Under the weathermdashclimate ecosystems and infectious disease Washington DC The National Academies Press
Newell AL 1995 The caves of Put-in-Bay Put-in-Bay OH Lake Erie Originals
Ohio Department of Health 2005 Household sewage systems Ohios decentralized wastewater infrastructure Retrieved on September 7 2005 from httpwww2odhohiogovODHProgramsSEWAGESewPubswastwtrPDF
Pennsylvania Department of Environmental Protection 2003 Drinking water treatment
27
technologies for groundwater systems under the direct influence of surface water Harrisburg PA Bureau of Water Supply and Wastewater Management 2001 Retrieved on July 13 2005 from httpwwwdepstatepausdepdeputatewatermgtWSMWSM_DWMTechnolTrt_GU DIhtm
Percival SL Chalmers RM Embrey M Hunter PR Sellwood J Wyn-Jones P 2004 Microbiology of Waterborne Diseases San Diego CA Elsevier Ltd
PIB Chamber of Commerce Lodging information Retrieved on February 7 2005 from httpwwwput-in-baycom
Rose JB Epstein PR Lipp EK Sherman BH Bernard SM Patz JA 2001 Climate variability and change in the United States potential impacts on water and foodborne diseases caused by microbiological agents Environ Health Perspects 109(2)211ndash21
Salvato JA 1992 Environmental engineering and sanitation 4th ed New York NY John Wiley amp Sons Inc
Tranter J Gunn J Hunter C Perkins J 1997 Bacteria in the Castleton karst Derbyshire England J Engineering Geol 30171ndash8
US Census Bureau 2000 Put-in-Bay Township housing information Retrieved on February 7 2005 from httpfactfindercensusgov
US Department of the Interior 1985 Groundwater manualmdasha water resource technical publication Bureau of Reclamation Denver CO US Government Printing Office
US Environmental Protection Agency 1984 National statistical assessment of rural water conditions Washington DC US Environmental Protection Agency (EPA) 5709shy84-003
US Environmental Protection Agency 1999 Environmental Protection Agency guidance manual for conducting sanitary surveys of public water systems Surface water and groundwater under the direct influence (GWUDI) Washington DC US Environmental Protection Agency (EPA) 815-R-99-016
Verber JL Stansbery DH 1953 Caves in the Lake Erie Islands The Ohio Journal of Science 53(6)358ndash62
Yates MV 1987 Septic tank siting to minimize the contamination of groundwater by Microorganisms Washington DC US Environmental Protection Agency Office of Water Protection (EPA) 440 6-87-007
28
ATTACHMENTS
Environmental Health Assessment for Epi-Aid 2004-076 Outbreak of Gastroenteritis with Multiple Etiologies among Resort Visitors and
ResidentsmdashOhio 2004
29
80
70
60
s 50
cas
ef
oer 40
bmu
N 30
20
10
0
Giardia (n=3)
Salmonella Typhimurium (n=1)
Campylobacter (n=16)
Norovirus (n=9)
Suspect cases
530 66 613 620 627 74 711 718 725 81 88 815 822 829 95 912 919
Date of Onset
ATTACHMENT 1 Cases of gastroenteritis by date of onset and etiology South Bass Island Ohio May 30ndash September 12 2004 (N = 1450)
30
ATTACHMENT 2 INFORMATION ON SOUTH BASS ISLAND OHIO
South Bass Island (Longitude ndash8284970 Latitude 416021) in Ottawa County Ohio is located approximately 50 miles east of Toledo and 72 miles west of Cleveland Ohio South Bass Island Middle Bass Island and North Bass Island are collectively referred to as the Bass Islands of Ohio South Bass Island is the most developed of the three islands The village of Put-in-Bay is located on South Bass Island Middle Bass Island is situated between South and North Bass Islands North Bass Island is the farthest island from the Ohio mainland and the closest to the Canadian boarder (Figure 1)
The city of Port Clinton (population 11000) the capitol of Ottawa County Ohio is the nearest mainland city to South Bass Island South Bass Island is accessible by watercraft and air transportation Two ferry lines serve South Bass Island one carries only passengers and operates between Port Clinton and Put-in-Bay (12 mile trip ) the other carries passengers and vehicles and operates between Catawba Island and the southern point of South Bass Island (3 mile trip) Ferry service is not available during the winter months though air service is available year-round When Lake Erie freezes local residents also travel over the ice to get to and from South Bass Island and the mainland
Figure 1 Bass Islands Lake Erie Ohio
Source United States Geological Survey Put-in-Bay Topographic Map httpwwwterraservercom
31
South Bass Island is 5705 feet above sea level and covers an area of 1382 acres The island is 35 miles long by 15 miles wide it is 5 miles from the international border with Canada (Figures 2 amp 3) The island has an average annual temperature of 506degF with the annual average precipitation being among the lowest in the state at 2905 inches
Figure 2 Aerial Photograph Bass Islands Lake Erie Ohio
Source httpwwwterraservercom
South Bass Island a popular vacation destination from April through October attracts visitors from Ohio neighboring states and Canada Island activities include fishing boating swimming golfing camping bird watching and exploring caves and the unique geology of South Bass Island Vineyards and a winery are located on South Bass Island These and the many other South Bass Island activities and special events bring an estimated 15000 visitors to the island each week of the tourist season Visitor information for South Bass Island lists 21 tourist and recreational attractions 25 restaurants and taverns 14 shopping venues 11 providers of transportation services 11 bed and breakfasts 15 short-term rental homes 11 hotels and 2 campgrounds
32
Services on South Bass Island include a bank six boat docking and marina facilities two churches a fuel distributor two grocery stores a hardware store laundry police fire and emergency medical services post office library and a school
The islandrsquos public service infrastructure includes the Put-in-Bay public water system and wastewater treatment facility operated and managed by the municipality Portions of the island not served by public water and sewer use groundwater wells and on-site wastewater treatment and disposal systems
The 1990 US Census reports 679 drilled wells and 27 dug wells in use in Put-in Bay Township and 191 connections to the public water system The census reports 114 connections to the public sewer system and 749 septic tanks or cesspools in the township The 1990 US Census for the Village of Put-in-Bay reports 110 connections to the public water system and 82 housing units served by a drilled well The census reports 61 connections to the public sewer system and 127 septic tanks or cesspools in use in the village
The 1990 census figures are used here because well and septic system data were not collected in the more recent 2000 census
Septage from island septic tanks is land-applied near the center of the island Solid waste generated on the island is collected for disposal on the mainland
The Put-in-Bay TownshipSouth Bass Island 2000 US Census reports the following
bull Population 763 bull Median age of residents 451 years bull Total housing units 1264 bull Occupied housing units 355 (28) bull Vacant housing units 909 (72)
(851 [67] of the vacant housing units are seasonal recreational occasional use units)
bull Homeowner vacancy rate 3 bull Rental vacancy rate 29 bull Average household size of owner-occupied units 225 bull Average household size of renter-occupied units 176
33
Figure 3 Topographic Map of Bass Islands Lake Erie Ohio
Source United States Geological Survey Put-in-Bay Topographic Map at httpwwwterraservercom
34
ATTACHMENT 3
Aerial photograph identifying 11 NCEH water sample collection locations South Bass Island Ohio August 30ndashSeptember 2 2004
Photograph Source National Oceanic and Atmospheric Administration at httpmfproductsnosnoaagovimagesphotos5wn21675gif
Information Source NCEH Ultrafiltration Sampling Records South Bass Island August 30ndashSeptember 2 2004
35
Sample Locations
bull Sample 01 ndash August 30 2004mdashVillage of Put-in-Bay Water Treatment Plant bull Sample 02 ndash August 30 2004mdashPerryrsquos Monument National Park Service Maintenance
Building at 17 Park Avenue bull Sample 03 ndash August 30 2004mdashSaunders Cottages North Well at 1495 Catawba bull Sample 04 ndash August 31 2004mdashPerryrsquos Cave 979 Catawba bull Sample 05 ndash August 31 2004mdashJoersquos Bar and Grill (Press House) 1400 Catawba bull Sample 06 ndash August 31 2004mdashIrvingrsquos Put-in-Bay Deli 2110 Langram bull Sample 07 ndash September 1 2004mdashHeinemanrsquos Winery 978 Catawba bull Sample 08 ndash September 1 2004mdash1282 Catawba bull Sample 09 ndash September 1 2004mdash1210 Catawba bull Sample 10 ndash September 2 2004mdash1391 Put-in-Bay Road bull Sample 11 ndash September 2 2004mdash1030 Put-in-Bay Road
Ultrafiltration Sample Collection Field Notes South Bass Island Ohio August 30ndashSeptember 2 2004
Sample 01 ndash August 30 2004mdashVillage of Put-in-Bay Water Treatment Plant Centrally located on the eastern shore of South Bass Island the water treatment plant is designed for daily operation at 0216 million gallons per day (MGD) and a maximum production of 0288 (MGD) Water for the plant is drawn from Lake Erie The plant has five treatment chambers each with a maximum loading capacity of 50 gallons per minute (gpm) Treated water is chlorinated and pumped to a 200000 gallon elevated storage tank The water then flows into the distribution system serving the Village of Put-in-Bay on the north side of the island The distribution system connects to 104 commercial meters and 95 residential water meters
Sample 02 ndash August 30 2004mdashPerryrsquos Monument National Park Service Maintenance Building at 17 Park Avenue The National Park Service site is one of the most distant locations of the community water distribution system The sample was taken at the maintenance building breakroom sink Because the National Park Service site was connected to the Put-in-Bay Village water distribution system no property environment assessment was needed A free chlorine residual was measured at 041 parts per million (ppm)
Sample 03 ndash August 30 2004mdashSaunders Cottages North Well at 1495 Catawba The Saunders Cottages are small cottages located on the west side of the island near the shore line The north well supplies water to approximately six cottages in this area No septic tanks were used Wastewater is treated by a small aeration package plant located north of the cottages A chlorinator was installed on the north well but was turned off several hours before sampling The sample was collected from a tap upstream from the chlorinator The free chlorine residual was measured at 004 ppm
Sample 04 ndash August 31 2004mdashPerryrsquos Cave 979 Catawba Perryrsquos Cave is a tourist
36
attraction for an underground cavern It is located inland across the road from the Heineman Winery The property has a miniature golf course gift shop a gold panning sluice and a butterfly house The water supply for the business is obtained from underground creek in the cave located directly under the gift shop The property was equipped with a septic tank located northwest of the gift shop and cavern The water system was flushed for approximately 40 minutes before sampling Free chlorine testing of the water supply was frequently made while the system was being flushed The free chlorine residual was measured at 002 ppm The water was not chlorinated
Sample 05 ndash August 31 2004mdashJoersquos Bar and Grill (Press House) 1400 Catawba Joersquos Bar amp Grill is a restaurant and bar located at the corner of Catawba and Meechen Roads opposite a cemetery The property also had two dormitory type housing units The well was located at the southeast corner of the metal building located behind or south of the bar An old stone-lined septic leach tank was recently replaced with three 1500 gallon sewage holding tanks The septic leach tank that was removed measured 20 feet long 6 feet wide and 6 feet deep It was a stone-lined ldquotankrdquo with no lateral lines The owner was ordered to abandon this system and replace it with the storage tanks The well was run approximately 2 hours before sampling The well was equipped with a chlorinator but it was not working during our visit No chlorine residual was detected
Sample 06 ndash August 31 2004mdashIrvingrsquos Put-in-Bay Deli 2110 Langram The deli and convenience store was located on the south end of the island near the shore and next to the ferry dock An employee dormitory was located on the property but was supplied by another well The well for the deli was located on the northeast side of the property near the driveway to the ferry loading area The sewage was pumped from the property through a lift station to a small package treatment plant on the north side of Langram Road The well was run approximately 4 hours before sampling It had reportedly been chlorinated several days prior The chlorine residual was detected at 001 ppm
Sample 07 ndash September 1 2004mdashHeinemanrsquos Winery 978 Catawba The property is a local winery with a gift shop and restaurant and bar Located north of the winery was a single-story house The well casing was located in a pit under a metal plate of the sidewalk leading to the restaurant and bar Because the casing is located below the ground surface it is also prone to being flooded and had reportedly flooded as recently as August 16 2004 Two septic tanks served the house a 250-gallon tank and a 1000shygallon tank The septic tanks were located on the west side of the house and were being pumped during our visit of September 1 2004 The drainfield pipes had been capped August 19 2004 and tanks were being pumped on an as-needed basis Two 1000-gallon tanks serving the restaurant and bar located on the southwest side of the winery were also capped on August 17 2004 and are also pumped on an as-needed basis The well was equipped with a chlorinator and was turned off several hours before sampling Water was taken from a tap upstream from the chlorinator The well ran a minimum of 4 hours before sample collection No chlorine residual was detected
Sample 08 ndash September 1 2004mdash1282 Catawba The residence was a single-family home located adjacent north and west of a septage disposal site The residence well was
37
located at the southwest corner of the property and was located approximately 72 feet from the septic tank and 50 feet from the drainfield The well was not equipped with a chlorinator Water was run at three sinks in the home for 15 hours while water the sample was being taken No chlorine residual was detected
Sample 09 ndash September 1 2004mdash1210 Catawba The residence was a single-family home surrounded on all but the west side of the septage disposal site The well was located in the back yard approximately 54 ft from the septic tank Water was run for approximately 25 hours before sampling The free chlorine residual was detected at 002 ppm
Sample 10 ndash September 2 2004mdash1391 Put-in-Bay Road The residence was a single-family home with a museum located approximately 100 feet northwest of the home The museum belonged to the homeowner The property was located west of septage disposal site The well was located on the northwest side of the home A septic tank was located behind the home and a gray water disposal area was located between the home and the museum The well was not chlorinated and had not been disinfected recently Water was run for approximately 30 minutes before sampling Chlorine residual was detected at 002 ppm
Sample 11 ndash September 2 2004mdash1030 Put-in-Bay Road The residence was a single-family home located northeast of the septage disposal site The well was located next to the home on the south side The septic tank was located behind the home to the east The well was not chlorinated and according to the owners had not been disinfected this year Chlorine residual was detected at 001 ppm
Wastewater Sample ndash August 30 2004mdashVillage of Put-in-Bay Wastewater Treatment Plant A 250-mL sample of raw wastewater was collected from the wastewater treatment plant The bottle was capped and labeled as ldquowastewaterrdquo The 250shymL bottle was double-bagged and sealed with tape and immediately stored on ice The ice-packed wastewater sample was delivered to the Centers for Disease Control and Prevention (Atlanta Georgia) on August 31 2004 for testing
38
ATTACHMENT 4
Environmental Sampling Conducted in the Investigation of a Suspected Waterborne Outbreak
South Bass Island Ohio AugustndashSeptember 2004
Analytical Results from the Water and Environmental Projects Laboratories of the Division of Parasitic Diseases Centers for Disease Control and Prevention (CDC)
National Center for Infectious Diseases
Water and Wastewater Sampling Performed by CDC National Center for Environmental Health (NCEH) Field Team
Between August 30 and September 2 2004 a field team from CDCNCEH collected 1 wastewater sample and 11 water samples from South Bass Island Ohio The wastewater sample was an approximately 250-mL sample of raw sewage collected at the Put-in-Bay wastewater treatment facility This sample was collected to determine if wastewater generated and treated on the island would give an indication of what pathogens were circulating in the human population working residing on and visiting South Bass Island Of the 11 water samples collected 1 was from the raw water intake of the Put-in-Bay water treatment plant (Sample 1) 1 was the finished water from the water treatment plant (Sample 2) 5 were groundwater from transient noncommunity (TNC) public water supplies (Samples 3ndash7) and 4 were from private wells (Samples 8ndash11) Table 1 provides information on the sampling sites and conditions
All water samples were concentrated using an ultrafiltration technique developed at CDC Briefly 50 L of water was collected and concentrated in the field using an ultrafilter module having a molecular weight cut-off of ~20000 daltons a pore size small enough to enable the ultrafilter to effectively retain all solid particles (including microbes) in the water samples If a free chlorine residual was detected in water to be sampled sodium thiosulfate was added to deactivate the disinfecting properties of chlorine A negatively charged chemical sodium polyphosphate was used to pretreat all ultrafilters and was also added to each water sample This was done to reduce potential sticking of microbes to the surfaces of the ultrafilter system All samples were concentrated to 200ndash250 mL (termed ldquoretentaterdquo) All samples and ultrafilters were stored and shipped refrigerated to CDC for further processing and analysis
Water and Wastewater Analysis at CDC
At CDC the ultrafilters were backflushed with a surfactant solution to remove residual microbes from the filter surfaces This backflush water was added to the corresponding retentate and the combined sample centrifuged to concentrate bacteria and parasites in the samples The supernatant from the centrifugation process was treated using chemical precipitation to concentrate viral pathogens in the samples In general coliphages were assayed directly from retentate not from the precipitation-concentrated samples
39
The ldquobacteria and parasite pelletsrdquo were resuspended and aliquoted for analysis by several different labs at CDC bull the Campylobacter reference laboratory (Collette C Fitzgerald) bull the water and environmental projects laboratory (Vincent Hill) bull the waterborne parasite laboratory (Michael J Arrowood) and bull the parasite genotyping laboratory (Lihua X Xiao)
This report presents the results of the water and environmental projects and waterborne parasite laboratories The parasite genotype analyses are not yet completed The results of the Campylobacter reference laboratory are summarized in a separate report
In addition to analyzing the samples for pathogenic microbes CDC also analyzed samples for microbial indicators of fecal contamination The microbial indicators studied are enteric microbes that do not tend to multiply in the environment Thus their presence in environmental samples can be considered an indication that the sampled water have been contaminated to some degree by fecal matter (which could either be from humans or animals) Fecal coliforms and Escherichia coli are well-established bacterial indicators of fecal contamination Clostridium perfringens are spore-forming bacteria that are highly persistent under environmental conditions (especially versus viruses and non-sporeshyforming bacteria) The presence of C perfringens is a conservative indicator of fecal contamination as the presence of the spores can reflect historical fecal contamination (months to many years) Somatic and F-specific coliphages are viruses that infect coliform bacteria Thus they are normal gastrointestinal microfloras that are fairly specific indicators of fecal contamination Research has suggested that coliphages are superior to coliform bacteria as indicators for the presence of viral pathogens
Summary of Results
The wastewater analyses indicate that the wastewater sampled contained concentrations of microbial indicators that are typical of untreated private wastewater (Table 2) All positive microbial detections for this sample and the water samples are highlighted in Table 2 by shaded cells Cryptosporidium spp and adenoviruses were also detected in the wastewater sample using real-time (TaqMan) polymerase chain reaction (PCR) The aliquot of the wastewater sample assayed by immunomagnetic separation (IMS) and an immunofluorescent antibody (IFA) kit (a standard microscopy technique for these parasites) was found to be positive for Giardia spp Fluorescent structures that were considered to possibly be Cryptosporidium were also observed in the wastewater sample but these particles did not have the typical size expected for Cryptosporidium and thus are not reported here as being positively identified as Cryptosporidium Additional analysis of the wastewater sample by IMS-IFA microscopy and nested PCR genotyping report negative results for Cryptosporidium and positive results for Giardia
We found water collected at the raw water intake at the Put-in-Bay water treatment facility to be positive for four microbial indicators as well as for Cryptosporidium spp (by both PCR and microscopy) In the finished water collected from the Put-in-Bay
40
distribution system we did detect the DNA of Cryptosporidium It is not known whether this detection reflects the presence of viable or infectious Cryptosporidium PCR results are a very conservative indicator of fecal contamination and health risks as the PCR test can detect DNA that is not associated with viable or infectious pathogens However this data can be considered as warranting additional investigation of the effectiveness of equipment and procedures used at the Put-in-Bay water treatment facility
Of the five TNC wells sampled three were found to contain fecal coliforms and E coli Two of these wells (Samples 5 and 7) contained relatively high concentrations of E coli In addition three of the five wells contained either somatic coliphages or F-specific coliphages One of the wells contained C perfringens Only one of the wells (Sample 3) did not contain a culturable microbial indicator of fecal contamination However Sample 3 as well as three other samples was found to be positive for Salmonella by PCR (using two different PCR assays) We were not able to culture Salmonella from any of these samples This is not necessarily surprising as the PCR technique can detect nonviable and viable-but-not-culturable (VBNC) microbes In addition to Salmonella three other pathogens were detected in the TNC wells using PCR Cryptosporidium (in three of five wells) adenovirus (in one of five wells) and enterovirus (in one of five wells) While the IMSIFA analyses for Cryptosporidium are negative the analyses did detect a single Giardia cyst in Sample 5 This is a significant finding as the presence of this parasite (which is fairly large with a diameter of 12 microm) indicates that enteric parasites as well as smaller pathogens (ie bacteria and viruses) can enter and be transported through the subsurface aquifer at South Bass Island Additional analysis of these samples included genotyping by nested PCR Cryptosporidium hominis was detected in Sample 5 by Nested PCR Genotyping
Samples from the four private wells (Samples 8ndash11) were received at CDC on September 3 2004 and stored in a refrigerator until September 7 before further processing and analysis While significant microbial die-off likely occurred during this extending holding period two of the four samples were still found to be positive for E coli Beyond fecal coliforms and E coli none of the private well samples were found to be positive for any other microbial analyte All Salmonella cultures for the private samples are negative
41
Table 1 NCEH Field Team Water Sample Collection Log South Bass Island Ohio Investigation
Sample Collection Dates August 30 to September 2 2004
Sample Number
Location Chlorine Residual
Date Collected Date Sent to CDC
Date Received
1 Raw Water Community Water Treatment Facility
None Detected (ND)
Mon-30 Aug 31 Aug 31Aug
Notes Community Water System 2 Finished Water
Community Water Distribution System
041 ppm Mon-30 Aug 31 Aug 31 Aug
Notes Perryrsquos Monument National Park Service Maintenance Building 17 Park Ave 3 Saunders Cottages
North Well 004 ppm Mon-30 Aug 31 Aug 31 Aug
Notes Transient Noncommunity Water Supply System 4 Perryrsquos Cave 002 ppm Tue-31 Aug 31 Aug 1 Sept
Notes Transient Noncommunity Water Supply System 5 Joersquos Bar ND Tue-31 Aug 31Aug 1 Sept
Notes Transient Noncommunity Water Supply System 6 Irvingrsquos Put-in-Bay
Deli 001 ppm Tue-31 Aug 1 Sept 2 Sept
Notes Transient Noncommunity Water Supply System 7 Heineman Winery ND Tue-31 Aug 1 Sept 2 Sept
Notes Transient Noncommunity Water Supply System 8 1282 Catawba
Residence ND Wed-1 Sept 2 Sept 3 Sept
Notes Private Goundwater Well 9 1210 Catawba
Residence 002 ppm Wed-1 Sept 2 Sept 3 Sept
Notes Private Goundwater Well 10 1391 Put-in-
Bay Residence 002 ppm Thurs-2 Sept 2 Sept 3 Sept
Notes Private Goundwater Well 11 1030 Puti-in-
Bay Residence 001 ppm Thurs-2 Sept 2 Sept 3 Sept
Notes Private Goundwater Well
42
Table 2 Water and Wastewater Analytical Results from CDCNCIDDPD Water and Environmental Projects Laboratories
Sample ID Fecal
Coliforms E coli Somatic
Colipahges F-specific
Coliphages C perfringens Salmonella
PCR Salmonella
Culture
Wastewater 45000 cfumL ND ND 680000 pfumL 130 cfumL Negative lt 002 MPNmL
Sample 1 3 cfuL 2 cfuL 02 pfuL lt 01 pfumL 10 cfuL Negative lt 01 MPNL
Sample 2 lt 04 cfuL lt 04 cfuL lt 01 pfuL lt 01 pfumL lt 08 cfuL Negative lt 01 MPNL
Sample 3 lt 04 cfuL lt 04 cfuL lt 01 pfuL lt 01 pfumL lt 08 cfuL Positive lt 01 MPNL
Sample 4 lt 08 cfuL lt 08 cfuL 7 pfuL lt 09 pfumL lt 08 cfuL Positive lt 01 MPNL
Sample 5 714 cfuL 420 cfuL 92 pfuL lt 09 pfumL 11 cfuL Negative lt 01 MPNL
Sample 6 21 cfuL 20 cfuL lt 1 pfuL lt 09 pfumL lt 08 cfuL Positive lt 01 MPNL
Sample 7 135 cfuL 118 cfuL 3 pfuL 8 pfumL lt 08 cfuL Positive lt 01 MPNL
Sample 8 1 cfuL (a) 1 cfuL (a) ND ND lt 08 cfuL Negative lt 01 MPNL
Sample 9 2 cfuL (a) 1 cfuL (a) ND ND lt 08 cfuL Negative lt 01 MPNL
Sample 10 lt 06 cfuL (a) lt 06 cfuL (a) ND ND lt 08 cfuL Negative lt 01 MPNL
Sample 11 lt 06 cfuL (a) lt 06 cfuL (a) ND ND lt 08 cfuL Negative lt 01 MPNL
Notes
(a) Estimated concentration Samples were held 5 days until culture analysis ldquoltrdquo = microbe was not detected in sample at detection limit noted cfu = colony forming units pfu = plaque forming units MPN = most probable number (5-tube) ND = not done
43
Table 2 CDCCCIDDPD Analytical Results (Cont)
Sample ID Cryptosporidium
PCR Cryptosporidium
IMS-IFA Giardia
IMS-IFA GI
Norovirus GII
Norovirus Adenovirus
PCR Enterovirus
PCR
Wastewater Positive ldquoNegativerdquo (b) 151 cysts100 mL Negative Negative Positive Negative
Sample 1 Positive 15 oocsysts10 L lt 15 cysts10 L Negative Negative Negative Negative
Sample 2 Positive lt 15 oocysts10L lt 15 cysts10 L Negative Negative Negative Negative
Sample 3 Positive lt 15 oocysts10L lt 15 cysts10 L Negative Negative Negative Negative
Sample 4 Negative lt 2 oocysts10L lt 2 cysts10 L Negative Negative Negative Negative
Sample 5 Negative lt 2 oocysts10L 18 cysts10 L Negative Negative Positive Positive
Sample 6 Positive lt 15 oocysts10L lt 15 cysts10 L Negative Negative Negative Negative
Sample 7 Positive lt 15 oocysts10L lt 15 cysts10 L Negative Negative Negative Negative
Sample 8 Negative lt 15 oocysts10L lt 15 cysts10 L Negative Negative Negative Negative
Sample 9 Negative lt 15 oocysts10L lt 15 cysts10 L Negative Negative Negative Negative
Sample 10 Negative lt 15 oocysts10L lt 15 cysts10 L Negative Negative Negative Negative
Sample 11 Negative lt 15 oocysts10L lt 15 cysts10 L Negative Negative Negative Negative
(b) Approxmately 10 ldquocrypto-like structures were observed in a volume equal to 14 of the sample While these structures fluoresced brightly and were close to the expected appearance they were slightly too large (6 to 65 microm rather than the typical 45 to 5 microm oocysts of C parvum and C hominis) These structures may have been artifacts or possibly C andersonii (or equivalent) The assay was not sufficiently clear to confidently identify these structures as being Cryptosporidium spp
44
Cryptosporidium and Giardia analysis results South Bass Island Ohio
Sample LocationID Real-time PCR dagger IMS-IFA Microscopy Genotyping Nested PCRDagger
Wastewater Cryptosporidium PCR Positive
Cryptosporidium Negative
Giardia Positive (151cysts100mL)
Cryptosporidium Negative
Giardia Positive
Sample 1 Raw Water CWS Cryptosporidium PCR Positive
Cryptosporidium IMSshyIFA
15 oocsysts10 L Giardia Negative
Cryptosporidium Negative Giardia Negative
Sample 2 Finished Water PWS Cryptosporidium PCR Positive
Cryptosporidium Negative
Giardia Negative
Cryptosporidium Negative
Giardia Negative
Sample 3 Saunders Cottages North Well
Cryptosporidium PCR Positive
Cryptosporidium Negative
Giardia Negative
Cryptosporidium Negative
Giardia Negative
Sample 4 Perryrsquos Cave Cryptosporidium Negative
Cryptosporidium Negative
Giardia Negative
Cryptosporidium Negative
Giardia Negative
Sample 5 Joes Bar Cryptosporidium Negative
Cryptosporidium Negative
Giardia Positive (18cysts10 L)
Cryptosporidium hominis Positive
Giardia Negative
Sample 6 Irivings Put-In-Bay Deli Cryptosporidium PCR Positive
Cryptosporidium Negative
Giardia Negative
Cryptosporidium Negative
Giardia Negative
Sample 7 Heineman Winery Cryptosporidium PCR Positive
Cryptosporidium Negative
Giardia Negative
Cryptosporidium Negative
Giardia Negative
Sample 8 1282 Catawba Cryptosporidium Negative
Cryptosporidium Negative
Giardia Negative
Cryptosporidium Negative
Giardia Negative
Sample 9 1210 Catawba Cryptosporidium Negative
Cryptosporidium Negative
Giardia Negative
Cryptosporidium Negative
Giardia Negative
Sample 10 1391 Put-in-Bay Cryptosporidium Negative
Cryptosporidium Negative
Giardia Negative
Cryptosporidium Negative
Giardia Negative
Sample 11 1030 Put-in-Bay Cryptosporidium Negative
Cryptosporidium Negative
Giardia Negative
Cryptosporidium Negative
Giardia Negative Reporting sources Centers for Disease Control National Center for Infectious Diseases Parasitic Diseases Laboratory Atlanta GA water and environmental projects laboratory (Vincent Hill) daggerwaterborne parasite laboratory (Michael J Arrowood) and Daggerparasite genotyping laboratory (Lihua X Xiao)
45
Campylobacter results on samples collected by NCEH on South Bass Island August 30ndashSeptember 2 2004
We received 12 samples from Vincent Hillrsquos laboratory at CDC The sample numbers 1ndash11 correspond to the sample numbers used in the attachment sent by John Sarisky on 92704 entitled ldquoReleased NCID NCEH Environmental Lab Results 092404rdquo The remaining sample was a wastewater sample The results are summarized in the table below
Only one sample ldquo5rdquo was culture positive for a campylobacter-like organism This has now been confirmed biochemically and by 16S sequencing as an Arcobacter butzleri strain No sample was culture positive for Campylobacter sp
Sample Number Culture Lightcycler PCR Genus C jejuni Seminested PCR
1 NBG Neg Neg 2 NBG Neg Neg 3 NBG Neg Neg 4 NBG Neg Neg 5 Arcobacter butzleri ++ + 6 NBG Neg Neg 7 NBG Neg + 8 NBG Neg Neg 9 NBG Neg Neg
10 NBG Neg Neg 11 NBG Neg Neg
wastewater sample NBG Neg Neg NBG ndash no bacterial growth Neg ndash negative + - positive The PCR procedure described by Waage et al 1999 was followed (Waage AS Vardund T Lund V Kapperud G 1999) Detection of small numbers of Campylobacter jejuni and Campylobacter coli cells in environmental water sewage and food samples by a semi-nested PCR assay Appl Environ Microbiol 651636-43 1999 This assay is specific for C jejuni and C coli and is based on the intergenic region between two flagelling genes (flaA and flaB)
46
From Xiao Lihua X Sent Friday November 05 2004 323 PM To Hill Vincent Sarisky John Cc Beach Michael J Subject Results for Put-in-Bay Investigation-- John and Vince
Below are Crypto and Giardia genotyping results for water samples from the South Bass outbreak We also analyzed the samples for microsporidia (Enterocytozoon bieneusi) Quite a few of the samples produced bands of the expected size several (2 for each sample) of which were sequenced However we were unable to read out the sequences due to underlying signals (a sign for mixed genotypes) in the electropherogram
I apologize for taking so long to get the results back to you but I am short handed and there were five outbreaks under investigation It took us quite some efforts to genotype and subtypethe Giardia in the wastewater samples as we had to cut the PCR products out of gel several times for sequencing because of the presence of other bands
Lihua
South Bass Ohio (Put-in-Bay) Drinking Water Cryptosporidium Outbreak Sept04 Crypto Giardia
9158 Put-in-Bay Water Outbreak Ohio Sample No 1-Surface water Neg Negative 9159 Put-in-Bay Water Outbreak Ohio Sample No 2 -Treated water Neg Negative 9160 Put-in-Bay Water Outbreak Ohio Sample No 3- Saunders North Well Neg Negative 9161 Put-in-Bay Water Outbreak Ohio Sample No 4 water Neg Negative 9162 Put-in-Bay Water Outbreak Ohio Sample No 5 water C hominis Negative 9163 Put-in-Bay Water Outbreak Ohio wastewater Neg Assemblage A WA1 subtype 9164 Put-in-Bay Water Outbreak Ohio Sample No 6 water Neg Negative 9165 Put-in-Bay Water Outbreak Ohio Sample No7 water Neg Negative 9166 Put-in-Bay Water Outbreak Ohio Sample No8 water Neg Negative 9167 Put-in-Bay Water Outbreak Ohio Sample No9 water Neg Negative 9168 Put-in-Bay Water Outbreak Ohio Sample No10 water Neg Negative 9169 Put-in-Bay Water Outbreak Ohio Sample No11 water Neg Negative
47
_________ _____________________________________________
ATTACHMENT 5
Bass Island Sample Form
Sample ______ Date _______2004 Chlorinated YES No
Location (Include diagram on back show location of well septic tank drainfield house and other features)_______________________________________________________________________________
Weather Conditions _______________________________________________________
Free Chlorine Test ____PPM Nitrate Test _____PPM
Home Water Pumping Started________AM PM
Filter Apparatus Setup Start ________ AM PM Filter Apparatus Setup Complete ________ AM PM
10 ml Sodium Thiosulfate 20 L Water YES No NA 2 Tubes (15ml) Sodium Polyphosphate 20 L Water YES No Sample Start Time ______ AM PM Permeate Rate _____ mlmin
10 ml Sodium Thiosulfate 20 L Water YES No NA 2 Tubes (15ml) Sodium Polyphosphate 20 L Water YES No Sample Start Time ______ AM PM Permeate Rate _____ mlmin
5 ml Sodium Thiosulfate 10 L Water YES No NA 1 Tubes (15ml) Sodium Polyphosphate 10 L Water YES No Sample Start Time ______ AM PM Permeate Rate _____ mlmin
Ultrafilter in Ziplock Bag at ______ AM PM (on ice) (color connectorsadapters included)
250 ml polycarbonate bottle capped with retenate at ______ AM PM (on ice) (labeled the same as Ultrafilter)
Filter Apparatus Takedown Start ________ AM PM Filter Apparatus Takedown Complete ________ AM PM
Iced down and shipped overnight to CDC co Vince Hill 4770 Buford Highway MS F-36 Building 109 Room 1318 Atlanta GA 30341
48
ATTACHMENT 6 Well Log and Drilling Report ndash Historical Review 1951ndash2004
South Bass Island Ohio
Drilling Company
Total Wells Wells with CrevicesCave
s
Wells with CrevicesCave s below Well
Casing
Percent of Wells with
Crevices below Casing
Tibboles Well Drilling (1975ndash1997)
214 6 6 100
Edgil Collins Well Drilling (1988ndash1995)
80 0 0 0
Island Well Drilling (1961ndash1971)
82 36 20 56
Oddo amp Kimmet Well Drilling (1996ndash2003)
48 0 0 0
Water Well Drilling amp Supply (1956ndash1960)
32 1 1 100
NO Manahan (1948ndash1953)
15 0 0 0
Robertsonrsquos (1973ndash1997)
17 0 0 0
Clear Water Well Drilling (1995) 4 0 0 0 Dunbar Drilling (1970ndash1978) 4 0 0 0
Aicirtap Enterprises Inchellip (1979) 3 0 0 0
LG Argutte (1964ndash1969) 4 2 2 100
TOTAL 503 45 29 64
Source South Bass Island well drilling logs Ohio Department of Natural Resources
49
ATTACHMENT 7
Movement of Water in Karst Geology
50
ATTACHMENT 8
Ottawa County SSURGO Digital Soil Survey Limitations for Septic Absorption Fields
South Bass Island Ohio 1985
Source Ottawa SSURGO Digital Soil Survey Division of Soil and Water Conservation Ohio Department of Natural Resources Columbus Ohio January 2000
51
ATTACHMENT 9
Soil Limitations for Wastewater Disposal
All five soil types identified on South Bass Island have limitations for septic tank systems rated as ldquosevererdquo in the Soil Survey The following is a list of each soil series located on South Bass Island along with its primary limitations
Castalia ndash This is the predominant soil on South Bass Island The primary limitations are depth to bedrock and many large stones ranging in size from 10 inches to 4 feet across Unweathered bedrock (dolomitic limestone) is found at depths from 20 to 40 inches Vertical fractures in bedrock are 3 to 6 feet apart
Dunbridge ndash The primary limitation is depth to bedrock Unweathered bedrock is found at depths from 20 to 40 inches in this soil series Vertical fractures in bedrock are 2 to 4 feet apart
Milton ndash Major limitations include depth to bedrock and slow permeability Depth to bedrock ranges from 20 to 40 inches
Nappanee ndash The primary limitations are slow permeability and soil wetness The perched seasonal high water table is between depths of 1 to 2 feet in fall winter spring and extended wet periods
Rawson ndash Major limitations are soil permeability and wetness It is also noted that some Rawson soils may have bedrock as shallow as 20 to 40 inches The perched seasonally high water table is at depths between 30 and 48 inches in winter and spring and other extended wet periods Soil permeability is rated as slow to very slow in the lower profile of the soil
Disturbed areas ndash Areas where soils were not classified include the area around the Perry Monument which is owned by the National Park Service and two small areas identified as ldquopitsrdquo where limestone bedrock has been removed for use in construction
For soils identified with an asterisk () the soil survey notes that effluent from sanitary facilities used in these soils may move through fissures in the bedrock and pollute groundwater supplies
52
ATTACHMENT 10
ODHNCEH Groundwater Quality Assessment Procedure
The South Bass Island groundwater assessment included only private residential wells and consisted of a sanitary survey and the collection of a groundwater sample The island was divided by topographical features into 22 sections To obtain a statistically valid number of samples in each of the 22 sections an Ohio Department of Health (ODH) surveyor selected four housing units representing a geographic distribution within the section If a household resident of a selected unit agreed to participate in the assessment the surveyor collected a water sample and conducted a sanitary survey of the groundwater supply system Ohio Department of Health surveyors were to visit homes in each of their assigned sections until they enrolled four locations Collected water samples were stored in insulated containers and returned to the Ottawa County Health Department by 500 PM of each of the three sample collection days Samples were shipped to a certified water quality laboratory for analysis (Benchmark Laboratory and the Ohio Department of Agriculture Laboratory) Samples were analyzed for total coliforms E coli Campylobacter Salmonella chloride and nitrate Sample collection and sanitary survey information was collected reviewed clarified and corrected when needed and recorded on the master tracking log
To facilitate mapping of sampled wells longitude and latitude coordinates were recorded in the field The sample collection tracking log and sanitary survey codebook were developed for this activity A Web-based data entry system and a GIS mapping tool were developed by the ODH and the Centers for Disease Control and Preventionrsquo s National Center for Environmental Health (NCEH) to assist with analysis of collected data The NCEH Health Informatics Office developed an additional GIS analysis tool to support data analysis
The ODHNCEH groundwater quality assessment collected groundwater samples from 11 (77679) of the housing units served by a groundwater well on South Bass Island The protocol called for a sample size of 88 private groundwater wells (4 wells for each of the 22 sections) however resource and time limitations restricted the number of households visited to 77 Seventy-seven is a valid sample size for this descriptive study
Data from the sanitary survey and well-logs were entered into a Microsoft Access database Statistical analysis was performed using SAS version 802 and EPI Info version 322 Geographic information system analysis was performed using Spatial Epidemiology and Emergency Management System (SEEM) version 11 Following is the sanitary survey data collection form water sample collection tracking log and the sanitary survey codebook
53
___________________________________________________________________________________
___________________________________________________________________________________
______________________________________________________________________________________ ______________________________________________________________________________________ _______________________________________________________________________________
ATTACHMENT 10 Form 1
ODHNCEH Groundwater Quality Assessment Sanitary Survey Form
South Bass Island Ohio September 2004
South Bass Island - Sanitary Survey
Owner Name________________________________________________________________ Address (street number name)________________________________________________ GPS Coordinates (NAD 83) _________________________________________________ Sample collected_
Water Well Information Well Currently Used for Drinking Water______
Well Casing (circle one) - Steel PVC Well casing (circle) - Above grade In Pit
Well casing height above grade__________ Well Log Number_____________________
Condition of casing (circle) Good Fair Deteriorated Holescracks in casing
Well Cap(circle) - Aluminum 2 Part gasketed Sanitary Seal Condition of cap_____________________________________________________________
Type of pump (circle) Jet Deep(2 lines) Jet Shallow Submersible Hand pump
Pitless Adapter______ Well Pit ______(wet or dry) Well House_____________________
Conditions around well (subsidence slope rock at surface)____________________________________
Comments__________________________________________________________________________
HSTS Information
TankRisers visible______ Distribution Boxes____ ATU visible______ Discharge ______
Location of Discharge_______________Lake discharge______ Discharge - clear cloudy odor (circle)
Elevated leach field or mound______ Chlorinator present and filled_______ Aeration sytem ndash motor present______
Comments on system conditions (surfacing sewage wet areas green stripes etc
54
Water Treatment Information
System type (circle one) ndash Softener Oxidizing Unit(chlorineiodine) Continuous chlorination Ultraviolet Carbon Filter Sediment Filter
Other________________________________________________________________
Sampling port or bypass present_____________________________________________
Survey completed by_________________________________________________________ Date_________________________________________
LAB
55
Attachment 10 Form 2
Water Sample Collection Log Bass Island Ohio
Lab
DATE COLLECTED
TIME NAME ADDRESS WELL LOG CLOOECTED BY SECTION
56
ATTACHMENT 10 Table 1
ODHNCEH Groundwater Quality Assessment Codebook South Bass Island Ohio September 2004
Variable Name Variable Type Variable size Variable Description Values or Explanation Data Source Well_log Number 6 Well log number uniquely
describes well Plunketmdb
Sanitary survey Last_name Character 20 Last name of well owner Sanitary survey
Tracking database
First_name Character 20 First name of well owner Sanitary survey Tracking database
Street_name Character 25 Street name where well is located
Plunketmdb Sanitary survey
Street_number Character 5 Street number where well is located
Plunketmdb Sanitary survey
Well_depth Number 4 Depth of the well in feet Plunketmdb Sanitary survey
Latitude Number 9 Latitude of well position Plunketmdb Sanitary survey
Longitude Number 9 Longitude of well position Plunketmdb Sanitary survey
Sample_date Date 10 Date sample was taken Santary survey Laboratory
results
Sample_number Character Number assigned to lab results for sample
Laboratory results
57
Quadrant Character 22 Quadrant where sample was drawn
1-22 quadrants Sanitary survey Tracking database
Collector Character 20 Name of Surveyor Sanitary survey Tracking database
Lab Character 30 Name of Laboratory performing analysis
Ohio Department of Agriculture BenchMark
Tracking database
TC Number Laboratory results for Total Coliforms
Laboratory results
EC Number Laboratory results for E coli Laboratory results
Campy Number Laboratory results for Camybolacter
Laboratory results
Salmon Number Laboratory results for Salmonella
Laboratory results
Nitrate Number Laboratory results for Nitrates Laboratory results
Chloride Number Laboratory results for Chlorides
Laboratory results
Casing_mat Character 8 Material used for well-casing Steel PVC Brick Concrete
Sanitary survey
Casing_location Character 16 Location of well-casing Above grade In pit Buried Cannot
determine
Sanitary survey
Casing_height Number 2 Height of well-casing above grade in inches
Sanitary survey
Casing_cond YES-no Does the well-casing havecracks holes or gaps
Sanitary survey
Case_diam Number 4 Diameter of well casing in inches
Well logs
58
Case_length Number 5 Length of the well casing in feet
Well logs
Cap YES-no Is the well top covered YESno Sanitary survey Cap_seal YES-no Well top provides a sanitary
seal YESno Sanitary survey
Pitless YES-no Presence of pitless adapter YESno Sanitary survey Wellhouse YES-no Well head in protected
wellhouse YESno Sanitary survey
Wellhead YES-no Well head located in pit YESno Sanitary survey wellhead_dry YES-no Well head in pit is dry YESno Sanitary survey Date_comp Date 10 Date well constuction
completed Well logs
Drawdown Number 3 Number of feet that water can be drawn down in a well
Well logs
Static_level Number 3 Depth to water level in feet Well logs Well_pres YES-no Presence of a properly sealed
water well (10ft) YESno Sanitary survey
Slines_pres YES-no Presence of sewer lines (10ft) YESno Sanitary survey
Sewage_pres YES-no Presence of sewage disposal systems (50ft)
YESno Sanitary survey
Water_pres YES-no Presence streams lakes ponds and ditches near well
source (25ft)
YESno Sanitary survey
Manure_pres YES-no Presence of manure ponds piles or lagoons near well
source (50-300ft)
YESno Sanitary survey
Landfill_pres YES-no Land fills or dump sites present near well source
(1000ft)
YESno Sanitary survey
59
Watercoll YES-no Surface water collects around well-casing
YESno Sanitary survey
Cont_pres YES-no Other sources of contamnation present near
well source
YESno Sanitary survey
Cont_other Text 250 Explanation of other type of contamination source
Sanitary survey
Sewage_home YES-no Home sewage tretment system is designed to
discharge effluent to surface
YESno Santary survey
Discharge Character 15 Surface discharge location Drainage ditch Storm drain Lake Pond
Stream
Sanitary survey
Disch_qual Character 10 Quality of effluent Clear Cloudy Odor Sanitary survey Chlorination YES-no Chlorinated effluent YESno Sanitary survey
Oper_chl YES-no chlorination system operates as designed
YESno Sanitary survey
Aeration YES-no Presence of aeration system YESno Sanitary survey Oper_aer YES-no Aeration system functions as
designed YESno Sanitary survey
Treat_type Character 30 Type of water treatment system used
Softener Oxidizing unit(iodinechlorine)
Carbon Filter Sediment Filter Ultraviolet
Continuous chlorination
Sanitary survey
Port YES-no Presence of sampling port or bypass
YESno Sanitary survey
60
ATTACHMENT 11 Table 1
E coli Analysis Results Groundwater Samples Collected on South Bass Island Ohio
September 2004
E COLI POSITIVE RESULTS n = 77
69 E COLI NEGATIVE
31 E COLI POSITIVE
69 E COLI NEGATIVE
31 E COLI POSITIVE
Source Ohio Department of Health (ODH) and Centers for Disease Control and Prevention National Center for Environmental Health (NCEH) groundwater quality assessment South Bass Island Ohio September 8ndash10 2004
61
ATTACHMENT 11 Table 2
E coli Analysis Results by Laboratory Groundwater Samples Collected on South Bass Island Ohio
September 2004
Lab amp Sample Set Date Collected Total Samples Number E coli
Positive Percent Positive
Benchmark 1 Wednesday 090804 16 5 294
ODA 2 Wednesday 090804 6 1 167
Benchmark 3 Thursday 090904 15 6 400
ODA 4 Thursday 090904 12 4 308
Benchmark 5 Friday 091004 20 3 150
ODA 6 Friday 091004 8 5 625
Total 77 24 312
Source Ohio Department of Health (ODH) and Centers for Disease Control and Prevention National Center for Environmental Health (NCEH) groundwater quality assessment South Bass Island Ohio September 8ndash10 2004
62
ATTACHMENT 11 Table 3
Location of E coli Positive Sample Results Groundwater Samples Collected on South Bass Island Ohio
September 2004
Source Ohio Department of Health (ODH) and Centers for Disease Control and Prevention National Center for Environmental Health (NCEH) groundwater quality assessment South Bass Island Ohio September 8ndash10 2004
63
ATTACHMENT 12 Table 1
Total Coliform Analysis Results Groundwater Samples Collected on South Bass Island Ohio
September 2004
TOTAL COLIFORM POSITIVE RESULTS n = 77
22 Total coliform negative
78 Total coliform positive
22 Total coliform negative
78 Total coliform positive
Source Ohio Department of Health (ODH) and Centers for Disease Control and Prevention National Center for Environmental Health (NCEH) groundwater quality assessment South Bass Island Ohio September 8ndash10 2004
64
Total
ATTACHMENT 12 Table 2
Total Coliform Analysis Results by Laboratory Groundwater Samples Collected on South Bass Island Ohio
September 2004
Lab amp Sample Set Date Collected Total Samples Total Coliform Positive Percent Positive
Benchmark 1 Wednesday 090804 16 14 875
ODA 2 Wednesday 090804 06 03 500
Benchmark 3 Thursday 090904 15 12 800
ODA 4 Thursday 090904 12 09 750
Benchmark 5 Friday 091004 20 16 800
ODA 6 Friday 091004 08 06 750
77 60 779
Source Ohio Department of Health (ODH) and Centers for Disease Control and Prevention National Center for Environmental Health (NCEH) groundwater quality assessment South Bass Island Ohio September 8ndash10 2004
65
ATTACHMENT 12 Figure 1
Location of Total Coliform Positive Samples Groundwater Samples Collected on South Bass Island Ohio
September 2004
Source Ohio Department of Health (ODH) and Centers for Disease Control and Prevention National Center for Environmental Health (NCEH) groundwater quality assessment South Bass Island Ohio September 8ndash10 2004
66
ATTACHMENT 13 Figure 1
E coli Positive Results by Well Depth Groundwater Samples Collected on South Bass Island Ohio
September 2004
0 ft
52 ft
d
162 ft
Source Ohio Department of Health (ODH) and Centers fNational Center for Environmental Health (NCEH) grouIsland Ohio September 8ndash10 2004
67
Well Hea
Wells 0 to 52 Feet Deep 64 E coli Positive
N = 22
Wells greater than 52 Feet Deep 19 E coli Positive
N = 54
Ground Surface
or Disease Control and Prevention ndwater quality assessment South Bass
ATTACHMENT 13 Figure 2
E coli Results Well Depths Less Than 52 Feet Groundwater Samples Collected
September 8ndash10 2004 South Bass Island Ohio
Source Ohio Department of Health (ODH) and Centers for Disease Control and Prevention National Center for Environmental Health (NCEH) groundwater quality assessment South Bass Island Ohio September 8ndash10 2004
68
ATTACHMENT 13 Figure 3
E coli Results Well Depths Greater Than or Equal to 52 Feet Groundwater Samples Collected
September 8ndash10 2004 South Bass Island Ohio
Source Ohio Department of Health (ODH) and Centers for Disease Control and Prevention National Center for Environmental Health (NCEH) groundwater quality assessment South Bass Island Ohio September 8ndash10 2004
69
ATTACHMENT 13 Figure 4
E coli Positive Results by Well Depths Groundwater Samples Collected
September 8-10 2004 South Bass Island Ohio
Source Ohio Department of Health (ODH) and Centers for Disease Control and Prevention National Center for Environmental Health (NCEH) groundwater quality assessment South Bass Island Ohio September 8ndash10 2004
70
ATTACHMENT 14
E coli Positive Results by Section Location Groundwater Samples Collected on South Bass Island Ohio
September 2004
Location Total Samples
Number E coli Positive
Percent Positive
Shoreline 55 17 309
Interior 22 7 318
Source Ohio Department of Health (ODH) and Centers for Disease Control and Prevention National Center for Environmental Health (NCEH) groundwater quality assessment South Bass Island Ohio September 8ndash10 2004
71
ATTACHMENT 15 Table 1
Water Quality Analysis Results Private Groundwater Wells Sampled by Ottawa County Health Department
South Bass Island Ohio AugustndashSeptember 2004
Date Collected
Number Collected
Number amp Total Coliform Positive
Number amp Ecoli Positive
AUG 23 9 5 (56 ) 2 (22) AUG 25 8 4 (50 ) 1 (13) AUG 30 23 12 (52 ) 8 (35) SEPT 01 6 3 (50 ) 2 (33) SEPT 08 18 3 (17) 6 (40)
Total ( Pos) 64 27 (42) 19 (30)
Source Ottawa County Health Department Port Clinton Ohio September 10 2004
72
ATTACHMENT 15 Table 2
Water Quality Analysis Results Total Coliform and E coli Positive Private Groundwater Well Samples
South Bass Island Ohio 2001ndashAugust 2004
Year Number of
Samples Collected
Number Total
Coliform Positive
Percent Total
Coliform Positive
Number E coli
Positive
Percent Ecoli
Positive
2001 29 18 62 2 7 2002 23 9 39 2 9 2003 28 14 50 3 11
Jan ndash July 2004 13 10 77 2 15
Aug 2004 54 36 67 14 26 Total 147 87 59 23 16
Source Ottawa County Health Department Port Clinton Ohio September 10 2004
ATTACHMENT 15 Table 3
Groundwater Quality Analysis Results All Water Samples Collected Total Coliform and E coli Results by Agency
South Bass Island Ohio AugustndashSeptember 2004
Agency Total Coliforms E coli No
Analyzed No
Positive Percent
+ No
Analyzed No
Positive Percent
+ OEPA 87 38 44 48 17 35 MSU 8 4 50 8 2 25 ODA 10 3 33 10 2 20 CDC 0 mdash mdash 7 4 57 ODH 6 4 666 4 2 50 Total 111 49 44 77 27 35
Source Ottawa County GI IllnessmdashSummer 2004 Sample Results Log Oct 14 2004 Ohio Environmental Protection Agency (OEPA) Columbus Ohio MSU = Michigan State University ODA = Ohio Department of Agriculture CDC = Centers for Disease Control and Prevention ODH = Ohio Department of Health
73
ATTACHMENT 16
South Bass Island and North Central Ohio Precipitation (in inches)
North Central Region North Central Region South Bass Island Month 2004 1951ndash2000 1977ndash1997
January 225 221 163 February 063 191 145
March 362 266 228 April 236 337 298 May 809 351 333
June 496 373 349 July 406 372 301
August 376 336 343 September 245 299 303
October 233 226 248 November 359 283 253 December 335 254 213
Total 4145 3509 3177
Sources Monthly Water Inventory Report for Ohio Ohio Department of Natural Resources Monthly Station Normals Station 33 Put-In-Bay National Oceanic and Atmospheric Administration
74
- Background
- Purpose
- Phase 1 - Rapid Field Asessment
-
- Determination of Water Quality
- Assessment of Water Sources and Supplies
- Assessment of Community Water Distribution System and Auxiliary Wells
- Assessment of Water Sources and Supplies - Development of Groundwater Wells Sewage Disposal Methods
- Sewage Disposal Methods
-
- Phase 2 - Groundwater Quality Assessment
-
- ODHNCEH Assessment
- Collection Organization and Analysis of Available Water Quality Data
-
- Conclusions
- Recommendations
- References
- Attachments
-
- 1 Cases of gastroenteritis by date of onset and etiology
- 2 Information on South Bass Island Ohio
- 3 Aerial photograph identifying 11 NCEH water sample collection locations South Bass Island Ohio Aug 30 - Sept 2 2004
- 4 Environmental Sampling Conducted in the Investigation of a Suspected Waterborne Outbreak South Bass Island Ohio Aug - Sept 2004
- 5 Bass Island Sample Form
- 6 Well Log and Drilling Report
- 7 Movement of Water in Karst Geology
- 8 Ottawa County SSURGO Digital Soil Survey
- 9 Soil Limitations for Wastwater Disposal
- 10 ODHNCEH Groundwater Quality Assessment Procedure
- 11 E coli Analysis Results
- 12 Total Coliform Analysis Results
- 13 E coli Positive Results by Well Depth
- 14 E coli Positive Results by Section Location
- 15 Water Quality Analysis Results
- 16 South Bass Island and North Central Ohio Precipitation (in inches)
-
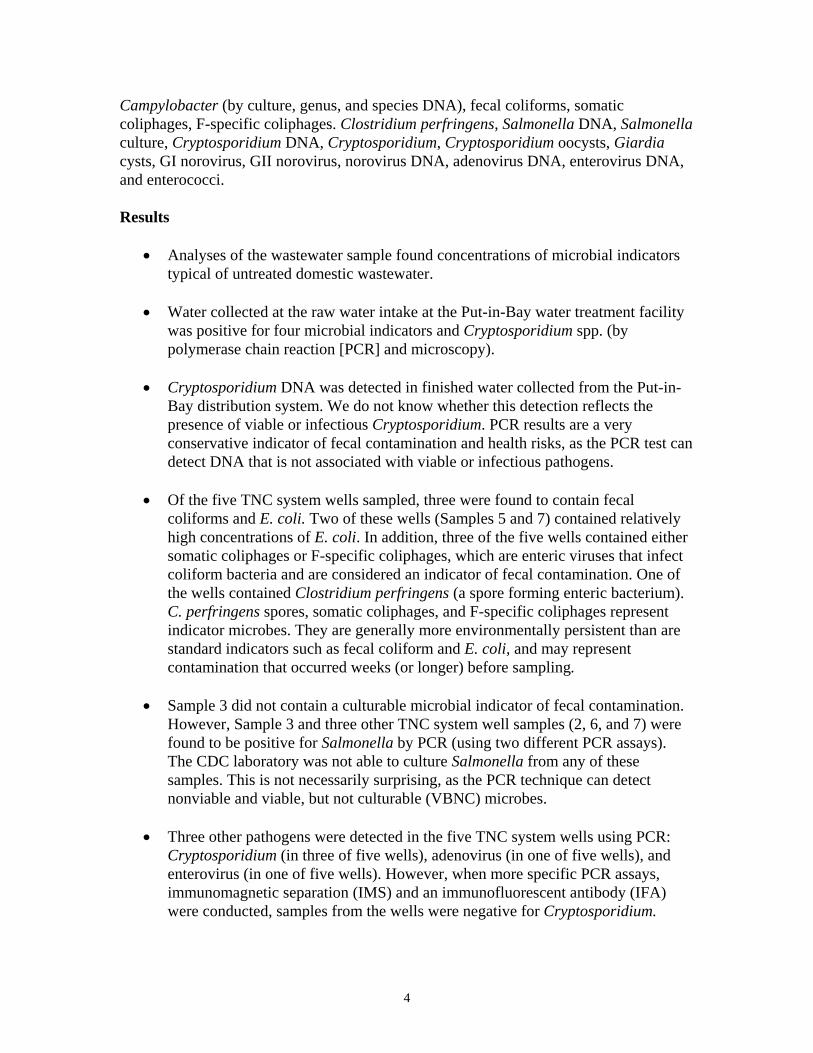

Discussion
The Giardia cyst identified in Sample 5 is a significant finding The presence of this parasite (which is fairly large with a diameter of 12 microm) indicates that enteric parasites and smaller pathogens (ie bacteria and viruses) can enter and be transported through the subsurface aquifer of South Bass Island (Gerba et al 1984 Moe 1997)
Chlorine was detected in several wells even those wells that were not chlorinated This finding strongly supports the hypothesis that chlorine used to treat other wells on the island found its way to the aquifer so that it was being detected in wells not recently disinfected with a chlorine product Similarly pathogens present in on-site wastewater system effluent may find their way into the aquifer and ultimately into drinking water supplies
Local reports indicate that during the summer months approximately 15000 tourists visit the island each week Most visitors arrive Friday evening and depart on Sunday The weekend visitation peak places an extraordinary demand on the islandrsquos groundwater aquifers The increased demand for water from TNC public and private water systems will draw the aquifer down over time When this occurs a cone of depression extends around a well resulting in water being ldquopulled inrdquo from other sources such as the lake That could also pull in effluent from on-site wastewater systems (Fetter 1980 Freeze et al 1979) Due to the high seasonal demand on the aquifer the thin-to-absent soils severe limitations for septic tank absorption fields and known karst geology (interconnected fractures channels and caves) pathogens could reach and contaminate drinking water supplies (Malard et al 1994) The limited number of groundwater samples collected by NCEH found multiple indicators of a sewage contaminated aquifer
Raw untreated surface water from Lake Erie collected at the Put-in Bay community water treatment plant is positive for Cryptosporidium Raw water was also positive for E coli fecal coliform somatic coliphages and C perfringens The presence of these organisms in surface water is not uncommon Proper operation of the water treatment plant process effectively removes these organisms
The water source for the public water system is Lake Erie Finished water samples collected from the water distribution system are negative for all organisms tested with one exception Cryptosporidium DNA was found in the finished water sample collected by NCEH on August 30 2004 Cryptosporidium oocysts often present in surface water are broken and inactivated by water treatment processes The analysis process used by CDC may detect DNA on nonviable oocyst particles and fragments present in treated water The detection of Cryptosporidium DNA does not differentiate live from dead oocysts Finished water from the Put-in-Bay community water system was analyzed by two additional methods for Cryptosporidium Michigan State University also analyzed finished water for
6
Cryptosporidium These follow-up tests found no evidence of viable Cryptosporidium oocysts in the public water system
Phase 1mdashRapid Field Assessment Assessment of Water Sources and Supplies
Methods
Put-in-Bayrsquos water treatment plant operation records from May to August 2004 were reviewed to determine if plant or distribution system operation could have contributed to the gastrointestinal disease outbreak All aspects of the records were reviewed including operator logs loading rates filter operations chlorination bacteriological tests and OEPA inspection reports
The Village of Put-in-Bay water treatment facility processes water at a rate of 0216 million gallons per day (MGD) The facility originally constructed in 1977 was upgraded in 2000 with the installation of a Culligan Multi-Tech treatment system Water treated at the facility is drawn from lake and groundwater sources Lake Erie surface water is the primary water source A groundwater well was developed as an emergency back-up source Raw (untreated) water pumped from Lake Erie passes through five Culligan Multi-Tech treatment trains This treatment system consists of clarification rapid sand filtration and granular activated carbon filtration Water is then chlorinated and pumped to a 200000-gallon elevated storage tank for gravity flow through the Put-in-Bay water distribution system The distribution system is connected to 104 commercial meters and 95 residential water meters
Results
bull The August 2004 OEPA inspection of the facility discovered that the raw water (low service) pumping system was not installed according to proposed plans The 2000 upgrade plan called for the installation of a 200-gallon per minute (gpm) pump However when construction took place a 150-gpm pump was installed thus limiting production to 0216 MGD (150 gpm) Although this does not to affect the quality of the water produced it did lower the production rate of the overall plant from 0288 MGD (200 gpm) to 0216 MGD (150 gpm)
bull Records indicate the water from the emergency groundwater supply well is highly corrosive Corrosive water if used for long periods can leach lead and copper from water distribution lines and building service pipes Records indicate the groundwater well was used on occasion to meet the demand for water Because of the corrosiveness of the water and the related lead and copper issues OEPA ordered this well not be used on a routine basis
bull Michigan State University collected samples from the back-up groundwater well at the Put-in-Bay community water facility These water samples were negative
7
for all tested biological parameters
bull OEPA records report all bacteriological analysis results of treated water leaving the facility as negative The review of plant operation logs and records indicated compliance with OEPA standards and reporting requirements
Discussion
Although some operational issues were identified they did not affect the ability of the facility to provide adequate quantities of treated water All routine water tests indicate compliance with OEPA water treatment and quality standards The pump capacity issue did limit total water production but there is no evidence of inability to meet water demand (ie lack of water low flow loss of pressure in distribution system) There is no evidence in material reviewed and from discussions with the facility operator of pumping rates exceeding the design capacity of the treatment facility
If the water treatment facility is operating as designed the mixing of groundwater from the emergency backup well with surface water at the facility does not present a pathogen exposure risk because the groundwater enters the treatment system at the beginning of the process and receives full treatment including chlorination It was because of its high corrosivity that the use of water from the emergency well was discontinued Analyses of groundwater collected from the emergency well by Michigan State University showed no indicators of microbial contamination
Phase 1mdashRapid Field Assessment Assessment of Community Water Distribution System and Auxiliary Wells
Methods
NCEH reviewed Put-in-Bay community water distribution system operation and maintenance records and water quality data NCEH also reviewed available information on auxiliary wells developed and utilized by several commercial establishments
Results
bull The review of available information found no indications of water line breaks leaks or significant loss of pressure in the water distribution system
bull Water quality data maintained on the Put-in-Bay community water distribution system from 2000 to August 2004 report 2 of 196 (1) samples as total coliform positive No total coliform bacteria positive sample results were reported for the community water distribution system during the first 8 months of 2004
bull The auxiliary wells provided groundwater for cooling watering grass flushing
8
toilets and other activities Four of the auxiliary wells were cross-connected to the Put-in-Bay community water distribution system
bull Three of the four cross-connected auxiliary wells were sampled by OEPA One auxiliary well is positive for total coliforms and E coli and another is positive for Campylobacter jejuni OEPA ordered these businesses to disconnect all identified cross-connected plumbing
bull Backflow prevention devices were installed on the four cross-connected auxiliary wells Each was fitted with either a reduced pressure zone (RPZ) valve or a check valve assembly Properly installed and functioning backflow prevention devices allow water to move in one direction These devices are installed to prevent water from building supply lines to flow back into the distribution system
bull OEPA examined one of the RPZ valves after it was removed and determined that it was malfunctioning The condition of the other valves is unknown Building owners did not maintain valve operation maintenance and test records
Discussion
The results of routine water samples collected from the Put-in-Bay water distribution system found no recent indicators of bacterial contamination
There is no direct evidence of loss of pressure in the water distribution system to the extent necessary to cause backflow However the cross-connections between groundwater supply lines and community water system service lines the finding of a malfunctioning PRZ valve and the presence of fecal indicators and C jejuni in samples collect from auxiliary wells are factors that may have contributed to this outbreak
Phase 1mdashRapid Field Assessment Assessment of Water Sources and Suppliesmdash Development of Groundwater Wells
Methods
To characterize groundwater well development on South Bass Island NCEH reviewed 503 groundwater well drilling reports provided by the Ohio Department of Health The most recent information from the 1990 US Census indicates a total of 679 drilled wells and 27 dug wells in Put-in-Bay Township Characteristics of interest included well and casing depth grouting and remarks from well formation logs Remarks from well formation logs were reviewed for evidence of subsurface openings crevices voids caves and other geological conditions that may influence the collection movement and mixing of groundwater with recharge waters The reviewed logs dated from 1948 to 2003
Among those reports the detailed and clear records developed by the Island Well
9
Drilling Company provide an excellent source of information on well construction practices and geologic formations of South Bass Island Island Well Drilling Company records were examined to collect information not consistently recorded by other well drillers The Island Well Drilling Company developed 82 wells on South Bass Island from 1961 to 1971
Results
bull The review of the Island Well Drilling Company well logs found 56 (2036) of the wells had openings crevices or caves below the protective casing depth (Attachment 6)
bull A review of all 503 well log and drilling reports found 172 (34) wells with a recorded grout seal A proper grouting seal can prevent contaminants from entering groundwater
bull Of the well logs reporting grouting 64 did not record type of grout used
bull Well logs report the use of the following grouting materials 22 well cuttings 34 cement 34 bentonite clay and 10 bentonite mixed with well cuttings
bull The detailed well logs maintained by the Island Drilling Company do not record the use of grout or the grouting of drilled wells The older well log and drilling report form used by Island Drilling Company did not require the reporting of well grouting so it is unknown if grouting was used
Discussion
Island Drilling Company records indicate 56 of the developed wells have openings crevices or caves below the protective casing depth This may allow surface water to quickly reach and enter the drill hole (Attachment 7) Contaminants seeping into the ground from septic tanks or others sources could mix with water in the drill hole (Keswick 1984 US Department of the Interior 1985)
Additionally the lack of a proper grouting seal could allow contaminants to enter the well A gap often exists between the well casing and the soil and layers of rock in the well hole It is common practice to place a grout (cement clay well cuttings) seal around the upper portion of well casing to help prevent contaminated surface water from entering the well Grout also helps to seal crevices or openings in formations to prevent water or other contaminants from entering the well along the casing The absence of grouting could lead to well contamination In that case the casing acts as a funnel allowing contaminants to flow along the casing sides into the well (Salvato 1992 US Department of the Interior 1985)
Environmental laws well now prohibit cuttings (material removed in the process of drilling) from being used as a grouting material in Ohio Well cuttings were found to be
10
less effective in providing a proper seal Only 34 of wells recorded a grout seal The lack of grouting and the use of ineffective grouting materials such as well cuttings could allow contaminants to enter the well
Phase 1mdashRapid Field Assessment Sewage Disposal Methods
Methods
Information on South Bass Island wastewater treatment and disposal methods and septage management practices was obtained from OEPA the Ottawa County Health Department and from operators during site visits to sewage disposal facilities Soils information for South Bass Island was obtained from the 1985 Soil Survey of Ottawa County Ohio conducted by the US Department of Agriculture Soil Conservation Service (now the Natural Resources Conservation Service) (Musgrave et al 1985) This information was organized and reviewed to determine if sewage management on the island may have contributed to the outbreak
Village of Put-in-Bay Community Wastewater Treatment Facility
Results
bull The Village of Put-in-Bayrsquos wastewater treatment facility is the largest sewage system on the island It has a design capacity of 025 MGD The facility uses a sequencing batch reactor (SBR) activated sludge treatment process followed by chlorination of the final effluent The effluent is discharged into Lake Erie at the Put-in-Bay Harbor Design is underway for an expansion of the wastewater treatment facility by converting a portion of the aerobic sludge process into a membrane-type system This will increase the design capacity of the facility by an additional 0200ndash0250 MGD for a total capacity of 0450ndash0500 MGD The project is scheduled for completion by the end of 2006 The membrane system will be evaluated for performance the community may then opt to convert one or two of the SBR tanks into a membrane system If both SBR tanks are converted the facility could have a design capacity of up to 20 MGD
bull No discharge violations were reported in recent years or during the time of the outbreak The facility appeared to be well operated and maintained
Discussion
The effluent discharged from the treatment plant met discharge standards and records indicate the facility was operating properly at the time of this outbreak There is no evidence to support a connection between the village wastewater treatment facility and the outbreak
11
On-site Wastewater Systems for Residences and Businesses
Results
bull Individual on-site septic tank systems are the most common type of wastewater disposal method on South Bass Island Ottawa County Health Department records indicate there are 476 on-site septic tank systems used at individual homes on South Bass Island
bull On-site septic tank systems are also the most common method of wastewater disposal for businesses on South Bass Island Several different types of on-site disposal systems have been installed and are in use at business establishments
bull Information provided by OEPA on sewage disposal methods used by 32 businesses on South Bass Island finds 25 of 32 (78) discharge their wastewater into the subsurface
bull The following information shows the distribution of wastewater disposal methods for businessesmdashlodging food service convenience storesmdashon South Bass Island
Type of System Total Number Aerator system (surface water discharge) 2
Leach beds (soil absorption) 9 Leach fields (soil absorption) 9 Mound systems (soil absorption) 4
Subsurface sand filter (soil absorption) 3 Subsurface sand filter (surface water discharge) 2 Rock filter (surface water discharge) 1
Holding tanks 2 Unknown type 16
Package treatment plants (surface water discharge) 10
bull OEPA ordered two businesses to install holding tanks and discontinue discharging wastewater to existing systems due to high potential for groundwater contamination One of these systems discharged wastewater directly to a dry well that provided a direct conduit to the groundwater aquifer
bull Five business operations discharge effluent to surface water (Lake Erie)
bull Ten of the 32 systems are permitted by OEPA The wastewater disposal method used by 16 businesses is unknown
bull According to OEPA 10 businesses use package wastewater treatment plants that discharge effluent to Lake Erie These systems range in their designed flow
12
capacity from 1500 gpd to 29000 gpd The total design capacity of these 10 package plants is 88600 gpd All of these systems were inspected between August 10 and August 27 Minor to serious problems were identified at each plant Some of the more severe problems identified included aeration tank contents being black and septic blowers malfunctioning tanks leaking and disinfection not being applied Four of the 10 package treatment plants were operating under OEPA permits The Federal Clean Water Act requires all owners of wastewater systems that discharge to surface waters to obtain a permit under the National Pollutant Discharge Elimination System (NPDES) OEPA ordered all owners of package plants who did not have an NPDES permit to make application At the time of this assessment 9 of the 10 package systems are either operating under an NPDES permit or have applied for a permit One system has not applied and is reported to have repeated operational problems
bull Eleven bed-and-breakfast operations and 15 short-term rentals exist on the island Due to small lot sizes adequate room for on-site wastewater systems may not available Therefore many of these systems use leach beds instead of leach line systems This practice concentrates the amount of effluent over a much smaller area It can result in higher rates of failure even in suitable soil and geologic environments due to a great reduction in the soil sidewall area of the disposal system (Salvato 1992 Yates 1987) The use of leach beds is even more problematic on South Bass Island because of severe soil and geologic limitations
Discussion
A high number of homes and businesses discharge wastewater into the thin soils of the island through conventional on-site wastewater systems The 476 on-site wastewater systems and the islandrsquos karst geology provide a means for wastewater to enter the South Bass Island groundwater aquifer (Gunn et al 1997 Keswick 1984 Lance 1984 Tranter 1997)
Operational problems were noted with package plants that discharge into Lake Erie These operational issues could affect the quality of wastewater treatment and allow insufficiently treated sewage to enter the lake creating a potential health hazard (Hunter et al 2003)
Soil Limitations for Onsite Wastewater Disposal
Results
bull The most recent Soil Survey of Ottawa County Ohio was conducted by the US Department of Agriculture Soil Conservation Service in 1985 The survey shows that five series of soilsmdashCastalia Dunbridge Milton Nappanee and Rawsonmdash are native to South Bass Island
13
bull All five soil types identified on South Bass Island have ldquosevererdquo limitations for septic tank system use according to the Soil Survey (Attachment 8) Attachment 9 provides a complete description and primary limitations for each of the soils types found on South Bass Island
bull Chapter 3701 of the Ohio Administrative Code Section 29-10 ldquoInstallation requirements for soil absorption and percolationrdquo (effective 711977) establishes the following restrictions for the use of onsite wastewater systems
(A) Leaching systems utilizing soil absorption or percolation shall not be permitted where the depth to normal groundwater table or rock strata is less than four feet below the bottom of the proposed system
(B) Leaching systems utilizing soil absorption or percolation shall not be installed where the texture structure or permeability of the soil is not suitable to provide internal drainage The health commissioner may require the owner at the ownerrsquos expense to provide a written site evaluation by a qualified person before a final decision is made in issuing a permit The criteria of the national cooperative soil survey shall be used as a guideline by the health commissioner to determine the suitability of the soils in lieu of a more detailed guideline relating to the code requirements and soil characteristics
Discussion
According to the most recent soil survey of Ottawa County and the Ohio Administrative Code all soils located on South Bass Island are unsuitable for conventional onsite wastewater disposal systems (Musgrave et al 1985)
In addition to severe limitations for on-site wastewater posed by the native soils of South Bass Island an additional limitation and threat to groundwater is the karst topography and geology of the area (Myers et al 2000) Karst is a distinctive topography in which the landscape is largely shaped by the dissolving action of water on carbonate bedrock (usually limestone dolomite or marble) This geologic process occurring over many thousands of years results in unusual surface and subsurface features Those range from sinkholes vertical shafts disappearing streams and springs to complex underground drainage systems and caves (Jack 1999 Maire 1994 Malard 1994)
The combination of karst geology and thin soil depths make the island unsuitable for conventional onsite septic systems (Musgrave et al 1985 Myers et al 2000)
Septage Disposal
14
Results
bull Septage was pumped from business and privately owned septic tanks by a local septic tank pumping service and discharged on land into a sink holelow depression located between Catawba Road and Put-in-Bay Road This disposal site was reported to be in use for several years NCEH was unable to obtain septage dumping records for the site More than half of the water samples (Samples 5 and 7ndash11) were collected from TNC public water supplies and private wells that were located adjacent to and within 1 mile of the property where septage was discharged
bull None of the private well water samples (8ndash11) taken from properties adjacent to the septage disposal site were positive for bacterial or viral contamination
bull The TNC public water supplies sampled near the septage disposal site showed significant levels of contamination (Samples 5 and 7)
Discussion
OEPA reports that septage disposal at this site is not allowed under Title 40 of CFR Part 503 and has stopped It is unknown if the septage disposal site contributed to the contamination of the TNC public water supplies Given the karst geology of the island including large pores channels and caves through which surface water and contaminants can travel it is possible that the septage disposal site may have contributed to contamination of the groundwater aquifer (Keswick 1984 Kowel 1982 Lance 1984)
Phase 2mdashGroundwater Quality Assessment ODHNCEH Assessment
Methods
The ODHNCEH groundwater quality assessment included only private residential wells The assessment conducted water source sanitary surveys and collected groundwater samples (US Environmental Protection Agency 1999) The island was divided into 22 sections and a total of 77 water samples were collected Attachment 10 provides a description of the sampling protocol
Samples were analyzed for total coliforms E coli Campylobacter Salmonella chloride and nitrate The primary purpose of collecting a water sample was to support the finding of a sanitary survey The South Bass Island water quality assessment was designed to collect information on selected well characteristics and conditions that could affect water quality CDCrsquos water quality assessment of Midwestern private wells which yielded valuable information on private well use in the United States focused on well characteristics such as pitless adapters backflow devices sanitary seal cracked casing proximity to potential contamination sources and other data This protocol was used as a model in the design of the South Bass Island assessment (Centers for Disease Control and
15
Prevention 1998) However limited resources and time prevented the collection of accurate and complete sanitary survey data on South Bass Island
The results of this groundwater sample collection activity are compared to South Bass Island outbreak and existing historical groundwater quality data
Results
bull Of the groundwater samples collected by the ODHNCEH assessment 31 were E coli positive (Attachment 11)
bull Historical data for South Bass Island reports 9 of private wells as E coli positive
bull Outbreak response water quality data from August and September 2004 report 30 of private wells E coli positive and 35 of the TNC public water systems as E coli positive
bull Of the groundwater samples collected by the ODHNCEH assessment 78 were total coliform positive (Attachment 12) Historical data reports 51 total coliform positive for private wells
bull Outbreak response water quality data from August and September 2004 reports 42 of private wells to be total coliform positive and 48 of the TNC public water systems tested positive
bull A statistically significant relationship exists between wells that are less than 52 feet deep and positive results for E coli (OR = 77 (95 CI 224ndash2706) P value = 00002) Wells constructed with depths less than 52 feet are almost 8 times more likely to be contaminated with E coli than wells with depths of 52 feet or greater (Attachment 13)
bull A statistically significant relationship also exists between wells developed in the aquifer above lake bottom and E coli positive results (OR = 321 (95 CI 113ndash909 P value = 0039) Groundwater wells developed in the aquifer above the lake level are 321 times more likely to be contaminated with Ecoli than wells drilled below the lake bottom
Discussion
The bacteriological results of the private well groundwater assessment are similar to those obtained in groundwater collection activities implemented in response to the
16
outbreak but higher than the historical data on private wells
The results obtained in the ODHNCEH groundwater quality assessment of 31 E coli and 78 total coliform positive exceed those obtained in the CDC Midwestern states well study of 11 E coli and 41 total coliform positive (Centers for Disease Control and Prevention 1998)
Wells less than 52 feet were more likely to be contaminated with E coli Deeper wells may provide some protection against contamination
A comparison of location of well in relation to shoreline and E coli positive results found no association (Attachment 14) Although no association was found with this analysis a mixing of ground and lake water in the aquifers under South Bass Island occurs through interconnected caves and fractures in the geology Historical studies of the island show increased water levels in caves rise as lake levels rise This shows evidence of interconnectivity of lake water and groundwater on the island (Newell 1999 Verber et al 1953)
Phase 2mdashGroundwater Quality Assessment Collection Organization and Analysis of Available Water Quality Data
Methods
Available historical and recent outbreak response groundwater quality records for South Bass Island provided by the Ottawa County Health Department Ohio Department of Health Ohio Environmental Protection Agency and the Ohio Department of Agriculture were combined organized and reviewed The number and percent of total coliform and E Coli positive water samples in the historical database were compared to outbreak sample results to determine if groundwater quality had recently deteriorated
Review of Existing Historical Private Groundwater Well Sampling Results
Results
Total coliform
bull Of the groundwater samples collected from private wells on South Bass Island during 2001 2002 and 2003 51 (4180) are total coliform positive (Attachment 15)
bull Of the groundwater samples collected from private wells on South Bass Island during the first 8 months of 2004 69 (4667) are total coliform positive
bull Private groundwater well total coliform positive results increased from 50 in 2003 to 77 during the first 7 months (JanuaryndashJuly) of 2004 and remained
17
elevated at 67 during August 2004
E coli
bull Of the groundwater samples collected from private wells on South Bass Island during 2001 2002 and 2003 9 (780) are E coli positive (Attachment 15)
bull Of the groundwater samples collected from private wells on South Bass Island during the first 8 months of 2004 24 (1667) are E coli positive
bull Of the 64 water samples collected by the Ottawa County Health Department at the end of August and the beginning of September 2004 30 (1964) were E coli positive
bull The Ottawa County Health Department collected 55 water samples in 2000 from private water wells on South Bass Island Sample results are reported as safe or unsafe Of the samples collected 56 (3155) were recorded as unsafe
Discussion
A comparison of recent to historical groundwater quality data found an increase in the number of both total coliform and E coli positive results for samples collected from private groundwater wells during the first 8 months of 2004 Total coliform positive results increased from 51 (2001ndash2003) to 69 for the first 8 months of 2004 E coli which is a stronger indicator of fecal contamination increased from 9 in 2001ndash2003 to 24 from January through August 2004
In a 1994 CDC private well study conducted in nine Midwestern states 413 of the wells (N = 5520) were positive for total coliforms and 111 were positive for E coli Although other studies have been conducted in the United States this study is most comparable because it was conducted in the same region Using this study as a comparison rates were higher for South Bass Island in all categories except E coli in 2001ndash2003 The percent of total coliform and E coli positive test were higher than the Midwestern states study A nationwide study conducted by EPA in 1984 showed rural wells with 78 total coliform and 12 E coli positive results This nation-wide study had higher total coliform rates than South Bass Island but E coli rates were higher for the island from January through August 2004 (US Environmental Protection Agency 1984)
Historical Review of Transient and Noncommunity Public Water Sample Results
Results
bull Of the groundwater samples collected from 11 TNC public water systems (2000ndash 2003) 7 (19284) were total coliform positive In comparison 51 of the
18
private well samples collected during this same period were total coliform positive
bull Of the groundwater samples collected from 11 TNC public water systems during the first 8 months of 2004 21 (735) are total coliform positive Of the private well samples collected during this same period 69 are total coliform positive
Discussion
The much higher percent of total coliform positive groundwater samples in the private wells compared to the TNC public water systems (51 vs 7) for the years 2000ndash2003 is difficult to explain Further investigation is needed One explanation might be that TNC water systems typically have to provide more water than private wells Consequently they may be drilled to greater depths drawing from deeper aquifers which are generally more protected than shallow aquifers (Gerba et al 1984 US Department of the Interior 1985)
Association between Precipitation and Water Quality
Methods
Precipitation data were examined for South Bass Island to determine if rainfall trends may have contributed to this outbreak The karst geology of the island containing caves cracks and fractures along with a thin soil layer increase the risk of groundwater contamination Large amounts of rainfall or melting snow may flush contaminants such as septic tank discharge from the upper soils into groundwater wells Ohio Department of Natural Resources monthly regional precipitation reports for the years 1951ndash2000 and 2004 were reviewed This regional data provides an average of precipitation for several sample points in north central Ohio South Bass Island rainfall data collected at Perryrsquos Monument from 1977 through 1997 were also reviewed Island-specific data were compared to the regional precipitation data to identify major differences and existing trends
Results
bull Average monthly precipitation on South Bass Island is 020ndash058 inches less than north central Ohio precipitation for all months except August September and October During these months the rainfall on South Bass Island is greater (Attachment 16)
bull The average yearly precipitation for the north central Ohio region is 3509 inches compared to the South Bass Island yearly average of 3177 inches
bull In 2004 north central Ohio precipitation exceeded the historical average for the region by 458 inches in May 123 inches in June 034 inches in July and 040
19
inches in August
Discussion
Regional precipitation for the months of March May June July and August 2004 is higher than historical measures and may have contributed to contamination of groundwater wells on South Bass Island Periods of high precipitation can cause contaminants from sewage treatment facilities to be flushed into the groundwater aquifer Periods of high snow melt may have the same effect on groundwater quality Although higher then normal precipitation may exacerbate the problem of groundwater contamination on the island it should not be considered the single contributing factor to this outbreak Continued use of on-site systems in this type of soil and geologic environment will result in continued contamination of the groundwater regardless of variations in precipitation (National Research Council 2001 Rose et al 2001)
Conclusions
Conclusion 1 Suspected Source of Etiological Agent
Sewage has contaminated the groundwater aquifers that provide drinking water to South Bass Island Inadequate soil depth to bedrock which is fractured and contains numerous solution channels contributes to the problem This increases the likelihood that on-site subsurface sewage disposal systems at homes and businesses are introducing sewage directly into groundwater supplies The karst formation of the island facilitates the movement of sewage into the aquifer and the movement of contaminated groundwater within the aquifer (Gunn et al 1997 Jack 1999 Malard et al 1994 Yates 1987)
The subsurface disposal of sewage is not the only contributor to the contamination of the aquifer Another source could be poorly maintained malfunctioning and possibly undersized package wastewater treatment plants In addition on-site wastewater disposal systems designed to discharge to surface water could be introducing untreated or poorly treated wastewater to the shoreline of the island Depending on the location duration and volume of discharge this situation may expose swimmers and recreational water enthusiasts to contaminated water Considering the apparent influence of surface water on South Bass Island groundwater supplies contaminated surface water could be mixing with groundwater
Because of the thin layer of soils on the island water runoff may move contaminants from the ground surface into the aquifer through openings and cracks near the ground surface (Centers for Disease Control 1999 Michaud et al 2004) The possible connection between the septage disposal site and contamination of the aquifer has not been adequately investigated (Keswick 1984 Kowel 1982)
Conclusion 2 Suspected Mode of Contamination of Water Supply
20
A review of operational records and bacteriological results for water leaving the water treatment plant does not support a link between drinking water from this source and illness Cross connections were found between auxiliary wells and the village water distribution system These cross connections could have allowed contaminated groundwater to enter the public water distribution system However a review of routine bacteriological results maintained on the distribution system did not find evidence of wide-spread contamination in the distribution system All water samples collected from the distribution system before and during the outbreak are negative for standard indicator organisms In addition water from the public water systems was not implicated in the outbreak by the epidemiologic investigation
Backflow prevention devices were installed at cross-connected auxiliary wells A properly functioning backflow prevention device prevents water from flowing back into the water service line that connects the building to the distribution main After removing the cross connections one reduced pressure zone (RPZ) valve was examined At the time of inspection the valve was found to not be working properly Reports did not indicate that other backflow prevention devices were tested If backflow prevention devices were not operating properly contaminated groundwater could have entered the buildingrsquos water service line and the public water distribution system
Two auxiliary wells that were discovered to be cross-connected at the time of the outbreak were sampled One of these auxiliary wells was positive for total coliform and E coli The second well was positive for C jejuni The cross connected wells may have provided contaminated groundwater a mode of entry into the public water distribution system
Drinking water from a groundwater well on South Bass Island is identified in the epidemiological investigation as the likely source of exposure for those individuals reporting illness The environmental investigation supports this conclusion Groundwater samples collected in response to this outbreak found strong indicators of fecal contamination (Haas et al 1999 National Research Council 2004) E coli was positive in 30 to 40 of collected groundwater samples The geographical distribution of these sample locations indicates widespread contamination of the groundwater aquifer On-site wastewater systems are installed in soils identified as having severe limitations for septic tank absorption fields (Musgrave et al 1985) The karst geology of the island provides a direct connection between on-site wastewater system effluent and the drinking water aquifer Well logs report numerous subsurface voids openings crevices and caves many below the protective casing depth This facilitates the mixing of sewage with groundwater in well holes and the movement of lake water into the aquifer (Gunn et al 1997 Maire 1994 Malard 1994 Tranter 1997)
Conclusion 3 Possible Reasons the Etiological Agents Survived in the Water Supply
The demand on island sewage and water systems during peak visitation periods especially summer weekends increases when an average of 15000 tourists visit the island In a short period (2-day weekends) large volumes of ground and surface water are used and returned
21
to the subsurface of the island or to the lake as wastewater This surge of wastewater into the islandrsquos many small on-site wastewater treatment and disposal systems may result in the discharge of inadequately treated sewage into the subsurface of the island and the lake The thin soil layer and the fractured karst geology allow sewage discharged to the subsurface to move quickly (days to weeks) into the drinking water aquifer Sewage contaminated lake water may also move under the island and mix with groundwater used for drinking
This weekly surge of sewage into the islandrsquos subsurface and surrounding lake water may contain a heavy concentration of pathogens Hardy pathogens including Cryptosporidium Giardia Campylobacter and Salmonella were detected in South Bass Island groundwater samples Cryptosporidium and Giardia were also detected in the untreated wastewater sample collected from the municipal wastewater treatment facility
The protozoa Cryptosporidium and Giardia do not easily move through soils Their detection in groundwater is an indication that other organisms may also be moving through the subsurface unimpeded Consuming as few as 10ndash25 Giardia cysts can cause infection Giardia cysts maintain viability for up to 3 months in cold water Studies conducted on Cryptosporidium found oocysts surviving in soils for 60ndash180 days and in surface water and groundwater for 176 days (Salvato 1992 Percival et al 2004) As few as 30 oocysts can cause infection in healthy individuals (Moe 1997 Percival et al 2004 Salvato 1992)
The infectious dose of Campylobacter is a few hundred organisms Studies have isolated Campylobacter from surface water and this bacterium is commonly found in high numbers in domestic sewage The survival of Campylobacter in the environment is dependent upon temperature and other factors with the range being a few days to weeks (Fricker 1999 Moe 1997 Percival et al 2004)
Salmonella can survive in soils for 1ndash120 days in surface water from days to 2 months and in groundwater for 70 days In addition to being able to survive in water for prolonged periods Salmonella is also able to grow in warm polluted waters Studies have identified large numbers of Salmonella in the effluent of wastewater treatment plants The infective dose of Salmonella can be as few as 1000 organisms (Gerba et al 1984 Percival et al 2004 Salvato 1992)
The geology of South Bass Island provides an avenue of connection between surface water runoff sewage lake water and the groundwater aquifer (Graham et al 1998 Musgrave et al 1985 Myers et al 2000) The influx of visitors on weekends to the island creates a demand for water that draws available recharge water to groundwater wells This demand for water may facilitate contamination of groundwater from on-site systems and increase the mixing of lake water with groundwater These periods of high water use also generate a high volume of sewage that existing systems may be unable to adequately treat This cycle of water demand and sewage discharge in the unique geology of South Bass Island creates a system that may allow a heavy concentration of viable pathogens to move quickly from host to susceptible persons
22
The lack of a treatment barrier also influences the survival of pathogens in water The number of households and business establishments using point-of-use water treatment equipment is unknown Groundwater may not be filtered or disinfected before consumption
Conclusion 4 Isolation of Suspected Etiological Agent From Water Supply
Indicators of fecal contamination were found in groundwater samples collected from South Bass Island Total coliforms Ecoli fecal coliforms somatic coliphages F-specific coliphages Clostridium perfringens Salmonella DNA Cryptosporidium DNA Giardia adenovirus DNA enterovirus DNA enterococci and Campylobacter (by culture genus and species DNA) were detected in water samples Campylobacter jejuni Arcobacter butzleri Campylobacter upsaliensis and Acinetobacter were also detected in South Bass Island water samples
Campylobacter Salmonella Group B norovirus and Giardia were isolated from ill persons Molecular sub-typing of C jejuni found the pattern of clinical isolates to differ from the pattern of C jejuni isolated from water This investigation was unable to genetically match a pathogen isolated from an environmental sample with a clinical isolate collected from an ill individual Considering the number and variety of pathogens and indicators of fecal contamination identified in South Bass Island water samples this lack of a genetic match should not be taken as evidence that groundwater is not linked to the illnesses (Baumann 1968 Hunter et al 2003 National Research Council 2004 Percival et al 2004)
Recommendations
Recommendation 1 All housing units and commercial establishments on the island should be served by a public sewage collection and disposal systems and a public water supply system Extending public water supply lines without provision of public sewer system could result in higher water use and an increase in the volume of wastewater generated per household and business Extending water supply lines to most of the island could result in additional residential and commercial development This growth may increase water use and wastewater production on the island If such development took place without adequate sewage disposal system expansion contamination of the aquifer could actually increase In addition increased water use would require expansion of the existing public water treatment facility
Recommendation 2 The septage disposal site should be closed and septage be disposed of at the sewage treatment facility or off the island at a site and methods approved of by local and state health and environmental authorities An assessment should be made to determine if the septage disposal site is contributing to the contamination of the aquifer If pathogens are present on the ground surface in the soil or in the subsurface at this location action should be implemented to remove this contamination source
Recommendation 3 Residents should not consume groundwater unless the source has a
23
demonstrated history of negative bacteriological results All Island groundwater should be treated before consumption The Pennsylvania Department of Environmental Protection document listed in the reference section of this report provides treatment guidelines (Pennsylvania Department of Environmental Protection 2003)
Recommendation 4 For all groundwater supplies on South Bass Island local and state environmental and health authorities should determine the influence of surface water on groundwater Inform those that plan to use groundwater that may be under the influence of surface water of precautions and actions needed to ensure safe drinking water Surface water treatment methods and procedures may need to be implemented when regulated systems use groundwater under the influence of surface water
Recommendation 5 Local and state environmental and health authorities should develop a sewage management plan for South Bass Island The severe soil and geologic limitations for conventional soil-based on-site wastewater disposal systems on South Bass Island may preclude the continued use of these types of systems (Ohio Department of Health 2005) Continued use of existing on-site wastewater disposal systems will likely result in persistent contamination of groundwater supplies and present a serious risk to public health A moratorium on the construction of new on-site wastewater treatment and disposal systems should be imposed until a sewage management plan is developed and implemented
Recommendation 6 Repair and alteration of existing on-site systems or the permitting of any new construction on the island would require extensively engineered alternative systems to overcome soil depth and permeability issues These systems would likely need to be elevated pressure-dosed alternative wastewater systems such as mounds However mound-type systems are often costly and require much more maintenance than conventional systems They also have a high probability of failure when used in high water use or ldquoshock-loadingrdquo situations such as those that typically occur in the summer months for business establishments located on South Bass Island Increased monitoring of existing package treatment plants during high use periods should be part of the sewage management plan
Recommendation 7 Another possible alternative to on-site wastewater disposal would be the development of one or more centralized wastewater treatment system (package plant) with surface water discharge Given the extreme fluctuation in island population during the summer months treatment facilities would need to be designed to accommodate maximum wastewater loading during peak wastewater discharge periods These systems are often costly and must comply with the NPDES provisions of the Clean Water Act Extensive maintenance and monitoring would be required along with the hiring of certified operators to manage and maintain the systems The greatest advantage to using surface water discharge as the primary method of wastewater disposal is that it reduces the threat of further groundwater contamination from on-site wastewater disposal This threat is not entirely eliminated however because of the characteristics of karst environments Any discharge that reaches losing or disappearing streams (a stream reach in which the water table adjacent to the stream is lower than the water surface in
24
the stream causing infiltration from the stream channel recharging the groundwater aquifer and decreasing the stream flow) that feed groundwater could then contaminate the aquifer
Recommendation 8 Local and state environmental and health authorities should develop and implement a public information effort to inform business owners and residents using groundwater wells of the potential exposure and health risks Provide information on protective measures and options available to reduce exposure to contaminated drinking water
Recommendation 9 Local and state environmental and health authorities should identify all private and business auxiliary wells to ensure that no additional cross connections exist within the distribution system
Recommendation 10 To ensure that all cross connections have been removed a tracer test using an inert substance should be considered The inert tracer would be added to the auxiliary well Drinking water within the home or business would then be analyzed for presence of the tracer
Recommendation 11 Local and state environmental and health authorities should identify and properly close abandoned wells and all improperly developed dug wells Place a moratorium on new well installation until appropriate well development guidelines can be written for South Bass Island
Recommendation 12 Local and state environmental and health authorities should assess water supplies and wastewater treatment facilities located on other islands with karst geology to determine if similar groundwater contamination issues exist
This Trip Report summarizes the field component of our EIP-AID investigation Because of the preliminary nature of this investigation future correspondence MMWR articles or other published reports might present results interpretation and recommendations
that are different from those contained in this document
25
References
Baumann P 1968 Isolation of acinetobacter from soil and water J Bacteriol 96 39ndash42
Blackburn BG Craun GF Yoder JS Hill V Levy DA Chen N et al 2004 Surveillance for waterborne-disease outbreaks associated with drinking watermdashUnited States 2001ndash 2002 MMWR 53(8) 23ndash39
Centers for Disease Control and Prevention 1999 Public health dispatch outbreak of escherichia coli 0157H7 and campylobacter among attendees of the Washington County FairmdashNew York 1999 MMWR 48(36)803
Centers for Disease Control and Prevention 1998 A survey of the quality of water drawn from private wells in the nine Midwestern states Atlanta GA US Department of Health and Human Services
Fetter CW 1980 Applied hydrogeology Columbus OH Charles E Merrill Publishing Company
Freeze RA Cherry JA 1979 Groundwater Englewood Cliffs NJ Prentice-Hall Inc
Fricker C 1999 Campylobacter In Waterborne pathogens AWWA Manual M48 Denver CO American Water Works Association
Gerba PG Bitton G 1984 Microbial pollutants their survival and transport pattern to groundwater In Britton G Gerba CP editors Groundwater pollution microbiology New York NY John Wiley amp Sons Inc p 65ndash84
Graham GW NrsquoDeye MN Brown LC 1998 Ohio State University fact sheet water resources of Ottawa County Retrieved on September 24 2004 from httpohiolineosueduaex-fact0480_62html
Gunn J Tranter J Perkins J 1997 Sanitary bacterial dynamics in a mixed karst aquifer Proceedings of workshop W2 held at Rabat Morocco AprilMay 1997 24761ndash70
Haas CN Rose JB Gerba CP 1999 Quantitative microbial risk assessment New York NY John Wiley amp Sons Inc
Hunter PR Waite M Ronchi E 2003 Drinking water and infections diseasendashestablishing the links Boca Raton FL CRC Press LLC
Jack JD 2005 Environmental problems in karst lands Retrieved on February 3 2005 from httpcwxprenhallcombookbindpubbooksnebel2medialibupdate13html
Keswick BH 1984 Sources of groundwater pollution In Britton G Gerba CP editors
26
Groundwater pollution microbiology New York NY John Wiley amp Sons Inc p 39ndash64
Kowel NE 1982 Health effects of land treatment microbiological Cincinnati OH Environmental Protection Agency Health Effects Research Laboratory Washington DC US Environmental Protection Agency (EPA) 6001-82-007
Lance JC 1984 Land disposal of sewage effluents and residues In Britton G Gerba CP editors Groundwater pollution microbiology New York NY John Wiley amp Sons Inc p 198ndash220
Maire R Pomel S 1994 Karst geomorphology and environment In Gilbert J Danielopol DL Stanford JA editors Groundwater ecology San Diego CA Academic Press
Malard F Reygrobbellet JL Soulie M 1994 Transport and retention of fecal bacteria at sewage-polluted fractured rock sites J Environ Qual 231352ndash63
Michaud S Menard S Arbeitt RD 2004 Campylobacteriosis Eastern townships Quebec Emerging Infectious Diseases 10(10)1844ndash7
Moe CL 1997 Waterborne Transmission of infectious agents In Hurst CJ Knudsen GR McInerney MJ Stetzenbach LD Walter MV editors Manual of environmental microbiology Washington DC American Society of Microbiology
Musgrave DK Derringer GD 1985 Soil survey of Ottawa County Ohio Washington DC Government Printing Office
Myers DN Thomas MA Frey JW Rheaume SJ Button DT 2000 Water quality in the Lake Erie-Lake Saint Clair DrainagesmdashMichigan Ohio Indiana New York and Pennsylvania 1996ndash98 US Geological Survey Denver CO US Geological Survey Circular
National Research Council 2004 Indicators for waterborne pathogens Washington DC The National Academies Press
National Research Council 2001 Under the weathermdashclimate ecosystems and infectious disease Washington DC The National Academies Press
Newell AL 1995 The caves of Put-in-Bay Put-in-Bay OH Lake Erie Originals
Ohio Department of Health 2005 Household sewage systems Ohios decentralized wastewater infrastructure Retrieved on September 7 2005 from httpwww2odhohiogovODHProgramsSEWAGESewPubswastwtrPDF
Pennsylvania Department of Environmental Protection 2003 Drinking water treatment
27
technologies for groundwater systems under the direct influence of surface water Harrisburg PA Bureau of Water Supply and Wastewater Management 2001 Retrieved on July 13 2005 from httpwwwdepstatepausdepdeputatewatermgtWSMWSM_DWMTechnolTrt_GU DIhtm
Percival SL Chalmers RM Embrey M Hunter PR Sellwood J Wyn-Jones P 2004 Microbiology of Waterborne Diseases San Diego CA Elsevier Ltd
PIB Chamber of Commerce Lodging information Retrieved on February 7 2005 from httpwwwput-in-baycom
Rose JB Epstein PR Lipp EK Sherman BH Bernard SM Patz JA 2001 Climate variability and change in the United States potential impacts on water and foodborne diseases caused by microbiological agents Environ Health Perspects 109(2)211ndash21
Salvato JA 1992 Environmental engineering and sanitation 4th ed New York NY John Wiley amp Sons Inc
Tranter J Gunn J Hunter C Perkins J 1997 Bacteria in the Castleton karst Derbyshire England J Engineering Geol 30171ndash8
US Census Bureau 2000 Put-in-Bay Township housing information Retrieved on February 7 2005 from httpfactfindercensusgov
US Department of the Interior 1985 Groundwater manualmdasha water resource technical publication Bureau of Reclamation Denver CO US Government Printing Office
US Environmental Protection Agency 1984 National statistical assessment of rural water conditions Washington DC US Environmental Protection Agency (EPA) 5709shy84-003
US Environmental Protection Agency 1999 Environmental Protection Agency guidance manual for conducting sanitary surveys of public water systems Surface water and groundwater under the direct influence (GWUDI) Washington DC US Environmental Protection Agency (EPA) 815-R-99-016
Verber JL Stansbery DH 1953 Caves in the Lake Erie Islands The Ohio Journal of Science 53(6)358ndash62
Yates MV 1987 Septic tank siting to minimize the contamination of groundwater by Microorganisms Washington DC US Environmental Protection Agency Office of Water Protection (EPA) 440 6-87-007
28
ATTACHMENTS
Environmental Health Assessment for Epi-Aid 2004-076 Outbreak of Gastroenteritis with Multiple Etiologies among Resort Visitors and
ResidentsmdashOhio 2004
29
80
70
60
s 50
cas
ef
oer 40
bmu
N 30
20
10
0
Giardia (n=3)
Salmonella Typhimurium (n=1)
Campylobacter (n=16)
Norovirus (n=9)
Suspect cases
530 66 613 620 627 74 711 718 725 81 88 815 822 829 95 912 919
Date of Onset
ATTACHMENT 1 Cases of gastroenteritis by date of onset and etiology South Bass Island Ohio May 30ndash September 12 2004 (N = 1450)
30
ATTACHMENT 2 INFORMATION ON SOUTH BASS ISLAND OHIO
South Bass Island (Longitude ndash8284970 Latitude 416021) in Ottawa County Ohio is located approximately 50 miles east of Toledo and 72 miles west of Cleveland Ohio South Bass Island Middle Bass Island and North Bass Island are collectively referred to as the Bass Islands of Ohio South Bass Island is the most developed of the three islands The village of Put-in-Bay is located on South Bass Island Middle Bass Island is situated between South and North Bass Islands North Bass Island is the farthest island from the Ohio mainland and the closest to the Canadian boarder (Figure 1)
The city of Port Clinton (population 11000) the capitol of Ottawa County Ohio is the nearest mainland city to South Bass Island South Bass Island is accessible by watercraft and air transportation Two ferry lines serve South Bass Island one carries only passengers and operates between Port Clinton and Put-in-Bay (12 mile trip ) the other carries passengers and vehicles and operates between Catawba Island and the southern point of South Bass Island (3 mile trip) Ferry service is not available during the winter months though air service is available year-round When Lake Erie freezes local residents also travel over the ice to get to and from South Bass Island and the mainland
Figure 1 Bass Islands Lake Erie Ohio
Source United States Geological Survey Put-in-Bay Topographic Map httpwwwterraservercom
31
South Bass Island is 5705 feet above sea level and covers an area of 1382 acres The island is 35 miles long by 15 miles wide it is 5 miles from the international border with Canada (Figures 2 amp 3) The island has an average annual temperature of 506degF with the annual average precipitation being among the lowest in the state at 2905 inches
Figure 2 Aerial Photograph Bass Islands Lake Erie Ohio
Source httpwwwterraservercom
South Bass Island a popular vacation destination from April through October attracts visitors from Ohio neighboring states and Canada Island activities include fishing boating swimming golfing camping bird watching and exploring caves and the unique geology of South Bass Island Vineyards and a winery are located on South Bass Island These and the many other South Bass Island activities and special events bring an estimated 15000 visitors to the island each week of the tourist season Visitor information for South Bass Island lists 21 tourist and recreational attractions 25 restaurants and taverns 14 shopping venues 11 providers of transportation services 11 bed and breakfasts 15 short-term rental homes 11 hotels and 2 campgrounds
32
Services on South Bass Island include a bank six boat docking and marina facilities two churches a fuel distributor two grocery stores a hardware store laundry police fire and emergency medical services post office library and a school
The islandrsquos public service infrastructure includes the Put-in-Bay public water system and wastewater treatment facility operated and managed by the municipality Portions of the island not served by public water and sewer use groundwater wells and on-site wastewater treatment and disposal systems
The 1990 US Census reports 679 drilled wells and 27 dug wells in use in Put-in Bay Township and 191 connections to the public water system The census reports 114 connections to the public sewer system and 749 septic tanks or cesspools in the township The 1990 US Census for the Village of Put-in-Bay reports 110 connections to the public water system and 82 housing units served by a drilled well The census reports 61 connections to the public sewer system and 127 septic tanks or cesspools in use in the village
The 1990 census figures are used here because well and septic system data were not collected in the more recent 2000 census
Septage from island septic tanks is land-applied near the center of the island Solid waste generated on the island is collected for disposal on the mainland
The Put-in-Bay TownshipSouth Bass Island 2000 US Census reports the following
bull Population 763 bull Median age of residents 451 years bull Total housing units 1264 bull Occupied housing units 355 (28) bull Vacant housing units 909 (72)
(851 [67] of the vacant housing units are seasonal recreational occasional use units)
bull Homeowner vacancy rate 3 bull Rental vacancy rate 29 bull Average household size of owner-occupied units 225 bull Average household size of renter-occupied units 176
33
Figure 3 Topographic Map of Bass Islands Lake Erie Ohio
Source United States Geological Survey Put-in-Bay Topographic Map at httpwwwterraservercom
34
ATTACHMENT 3
Aerial photograph identifying 11 NCEH water sample collection locations South Bass Island Ohio August 30ndashSeptember 2 2004
Photograph Source National Oceanic and Atmospheric Administration at httpmfproductsnosnoaagovimagesphotos5wn21675gif
Information Source NCEH Ultrafiltration Sampling Records South Bass Island August 30ndashSeptember 2 2004
35
Sample Locations
bull Sample 01 ndash August 30 2004mdashVillage of Put-in-Bay Water Treatment Plant bull Sample 02 ndash August 30 2004mdashPerryrsquos Monument National Park Service Maintenance
Building at 17 Park Avenue bull Sample 03 ndash August 30 2004mdashSaunders Cottages North Well at 1495 Catawba bull Sample 04 ndash August 31 2004mdashPerryrsquos Cave 979 Catawba bull Sample 05 ndash August 31 2004mdashJoersquos Bar and Grill (Press House) 1400 Catawba bull Sample 06 ndash August 31 2004mdashIrvingrsquos Put-in-Bay Deli 2110 Langram bull Sample 07 ndash September 1 2004mdashHeinemanrsquos Winery 978 Catawba bull Sample 08 ndash September 1 2004mdash1282 Catawba bull Sample 09 ndash September 1 2004mdash1210 Catawba bull Sample 10 ndash September 2 2004mdash1391 Put-in-Bay Road bull Sample 11 ndash September 2 2004mdash1030 Put-in-Bay Road
Ultrafiltration Sample Collection Field Notes South Bass Island Ohio August 30ndashSeptember 2 2004
Sample 01 ndash August 30 2004mdashVillage of Put-in-Bay Water Treatment Plant Centrally located on the eastern shore of South Bass Island the water treatment plant is designed for daily operation at 0216 million gallons per day (MGD) and a maximum production of 0288 (MGD) Water for the plant is drawn from Lake Erie The plant has five treatment chambers each with a maximum loading capacity of 50 gallons per minute (gpm) Treated water is chlorinated and pumped to a 200000 gallon elevated storage tank The water then flows into the distribution system serving the Village of Put-in-Bay on the north side of the island The distribution system connects to 104 commercial meters and 95 residential water meters
Sample 02 ndash August 30 2004mdashPerryrsquos Monument National Park Service Maintenance Building at 17 Park Avenue The National Park Service site is one of the most distant locations of the community water distribution system The sample was taken at the maintenance building breakroom sink Because the National Park Service site was connected to the Put-in-Bay Village water distribution system no property environment assessment was needed A free chlorine residual was measured at 041 parts per million (ppm)
Sample 03 ndash August 30 2004mdashSaunders Cottages North Well at 1495 Catawba The Saunders Cottages are small cottages located on the west side of the island near the shore line The north well supplies water to approximately six cottages in this area No septic tanks were used Wastewater is treated by a small aeration package plant located north of the cottages A chlorinator was installed on the north well but was turned off several hours before sampling The sample was collected from a tap upstream from the chlorinator The free chlorine residual was measured at 004 ppm
Sample 04 ndash August 31 2004mdashPerryrsquos Cave 979 Catawba Perryrsquos Cave is a tourist
36
attraction for an underground cavern It is located inland across the road from the Heineman Winery The property has a miniature golf course gift shop a gold panning sluice and a butterfly house The water supply for the business is obtained from underground creek in the cave located directly under the gift shop The property was equipped with a septic tank located northwest of the gift shop and cavern The water system was flushed for approximately 40 minutes before sampling Free chlorine testing of the water supply was frequently made while the system was being flushed The free chlorine residual was measured at 002 ppm The water was not chlorinated
Sample 05 ndash August 31 2004mdashJoersquos Bar and Grill (Press House) 1400 Catawba Joersquos Bar amp Grill is a restaurant and bar located at the corner of Catawba and Meechen Roads opposite a cemetery The property also had two dormitory type housing units The well was located at the southeast corner of the metal building located behind or south of the bar An old stone-lined septic leach tank was recently replaced with three 1500 gallon sewage holding tanks The septic leach tank that was removed measured 20 feet long 6 feet wide and 6 feet deep It was a stone-lined ldquotankrdquo with no lateral lines The owner was ordered to abandon this system and replace it with the storage tanks The well was run approximately 2 hours before sampling The well was equipped with a chlorinator but it was not working during our visit No chlorine residual was detected
Sample 06 ndash August 31 2004mdashIrvingrsquos Put-in-Bay Deli 2110 Langram The deli and convenience store was located on the south end of the island near the shore and next to the ferry dock An employee dormitory was located on the property but was supplied by another well The well for the deli was located on the northeast side of the property near the driveway to the ferry loading area The sewage was pumped from the property through a lift station to a small package treatment plant on the north side of Langram Road The well was run approximately 4 hours before sampling It had reportedly been chlorinated several days prior The chlorine residual was detected at 001 ppm
Sample 07 ndash September 1 2004mdashHeinemanrsquos Winery 978 Catawba The property is a local winery with a gift shop and restaurant and bar Located north of the winery was a single-story house The well casing was located in a pit under a metal plate of the sidewalk leading to the restaurant and bar Because the casing is located below the ground surface it is also prone to being flooded and had reportedly flooded as recently as August 16 2004 Two septic tanks served the house a 250-gallon tank and a 1000shygallon tank The septic tanks were located on the west side of the house and were being pumped during our visit of September 1 2004 The drainfield pipes had been capped August 19 2004 and tanks were being pumped on an as-needed basis Two 1000-gallon tanks serving the restaurant and bar located on the southwest side of the winery were also capped on August 17 2004 and are also pumped on an as-needed basis The well was equipped with a chlorinator and was turned off several hours before sampling Water was taken from a tap upstream from the chlorinator The well ran a minimum of 4 hours before sample collection No chlorine residual was detected
Sample 08 ndash September 1 2004mdash1282 Catawba The residence was a single-family home located adjacent north and west of a septage disposal site The residence well was
37
located at the southwest corner of the property and was located approximately 72 feet from the septic tank and 50 feet from the drainfield The well was not equipped with a chlorinator Water was run at three sinks in the home for 15 hours while water the sample was being taken No chlorine residual was detected
Sample 09 ndash September 1 2004mdash1210 Catawba The residence was a single-family home surrounded on all but the west side of the septage disposal site The well was located in the back yard approximately 54 ft from the septic tank Water was run for approximately 25 hours before sampling The free chlorine residual was detected at 002 ppm
Sample 10 ndash September 2 2004mdash1391 Put-in-Bay Road The residence was a single-family home with a museum located approximately 100 feet northwest of the home The museum belonged to the homeowner The property was located west of septage disposal site The well was located on the northwest side of the home A septic tank was located behind the home and a gray water disposal area was located between the home and the museum The well was not chlorinated and had not been disinfected recently Water was run for approximately 30 minutes before sampling Chlorine residual was detected at 002 ppm
Sample 11 ndash September 2 2004mdash1030 Put-in-Bay Road The residence was a single-family home located northeast of the septage disposal site The well was located next to the home on the south side The septic tank was located behind the home to the east The well was not chlorinated and according to the owners had not been disinfected this year Chlorine residual was detected at 001 ppm
Wastewater Sample ndash August 30 2004mdashVillage of Put-in-Bay Wastewater Treatment Plant A 250-mL sample of raw wastewater was collected from the wastewater treatment plant The bottle was capped and labeled as ldquowastewaterrdquo The 250shymL bottle was double-bagged and sealed with tape and immediately stored on ice The ice-packed wastewater sample was delivered to the Centers for Disease Control and Prevention (Atlanta Georgia) on August 31 2004 for testing
38
ATTACHMENT 4
Environmental Sampling Conducted in the Investigation of a Suspected Waterborne Outbreak
South Bass Island Ohio AugustndashSeptember 2004
Analytical Results from the Water and Environmental Projects Laboratories of the Division of Parasitic Diseases Centers for Disease Control and Prevention (CDC)
National Center for Infectious Diseases
Water and Wastewater Sampling Performed by CDC National Center for Environmental Health (NCEH) Field Team
Between August 30 and September 2 2004 a field team from CDCNCEH collected 1 wastewater sample and 11 water samples from South Bass Island Ohio The wastewater sample was an approximately 250-mL sample of raw sewage collected at the Put-in-Bay wastewater treatment facility This sample was collected to determine if wastewater generated and treated on the island would give an indication of what pathogens were circulating in the human population working residing on and visiting South Bass Island Of the 11 water samples collected 1 was from the raw water intake of the Put-in-Bay water treatment plant (Sample 1) 1 was the finished water from the water treatment plant (Sample 2) 5 were groundwater from transient noncommunity (TNC) public water supplies (Samples 3ndash7) and 4 were from private wells (Samples 8ndash11) Table 1 provides information on the sampling sites and conditions
All water samples were concentrated using an ultrafiltration technique developed at CDC Briefly 50 L of water was collected and concentrated in the field using an ultrafilter module having a molecular weight cut-off of ~20000 daltons a pore size small enough to enable the ultrafilter to effectively retain all solid particles (including microbes) in the water samples If a free chlorine residual was detected in water to be sampled sodium thiosulfate was added to deactivate the disinfecting properties of chlorine A negatively charged chemical sodium polyphosphate was used to pretreat all ultrafilters and was also added to each water sample This was done to reduce potential sticking of microbes to the surfaces of the ultrafilter system All samples were concentrated to 200ndash250 mL (termed ldquoretentaterdquo) All samples and ultrafilters were stored and shipped refrigerated to CDC for further processing and analysis
Water and Wastewater Analysis at CDC
At CDC the ultrafilters were backflushed with a surfactant solution to remove residual microbes from the filter surfaces This backflush water was added to the corresponding retentate and the combined sample centrifuged to concentrate bacteria and parasites in the samples The supernatant from the centrifugation process was treated using chemical precipitation to concentrate viral pathogens in the samples In general coliphages were assayed directly from retentate not from the precipitation-concentrated samples
39
The ldquobacteria and parasite pelletsrdquo were resuspended and aliquoted for analysis by several different labs at CDC bull the Campylobacter reference laboratory (Collette C Fitzgerald) bull the water and environmental projects laboratory (Vincent Hill) bull the waterborne parasite laboratory (Michael J Arrowood) and bull the parasite genotyping laboratory (Lihua X Xiao)
This report presents the results of the water and environmental projects and waterborne parasite laboratories The parasite genotype analyses are not yet completed The results of the Campylobacter reference laboratory are summarized in a separate report
In addition to analyzing the samples for pathogenic microbes CDC also analyzed samples for microbial indicators of fecal contamination The microbial indicators studied are enteric microbes that do not tend to multiply in the environment Thus their presence in environmental samples can be considered an indication that the sampled water have been contaminated to some degree by fecal matter (which could either be from humans or animals) Fecal coliforms and Escherichia coli are well-established bacterial indicators of fecal contamination Clostridium perfringens are spore-forming bacteria that are highly persistent under environmental conditions (especially versus viruses and non-sporeshyforming bacteria) The presence of C perfringens is a conservative indicator of fecal contamination as the presence of the spores can reflect historical fecal contamination (months to many years) Somatic and F-specific coliphages are viruses that infect coliform bacteria Thus they are normal gastrointestinal microfloras that are fairly specific indicators of fecal contamination Research has suggested that coliphages are superior to coliform bacteria as indicators for the presence of viral pathogens
Summary of Results
The wastewater analyses indicate that the wastewater sampled contained concentrations of microbial indicators that are typical of untreated private wastewater (Table 2) All positive microbial detections for this sample and the water samples are highlighted in Table 2 by shaded cells Cryptosporidium spp and adenoviruses were also detected in the wastewater sample using real-time (TaqMan) polymerase chain reaction (PCR) The aliquot of the wastewater sample assayed by immunomagnetic separation (IMS) and an immunofluorescent antibody (IFA) kit (a standard microscopy technique for these parasites) was found to be positive for Giardia spp Fluorescent structures that were considered to possibly be Cryptosporidium were also observed in the wastewater sample but these particles did not have the typical size expected for Cryptosporidium and thus are not reported here as being positively identified as Cryptosporidium Additional analysis of the wastewater sample by IMS-IFA microscopy and nested PCR genotyping report negative results for Cryptosporidium and positive results for Giardia
We found water collected at the raw water intake at the Put-in-Bay water treatment facility to be positive for four microbial indicators as well as for Cryptosporidium spp (by both PCR and microscopy) In the finished water collected from the Put-in-Bay
40
distribution system we did detect the DNA of Cryptosporidium It is not known whether this detection reflects the presence of viable or infectious Cryptosporidium PCR results are a very conservative indicator of fecal contamination and health risks as the PCR test can detect DNA that is not associated with viable or infectious pathogens However this data can be considered as warranting additional investigation of the effectiveness of equipment and procedures used at the Put-in-Bay water treatment facility
Of the five TNC wells sampled three were found to contain fecal coliforms and E coli Two of these wells (Samples 5 and 7) contained relatively high concentrations of E coli In addition three of the five wells contained either somatic coliphages or F-specific coliphages One of the wells contained C perfringens Only one of the wells (Sample 3) did not contain a culturable microbial indicator of fecal contamination However Sample 3 as well as three other samples was found to be positive for Salmonella by PCR (using two different PCR assays) We were not able to culture Salmonella from any of these samples This is not necessarily surprising as the PCR technique can detect nonviable and viable-but-not-culturable (VBNC) microbes In addition to Salmonella three other pathogens were detected in the TNC wells using PCR Cryptosporidium (in three of five wells) adenovirus (in one of five wells) and enterovirus (in one of five wells) While the IMSIFA analyses for Cryptosporidium are negative the analyses did detect a single Giardia cyst in Sample 5 This is a significant finding as the presence of this parasite (which is fairly large with a diameter of 12 microm) indicates that enteric parasites as well as smaller pathogens (ie bacteria and viruses) can enter and be transported through the subsurface aquifer at South Bass Island Additional analysis of these samples included genotyping by nested PCR Cryptosporidium hominis was detected in Sample 5 by Nested PCR Genotyping
Samples from the four private wells (Samples 8ndash11) were received at CDC on September 3 2004 and stored in a refrigerator until September 7 before further processing and analysis While significant microbial die-off likely occurred during this extending holding period two of the four samples were still found to be positive for E coli Beyond fecal coliforms and E coli none of the private well samples were found to be positive for any other microbial analyte All Salmonella cultures for the private samples are negative
41
Table 1 NCEH Field Team Water Sample Collection Log South Bass Island Ohio Investigation
Sample Collection Dates August 30 to September 2 2004
Sample Number
Location Chlorine Residual
Date Collected Date Sent to CDC
Date Received
1 Raw Water Community Water Treatment Facility
None Detected (ND)
Mon-30 Aug 31 Aug 31Aug
Notes Community Water System 2 Finished Water
Community Water Distribution System
041 ppm Mon-30 Aug 31 Aug 31 Aug
Notes Perryrsquos Monument National Park Service Maintenance Building 17 Park Ave 3 Saunders Cottages
North Well 004 ppm Mon-30 Aug 31 Aug 31 Aug
Notes Transient Noncommunity Water Supply System 4 Perryrsquos Cave 002 ppm Tue-31 Aug 31 Aug 1 Sept
Notes Transient Noncommunity Water Supply System 5 Joersquos Bar ND Tue-31 Aug 31Aug 1 Sept
Notes Transient Noncommunity Water Supply System 6 Irvingrsquos Put-in-Bay
Deli 001 ppm Tue-31 Aug 1 Sept 2 Sept
Notes Transient Noncommunity Water Supply System 7 Heineman Winery ND Tue-31 Aug 1 Sept 2 Sept
Notes Transient Noncommunity Water Supply System 8 1282 Catawba
Residence ND Wed-1 Sept 2 Sept 3 Sept
Notes Private Goundwater Well 9 1210 Catawba
Residence 002 ppm Wed-1 Sept 2 Sept 3 Sept
Notes Private Goundwater Well 10 1391 Put-in-
Bay Residence 002 ppm Thurs-2 Sept 2 Sept 3 Sept
Notes Private Goundwater Well 11 1030 Puti-in-
Bay Residence 001 ppm Thurs-2 Sept 2 Sept 3 Sept
Notes Private Goundwater Well
42
Table 2 Water and Wastewater Analytical Results from CDCNCIDDPD Water and Environmental Projects Laboratories
Sample ID Fecal
Coliforms E coli Somatic
Colipahges F-specific
Coliphages C perfringens Salmonella
PCR Salmonella
Culture
Wastewater 45000 cfumL ND ND 680000 pfumL 130 cfumL Negative lt 002 MPNmL
Sample 1 3 cfuL 2 cfuL 02 pfuL lt 01 pfumL 10 cfuL Negative lt 01 MPNL
Sample 2 lt 04 cfuL lt 04 cfuL lt 01 pfuL lt 01 pfumL lt 08 cfuL Negative lt 01 MPNL
Sample 3 lt 04 cfuL lt 04 cfuL lt 01 pfuL lt 01 pfumL lt 08 cfuL Positive lt 01 MPNL
Sample 4 lt 08 cfuL lt 08 cfuL 7 pfuL lt 09 pfumL lt 08 cfuL Positive lt 01 MPNL
Sample 5 714 cfuL 420 cfuL 92 pfuL lt 09 pfumL 11 cfuL Negative lt 01 MPNL
Sample 6 21 cfuL 20 cfuL lt 1 pfuL lt 09 pfumL lt 08 cfuL Positive lt 01 MPNL
Sample 7 135 cfuL 118 cfuL 3 pfuL 8 pfumL lt 08 cfuL Positive lt 01 MPNL
Sample 8 1 cfuL (a) 1 cfuL (a) ND ND lt 08 cfuL Negative lt 01 MPNL
Sample 9 2 cfuL (a) 1 cfuL (a) ND ND lt 08 cfuL Negative lt 01 MPNL
Sample 10 lt 06 cfuL (a) lt 06 cfuL (a) ND ND lt 08 cfuL Negative lt 01 MPNL
Sample 11 lt 06 cfuL (a) lt 06 cfuL (a) ND ND lt 08 cfuL Negative lt 01 MPNL
Notes
(a) Estimated concentration Samples were held 5 days until culture analysis ldquoltrdquo = microbe was not detected in sample at detection limit noted cfu = colony forming units pfu = plaque forming units MPN = most probable number (5-tube) ND = not done
43
Table 2 CDCCCIDDPD Analytical Results (Cont)
Sample ID Cryptosporidium
PCR Cryptosporidium
IMS-IFA Giardia
IMS-IFA GI
Norovirus GII
Norovirus Adenovirus
PCR Enterovirus
PCR
Wastewater Positive ldquoNegativerdquo (b) 151 cysts100 mL Negative Negative Positive Negative
Sample 1 Positive 15 oocsysts10 L lt 15 cysts10 L Negative Negative Negative Negative
Sample 2 Positive lt 15 oocysts10L lt 15 cysts10 L Negative Negative Negative Negative
Sample 3 Positive lt 15 oocysts10L lt 15 cysts10 L Negative Negative Negative Negative
Sample 4 Negative lt 2 oocysts10L lt 2 cysts10 L Negative Negative Negative Negative
Sample 5 Negative lt 2 oocysts10L 18 cysts10 L Negative Negative Positive Positive
Sample 6 Positive lt 15 oocysts10L lt 15 cysts10 L Negative Negative Negative Negative
Sample 7 Positive lt 15 oocysts10L lt 15 cysts10 L Negative Negative Negative Negative
Sample 8 Negative lt 15 oocysts10L lt 15 cysts10 L Negative Negative Negative Negative
Sample 9 Negative lt 15 oocysts10L lt 15 cysts10 L Negative Negative Negative Negative
Sample 10 Negative lt 15 oocysts10L lt 15 cysts10 L Negative Negative Negative Negative
Sample 11 Negative lt 15 oocysts10L lt 15 cysts10 L Negative Negative Negative Negative
(b) Approxmately 10 ldquocrypto-like structures were observed in a volume equal to 14 of the sample While these structures fluoresced brightly and were close to the expected appearance they were slightly too large (6 to 65 microm rather than the typical 45 to 5 microm oocysts of C parvum and C hominis) These structures may have been artifacts or possibly C andersonii (or equivalent) The assay was not sufficiently clear to confidently identify these structures as being Cryptosporidium spp
44
Cryptosporidium and Giardia analysis results South Bass Island Ohio
Sample LocationID Real-time PCR dagger IMS-IFA Microscopy Genotyping Nested PCRDagger
Wastewater Cryptosporidium PCR Positive
Cryptosporidium Negative
Giardia Positive (151cysts100mL)
Cryptosporidium Negative
Giardia Positive
Sample 1 Raw Water CWS Cryptosporidium PCR Positive
Cryptosporidium IMSshyIFA
15 oocsysts10 L Giardia Negative
Cryptosporidium Negative Giardia Negative
Sample 2 Finished Water PWS Cryptosporidium PCR Positive
Cryptosporidium Negative
Giardia Negative
Cryptosporidium Negative
Giardia Negative
Sample 3 Saunders Cottages North Well
Cryptosporidium PCR Positive
Cryptosporidium Negative
Giardia Negative
Cryptosporidium Negative
Giardia Negative
Sample 4 Perryrsquos Cave Cryptosporidium Negative
Cryptosporidium Negative
Giardia Negative
Cryptosporidium Negative
Giardia Negative
Sample 5 Joes Bar Cryptosporidium Negative
Cryptosporidium Negative
Giardia Positive (18cysts10 L)
Cryptosporidium hominis Positive
Giardia Negative
Sample 6 Irivings Put-In-Bay Deli Cryptosporidium PCR Positive
Cryptosporidium Negative
Giardia Negative
Cryptosporidium Negative
Giardia Negative
Sample 7 Heineman Winery Cryptosporidium PCR Positive
Cryptosporidium Negative
Giardia Negative
Cryptosporidium Negative
Giardia Negative
Sample 8 1282 Catawba Cryptosporidium Negative
Cryptosporidium Negative
Giardia Negative
Cryptosporidium Negative
Giardia Negative
Sample 9 1210 Catawba Cryptosporidium Negative
Cryptosporidium Negative
Giardia Negative
Cryptosporidium Negative
Giardia Negative
Sample 10 1391 Put-in-Bay Cryptosporidium Negative
Cryptosporidium Negative
Giardia Negative
Cryptosporidium Negative
Giardia Negative
Sample 11 1030 Put-in-Bay Cryptosporidium Negative
Cryptosporidium Negative
Giardia Negative
Cryptosporidium Negative
Giardia Negative Reporting sources Centers for Disease Control National Center for Infectious Diseases Parasitic Diseases Laboratory Atlanta GA water and environmental projects laboratory (Vincent Hill) daggerwaterborne parasite laboratory (Michael J Arrowood) and Daggerparasite genotyping laboratory (Lihua X Xiao)
45
Campylobacter results on samples collected by NCEH on South Bass Island August 30ndashSeptember 2 2004
We received 12 samples from Vincent Hillrsquos laboratory at CDC The sample numbers 1ndash11 correspond to the sample numbers used in the attachment sent by John Sarisky on 92704 entitled ldquoReleased NCID NCEH Environmental Lab Results 092404rdquo The remaining sample was a wastewater sample The results are summarized in the table below
Only one sample ldquo5rdquo was culture positive for a campylobacter-like organism This has now been confirmed biochemically and by 16S sequencing as an Arcobacter butzleri strain No sample was culture positive for Campylobacter sp
Sample Number Culture Lightcycler PCR Genus C jejuni Seminested PCR
1 NBG Neg Neg 2 NBG Neg Neg 3 NBG Neg Neg 4 NBG Neg Neg 5 Arcobacter butzleri ++ + 6 NBG Neg Neg 7 NBG Neg + 8 NBG Neg Neg 9 NBG Neg Neg
10 NBG Neg Neg 11 NBG Neg Neg
wastewater sample NBG Neg Neg NBG ndash no bacterial growth Neg ndash negative + - positive The PCR procedure described by Waage et al 1999 was followed (Waage AS Vardund T Lund V Kapperud G 1999) Detection of small numbers of Campylobacter jejuni and Campylobacter coli cells in environmental water sewage and food samples by a semi-nested PCR assay Appl Environ Microbiol 651636-43 1999 This assay is specific for C jejuni and C coli and is based on the intergenic region between two flagelling genes (flaA and flaB)
46
From Xiao Lihua X Sent Friday November 05 2004 323 PM To Hill Vincent Sarisky John Cc Beach Michael J Subject Results for Put-in-Bay Investigation-- John and Vince
Below are Crypto and Giardia genotyping results for water samples from the South Bass outbreak We also analyzed the samples for microsporidia (Enterocytozoon bieneusi) Quite a few of the samples produced bands of the expected size several (2 for each sample) of which were sequenced However we were unable to read out the sequences due to underlying signals (a sign for mixed genotypes) in the electropherogram
I apologize for taking so long to get the results back to you but I am short handed and there were five outbreaks under investigation It took us quite some efforts to genotype and subtypethe Giardia in the wastewater samples as we had to cut the PCR products out of gel several times for sequencing because of the presence of other bands
Lihua
South Bass Ohio (Put-in-Bay) Drinking Water Cryptosporidium Outbreak Sept04 Crypto Giardia
9158 Put-in-Bay Water Outbreak Ohio Sample No 1-Surface water Neg Negative 9159 Put-in-Bay Water Outbreak Ohio Sample No 2 -Treated water Neg Negative 9160 Put-in-Bay Water Outbreak Ohio Sample No 3- Saunders North Well Neg Negative 9161 Put-in-Bay Water Outbreak Ohio Sample No 4 water Neg Negative 9162 Put-in-Bay Water Outbreak Ohio Sample No 5 water C hominis Negative 9163 Put-in-Bay Water Outbreak Ohio wastewater Neg Assemblage A WA1 subtype 9164 Put-in-Bay Water Outbreak Ohio Sample No 6 water Neg Negative 9165 Put-in-Bay Water Outbreak Ohio Sample No7 water Neg Negative 9166 Put-in-Bay Water Outbreak Ohio Sample No8 water Neg Negative 9167 Put-in-Bay Water Outbreak Ohio Sample No9 water Neg Negative 9168 Put-in-Bay Water Outbreak Ohio Sample No10 water Neg Negative 9169 Put-in-Bay Water Outbreak Ohio Sample No11 water Neg Negative
47
_________ _____________________________________________
ATTACHMENT 5
Bass Island Sample Form
Sample ______ Date _______2004 Chlorinated YES No
Location (Include diagram on back show location of well septic tank drainfield house and other features)_______________________________________________________________________________
Weather Conditions _______________________________________________________
Free Chlorine Test ____PPM Nitrate Test _____PPM
Home Water Pumping Started________AM PM
Filter Apparatus Setup Start ________ AM PM Filter Apparatus Setup Complete ________ AM PM
10 ml Sodium Thiosulfate 20 L Water YES No NA 2 Tubes (15ml) Sodium Polyphosphate 20 L Water YES No Sample Start Time ______ AM PM Permeate Rate _____ mlmin
10 ml Sodium Thiosulfate 20 L Water YES No NA 2 Tubes (15ml) Sodium Polyphosphate 20 L Water YES No Sample Start Time ______ AM PM Permeate Rate _____ mlmin
5 ml Sodium Thiosulfate 10 L Water YES No NA 1 Tubes (15ml) Sodium Polyphosphate 10 L Water YES No Sample Start Time ______ AM PM Permeate Rate _____ mlmin
Ultrafilter in Ziplock Bag at ______ AM PM (on ice) (color connectorsadapters included)
250 ml polycarbonate bottle capped with retenate at ______ AM PM (on ice) (labeled the same as Ultrafilter)
Filter Apparatus Takedown Start ________ AM PM Filter Apparatus Takedown Complete ________ AM PM
Iced down and shipped overnight to CDC co Vince Hill 4770 Buford Highway MS F-36 Building 109 Room 1318 Atlanta GA 30341
48
ATTACHMENT 6 Well Log and Drilling Report ndash Historical Review 1951ndash2004
South Bass Island Ohio
Drilling Company
Total Wells Wells with CrevicesCave
s
Wells with CrevicesCave s below Well
Casing
Percent of Wells with
Crevices below Casing
Tibboles Well Drilling (1975ndash1997)
214 6 6 100
Edgil Collins Well Drilling (1988ndash1995)
80 0 0 0
Island Well Drilling (1961ndash1971)
82 36 20 56
Oddo amp Kimmet Well Drilling (1996ndash2003)
48 0 0 0
Water Well Drilling amp Supply (1956ndash1960)
32 1 1 100
NO Manahan (1948ndash1953)
15 0 0 0
Robertsonrsquos (1973ndash1997)
17 0 0 0
Clear Water Well Drilling (1995) 4 0 0 0 Dunbar Drilling (1970ndash1978) 4 0 0 0
Aicirtap Enterprises Inchellip (1979) 3 0 0 0
LG Argutte (1964ndash1969) 4 2 2 100
TOTAL 503 45 29 64
Source South Bass Island well drilling logs Ohio Department of Natural Resources
49
ATTACHMENT 7
Movement of Water in Karst Geology
50
ATTACHMENT 8
Ottawa County SSURGO Digital Soil Survey Limitations for Septic Absorption Fields
South Bass Island Ohio 1985
Source Ottawa SSURGO Digital Soil Survey Division of Soil and Water Conservation Ohio Department of Natural Resources Columbus Ohio January 2000
51
ATTACHMENT 9
Soil Limitations for Wastewater Disposal
All five soil types identified on South Bass Island have limitations for septic tank systems rated as ldquosevererdquo in the Soil Survey The following is a list of each soil series located on South Bass Island along with its primary limitations
Castalia ndash This is the predominant soil on South Bass Island The primary limitations are depth to bedrock and many large stones ranging in size from 10 inches to 4 feet across Unweathered bedrock (dolomitic limestone) is found at depths from 20 to 40 inches Vertical fractures in bedrock are 3 to 6 feet apart
Dunbridge ndash The primary limitation is depth to bedrock Unweathered bedrock is found at depths from 20 to 40 inches in this soil series Vertical fractures in bedrock are 2 to 4 feet apart
Milton ndash Major limitations include depth to bedrock and slow permeability Depth to bedrock ranges from 20 to 40 inches
Nappanee ndash The primary limitations are slow permeability and soil wetness The perched seasonal high water table is between depths of 1 to 2 feet in fall winter spring and extended wet periods
Rawson ndash Major limitations are soil permeability and wetness It is also noted that some Rawson soils may have bedrock as shallow as 20 to 40 inches The perched seasonally high water table is at depths between 30 and 48 inches in winter and spring and other extended wet periods Soil permeability is rated as slow to very slow in the lower profile of the soil
Disturbed areas ndash Areas where soils were not classified include the area around the Perry Monument which is owned by the National Park Service and two small areas identified as ldquopitsrdquo where limestone bedrock has been removed for use in construction
For soils identified with an asterisk () the soil survey notes that effluent from sanitary facilities used in these soils may move through fissures in the bedrock and pollute groundwater supplies
52
ATTACHMENT 10
ODHNCEH Groundwater Quality Assessment Procedure
The South Bass Island groundwater assessment included only private residential wells and consisted of a sanitary survey and the collection of a groundwater sample The island was divided by topographical features into 22 sections To obtain a statistically valid number of samples in each of the 22 sections an Ohio Department of Health (ODH) surveyor selected four housing units representing a geographic distribution within the section If a household resident of a selected unit agreed to participate in the assessment the surveyor collected a water sample and conducted a sanitary survey of the groundwater supply system Ohio Department of Health surveyors were to visit homes in each of their assigned sections until they enrolled four locations Collected water samples were stored in insulated containers and returned to the Ottawa County Health Department by 500 PM of each of the three sample collection days Samples were shipped to a certified water quality laboratory for analysis (Benchmark Laboratory and the Ohio Department of Agriculture Laboratory) Samples were analyzed for total coliforms E coli Campylobacter Salmonella chloride and nitrate Sample collection and sanitary survey information was collected reviewed clarified and corrected when needed and recorded on the master tracking log
To facilitate mapping of sampled wells longitude and latitude coordinates were recorded in the field The sample collection tracking log and sanitary survey codebook were developed for this activity A Web-based data entry system and a GIS mapping tool were developed by the ODH and the Centers for Disease Control and Preventionrsquo s National Center for Environmental Health (NCEH) to assist with analysis of collected data The NCEH Health Informatics Office developed an additional GIS analysis tool to support data analysis
The ODHNCEH groundwater quality assessment collected groundwater samples from 11 (77679) of the housing units served by a groundwater well on South Bass Island The protocol called for a sample size of 88 private groundwater wells (4 wells for each of the 22 sections) however resource and time limitations restricted the number of households visited to 77 Seventy-seven is a valid sample size for this descriptive study
Data from the sanitary survey and well-logs were entered into a Microsoft Access database Statistical analysis was performed using SAS version 802 and EPI Info version 322 Geographic information system analysis was performed using Spatial Epidemiology and Emergency Management System (SEEM) version 11 Following is the sanitary survey data collection form water sample collection tracking log and the sanitary survey codebook
53
___________________________________________________________________________________
___________________________________________________________________________________
______________________________________________________________________________________ ______________________________________________________________________________________ _______________________________________________________________________________
ATTACHMENT 10 Form 1
ODHNCEH Groundwater Quality Assessment Sanitary Survey Form
South Bass Island Ohio September 2004
South Bass Island - Sanitary Survey
Owner Name________________________________________________________________ Address (street number name)________________________________________________ GPS Coordinates (NAD 83) _________________________________________________ Sample collected_
Water Well Information Well Currently Used for Drinking Water______
Well Casing (circle one) - Steel PVC Well casing (circle) - Above grade In Pit
Well casing height above grade__________ Well Log Number_____________________
Condition of casing (circle) Good Fair Deteriorated Holescracks in casing
Well Cap(circle) - Aluminum 2 Part gasketed Sanitary Seal Condition of cap_____________________________________________________________
Type of pump (circle) Jet Deep(2 lines) Jet Shallow Submersible Hand pump
Pitless Adapter______ Well Pit ______(wet or dry) Well House_____________________
Conditions around well (subsidence slope rock at surface)____________________________________
Comments__________________________________________________________________________
HSTS Information
TankRisers visible______ Distribution Boxes____ ATU visible______ Discharge ______
Location of Discharge_______________Lake discharge______ Discharge - clear cloudy odor (circle)
Elevated leach field or mound______ Chlorinator present and filled_______ Aeration sytem ndash motor present______
Comments on system conditions (surfacing sewage wet areas green stripes etc
54
Water Treatment Information
System type (circle one) ndash Softener Oxidizing Unit(chlorineiodine) Continuous chlorination Ultraviolet Carbon Filter Sediment Filter
Other________________________________________________________________
Sampling port or bypass present_____________________________________________
Survey completed by_________________________________________________________ Date_________________________________________
LAB
55
Attachment 10 Form 2
Water Sample Collection Log Bass Island Ohio
Lab
DATE COLLECTED
TIME NAME ADDRESS WELL LOG CLOOECTED BY SECTION
56
ATTACHMENT 10 Table 1
ODHNCEH Groundwater Quality Assessment Codebook South Bass Island Ohio September 2004
Variable Name Variable Type Variable size Variable Description Values or Explanation Data Source Well_log Number 6 Well log number uniquely
describes well Plunketmdb
Sanitary survey Last_name Character 20 Last name of well owner Sanitary survey
Tracking database
First_name Character 20 First name of well owner Sanitary survey Tracking database
Street_name Character 25 Street name where well is located
Plunketmdb Sanitary survey
Street_number Character 5 Street number where well is located
Plunketmdb Sanitary survey
Well_depth Number 4 Depth of the well in feet Plunketmdb Sanitary survey
Latitude Number 9 Latitude of well position Plunketmdb Sanitary survey
Longitude Number 9 Longitude of well position Plunketmdb Sanitary survey
Sample_date Date 10 Date sample was taken Santary survey Laboratory
results
Sample_number Character Number assigned to lab results for sample
Laboratory results
57
Quadrant Character 22 Quadrant where sample was drawn
1-22 quadrants Sanitary survey Tracking database
Collector Character 20 Name of Surveyor Sanitary survey Tracking database
Lab Character 30 Name of Laboratory performing analysis
Ohio Department of Agriculture BenchMark
Tracking database
TC Number Laboratory results for Total Coliforms
Laboratory results
EC Number Laboratory results for E coli Laboratory results
Campy Number Laboratory results for Camybolacter
Laboratory results
Salmon Number Laboratory results for Salmonella
Laboratory results
Nitrate Number Laboratory results for Nitrates Laboratory results
Chloride Number Laboratory results for Chlorides
Laboratory results
Casing_mat Character 8 Material used for well-casing Steel PVC Brick Concrete
Sanitary survey
Casing_location Character 16 Location of well-casing Above grade In pit Buried Cannot
determine
Sanitary survey
Casing_height Number 2 Height of well-casing above grade in inches
Sanitary survey
Casing_cond YES-no Does the well-casing havecracks holes or gaps
Sanitary survey
Case_diam Number 4 Diameter of well casing in inches
Well logs
58
Case_length Number 5 Length of the well casing in feet
Well logs
Cap YES-no Is the well top covered YESno Sanitary survey Cap_seal YES-no Well top provides a sanitary
seal YESno Sanitary survey
Pitless YES-no Presence of pitless adapter YESno Sanitary survey Wellhouse YES-no Well head in protected
wellhouse YESno Sanitary survey
Wellhead YES-no Well head located in pit YESno Sanitary survey wellhead_dry YES-no Well head in pit is dry YESno Sanitary survey Date_comp Date 10 Date well constuction
completed Well logs
Drawdown Number 3 Number of feet that water can be drawn down in a well
Well logs
Static_level Number 3 Depth to water level in feet Well logs Well_pres YES-no Presence of a properly sealed
water well (10ft) YESno Sanitary survey
Slines_pres YES-no Presence of sewer lines (10ft) YESno Sanitary survey
Sewage_pres YES-no Presence of sewage disposal systems (50ft)
YESno Sanitary survey
Water_pres YES-no Presence streams lakes ponds and ditches near well
source (25ft)
YESno Sanitary survey
Manure_pres YES-no Presence of manure ponds piles or lagoons near well
source (50-300ft)
YESno Sanitary survey
Landfill_pres YES-no Land fills or dump sites present near well source
(1000ft)
YESno Sanitary survey
59
Watercoll YES-no Surface water collects around well-casing
YESno Sanitary survey
Cont_pres YES-no Other sources of contamnation present near
well source
YESno Sanitary survey
Cont_other Text 250 Explanation of other type of contamination source
Sanitary survey
Sewage_home YES-no Home sewage tretment system is designed to
discharge effluent to surface
YESno Santary survey
Discharge Character 15 Surface discharge location Drainage ditch Storm drain Lake Pond
Stream
Sanitary survey
Disch_qual Character 10 Quality of effluent Clear Cloudy Odor Sanitary survey Chlorination YES-no Chlorinated effluent YESno Sanitary survey
Oper_chl YES-no chlorination system operates as designed
YESno Sanitary survey
Aeration YES-no Presence of aeration system YESno Sanitary survey Oper_aer YES-no Aeration system functions as
designed YESno Sanitary survey
Treat_type Character 30 Type of water treatment system used
Softener Oxidizing unit(iodinechlorine)
Carbon Filter Sediment Filter Ultraviolet
Continuous chlorination
Sanitary survey
Port YES-no Presence of sampling port or bypass
YESno Sanitary survey
60
ATTACHMENT 11 Table 1
E coli Analysis Results Groundwater Samples Collected on South Bass Island Ohio
September 2004
E COLI POSITIVE RESULTS n = 77
69 E COLI NEGATIVE
31 E COLI POSITIVE
69 E COLI NEGATIVE
31 E COLI POSITIVE
Source Ohio Department of Health (ODH) and Centers for Disease Control and Prevention National Center for Environmental Health (NCEH) groundwater quality assessment South Bass Island Ohio September 8ndash10 2004
61
ATTACHMENT 11 Table 2
E coli Analysis Results by Laboratory Groundwater Samples Collected on South Bass Island Ohio
September 2004
Lab amp Sample Set Date Collected Total Samples Number E coli
Positive Percent Positive
Benchmark 1 Wednesday 090804 16 5 294
ODA 2 Wednesday 090804 6 1 167
Benchmark 3 Thursday 090904 15 6 400
ODA 4 Thursday 090904 12 4 308
Benchmark 5 Friday 091004 20 3 150
ODA 6 Friday 091004 8 5 625
Total 77 24 312
Source Ohio Department of Health (ODH) and Centers for Disease Control and Prevention National Center for Environmental Health (NCEH) groundwater quality assessment South Bass Island Ohio September 8ndash10 2004
62
ATTACHMENT 11 Table 3
Location of E coli Positive Sample Results Groundwater Samples Collected on South Bass Island Ohio
September 2004
Source Ohio Department of Health (ODH) and Centers for Disease Control and Prevention National Center for Environmental Health (NCEH) groundwater quality assessment South Bass Island Ohio September 8ndash10 2004
63
ATTACHMENT 12 Table 1
Total Coliform Analysis Results Groundwater Samples Collected on South Bass Island Ohio
September 2004
TOTAL COLIFORM POSITIVE RESULTS n = 77
22 Total coliform negative
78 Total coliform positive
22 Total coliform negative
78 Total coliform positive
Source Ohio Department of Health (ODH) and Centers for Disease Control and Prevention National Center for Environmental Health (NCEH) groundwater quality assessment South Bass Island Ohio September 8ndash10 2004
64
Total
ATTACHMENT 12 Table 2
Total Coliform Analysis Results by Laboratory Groundwater Samples Collected on South Bass Island Ohio
September 2004
Lab amp Sample Set Date Collected Total Samples Total Coliform Positive Percent Positive
Benchmark 1 Wednesday 090804 16 14 875
ODA 2 Wednesday 090804 06 03 500
Benchmark 3 Thursday 090904 15 12 800
ODA 4 Thursday 090904 12 09 750
Benchmark 5 Friday 091004 20 16 800
ODA 6 Friday 091004 08 06 750
77 60 779
Source Ohio Department of Health (ODH) and Centers for Disease Control and Prevention National Center for Environmental Health (NCEH) groundwater quality assessment South Bass Island Ohio September 8ndash10 2004
65
ATTACHMENT 12 Figure 1
Location of Total Coliform Positive Samples Groundwater Samples Collected on South Bass Island Ohio
September 2004
Source Ohio Department of Health (ODH) and Centers for Disease Control and Prevention National Center for Environmental Health (NCEH) groundwater quality assessment South Bass Island Ohio September 8ndash10 2004
66
ATTACHMENT 13 Figure 1
E coli Positive Results by Well Depth Groundwater Samples Collected on South Bass Island Ohio
September 2004
0 ft
52 ft
d
162 ft
Source Ohio Department of Health (ODH) and Centers fNational Center for Environmental Health (NCEH) grouIsland Ohio September 8ndash10 2004
67
Well Hea
Wells 0 to 52 Feet Deep 64 E coli Positive
N = 22
Wells greater than 52 Feet Deep 19 E coli Positive
N = 54
Ground Surface
or Disease Control and Prevention ndwater quality assessment South Bass
ATTACHMENT 13 Figure 2
E coli Results Well Depths Less Than 52 Feet Groundwater Samples Collected
September 8ndash10 2004 South Bass Island Ohio
Source Ohio Department of Health (ODH) and Centers for Disease Control and Prevention National Center for Environmental Health (NCEH) groundwater quality assessment South Bass Island Ohio September 8ndash10 2004
68
ATTACHMENT 13 Figure 3
E coli Results Well Depths Greater Than or Equal to 52 Feet Groundwater Samples Collected
September 8ndash10 2004 South Bass Island Ohio
Source Ohio Department of Health (ODH) and Centers for Disease Control and Prevention National Center for Environmental Health (NCEH) groundwater quality assessment South Bass Island Ohio September 8ndash10 2004
69
ATTACHMENT 13 Figure 4
E coli Positive Results by Well Depths Groundwater Samples Collected
September 8-10 2004 South Bass Island Ohio
Source Ohio Department of Health (ODH) and Centers for Disease Control and Prevention National Center for Environmental Health (NCEH) groundwater quality assessment South Bass Island Ohio September 8ndash10 2004
70
ATTACHMENT 14
E coli Positive Results by Section Location Groundwater Samples Collected on South Bass Island Ohio
September 2004
Location Total Samples
Number E coli Positive
Percent Positive
Shoreline 55 17 309
Interior 22 7 318
Source Ohio Department of Health (ODH) and Centers for Disease Control and Prevention National Center for Environmental Health (NCEH) groundwater quality assessment South Bass Island Ohio September 8ndash10 2004
71
ATTACHMENT 15 Table 1
Water Quality Analysis Results Private Groundwater Wells Sampled by Ottawa County Health Department
South Bass Island Ohio AugustndashSeptember 2004
Date Collected
Number Collected
Number amp Total Coliform Positive
Number amp Ecoli Positive
AUG 23 9 5 (56 ) 2 (22) AUG 25 8 4 (50 ) 1 (13) AUG 30 23 12 (52 ) 8 (35) SEPT 01 6 3 (50 ) 2 (33) SEPT 08 18 3 (17) 6 (40)
Total ( Pos) 64 27 (42) 19 (30)
Source Ottawa County Health Department Port Clinton Ohio September 10 2004
72
ATTACHMENT 15 Table 2
Water Quality Analysis Results Total Coliform and E coli Positive Private Groundwater Well Samples
South Bass Island Ohio 2001ndashAugust 2004
Year Number of
Samples Collected
Number Total
Coliform Positive
Percent Total
Coliform Positive
Number E coli
Positive
Percent Ecoli
Positive
2001 29 18 62 2 7 2002 23 9 39 2 9 2003 28 14 50 3 11
Jan ndash July 2004 13 10 77 2 15
Aug 2004 54 36 67 14 26 Total 147 87 59 23 16
Source Ottawa County Health Department Port Clinton Ohio September 10 2004
ATTACHMENT 15 Table 3
Groundwater Quality Analysis Results All Water Samples Collected Total Coliform and E coli Results by Agency
South Bass Island Ohio AugustndashSeptember 2004
Agency Total Coliforms E coli No
Analyzed No
Positive Percent
+ No
Analyzed No
Positive Percent
+ OEPA 87 38 44 48 17 35 MSU 8 4 50 8 2 25 ODA 10 3 33 10 2 20 CDC 0 mdash mdash 7 4 57 ODH 6 4 666 4 2 50 Total 111 49 44 77 27 35
Source Ottawa County GI IllnessmdashSummer 2004 Sample Results Log Oct 14 2004 Ohio Environmental Protection Agency (OEPA) Columbus Ohio MSU = Michigan State University ODA = Ohio Department of Agriculture CDC = Centers for Disease Control and Prevention ODH = Ohio Department of Health
73
ATTACHMENT 16
South Bass Island and North Central Ohio Precipitation (in inches)
North Central Region North Central Region South Bass Island Month 2004 1951ndash2000 1977ndash1997
January 225 221 163 February 063 191 145
March 362 266 228 April 236 337 298 May 809 351 333
June 496 373 349 July 406 372 301
August 376 336 343 September 245 299 303
October 233 226 248 November 359 283 253 December 335 254 213
Total 4145 3509 3177
Sources Monthly Water Inventory Report for Ohio Ohio Department of Natural Resources Monthly Station Normals Station 33 Put-In-Bay National Oceanic and Atmospheric Administration
74
- Background
- Purpose
- Phase 1 - Rapid Field Asessment
-
- Determination of Water Quality
- Assessment of Water Sources and Supplies
- Assessment of Community Water Distribution System and Auxiliary Wells
- Assessment of Water Sources and Supplies - Development of Groundwater Wells Sewage Disposal Methods
- Sewage Disposal Methods
-
- Phase 2 - Groundwater Quality Assessment
-
- ODHNCEH Assessment
- Collection Organization and Analysis of Available Water Quality Data
-
- Conclusions
- Recommendations
- References
- Attachments
-
- 1 Cases of gastroenteritis by date of onset and etiology
- 2 Information on South Bass Island Ohio
- 3 Aerial photograph identifying 11 NCEH water sample collection locations South Bass Island Ohio Aug 30 - Sept 2 2004
- 4 Environmental Sampling Conducted in the Investigation of a Suspected Waterborne Outbreak South Bass Island Ohio Aug - Sept 2004
- 5 Bass Island Sample Form
- 6 Well Log and Drilling Report
- 7 Movement of Water in Karst Geology
- 8 Ottawa County SSURGO Digital Soil Survey
- 9 Soil Limitations for Wastwater Disposal
- 10 ODHNCEH Groundwater Quality Assessment Procedure
- 11 E coli Analysis Results
- 12 Total Coliform Analysis Results
- 13 E coli Positive Results by Well Depth
- 14 E coli Positive Results by Section Location
- 15 Water Quality Analysis Results
- 16 South Bass Island and North Central Ohio Precipitation (in inches)
-
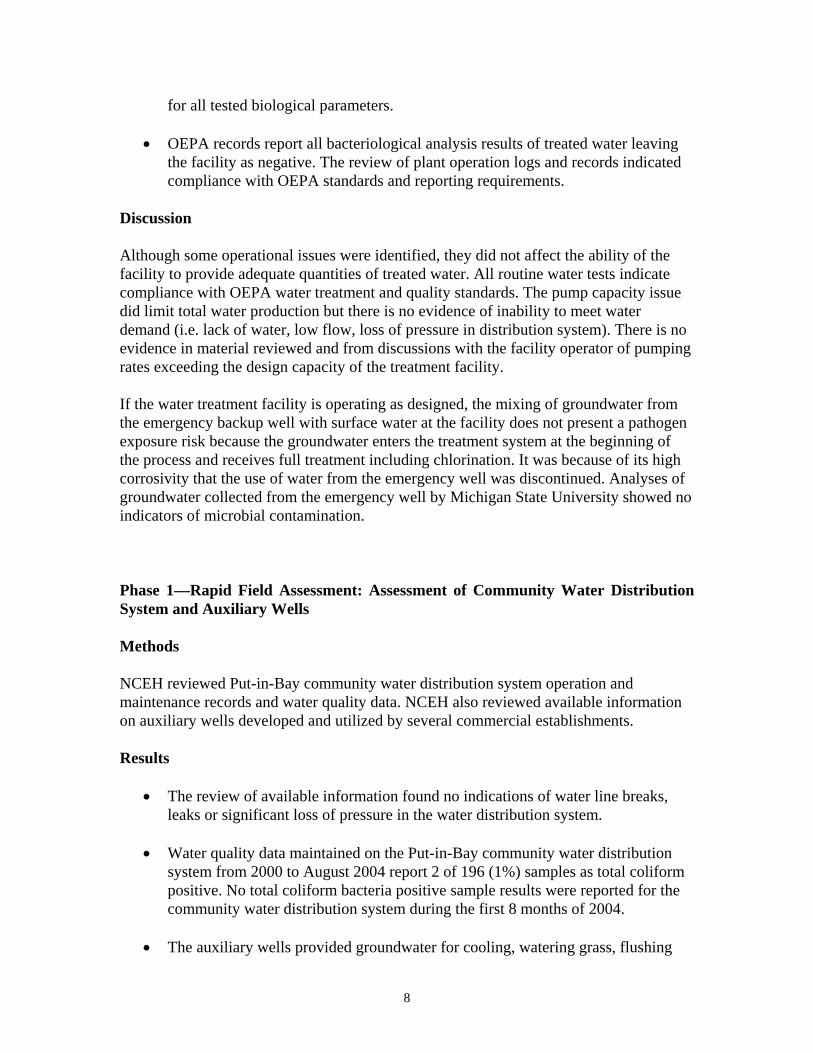
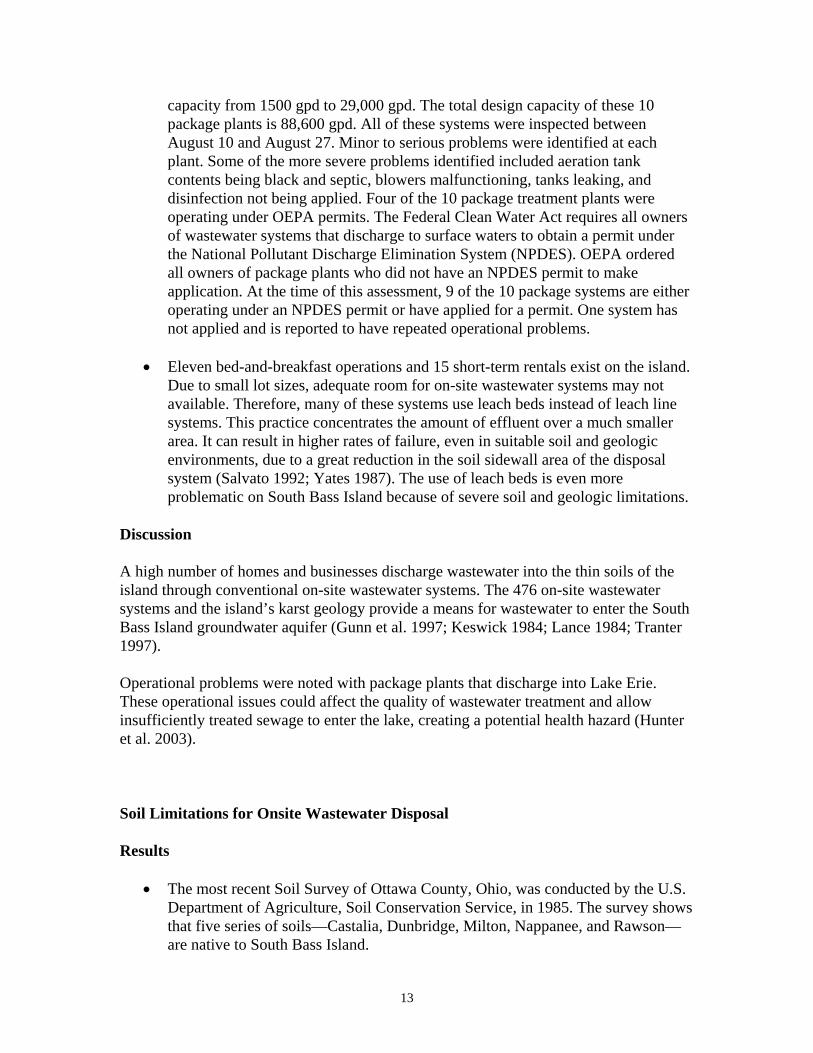
Results
bull Septage was pumped from business and privately owned septic tanks by a local septic tank pumping service and discharged on land into a sink holelow depression located between Catawba Road and Put-in-Bay Road This disposal site was reported to be in use for several years NCEH was unable to obtain septage dumping records for the site More than half of the water samples (Samples 5 and 7ndash11) were collected from TNC public water supplies and private wells that were located adjacent to and within 1 mile of the property where septage was discharged
bull None of the private well water samples (8ndash11) taken from properties adjacent to the septage disposal site were positive for bacterial or viral contamination
bull The TNC public water supplies sampled near the septage disposal site showed significant levels of contamination (Samples 5 and 7)
Discussion
OEPA reports that septage disposal at this site is not allowed under Title 40 of CFR Part 503 and has stopped It is unknown if the septage disposal site contributed to the contamination of the TNC public water supplies Given the karst geology of the island including large pores channels and caves through which surface water and contaminants can travel it is possible that the septage disposal site may have contributed to contamination of the groundwater aquifer (Keswick 1984 Kowel 1982 Lance 1984)
Phase 2mdashGroundwater Quality Assessment ODHNCEH Assessment
Methods
The ODHNCEH groundwater quality assessment included only private residential wells The assessment conducted water source sanitary surveys and collected groundwater samples (US Environmental Protection Agency 1999) The island was divided into 22 sections and a total of 77 water samples were collected Attachment 10 provides a description of the sampling protocol
Samples were analyzed for total coliforms E coli Campylobacter Salmonella chloride and nitrate The primary purpose of collecting a water sample was to support the finding of a sanitary survey The South Bass Island water quality assessment was designed to collect information on selected well characteristics and conditions that could affect water quality CDCrsquos water quality assessment of Midwestern private wells which yielded valuable information on private well use in the United States focused on well characteristics such as pitless adapters backflow devices sanitary seal cracked casing proximity to potential contamination sources and other data This protocol was used as a model in the design of the South Bass Island assessment (Centers for Disease Control and
15
Prevention 1998) However limited resources and time prevented the collection of accurate and complete sanitary survey data on South Bass Island
The results of this groundwater sample collection activity are compared to South Bass Island outbreak and existing historical groundwater quality data
Results
bull Of the groundwater samples collected by the ODHNCEH assessment 31 were E coli positive (Attachment 11)
bull Historical data for South Bass Island reports 9 of private wells as E coli positive
bull Outbreak response water quality data from August and September 2004 report 30 of private wells E coli positive and 35 of the TNC public water systems as E coli positive
bull Of the groundwater samples collected by the ODHNCEH assessment 78 were total coliform positive (Attachment 12) Historical data reports 51 total coliform positive for private wells
bull Outbreak response water quality data from August and September 2004 reports 42 of private wells to be total coliform positive and 48 of the TNC public water systems tested positive
bull A statistically significant relationship exists between wells that are less than 52 feet deep and positive results for E coli (OR = 77 (95 CI 224ndash2706) P value = 00002) Wells constructed with depths less than 52 feet are almost 8 times more likely to be contaminated with E coli than wells with depths of 52 feet or greater (Attachment 13)
bull A statistically significant relationship also exists between wells developed in the aquifer above lake bottom and E coli positive results (OR = 321 (95 CI 113ndash909 P value = 0039) Groundwater wells developed in the aquifer above the lake level are 321 times more likely to be contaminated with Ecoli than wells drilled below the lake bottom
Discussion
The bacteriological results of the private well groundwater assessment are similar to those obtained in groundwater collection activities implemented in response to the
16
outbreak but higher than the historical data on private wells
The results obtained in the ODHNCEH groundwater quality assessment of 31 E coli and 78 total coliform positive exceed those obtained in the CDC Midwestern states well study of 11 E coli and 41 total coliform positive (Centers for Disease Control and Prevention 1998)
Wells less than 52 feet were more likely to be contaminated with E coli Deeper wells may provide some protection against contamination
A comparison of location of well in relation to shoreline and E coli positive results found no association (Attachment 14) Although no association was found with this analysis a mixing of ground and lake water in the aquifers under South Bass Island occurs through interconnected caves and fractures in the geology Historical studies of the island show increased water levels in caves rise as lake levels rise This shows evidence of interconnectivity of lake water and groundwater on the island (Newell 1999 Verber et al 1953)
Phase 2mdashGroundwater Quality Assessment Collection Organization and Analysis of Available Water Quality Data
Methods
Available historical and recent outbreak response groundwater quality records for South Bass Island provided by the Ottawa County Health Department Ohio Department of Health Ohio Environmental Protection Agency and the Ohio Department of Agriculture were combined organized and reviewed The number and percent of total coliform and E Coli positive water samples in the historical database were compared to outbreak sample results to determine if groundwater quality had recently deteriorated
Review of Existing Historical Private Groundwater Well Sampling Results
Results
Total coliform
bull Of the groundwater samples collected from private wells on South Bass Island during 2001 2002 and 2003 51 (4180) are total coliform positive (Attachment 15)
bull Of the groundwater samples collected from private wells on South Bass Island during the first 8 months of 2004 69 (4667) are total coliform positive
bull Private groundwater well total coliform positive results increased from 50 in 2003 to 77 during the first 7 months (JanuaryndashJuly) of 2004 and remained
17
elevated at 67 during August 2004
E coli
bull Of the groundwater samples collected from private wells on South Bass Island during 2001 2002 and 2003 9 (780) are E coli positive (Attachment 15)
bull Of the groundwater samples collected from private wells on South Bass Island during the first 8 months of 2004 24 (1667) are E coli positive
bull Of the 64 water samples collected by the Ottawa County Health Department at the end of August and the beginning of September 2004 30 (1964) were E coli positive
bull The Ottawa County Health Department collected 55 water samples in 2000 from private water wells on South Bass Island Sample results are reported as safe or unsafe Of the samples collected 56 (3155) were recorded as unsafe
Discussion
A comparison of recent to historical groundwater quality data found an increase in the number of both total coliform and E coli positive results for samples collected from private groundwater wells during the first 8 months of 2004 Total coliform positive results increased from 51 (2001ndash2003) to 69 for the first 8 months of 2004 E coli which is a stronger indicator of fecal contamination increased from 9 in 2001ndash2003 to 24 from January through August 2004
In a 1994 CDC private well study conducted in nine Midwestern states 413 of the wells (N = 5520) were positive for total coliforms and 111 were positive for E coli Although other studies have been conducted in the United States this study is most comparable because it was conducted in the same region Using this study as a comparison rates were higher for South Bass Island in all categories except E coli in 2001ndash2003 The percent of total coliform and E coli positive test were higher than the Midwestern states study A nationwide study conducted by EPA in 1984 showed rural wells with 78 total coliform and 12 E coli positive results This nation-wide study had higher total coliform rates than South Bass Island but E coli rates were higher for the island from January through August 2004 (US Environmental Protection Agency 1984)
Historical Review of Transient and Noncommunity Public Water Sample Results
Results
bull Of the groundwater samples collected from 11 TNC public water systems (2000ndash 2003) 7 (19284) were total coliform positive In comparison 51 of the
18
private well samples collected during this same period were total coliform positive
bull Of the groundwater samples collected from 11 TNC public water systems during the first 8 months of 2004 21 (735) are total coliform positive Of the private well samples collected during this same period 69 are total coliform positive
Discussion
The much higher percent of total coliform positive groundwater samples in the private wells compared to the TNC public water systems (51 vs 7) for the years 2000ndash2003 is difficult to explain Further investigation is needed One explanation might be that TNC water systems typically have to provide more water than private wells Consequently they may be drilled to greater depths drawing from deeper aquifers which are generally more protected than shallow aquifers (Gerba et al 1984 US Department of the Interior 1985)
Association between Precipitation and Water Quality
Methods
Precipitation data were examined for South Bass Island to determine if rainfall trends may have contributed to this outbreak The karst geology of the island containing caves cracks and fractures along with a thin soil layer increase the risk of groundwater contamination Large amounts of rainfall or melting snow may flush contaminants such as septic tank discharge from the upper soils into groundwater wells Ohio Department of Natural Resources monthly regional precipitation reports for the years 1951ndash2000 and 2004 were reviewed This regional data provides an average of precipitation for several sample points in north central Ohio South Bass Island rainfall data collected at Perryrsquos Monument from 1977 through 1997 were also reviewed Island-specific data were compared to the regional precipitation data to identify major differences and existing trends
Results
bull Average monthly precipitation on South Bass Island is 020ndash058 inches less than north central Ohio precipitation for all months except August September and October During these months the rainfall on South Bass Island is greater (Attachment 16)
bull The average yearly precipitation for the north central Ohio region is 3509 inches compared to the South Bass Island yearly average of 3177 inches
bull In 2004 north central Ohio precipitation exceeded the historical average for the region by 458 inches in May 123 inches in June 034 inches in July and 040
19
inches in August
Discussion
Regional precipitation for the months of March May June July and August 2004 is higher than historical measures and may have contributed to contamination of groundwater wells on South Bass Island Periods of high precipitation can cause contaminants from sewage treatment facilities to be flushed into the groundwater aquifer Periods of high snow melt may have the same effect on groundwater quality Although higher then normal precipitation may exacerbate the problem of groundwater contamination on the island it should not be considered the single contributing factor to this outbreak Continued use of on-site systems in this type of soil and geologic environment will result in continued contamination of the groundwater regardless of variations in precipitation (National Research Council 2001 Rose et al 2001)
Conclusions
Conclusion 1 Suspected Source of Etiological Agent
Sewage has contaminated the groundwater aquifers that provide drinking water to South Bass Island Inadequate soil depth to bedrock which is fractured and contains numerous solution channels contributes to the problem This increases the likelihood that on-site subsurface sewage disposal systems at homes and businesses are introducing sewage directly into groundwater supplies The karst formation of the island facilitates the movement of sewage into the aquifer and the movement of contaminated groundwater within the aquifer (Gunn et al 1997 Jack 1999 Malard et al 1994 Yates 1987)
The subsurface disposal of sewage is not the only contributor to the contamination of the aquifer Another source could be poorly maintained malfunctioning and possibly undersized package wastewater treatment plants In addition on-site wastewater disposal systems designed to discharge to surface water could be introducing untreated or poorly treated wastewater to the shoreline of the island Depending on the location duration and volume of discharge this situation may expose swimmers and recreational water enthusiasts to contaminated water Considering the apparent influence of surface water on South Bass Island groundwater supplies contaminated surface water could be mixing with groundwater
Because of the thin layer of soils on the island water runoff may move contaminants from the ground surface into the aquifer through openings and cracks near the ground surface (Centers for Disease Control 1999 Michaud et al 2004) The possible connection between the septage disposal site and contamination of the aquifer has not been adequately investigated (Keswick 1984 Kowel 1982)
Conclusion 2 Suspected Mode of Contamination of Water Supply
20
A review of operational records and bacteriological results for water leaving the water treatment plant does not support a link between drinking water from this source and illness Cross connections were found between auxiliary wells and the village water distribution system These cross connections could have allowed contaminated groundwater to enter the public water distribution system However a review of routine bacteriological results maintained on the distribution system did not find evidence of wide-spread contamination in the distribution system All water samples collected from the distribution system before and during the outbreak are negative for standard indicator organisms In addition water from the public water systems was not implicated in the outbreak by the epidemiologic investigation
Backflow prevention devices were installed at cross-connected auxiliary wells A properly functioning backflow prevention device prevents water from flowing back into the water service line that connects the building to the distribution main After removing the cross connections one reduced pressure zone (RPZ) valve was examined At the time of inspection the valve was found to not be working properly Reports did not indicate that other backflow prevention devices were tested If backflow prevention devices were not operating properly contaminated groundwater could have entered the buildingrsquos water service line and the public water distribution system
Two auxiliary wells that were discovered to be cross-connected at the time of the outbreak were sampled One of these auxiliary wells was positive for total coliform and E coli The second well was positive for C jejuni The cross connected wells may have provided contaminated groundwater a mode of entry into the public water distribution system
Drinking water from a groundwater well on South Bass Island is identified in the epidemiological investigation as the likely source of exposure for those individuals reporting illness The environmental investigation supports this conclusion Groundwater samples collected in response to this outbreak found strong indicators of fecal contamination (Haas et al 1999 National Research Council 2004) E coli was positive in 30 to 40 of collected groundwater samples The geographical distribution of these sample locations indicates widespread contamination of the groundwater aquifer On-site wastewater systems are installed in soils identified as having severe limitations for septic tank absorption fields (Musgrave et al 1985) The karst geology of the island provides a direct connection between on-site wastewater system effluent and the drinking water aquifer Well logs report numerous subsurface voids openings crevices and caves many below the protective casing depth This facilitates the mixing of sewage with groundwater in well holes and the movement of lake water into the aquifer (Gunn et al 1997 Maire 1994 Malard 1994 Tranter 1997)
Conclusion 3 Possible Reasons the Etiological Agents Survived in the Water Supply
The demand on island sewage and water systems during peak visitation periods especially summer weekends increases when an average of 15000 tourists visit the island In a short period (2-day weekends) large volumes of ground and surface water are used and returned
21
to the subsurface of the island or to the lake as wastewater This surge of wastewater into the islandrsquos many small on-site wastewater treatment and disposal systems may result in the discharge of inadequately treated sewage into the subsurface of the island and the lake The thin soil layer and the fractured karst geology allow sewage discharged to the subsurface to move quickly (days to weeks) into the drinking water aquifer Sewage contaminated lake water may also move under the island and mix with groundwater used for drinking
This weekly surge of sewage into the islandrsquos subsurface and surrounding lake water may contain a heavy concentration of pathogens Hardy pathogens including Cryptosporidium Giardia Campylobacter and Salmonella were detected in South Bass Island groundwater samples Cryptosporidium and Giardia were also detected in the untreated wastewater sample collected from the municipal wastewater treatment facility
The protozoa Cryptosporidium and Giardia do not easily move through soils Their detection in groundwater is an indication that other organisms may also be moving through the subsurface unimpeded Consuming as few as 10ndash25 Giardia cysts can cause infection Giardia cysts maintain viability for up to 3 months in cold water Studies conducted on Cryptosporidium found oocysts surviving in soils for 60ndash180 days and in surface water and groundwater for 176 days (Salvato 1992 Percival et al 2004) As few as 30 oocysts can cause infection in healthy individuals (Moe 1997 Percival et al 2004 Salvato 1992)
The infectious dose of Campylobacter is a few hundred organisms Studies have isolated Campylobacter from surface water and this bacterium is commonly found in high numbers in domestic sewage The survival of Campylobacter in the environment is dependent upon temperature and other factors with the range being a few days to weeks (Fricker 1999 Moe 1997 Percival et al 2004)
Salmonella can survive in soils for 1ndash120 days in surface water from days to 2 months and in groundwater for 70 days In addition to being able to survive in water for prolonged periods Salmonella is also able to grow in warm polluted waters Studies have identified large numbers of Salmonella in the effluent of wastewater treatment plants The infective dose of Salmonella can be as few as 1000 organisms (Gerba et al 1984 Percival et al 2004 Salvato 1992)
The geology of South Bass Island provides an avenue of connection between surface water runoff sewage lake water and the groundwater aquifer (Graham et al 1998 Musgrave et al 1985 Myers et al 2000) The influx of visitors on weekends to the island creates a demand for water that draws available recharge water to groundwater wells This demand for water may facilitate contamination of groundwater from on-site systems and increase the mixing of lake water with groundwater These periods of high water use also generate a high volume of sewage that existing systems may be unable to adequately treat This cycle of water demand and sewage discharge in the unique geology of South Bass Island creates a system that may allow a heavy concentration of viable pathogens to move quickly from host to susceptible persons
22
The lack of a treatment barrier also influences the survival of pathogens in water The number of households and business establishments using point-of-use water treatment equipment is unknown Groundwater may not be filtered or disinfected before consumption
Conclusion 4 Isolation of Suspected Etiological Agent From Water Supply
Indicators of fecal contamination were found in groundwater samples collected from South Bass Island Total coliforms Ecoli fecal coliforms somatic coliphages F-specific coliphages Clostridium perfringens Salmonella DNA Cryptosporidium DNA Giardia adenovirus DNA enterovirus DNA enterococci and Campylobacter (by culture genus and species DNA) were detected in water samples Campylobacter jejuni Arcobacter butzleri Campylobacter upsaliensis and Acinetobacter were also detected in South Bass Island water samples
Campylobacter Salmonella Group B norovirus and Giardia were isolated from ill persons Molecular sub-typing of C jejuni found the pattern of clinical isolates to differ from the pattern of C jejuni isolated from water This investigation was unable to genetically match a pathogen isolated from an environmental sample with a clinical isolate collected from an ill individual Considering the number and variety of pathogens and indicators of fecal contamination identified in South Bass Island water samples this lack of a genetic match should not be taken as evidence that groundwater is not linked to the illnesses (Baumann 1968 Hunter et al 2003 National Research Council 2004 Percival et al 2004)
Recommendations
Recommendation 1 All housing units and commercial establishments on the island should be served by a public sewage collection and disposal systems and a public water supply system Extending public water supply lines without provision of public sewer system could result in higher water use and an increase in the volume of wastewater generated per household and business Extending water supply lines to most of the island could result in additional residential and commercial development This growth may increase water use and wastewater production on the island If such development took place without adequate sewage disposal system expansion contamination of the aquifer could actually increase In addition increased water use would require expansion of the existing public water treatment facility
Recommendation 2 The septage disposal site should be closed and septage be disposed of at the sewage treatment facility or off the island at a site and methods approved of by local and state health and environmental authorities An assessment should be made to determine if the septage disposal site is contributing to the contamination of the aquifer If pathogens are present on the ground surface in the soil or in the subsurface at this location action should be implemented to remove this contamination source
Recommendation 3 Residents should not consume groundwater unless the source has a
23
demonstrated history of negative bacteriological results All Island groundwater should be treated before consumption The Pennsylvania Department of Environmental Protection document listed in the reference section of this report provides treatment guidelines (Pennsylvania Department of Environmental Protection 2003)
Recommendation 4 For all groundwater supplies on South Bass Island local and state environmental and health authorities should determine the influence of surface water on groundwater Inform those that plan to use groundwater that may be under the influence of surface water of precautions and actions needed to ensure safe drinking water Surface water treatment methods and procedures may need to be implemented when regulated systems use groundwater under the influence of surface water
Recommendation 5 Local and state environmental and health authorities should develop a sewage management plan for South Bass Island The severe soil and geologic limitations for conventional soil-based on-site wastewater disposal systems on South Bass Island may preclude the continued use of these types of systems (Ohio Department of Health 2005) Continued use of existing on-site wastewater disposal systems will likely result in persistent contamination of groundwater supplies and present a serious risk to public health A moratorium on the construction of new on-site wastewater treatment and disposal systems should be imposed until a sewage management plan is developed and implemented
Recommendation 6 Repair and alteration of existing on-site systems or the permitting of any new construction on the island would require extensively engineered alternative systems to overcome soil depth and permeability issues These systems would likely need to be elevated pressure-dosed alternative wastewater systems such as mounds However mound-type systems are often costly and require much more maintenance than conventional systems They also have a high probability of failure when used in high water use or ldquoshock-loadingrdquo situations such as those that typically occur in the summer months for business establishments located on South Bass Island Increased monitoring of existing package treatment plants during high use periods should be part of the sewage management plan
Recommendation 7 Another possible alternative to on-site wastewater disposal would be the development of one or more centralized wastewater treatment system (package plant) with surface water discharge Given the extreme fluctuation in island population during the summer months treatment facilities would need to be designed to accommodate maximum wastewater loading during peak wastewater discharge periods These systems are often costly and must comply with the NPDES provisions of the Clean Water Act Extensive maintenance and monitoring would be required along with the hiring of certified operators to manage and maintain the systems The greatest advantage to using surface water discharge as the primary method of wastewater disposal is that it reduces the threat of further groundwater contamination from on-site wastewater disposal This threat is not entirely eliminated however because of the characteristics of karst environments Any discharge that reaches losing or disappearing streams (a stream reach in which the water table adjacent to the stream is lower than the water surface in
24
the stream causing infiltration from the stream channel recharging the groundwater aquifer and decreasing the stream flow) that feed groundwater could then contaminate the aquifer
Recommendation 8 Local and state environmental and health authorities should develop and implement a public information effort to inform business owners and residents using groundwater wells of the potential exposure and health risks Provide information on protective measures and options available to reduce exposure to contaminated drinking water
Recommendation 9 Local and state environmental and health authorities should identify all private and business auxiliary wells to ensure that no additional cross connections exist within the distribution system
Recommendation 10 To ensure that all cross connections have been removed a tracer test using an inert substance should be considered The inert tracer would be added to the auxiliary well Drinking water within the home or business would then be analyzed for presence of the tracer
Recommendation 11 Local and state environmental and health authorities should identify and properly close abandoned wells and all improperly developed dug wells Place a moratorium on new well installation until appropriate well development guidelines can be written for South Bass Island
Recommendation 12 Local and state environmental and health authorities should assess water supplies and wastewater treatment facilities located on other islands with karst geology to determine if similar groundwater contamination issues exist
This Trip Report summarizes the field component of our EIP-AID investigation Because of the preliminary nature of this investigation future correspondence MMWR articles or other published reports might present results interpretation and recommendations
that are different from those contained in this document
25
References
Baumann P 1968 Isolation of acinetobacter from soil and water J Bacteriol 96 39ndash42
Blackburn BG Craun GF Yoder JS Hill V Levy DA Chen N et al 2004 Surveillance for waterborne-disease outbreaks associated with drinking watermdashUnited States 2001ndash 2002 MMWR 53(8) 23ndash39
Centers for Disease Control and Prevention 1999 Public health dispatch outbreak of escherichia coli 0157H7 and campylobacter among attendees of the Washington County FairmdashNew York 1999 MMWR 48(36)803
Centers for Disease Control and Prevention 1998 A survey of the quality of water drawn from private wells in the nine Midwestern states Atlanta GA US Department of Health and Human Services
Fetter CW 1980 Applied hydrogeology Columbus OH Charles E Merrill Publishing Company
Freeze RA Cherry JA 1979 Groundwater Englewood Cliffs NJ Prentice-Hall Inc
Fricker C 1999 Campylobacter In Waterborne pathogens AWWA Manual M48 Denver CO American Water Works Association
Gerba PG Bitton G 1984 Microbial pollutants their survival and transport pattern to groundwater In Britton G Gerba CP editors Groundwater pollution microbiology New York NY John Wiley amp Sons Inc p 65ndash84
Graham GW NrsquoDeye MN Brown LC 1998 Ohio State University fact sheet water resources of Ottawa County Retrieved on September 24 2004 from httpohiolineosueduaex-fact0480_62html
Gunn J Tranter J Perkins J 1997 Sanitary bacterial dynamics in a mixed karst aquifer Proceedings of workshop W2 held at Rabat Morocco AprilMay 1997 24761ndash70
Haas CN Rose JB Gerba CP 1999 Quantitative microbial risk assessment New York NY John Wiley amp Sons Inc
Hunter PR Waite M Ronchi E 2003 Drinking water and infections diseasendashestablishing the links Boca Raton FL CRC Press LLC
Jack JD 2005 Environmental problems in karst lands Retrieved on February 3 2005 from httpcwxprenhallcombookbindpubbooksnebel2medialibupdate13html
Keswick BH 1984 Sources of groundwater pollution In Britton G Gerba CP editors
26
Groundwater pollution microbiology New York NY John Wiley amp Sons Inc p 39ndash64
Kowel NE 1982 Health effects of land treatment microbiological Cincinnati OH Environmental Protection Agency Health Effects Research Laboratory Washington DC US Environmental Protection Agency (EPA) 6001-82-007
Lance JC 1984 Land disposal of sewage effluents and residues In Britton G Gerba CP editors Groundwater pollution microbiology New York NY John Wiley amp Sons Inc p 198ndash220
Maire R Pomel S 1994 Karst geomorphology and environment In Gilbert J Danielopol DL Stanford JA editors Groundwater ecology San Diego CA Academic Press
Malard F Reygrobbellet JL Soulie M 1994 Transport and retention of fecal bacteria at sewage-polluted fractured rock sites J Environ Qual 231352ndash63
Michaud S Menard S Arbeitt RD 2004 Campylobacteriosis Eastern townships Quebec Emerging Infectious Diseases 10(10)1844ndash7
Moe CL 1997 Waterborne Transmission of infectious agents In Hurst CJ Knudsen GR McInerney MJ Stetzenbach LD Walter MV editors Manual of environmental microbiology Washington DC American Society of Microbiology
Musgrave DK Derringer GD 1985 Soil survey of Ottawa County Ohio Washington DC Government Printing Office
Myers DN Thomas MA Frey JW Rheaume SJ Button DT 2000 Water quality in the Lake Erie-Lake Saint Clair DrainagesmdashMichigan Ohio Indiana New York and Pennsylvania 1996ndash98 US Geological Survey Denver CO US Geological Survey Circular
National Research Council 2004 Indicators for waterborne pathogens Washington DC The National Academies Press
National Research Council 2001 Under the weathermdashclimate ecosystems and infectious disease Washington DC The National Academies Press
Newell AL 1995 The caves of Put-in-Bay Put-in-Bay OH Lake Erie Originals
Ohio Department of Health 2005 Household sewage systems Ohios decentralized wastewater infrastructure Retrieved on September 7 2005 from httpwww2odhohiogovODHProgramsSEWAGESewPubswastwtrPDF
Pennsylvania Department of Environmental Protection 2003 Drinking water treatment
27
technologies for groundwater systems under the direct influence of surface water Harrisburg PA Bureau of Water Supply and Wastewater Management 2001 Retrieved on July 13 2005 from httpwwwdepstatepausdepdeputatewatermgtWSMWSM_DWMTechnolTrt_GU DIhtm
Percival SL Chalmers RM Embrey M Hunter PR Sellwood J Wyn-Jones P 2004 Microbiology of Waterborne Diseases San Diego CA Elsevier Ltd
PIB Chamber of Commerce Lodging information Retrieved on February 7 2005 from httpwwwput-in-baycom
Rose JB Epstein PR Lipp EK Sherman BH Bernard SM Patz JA 2001 Climate variability and change in the United States potential impacts on water and foodborne diseases caused by microbiological agents Environ Health Perspects 109(2)211ndash21
Salvato JA 1992 Environmental engineering and sanitation 4th ed New York NY John Wiley amp Sons Inc
Tranter J Gunn J Hunter C Perkins J 1997 Bacteria in the Castleton karst Derbyshire England J Engineering Geol 30171ndash8
US Census Bureau 2000 Put-in-Bay Township housing information Retrieved on February 7 2005 from httpfactfindercensusgov
US Department of the Interior 1985 Groundwater manualmdasha water resource technical publication Bureau of Reclamation Denver CO US Government Printing Office
US Environmental Protection Agency 1984 National statistical assessment of rural water conditions Washington DC US Environmental Protection Agency (EPA) 5709shy84-003
US Environmental Protection Agency 1999 Environmental Protection Agency guidance manual for conducting sanitary surveys of public water systems Surface water and groundwater under the direct influence (GWUDI) Washington DC US Environmental Protection Agency (EPA) 815-R-99-016
Verber JL Stansbery DH 1953 Caves in the Lake Erie Islands The Ohio Journal of Science 53(6)358ndash62
Yates MV 1987 Septic tank siting to minimize the contamination of groundwater by Microorganisms Washington DC US Environmental Protection Agency Office of Water Protection (EPA) 440 6-87-007
28
ATTACHMENTS
Environmental Health Assessment for Epi-Aid 2004-076 Outbreak of Gastroenteritis with Multiple Etiologies among Resort Visitors and
ResidentsmdashOhio 2004
29
80
70
60
s 50
cas
ef
oer 40
bmu
N 30
20
10
0
Giardia (n=3)
Salmonella Typhimurium (n=1)
Campylobacter (n=16)
Norovirus (n=9)
Suspect cases
530 66 613 620 627 74 711 718 725 81 88 815 822 829 95 912 919
Date of Onset
ATTACHMENT 1 Cases of gastroenteritis by date of onset and etiology South Bass Island Ohio May 30ndash September 12 2004 (N = 1450)
30
ATTACHMENT 2 INFORMATION ON SOUTH BASS ISLAND OHIO
South Bass Island (Longitude ndash8284970 Latitude 416021) in Ottawa County Ohio is located approximately 50 miles east of Toledo and 72 miles west of Cleveland Ohio South Bass Island Middle Bass Island and North Bass Island are collectively referred to as the Bass Islands of Ohio South Bass Island is the most developed of the three islands The village of Put-in-Bay is located on South Bass Island Middle Bass Island is situated between South and North Bass Islands North Bass Island is the farthest island from the Ohio mainland and the closest to the Canadian boarder (Figure 1)
The city of Port Clinton (population 11000) the capitol of Ottawa County Ohio is the nearest mainland city to South Bass Island South Bass Island is accessible by watercraft and air transportation Two ferry lines serve South Bass Island one carries only passengers and operates between Port Clinton and Put-in-Bay (12 mile trip ) the other carries passengers and vehicles and operates between Catawba Island and the southern point of South Bass Island (3 mile trip) Ferry service is not available during the winter months though air service is available year-round When Lake Erie freezes local residents also travel over the ice to get to and from South Bass Island and the mainland
Figure 1 Bass Islands Lake Erie Ohio
Source United States Geological Survey Put-in-Bay Topographic Map httpwwwterraservercom
31
South Bass Island is 5705 feet above sea level and covers an area of 1382 acres The island is 35 miles long by 15 miles wide it is 5 miles from the international border with Canada (Figures 2 amp 3) The island has an average annual temperature of 506degF with the annual average precipitation being among the lowest in the state at 2905 inches
Figure 2 Aerial Photograph Bass Islands Lake Erie Ohio
Source httpwwwterraservercom
South Bass Island a popular vacation destination from April through October attracts visitors from Ohio neighboring states and Canada Island activities include fishing boating swimming golfing camping bird watching and exploring caves and the unique geology of South Bass Island Vineyards and a winery are located on South Bass Island These and the many other South Bass Island activities and special events bring an estimated 15000 visitors to the island each week of the tourist season Visitor information for South Bass Island lists 21 tourist and recreational attractions 25 restaurants and taverns 14 shopping venues 11 providers of transportation services 11 bed and breakfasts 15 short-term rental homes 11 hotels and 2 campgrounds
32
Services on South Bass Island include a bank six boat docking and marina facilities two churches a fuel distributor two grocery stores a hardware store laundry police fire and emergency medical services post office library and a school
The islandrsquos public service infrastructure includes the Put-in-Bay public water system and wastewater treatment facility operated and managed by the municipality Portions of the island not served by public water and sewer use groundwater wells and on-site wastewater treatment and disposal systems
The 1990 US Census reports 679 drilled wells and 27 dug wells in use in Put-in Bay Township and 191 connections to the public water system The census reports 114 connections to the public sewer system and 749 septic tanks or cesspools in the township The 1990 US Census for the Village of Put-in-Bay reports 110 connections to the public water system and 82 housing units served by a drilled well The census reports 61 connections to the public sewer system and 127 septic tanks or cesspools in use in the village
The 1990 census figures are used here because well and septic system data were not collected in the more recent 2000 census
Septage from island septic tanks is land-applied near the center of the island Solid waste generated on the island is collected for disposal on the mainland
The Put-in-Bay TownshipSouth Bass Island 2000 US Census reports the following
bull Population 763 bull Median age of residents 451 years bull Total housing units 1264 bull Occupied housing units 355 (28) bull Vacant housing units 909 (72)
(851 [67] of the vacant housing units are seasonal recreational occasional use units)
bull Homeowner vacancy rate 3 bull Rental vacancy rate 29 bull Average household size of owner-occupied units 225 bull Average household size of renter-occupied units 176
33
Figure 3 Topographic Map of Bass Islands Lake Erie Ohio
Source United States Geological Survey Put-in-Bay Topographic Map at httpwwwterraservercom
34
ATTACHMENT 3
Aerial photograph identifying 11 NCEH water sample collection locations South Bass Island Ohio August 30ndashSeptember 2 2004
Photograph Source National Oceanic and Atmospheric Administration at httpmfproductsnosnoaagovimagesphotos5wn21675gif
Information Source NCEH Ultrafiltration Sampling Records South Bass Island August 30ndashSeptember 2 2004
35
Sample Locations
bull Sample 01 ndash August 30 2004mdashVillage of Put-in-Bay Water Treatment Plant bull Sample 02 ndash August 30 2004mdashPerryrsquos Monument National Park Service Maintenance
Building at 17 Park Avenue bull Sample 03 ndash August 30 2004mdashSaunders Cottages North Well at 1495 Catawba bull Sample 04 ndash August 31 2004mdashPerryrsquos Cave 979 Catawba bull Sample 05 ndash August 31 2004mdashJoersquos Bar and Grill (Press House) 1400 Catawba bull Sample 06 ndash August 31 2004mdashIrvingrsquos Put-in-Bay Deli 2110 Langram bull Sample 07 ndash September 1 2004mdashHeinemanrsquos Winery 978 Catawba bull Sample 08 ndash September 1 2004mdash1282 Catawba bull Sample 09 ndash September 1 2004mdash1210 Catawba bull Sample 10 ndash September 2 2004mdash1391 Put-in-Bay Road bull Sample 11 ndash September 2 2004mdash1030 Put-in-Bay Road
Ultrafiltration Sample Collection Field Notes South Bass Island Ohio August 30ndashSeptember 2 2004
Sample 01 ndash August 30 2004mdashVillage of Put-in-Bay Water Treatment Plant Centrally located on the eastern shore of South Bass Island the water treatment plant is designed for daily operation at 0216 million gallons per day (MGD) and a maximum production of 0288 (MGD) Water for the plant is drawn from Lake Erie The plant has five treatment chambers each with a maximum loading capacity of 50 gallons per minute (gpm) Treated water is chlorinated and pumped to a 200000 gallon elevated storage tank The water then flows into the distribution system serving the Village of Put-in-Bay on the north side of the island The distribution system connects to 104 commercial meters and 95 residential water meters
Sample 02 ndash August 30 2004mdashPerryrsquos Monument National Park Service Maintenance Building at 17 Park Avenue The National Park Service site is one of the most distant locations of the community water distribution system The sample was taken at the maintenance building breakroom sink Because the National Park Service site was connected to the Put-in-Bay Village water distribution system no property environment assessment was needed A free chlorine residual was measured at 041 parts per million (ppm)
Sample 03 ndash August 30 2004mdashSaunders Cottages North Well at 1495 Catawba The Saunders Cottages are small cottages located on the west side of the island near the shore line The north well supplies water to approximately six cottages in this area No septic tanks were used Wastewater is treated by a small aeration package plant located north of the cottages A chlorinator was installed on the north well but was turned off several hours before sampling The sample was collected from a tap upstream from the chlorinator The free chlorine residual was measured at 004 ppm
Sample 04 ndash August 31 2004mdashPerryrsquos Cave 979 Catawba Perryrsquos Cave is a tourist
36
attraction for an underground cavern It is located inland across the road from the Heineman Winery The property has a miniature golf course gift shop a gold panning sluice and a butterfly house The water supply for the business is obtained from underground creek in the cave located directly under the gift shop The property was equipped with a septic tank located northwest of the gift shop and cavern The water system was flushed for approximately 40 minutes before sampling Free chlorine testing of the water supply was frequently made while the system was being flushed The free chlorine residual was measured at 002 ppm The water was not chlorinated
Sample 05 ndash August 31 2004mdashJoersquos Bar and Grill (Press House) 1400 Catawba Joersquos Bar amp Grill is a restaurant and bar located at the corner of Catawba and Meechen Roads opposite a cemetery The property also had two dormitory type housing units The well was located at the southeast corner of the metal building located behind or south of the bar An old stone-lined septic leach tank was recently replaced with three 1500 gallon sewage holding tanks The septic leach tank that was removed measured 20 feet long 6 feet wide and 6 feet deep It was a stone-lined ldquotankrdquo with no lateral lines The owner was ordered to abandon this system and replace it with the storage tanks The well was run approximately 2 hours before sampling The well was equipped with a chlorinator but it was not working during our visit No chlorine residual was detected
Sample 06 ndash August 31 2004mdashIrvingrsquos Put-in-Bay Deli 2110 Langram The deli and convenience store was located on the south end of the island near the shore and next to the ferry dock An employee dormitory was located on the property but was supplied by another well The well for the deli was located on the northeast side of the property near the driveway to the ferry loading area The sewage was pumped from the property through a lift station to a small package treatment plant on the north side of Langram Road The well was run approximately 4 hours before sampling It had reportedly been chlorinated several days prior The chlorine residual was detected at 001 ppm
Sample 07 ndash September 1 2004mdashHeinemanrsquos Winery 978 Catawba The property is a local winery with a gift shop and restaurant and bar Located north of the winery was a single-story house The well casing was located in a pit under a metal plate of the sidewalk leading to the restaurant and bar Because the casing is located below the ground surface it is also prone to being flooded and had reportedly flooded as recently as August 16 2004 Two septic tanks served the house a 250-gallon tank and a 1000shygallon tank The septic tanks were located on the west side of the house and were being pumped during our visit of September 1 2004 The drainfield pipes had been capped August 19 2004 and tanks were being pumped on an as-needed basis Two 1000-gallon tanks serving the restaurant and bar located on the southwest side of the winery were also capped on August 17 2004 and are also pumped on an as-needed basis The well was equipped with a chlorinator and was turned off several hours before sampling Water was taken from a tap upstream from the chlorinator The well ran a minimum of 4 hours before sample collection No chlorine residual was detected
Sample 08 ndash September 1 2004mdash1282 Catawba The residence was a single-family home located adjacent north and west of a septage disposal site The residence well was
37
located at the southwest corner of the property and was located approximately 72 feet from the septic tank and 50 feet from the drainfield The well was not equipped with a chlorinator Water was run at three sinks in the home for 15 hours while water the sample was being taken No chlorine residual was detected
Sample 09 ndash September 1 2004mdash1210 Catawba The residence was a single-family home surrounded on all but the west side of the septage disposal site The well was located in the back yard approximately 54 ft from the septic tank Water was run for approximately 25 hours before sampling The free chlorine residual was detected at 002 ppm
Sample 10 ndash September 2 2004mdash1391 Put-in-Bay Road The residence was a single-family home with a museum located approximately 100 feet northwest of the home The museum belonged to the homeowner The property was located west of septage disposal site The well was located on the northwest side of the home A septic tank was located behind the home and a gray water disposal area was located between the home and the museum The well was not chlorinated and had not been disinfected recently Water was run for approximately 30 minutes before sampling Chlorine residual was detected at 002 ppm
Sample 11 ndash September 2 2004mdash1030 Put-in-Bay Road The residence was a single-family home located northeast of the septage disposal site The well was located next to the home on the south side The septic tank was located behind the home to the east The well was not chlorinated and according to the owners had not been disinfected this year Chlorine residual was detected at 001 ppm
Wastewater Sample ndash August 30 2004mdashVillage of Put-in-Bay Wastewater Treatment Plant A 250-mL sample of raw wastewater was collected from the wastewater treatment plant The bottle was capped and labeled as ldquowastewaterrdquo The 250shymL bottle was double-bagged and sealed with tape and immediately stored on ice The ice-packed wastewater sample was delivered to the Centers for Disease Control and Prevention (Atlanta Georgia) on August 31 2004 for testing
38
ATTACHMENT 4
Environmental Sampling Conducted in the Investigation of a Suspected Waterborne Outbreak
South Bass Island Ohio AugustndashSeptember 2004
Analytical Results from the Water and Environmental Projects Laboratories of the Division of Parasitic Diseases Centers for Disease Control and Prevention (CDC)
National Center for Infectious Diseases
Water and Wastewater Sampling Performed by CDC National Center for Environmental Health (NCEH) Field Team
Between August 30 and September 2 2004 a field team from CDCNCEH collected 1 wastewater sample and 11 water samples from South Bass Island Ohio The wastewater sample was an approximately 250-mL sample of raw sewage collected at the Put-in-Bay wastewater treatment facility This sample was collected to determine if wastewater generated and treated on the island would give an indication of what pathogens were circulating in the human population working residing on and visiting South Bass Island Of the 11 water samples collected 1 was from the raw water intake of the Put-in-Bay water treatment plant (Sample 1) 1 was the finished water from the water treatment plant (Sample 2) 5 were groundwater from transient noncommunity (TNC) public water supplies (Samples 3ndash7) and 4 were from private wells (Samples 8ndash11) Table 1 provides information on the sampling sites and conditions
All water samples were concentrated using an ultrafiltration technique developed at CDC Briefly 50 L of water was collected and concentrated in the field using an ultrafilter module having a molecular weight cut-off of ~20000 daltons a pore size small enough to enable the ultrafilter to effectively retain all solid particles (including microbes) in the water samples If a free chlorine residual was detected in water to be sampled sodium thiosulfate was added to deactivate the disinfecting properties of chlorine A negatively charged chemical sodium polyphosphate was used to pretreat all ultrafilters and was also added to each water sample This was done to reduce potential sticking of microbes to the surfaces of the ultrafilter system All samples were concentrated to 200ndash250 mL (termed ldquoretentaterdquo) All samples and ultrafilters were stored and shipped refrigerated to CDC for further processing and analysis
Water and Wastewater Analysis at CDC
At CDC the ultrafilters were backflushed with a surfactant solution to remove residual microbes from the filter surfaces This backflush water was added to the corresponding retentate and the combined sample centrifuged to concentrate bacteria and parasites in the samples The supernatant from the centrifugation process was treated using chemical precipitation to concentrate viral pathogens in the samples In general coliphages were assayed directly from retentate not from the precipitation-concentrated samples
39
The ldquobacteria and parasite pelletsrdquo were resuspended and aliquoted for analysis by several different labs at CDC bull the Campylobacter reference laboratory (Collette C Fitzgerald) bull the water and environmental projects laboratory (Vincent Hill) bull the waterborne parasite laboratory (Michael J Arrowood) and bull the parasite genotyping laboratory (Lihua X Xiao)
This report presents the results of the water and environmental projects and waterborne parasite laboratories The parasite genotype analyses are not yet completed The results of the Campylobacter reference laboratory are summarized in a separate report
In addition to analyzing the samples for pathogenic microbes CDC also analyzed samples for microbial indicators of fecal contamination The microbial indicators studied are enteric microbes that do not tend to multiply in the environment Thus their presence in environmental samples can be considered an indication that the sampled water have been contaminated to some degree by fecal matter (which could either be from humans or animals) Fecal coliforms and Escherichia coli are well-established bacterial indicators of fecal contamination Clostridium perfringens are spore-forming bacteria that are highly persistent under environmental conditions (especially versus viruses and non-sporeshyforming bacteria) The presence of C perfringens is a conservative indicator of fecal contamination as the presence of the spores can reflect historical fecal contamination (months to many years) Somatic and F-specific coliphages are viruses that infect coliform bacteria Thus they are normal gastrointestinal microfloras that are fairly specific indicators of fecal contamination Research has suggested that coliphages are superior to coliform bacteria as indicators for the presence of viral pathogens
Summary of Results
The wastewater analyses indicate that the wastewater sampled contained concentrations of microbial indicators that are typical of untreated private wastewater (Table 2) All positive microbial detections for this sample and the water samples are highlighted in Table 2 by shaded cells Cryptosporidium spp and adenoviruses were also detected in the wastewater sample using real-time (TaqMan) polymerase chain reaction (PCR) The aliquot of the wastewater sample assayed by immunomagnetic separation (IMS) and an immunofluorescent antibody (IFA) kit (a standard microscopy technique for these parasites) was found to be positive for Giardia spp Fluorescent structures that were considered to possibly be Cryptosporidium were also observed in the wastewater sample but these particles did not have the typical size expected for Cryptosporidium and thus are not reported here as being positively identified as Cryptosporidium Additional analysis of the wastewater sample by IMS-IFA microscopy and nested PCR genotyping report negative results for Cryptosporidium and positive results for Giardia
We found water collected at the raw water intake at the Put-in-Bay water treatment facility to be positive for four microbial indicators as well as for Cryptosporidium spp (by both PCR and microscopy) In the finished water collected from the Put-in-Bay
40
distribution system we did detect the DNA of Cryptosporidium It is not known whether this detection reflects the presence of viable or infectious Cryptosporidium PCR results are a very conservative indicator of fecal contamination and health risks as the PCR test can detect DNA that is not associated with viable or infectious pathogens However this data can be considered as warranting additional investigation of the effectiveness of equipment and procedures used at the Put-in-Bay water treatment facility
Of the five TNC wells sampled three were found to contain fecal coliforms and E coli Two of these wells (Samples 5 and 7) contained relatively high concentrations of E coli In addition three of the five wells contained either somatic coliphages or F-specific coliphages One of the wells contained C perfringens Only one of the wells (Sample 3) did not contain a culturable microbial indicator of fecal contamination However Sample 3 as well as three other samples was found to be positive for Salmonella by PCR (using two different PCR assays) We were not able to culture Salmonella from any of these samples This is not necessarily surprising as the PCR technique can detect nonviable and viable-but-not-culturable (VBNC) microbes In addition to Salmonella three other pathogens were detected in the TNC wells using PCR Cryptosporidium (in three of five wells) adenovirus (in one of five wells) and enterovirus (in one of five wells) While the IMSIFA analyses for Cryptosporidium are negative the analyses did detect a single Giardia cyst in Sample 5 This is a significant finding as the presence of this parasite (which is fairly large with a diameter of 12 microm) indicates that enteric parasites as well as smaller pathogens (ie bacteria and viruses) can enter and be transported through the subsurface aquifer at South Bass Island Additional analysis of these samples included genotyping by nested PCR Cryptosporidium hominis was detected in Sample 5 by Nested PCR Genotyping
Samples from the four private wells (Samples 8ndash11) were received at CDC on September 3 2004 and stored in a refrigerator until September 7 before further processing and analysis While significant microbial die-off likely occurred during this extending holding period two of the four samples were still found to be positive for E coli Beyond fecal coliforms and E coli none of the private well samples were found to be positive for any other microbial analyte All Salmonella cultures for the private samples are negative
41
Table 1 NCEH Field Team Water Sample Collection Log South Bass Island Ohio Investigation
Sample Collection Dates August 30 to September 2 2004
Sample Number
Location Chlorine Residual
Date Collected Date Sent to CDC
Date Received
1 Raw Water Community Water Treatment Facility
None Detected (ND)
Mon-30 Aug 31 Aug 31Aug
Notes Community Water System 2 Finished Water
Community Water Distribution System
041 ppm Mon-30 Aug 31 Aug 31 Aug
Notes Perryrsquos Monument National Park Service Maintenance Building 17 Park Ave 3 Saunders Cottages
North Well 004 ppm Mon-30 Aug 31 Aug 31 Aug
Notes Transient Noncommunity Water Supply System 4 Perryrsquos Cave 002 ppm Tue-31 Aug 31 Aug 1 Sept
Notes Transient Noncommunity Water Supply System 5 Joersquos Bar ND Tue-31 Aug 31Aug 1 Sept
Notes Transient Noncommunity Water Supply System 6 Irvingrsquos Put-in-Bay
Deli 001 ppm Tue-31 Aug 1 Sept 2 Sept
Notes Transient Noncommunity Water Supply System 7 Heineman Winery ND Tue-31 Aug 1 Sept 2 Sept
Notes Transient Noncommunity Water Supply System 8 1282 Catawba
Residence ND Wed-1 Sept 2 Sept 3 Sept
Notes Private Goundwater Well 9 1210 Catawba
Residence 002 ppm Wed-1 Sept 2 Sept 3 Sept
Notes Private Goundwater Well 10 1391 Put-in-
Bay Residence 002 ppm Thurs-2 Sept 2 Sept 3 Sept
Notes Private Goundwater Well 11 1030 Puti-in-
Bay Residence 001 ppm Thurs-2 Sept 2 Sept 3 Sept
Notes Private Goundwater Well
42
Table 2 Water and Wastewater Analytical Results from CDCNCIDDPD Water and Environmental Projects Laboratories
Sample ID Fecal
Coliforms E coli Somatic
Colipahges F-specific
Coliphages C perfringens Salmonella
PCR Salmonella
Culture
Wastewater 45000 cfumL ND ND 680000 pfumL 130 cfumL Negative lt 002 MPNmL
Sample 1 3 cfuL 2 cfuL 02 pfuL lt 01 pfumL 10 cfuL Negative lt 01 MPNL
Sample 2 lt 04 cfuL lt 04 cfuL lt 01 pfuL lt 01 pfumL lt 08 cfuL Negative lt 01 MPNL
Sample 3 lt 04 cfuL lt 04 cfuL lt 01 pfuL lt 01 pfumL lt 08 cfuL Positive lt 01 MPNL
Sample 4 lt 08 cfuL lt 08 cfuL 7 pfuL lt 09 pfumL lt 08 cfuL Positive lt 01 MPNL
Sample 5 714 cfuL 420 cfuL 92 pfuL lt 09 pfumL 11 cfuL Negative lt 01 MPNL
Sample 6 21 cfuL 20 cfuL lt 1 pfuL lt 09 pfumL lt 08 cfuL Positive lt 01 MPNL
Sample 7 135 cfuL 118 cfuL 3 pfuL 8 pfumL lt 08 cfuL Positive lt 01 MPNL
Sample 8 1 cfuL (a) 1 cfuL (a) ND ND lt 08 cfuL Negative lt 01 MPNL
Sample 9 2 cfuL (a) 1 cfuL (a) ND ND lt 08 cfuL Negative lt 01 MPNL
Sample 10 lt 06 cfuL (a) lt 06 cfuL (a) ND ND lt 08 cfuL Negative lt 01 MPNL
Sample 11 lt 06 cfuL (a) lt 06 cfuL (a) ND ND lt 08 cfuL Negative lt 01 MPNL
Notes
(a) Estimated concentration Samples were held 5 days until culture analysis ldquoltrdquo = microbe was not detected in sample at detection limit noted cfu = colony forming units pfu = plaque forming units MPN = most probable number (5-tube) ND = not done
43
Table 2 CDCCCIDDPD Analytical Results (Cont)
Sample ID Cryptosporidium
PCR Cryptosporidium
IMS-IFA Giardia
IMS-IFA GI
Norovirus GII
Norovirus Adenovirus
PCR Enterovirus
PCR
Wastewater Positive ldquoNegativerdquo (b) 151 cysts100 mL Negative Negative Positive Negative
Sample 1 Positive 15 oocsysts10 L lt 15 cysts10 L Negative Negative Negative Negative
Sample 2 Positive lt 15 oocysts10L lt 15 cysts10 L Negative Negative Negative Negative
Sample 3 Positive lt 15 oocysts10L lt 15 cysts10 L Negative Negative Negative Negative
Sample 4 Negative lt 2 oocysts10L lt 2 cysts10 L Negative Negative Negative Negative
Sample 5 Negative lt 2 oocysts10L 18 cysts10 L Negative Negative Positive Positive
Sample 6 Positive lt 15 oocysts10L lt 15 cysts10 L Negative Negative Negative Negative
Sample 7 Positive lt 15 oocysts10L lt 15 cysts10 L Negative Negative Negative Negative
Sample 8 Negative lt 15 oocysts10L lt 15 cysts10 L Negative Negative Negative Negative
Sample 9 Negative lt 15 oocysts10L lt 15 cysts10 L Negative Negative Negative Negative
Sample 10 Negative lt 15 oocysts10L lt 15 cysts10 L Negative Negative Negative Negative
Sample 11 Negative lt 15 oocysts10L lt 15 cysts10 L Negative Negative Negative Negative
(b) Approxmately 10 ldquocrypto-like structures were observed in a volume equal to 14 of the sample While these structures fluoresced brightly and were close to the expected appearance they were slightly too large (6 to 65 microm rather than the typical 45 to 5 microm oocysts of C parvum and C hominis) These structures may have been artifacts or possibly C andersonii (or equivalent) The assay was not sufficiently clear to confidently identify these structures as being Cryptosporidium spp
44
Cryptosporidium and Giardia analysis results South Bass Island Ohio
Sample LocationID Real-time PCR dagger IMS-IFA Microscopy Genotyping Nested PCRDagger
Wastewater Cryptosporidium PCR Positive
Cryptosporidium Negative
Giardia Positive (151cysts100mL)
Cryptosporidium Negative
Giardia Positive
Sample 1 Raw Water CWS Cryptosporidium PCR Positive
Cryptosporidium IMSshyIFA
15 oocsysts10 L Giardia Negative
Cryptosporidium Negative Giardia Negative
Sample 2 Finished Water PWS Cryptosporidium PCR Positive
Cryptosporidium Negative
Giardia Negative
Cryptosporidium Negative
Giardia Negative
Sample 3 Saunders Cottages North Well
Cryptosporidium PCR Positive
Cryptosporidium Negative
Giardia Negative
Cryptosporidium Negative
Giardia Negative
Sample 4 Perryrsquos Cave Cryptosporidium Negative
Cryptosporidium Negative
Giardia Negative
Cryptosporidium Negative
Giardia Negative
Sample 5 Joes Bar Cryptosporidium Negative
Cryptosporidium Negative
Giardia Positive (18cysts10 L)
Cryptosporidium hominis Positive
Giardia Negative
Sample 6 Irivings Put-In-Bay Deli Cryptosporidium PCR Positive
Cryptosporidium Negative
Giardia Negative
Cryptosporidium Negative
Giardia Negative
Sample 7 Heineman Winery Cryptosporidium PCR Positive
Cryptosporidium Negative
Giardia Negative
Cryptosporidium Negative
Giardia Negative
Sample 8 1282 Catawba Cryptosporidium Negative
Cryptosporidium Negative
Giardia Negative
Cryptosporidium Negative
Giardia Negative
Sample 9 1210 Catawba Cryptosporidium Negative
Cryptosporidium Negative
Giardia Negative
Cryptosporidium Negative
Giardia Negative
Sample 10 1391 Put-in-Bay Cryptosporidium Negative
Cryptosporidium Negative
Giardia Negative
Cryptosporidium Negative
Giardia Negative
Sample 11 1030 Put-in-Bay Cryptosporidium Negative
Cryptosporidium Negative
Giardia Negative
Cryptosporidium Negative
Giardia Negative Reporting sources Centers for Disease Control National Center for Infectious Diseases Parasitic Diseases Laboratory Atlanta GA water and environmental projects laboratory (Vincent Hill) daggerwaterborne parasite laboratory (Michael J Arrowood) and Daggerparasite genotyping laboratory (Lihua X Xiao)
45
Campylobacter results on samples collected by NCEH on South Bass Island August 30ndashSeptember 2 2004
We received 12 samples from Vincent Hillrsquos laboratory at CDC The sample numbers 1ndash11 correspond to the sample numbers used in the attachment sent by John Sarisky on 92704 entitled ldquoReleased NCID NCEH Environmental Lab Results 092404rdquo The remaining sample was a wastewater sample The results are summarized in the table below
Only one sample ldquo5rdquo was culture positive for a campylobacter-like organism This has now been confirmed biochemically and by 16S sequencing as an Arcobacter butzleri strain No sample was culture positive for Campylobacter sp
Sample Number Culture Lightcycler PCR Genus C jejuni Seminested PCR
1 NBG Neg Neg 2 NBG Neg Neg 3 NBG Neg Neg 4 NBG Neg Neg 5 Arcobacter butzleri ++ + 6 NBG Neg Neg 7 NBG Neg + 8 NBG Neg Neg 9 NBG Neg Neg
10 NBG Neg Neg 11 NBG Neg Neg
wastewater sample NBG Neg Neg NBG ndash no bacterial growth Neg ndash negative + - positive The PCR procedure described by Waage et al 1999 was followed (Waage AS Vardund T Lund V Kapperud G 1999) Detection of small numbers of Campylobacter jejuni and Campylobacter coli cells in environmental water sewage and food samples by a semi-nested PCR assay Appl Environ Microbiol 651636-43 1999 This assay is specific for C jejuni and C coli and is based on the intergenic region between two flagelling genes (flaA and flaB)
46
From Xiao Lihua X Sent Friday November 05 2004 323 PM To Hill Vincent Sarisky John Cc Beach Michael J Subject Results for Put-in-Bay Investigation-- John and Vince
Below are Crypto and Giardia genotyping results for water samples from the South Bass outbreak We also analyzed the samples for microsporidia (Enterocytozoon bieneusi) Quite a few of the samples produced bands of the expected size several (2 for each sample) of which were sequenced However we were unable to read out the sequences due to underlying signals (a sign for mixed genotypes) in the electropherogram
I apologize for taking so long to get the results back to you but I am short handed and there were five outbreaks under investigation It took us quite some efforts to genotype and subtypethe Giardia in the wastewater samples as we had to cut the PCR products out of gel several times for sequencing because of the presence of other bands
Lihua
South Bass Ohio (Put-in-Bay) Drinking Water Cryptosporidium Outbreak Sept04 Crypto Giardia
9158 Put-in-Bay Water Outbreak Ohio Sample No 1-Surface water Neg Negative 9159 Put-in-Bay Water Outbreak Ohio Sample No 2 -Treated water Neg Negative 9160 Put-in-Bay Water Outbreak Ohio Sample No 3- Saunders North Well Neg Negative 9161 Put-in-Bay Water Outbreak Ohio Sample No 4 water Neg Negative 9162 Put-in-Bay Water Outbreak Ohio Sample No 5 water C hominis Negative 9163 Put-in-Bay Water Outbreak Ohio wastewater Neg Assemblage A WA1 subtype 9164 Put-in-Bay Water Outbreak Ohio Sample No 6 water Neg Negative 9165 Put-in-Bay Water Outbreak Ohio Sample No7 water Neg Negative 9166 Put-in-Bay Water Outbreak Ohio Sample No8 water Neg Negative 9167 Put-in-Bay Water Outbreak Ohio Sample No9 water Neg Negative 9168 Put-in-Bay Water Outbreak Ohio Sample No10 water Neg Negative 9169 Put-in-Bay Water Outbreak Ohio Sample No11 water Neg Negative
47
_________ _____________________________________________
ATTACHMENT 5
Bass Island Sample Form
Sample ______ Date _______2004 Chlorinated YES No
Location (Include diagram on back show location of well septic tank drainfield house and other features)_______________________________________________________________________________
Weather Conditions _______________________________________________________
Free Chlorine Test ____PPM Nitrate Test _____PPM
Home Water Pumping Started________AM PM
Filter Apparatus Setup Start ________ AM PM Filter Apparatus Setup Complete ________ AM PM
10 ml Sodium Thiosulfate 20 L Water YES No NA 2 Tubes (15ml) Sodium Polyphosphate 20 L Water YES No Sample Start Time ______ AM PM Permeate Rate _____ mlmin
10 ml Sodium Thiosulfate 20 L Water YES No NA 2 Tubes (15ml) Sodium Polyphosphate 20 L Water YES No Sample Start Time ______ AM PM Permeate Rate _____ mlmin
5 ml Sodium Thiosulfate 10 L Water YES No NA 1 Tubes (15ml) Sodium Polyphosphate 10 L Water YES No Sample Start Time ______ AM PM Permeate Rate _____ mlmin
Ultrafilter in Ziplock Bag at ______ AM PM (on ice) (color connectorsadapters included)
250 ml polycarbonate bottle capped with retenate at ______ AM PM (on ice) (labeled the same as Ultrafilter)
Filter Apparatus Takedown Start ________ AM PM Filter Apparatus Takedown Complete ________ AM PM
Iced down and shipped overnight to CDC co Vince Hill 4770 Buford Highway MS F-36 Building 109 Room 1318 Atlanta GA 30341
48
ATTACHMENT 6 Well Log and Drilling Report ndash Historical Review 1951ndash2004
South Bass Island Ohio
Drilling Company
Total Wells Wells with CrevicesCave
s
Wells with CrevicesCave s below Well
Casing
Percent of Wells with
Crevices below Casing
Tibboles Well Drilling (1975ndash1997)
214 6 6 100
Edgil Collins Well Drilling (1988ndash1995)
80 0 0 0
Island Well Drilling (1961ndash1971)
82 36 20 56
Oddo amp Kimmet Well Drilling (1996ndash2003)
48 0 0 0
Water Well Drilling amp Supply (1956ndash1960)
32 1 1 100
NO Manahan (1948ndash1953)
15 0 0 0
Robertsonrsquos (1973ndash1997)
17 0 0 0
Clear Water Well Drilling (1995) 4 0 0 0 Dunbar Drilling (1970ndash1978) 4 0 0 0
Aicirtap Enterprises Inchellip (1979) 3 0 0 0
LG Argutte (1964ndash1969) 4 2 2 100
TOTAL 503 45 29 64
Source South Bass Island well drilling logs Ohio Department of Natural Resources
49
ATTACHMENT 7
Movement of Water in Karst Geology
50
ATTACHMENT 8
Ottawa County SSURGO Digital Soil Survey Limitations for Septic Absorption Fields
South Bass Island Ohio 1985
Source Ottawa SSURGO Digital Soil Survey Division of Soil and Water Conservation Ohio Department of Natural Resources Columbus Ohio January 2000
51
ATTACHMENT 9
Soil Limitations for Wastewater Disposal
All five soil types identified on South Bass Island have limitations for septic tank systems rated as ldquosevererdquo in the Soil Survey The following is a list of each soil series located on South Bass Island along with its primary limitations
Castalia ndash This is the predominant soil on South Bass Island The primary limitations are depth to bedrock and many large stones ranging in size from 10 inches to 4 feet across Unweathered bedrock (dolomitic limestone) is found at depths from 20 to 40 inches Vertical fractures in bedrock are 3 to 6 feet apart
Dunbridge ndash The primary limitation is depth to bedrock Unweathered bedrock is found at depths from 20 to 40 inches in this soil series Vertical fractures in bedrock are 2 to 4 feet apart
Milton ndash Major limitations include depth to bedrock and slow permeability Depth to bedrock ranges from 20 to 40 inches
Nappanee ndash The primary limitations are slow permeability and soil wetness The perched seasonal high water table is between depths of 1 to 2 feet in fall winter spring and extended wet periods
Rawson ndash Major limitations are soil permeability and wetness It is also noted that some Rawson soils may have bedrock as shallow as 20 to 40 inches The perched seasonally high water table is at depths between 30 and 48 inches in winter and spring and other extended wet periods Soil permeability is rated as slow to very slow in the lower profile of the soil
Disturbed areas ndash Areas where soils were not classified include the area around the Perry Monument which is owned by the National Park Service and two small areas identified as ldquopitsrdquo where limestone bedrock has been removed for use in construction
For soils identified with an asterisk () the soil survey notes that effluent from sanitary facilities used in these soils may move through fissures in the bedrock and pollute groundwater supplies
52
ATTACHMENT 10
ODHNCEH Groundwater Quality Assessment Procedure
The South Bass Island groundwater assessment included only private residential wells and consisted of a sanitary survey and the collection of a groundwater sample The island was divided by topographical features into 22 sections To obtain a statistically valid number of samples in each of the 22 sections an Ohio Department of Health (ODH) surveyor selected four housing units representing a geographic distribution within the section If a household resident of a selected unit agreed to participate in the assessment the surveyor collected a water sample and conducted a sanitary survey of the groundwater supply system Ohio Department of Health surveyors were to visit homes in each of their assigned sections until they enrolled four locations Collected water samples were stored in insulated containers and returned to the Ottawa County Health Department by 500 PM of each of the three sample collection days Samples were shipped to a certified water quality laboratory for analysis (Benchmark Laboratory and the Ohio Department of Agriculture Laboratory) Samples were analyzed for total coliforms E coli Campylobacter Salmonella chloride and nitrate Sample collection and sanitary survey information was collected reviewed clarified and corrected when needed and recorded on the master tracking log
To facilitate mapping of sampled wells longitude and latitude coordinates were recorded in the field The sample collection tracking log and sanitary survey codebook were developed for this activity A Web-based data entry system and a GIS mapping tool were developed by the ODH and the Centers for Disease Control and Preventionrsquo s National Center for Environmental Health (NCEH) to assist with analysis of collected data The NCEH Health Informatics Office developed an additional GIS analysis tool to support data analysis
The ODHNCEH groundwater quality assessment collected groundwater samples from 11 (77679) of the housing units served by a groundwater well on South Bass Island The protocol called for a sample size of 88 private groundwater wells (4 wells for each of the 22 sections) however resource and time limitations restricted the number of households visited to 77 Seventy-seven is a valid sample size for this descriptive study
Data from the sanitary survey and well-logs were entered into a Microsoft Access database Statistical analysis was performed using SAS version 802 and EPI Info version 322 Geographic information system analysis was performed using Spatial Epidemiology and Emergency Management System (SEEM) version 11 Following is the sanitary survey data collection form water sample collection tracking log and the sanitary survey codebook
53
___________________________________________________________________________________
___________________________________________________________________________________
______________________________________________________________________________________ ______________________________________________________________________________________ _______________________________________________________________________________
ATTACHMENT 10 Form 1
ODHNCEH Groundwater Quality Assessment Sanitary Survey Form
South Bass Island Ohio September 2004
South Bass Island - Sanitary Survey
Owner Name________________________________________________________________ Address (street number name)________________________________________________ GPS Coordinates (NAD 83) _________________________________________________ Sample collected_
Water Well Information Well Currently Used for Drinking Water______
Well Casing (circle one) - Steel PVC Well casing (circle) - Above grade In Pit
Well casing height above grade__________ Well Log Number_____________________
Condition of casing (circle) Good Fair Deteriorated Holescracks in casing
Well Cap(circle) - Aluminum 2 Part gasketed Sanitary Seal Condition of cap_____________________________________________________________
Type of pump (circle) Jet Deep(2 lines) Jet Shallow Submersible Hand pump
Pitless Adapter______ Well Pit ______(wet or dry) Well House_____________________
Conditions around well (subsidence slope rock at surface)____________________________________
Comments__________________________________________________________________________
HSTS Information
TankRisers visible______ Distribution Boxes____ ATU visible______ Discharge ______
Location of Discharge_______________Lake discharge______ Discharge - clear cloudy odor (circle)
Elevated leach field or mound______ Chlorinator present and filled_______ Aeration sytem ndash motor present______
Comments on system conditions (surfacing sewage wet areas green stripes etc
54
Water Treatment Information
System type (circle one) ndash Softener Oxidizing Unit(chlorineiodine) Continuous chlorination Ultraviolet Carbon Filter Sediment Filter
Other________________________________________________________________
Sampling port or bypass present_____________________________________________
Survey completed by_________________________________________________________ Date_________________________________________
LAB
55
Attachment 10 Form 2
Water Sample Collection Log Bass Island Ohio
Lab
DATE COLLECTED
TIME NAME ADDRESS WELL LOG CLOOECTED BY SECTION
56
ATTACHMENT 10 Table 1
ODHNCEH Groundwater Quality Assessment Codebook South Bass Island Ohio September 2004
Variable Name Variable Type Variable size Variable Description Values or Explanation Data Source Well_log Number 6 Well log number uniquely
describes well Plunketmdb
Sanitary survey Last_name Character 20 Last name of well owner Sanitary survey
Tracking database
First_name Character 20 First name of well owner Sanitary survey Tracking database
Street_name Character 25 Street name where well is located
Plunketmdb Sanitary survey
Street_number Character 5 Street number where well is located
Plunketmdb Sanitary survey
Well_depth Number 4 Depth of the well in feet Plunketmdb Sanitary survey
Latitude Number 9 Latitude of well position Plunketmdb Sanitary survey
Longitude Number 9 Longitude of well position Plunketmdb Sanitary survey
Sample_date Date 10 Date sample was taken Santary survey Laboratory
results
Sample_number Character Number assigned to lab results for sample
Laboratory results
57
Quadrant Character 22 Quadrant where sample was drawn
1-22 quadrants Sanitary survey Tracking database
Collector Character 20 Name of Surveyor Sanitary survey Tracking database
Lab Character 30 Name of Laboratory performing analysis
Ohio Department of Agriculture BenchMark
Tracking database
TC Number Laboratory results for Total Coliforms
Laboratory results
EC Number Laboratory results for E coli Laboratory results
Campy Number Laboratory results for Camybolacter
Laboratory results
Salmon Number Laboratory results for Salmonella
Laboratory results
Nitrate Number Laboratory results for Nitrates Laboratory results
Chloride Number Laboratory results for Chlorides
Laboratory results
Casing_mat Character 8 Material used for well-casing Steel PVC Brick Concrete
Sanitary survey
Casing_location Character 16 Location of well-casing Above grade In pit Buried Cannot
determine
Sanitary survey
Casing_height Number 2 Height of well-casing above grade in inches
Sanitary survey
Casing_cond YES-no Does the well-casing havecracks holes or gaps
Sanitary survey
Case_diam Number 4 Diameter of well casing in inches
Well logs
58
Case_length Number 5 Length of the well casing in feet
Well logs
Cap YES-no Is the well top covered YESno Sanitary survey Cap_seal YES-no Well top provides a sanitary
seal YESno Sanitary survey
Pitless YES-no Presence of pitless adapter YESno Sanitary survey Wellhouse YES-no Well head in protected
wellhouse YESno Sanitary survey
Wellhead YES-no Well head located in pit YESno Sanitary survey wellhead_dry YES-no Well head in pit is dry YESno Sanitary survey Date_comp Date 10 Date well constuction
completed Well logs
Drawdown Number 3 Number of feet that water can be drawn down in a well
Well logs
Static_level Number 3 Depth to water level in feet Well logs Well_pres YES-no Presence of a properly sealed
water well (10ft) YESno Sanitary survey
Slines_pres YES-no Presence of sewer lines (10ft) YESno Sanitary survey
Sewage_pres YES-no Presence of sewage disposal systems (50ft)
YESno Sanitary survey
Water_pres YES-no Presence streams lakes ponds and ditches near well
source (25ft)
YESno Sanitary survey
Manure_pres YES-no Presence of manure ponds piles or lagoons near well
source (50-300ft)
YESno Sanitary survey
Landfill_pres YES-no Land fills or dump sites present near well source
(1000ft)
YESno Sanitary survey
59
Watercoll YES-no Surface water collects around well-casing
YESno Sanitary survey
Cont_pres YES-no Other sources of contamnation present near
well source
YESno Sanitary survey
Cont_other Text 250 Explanation of other type of contamination source
Sanitary survey
Sewage_home YES-no Home sewage tretment system is designed to
discharge effluent to surface
YESno Santary survey
Discharge Character 15 Surface discharge location Drainage ditch Storm drain Lake Pond
Stream
Sanitary survey
Disch_qual Character 10 Quality of effluent Clear Cloudy Odor Sanitary survey Chlorination YES-no Chlorinated effluent YESno Sanitary survey
Oper_chl YES-no chlorination system operates as designed
YESno Sanitary survey
Aeration YES-no Presence of aeration system YESno Sanitary survey Oper_aer YES-no Aeration system functions as
designed YESno Sanitary survey
Treat_type Character 30 Type of water treatment system used
Softener Oxidizing unit(iodinechlorine)
Carbon Filter Sediment Filter Ultraviolet
Continuous chlorination
Sanitary survey
Port YES-no Presence of sampling port or bypass
YESno Sanitary survey
60
ATTACHMENT 11 Table 1
E coli Analysis Results Groundwater Samples Collected on South Bass Island Ohio
September 2004
E COLI POSITIVE RESULTS n = 77
69 E COLI NEGATIVE
31 E COLI POSITIVE
69 E COLI NEGATIVE
31 E COLI POSITIVE
Source Ohio Department of Health (ODH) and Centers for Disease Control and Prevention National Center for Environmental Health (NCEH) groundwater quality assessment South Bass Island Ohio September 8ndash10 2004
61
ATTACHMENT 11 Table 2
E coli Analysis Results by Laboratory Groundwater Samples Collected on South Bass Island Ohio
September 2004
Lab amp Sample Set Date Collected Total Samples Number E coli
Positive Percent Positive
Benchmark 1 Wednesday 090804 16 5 294
ODA 2 Wednesday 090804 6 1 167
Benchmark 3 Thursday 090904 15 6 400
ODA 4 Thursday 090904 12 4 308
Benchmark 5 Friday 091004 20 3 150
ODA 6 Friday 091004 8 5 625
Total 77 24 312
Source Ohio Department of Health (ODH) and Centers for Disease Control and Prevention National Center for Environmental Health (NCEH) groundwater quality assessment South Bass Island Ohio September 8ndash10 2004
62
ATTACHMENT 11 Table 3
Location of E coli Positive Sample Results Groundwater Samples Collected on South Bass Island Ohio
September 2004
Source Ohio Department of Health (ODH) and Centers for Disease Control and Prevention National Center for Environmental Health (NCEH) groundwater quality assessment South Bass Island Ohio September 8ndash10 2004
63
ATTACHMENT 12 Table 1
Total Coliform Analysis Results Groundwater Samples Collected on South Bass Island Ohio
September 2004
TOTAL COLIFORM POSITIVE RESULTS n = 77
22 Total coliform negative
78 Total coliform positive
22 Total coliform negative
78 Total coliform positive
Source Ohio Department of Health (ODH) and Centers for Disease Control and Prevention National Center for Environmental Health (NCEH) groundwater quality assessment South Bass Island Ohio September 8ndash10 2004
64
Total
ATTACHMENT 12 Table 2
Total Coliform Analysis Results by Laboratory Groundwater Samples Collected on South Bass Island Ohio
September 2004
Lab amp Sample Set Date Collected Total Samples Total Coliform Positive Percent Positive
Benchmark 1 Wednesday 090804 16 14 875
ODA 2 Wednesday 090804 06 03 500
Benchmark 3 Thursday 090904 15 12 800
ODA 4 Thursday 090904 12 09 750
Benchmark 5 Friday 091004 20 16 800
ODA 6 Friday 091004 08 06 750
77 60 779
Source Ohio Department of Health (ODH) and Centers for Disease Control and Prevention National Center for Environmental Health (NCEH) groundwater quality assessment South Bass Island Ohio September 8ndash10 2004
65
ATTACHMENT 12 Figure 1
Location of Total Coliform Positive Samples Groundwater Samples Collected on South Bass Island Ohio
September 2004
Source Ohio Department of Health (ODH) and Centers for Disease Control and Prevention National Center for Environmental Health (NCEH) groundwater quality assessment South Bass Island Ohio September 8ndash10 2004
66
ATTACHMENT 13 Figure 1
E coli Positive Results by Well Depth Groundwater Samples Collected on South Bass Island Ohio
September 2004
0 ft
52 ft
d
162 ft
Source Ohio Department of Health (ODH) and Centers fNational Center for Environmental Health (NCEH) grouIsland Ohio September 8ndash10 2004
67
Well Hea
Wells 0 to 52 Feet Deep 64 E coli Positive
N = 22
Wells greater than 52 Feet Deep 19 E coli Positive
N = 54
Ground Surface
or Disease Control and Prevention ndwater quality assessment South Bass
ATTACHMENT 13 Figure 2
E coli Results Well Depths Less Than 52 Feet Groundwater Samples Collected
September 8ndash10 2004 South Bass Island Ohio
Source Ohio Department of Health (ODH) and Centers for Disease Control and Prevention National Center for Environmental Health (NCEH) groundwater quality assessment South Bass Island Ohio September 8ndash10 2004
68
ATTACHMENT 13 Figure 3
E coli Results Well Depths Greater Than or Equal to 52 Feet Groundwater Samples Collected
September 8ndash10 2004 South Bass Island Ohio
Source Ohio Department of Health (ODH) and Centers for Disease Control and Prevention National Center for Environmental Health (NCEH) groundwater quality assessment South Bass Island Ohio September 8ndash10 2004
69
ATTACHMENT 13 Figure 4
E coli Positive Results by Well Depths Groundwater Samples Collected
September 8-10 2004 South Bass Island Ohio
Source Ohio Department of Health (ODH) and Centers for Disease Control and Prevention National Center for Environmental Health (NCEH) groundwater quality assessment South Bass Island Ohio September 8ndash10 2004
70
ATTACHMENT 14
E coli Positive Results by Section Location Groundwater Samples Collected on South Bass Island Ohio
September 2004
Location Total Samples
Number E coli Positive
Percent Positive
Shoreline 55 17 309
Interior 22 7 318
Source Ohio Department of Health (ODH) and Centers for Disease Control and Prevention National Center for Environmental Health (NCEH) groundwater quality assessment South Bass Island Ohio September 8ndash10 2004
71
ATTACHMENT 15 Table 1
Water Quality Analysis Results Private Groundwater Wells Sampled by Ottawa County Health Department
South Bass Island Ohio AugustndashSeptember 2004
Date Collected
Number Collected
Number amp Total Coliform Positive
Number amp Ecoli Positive
AUG 23 9 5 (56 ) 2 (22) AUG 25 8 4 (50 ) 1 (13) AUG 30 23 12 (52 ) 8 (35) SEPT 01 6 3 (50 ) 2 (33) SEPT 08 18 3 (17) 6 (40)
Total ( Pos) 64 27 (42) 19 (30)
Source Ottawa County Health Department Port Clinton Ohio September 10 2004
72
ATTACHMENT 15 Table 2
Water Quality Analysis Results Total Coliform and E coli Positive Private Groundwater Well Samples
South Bass Island Ohio 2001ndashAugust 2004
Year Number of
Samples Collected
Number Total
Coliform Positive
Percent Total
Coliform Positive
Number E coli
Positive
Percent Ecoli
Positive
2001 29 18 62 2 7 2002 23 9 39 2 9 2003 28 14 50 3 11
Jan ndash July 2004 13 10 77 2 15
Aug 2004 54 36 67 14 26 Total 147 87 59 23 16
Source Ottawa County Health Department Port Clinton Ohio September 10 2004
ATTACHMENT 15 Table 3
Groundwater Quality Analysis Results All Water Samples Collected Total Coliform and E coli Results by Agency
South Bass Island Ohio AugustndashSeptember 2004
Agency Total Coliforms E coli No
Analyzed No
Positive Percent
+ No
Analyzed No
Positive Percent
+ OEPA 87 38 44 48 17 35 MSU 8 4 50 8 2 25 ODA 10 3 33 10 2 20 CDC 0 mdash mdash 7 4 57 ODH 6 4 666 4 2 50 Total 111 49 44 77 27 35
Source Ottawa County GI IllnessmdashSummer 2004 Sample Results Log Oct 14 2004 Ohio Environmental Protection Agency (OEPA) Columbus Ohio MSU = Michigan State University ODA = Ohio Department of Agriculture CDC = Centers for Disease Control and Prevention ODH = Ohio Department of Health
73
ATTACHMENT 16
South Bass Island and North Central Ohio Precipitation (in inches)
North Central Region North Central Region South Bass Island Month 2004 1951ndash2000 1977ndash1997
January 225 221 163 February 063 191 145
March 362 266 228 April 236 337 298 May 809 351 333
June 496 373 349 July 406 372 301
August 376 336 343 September 245 299 303
October 233 226 248 November 359 283 253 December 335 254 213
Total 4145 3509 3177
Sources Monthly Water Inventory Report for Ohio Ohio Department of Natural Resources Monthly Station Normals Station 33 Put-In-Bay National Oceanic and Atmospheric Administration
74
- Background
- Purpose
- Phase 1 - Rapid Field Asessment
-
- Determination of Water Quality
- Assessment of Water Sources and Supplies
- Assessment of Community Water Distribution System and Auxiliary Wells
- Assessment of Water Sources and Supplies - Development of Groundwater Wells Sewage Disposal Methods
- Sewage Disposal Methods
-
- Phase 2 - Groundwater Quality Assessment
-
- ODHNCEH Assessment
- Collection Organization and Analysis of Available Water Quality Data
-
- Conclusions
- Recommendations
- References
- Attachments
-
- 1 Cases of gastroenteritis by date of onset and etiology
- 2 Information on South Bass Island Ohio
- 3 Aerial photograph identifying 11 NCEH water sample collection locations South Bass Island Ohio Aug 30 - Sept 2 2004
- 4 Environmental Sampling Conducted in the Investigation of a Suspected Waterborne Outbreak South Bass Island Ohio Aug - Sept 2004
- 5 Bass Island Sample Form
- 6 Well Log and Drilling Report
- 7 Movement of Water in Karst Geology
- 8 Ottawa County SSURGO Digital Soil Survey
- 9 Soil Limitations for Wastwater Disposal
- 10 ODHNCEH Groundwater Quality Assessment Procedure
- 11 E coli Analysis Results
- 12 Total Coliform Analysis Results
- 13 E coli Positive Results by Well Depth
- 14 E coli Positive Results by Section Location
- 15 Water Quality Analysis Results
- 16 South Bass Island and North Central Ohio Precipitation (in inches)
-
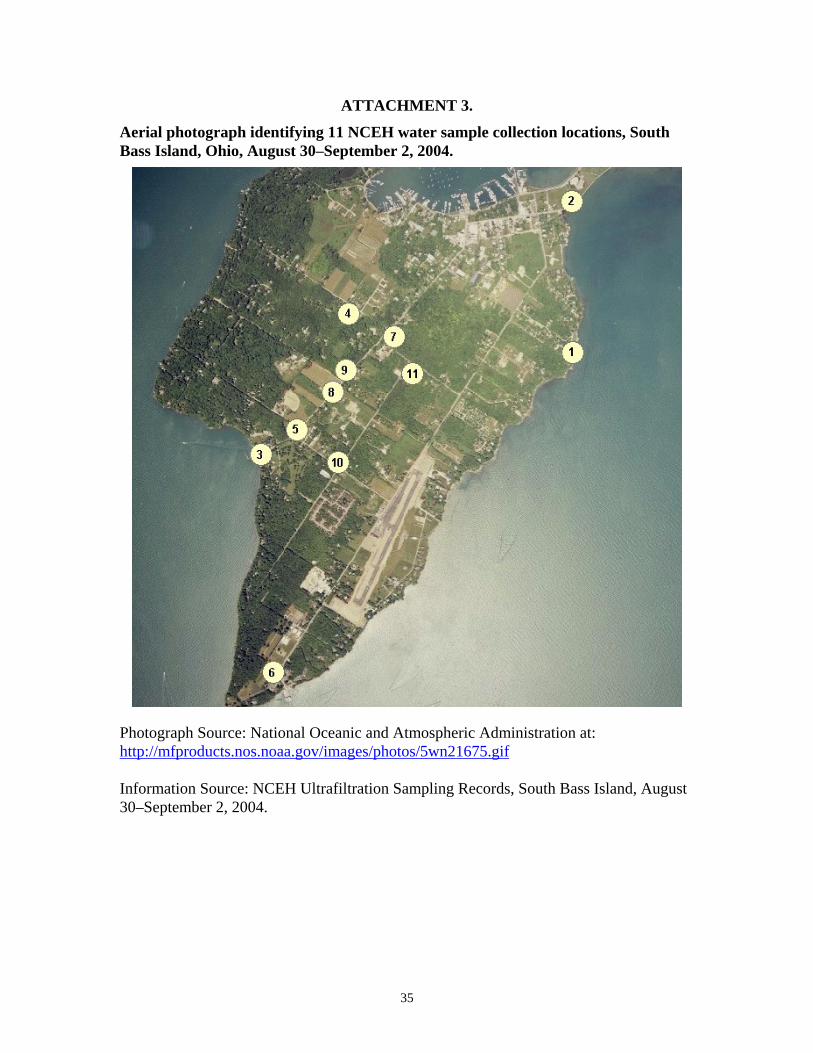
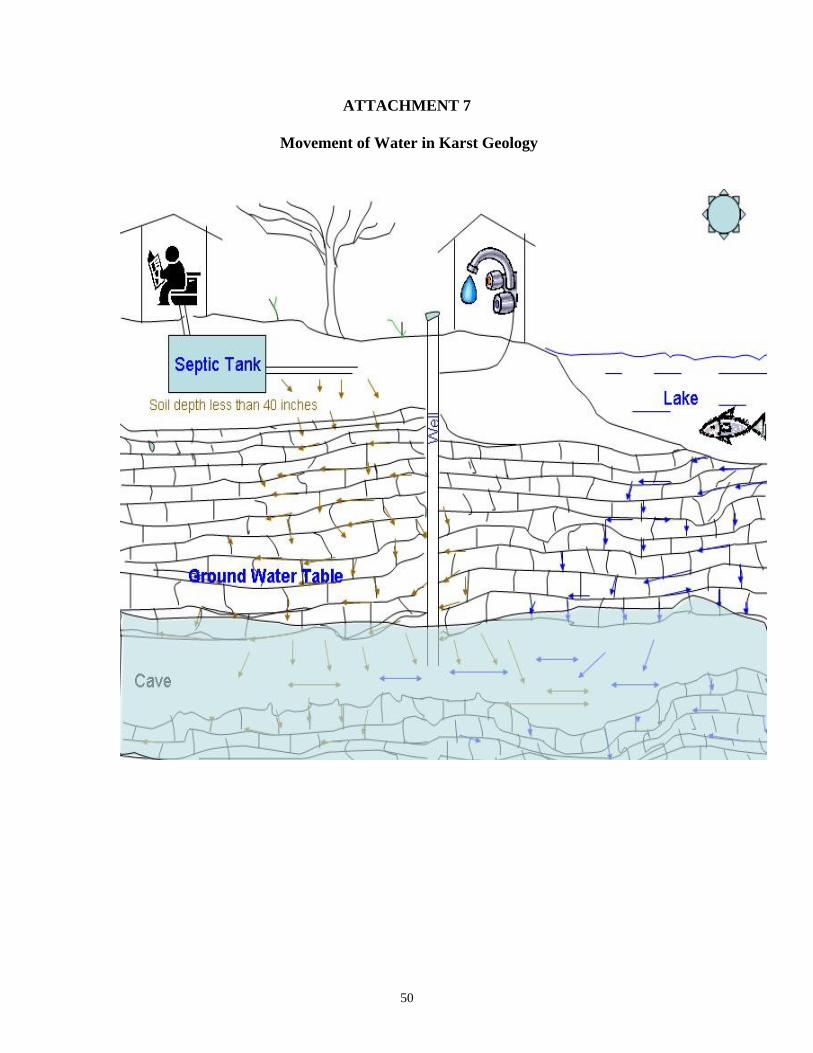

___________________________________________________________________________________
___________________________________________________________________________________
______________________________________________________________________________________ ______________________________________________________________________________________ _______________________________________________________________________________
ATTACHMENT 10 Form 1
ODHNCEH Groundwater Quality Assessment Sanitary Survey Form
South Bass Island Ohio September 2004
South Bass Island - Sanitary Survey
Owner Name________________________________________________________________ Address (street number name)________________________________________________ GPS Coordinates (NAD 83) _________________________________________________ Sample collected_
Water Well Information Well Currently Used for Drinking Water______
Well Casing (circle one) - Steel PVC Well casing (circle) - Above grade In Pit
Well casing height above grade__________ Well Log Number_____________________
Condition of casing (circle) Good Fair Deteriorated Holescracks in casing
Well Cap(circle) - Aluminum 2 Part gasketed Sanitary Seal Condition of cap_____________________________________________________________
Type of pump (circle) Jet Deep(2 lines) Jet Shallow Submersible Hand pump
Pitless Adapter______ Well Pit ______(wet or dry) Well House_____________________
Conditions around well (subsidence slope rock at surface)____________________________________
Comments__________________________________________________________________________
HSTS Information
TankRisers visible______ Distribution Boxes____ ATU visible______ Discharge ______
Location of Discharge_______________Lake discharge______ Discharge - clear cloudy odor (circle)
Elevated leach field or mound______ Chlorinator present and filled_______ Aeration sytem ndash motor present______
Comments on system conditions (surfacing sewage wet areas green stripes etc
54
Water Treatment Information
System type (circle one) ndash Softener Oxidizing Unit(chlorineiodine) Continuous chlorination Ultraviolet Carbon Filter Sediment Filter
Other________________________________________________________________
Sampling port or bypass present_____________________________________________
Survey completed by_________________________________________________________ Date_________________________________________
LAB
55
Attachment 10 Form 2
Water Sample Collection Log Bass Island Ohio
Lab
DATE COLLECTED
TIME NAME ADDRESS WELL LOG CLOOECTED BY SECTION
56
ATTACHMENT 10 Table 1
ODHNCEH Groundwater Quality Assessment Codebook South Bass Island Ohio September 2004
Variable Name Variable Type Variable size Variable Description Values or Explanation Data Source Well_log Number 6 Well log number uniquely
describes well Plunketmdb
Sanitary survey Last_name Character 20 Last name of well owner Sanitary survey
Tracking database
First_name Character 20 First name of well owner Sanitary survey Tracking database
Street_name Character 25 Street name where well is located
Plunketmdb Sanitary survey
Street_number Character 5 Street number where well is located
Plunketmdb Sanitary survey
Well_depth Number 4 Depth of the well in feet Plunketmdb Sanitary survey
Latitude Number 9 Latitude of well position Plunketmdb Sanitary survey
Longitude Number 9 Longitude of well position Plunketmdb Sanitary survey
Sample_date Date 10 Date sample was taken Santary survey Laboratory
results
Sample_number Character Number assigned to lab results for sample
Laboratory results
57
Quadrant Character 22 Quadrant where sample was drawn
1-22 quadrants Sanitary survey Tracking database
Collector Character 20 Name of Surveyor Sanitary survey Tracking database
Lab Character 30 Name of Laboratory performing analysis
Ohio Department of Agriculture BenchMark
Tracking database
TC Number Laboratory results for Total Coliforms
Laboratory results
EC Number Laboratory results for E coli Laboratory results
Campy Number Laboratory results for Camybolacter
Laboratory results
Salmon Number Laboratory results for Salmonella
Laboratory results
Nitrate Number Laboratory results for Nitrates Laboratory results
Chloride Number Laboratory results for Chlorides
Laboratory results
Casing_mat Character 8 Material used for well-casing Steel PVC Brick Concrete
Sanitary survey
Casing_location Character 16 Location of well-casing Above grade In pit Buried Cannot
determine
Sanitary survey
Casing_height Number 2 Height of well-casing above grade in inches
Sanitary survey
Casing_cond YES-no Does the well-casing havecracks holes or gaps
Sanitary survey
Case_diam Number 4 Diameter of well casing in inches
Well logs
58
Case_length Number 5 Length of the well casing in feet
Well logs
Cap YES-no Is the well top covered YESno Sanitary survey Cap_seal YES-no Well top provides a sanitary
seal YESno Sanitary survey
Pitless YES-no Presence of pitless adapter YESno Sanitary survey Wellhouse YES-no Well head in protected
wellhouse YESno Sanitary survey
Wellhead YES-no Well head located in pit YESno Sanitary survey wellhead_dry YES-no Well head in pit is dry YESno Sanitary survey Date_comp Date 10 Date well constuction
completed Well logs
Drawdown Number 3 Number of feet that water can be drawn down in a well
Well logs
Static_level Number 3 Depth to water level in feet Well logs Well_pres YES-no Presence of a properly sealed
water well (10ft) YESno Sanitary survey
Slines_pres YES-no Presence of sewer lines (10ft) YESno Sanitary survey
Sewage_pres YES-no Presence of sewage disposal systems (50ft)
YESno Sanitary survey
Water_pres YES-no Presence streams lakes ponds and ditches near well
source (25ft)
YESno Sanitary survey
Manure_pres YES-no Presence of manure ponds piles or lagoons near well
source (50-300ft)
YESno Sanitary survey
Landfill_pres YES-no Land fills or dump sites present near well source
(1000ft)
YESno Sanitary survey
59
Watercoll YES-no Surface water collects around well-casing
YESno Sanitary survey
Cont_pres YES-no Other sources of contamnation present near
well source
YESno Sanitary survey
Cont_other Text 250 Explanation of other type of contamination source
Sanitary survey
Sewage_home YES-no Home sewage tretment system is designed to
discharge effluent to surface
YESno Santary survey
Discharge Character 15 Surface discharge location Drainage ditch Storm drain Lake Pond
Stream
Sanitary survey
Disch_qual Character 10 Quality of effluent Clear Cloudy Odor Sanitary survey Chlorination YES-no Chlorinated effluent YESno Sanitary survey
Oper_chl YES-no chlorination system operates as designed
YESno Sanitary survey
Aeration YES-no Presence of aeration system YESno Sanitary survey Oper_aer YES-no Aeration system functions as
designed YESno Sanitary survey
Treat_type Character 30 Type of water treatment system used
Softener Oxidizing unit(iodinechlorine)
Carbon Filter Sediment Filter Ultraviolet
Continuous chlorination
Sanitary survey
Port YES-no Presence of sampling port or bypass
YESno Sanitary survey
60
ATTACHMENT 11 Table 1
E coli Analysis Results Groundwater Samples Collected on South Bass Island Ohio
September 2004
E COLI POSITIVE RESULTS n = 77
69 E COLI NEGATIVE
31 E COLI POSITIVE
69 E COLI NEGATIVE
31 E COLI POSITIVE
Source Ohio Department of Health (ODH) and Centers for Disease Control and Prevention National Center for Environmental Health (NCEH) groundwater quality assessment South Bass Island Ohio September 8ndash10 2004
61
ATTACHMENT 11 Table 2
E coli Analysis Results by Laboratory Groundwater Samples Collected on South Bass Island Ohio
September 2004
Lab amp Sample Set Date Collected Total Samples Number E coli
Positive Percent Positive
Benchmark 1 Wednesday 090804 16 5 294
ODA 2 Wednesday 090804 6 1 167
Benchmark 3 Thursday 090904 15 6 400
ODA 4 Thursday 090904 12 4 308
Benchmark 5 Friday 091004 20 3 150
ODA 6 Friday 091004 8 5 625
Total 77 24 312
Source Ohio Department of Health (ODH) and Centers for Disease Control and Prevention National Center for Environmental Health (NCEH) groundwater quality assessment South Bass Island Ohio September 8ndash10 2004
62
ATTACHMENT 11 Table 3
Location of E coli Positive Sample Results Groundwater Samples Collected on South Bass Island Ohio
September 2004
Source Ohio Department of Health (ODH) and Centers for Disease Control and Prevention National Center for Environmental Health (NCEH) groundwater quality assessment South Bass Island Ohio September 8ndash10 2004
63
ATTACHMENT 12 Table 1
Total Coliform Analysis Results Groundwater Samples Collected on South Bass Island Ohio
September 2004
TOTAL COLIFORM POSITIVE RESULTS n = 77
22 Total coliform negative
78 Total coliform positive
22 Total coliform negative
78 Total coliform positive
Source Ohio Department of Health (ODH) and Centers for Disease Control and Prevention National Center for Environmental Health (NCEH) groundwater quality assessment South Bass Island Ohio September 8ndash10 2004
64
Total
ATTACHMENT 12 Table 2
Total Coliform Analysis Results by Laboratory Groundwater Samples Collected on South Bass Island Ohio
September 2004
Lab amp Sample Set Date Collected Total Samples Total Coliform Positive Percent Positive
Benchmark 1 Wednesday 090804 16 14 875
ODA 2 Wednesday 090804 06 03 500
Benchmark 3 Thursday 090904 15 12 800
ODA 4 Thursday 090904 12 09 750
Benchmark 5 Friday 091004 20 16 800
ODA 6 Friday 091004 08 06 750
77 60 779
Source Ohio Department of Health (ODH) and Centers for Disease Control and Prevention National Center for Environmental Health (NCEH) groundwater quality assessment South Bass Island Ohio September 8ndash10 2004
65
ATTACHMENT 12 Figure 1
Location of Total Coliform Positive Samples Groundwater Samples Collected on South Bass Island Ohio
September 2004
Source Ohio Department of Health (ODH) and Centers for Disease Control and Prevention National Center for Environmental Health (NCEH) groundwater quality assessment South Bass Island Ohio September 8ndash10 2004
66
ATTACHMENT 13 Figure 1
E coli Positive Results by Well Depth Groundwater Samples Collected on South Bass Island Ohio
September 2004
0 ft
52 ft
d
162 ft
Source Ohio Department of Health (ODH) and Centers fNational Center for Environmental Health (NCEH) grouIsland Ohio September 8ndash10 2004
67
Well Hea
Wells 0 to 52 Feet Deep 64 E coli Positive
N = 22
Wells greater than 52 Feet Deep 19 E coli Positive
N = 54
Ground Surface
or Disease Control and Prevention ndwater quality assessment South Bass
ATTACHMENT 13 Figure 2
E coli Results Well Depths Less Than 52 Feet Groundwater Samples Collected
September 8ndash10 2004 South Bass Island Ohio
Source Ohio Department of Health (ODH) and Centers for Disease Control and Prevention National Center for Environmental Health (NCEH) groundwater quality assessment South Bass Island Ohio September 8ndash10 2004
68
ATTACHMENT 13 Figure 3
E coli Results Well Depths Greater Than or Equal to 52 Feet Groundwater Samples Collected
September 8ndash10 2004 South Bass Island Ohio
Source Ohio Department of Health (ODH) and Centers for Disease Control and Prevention National Center for Environmental Health (NCEH) groundwater quality assessment South Bass Island Ohio September 8ndash10 2004
69
ATTACHMENT 13 Figure 4
E coli Positive Results by Well Depths Groundwater Samples Collected
September 8-10 2004 South Bass Island Ohio
Source Ohio Department of Health (ODH) and Centers for Disease Control and Prevention National Center for Environmental Health (NCEH) groundwater quality assessment South Bass Island Ohio September 8ndash10 2004
70
ATTACHMENT 14
E coli Positive Results by Section Location Groundwater Samples Collected on South Bass Island Ohio
September 2004
Location Total Samples
Number E coli Positive
Percent Positive
Shoreline 55 17 309
Interior 22 7 318
Source Ohio Department of Health (ODH) and Centers for Disease Control and Prevention National Center for Environmental Health (NCEH) groundwater quality assessment South Bass Island Ohio September 8ndash10 2004
71
ATTACHMENT 15 Table 1
Water Quality Analysis Results Private Groundwater Wells Sampled by Ottawa County Health Department
South Bass Island Ohio AugustndashSeptember 2004
Date Collected
Number Collected
Number amp Total Coliform Positive
Number amp Ecoli Positive
AUG 23 9 5 (56 ) 2 (22) AUG 25 8 4 (50 ) 1 (13) AUG 30 23 12 (52 ) 8 (35) SEPT 01 6 3 (50 ) 2 (33) SEPT 08 18 3 (17) 6 (40)
Total ( Pos) 64 27 (42) 19 (30)
Source Ottawa County Health Department Port Clinton Ohio September 10 2004
72
ATTACHMENT 15 Table 2
Water Quality Analysis Results Total Coliform and E coli Positive Private Groundwater Well Samples
South Bass Island Ohio 2001ndashAugust 2004
Year Number of
Samples Collected
Number Total
Coliform Positive
Percent Total
Coliform Positive
Number E coli
Positive
Percent Ecoli
Positive
2001 29 18 62 2 7 2002 23 9 39 2 9 2003 28 14 50 3 11
Jan ndash July 2004 13 10 77 2 15
Aug 2004 54 36 67 14 26 Total 147 87 59 23 16
Source Ottawa County Health Department Port Clinton Ohio September 10 2004
ATTACHMENT 15 Table 3
Groundwater Quality Analysis Results All Water Samples Collected Total Coliform and E coli Results by Agency
South Bass Island Ohio AugustndashSeptember 2004
Agency Total Coliforms E coli No
Analyzed No
Positive Percent
+ No
Analyzed No
Positive Percent
+ OEPA 87 38 44 48 17 35 MSU 8 4 50 8 2 25 ODA 10 3 33 10 2 20 CDC 0 mdash mdash 7 4 57 ODH 6 4 666 4 2 50 Total 111 49 44 77 27 35
Source Ottawa County GI IllnessmdashSummer 2004 Sample Results Log Oct 14 2004 Ohio Environmental Protection Agency (OEPA) Columbus Ohio MSU = Michigan State University ODA = Ohio Department of Agriculture CDC = Centers for Disease Control and Prevention ODH = Ohio Department of Health
73
ATTACHMENT 16
South Bass Island and North Central Ohio Precipitation (in inches)
North Central Region North Central Region South Bass Island Month 2004 1951ndash2000 1977ndash1997
January 225 221 163 February 063 191 145
March 362 266 228 April 236 337 298 May 809 351 333
June 496 373 349 July 406 372 301
August 376 336 343 September 245 299 303
October 233 226 248 November 359 283 253 December 335 254 213
Total 4145 3509 3177
Sources Monthly Water Inventory Report for Ohio Ohio Department of Natural Resources Monthly Station Normals Station 33 Put-In-Bay National Oceanic and Atmospheric Administration
74
- Background
- Purpose
- Phase 1 - Rapid Field Asessment
-
- Determination of Water Quality
- Assessment of Water Sources and Supplies
- Assessment of Community Water Distribution System and Auxiliary Wells
- Assessment of Water Sources and Supplies - Development of Groundwater Wells Sewage Disposal Methods
- Sewage Disposal Methods
-
- Phase 2 - Groundwater Quality Assessment
-
- ODHNCEH Assessment
- Collection Organization and Analysis of Available Water Quality Data
-
- Conclusions
- Recommendations
- References
- Attachments
-
- 1 Cases of gastroenteritis by date of onset and etiology
- 2 Information on South Bass Island Ohio
- 3 Aerial photograph identifying 11 NCEH water sample collection locations South Bass Island Ohio Aug 30 - Sept 2 2004
- 4 Environmental Sampling Conducted in the Investigation of a Suspected Waterborne Outbreak South Bass Island Ohio Aug - Sept 2004
- 5 Bass Island Sample Form
- 6 Well Log and Drilling Report
- 7 Movement of Water in Karst Geology
- 8 Ottawa County SSURGO Digital Soil Survey
- 9 Soil Limitations for Wastwater Disposal
- 10 ODHNCEH Groundwater Quality Assessment Procedure
- 11 E coli Analysis Results
- 12 Total Coliform Analysis Results
- 13 E coli Positive Results by Well Depth
- 14 E coli Positive Results by Section Location
- 15 Water Quality Analysis Results
- 16 South Bass Island and North Central Ohio Precipitation (in inches)
-
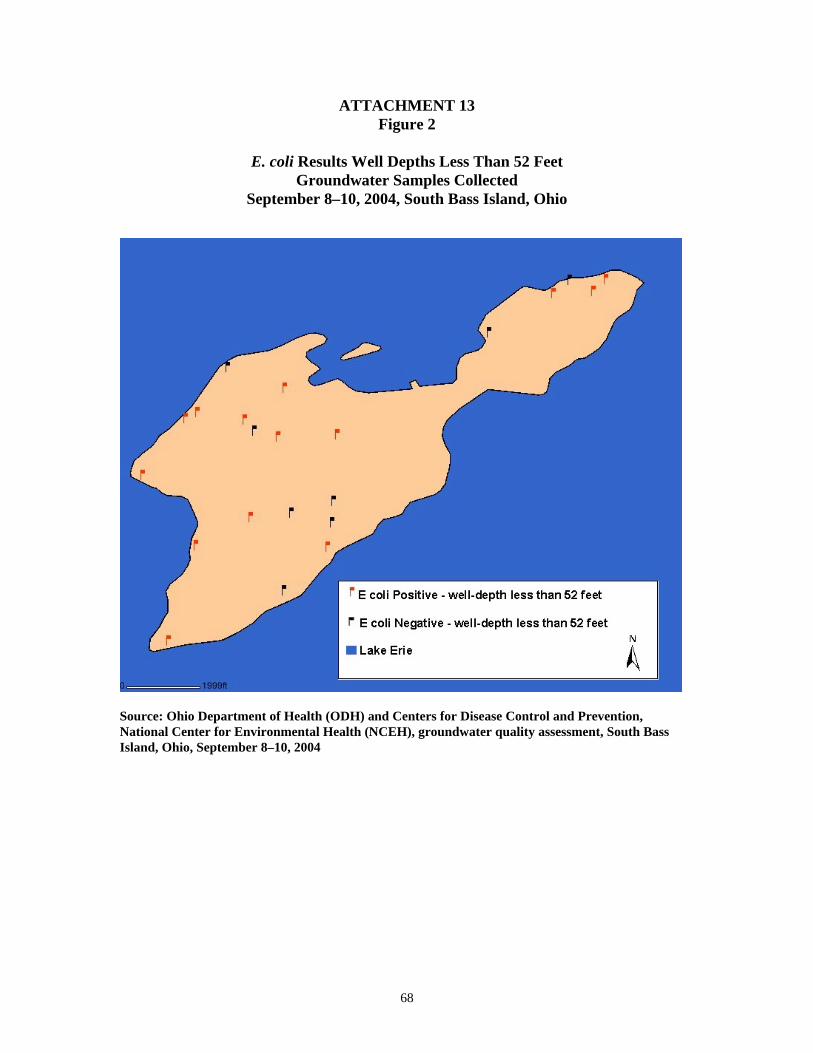


![Public Health 1936. - · PDF filePublic Health Act, 1936. [26 GEO. 5. & 1 EDW. 8. CH. 49.] ARRANGEMENT OF SECTIONS. A.D. 1936. PART I. LOCAL ADMINISTRATION. Local authorities and their](https://static.fdocuments.in/doc/165x107/5a9dd1187f8b9ae0108bf546/public-health-1936-health-act-1936-26-geo-5-1-edw-8-ch-49-arrangement.jpg)