Public Health Integrating Data for Improved Outcomes Annual PHSSR Keeneland Conference April 22,...
22
Public Health Integrating Data for Improved Outcomes Annual PHSSR Keeneland Conference April 22, 2015 Dawn Jacobson, MD, MPH Deborah Porterfield, MD, MPH Ben Yarnoff, PhD
-
Upload
calvin-ross -
Category
Documents
-
view
215 -
download
0
Transcript of Public Health Integrating Data for Improved Outcomes Annual PHSSR Keeneland Conference April 22,...

Public Health Integrating Data for Improved Outcomes
Annual PHSSR Keeneland ConferenceApril 22, 2015
Dawn Jacobson, MD, MPHDeborah Porterfield, MD, MPH
Ben Yarnoff, PhD

2
Acknowledgements
• Public Health Institute– Dawn Jacobson, MD, MPH – Suzanne Ryan-Ibarra, MPH
• RTI International– Deborah Porterfield, MD, MPH – Ben Yarnoff, PhD– Paula Soper, MS, MPH (now ASTHO)
• Funding – RWJF Public Health Services and Systems Research:
Building Evidence for Decision Making (2012-2015)

3
Beacon Community Program
• $265 million over a 3-year period (2011-2014) to 17 Beacon Communities
• Three aims: – Build and strengthen health IT infrastructure and
exchange capabilities– Improve cost, quality, and population health, translating
investments in health IT in the short run to measureable improvements
– Test innovative approaches to care delivery, performance measurement, and technology integration

4
What is a “Beacon Community”?
• Different criteria in creating definitions*– existing networks of physicians within a particular region– patterns of patients’ care seeking, or – physicians’ referral networks
• Public health agencies were not explicitly included in the definition (or as required partners)
• Public health agencies often included as partners and may have directly or indirectly benefited from Beacon Program interventions

5
Hypotheses
• Local public health departments (LHDs) that collaborated with Beacon Community led organizations to leverage partnerships, funding, and other IT resources developed:– more robust electronic Public Health Record (PHR) data
system capacity and – more efficient reporting processes for communicable and
chronic disease surveillance

6
Overview of Methods
• Quasi-experimental design–“natural” experiment– Compare “exposed” communities (received funding) with
“unexposed” communities (without funding)
• Mixed methods in three phases– Phase 1: quantitative; selection of comparison group;
baseline analysis using secondary data sources – Phase 2: qualitative; key informant interviews to inform
design of primary survey/data collection– Phase 3: quantitative; follow-up survey to measure
processes and outcomes; analysis of change of over time

7
Sample and Unit of Analysis (LHD)
• All LHDs located within the geographic region of a Beacon Community were eligible to be in the study sample– “Intent to reach” whether or not the LHD received Beacon funding or
participated in Beacon activities– Challenges based on geography
• regional LHD districts • standalone city LHDs nested within a county• Beacon communities that cross state lines
• Exclusion criteria: – nonresponders for NACCHO Profile – state without LHDs (e.g., Rhode Island)
• Final “exposed” sample: 80 local LHDs within 17 states

8
Defining Outcomes: Capabilities
• Robust LHD electronic data collection and reporting capabilities – Internal data sharing and reporting on shared data
platform rather than standalone, non-interoperable databases
– Unidirectional data sharing and reporting with local clinical care system or state health department
– Bidirectional data sharing with local clinical care system or state health department

9
Defining Outcomes: Processes
• Efficient and complete LHD electronic data collection and reporting processes, e.g.:– Percentage of LHDs that initiate and complete
communicable disease outbreak investigations within a given time standard
– Percentage of LHDs that can access and use electronic laboratory reports after receiving a report of an outbreak within a given time standard
– Percentage of LHDs that can access and use information from a disease registry within a given time standard

10
Data Sources
• Primary– 2014 Key Informant Interviews– 2015 LHD Survey (in field)
• Secondary– 2010 and 2013 NACCHO Profile – CMS directory of health care providers participating in
Meaningful Use– The Area Health Resource File from the Census Bureau

11
Timeline
2009 HITECH ACT
Three funding streams for HIT infrastructure development1. Beacon grants – local level2. State HIE grants – state level3. Regional Extension Centers
Beacon Program 2011 - 14
17 communitiesGeographic diversity
Project PHIDO 2013-15
Phase 1: 2013Phase 2: 2014Phase 3: 2015
NACCHO 2010Baseline Data
NACCHO 2013Follow-up Data
PHIDO SurveyFeb 2015
MU Stage 12011
MU Stage 22014

12
Phase 1: Developing Comparison Group
• Beacon funding is likely not random; therefore, an appropriate comparison group must be carefully constructed
• Comparison group generated by matching to LHDs that– are not located within a Beacon Community, but are located within
the same state, and – are otherwise similar in terms of the key factors that might influence
the outcomes of the study
• Should have no significant differences with respect to IT infrastructure or capabilities at baseline, or other factors that might influence these outcomes

13
Comparison Group: Propensity Score Methods
• Assembled a set of characteristics to serve as predictors in the propensity model, which are theoretically correlated with Beacon funding or outcomes – Capability and Process Measures of LHDs – Area-Level Factors
• Estimated a propensity score for each LHD in NACCHO Profile using logistic regression model
• Used nearest neighbor matching without replacement and required that the matched LHD be in the same state – Each exposed LHD was matched with the non-exposed LHD that has
the closest propensity score
Final matched sample: 160 LHDs – 80 exposed and 80 unexposed

14
Phase 1: Propensity Score Fit
• All tests indicate a good match. After matching:– Bias is almost completely reduced– No covariates are statically different between Beacon and non-Beacon– Covariates are jointly insignificant
Measure Unmatched Matched
Mean Bias 14.2% 5.6%
Median Bias 11.4% 3.2%
Number of Covariates with Statistically Significant Differences 7 0
Likelihood Ratio Chi2 p-value 0.000 0.961

15
Phase 1: Propensity Score FitHistogram of bias before and after matching

16
Phase 2: Interviews
• Semistructured interviews conducted by phone • Purposive sampling was used to identify six experts from
four LHDs and one Public Health Institute co-located within Beacon communities:– County of San Diego, CA; Olmsted County, MN; Hamilton
County, OH – Rowan County, NC; Louisiana Public Institute, New Orleans, LA
• Domains of the interview protocol– Involvement in Beacon activities; resultant partnerships and IT
development– Capabilities and processes

17
Phase 2 Results
• Examples– Most resources went to develop public health primary care clinic EHRs
rather than electronic public health surveillance (e.g., HgA1c) and case management records (e.g., WIC clients)
– Data sharing is often unidirectional between LHD and other organizations or only a one-way HIE at this time
– Many new and strengthened partnerships
• Findings used to craft Phase 3 questions, in particular:– Partnerships between LHD and SHD and LHD and health care systems
—type and nature– Standards for public health electronic data reporting (examples and
standards)

18
Phase 3: Quantitative Survey Analysis of Change Over Time
• Quantitative survey of matched LHD sample– Self-report of LHD IT capabilities and processes during the
timeframe of the Beacon program– 20 questions, varying complexity– 4 domains
• LHD IT infrastructure • LHD IT partnerships• LHD electronic data sharing• LHD efficiency/timeliness of data reporting
19
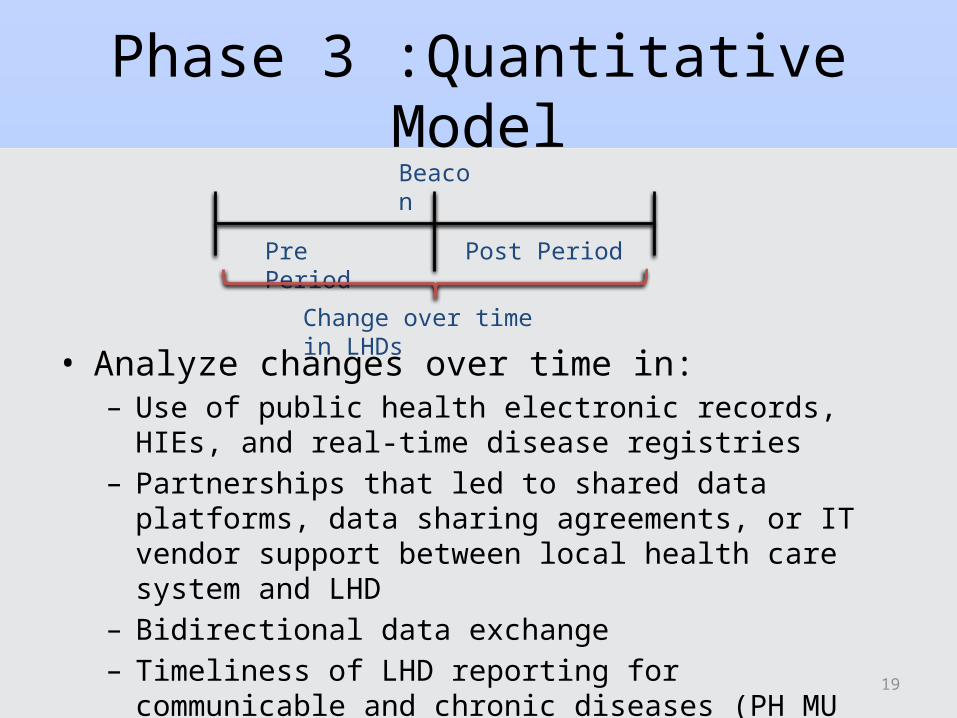
Phase 3 :Quantitative Model
• Analyze changes over time in:– Use of public health electronic records, HIEs, and real-time
disease registries– Partnerships that led to shared data platforms, data sharing
agreements, or IT vendor support between local health care system and LHD
– Bidirectional data exchange– Timeliness of LHD reporting for communicable and chronic
diseases (PH MU objectives)
Pre Period Post Period
Beacon
Change over time in LHDs

20
Phase 3 :Quantitative Model
• Trends in LHD IT over time may confound simple pre-post differences, so we use the matched non-Beacon LHDs as a control group
• We estimate a difference-in-differences regression equation:*
Beacon
Pre-Beacon Period Post-Beacon PeriodTime
LHD IT Measures
Beacon LHDs
Matched Control LHDs
Estimated Effect of Beacon
Actual Effect of Beacon

21
Policy and Practice Implications
• Develop best practices for partnerships and IT resource sharing between health care and public health organizations
• Increase awareness of the LHD IT infrastructure necessary for real-time data sharing and reporting
• Advocate for future LHD-specific funding– CMS innovation grants to LHDs– Expand CMS designation of “provider” to nonclinical LHD
surveillance activities

22
QUESTIONS?