Public Health Information Systems and Data Standards in Public Health Informatics
95
PUBLIC HEALTH INFORMATION SYSTEMS AND DATA STANDARDS IN PUBLIC HEALTH INFORMATICS MED264: Principles of Biomedical Informatics Michael Hogarth, MD, FACP Professor, Internal Medicine Professor and Vice Chair, Dept. of Pathology and Laboratory Medicine PI, California Electronic Death Registration System (CA-EDRS) http://www.hogarth.org [email protected]
-
Upload
mike-hogarth-md-facmi-facp -
Category
Health & Medicine
-
view
248 -
download
1
Transcript of Public Health Information Systems and Data Standards in Public Health Informatics

PUBLIC HEALTH INFORMATION SYSTEMS AND DATA STANDARDS IN PUBLIC HEALTH INFORMATICS
MED264: Principles of Biomedical Informatics
Michael Hogarth, MD, FACPProfessor, Internal MedicineProfessor and Vice Chair, Dept. of Pathology and Laboratory MedicinePI, California Electronic Death Registration System (CA-EDRS)
http://[email protected]

PUBLIC HEALTH 101

The birth of “public health”• Dr. Chadwick
– Secretary for the British Poor-Law commission
– Demonstrated the value and need for information that could be obtained from a vital records process.
• 1836 – the birth of modern “vital records” – following a cholera epidemic of 1831– the UK enacted a registration law
creating a central register office with responsibility for records and statistics of births, marriages, and deaths in England and Wales

The UK Public Health Act of 1848
• Sir Edwin Chadwick published a widely read and important report on sanitation and disease– felt that disease was the main cause
of poverty, hence preventing disease would reduce poverty.
• Chadwick led the creation of the Public Health Act of 1848 – created a General Health Board to
oversee sanitation
• Included mechanism for local boards of health to be created with an appointed medical officer– established several an important
precedent for government to oversee sanitation as a way of reducing the burden of disease

Snow and the Theory of Disease
London Cholera Outbreak 1854 Snow’s map of cases
Dr. John Snow (1813-1858) http://en.wikipedia.org/wiki/John_Snow_(physician)

Vital Records and Public Health
• William Farr, in 1838, became the first medical statistician in the General Register Office for England and Wales
• instrumental in using statistics to study the health of populations
• Set up a system for routinely recording causes of death
• Used this data (vital statistics) to compare mortality rates across different occupations
• Instrumental in the creation of ICD – international classification of disease
http://en.wikipedia.org/wiki/File:Farr_william1870.gif

Data, Statistics, and Improving the Public’s Health
• Florence Nightingale (1820-1910)
• The first “public health informaticist”
• Believed statistics could lead to improvements in health care practices
• Developed the “Model Hospital Statistical Form” to collect and generate data to perform statistics and identify areas for improvement
• Founded a the first formal nursing training program (Nightingale School for Nurses, King’s College, London)
U.S. Vital Statistics Reporting - 1890
http://www.cdc.gov/nchs/data/vsushistorical/vsush_1890_1.pdf
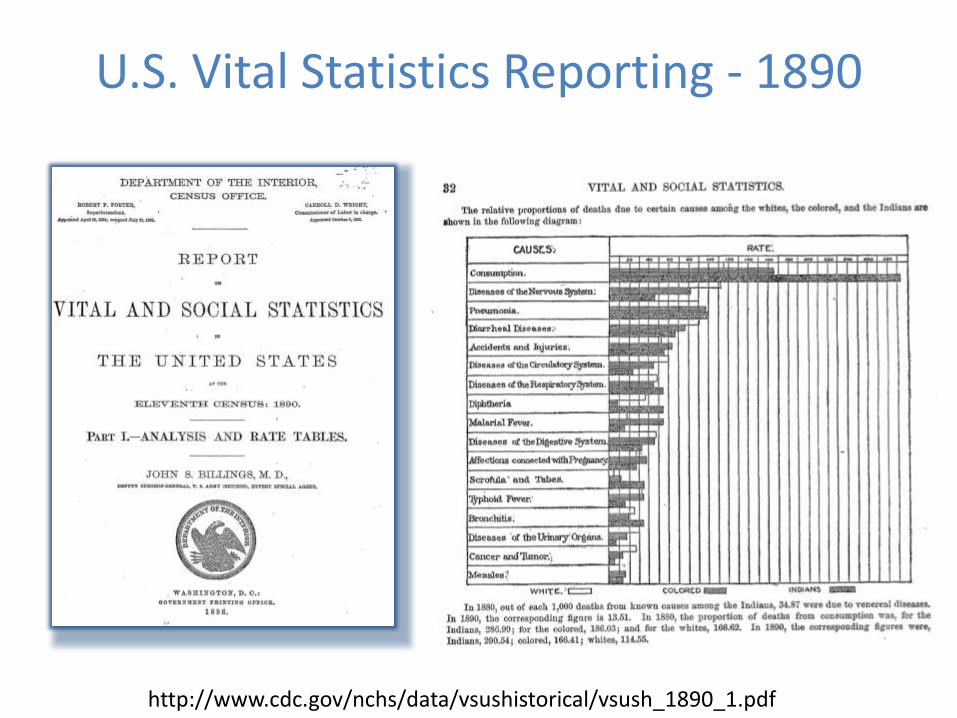
Public Health and Improving Population Health
• Improved Sanitation– Sewage treatment– Potable water
• Vaccination– Small pox, polio, diphtheria,
whooping cough, tetanus, influenza, measles, mumps, rubella
– Pneumonia, haemophilusinfluenza, herpes zoster, hepatitis
• Surveillance– Monitoring– Serologic and Microbiologic
testing
• Providing safety net care– County health programs
http://en.wikipedia.org/wiki/File:Salk_headlines.jpg

The Value of Public Health
http://en.wikipedia.org/wiki/File:Measles_US_1944-2007_inset.png

The Role of Data in Public Health
• Data acquisition and analysis are fundamental to public health practice
• Public health data to public health practice is akin to vital signs in individual patient practice

Collecting Data Example – California Health Interview Survey (CHIS)

Informing Policy Makers and the Public
http://www.cdph.ca.gov/pubsforms/Pubs/OHIRProfiles2011.pdf

Opening up data Data.gov
http://www.data.gov/

California Open Data – Sept 2014
https://health.data.ca.gov/
Este Geraghty, MD, MPH,MS,GISP

The Role of Informatics in Public Health
• Health data is critical to public health practice• Information management, information science,
and information technology are key functions in public health– Data collection systems – Information representation
• coding, data elements, metadata
– Data management • storage, archiving
– Computer security for digital data• policies, security procedures

PUBLIC HEALTH INFORMATICS

Public Health one of the first use computers
• 1938 – Illinois Dept. of Public Health acquires an IBM tabulation system for vital statistics (Lumpkin. Public Health
Informatics and Information Systems. 2002)
• 1951 – US Census Bureau used the first computer (ENIAC) to tabulate the census
http://en.wikipedia.org/wiki/File:Early_SSA_accounting_operations.jpg
IBM 285Tabulator(1936)

Common Informatics Activities
• Public health informatics planning and policy– Strategic planning – to align with org– Policy development – privacy, legal, ethics
• Information Management infrastructure– Analytics platform (SPSS, SAS)– Data Set acquisition, curating, distribution
• Information Technology Infrastructure– Geographic Information Systems
• To support professional GIS analysts• Provide infrastructure for information dissemination
– Information technology services coordination• Public health application development, support – ELR, eVitalRecords, IIS• Web site management• Coordinating the installation/operation of other public health systems
(STEVE, EVVE, NEDSS)• Managing/coordinating electronic medical record systems for clinical care

HI-TECH and Public Health
1. Meaningful Use public health “menu options”
– Electronic laboratory reporting
– Immunization information systems
2. State Health Information Exchange (HIE)
– Universal adoption of HIE within the state prior to 2015
– Grant program administered by HHS and funded by ARRA

PUBLIC HEALTH INFORMATION SYSTEMS
MPH 210

Core Public Health Information Systems
• Vital Records Systems
• Immunization Registries
• Disease Surveillance Systems
• Electronic Laboratory Reporting Systems
• Disease Registries (cancer, etc..)
• Health Information Exchanges (HIE)
• Geospatial Information Systems (GIS)

Example: Vital Record Systems
http://www.avss.ucsb.edu/
http://www.edrs.us/

Vital Records Systems
• Vital “Statistics”– “statistics” = ‘data about the state’– originated from:
•need to track populations and their status (health)•need to officially record lineage and thus ownership and entitlements
• “Vital Records” systems are managed in public health and typically consist of:– birth certificates– death certificates– marriage certificates

US Vital Statistics System
• 1632: Virginia - first state to legally require registration of vital events (birth, death, marriage)
• 1902: US Bureau of the Census authorized to obtain annual copies of records filed in the vital statistics offices of states having adequate death registration systems
• 1915: National birth registration collection authorized
• 1933: All states reporting both birth and death events
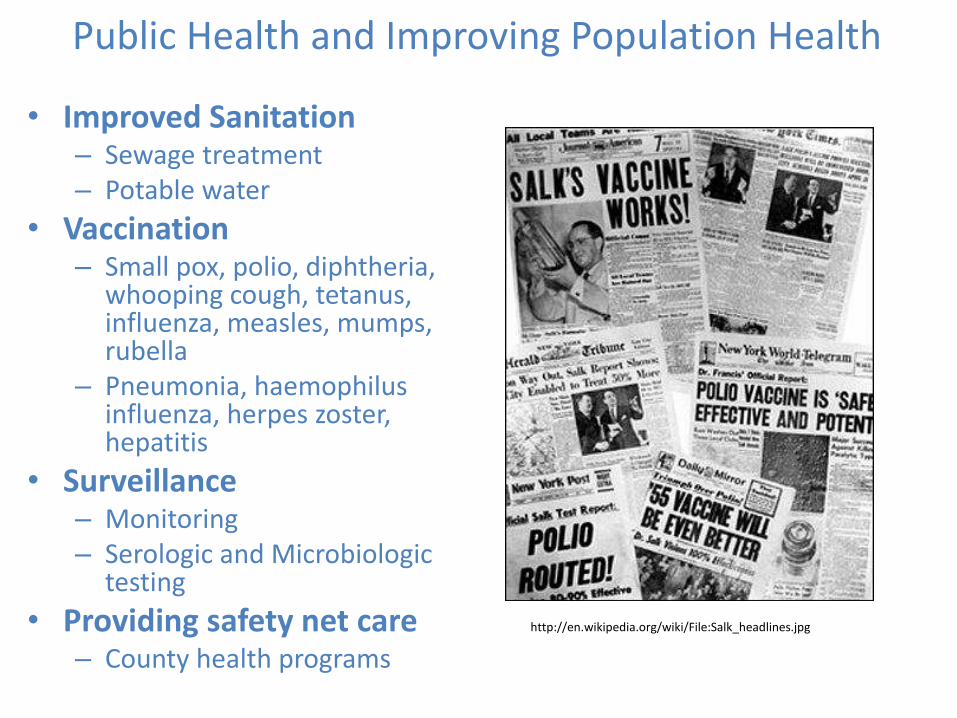
NCHS Data Files
http://www.cdc.gov/nchs/data_access/Vitalstatsonline.htm

NCHS National Death Index File
http://www.cdc.gov/nchs/data_access/ndi/about_ndi.htm
Available to investigators solely for statistical purposes in medical and
health research.
Not accessible to organizations or the general public for legal,
administrative, or genealogy purposes.

Standard Birth and Death Certificates
• These are ‘model’ certificates offered to states in order that there is uniformity in data collection making it easier to aggregate at the federal level
• Last revision - 2003
http://www.cdc.gov/nchs/nvss/vital_certificate_revisions.htm

Natality Data and Public Health
• Natality Files
– Teen childbearing
– Non-marital childbearing
– Pre-term birth
– Low birthweight
– Cesarean delivery
1940 1950 1960 1970 1980 1990 2000
0
20
40
60
80
100
Bir
th r
ate
per
1,0
00
wo
men
aged
15
-19
0
100
200
300
400
500
600
700
Nu
mb
er of b
irths (in
tho
usan
ds)
Number of births
Birth rate
Number of births and birth rates for teenagers
aged 15-19 years: United States, 1960-2000
http://www.cdc.gov/nchs/nvss/vital_certificate_revisions.htm

Death Files and Public Health
• Death Statistics Files
– Cause-of-death trends
– Leading causes of death
– Life expectancy
– socio-economic factors
– Demographic variation
http://www.cdc.gov/nchs/nvss/vital_certificate_revisions.htm
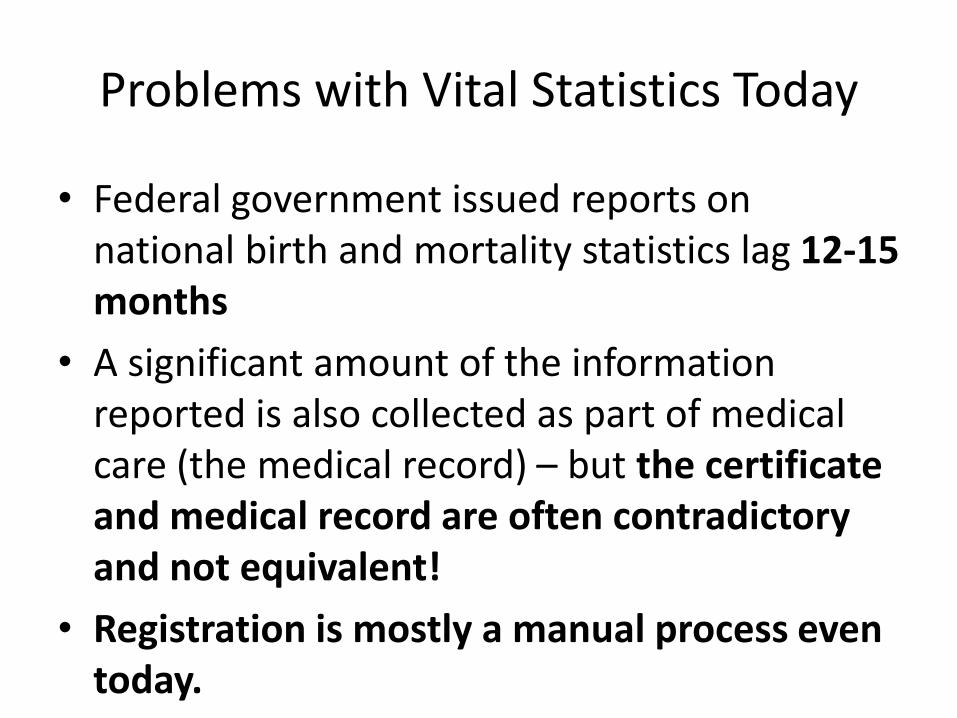
Problems with Vital Statistics Today
• Federal government issued reports on national birth and mortality statistics lag 12-15 months
• A significant amount of the information reported is also collected as part of medical care (the medical record) – but the certificate and medical record are often contradictory and not equivalent!
• Registration is mostly a manual process even today.

Electronic Birth Registration March 2011
http://www.naphsis.org/index.asp?bid=980

Electronic Death Registration in the US Today
http://www.naphsis.org/index.asp?bid=980

Death Registration in California Today
• In 2005, California implemented an electronic death registration system
• Today, 99.8% of all deaths are registered electronically in CA-EDRS
• The system contains death certificate data for over 2.1 million deaths since 2005.

Example: Immunization Registry
http://cairweb.org/

Immunization Information Systems
• What are they?– Confidential, population-based, computerized
information systems that attempt to collect vaccination data about all residents within a geographic area
• Advantages of IIS:– Significantly reduces paperwork and staff time for
schools, doctors, public health
– Assists in reminding parents of needed immunizations
– Allows public health to monitor immunizations
http://www.cdc.gov/vaccines/programs/iis/faq.htm

Example: State Cancer Registry
http://www.ccrcal.org/

SEER -– Cancer Registry Data
• Surveillance Epidemiology and End Results (SEER)
• Since 1973, an national cancer registry run by the National Cancer Institute
• Collects and publishes cancer incidence and survival data
• Derives data from a set of local cancer registries covering 26% of the population
• NCI staff work with the North American Association of Central Cancer Registries (NAACCR) to develop guidelines on the data to be collected

National Health Information Network
• NHIN should “be a decentralized architecture built using the Internet linked by uniform communications and a software framework of open standards and policies”
• 2005: ONC awards contracts to develop prototype architectures
• 2006: Executive order requires federal agencies dealing with health information to adhere to national interoperability standards
• 2008: ONC announced NHIN CONNECT with 20 federal agencies being interconnected on “the NHIN”

NHIN → HealtheWay

GEOGRAPHIC INFORMATION SYSTEMS: AN OVERVIEW

What is GIS?
“Geographic Information Systems (GIS) are computer based systems for the integration and analysis of geographic data”
Cromley and McLafferty. GIS and Public Health.2002. Guilford Press
http://www.cdc.gov/gis/mg_age_adj_98_01.htm

Key Functions of a GIS System
• Ability to store or compute and display spatial relationships between objects on a digital map
• Ability to store attributes of those objects
• Ability to analyze spatial and attribute data in addition to managing and retrieving data
• Ability to integrate spatial data from different resources
Goodchild, MF. GIS and geographic research. In J. Picles (Ed.), Ground truth: The SocialImplications of geographic information systems (pp31-50). New York. Guilford Press. 1995

GIS Layers
• GIS systems typically store information about the world in layers
• Each layer has additional geospatial objects
• One can add/remove layers in a GIS system
• As layers are added, a picture of the real world emerges
http://www.rockvillemd.gov/gis/

GIS Data and Image Basics
• Ways GIS systems represent geospatial objects– Vector Data
• geometric approximations of objects on the earth
• Objects are described by their type, and their geometric shape
• The GIS system uses this information to ‘draw’ the objects with correct proportions and geographic orientation
– Raster Data• Data is stored in as individual pixels, which individually carry
color and position information
• Provides more of a ‘real world’ view – looks like a satellite photograph

Vector Data
• Vector data provides a way of representing real world features in terms of their geometry– “a sketch” of the real feature
• Vector data includes geospatial attributes that describe the feature
• The geometry– Made up of one or more vertices
– A vertex describes a position in space using an x,ycoordinate system

Types of Vector Geospatial Objects
• Vector point
– Consists of a single vertex
– A single point on the map
• Polyline
– Consists of two or more vertices with the first and last vertices not being the same
• Polygon
– Four or more vertices are present
– Last vertex is the same as the first (closed the loop)

Vector Object Types
T. Sutton, O. Dassau, M. Sutton. A Gentle Introduction to GIS. Dept of Land Affairs. Eastern Cape, South Africa.

Vector Layers
Vector map with road Road layer only
T. Sutton, O. Dassau, M. Sutton. A Gentle Introduction to GIS. Dept of Land Affairs. Eastern Cape, South Africa.

Adding data attributes to vector objects
• Vector object data comes in two types: – (1) geospatial data about the object
– (2) additional data related to the object
• This is the “secret sauce” of GIS – it is a geospatial *database*– Allows for a broad variety of analyses regarding
geospatial objects and attribute data such as disease conditions, etc..
– Allows for map-based visualization of disease patterns or other information

Combining geospatial and disease data
Geospatialdata
Other data relatedto the object
T. Sutton, O. Dassau, M. Sutton. A Gentle Introduction to GIS. Dept of Land Affairs. Eastern Cape, South Africa.

Geospatial Objects and their Data

Raster Data
• Raster data is used when information is contiguous across an area and is not easily divided into vector features
• Raster data set is composed of rows and columns of pixels, with the value in the pixel representing some characteristic (snow level, temperature, depth, etc..)
T. Sutton, O. Dassau, M. Sutton. A Gentle Introduction to GIS. Dept of Land Affairs. Eastern Cape, South Africa.
Sacramento Area Raster image: created with Google Earth

Raster Data
• Provides for analysis that cannot be done easily with vector data– Water flow over land to
calculate watersheds
– Identification of areas where plants are growing poorly
– Areas of deforestation
– Areas under risk of flooding

PUBLIC HEALTH SURVEILLANCE SYSTEMS
MPH210

What is surveillance?
“the ongoing systematic collection, analysis, and interpretation of outcome-specific data for use in planning, implementation, and evaluation of public health practice”
Thacker SB, Berkelman RL. Public health surveillance system in the United States. Epidemiol Rev. 1988; 10:164-190

Disease Surveillance – the basics
• Disease surveillance is a critical function in public health
• Several types of surveillance systems
– Sentinel surveillance systems•Collect/analyze data from a select group of institutions
– Household surveys
•Population based, monitoring of a disease/condition
– Laboratory-based surveillance•Reporting the genetic variability of an agent
– Integrated disease surveillance and response
•Use data from health facilities, labs, etc...
•Monitor communicable diseases

National Notifiable Disease Surveillance System: A History
• 1878: Congress authorizes the US Marine Hospital Service to collect morbidity reports on cholera, smallpox, plague, and yellow fever from US consuls overseas.
• 1893: Expanded to include data from states for this list of “notifiable diseases”
• 1912: state and public health service begin reporting
– 5 diseases by telegraph
– 10 diseases by letter

CDC Notifiable Diseases
http://www.cdc.gov/mmwr/PDF/wk/mm5853.pdf

CDC Surveillance Systems and Programs
• CDC has over 30 surveillance programs and systems
• Here are some examples
– 121 cities mortality reporting system
– Active Bacterial Core Surveillance
– Border Infectious Disease Surveillance Project
– Foodborne Diseases Active Surveillance Network (Foodnet)
– Waterborne-Disease Outbreak Surveillance System
– Public Health Laboratory Information System (PHLIS)

Categorizing Surveillance Systems
• Rapid (Early) Recognition Disease Surveillance
– Surveillance for a disease that demands early detection and fast countermeasures to avoid high mortality“
– Premium placed on early detection – tapping data streams for a pattern that we believe means disease *outbreak* (the signal)
– Typically need immediate input from multiple disparate data sources that are associated with behavior or actions typically occurring because of the outbreak
– Informatics impact: Access to absenteeism data, over-the-counter medications for “the cold”, clinical encounter types, patient ‘complaints’ (symptoms –syndromic surveillance).
• Exposure/Disease Monitoring Surveillance System
– Surveillance for a disease that results from prolonged exposure to causal factors
– Premium placed on understanding the association of a causal factor with the disease
– Typically need long term longitudinal data for causal factors
– Example: Cancer Registries
– Informatics impact: Access to longitudinal data (clinical encounters, cumulative CT radiation dose, etc..)

Early Recognition Surveillance
• Goals: Reduce the number of cases of a disease by– Rapid administration of prophylaxis: administering
the most effective prophylaxis (if it exists) to the right people in the quickest way possible
– Enable “social distancing” to reduce the spread of the disease
• Systems typically built to tap multiple types of information, including chief complaints in the ED (“syndromic surveillance)

Why is Early Recognition surveillance so important?
• We live in a time of rapid travel between large urban areas – perfect conditions for a killer communicable disease
• 2009 H1N1 Influenza A pandemic had a mortality rate of only 0.01% (1 in 10,000) yet it killed 14,000 worldwide in a few months...
61 million infected

The big threat....a viral pandemic
• 1918 Influenza pandemic– 20% fatality rate– 50 million died (3% of the
world population of 1.86 billion)
• Avian flu (H5N1)– H5N1 has a 60% fatality rate
(three times that of 1918 virus)– So, 3x3%=9% of 7 billion
630 million deaths worldwide....
– Wild type Avian Flu, so far, has not demonstrated the ability to have airborne spread, but......• Dec 2011 - Dr. Fouchier of
Erasmus Medical Center modified H5N1 (avian flu) such that it gained the ability to latch onto cells in the respiratory passage ways (making it airborne).
http://en.wikipedia.org/wiki/1918_flu_pandemic
http://en.wikipedia.org/wiki/Human_mortality_from_H5N1
http://en.wikipedia.org/wiki/File:Colorized_transmission_electron_micrograph_of_Avian_influenza_A_H5N1_viruses.jpg
H5N1 - electron micrograph1918 pandemic victim


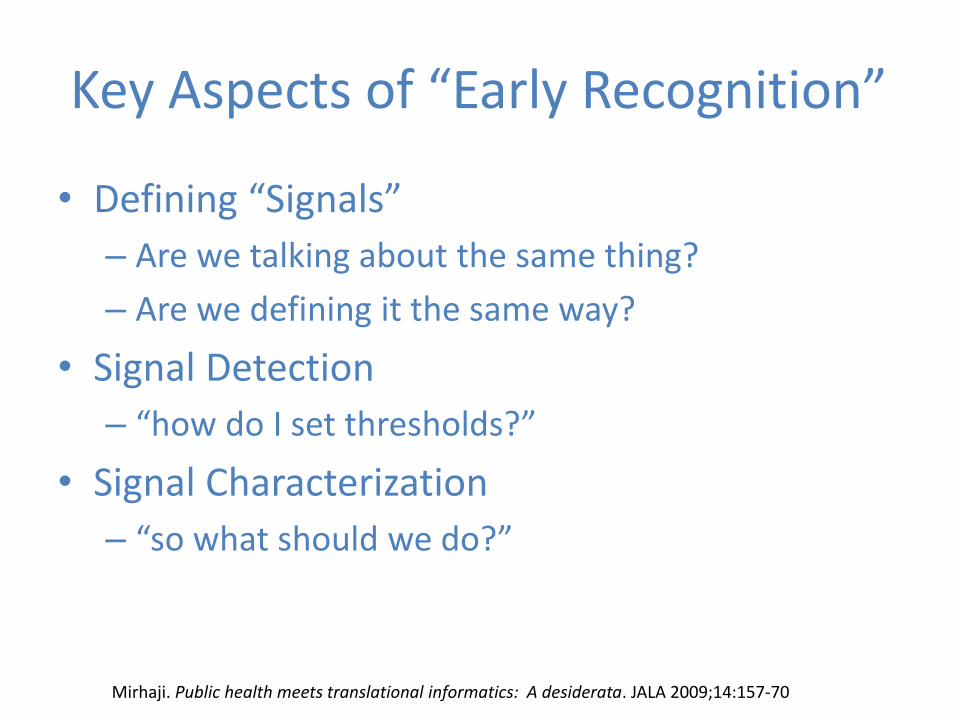
Key Aspects of “Early Recognition”
• Defining “Signals”
– Are we talking about the same thing?
– Are we defining it the same way?
• Signal Detection
– “how do I set thresholds?”
• Signal Characterization
– “so what should we do?”
Mirhaji. Public health meets translational informatics: A desiderata. JALA 2009;14:157-70

Examples of Early Recognition Surveillance
• Pneumonia and Influenza Mortality Surveillance– 122 cities, vital statistics offices report total number of death
certificates received and the number for which pneumonia or influenza was listed as the underlying cause or a contributing cause to the death
• ILINet– 3,000 healthcare providers (The US Influenza Sentinel Provider
Surveillance Network) across all 50 states, DC, territories reporting Influenza Like Illness cases from over 30 million patient visits annually
• Foodnet– Surveillance on campylobacter, cryptosporidium, cyclospora, Listeria,
Salmonella, Toxin producing E-Coli, Shigella, Vibrio Cholera, Yersinia diagnosed by laboratory testing of samples from patients
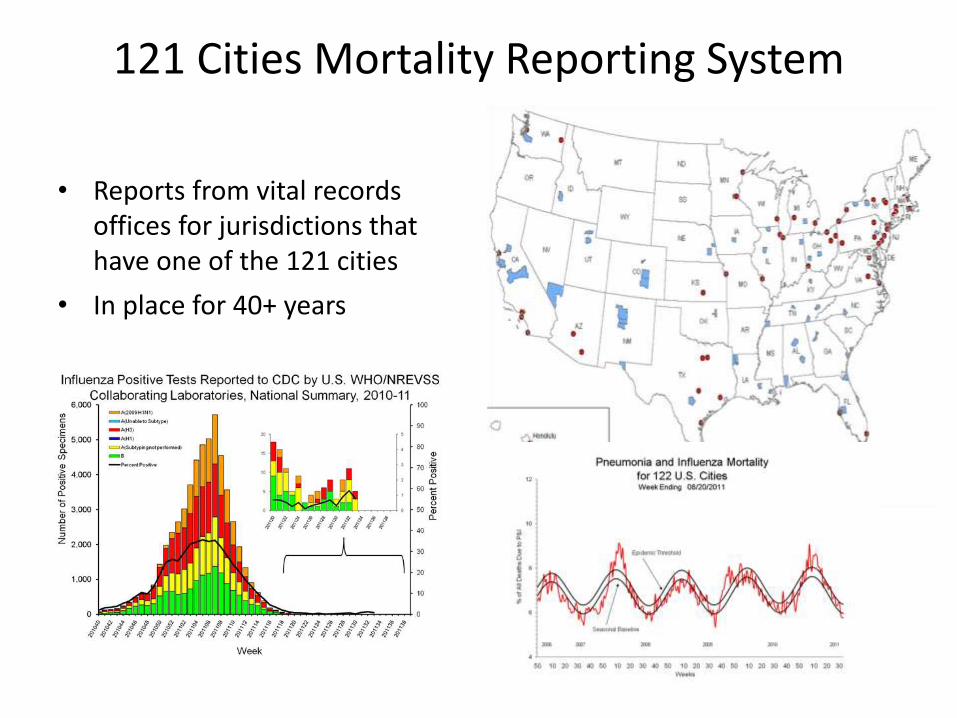
121 Cities Mortality Reporting System
• Reports from vital records offices for jurisdictions that have one of the 121 cities
• In place for 40+ years

Sentinel Provider Network (ILINet)
• Interested providers (hospitals, doctors, nurse practitioners) and enroll them into the CDC sentinel provider network
• Goal - one reporting sentinel provider for every 250,000 residents
• Smaller states – minimum of 10 sentinel providers
• Sentinel Provider– Any specialty (nursing homes, prisons do not
participate)
– ILI Case Definition: fever >100F and cough or sore throat
– Data collection: summary data each week, total patients, age groups
– Collection of respiratory specimens sent to state lab
• 12 million patients visits per year

The CDC’s FluView• A weekly influenza surveillance
report• Consolidates 5 sources of
information– rate of influenza positive
specimens (US virologicsurveillance system)
– proportion of deaths attributed to influenza (P&I 122 cities rep)
– pediatric deaths from influenza– Proportion of outpatient visits for
influenza-like illness (from ILINet’sSentinel Network providers)
– State map showing geographic spread of Influenza
• Not very automated.... Requires manual collection and submission of data
http://www.cdc.gov/flu/weekly/index.htm#OISmap

Foodnet

Syndromic Surveillance
• “the ongoing, systematic collection, analysis, interpretation, and application of real-time (or near real time) indicators for diseases and outbreaks that allow for their detection before public health authorities would otherwise note them.”
• Emphasizes– Timeliness of inbound data (real-time)
– Automated analysis
– Visualization tools
Lee, LM editor. Principles and Practice of Public Health Surveillance, 3rd Ed. Oxford Press. 2010

Data Sources and “SyndromicSurveillance” systems
Yan, Chen, Zeng. Syndromic surveillance systems: Public health and biodefense.Ann Rev Inf Science and Technology. Vol 32. 2008

Challenges with ED Encounter Data
• If data is coded– Code mismatch
• The use of different coding systems, or different versions of the same coding system across the various source sites
• If data is not coded (common)– Misspellings: 10-20% of common words are misspelled in
hospital records– Abbreviations: 20% of all words in chief complaints were
nonstandard abbreviations or acronyms– Negatives: “no fever present” can be a challenge to process
correctly (NegEx – an open source negation detection module for clinical natural language processing)
– Extraneous characters: often cause challenges for natural language processing systems in detecting word boundaries and the “part of speech” for the word or phrase (verb, noun, etc..)
Hauentstein, et al. In Disease Surveillance: A Public Health Informatics Approach. Edited by Lombardo J, Buckeridge DL. Wiley Publishers. 2007

BioSense 1.0• National lab test orders
and results
• DoD and VA sentinel
clinical data
• Clinical lab orders
• Advice nurse call line
types
• Lab Response
Network (Biowatch)
• Over-the-counter drug
sales

Visualization

Biosense 2.0

Biosense 2.0

PUBLIC HEALTH DATA STANDARDS
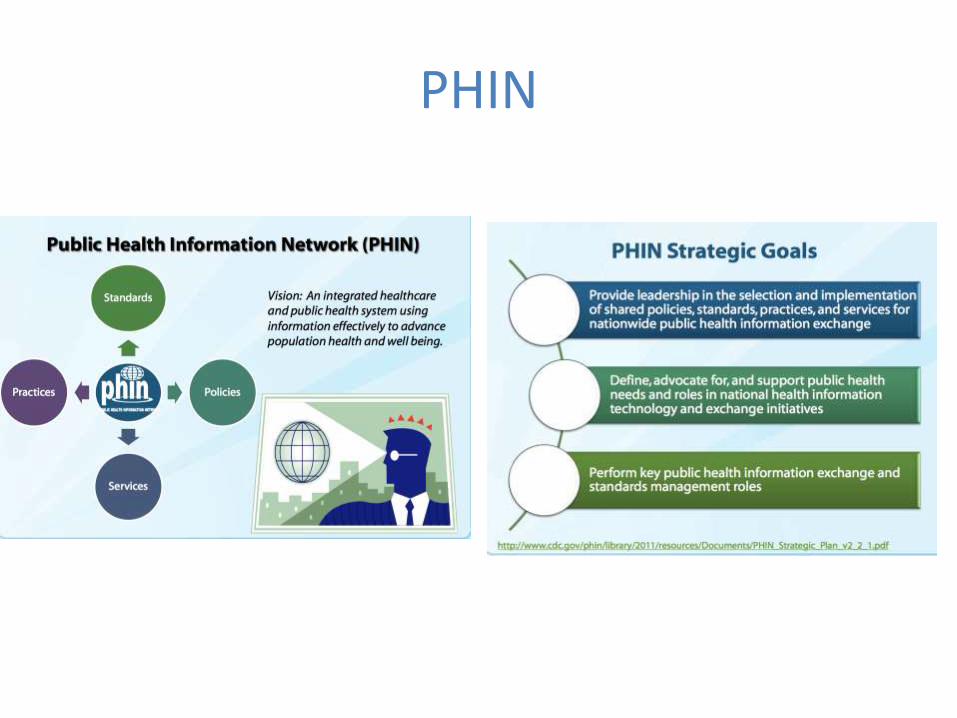
PHIN

Scope of PHIN
5 public health functional areas
1. Detection and monitoring
2. Data analysis
3. Knowledge management
4. Alerting
5. Response
9 IT functions
To support these 5 public health functions, the CDC has developed specifications for nine IT functions:
1. Automated exchange of data between public health partners
2. Use of electronic clinical data for event detection
3. Manual data entry for event detection and management
4. Specimen and lab result information management and exchange
5. Management of possible case, contacts, and threat data
6. Analysis and visualization
7. Directories of public health and clinical personnel
8. Public health information dissemination and alerting
9. IT security and critical infrastructure protection

PHIN Reportable Condition Messages

PHIN Reportable: Tb Notification

Immunizations HL7 Messages
CDC Implementation Guide Message Types Involved
• VXU – unsolicited request immunization record
• VXQ – unsolicited immunization record update
• QBP – Query by parameter
• RSP – Respond to QBP
• ADT – Admit, Discharge, Transfer message
• ACK – Acknowledgement message

Standardizing Lists of Vaccines and Manufacturers
Standard vaccine codes (CVX) Standard manufacturer codes (MVX)
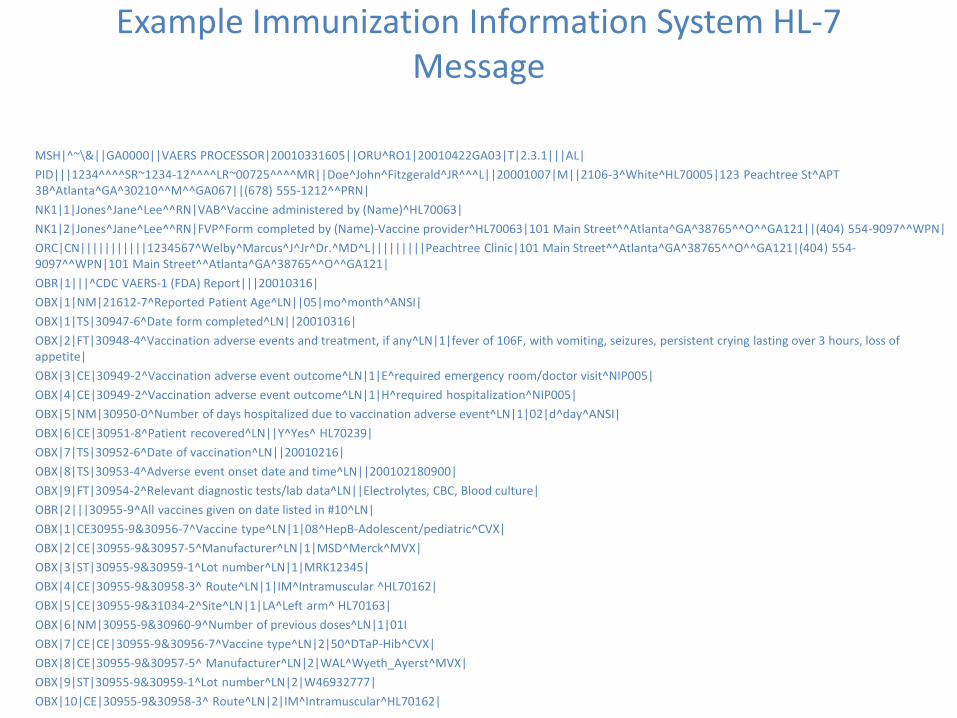
Example Immunization Information System HL-7 Message
MSH|^~\&||GA0000||VAERS PROCESSOR|20010331605||ORU^RO1|20010422GA03|T|2.3.1|||AL|
PID|||1234^^^^SR~1234-12^^^^LR~00725^^^^MR||Doe^John^Fitzgerald^JR^^^L||20001007|M||2106-3^White^HL70005|123 Peachtree St^APT3B^Atlanta^GA^30210^^M^^GA067||(678) 555-1212^^PRN|
NK1|1|Jones^Jane^Lee^^RN|VAB^Vaccine administered by (Name)^HL70063|
NK1|2|Jones^Jane^Lee^^RN|FVP^Form completed by (Name)-Vaccine provider^HL70063|101 Main Street^^Atlanta^GA^38765^^O^^GA121||(404) 554-9097^^WPN|
ORC|CN|||||||||||1234567^Welby^Marcus^J^Jr^Dr.^MD^L|||||||||Peachtree Clinic|101 Main Street^^Atlanta^GA^38765^^O^^GA121|(404) 554-9097^^WPN|101 Main Street^^Atlanta^GA^38765^^O^^GA121|
OBR|1|||^CDC VAERS-1 (FDA) Report|||20010316|
OBX|1|NM|21612-7^Reported Patient Age^LN||05|mo^month^ANSI|
OBX|1|TS|30947-6^Date form completed^LN||20010316|
OBX|2|FT|30948-4^Vaccination adverse events and treatment, if any^LN|1|fever of 106F, with vomiting, seizures, persistent crying lasting over 3 hours, loss of appetite|
OBX|3|CE|30949-2^Vaccination adverse event outcome^LN|1|E^required emergency room/doctor visit^NIP005|
OBX|4|CE|30949-2^Vaccination adverse event outcome^LN|1|H^required hospitalization^NIP005|
OBX|5|NM|30950-0^Number of days hospitalized due to vaccination adverse event^LN|1|02|d^day^ANSI|
OBX|6|CE|30951-8^Patient recovered^LN||Y^Yes^ HL70239|
OBX|7|TS|30952-6^Date of vaccination^LN||20010216|
OBX|8|TS|30953-4^Adverse event onset date and time^LN||200102180900|
OBX|9|FT|30954-2^Relevant diagnostic tests/lab data^LN||Electrolytes, CBC, Blood culture|
OBR|2|||30955-9^All vaccines given on date listed in #10^LN|
OBX|1|CE30955-9&30956-7^Vaccine type^LN|1|08^HepB-Adolescent/pediatric^CVX|
OBX|2|CE|30955-9&30957-5^Manufacturer^LN|1|MSD^Merck^MVX|
OBX|3|ST|30955-9&30959-1^Lot number^LN|1|MRK12345|
OBX|4|CE|30955-9&30958-3^ Route^LN|1|IM^Intramuscular ^HL70162|
OBX|5|CE|30955-9&31034-2^Site^LN|1|LA^Left arm^ HL70163|
OBX|6|NM|30955-9&30960-9^Number of previous doses^LN|1|01I
OBX|7|CE|CE|30955-9&30956-7^Vaccine type^LN|2|50^DTaP-Hib^CVX|
OBX|8|CE|30955-9&30957-5^ Manufacturer^LN|2|WAL^Wyeth_Ayerst^MVX|
OBX|9|ST|30955-9&30959-1^Lot number^LN|2|W46932777|
OBX|10|CE|30955-9&30958-3^ Route^LN|2|IM^Intramuscular^HL70162|

Electronic Laboratory Reporting (ELR)

CODING AND CLASSIFICATION SYSTEMS IN PUBLIC HEALTH

Death Certificates - ICD
• Causes of Death are coded using the International Classification of Disease, 10th edition (ICD-10)
• ACME – Automated Classification of Medical Entities
– Developed to improve consistency
– Developed with experienced nosologists
– SuperMICAR: a software system that automates the classification and allows the use of literal text from the death certificate• Used today to expedite the coding of causes of death on certificate
information submitted by states to the National Center for Health Statistics (NCHS).

PHIN - VADS
• A one-stop shop for obtaining vocabularies related to public health
• Main purpose is to distribute value sets developed by the CDC for use in v2.x and CDA messages in public health
• 592 value sets supporting 60 HL7 and CDA message implementation guides
• Value sets are function specific and derived from a number of vocabularies (LOINC, SNOMED, CPT, ICD, etc..)

VADS Microorganism Value Set

What’s next?

ICD-11 by 2017(18months after US implements ICD-10)

ICD 11
• Foundation = ICD Concepts• Linearization=A specific list for a
particular Purpose (primary care, cause of death, etc...)