Public Health and Ecological Forecasting Ben Zaitchik Johns Hopkins University.
27
Public Health and Ecological Forecasting Ben Zaitchik Johns Hopkins University
-
Upload
kelly-hodges -
Category
Documents
-
view
217 -
download
2
Transcript of Public Health and Ecological Forecasting Ben Zaitchik Johns Hopkins University.

Public Health and Ecological ForecastingBen ZaitchikJohns Hopkins University

Four Thoughts These are highly mediated and often
multi-scale systems Models have a strong empirical
component In many cases, processes of interest
unfold over weeks, months or years Data accessibility and
communication are critical
Four Thoughts These are highly mediated and often
multi-scale systems Models have a strong empirical
component In many cases, processes of interest
unfold over weeks, months or years Data accessibility and
communication are critical

Anopheles darlingi is the
dominant malaria vector in the Peruvian
Amazon
Symptoms (e.g., fever, chills, etc.) appear ~5-10 days after being bitten by
an infected mosquito.
Biting rates are influenced by both
climate and land cover
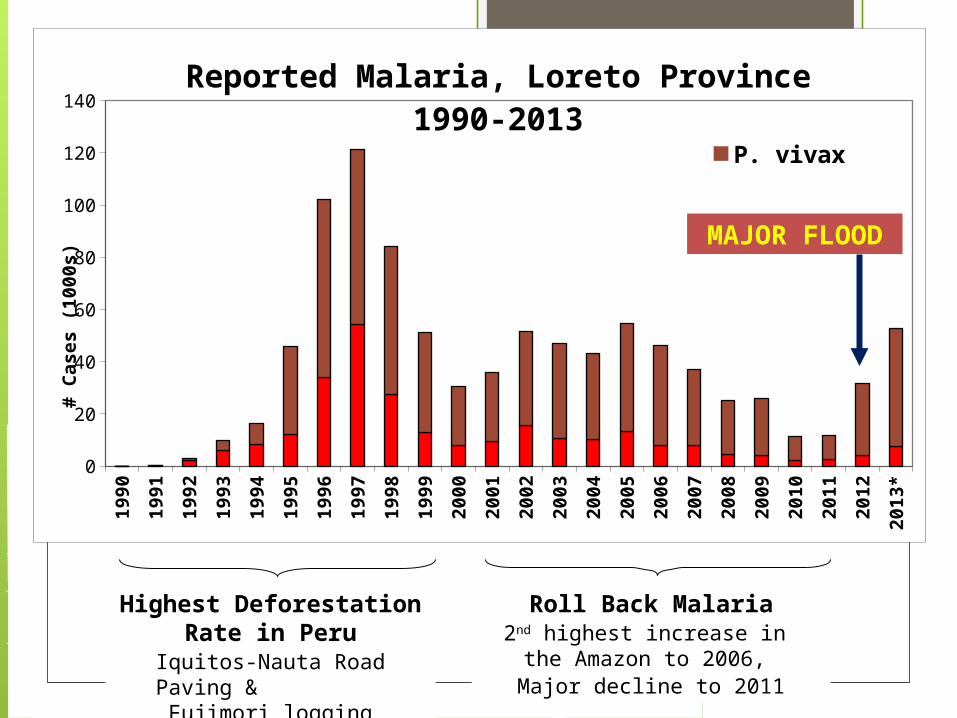
Highest Deforestation Rate in Peru
Iquitos-Nauta Road Paving & Fujimori logging concessions
19
90
19
91
19
92
19
93
19
94
19
95
19
96
19
97
19
98
19
99
20
00
20
01
20
02
20
03
20
04
20
05
20
06
20
07
20
08
20
09
20
10
20
11
20
12
20
13
*0
20
40
60
80
100
120
140Reported Malaria, Loreto Province 1990-2013
P. vivaxP. falciparum
# C
as
es
(1
00
0s
) MAJOR FLOOD
Roll Back Malaria2nd highest increase in the Amazon
to 2006, Major decline to 2011
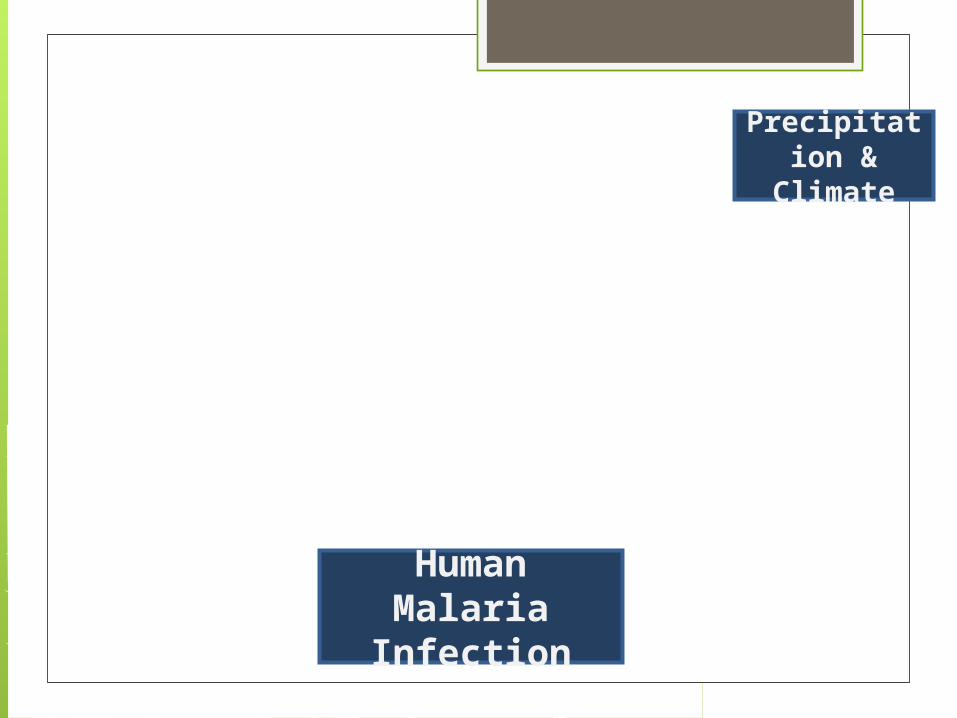
Human Malaria
Infection
Precipitation &
Climate

Land Use
Density of Anopheles
Adults
Anopheles Larva Habitat
Human Malaria
Infection
Precipitation &
Climate

Land Use
Density of Anopheles
Adults
Infrastructure
Migration, Colonization,
and Agriculture
Human Exposure
Anopheles Larva Habitat
Human Malaria
Infection
Precipitation &
Climate

Iquitos
Local Scale
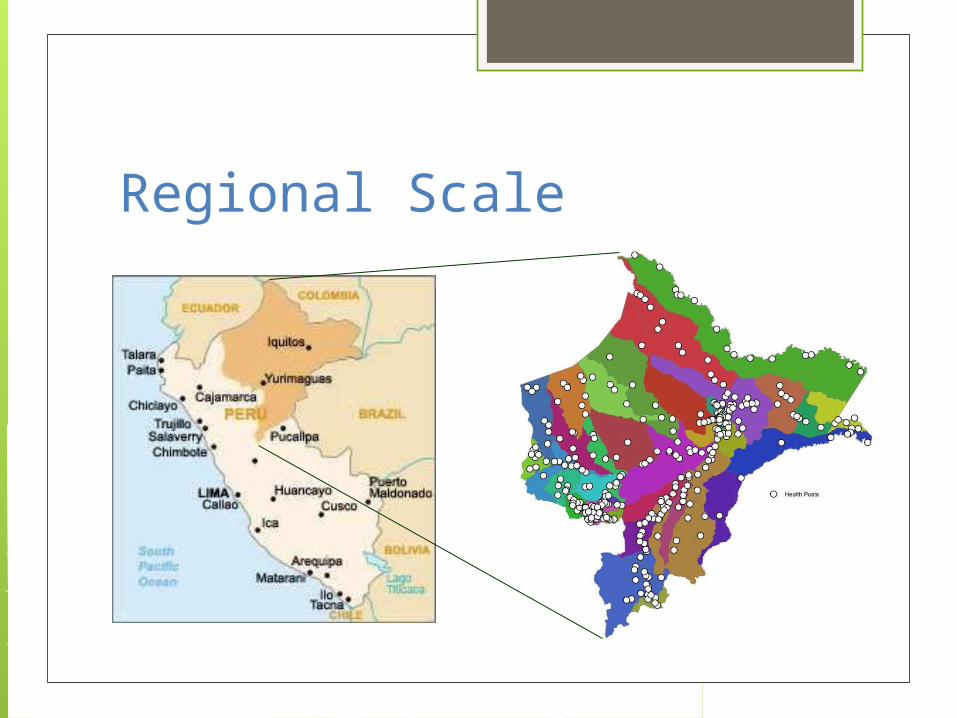
Regional Scale

Local: Predict Breeding Sites
Tmin
[5 day]
Rain[1 day]
SWnet
[1 day] SWnet
[5 day]
SoilMoisture[5 day]
Land Cover Variables
Denis Valle, Univ. of Florida
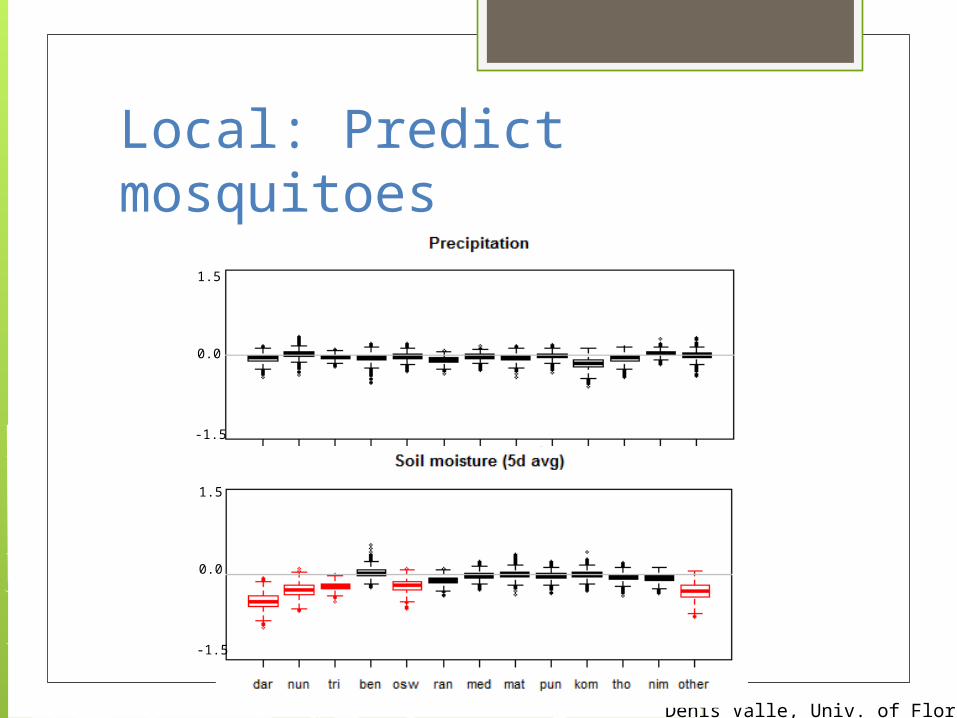
Local: Predict mosquitoes1.5
-1.5
0.0
Denis Valle, Univ. of Florida
1.5
-1.5
0.0
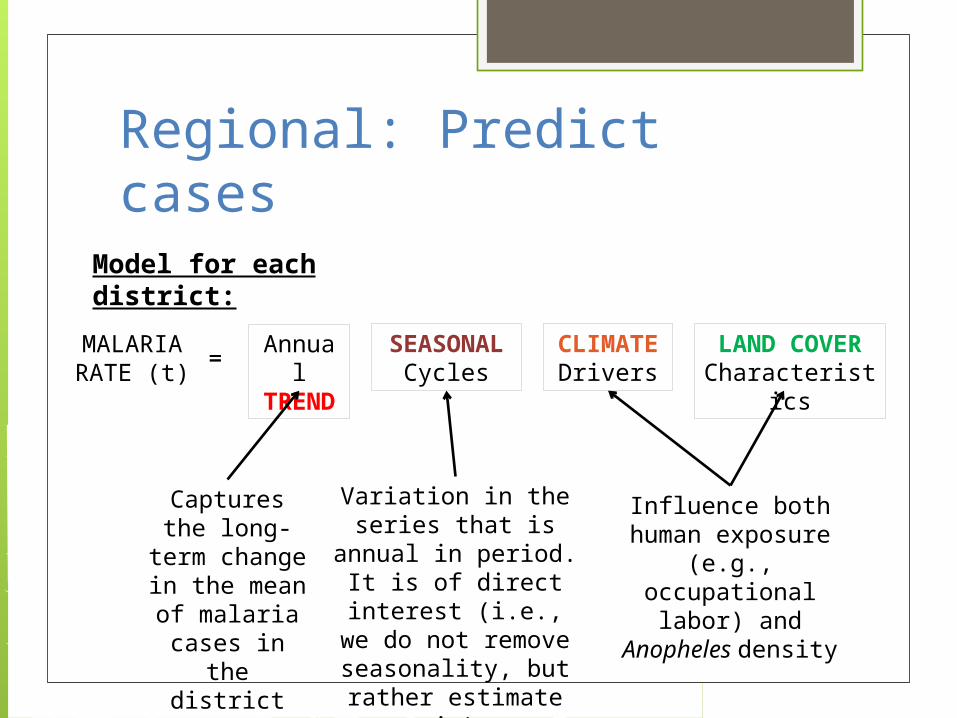
Regional: Predict casesModel for each district:
MALARIA RATE (t)
Annual
TREND
SEASONAL Cycles
CLIMATE Drivers
LAND COVER Characteristic
s
==
Captures the long-term
change in the mean of
malaria cases in the district
Variation in the series that is annual
in period. It is of direct interest (i.e., we do not remove seasonality, but
rather estimate it)
Influence both human exposure
(e.g., occupational labor) and
Anopheles density

Regional: Predict casesModel for each district:
MALARIA RATE (t)
Annual
TREND
SEASONAL Cycles
CLIMATE Drivers
LAND COVER Characteristic
s
==
TMPA rain rate is positively associated with
case count
Precipitation is negatively associated with vectors at local scale but positively associated with clinical cases at
district scale

Four Thoughts These are highly mediated and often
multi-scale systems Models have a strong empirical
component In many cases, processes of interest
unfold over weeks, months or years Data accessibility and
communication are critical

Thresholds of Rainfall, Temperature, and Humidity
Logistic Regression with multiple climate variables

Empirical The good news: in some applications
consistency may be as important as accuracy
The bad news: some forecasts are sensitive to thresholds and nonlinear responses

Four Thoughts These are highly mediated and often
multi-scale systems Models have a strong empirical
component In many cases, processes of interest
unfold over weeks, months or years Data accessibility and
communication are critical
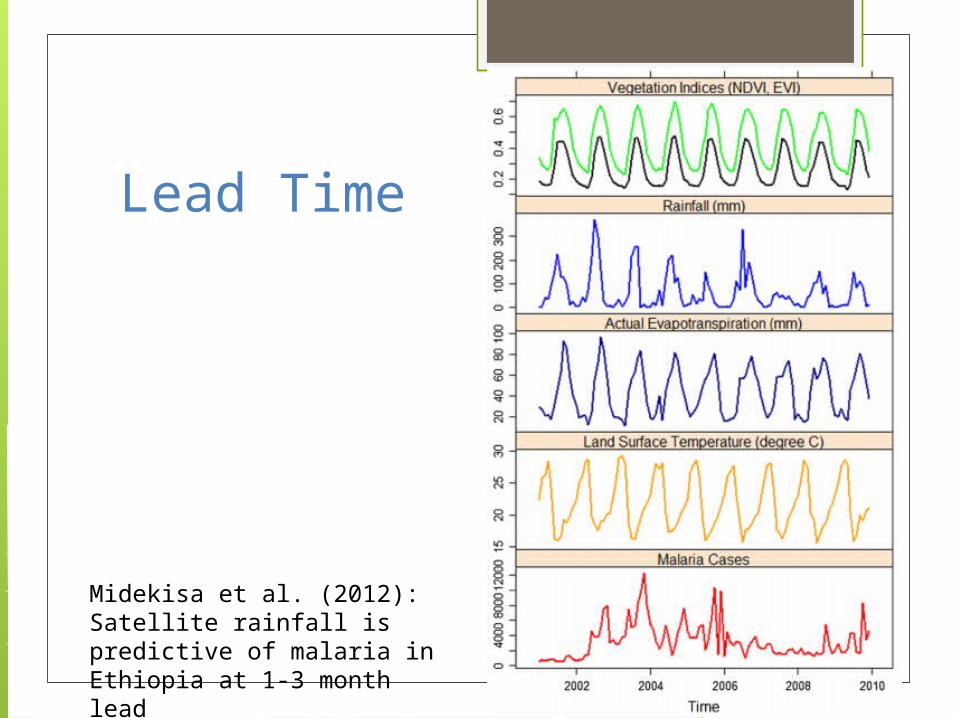
Lead Time
Midekisa et al. (2012): Satellite rainfall is predictive of malaria in Ethiopia at 1-3 month lead

Lead Time Murray Valley Encephalitis Virus (MVEV) in Australia
has been predicted using TRMM at 2-month lead In our Amazon malaria risk model, satellite rainfall
rate is most predictive at 10 week lead. Rift Valley Fever warnings in East Africa make use
of satellite observations integrated over 3-months.
For hantavirus, seasonal rainfall anomalies can influence cases two or more years later.
Cholera dynamics have been related to precipitation at lead times from days to seasons.

Lead Time The good news: we can use satellite
rainfall observations to generate actionable forecasts.
The so-so news: many of these forecast horizons fall in between RT and research grade TRMM and GPM products.
Four Thoughts These are highly mediated and often
multi-scale systems Models have a strong empirical
component In many cases, processes of interest
unfold over weeks, months or years Data accessibility and
communication are critical

Data Accessibility Smooth web access, simple product
descriptions, and GIS compatibility are critical for this research community
The merged precipitation estimates are most widely used, but other products could also be valuable

Data Accessibility

Communication with users However, with accessibility comes
risk! We want to facilitate appropriate
interpretation and application of all GPM data products

Four Thoughts These are highly mediated and often
multi-scale systems Models have a strong empirical
component In many cases, processes of interest
unfold over weeks, months or years Data accessibility and
communication are critical

Thank you


![THE The JOHNS HOPKINS CLUB Events JOHNS HOPKINS … [4].pdf · Club Herald July / August 2015 Events THE The JOHNS HOPKINS CLUB JOHNS HOPKINS UNIVERSITY 3400 North Charles Street,](https://static.fdocuments.in/doc/165x107/5fae1ad08ad8816d2e1aaabe/the-the-johns-hopkins-club-events-johns-hopkins-4pdf-club-herald-july-august.jpg)