Public Environmental Review - EPA WA | EPA Western … Reef Marina Public Environmental Review...
57
November 2016 Prepared for City of Joondalup by Public Environmental Review Appendix 5: Peer Review Reports
Transcript of Public Environmental Review - EPA WA | EPA Western … Reef Marina Public Environmental Review...

November 2016
Prepared for City of Joondalup by
Public Environmental Review
Appendix 5: Peer Review Reports
Ocean Reef Marina Public Environmental Review Appendix 5
Appendix 5 Peer review reports list
November 2016
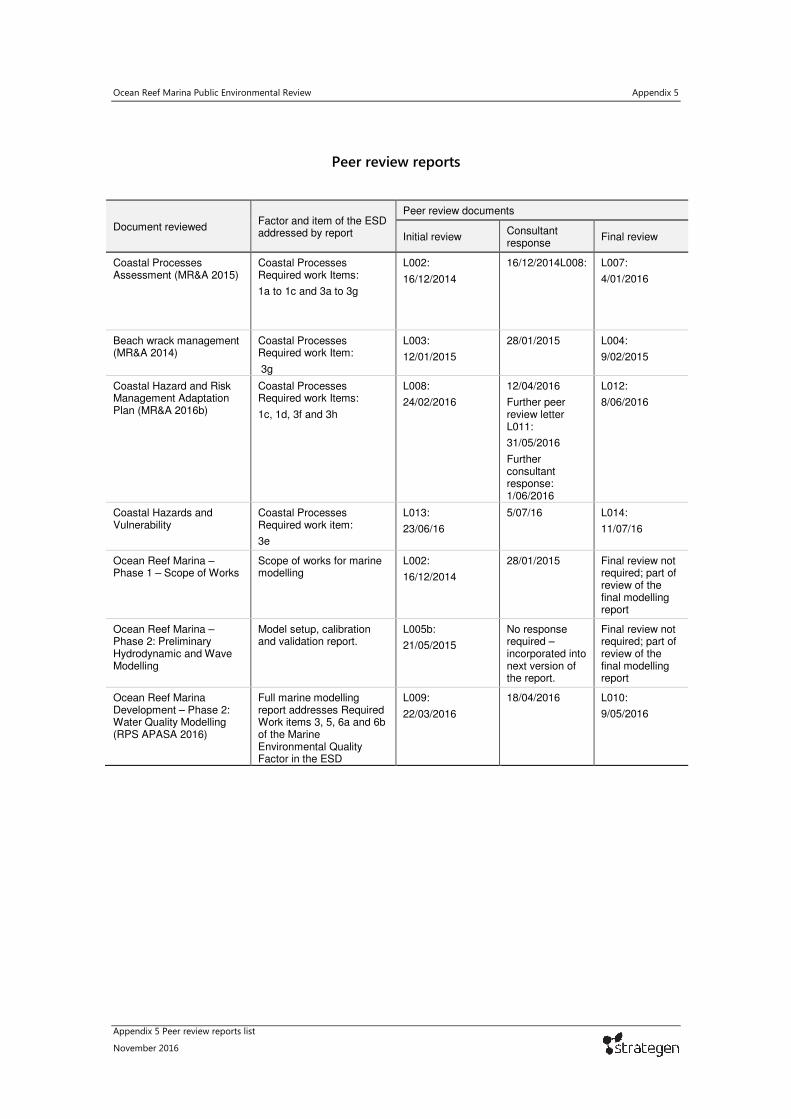
Peer review reports
Document reviewed Factor and item of the ESD addressed by report
Peer review documents
Initial review Consultant response
Final review
Coastal Processes Assessment (MR&A 2015)
Coastal Processes Required work Items:
1a to 1c and 3a to 3g
L002:
16/12/2014
16/12/2014L008: L007:
4/01/2016
Beach wrack management (MR&A 2014)
Coastal Processes Required work Item:
3g
L003:
12/01/2015
28/01/2015 L004:
9/02/2015
Coastal Hazard and Risk Management Adaptation Plan (MR&A 2016b)
Coastal Processes Required work Items:
1c, 1d, 3f and 3h
L008:
24/02/2016
12/04/2016
Further peer review letter L011:
31/05/2016
Further consultant response: 1/06/2016
L012:
8/06/2016
Coastal Hazards and Vulnerability
Coastal Processes Required work item:
3e
L013:
23/06/16
5/07/16 L014:
11/07/16
Ocean Reef Marina – Phase 1 – Scope of Works
Scope of works for marine modelling
L002:
16/12/2014
28/01/2015 Final review not required; part of review of the final modelling report
Ocean Reef Marina – Phase 2: Preliminary Hydrodynamic and Wave Modelling
Model setup, calibration and validation report.
L005b:
21/05/2015
No response required – incorporated into next version of the report.
Final review not required; part of review of the final modelling report
Ocean Reef Marina Development – Phase 2: Water Quality Modelling (RPS APASA 2016)
Full marine modelling report addresses Required Work items 3, 5, 6a and 6b of the Marine Environmental Quality Factor in the ESD
L009:
22/03/2016
18/04/2016 L010:
9/05/2016

Australia ● Belgium ● Canada ● Colombia ● Ecuador ● Germany ● Indonesia ● Kenya ● New Zealand ● Nigeria ● Papua New Guinea ● Peru ● Philippines ● Singapore ● United Arab Emirates ● United Kingdom ● United States ● Operations in over 100 countries
N:\2014\COJ\COJ14177.00 ORM ESD and PER\Deliverables\R001\App\Appendix 5 Peer Review Reports\L002 Model Scope of works and Coastal Processes Initial review.docx
Cardno (NSW/ACT) Pty Ltd
ABN 95 001 145 035
Level 9, The Forum
203 Pacific Highway
St Leonards New South Wales 2065
PO Box 19
St Leonards New South Wales 1590
Australia
Telephone: 02 9496 7700
Facsimile: 02 9439 5170
International: +61 2 9496 7700
Web: www.cardno.com.au
Our Ref 59915082/L002 :sge
Contact P.D. Treloar
16 December 2014
City of Joondalup PO Box 21 JOONDALUP WA 6919
Attention: Genevieve Hunter Cc: Lisa Adams - Strategen
Dear Genevieve,
OCEAN REEF MARINA - REVIEW OF MRA REPORT
Preamble
Acting upon your instructions, and considering the Environmental Scoping Document prepared by the Environmental Protection Authority for Public Environmental Review, I have reviewed the MP Rogers & Associates PL Report R519 Rev 0 entitled “Ocean Reef Marina, Coastal Processes Assessment’ dated August 2014, together with the APASA report entitled ‘Ocean Reef Marina, Phase I: Scope of Works, dated 1 December 2014. Background information for this project is provided in MP Rogers PL report, R307 Rev 0 entitled ‘Ocean Reef Marina – Concept 7.2 Water Quality Investigations’, dated October 2011. That report includes documents:-
Appendix A Rockwater Groundwater Modelling Report, June 2011 Appendix B Asia Pacific ASA Hydrodynamics & Water Quality Modelling
Report, Rev0 – 19 September 2011
This review has focussed on the 2014 reports, but has kept the previous reports in mind to provide context and historical perspective.
MP Rogers Report
This report has been prepared in a logical manner with some detail. The reviewer has the following comments and questions. These comments are general at first and then specific.
Review Comments
The reviewer believes that Figure 1.1 would be enhanced by including an outline of the existing marina.
Section 1.3 – a plan view indicating all of the beaches and features described in this section would assist many future readers.
Page 4, second sentence – perhaps elaborate on ‘more sheltered’, by reefs/islands? Is there documented evidence/beach profile data that describes the along coast variation in beach width fluctuations mentioned in this paragraph.

59915082/L002 2 20 June 2016
N:\2014\COJ\COJ14177.00 ORM ESD and PER\Deliverables\R001\App\Appendix 5 Peer Review Reports\L002 Model Scope of works and Coastal Processes Initial review.docx
Figure 2.2 seems to cut off some of the cell details. How reliable are these cell definitions, given the comments in the last paragraph of Section 2.2 on page 9 about the cell boundaries near Ocean Reef being located on sandy shorelines?
Section 2.3 – there appears to be no detail about how shoreline movements were measured. Was it a vegetation line or based on a contour developed using photogrammetric methods? Were these changes based on the same month each year, given the seasonal variation in sediment transport direction? Some comment on the effects of onshore/offshore sediment transport caused profile change on the longshore transport rates would be helpful. There doesn’t seem to be any information describing the frequency of profile data and hence the potential resolution of seasonal variations.
Figure 2.3 – In what depth is the ‘Incident Wave Height’ determined and what parameter is D2? Is it a stable sediment parameter? Does closure depth vary much along the study area shoreline?
Page 11, last sentence. Does the ‘analysis’ indicate whether this sediment influx to the marina is caused by northward or southward transport, that is, does it occur mainly during summer or winter, or from both? Moreover, what has been adopted as the summer and winter periods?
Page 11, main paragraph. Where it is written that the range of transport rates is from 30,000 to 60,000m3/season, is it meant to be the range of results determined from one year to the next, say? Or is this a north versus south range? Does the same range apply to summer and winter transport? These numbers are much bigger than those that appear on Figure 2.5.
Page 14 – Where the report says that ‘approximately (net) 7,000m3 of sediment is transported to the
north past the Ocean Reef Boat Harbour each year’, it actually doesn’t go ‘past’ ≈ 4,000m3/year accumulating within the marina. This accumulation might occur during the summer?
Section 3
• How have sea and swell been separated? Or ‘typical events’ been defined.
• Have any wave caused near shore currents been plotted to see how irregular they are in time andspace? Was there any smoothing of the seabed required to obtain realistic wave driven currents?
Page 17 describes these investigations as preliminary, yet Section 6 does not seem to refer to a next stage?
Section 3.2.1 – Please discuss model calibration in terms of bed friction, input directional spread and breaking wave index. The report does not provide much information on this matter. The calibration point is in a depth of about 8m and wave breaking occurs more shoreward; where the longshore currents are generated. The breaking wave index will therefore affect longshore transport?
Figure 3.4 shows a winter calibration period. Was there a summer calibration period (or is it warranted because of the sea breezes being difficult to model?) It is not clear whether the roses shown in Figure 3.5 are only for the June to July 2011 calibration period, all data or a mixture – all measured, modelled calibration period, for example?
Was SWAN run as a series of steady-state steps or in dynamic mode? Tide was included, but it will have taken some time for waves to travel from Rottnest Island to the inshore buoy, where depth is more important, albeit tide range is not high. Hence the tide will have changed over the propagation time – any comment, please?
Section 3.3
Please comment on calibration to the ‘Concept Design’ derived data, when that data is only + 50% accurate. See earlier comment on wave-caused near shore currents. This reviewer believes that some plan plots of sediment transport, bed and suspended loads (separated), as well as some shore normal profile plots of these variables would help to describe the distribution and character of the longshore transport near points of interest.

59915082/L002 3 20 June 2016
N:\2014\COJ\COJ14177.00 ORM ESD and PER\Deliverables\R001\App\Appendix 5 Peer Review Reports\L002 Model Scope of works and Coastal Processes Initial review.docx
The title of this section includes ‘shoreline evolution’. There does not appear to be any results for this process? Will there be some in a next phase? How was sediment influx to the existing marina handled? Or was it not? Some information is needed. Section 4.1 – How were the four events selected? Were those four periods the only periods modelled? Or was the whole year modelled? What about the annual 2008 and 2010 data sets selected on page 17? Figure 4.1 – Is this a wind only case? How was Rottnest Island boundary data used for this case? Figure 4.2 – Please comment on the suitability/effects of applying Rottnest Island data along the whole offshore boundary? Figures 4.1 to 4.8 could include a zoom-in to the Ocean Reef marinas. That is the only area where waves will be changed and no detail can really be gleaned from these figures at the plotted scales. Section 4.1.2 – It is agreed that change in longshore transport obstruction would not change materially with the construction of the new marina. I am not so sure that the plan shape of the new marina has much to do with it. Is it possible to prepare wave vector difference plots for an area zoomed-in to the marinas? It is my understanding that it is not possible/realistic to model sediment influx to the marinas. Please comment. It is possible that the smaller entrance of the new marina, also located further offshore, might reduce sediment influx. Section 4.2.1 – Has the whole of 2008 been modelled? Or just four ‘events’? Para, 4 ‘. . . model is slightly under predicting the total volume of sediment captured within the Harbour each year’. Is this a volume implied by transport rates at sections north and south of the harbour? Were the transport rate results of Figure 4.9 based on single profiles in these areas or averaged over a number of profiles? There is no description of how the sediment model was calibrated – just the results. The seaward extent of the existing marina would seem to suggest that it is near the closure depth. If so, why does the new marina trap an additional 2,000m3 on its southern side? Perhaps a shore normal (or a composite of a year) profile of sediment transport distribution for each marina case would assist in understanding how this change has occurred. Page 28 advises that it is caused by the new structure extending to -8m AHD instead of -6m AHD. Figure 4.9 suggests that 2,500m3/year (in 2008) accumulates south of the existing marina. However, Figure 2.4 suggests no long term accumulation, just seasonal fluctuations. Is there an explanation? The bypassing matter/issue might be reduced by placing some of the sand that is dredged from the marina annually on the beach further north – if indeed sediment enters the new marina in any significant amount. APASA Report This is a relatively concise report and is a Scope of Works document. It is noted that it is proposed to use only the Delft3D model for hydrodynamics, rather than using two different model systems as applied in the 2011 APASA report.
Section 3.1.1 – It is assumed that grid 1 in Figure 1 has the ≈ 300m grid sizes? Are all grids 3D? If not, which ones are; grid 3 only? Has APASA investigated the resolution benefits of using more than 5 vertical layers, albeit at greater computational time?

59915082/L002 4 20 June 2016
N:\2014\COJ\COJ14177.00 ORM ESD and PER\Deliverables\R001\App\Appendix 5 Peer Review Reports\L002 Model Scope of works and Coastal Processes Initial review.docx
Figure 2 might include the location of the current meter. Section 3.2.2, Item 3, page 6 – it is assumed that by ‘seeding’ APASA mean that groundwater flows will include a continuous conservative contaminant concentration that can be related to actual nutrient concentrations. Do these concentrations vary with season (in the model) and spatially? It is assumed that ground water flows to the near shore area outside the marinas would be included also. Some simulation time would be required to reach dynamic equilibrium. Without the exterior groundwater flows the marina may flush too quickly in terms of nutrients – as distinct from a Rhodamine dye tracer test. It is noted that APASA don’t appear to mention their previous model investigations in terms of that work. Cardno had some comments on that work from the 2011 report, see below. APASA is requested to consider these points as they proceed to this next phase of the project. APASA 2011 Table 4.4 – The report does not seem to provide the basis for selection of initial model temperatures - the calibration period data seems to suggest slightly higher winter temperatures? Did APASA examine temperature time-series when solar radiation was included in their modelling? What do they look like? Figure 5.2 – is a bit mixed-up. The title block says ‘observed’, the legend and text say ‘Xtide’? Comparing model results driven by Topex derived constants with measured or predicted tides prepared using a different number of constants is not a like-with-like comparison. Figures 5.5 and 5.6 – The high modelled speeds of Figure 5.5 do not appear in Figure 5.6? Nor in the top panel of Figure 5.4? Is there an explanation? Section 5.2.1 – last line. This outcome is contrary to the outcome in Section 6.3 where it is stated ‘the surface layer flushes faster . . . . . .’ Section 5.2.2 – last lines and Figures 5.11 and 5.12 – should the curve fitting omit the first and last data points to be more realistic with e-folding time estimation? Section 7 – consider comments and request above on plan and time-series plots to illustrate the development of ‘dynamic equilibrium’ in the model and spatial gradients in TN, for example. Based on the investigations (by others) at Hilary’s marina, it is apparent that the more buoyant ground water flows to Hilary’s marina, the existing Ocean Reef marina and the proposed new, expanded Ocean Reef marina, are important drivers for marina flushing. This is considered in the APASA report, which demonstrates that best flushing is expected in cooler, winter neap conditions, which is counter-intuitive. It is understood that this is caused by the greater ground water flows in winter and the greater stratification in neap tide conditions allowing a more structured inflow of clean seawater at the seabed. This assumes that exchange between the marina and the sea is high – that is, little or none of the discharged contaminated water near the seabed returns to the marina on the next flood tide. Section 3.2, Item 4 – It is not clear what ‘most-likely’, ‘best’ and ‘worst’ cases really mean. What is worst at one location may not be worst at another, for example, perhaps what might be worst in summer may not be worst for winter because some processes are affected by temperature. Please comment. Will the nutrient accumulation investigations include phytoplankton processes (eventually – Section 3.5)? Section 3.1.1 – What will be the basis for selecting fuel spill volumes, location, environmental conditions? Why not include die-off rates for bacterial modelling? Section 3.1.1 – It is noted that it is proposed to provide modelling results in terms of dilution. However, eventually it will be necessary to consider concentrations of selected contaminants and that requires the inclusion of background concentrations, which are not just additive to nil background based results because spatial gradients in concentration affect dispersive transport.
59915082/L002 5 20 June 2016
N:\2014\COJ\COJ14177.00 ORM ESD and PER\Deliverables\R001\App\Appendix 5 Peer Review Reports\L002 Model Scope of works and Coastal Processes Initial review.docx
Section 3.4.1, second para. What is meant by ‘suspended sediment load’ – concentrations, depth of deposition contours or flux? What time-scales for re-suspension are to be considered? Is it intended to model ‘typical dredging scenario cases’ or an idealised whole of works scenario? Summer and/or winter? Section 3.4.2, Item 4 – How will APASA define bed roughness, which affects bed shear stress. Can DREDGEMAP also include the currents, including those generated by near shore wave activity, from Delft3D? Is this a 3D model? Section 3.4.2, Item 6 – Durations, as well as thresholds need to be considered. Section 3.4.2, Item 7 – The location of the wastewater treatment outlet should be shown on a Figure. Section 3.5.1 – Suspended sediment concentrations affect light penetration. Will that process be included? Will the D-WAQ modelling be in 3D? Nutrient loads delivered by treated storm water and groundwater within and without the proposed marina need to be included. In the last paragraph, APASA state that phytoplankton growth in Marmion Park will not be addressed. However, should the new marina cause higher concentrations of nutrients that flow out of the marina, then that outcome may cause increased phytoplankton activity outside of the marina and it is assumed that it is included. A map showing Marmion Park would be helpful. Baseline nutrient concentrations are needed beyond the marina itself for a range of reasons; including that even though nitrogen concentration may increase, concentrations of another contaminant may limit phytoplankton growth. Section 3.5.2, Item 1 – These processes are environmentally dependent. Has suitable literature been obtained and assessed? Item 2 - Is realistic open ocean source information available? Item 3 – Why seed? Why not allow natural phytoplankton development? Overall, this requires a significant amount of computing. Does APASA have the hardware capacity to undertake the planned modelling in the project schedule? Section 3.6 – Duration of contaminant exceedance needs to be considered as well as threshold. Section 4.0, Item 4 – As well as climate change, might there not be future depletion of the ground water resource. Item 10, is vertical variation included? Will the report comment on large algae and diatoms. We hope that these review comments and questions are helpful and look forward to the responses. Yours faithfully, P.D. Treloar Senior Principal for Cardno (NSW/ACT) Pty Ltd
Australia ● Belgium ● Canada ● Colombia ● Ecuador ● Germany ● Indonesia ● Kenya ● New Zealand ● Nigeria ● Papua New Guinea ● Peru ● Philippines ● Singapore ● United Arab Emirates ● United Kingdom ● United States ● Operations in over 100 countries N:\2014\COJ\COJ14177.00 ORM ESD and PER\Deliverables\R001\App\Appendix 5 Peer Review Reports\L003 Beach Wrack initial review.docx
Cardno (NSW/ACT) Pty Ltd
ABN 95 001 145 035
Level 9, The Forum
203 Pacific Highway
St Leonards New South Wales 2065
PO Box 19
St Leonards New South Wales 1590
Australia
Telephone: 02 9496 7700
Facsimile: 02 9439 5170
International: +61 2 9496 7700
Web: www.cardno.com.au
Our Ref 59915082/L003 :sge Contact P.D. Treloar
12 January 2015 City of Joondalup PO Box 21 JOONDALUP WA 6919
Attention: Genevieve Hunter Cc: Lisa Adams - Strategen Dear Genevieve, OCEAN REEF MARINA – BEACH WRACK MANAGEMENT
Preamble Acting upon your instructions, and considering the Environmental Scoping Document prepared by the Environmental Protection Authority for Public Environmental Review, I have reviewed the MP Rogers (MPR) & Associates PL Report R455 Rev. 1 entitled “Ocean Reef Marina, Beach Wrack Management’ dated June 2014. From this review I have the following comments. Review MRP have undertaken a thorough review of wrack sources and accumulation history at the Ocean Reef site and at several others in the Perth area, as well as Port Geographe, where they have significant experience in handling major volumes of wrack. Overall, the report is clear, relevant and sound. Section 2. The authors could provide a reference to the detailed coastal processes report so that readers can identify it easily. Section 3. Is wrack accumulation south of Ocean Reef Boat Harbour a problem for beach amenity at present? Or has the wrack decomposed by the summer beach season? Table 5.1. Because the new marina entrance is further offshore and more over-lapped, any increase in wrack entrapment may not occur. Hence MPR’s estimates may be conservative. Section 6.1.2, second para. MRP could discuss survey methods and whether or not echo-sounding would be realistic/successful where there is significant seabed wrack. Section 6.1.3. MPR do not appear to provide advice on the number of locations at which, and where in the water column, WQ sampling should be undertaken. Would that be part of a future monitoring plan?

59915082/L003 2 20 June 2016
N:\2014\COJ\COJ14177.00 ORM ESD and PER\Deliverables\R001\App\Appendix 5 Peer Review Reports\L003 Beach Wrack initial review.docx
Table 6.1, Row 2 (Visual monitoring (external)). Can MPR advise the months in which these observations would most likely best be undertaken. Section 7, big dot-point 5. MRP (or a future monitoring plan) should be a little more specific with these recommendations, or a future monitoring plan needs to be. Under the last big dot-point the authors advise that monitoring costs have been advised, but they don’t seem to part of this report. We hope that these review comments and questions are helpful and look forward to the responses. Yours faithfully, P.D. Treloar Senior Principal for Cardno (NSW/ACT) Pty Ltd


Australia ● Belgium ● Canada ● Colombia ● Ecuador ● Germany ● Indonesia ● Kenya ● New Zealand ● Nigeria ● Papua New Guinea ● Peru ● Philippines ● Singapore ● United Arab Emirates ● United Kingdom ● United States ● Operations in over 100 countries N:\2014\COJ\COJ14177.00 ORM ESD and PER\Deliverables\R001\App\Appendix 5 Peer Review Reports\L009 Marine Modelling Report Initial review.docx
Cardno (NSW/ACT) Pty Ltd
ABN 95 001 145 035
Level 9, The Forum
203 Pacific Highway
St Leonards New South Wales 2065
PO Box 19
St Leonards New South Wales 1590
Australia
Telephone: 02 9496 7700
Facsimile: 02 9439 5170
International: +61 2 9496 7700
Web: www.cardno.com.au
Our Ref 59915082/L009 Contact P.D. Treloar
22 March 2016 City of Joondalup PO Box 21 JOONDALUP WA 6919
Attention: Genevieve Hunter Cc: Lisa Adams - Strategen Dear Genevieve, OCEAN REEF MARINA – PHASE 2: WATER QUALITY MODELLING
Preamble Acting upon your request, I have reviewed the report ‘Ocean Reef Marina Development – Phase 2: Water Quality Modelling’ prepared by RPS – APASA and dated 29/01/2016. The reviewer has considered State Planning Policy No. 2.6 and the Ocean Reef Marina Environmental Scoping Document (ESD) in this assessment. Initial comments were discussed with Mr Clinton Doak of M P Rogers and Mr Ryan Alexander of APASA on 9 and 10 March 2016. Many of these were editorial in nature and are not re-addressed in this review report. This letter provides my review comments and requests for clarification arising from this review task and are presented below in the order in which the subject issue is presented in APASA’s report. No comments on the Executive Summary have been made because they are addressed in the main text and the authors can transpose any changes into that section. However, the authors need to make it clear that this report does not address the effects of water quality changes, but rather prepares data for use by others in the overall assessment team. Section 1.1, Item 2) – Is there a need to address potential spills and anti-foulant leachate contamination? The effects of ground water should be introduced here. Section 1.1, last para – the authors need to explain what they mean by ‘…a common hydrodynamic model framework.’ Is it common to MP Rogers and APASA work, or other? Section 1.2, Page 3, second last line – Are MP Rogers and APASA using the same/similar Delft3D-SWAN model layouts? Please clarify any differences in layouts and inputs. Section 2.1, last line – sediment veneer is a realistic term, but authors could add that it is irregular in thickness and some areas are bare, at least some of the time.

59915082/L009 2 20 June 2016
N:\2014\COJ\COJ14177.00 ORM ESD and PER\Deliverables\R001\App\Appendix 5 Peer Review Reports\L009 Marine Modelling Report Initial review.docx
Section 2.2.1, para 1 – were other anemometer sites considered? It would seem that later in the report other wind data sources are used. The authors should advise that they use Swanbourne only for a general description. Page 8 – the authors should advise readers that the 0-15cm/s current speed is seasonally variable. Page 10, para 2 – the authors should clarify that the ≈25m is from a source point (dredge head, for example), and that concentrations are not described well within that distance, but that at more distant locations of environmental interest the suspended sediment concentrations are described well. Section 4.1 – Some discussion is needed about the coupling of the wave and hydrodynamic models. They are being calibrated uncoupled (I understand), but may be used later in the project in coupled form, which may partially ‘invalidate’ the calibration. I understand that the model will be used in subsequent investigations to study sediment plume movement, but not nearshore sediment transport – which is being addressed separately by M P Rogers. This is not made clear in the report and some description would clarify the situation. Section 3.4, para 2 – the authors should elaborate on the term ‘… respond quickly …’ in terms of whether this relates to both growth and mortality and whether or not light and temperature are included – day and night differences; or whether this is a slightly longer term variation in nutrient concentrations – over days. Section 4.1.1, para 2 – the ≈10m grid size mentioned here conflicts with Table 4.4. This needs to be clarified. There needs to be a statement that describes the resolution of the ORM entrance channel and its adequacy using a 12.5m grid size for flushing processes. The report does not advise the entrance channel width, albeit Figure 4.4 provides some description. This figure suggests that channel width is about 30m, which is probably narrow for major marina in terms of the marina code (AS3962). The reviewer understands that final channel width design is part of later investigations. A wider channel would provide better flushing and the authors should consider that point. Section 4.1.2, para 1 – implies to the reviewer that wave breaking was not included. Discussions with MP Rogers and APASA confirm that it was and that what was meant is that the grid size is too big to describe this process in the nearshore area, but is adequate in the reef areas and not important near the marina entrance. The authors are requested to clarify/elaborate this issue. Section 4.1.3, para 1 – the authors are requested to describe the selection method for the 12-months modelling period. Section 4.1.4 – the authors are requested to describe how the investigation has dealt with, or how the site deals with fresh water runoff at the site – is it diverted or excluded, for example? Or what ARI rainfall event is diverted and so on. Table 4.1 – this table needs to describe the current data collection in terms of burst-length, as well as data interval (included), and anemometer elevations and whether or not wind data was modified to a common elevation. Page 16, first sentence – does this mean that the dye experiments were used to establish realistic eddy and dispersion coefficients? Section 4.2.2.2 – clarify forecast or hindcast data application. Section 4.2.2.3, para 2 – Clarify the parameter 20o – is it standard deviation? Section 4.2.2.4 – The ground water flows will enhance flushing, but deliver contaminants as well. Hence there is a difference between flushing of a contaminant not found in the ground water and one that is found in those flows. Some discussion and understanding is needed on this point. That is, a contaminant not found in the ground water should flush more quickly, all other matters being equal.

59915082/L009 3 20 June 2016
N:\2014\COJ\COJ14177.00 ORM ESD and PER\Deliverables\R001\App\Appendix 5 Peer Review Reports\L009 Marine Modelling Report Initial review.docx
Table 4.3 – the authors should make clear that the changes in total discharges are based on changes in marina area, but not that for both cases ground water flows beyond the enclosed area are included so that the total flows remain the same. Section 4.3 – the authors should confirm that dredged seabed level was included in the ORM model set-up and that it was -3.5m AHD, broadly indicated on Figure 4.3. Section 4.3.2.2 – have the different wind data sets been compared for consistency at grid boundaries and might differences affect the outcomes? Some discussion is requested. Section 4.3.2.3 – How were salinity and temperature selected? Page 26 – was cloud cover modelled, and if so, was it based on measured on modelled data? Was it really important to the analyses? Page 28 – an eddy viscosity of 200m2/s seems high for a 3D model – please comment. Section 4.4.1, para 2 – is the datum mean sea level or AHD? Figure 4.6 – please indicate the NOAA (WW3) data site used – if it is located on this figure, or provide its latitude and longitude in the text. Page 32, last para – are you using different wind data for the wave and current models? Please elaborate. Table 4.5 – are these wind speeds at 10m above ground level? Table 5.1 – The speed RMSE, albeit small, are relatively large when compared with the actual magnitudes. This is partly because current speeds are very low. Also, slight phase differences can affect the results. Perhaps the time-series plots provide a better comparison in this case. Please comment in the report. Section 5.1.3, para 5 and Figure 5.8, second panel up – there is a significant difference between modelled and measured current U components, yet speed in the top panel is not so different. Please comment on whether or not this may be caused by a directional bias in the model? Page 54 – the authors are requested to comment on whether or not the ‘… small directional discrepancy…’ or bias of about 30o has any significant effect on the model ‘prediction’ outcomes. Section 5.2.2, para 2 – The authors should note in terms of flushing time at R1 that this outcome is a result of the test case set-up. If they tested spill patches at each location instead of filling-up the whole marina with an initial contaminant then they would get a different result. However, their approach is a standard one, albeit unrealistic. The most realistic results come from their water quality simulations. However, the dye test results and equivalent model simulations do assist with model calibration in terms of dispersion coefficient. Table 6.1 – the large RMSE direction results need some comment – probably in terms of bias as discussed above. These biases may not affect sediment re-suspension and don’t affect currents (because the wave and hydrodynamic models are uncoupled), but can’t be left unaddressed. Figure 6.4 – needs some comment about wave direction on 11/07 and the effect in the bottom right-hand scatter plot. Some waves appear to be propagating from the land. Those results seem to have been ‘filtered’ from Figure 6.5; (which is appropriate)? Figure 6.7 – shows directional bias. Please comment on whether this is a consequence of model resolution. Although Table 6.1 suggests possible bias at Rottnest Island, Figure 6.4 doesn’t. Hence bias at Ocean Reef has not been caused by model boundary conditions. Please comment.
59915082/L009 4 20 June 2016
N:\2014\COJ\COJ14177.00 ORM ESD and PER\Deliverables\R001\App\Appendix 5 Peer Review Reports\L009 Marine Modelling Report Initial review.docx
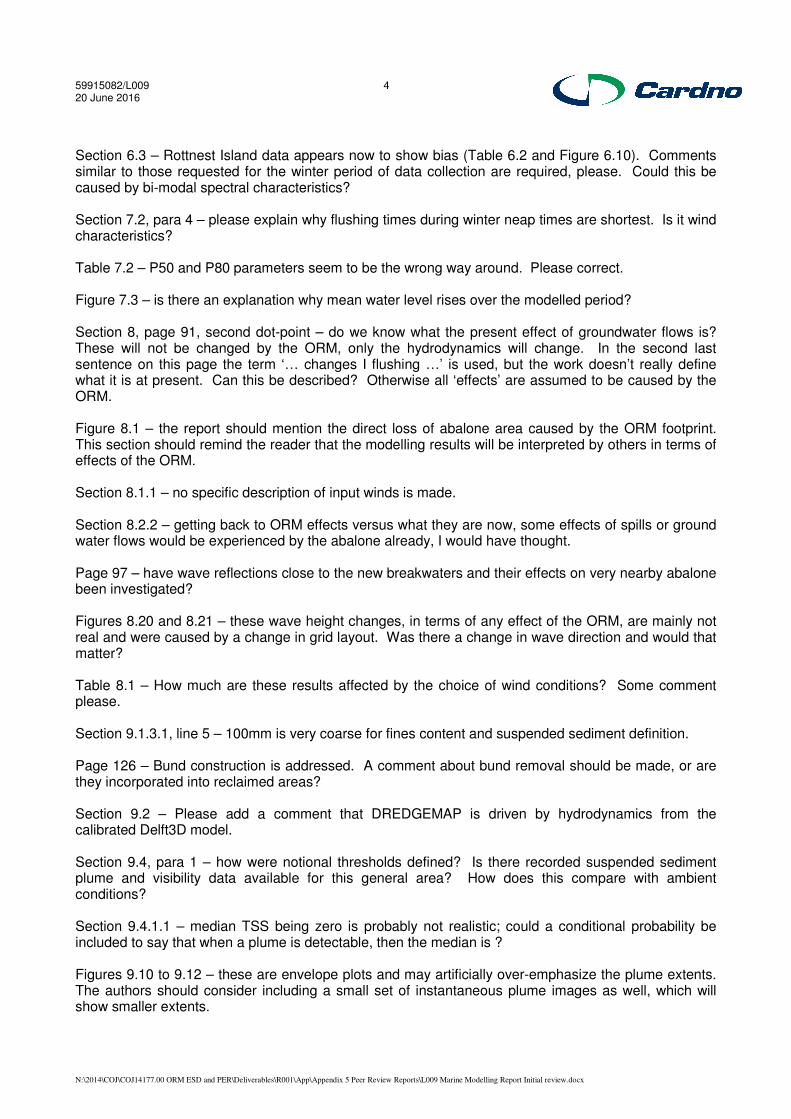
Section 6.3 – Rottnest Island data appears now to show bias (Table 6.2 and Figure 6.10). Comments similar to those requested for the winter period of data collection are required, please. Could this be caused by bi-modal spectral characteristics? Section 7.2, para 4 – please explain why flushing times during winter neap times are shortest. Is it wind characteristics? Table 7.2 – P50 and P80 parameters seem to be the wrong way around. Please correct. Figure 7.3 – is there an explanation why mean water level rises over the modelled period? Section 8, page 91, second dot-point – do we know what the present effect of groundwater flows is? These will not be changed by the ORM, only the hydrodynamics will change. In the second last sentence on this page the term ‘… changes I flushing …’ is used, but the work doesn’t really define what it is at present. Can this be described? Otherwise all ‘effects’ are assumed to be caused by the ORM. Figure 8.1 – the report should mention the direct loss of abalone area caused by the ORM footprint. This section should remind the reader that the modelling results will be interpreted by others in terms of effects of the ORM. Section 8.1.1 – no specific description of input winds is made. Section 8.2.2 – getting back to ORM effects versus what they are now, some effects of spills or ground water flows would be experienced by the abalone already, I would have thought. Page 97 – have wave reflections close to the new breakwaters and their effects on very nearby abalone been investigated? Figures 8.20 and 8.21 – these wave height changes, in terms of any effect of the ORM, are mainly not real and were caused by a change in grid layout. Was there a change in wave direction and would that matter? Table 8.1 – How much are these results affected by the choice of wind conditions? Some comment please. Section 9.1.3.1, line 5 – 100mm is very coarse for fines content and suspended sediment definition. Page 126 – Bund construction is addressed. A comment about bund removal should be made, or are they incorporated into reclaimed areas? Section 9.2 – Please add a comment that DREDGEMAP is driven by hydrodynamics from the calibrated Delft3D model. Section 9.4, para 1 – how were notional thresholds defined? Is there recorded suspended sediment plume and visibility data available for this general area? How does this compare with ambient conditions? Section 9.4.1.1 – median TSS being zero is probably not realistic; could a conditional probability be included to say that when a plume is detectable, then the median is ? Figures 9.10 to 9.12 – these are envelope plots and may artificially over-emphasize the plume extents. The authors should consider including a small set of instantaneous plume images as well, which will show smaller extents.

59915082/L009 5 20 June 2016
N:\2014\COJ\COJ14177.00 ORM ESD and PER\Deliverables\R001\App\Appendix 5 Peer Review Reports\L009 Marine Modelling Report Initial review.docx
Section 10.1 – is light penetration included? How was temperature actually included? Was there a seasonal temperature variation? There seems to be no pre-ORM case. There needs to be some basis for quantifying any changes caused by the ORM, which may be very small. Please comment. Figure 10.3 – might advise the reader in the caption that locations are shown on the next figure. Figure 10.5 – a comment that there is always some growth limitation would help a reader who is unfamiliar with these processes and plots. I hope that that these review comments are helpful. Yours faithfully, P.D. Treloar Senior Principal for Cardno (NSW/ACT) Pty Ltd
Australia ● Belgium ● Canada ● Colombia ● Ecuador ● Germany ● Indonesia ● Kenya ● New Zealand ● Nigeria ● Papua New Guinea ● Peru ● Philippines ● Singapore ● United Arab Emirates ● United Kingdom ● United States ● Operations in over 100 countries N:\Projects\599\FY15\082_Ocean Reef Review\_Comms\Letters\L010 (2).docx
Cardno (NSW/ACT) Pty Ltd ABN 95 001 145 035 Level 9, The Forum 203 Pacific Highway St Leonards New South Wales 2065 PO Box 19 St Leonards New South Wales 1590 Australia Telephone: 02 9496 7700 Facsimile: 02 9439 5170 International: +61 2 9496 7700 Web: www.cardno.com.au
Our Ref 59915082/L010 Contact P.D. Treloar
9 May 2016 City of Joondalup PO Box 21 JOONDALUP WA 6919 Attention: Genevieve Hunter Cc: Lisa Adams - Strategen Dear Genevieve, OCEAN REEF MARINA – WATER QUALITY MODELLING REPORT Preamble Acting upon your instructions, and considering the Environmental Scoping Document (ESD) prepared by the Environmental Protection Authority for Public Environmental Review, I have reviewed the RPS APASA Report J0331 Rev. 3 entitled ‘Ocean Reef Marina Development, Water Quality Modelling’ dated April 2016 and their responses to my review of the Rev. 2 version of the report. I am satisfied that the report meets the relevant requirements of the ESD Items 3 to 5, 6a and 6b – Marine Environmental Quality. I note that the other aspects of the ESD relating to monitoring and ecological effects assessments are addressed in other documents. Yours faithfully,
P.D. Treloar Senior Principal for Cardno (NSW/ACT) Pty Ltd

Australia ● Belgium ● Canada ● Colombia ● Ecuador ● Germany ● Indonesia ● Kenya ● New Zealand ● Nigeria ● Papua New Guinea ● Peru ● Philippines ● Singapore ● United Arab Emirates ● United Kingdom ● United States ● Operations in over 100 countries N:\2014\COJ\COJ14177.00 ORM ESD and PER\Deliverables\R001\App\Appendix 5 Peer Review Reports\L011.docx
Cardno (NSW/ACT) Pty Ltd
ABN 95 001 145 035
Level 9, The Forum
203 Pacific Highway
St Leonards New South Wales 2065
PO Box 19
St Leonards New South Wales 1590
Australia
Telephone: 02 9496 7700
Facsimile: 02 9439 5170
International: +61 2 9496 7700
Web: www.cardno.com.au
Our Ref 59915082/L011 Contact P.D. Treloar
31 May 2016 City of Joondalup PO Box 21 JOONDALUP WA 6919
Attention: Genevieve Hunter Cc: Lisa Adams - Strategen Dear Genevieve, OCEAN REEF MARINA – COASTAL HAZARD AND RISK MANAGEMENT ADAPTION PLAN
Preamble Acting upon your request, I have reviewed the report ‘Ocean Reef Marina – Coastal Hazard and Risk Management Adaption Plan, R608, Rev 1’, prepared by M P Rogers and Associates (MPR) and dated April 2016. The reviewer has considered State Planning Policy No. 2.6, together with the Ocean Reef Marina Environmental Scoping Document (ESD). Additionally, I have reviewed and checked-off my Rev 0 review comments and the MPR responses. The MPR report has been re-structured and these further review comments relate only to Sections 5 and beyond. Initial comments were discussed with Mr Brad Smith of M P Rogers on 25 May 2016. Many of these were editorial in nature and are not re-addressed in this review report. This letter provides my review, Rev 1, comments and requests for clarification arising from this review task and are presented below in the order in which the subject issue is presented in MPR’s report. The reviewer requests that Section 6 include a short paragraph at its beginning that explains the differences in Inundation between Sections 6 and 7 – the latter including wave run-up. The reader can be left ‘up in the air’ until he/she reaches Section 7. Page 22 – the authors need to provide details of what constitutes a 500-years ARI event – combined water level and waves, and why water level is the dominant parameter. Table 6.2 – it is understood that the results include wave run-up, but the inclusion of the word ‘Steady’ in the table title confuses the reader. Page 33 – needs clarification in terms of Council regulations and the need for/no need for a freeboard allowance. Page 33 – the authors need to clarify the use of ‘Breakwater access’ to mean (really) breakwater crest level.
59915082/L011 2 20 June 2016
N:\2014\COJ\COJ14177.00 ORM ESD and PER\Deliverables\R001\App\Appendix 5 Peer Review Reports\L011.docx
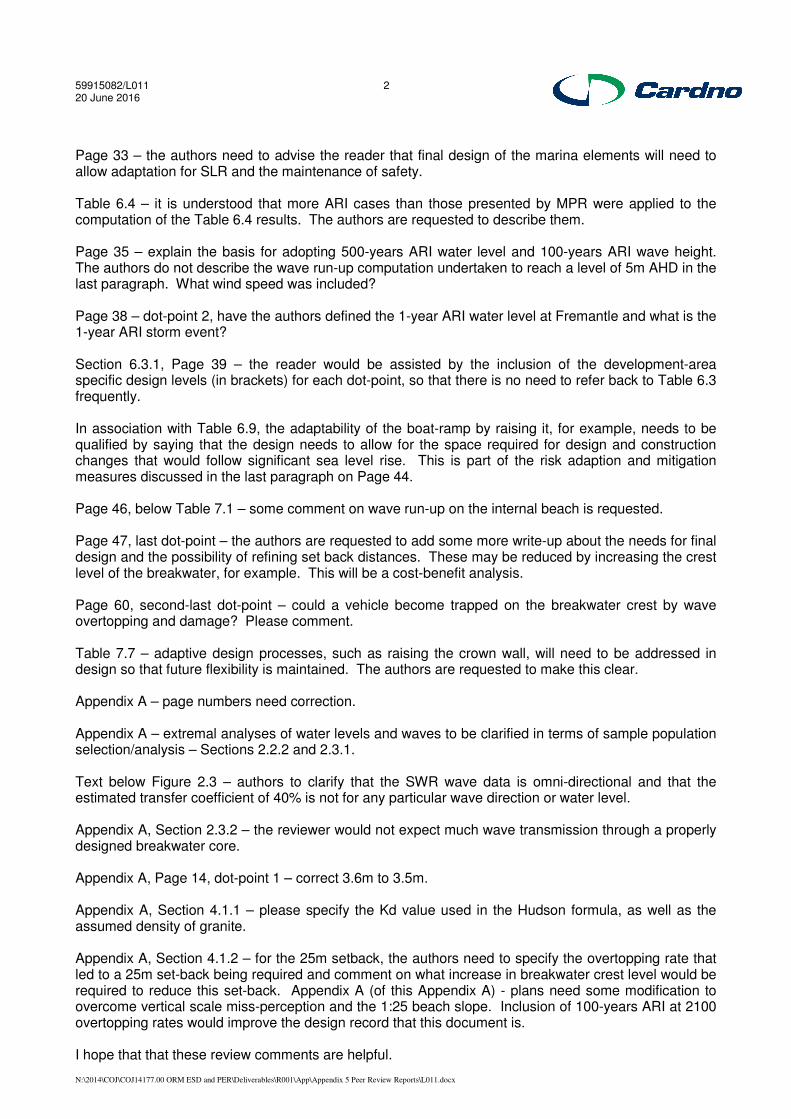
Page 33 – the authors need to advise the reader that final design of the marina elements will need to allow adaptation for SLR and the maintenance of safety. Table 6.4 – it is understood that more ARI cases than those presented by MPR were applied to the computation of the Table 6.4 results. The authors are requested to describe them. Page 35 – explain the basis for adopting 500-years ARI water level and 100-years ARI wave height. The authors do not describe the wave run-up computation undertaken to reach a level of 5m AHD in the last paragraph. What wind speed was included? Page 38 – dot-point 2, have the authors defined the 1-year ARI water level at Fremantle and what is the 1-year ARI storm event? Section 6.3.1, Page 39 – the reader would be assisted by the inclusion of the development-area specific design levels (in brackets) for each dot-point, so that there is no need to refer back to Table 6.3 frequently. In association with Table 6.9, the adaptability of the boat-ramp by raising it, for example, needs to be qualified by saying that the design needs to allow for the space required for design and construction changes that would follow significant sea level rise. This is part of the risk adaption and mitigation measures discussed in the last paragraph on Page 44. Page 46, below Table 7.1 – some comment on wave run-up on the internal beach is requested. Page 47, last dot-point – the authors are requested to add some more write-up about the needs for final design and the possibility of refining set back distances. These may be reduced by increasing the crest level of the breakwater, for example. This will be a cost-benefit analysis. Page 60, second-last dot-point – could a vehicle become trapped on the breakwater crest by wave overtopping and damage? Please comment. Table 7.7 – adaptive design processes, such as raising the crown wall, will need to be addressed in design so that future flexibility is maintained. The authors are requested to make this clear. Appendix A – page numbers need correction. Appendix A – extremal analyses of water levels and waves to be clarified in terms of sample population selection/analysis – Sections 2.2.2 and 2.3.1. Text below Figure 2.3 – authors to clarify that the SWR wave data is omni-directional and that the estimated transfer coefficient of 40% is not for any particular wave direction or water level. Appendix A, Section 2.3.2 – the reviewer would not expect much wave transmission through a properly designed breakwater core. Appendix A, Page 14, dot-point 1 – correct 3.6m to 3.5m. Appendix A, Section 4.1.1 – please specify the Kd value used in the Hudson formula, as well as the assumed density of granite. Appendix A, Section 4.1.2 – for the 25m setback, the authors need to specify the overtopping rate that led to a 25m set-back being required and comment on what increase in breakwater crest level would be required to reduce this set-back. Appendix A (of this Appendix A) - plans need some modification to overcome vertical scale miss-perception and the 1:25 beach slope. Inclusion of 100-years ARI at 2100 overtopping rates would improve the design record that this document is. I hope that that these review comments are helpful.

59915082/L011 3 20 June 2016
N:\2014\COJ\COJ14177.00 ORM ESD and PER\Deliverables\R001\App\Appendix 5 Peer Review Reports\L011.docx
Yours faithfully, P.D. Treloar Senior Principal for Cardno (NSW/ACT) Pty Ltd

Australia ● Belgium ● Canada ● Colombia ● Ecuador ● Germany ● Indonesia ● Kenya ● New Zealand ● Nigeria ● Papua New Guinea ● Peru ● Philippines ● Singapore ● United Arab Emirates ● United Kingdom ● United States ● Operations in over 100 countries N:\2014\COJ\COJ14177.00 ORM ESD and PER\Deliverables\R001\App\Appendix 5 Peer Review Reports\L012.docx
Cardno (NSW/ACT) Pty Ltd
ABN 95 001 145 035
Level 9, The Forum
203 Pacific Highway
St Leonards New South Wales 2065
PO Box 19
St Leonards New South Wales 1590
Australia
Telephone: 02 9496 7700
Facsimile: 02 9439 5170
International: +61 2 9496 7700
Web: www.cardno.com.au
Our Ref 59915082/L012 Contact P.D. Treloar
8 June 2016 City of Joondalup PO Box 21 JOONDALUP WA 6919
Attention: Genevieve Hunter Cc: Lisa Adams - Strategen Dear Genevieve, OCEAN REEF MARINA – COASTAL HAZARD AND RISK MANAGEMENT ADAPTION PLAN
Preamble Acting upon your instructions, and considering the Environmental Scoping Document (ESD) prepared by the Environmental Protection Authority for Public Environmental Review, I have reviewed the MP Rogers & Associates Report R608 Rev. 2 entitled ‘Ocean Reef Marina, Coastal Hazard and Risk Management Adaption Plan’ dated June 2016 and their responses to my review of the Rev. 1 version of the report. I am satisfied that the report meets the relevant requirements of the ESD Items related to Coastal Processes. I note that some other aspects of the ESD relating to monitoring and mitigation are addressed in other documents. I understand that there is some additional work being undertaken on cyclone modelling that will eventually be included in the estimates of 500-years ARI storm tide levels. This work is being done to meet SPP 2.6, but is not considered critical to the impact assessment outlined in the PER. My approval of the R608 Rev. 2 document is subject to this additional work (or similar), being undertaken. Yours faithfully,
P.D. Treloar Senior Principal for Cardno (NSW/ACT) Pty Ltd

Australia ● Belgium ● Canada ● Colombia ● Ecuador ● Germany ● Indonesia ● Kenya ● New Zealand ● Nigeria ● Papua New Guinea ● Peru ● Philippines ● Singapore ● United Arab Emirates ● United Kingdom ● United States ● Operations in over 100 countries C:\Users\ladams\AppData\Local\Microsoft\Windows\Temporary Internet Files\Content.Outlook\0LN19S0X\L013 (2).docx
Cardno (NSW/ACT) Pty Ltd
ABN 95 001 145 035
Level 9, The Forum
203 Pacific Highway
St Leonards New South Wales 2065
PO Box 19
St Leonards New South Wales 1590
Australia
Telephone: 02 9496 7700
Facsimile: 02 9439 5170
International: +61 2 9496 7700
Web: www.cardno.com.au
Our Ref 59915082/L013 Contact P.D. Treloar
23 June 2016 City of Joondalup PO Box 21 JOONDALUP WA 6919
Attention: Genevieve Hunter Cc: Lisa Adams - Strategen Dear Genevieve, OCEAN REEF MARINA – COASTAL HAZARDS AND VULNERABILITY
Preamble Acting upon your request, I have reviewed the report ‘Ocean Reef Marina – Coastal Hazards and Vulnerability, R760, Rev 0’, prepared by M P Rogers and Associates (MPR) and dated April 2016. The reviewer has considered State Planning Policy No. 2.6, together with the Ocean Reef Marina Environmental Scoping Document (ESD). Initial comments were discussed with Mr Trent Hunt of M P Rogers on 17 June 2016 based on a marked-up copy of the report sent to you. Many of these were editorial in nature and are not re-addressed in this review report. This letter provides my review comments and requests for clarification arising from this review task and are presented below in the order in which the subject issue is presented in MPR’s report. The reviewer requests that some editorial changes be made to the Glossary of Key Terms, where appropriate. These requests were included on the marked-up copy. Figure 1.1 – the authors are requested to include a scale and north arrow. Page 2 – the reference to the Worley parsons work (second last para) is not really used and should be deleted. Page 3 – The report numbering for this report (understood to be a summary report prepared from other previous coastal investigations undertaken for the City), and the CHRMAP report (R608), together with their sequence is confusing and the reader would be helped by an explanation. Figure 2.1 – please show Mullaloo Beach. Page 8, second dot-point – please add more text describing the cliffs, such as overall height and level of 1 to 2m thick layer.

59915082/L013 2 23 June 2016
C:\Users\ladams\AppData\Local\Microsoft\Windows\Temporary Internet Files\Content.Outlook\0LN19S0X\L013 (2).docx
Page 10, Section 3.2.1 – seems to describe more of the present conditions with the ORBH than what might happen following construction of the ORM. Please comment on the expected effects of the ORM. Figure 3.4 – please describe how a perched is re-nourished after a storm using suspended sediment and so on. Figure 3.5 – please indicate the general area of the Burns Beach salient. Page 15 – pleased discriminate between wave events (such as a storm) and wave conditions such as daily sea breeze ‘conditions’. This difference needs to be addressed in other parts of the report also, for example, page 21, last line. Page 18, last para. – it will be difficult for many readers to understand the difference between potential and likely changes – even though these are standard Western Australian government agency terms. Page 24, centre-page – I understand that where climate change is mentioned that in many cases it should be ‘projected climate change’. Please consider this change where climate change is mentioned, it may not be appropriate in all instances. Section 4.2.5 – so far the reviewer has not seen any real reporting on storm water planning for the ORM. Water quality in the marina and beach scour may occur in severe events. This is a general comment for Council to consider. Page 27, third last para – 0.2m/year seems a very large uncertainty allowance, but I understand that it is required by SPP2.6. This requirement means that Council may need to discuss/negotiate development plans with state government agencies, who may see this as a way of ensuring that project responsibility lies with Council. Section 6.1 – Please expand this section to explain why Sections 2, 3 and 4, for example, are included. They are unlikely to be affected by the ORM in terms of onshore/offshore sand transport. Section 6.2 – please elaborate about the three storms modelling and clarify that Figure 6.2 shows these storms and that the beach profile changes become progressively smaller with each storm of the three. How was the 1996 storm transposed to these profile offshore-ends? Table 6.1 – the S1 allowances seem large, but this is understood to be a consequence of the 9Required) way in which the results of Figure 6.6, for example, must be interpreted. On a shoreline contour recession basis the changes would be much smaller – reviewer’s comment only. Figures 7.1 and 7.2 – please include the locations of Hillarys, ORBH etc. for ease of understanding. Table 7.1 – needs minus signs for m/year; similar comment for Table 7.2. Figure 8.1 – shows 0.27m, but text below indicates 0.35m – please correct this inconsistency. Section 9 – Does Appendix B include wave run-up? Please clarify. Table 9.1 – some of the erosion allowances are very large and appear unrealistic. They arise from the need to fulfil SPP2.6 and will affect Council’s planning and negotiations with government agencies. For example, 168m for 700m to 900m chainage is possibly unbelievable. Section 9.2 – please clarify whether or not Appendix B includes wave run-up. Page 45, second last line – what does ‘will be consistent’ mean? Please clarify.

59915082/L013 3 23 June 2016
C:\Users\ladams\AppData\Local\Microsoft\Windows\Temporary Internet Files\Content.Outlook\0LN19S0X\L013 (2).docx
Coastal erosion Hazard plots in the Appendices – the erosion of embayments shown north of the ORBH seem unrealistic and unlikely to occur because the beaches are held within rocky headlands. The authors are requested to comment on this, please. I hope that that these review comments are helpful. Yours faithfully, P.D. Treloar Senior Principal for Cardno (NSW/ACT) Pty Ltd

Australia ● Belgium ● Canada ● Colombia ● Ecuador ● Germany ● Indonesia ● Kenya ● New Zealand ● Nigeria ● Papua New Guinea ● Peru ● Philippines ● Singapore ● United Arab Emirates ● United Kingdom ● United States ● Operations in over 100 countries N:\2014\COJ\COJ14177.00 ORM ESD and PER\Background_Refs\Peer review\L014.docx
Cardno (NSW/ACT) Pty Ltd
ABN 95 001 145 035
Level 9, The Forum
203 Pacific Highway
St Leonards New South Wales 2065
PO Box 19
St Leonards New South Wales 1590
Australia
Telephone: 02 9496 7700
Facsimile: 02 9439 5170
International: +61 2 9496 7700
Web: www.cardno.com.au
Our Ref 59915082/L014 Contact P.D. Treloar
11 July 2016 City of Joondalup PO Box 21 JOONDALUP WA 6919
Attention: Genevieve Hunter Cc: Lisa Adams - Strategen Dear Genevieve, OCEAN REEF MARINA – COASTAL HAZARDS AND VULNERABILITY
Preamble Acting upon your instructions, and considering the Environmental Scoping Document (ESD) prepared by the Environmental Protection Authority for Public Environmental Review, I have reviewed the MP Rogers & Associates Report R760 Rev. 2 entitled ‘Ocean Reef Marina, Coastal Hazards and Vulnerability’ dated July 2016 and their responses to my review of the Rev. 1 version of the report in terms of listed comments and responses and the revised report. I am satisfied that the report meets the relevant requirements of the ESD Items related to Coastal Processes. I note that this report provides supporting information for the MP Rogers & Associates report R608 Rev 2 – Ocean Reef Marina, Coastal Hazard and Risk Management Adaption Plan. Yours faithfully,
P.D. Treloar Senior Principal for Cardno (NSW/ACT) Pty Ltd
BJS / DLO 12/4/2016
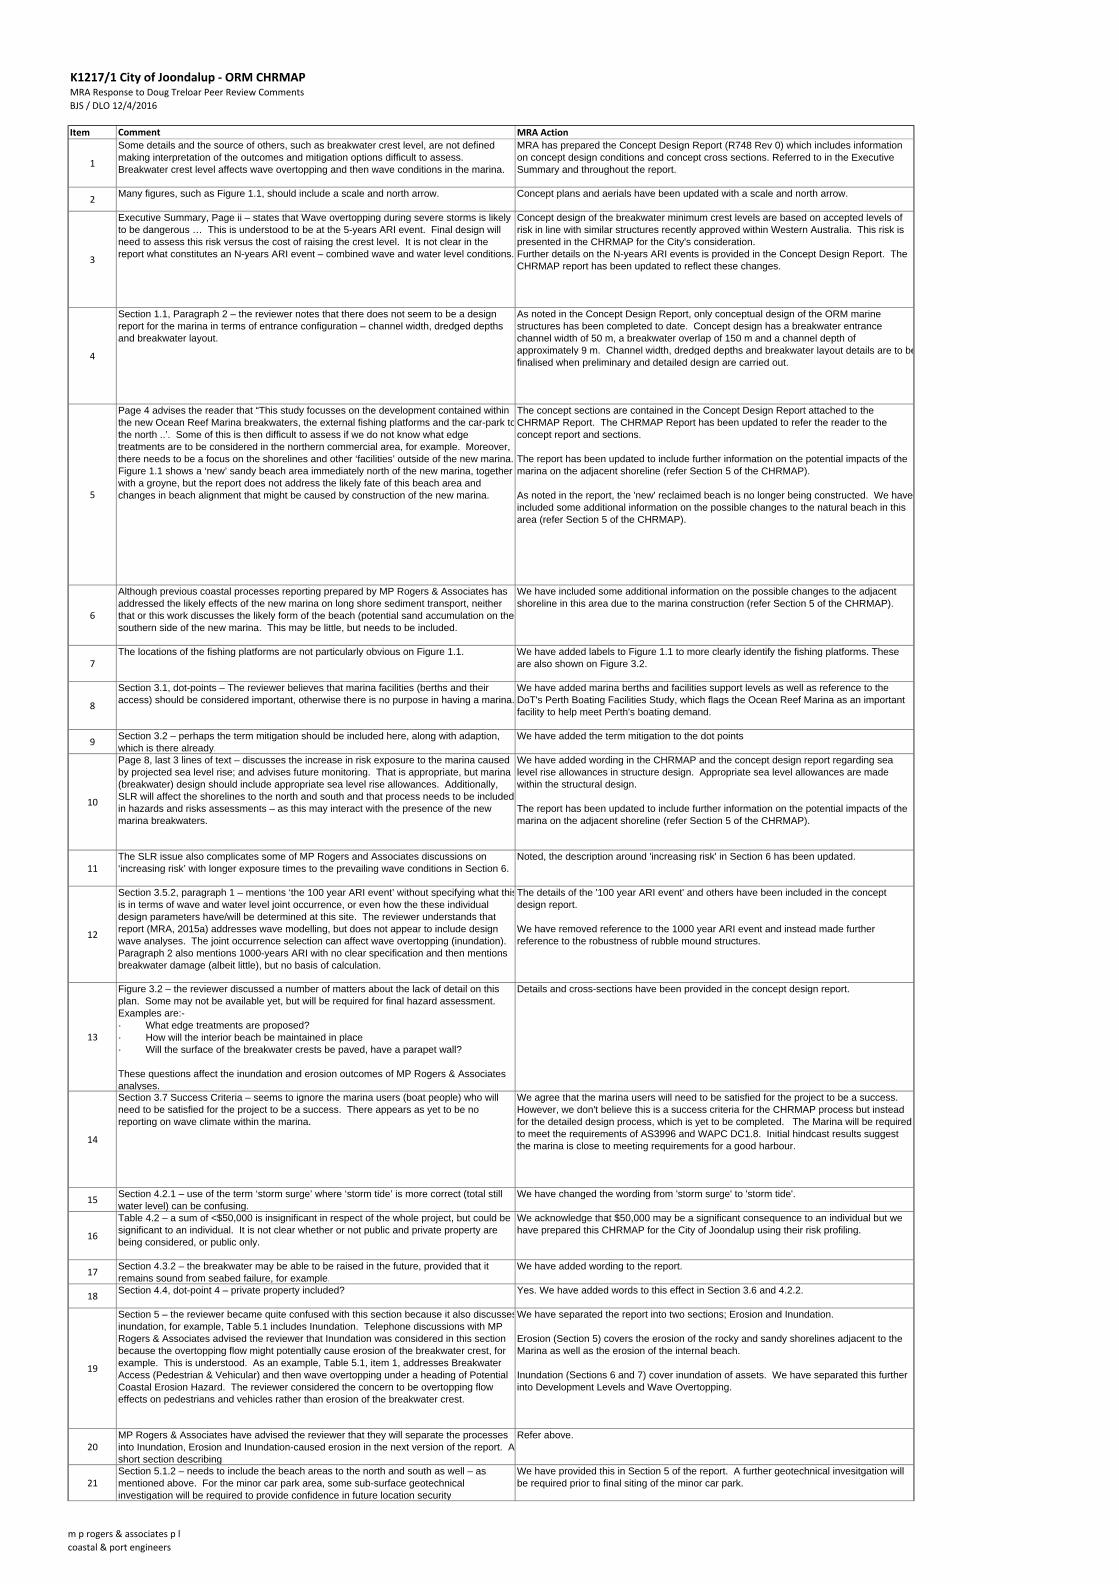
Item Comment MRA Action
1
Some details and the source of others, such as breakwater crest level, are not defined making interpretation of the outcomes and mitigation options difficult to assess. Breakwater crest level affects wave overtopping and then wave conditions in the marina.
MRA has prepared the Concept Design Report (R748 Rev 0) which includes information on concept design conditions and concept cross sections. Referred to in the Executive Summary and throughout the report.
2Many figures, such as Figure 1.1, should include a scale and north arrow. Concept plans and aerials have been updated with a scale and north arrow.
3
Executive Summary, Page ii – states that Wave overtopping during severe storms is likely to be dangerous … This is understood to be at the 5-years ARI event. Final design will need to assess this risk versus the cost of raising the crest level. It is not clear in the report what constitutes an N-years ARI event – combined wave and water level conditions.
Concept design of the breakwater minimum crest levels are based on accepted levels of risk in line with similar structures recently approved within Western Australia. This risk is presented in the CHRMAP for the City's consideration.Further details on the N-years ARI events is provided in the Concept Design Report. The CHRMAP report has been updated to reflect these changes.
4
Section 1.1, Paragraph 2 – the reviewer notes that there does not seem to be a design report for the marina in terms of entrance configuration – channel width, dredged depths and breakwater layout.
As noted in the Concept Design Report, only conceptual design of the ORM marine structures has been completed to date. Concept design has a breakwater entrance channel width of 50 m, a breakwater overlap of 150 m and a channel depth of approximately 9 m. Channel width, dredged depths and breakwater layout details are to befinalised when preliminary and detailed design are carried out.
5
Page 4 advises the reader that “This study focusses on the development contained within the new Ocean Reef Marina breakwaters, the external fishing platforms and the car-park tothe north ..’. Some of this is then difficult to assess if we do not know what edge treatments are to be considered in the northern commercial area, for example. Moreover, there needs to be a focus on the shorelines and other ‘facilities’ outside of the new marina. Figure 1.1 shows a ‘new’ sandy beach area immediately north of the new marina, together with a groyne, but the report does not address the likely fate of this beach area and changes in beach alignment that might be caused by construction of the new marina.
The concept sections are contained in the Concept Design Report attached to the CHRMAP Report. The CHRMAP Report has been updated to refer the reader to the concept report and sections.
The report has been updated to include further information on the potential impacts of the marina on the adjacent shoreline (refer Section 5 of the CHRMAP).
As noted in the report, the 'new' reclaimed beach is no longer being constructed. We have included some additional information on the possible changes to the natural beach in this area (refer Section 5 of the CHRMAP).
6
Although previous coastal processes reporting prepared by MP Rogers & Associates has addressed the likely effects of the new marina on long shore sediment transport, neither that or this work discusses the likely form of the beach (potential sand accumulation on the southern side of the new marina. This may be little, but needs to be included.
We have included some additional information on the possible changes to the adjacent shoreline in this area due to the marina construction (refer Section 5 of the CHRMAP).
7The locations of the fishing platforms are not particularly obvious on Figure 1.1. We have added labels to Figure 1.1 to more clearly identify the fishing platforms. These
are also shown on Figure 3.2.
8
Section 3.1, dot-points – The reviewer believes that marina facilities (berths and their access) should be considered important, otherwise there is no purpose in having a marina.
We have added marina berths and facilities support levels as well as reference to the DoT's Perth Boating Facilities Study, which flags the Ocean Reef Marina as an important facility to help meet Perth's boating demand.
9Section 3.2 – perhaps the term mitigation should be included here, along with adaption, which is there already.
We have added the term mitigation to the dot points
10
Page 8, last 3 lines of text – discusses the increase in risk exposure to the marina caused by projected sea level rise; and advises future monitoring. That is appropriate, but marina (breakwater) design should include appropriate sea level rise allowances. Additionally, SLR will affect the shorelines to the north and south and that process needs to be included in hazards and risks assessments – as this may interact with the presence of the new marina breakwaters.
We have added wording in the CHRMAP and the concept design report regarding sea level rise allowances in structure design. Appropriate sea level allowances are made within the structural design.
The report has been updated to include further information on the potential impacts of the marina on the adjacent shoreline (refer Section 5 of the CHRMAP).
11The SLR issue also complicates some of MP Rogers and Associates discussions on ‘increasing risk’ with longer exposure times to the prevailing wave conditions in Section 6.
Noted, the description around 'increasing risk' in Section 6 has been updated.
12
Section 3.5.2, paragraph 1 – mentions ‘the 100 year ARI event’ without specifying what thisis in terms of wave and water level joint occurrence, or even how the these individual design parameters have/will be determined at this site. The reviewer understands that report (MRA, 2015a) addresses wave modelling, but does not appear to include design wave analyses. The joint occurrence selection can affect wave overtopping (inundation). Paragraph 2 also mentions 1000-years ARI with no clear specification and then mentions breakwater damage (albeit little), but no basis of calculation.
The details of the '100 year ARI event' and others have been included in the concept design report.
We have removed reference to the 1000 year ARI event and instead made further reference to the robustness of rubble mound structures.
13
Figure 3.2 – the reviewer discussed a number of matters about the lack of detail on this plan. Some may not be available yet, but will be required for final hazard assessment. Examples are:-· What edge treatments are proposed?· How will the interior beach be maintained in place· Will the surface of the breakwater crests be paved, have a parapet wall?
These questions affect the inundation and erosion outcomes of MP Rogers & Associates analyses.
Details and cross-sections have been provided in the concept design report.
14
Section 3.7 Success Criteria – seems to ignore the marina users (boat people) who will need to be satisfied for the project to be a success. There appears as yet to be no reporting on wave climate within the marina.
We agree that the marina users will need to be satisfied for the project to be a success. However, we don't believe this is a success criteria for the CHRMAP process but instead for the detailed design process, which is yet to be completed. The Marina will be required to meet the requirements of AS3996 and WAPC DC1.8. Initial hindcast results suggest the marina is close to meeting requirements for a good harbour.
15Section 4.2.1 – use of the term ‘storm surge’ where ‘storm tide’ is more correct (total still water level) can be confusing.
We have changed the wording from 'storm surge' to 'storm tide'.
16
Table 4.2 – a sum of <$50,000 is insignificant in respect of the whole project, but could be significant to an individual. It is not clear whether or not public and private property are being considered, or public only.
We acknowledge that $50,000 may be a significant consequence to an individual but we have prepared this CHRMAP for the City of Joondalup using their risk profiling.
17Section 4.3.2 – the breakwater may be able to be raised in the future, provided that it remains sound from seabed failure, for example.
We have added wording to the report.
18Section 4.4, dot-point 4 – private property included? Yes. We have added words to this effect in Section 3.6 and 4.2.2.
19
Section 5 – the reviewer became quite confused with this section because it also discussesinundation, for example, Table 5.1 includes Inundation. Telephone discussions with MP Rogers & Associates advised the reviewer that Inundation was considered in this section because the overtopping flow might potentially cause erosion of the breakwater crest, for example. This is understood. As an example, Table 5.1, item 1, addresses Breakwater Access (Pedestrian & Vehicular) and then wave overtopping under a heading of Potential Coastal Erosion Hazard. The reviewer considered the concern to be overtopping flow effects on pedestrians and vehicles rather than erosion of the breakwater crest.
We have separated the report into two sections; Erosion and Inundation.
Erosion (Section 5) covers the erosion of the rocky and sandy shorelines adjacent to the Marina as well as the erosion of the internal beach.
Inundation (Sections 6 and 7) cover inundation of assets. We have separated this further into Development Levels and Wave Overtopping.
20MP Rogers & Associates have advised the reviewer that they will separate the processes into Inundation, Erosion and Inundation-caused erosion in the next version of the report. A short section describing
Refer above.
21Section 5.1.2 – needs to include the beach areas to the north and south as well – as mentioned above. For the minor car park area, some sub-surface geotechnical investigation will be required to provide confidence in future location security
We have provided this in Section 5 of the report. A further geotechnical invesitgation will be required prior to final siting of the minor car park.
K1217/1 City of Joondalup ‐ ORM CHRMAPMRA Response to Doug Treloar Peer Review Comments
m p rogers & associates p l
coastal & port engineers

22
Figure 5.3 – please include car-park foot print. The alignment of the dashed line describing the extent of the proposed northern breakwater is unexpected. Is it correct?
We have not included the car-park footprint as no in-depth design has been completed to date. The proposed northern breakwater alignment is general subject to final design.
23
Figure 5.4 – a section view showing inferred rock and the car-park would be helpful. This may all need to be confirmed when the project proceeds.
Given details of rock levels are limited we have chosen not to include a section of the inferred rock levels. A detailed geotechnical investigation across the site is required to be completed to assist preliminary design.
24
Section 5.2.1 – this and following sections have a confusing terminology in terms of Likelihood. It is clear that the longer a structure is in place then the more likely there is to be an overtopping event. However, the basic likelihood in a year doesn’t change, unless SLR is included. I think that the common use of the term ‘will increase over the 100 year exposure period’ should be replaced by the term ‘is greater over a 100 year exposure period than over a 5 year exposure period’. Please consider.
We have updated the wording related to Likelihood in the relevant sections.
25Table 5.3 – no basis for what shoreline loss constitutes erosion has been included. Is it 1m, 5m or 10m, say?
The erosion is less than 2 m. Details have been provided in the concept design report and summarised in the CHRMAP.
26Section 5.2.2 – this section needs to include the shorelines to the south and north. The CHRMAP has been expanded to include these shorelines.
27Table 5.4 – it seems unusual that the external fishing platforms are included in the erosion chapter (5).
The fishing platform assessment has been moved to the Inundation/Overtopping section (Sections 6 & 7).
28
Section 5.3.1 – first dot-point. It would seem that allowing dangerous wave overtopping at an average frequency of every 5 years would be against the principle of Safety in Design.
The 5 year ARI event has been selected as a cutoff for pedestrian safety as per discussions with DoT on previous breakwater structures. This event is approximately the limit in terms of wind strength for pedestrian safety, therefore it is deemed that it will be difficult for pedestrians to stand in an exposed location. The City of Joondalup may deem that this risk and management is too high and increase the level of protection provided.
29Page 27, third dot-point – what is ‘the breakwater design event’? The details of the 'breakwater design event' and others have been included in the concept
design report.
30Table 5.7 – Erosion Impact seems incompatible with a fishing platform structure. The fishing platform assessment has been moved to the Inundation/Overtopping section
(Sections 6 & 7).
31Page 30 – first dot-point – the risk really remains the same for the same period of time. It is just that more events would be likely over a longer exposure period
Agreed. We have updated the wording accordingly
32Figure 6.1 – storm surge is not necessarily associated with ‘highest tide’. Agreed, this is just a depiction of how an extreme water level can occur. We have updated
the wording appropriately.
33
Page 31, sixth dot-point – Local wind and wave setup – for what ARI or design case? The local wind and wave setup was calculated for the 500 year ARI event, which comprises a 500 year ARI winds and water levels. Further details have been added to the CHRMAP.
Please note we have refined our estimate of the 500 yr internal wind wave from 0.6 to 0.5 m, using a more refined hindcast to better define the internal wave climate.
34
Table 6.2 – No wave set-up is likely at a vertical wall. Does the result include wave run-up? If so, how was it calculated? The result of 2.7m AHD is likely to be conservative, but is it a finished floor level or a reclamation level? Electrical fittings would need to be about 1m higher.
The result includes wave run-up, as determined from the SBEACH model for runup on an impermeable sloped revetment.
The level is a development or reclamation level. The finished floor level is above this.
35
Table 6.3 – is there a design profile for the artificial beach, does it have impervious walls at its northern and southern ends?
A concept section of the internal beach has been included in the concept design report. This beach is held in place by impervious rock groynes at its northern and southern ends and may be protected at the toe by maintaining some of the existing boat harbour toe below -2 mCD.
36Figure 6.3 – what met-ocean conditions have been applied? The figure shows a frontal dune, but if erosion removes that, what is ground level behind it?
We have included details of the input met-ocean conditions. Ground levels behind the frontal dune are in the order of +8 mAHD.
37
Section 6.2.1 and Table 6.4 – did MP Rogers & Associates use a probability of exceedanceapproach for this analysis – not clear. Does this table include wave run-up? If so, how was run-up calculated?
Yes a probability of exceedance approach was used for this analysis. The result includes wave run-up, as determined from the SBEACH model for runup on an impermeable sloped revetment.
38
Table 6.5 – What does inundation of the Internal Beach mean? Does it matter? Inundation of the Internal Beach affects the usability of the beach. This may matter in the latter parts of the coming century when the beach is largely inundated at spring high tides.
39
Page 39, second dot-point – here the authors say that ‘breakwater access could only be inundated during extremely severe storm events with return periods of thousands of years … Previously the report advises that 5-years ARI will overtop, see Table 5.5. This seems very inconsistent.
This discrepancy between still water levels and wave overtopping has been resolved with the way we have separated our report sections.
40
Page 39, last dot-point – how was $5 million estimated? This is our best estimate of the cost consequences. Very few details are known on the buildings and structures that could be constructed in the Marine Commercial Zone at this concept stage.
41Table 6.6 – does this include wave run-up as per SPP No. 2.6? Yes this includes wave run-up. Wave overtopping setbacks have been treated separately.
42
Table 6.7 – will these results be revised when the marina is ‘designed’? The detailed design process will confirm or refine many of the design elements presented in the concept design report and the CHRMAP. Should any elements require updating in line with the detailed design then this would be completed then.
43
Section 7, paragraph 1 – how will SLR be monitored? It goes up and down. Would you not just take notice of WA government advice?
Yes part of the monitoring program would include reviewing sea level ris allowances for thestructures against those recommended by WA DoT, DoP and WAPC.
44Section 7.1 – if the City has responsibility, then it needs to know what might happen on those beaches.
Agreed, we have included details on the potential extent of changes to the coastal processes in Section 5 of the CHRMAP.
45
Page 44 – annual monitoring would become very onerous and expensive. Perhaps annually for five years and then if no major problems, inspect after major storms. Council officers could also be trained to observe and report damage whenever they visit the site.
Our experience suggests that ad hoc monitoring after storm events can often result in monitoring and maintenance being missed. In the long run this can cost more when significant amounts of maintenance have been allowed to accumulate or a major failure occurs as it was unnoticed. Therefore, we are proposing to keep this to annual monitoring. Once initially established, our annual monitoring of breakwater structures is very cost and time efficient for the client and has repeatedly shown to be more cost effective than ad hoc methods.
46Section 7.3 – there may be identifiable changes in beach plan alignment that need to be assessed.
We have updated the wording to include reference to beach re-alignments and monitoring.
47 Table 7.1 – shoreline mapping by aerial photographs? We have updated Table 7.1.
m p rogers & associates p l
coastal & port engineers

BJS / DLO 1/6/16
Item Comment MRA Action
1
The reviewer requests that Section 6 include a short paragraph at its beginning that explains the differences in Inundation between Sections 6 and 7 – the latter including wave run-up. The reader can be left ‘up in the air’ until he/she reaches Section 7.
We have provided further clarification on the separation of Sections 6 and 7, with particular reference to 'moving water' forces.
2
Page 22 – the authors need to provide details of what constitutes a 500-years ARI event – combined water level and waves, and why water level is the dominant parameter.
We understand that this comment refers to Page 32 not 22. We have reworded ths section to provide more detail on what constitutes the 500 year ARI event for the internal conditions.
We also note that the SPP2.6 requires that the S4 inundation assessment be completed with reference to the 500 year ARI water level conditions.
3Table 6.2 – it is understood that the results include wave run-up, but the inclusion of the word ‘Steady’ in the table title confuses the reader.
We have removed 'Steady' from the table title.
4Page 33 – needs clarification in terms of Council regulations and the need for/no need for a freeboard allowance.
We have included a sentence noting that the SPP2.6 does not require a freeboard as part of the S4 inundation assessment.
5Page 33 – the authors need to clarify the use of ‘Breakwater access’ to mean (really) breakwater crest level.
Report has been updated accordingly. It is really access along the breakwater trunk crest where maintenance access is provided. The breakwater armour crest sits higher and no access is provided to this.
6Page 33 – the authors need to advise the reader that final design of the marina elements will need to allow adaptation for SLR and the maintenance of safety.
Report has been updated accordingly. This was within the report however has been expanded to provide further detail.
7Table 6.4 – it is understood that more ARI cases than those presented by MPR were applied to the computation of the Table 6.4 results. The authors are requested to describe them.
Report has been updated accordingly.
8
Page 35 – explain the basis for adopting 500-years ARI water level and 100-years ARI wave height. The authors do not describe the wave run-up computation undertaken to reach a level of 5m AHD in the last paragraph. What wind speed was included?
Report has been updated accordingly. The combination of a 500 year ARI water level and 500 year ARI wave occurring concurrently is likely to result in conditions much greater than a 500 year ARI event.
9Page 38 – dot-point 2, have the authors defined the 1-year ARI water level at Fremantle and what is the 1-year ARI storm event?
Report has been updated accordingly.
10Section 6.3.1, Page 39 – the reader would be assisted by the inclusion of the development-area specific design levels (in brackets) for each dot-point, so that there is no need to refer back to Table 6.3 frequently.
Report has been updated accordingly.
11
In association with Table 6.9, the adaptability of the boat-ramp by raising it, for example, needs to be qualified by saying that the design needs to allow for the space required for design and construction changes that would follow significant sea level rise. This is part of the risk adaption and mitigation measures discussed in the last paragraph on Page 44.
Report has been updated accordingly.
12Page 46, below Table 7.1 – some comment on wave run-up on the internal beach is requested.
Report has been updated accordingly.
13
Page 47, last dot-point – the authors are requested to add some more write-up about the needs for final design and the possibility of refining set back distances. These may be reduced by increasing the crest level of the breakwater, for example. This will be a cost-benefit analysis.
Report has been updated accordingly.
14
Page 60, second-last dot-point – could a vehicle become trapped on the breakwater crest by wave overtopping and damage? Please comment.
Public vehicles will not be allowed to pass the Marine Commercial Zone on the northern breakwater and will not be allowed to pass the boat trailer parking on the southern breakwater. Only trained staff in a vehicle would be permitted past these points if access is required on the breakwaters. Turning circles would be provided on the breakwaters to allow them to turn around. These staff would need to judge the severity of the storm event prior to accessing the breakwaters.
We don't believe a public vehicle will be able to be trapped given the multiple paths through the marina hardstand. We have not modified the report in regards to this comment.
15Table 7.7 – adaptive design processes, such as raising the crown wall, will need to be addressed in design so that future flexibility is maintained. The authors are requested to make this clear.
Table 7.7 has been updated accordingly.
16 Appendix A – page numbers need correction. Page numbers have been corrected.
17Appendix A – extremal analyses of water levels and waves to be clarified in terms of sample population selection/analysis – Sections 2.2.2 and 2.3.1.
Paragraph in Section 2.2.2 reworded to make this clearer.
18Text below Figure 2.3 – authors to clarify that the SWR wave data is omni-directional and that the estimated transfer coefficient of 40% is not for any particular wave direction or water level.
Report has been updated accordingly.
19Appendix A, Section 2.3.2 – the reviewer would not expect much wave transmission through a properly designed breakwater core.
Agreed. This is the reviewers comment only. We included this within the report to allow quantification of 'not much'.
20 Appendix A, Page 14, dot-point 1 – correct 3.6m to 3.5m. Report has been updated accordingly.
21Appendix A, Section 4.1.1 – please specify the Kd value used in the Hudson formula, as well as the assumed density of granite.
Report has been updated accordingly.
22
Appendix A, Section 4.1.2 – for the 25m setback, the authors need to specify the overtopping rate that led to a 25m set-back being required and comment on what increase in breakwater crest level would be required to reduce this set-back.
Report has been updated accordingly.
23
Appendix A (of this Appendix A) - plans need some modification to overcome vertical scale miss-perception and the 1:25 beach slope. Inclusion of 100-years ARI at 2100 overtopping rates would improve the design record that this document is.
Plans have been updated to show the correct bottom depth for Sections A and B and the beach slope.
K1217/1 City of Joondalup ‐ ORM CHRMAPMRA Response to Doug Treloar Peer Review Comments received 31/5/16
m p rogers & associates p l
coastal & port engineers
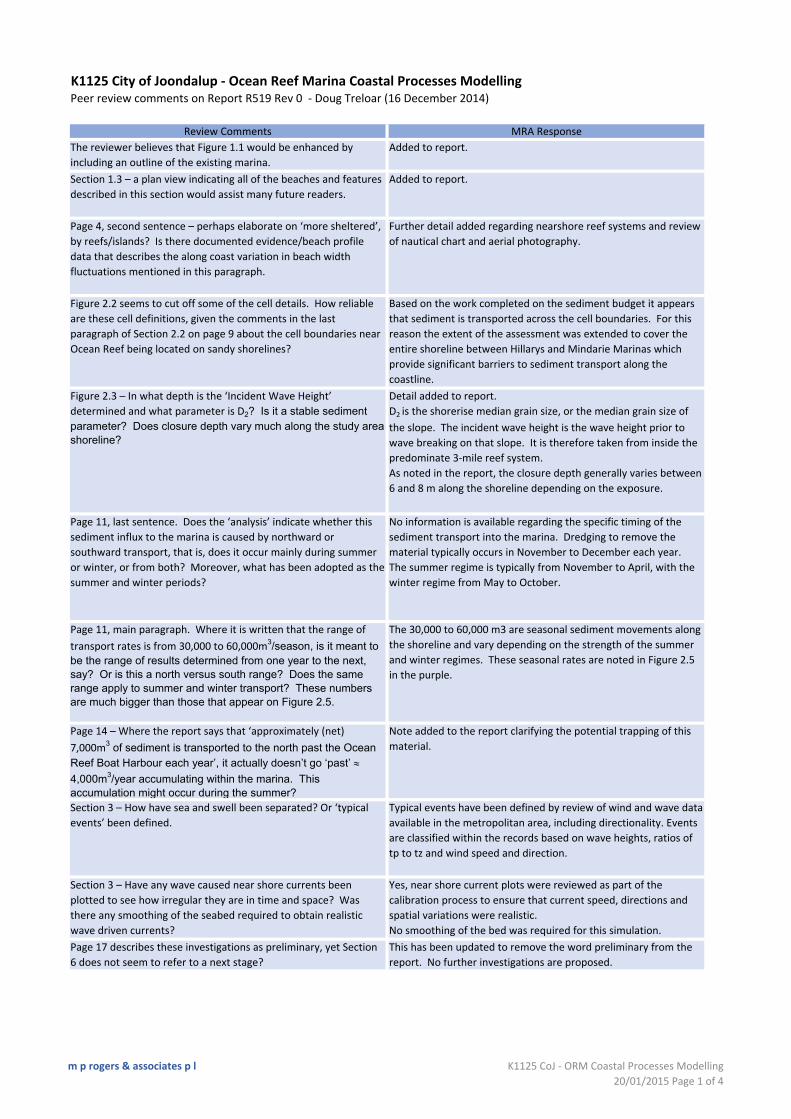
K1125 City of Joondalup ‐ Ocean Reef Marina Coastal Processes ModellingPeer review comments on Report R519 Rev 0 ‐ Doug Treloar (16 December 2014)
Review Comments MRA Response
The reviewer believes that Figure 1.1 would be enhanced by
including an outline of the existing marina.
Added to report.
Section 1.3 – a plan view indicating all of the beaches and features
described in this section would assist many future readers.
Added to report.
Page 4, second sentence – perhaps elaborate on ‘more sheltered’,
by reefs/islands? Is there documented evidence/beach profile
data that describes the along coast variation in beach width
fluctuations mentioned in this paragraph.
Further detail added regarding nearshore reef systems and review
of nautical chart and aerial photography.
Figure 2.2 seems to cut off some of the cell details. How reliable
are these cell definitions, given the comments in the last
paragraph of Section 2.2 on page 9 about the cell boundaries near
Ocean Reef being located on sandy shorelines?
Based on the work completed on the sediment budget it appears
that sediment is transported across the cell boundaries. For this
reason the extent of the assessment was extended to cover the
entire shoreline between Hillarys and Mindarie Marinas which
provide significant barriers to sediment transport along the
coastline.
Figure 2.3 – In what depth is the ‘Incident Wave Height’
determined and what parameter is D2? Is it a stable sediment parameter? Does closure depth vary much along the study area shoreline?
Detail added to report.
D2 is the shorerise median grain size, or the median grain size of
the slope. The incident wave height is the wave height prior to
wave breaking on that slope. It is therefore taken from inside the
predominate 3‐mile reef system.
As noted in the report, the closure depth generally varies between
6 and 8 m along the shoreline depending on the exposure.
Page 11, last sentence. Does the ‘analysis’ indicate whether this
sediment influx to the marina is caused by northward or
southward transport, that is, does it occur mainly during summer
or winter, or from both? Moreover, what has been adopted as the
summer and winter periods?
No information is available regarding the specific timing of the
sediment transport into the marina. Dredging to remove the
material typically occurs in November to December each year.
The summer regime is typically from November to April, with the
winter regime from May to October.
Page 11, main paragraph. Where it is written that the range of
transport rates is from 30,000 to 60,000m3/season, is it meant to be the range of results determined from one year to the next, say? Or is this a north versus south range? Does the same range apply to summer and winter transport? These numbers are much bigger than those that appear on Figure 2.5.
The 30,000 to 60,000 m3 are seasonal sediment movements along
the shoreline and vary depending on the strength of the summer
and winter regimes. These seasonal rates are noted in Figure 2.5
in the purple.
Page 14 – Where the report says that ‘approximately (net)
7,000m3 of sediment is transported to the north past the Ocean Reef Boat Harbour each year’, it actually doesn’t go ‘past’ 4,000m3/year accumulating within the marina. This accumulation might occur during the summer?
Note added to the report clarifying the potential trapping of this
material.
Section 3 – How have sea and swell been separated? Or ‘typical
events’ been defined.
Typical events have been defined by review of wind and wave data
available in the metropolitan area, including directionality. Events
are classified within the records based on wave heights, ratios of
tp to tz and wind speed and direction.
Section 3 – Have any wave caused near shore currents been
plotted to see how irregular they are in time and space? Was
there any smoothing of the seabed required to obtain realistic
wave driven currents?
Yes, near shore current plots were reviewed as part of the
calibration process to ensure that current speed, directions and
spatial variations were realistic.
No smoothing of the bed was required for this simulation.
Page 17 describes these investigations as preliminary, yet Section
6 does not seem to refer to a next stage?
This has been updated to remove the word preliminary from the
report. No further investigations are proposed.
m p rogers & associates p l K1125 CoJ ‐ ORM Coastal Processes Modelling
20/01/2015 Page 1 of 4
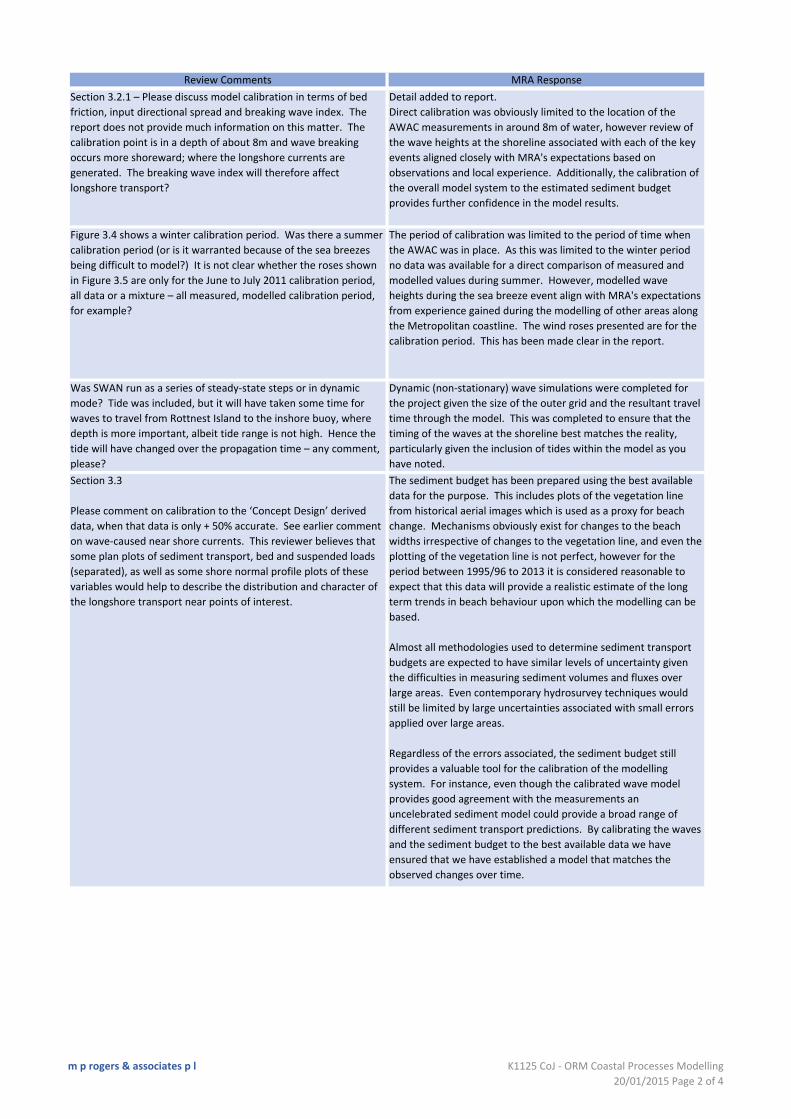
Review Comments MRA Response
Section 3.2.1 – Please discuss model calibration in terms of bed
friction, input directional spread and breaking wave index. The
report does not provide much information on this matter. The
calibration point is in a depth of about 8m and wave breaking
occurs more shoreward; where the longshore currents are
generated. The breaking wave index will therefore affect
longshore transport?
Detail added to report.
Direct calibration was obviously limited to the location of the
AWAC measurements in around 8m of water, however review of
the wave heights at the shoreline associated with each of the key
events aligned closely with MRA's expectations based on
observations and local experience. Additionally, the calibration of
the overall model system to the estimated sediment budget
provides further confidence in the model results.
Figure 3.4 shows a winter calibration period. Was there a summer
calibration period (or is it warranted because of the sea breezes
being difficult to model?) It is not clear whether the roses shown
in Figure 3.5 are only for the June to July 2011 calibration period,
all data or a mixture – all measured, modelled calibration period,
for example?
The period of calibration was limited to the period of time when
the AWAC was in place. As this was limited to the winter period
no data was available for a direct comparison of measured and
modelled values during summer. However, modelled wave
heights during the sea breeze event align with MRA's expectations
from experience gained during the modelling of other areas along
the Metropolitan coastline. The wind roses presented are for the
calibration period. This has been made clear in the report.
Was SWAN run as a series of steady‐state steps or in dynamic
mode? Tide was included, but it will have taken some time for
waves to travel from Rottnest Island to the inshore buoy, where
depth is more important, albeit tide range is not high. Hence the
tide will have changed over the propagation time – any comment,
please?
Dynamic (non‐stationary) wave simulations were completed for
the project given the size of the outer grid and the resultant travel
time through the model. This was completed to ensure that the
timing of the waves at the shoreline best matches the reality,
particularly given the inclusion of tides within the model as you
have noted.
Section 3.3
Please comment on calibration to the ‘Concept Design’ derived
data, when that data is only + 50% accurate. See earlier comment
on wave‐caused near shore currents. This reviewer believes that
some plan plots of sediment transport, bed and suspended loads
(separated), as well as some shore normal profile plots of these
variables would help to describe the distribution and character of
the longshore transport near points of interest.
The sediment budget has been prepared using the best available
data for the purpose. This includes plots of the vegetation line
from historical aerial images which is used as a proxy for beach
change. Mechanisms obviously exist for changes to the beach
widths irrespective of changes to the vegetation line, and even the
plotting of the vegetation line is not perfect, however for the
period between 1995/96 to 2013 it is considered reasonable to
expect that this data will provide a realistic estimate of the long
term trends in beach behaviour upon which the modelling can be
based.
Almost all methodologies used to determine sediment transport
budgets are expected to have similar levels of uncertainty given
the difficulties in measuring sediment volumes and fluxes over
large areas. Even contemporary hydrosurvey techniques would
still be limited by large uncertainties associated with small errors
applied over large areas.
Regardless of the errors associated, the sediment budget still
provides a valuable tool for the calibration of the modelling
system. For instance, even though the calibrated wave model
provides good agreement with the measurements an
uncelebrated sediment model could provide a broad range of
different sediment transport predictions. By calibrating the waves
and the sediment budget to the best available data we have
ensured that we have established a model that matches the
observed changes over time.
m p rogers & associates p l K1125 CoJ ‐ ORM Coastal Processes Modelling
20/01/2015 Page 2 of 4
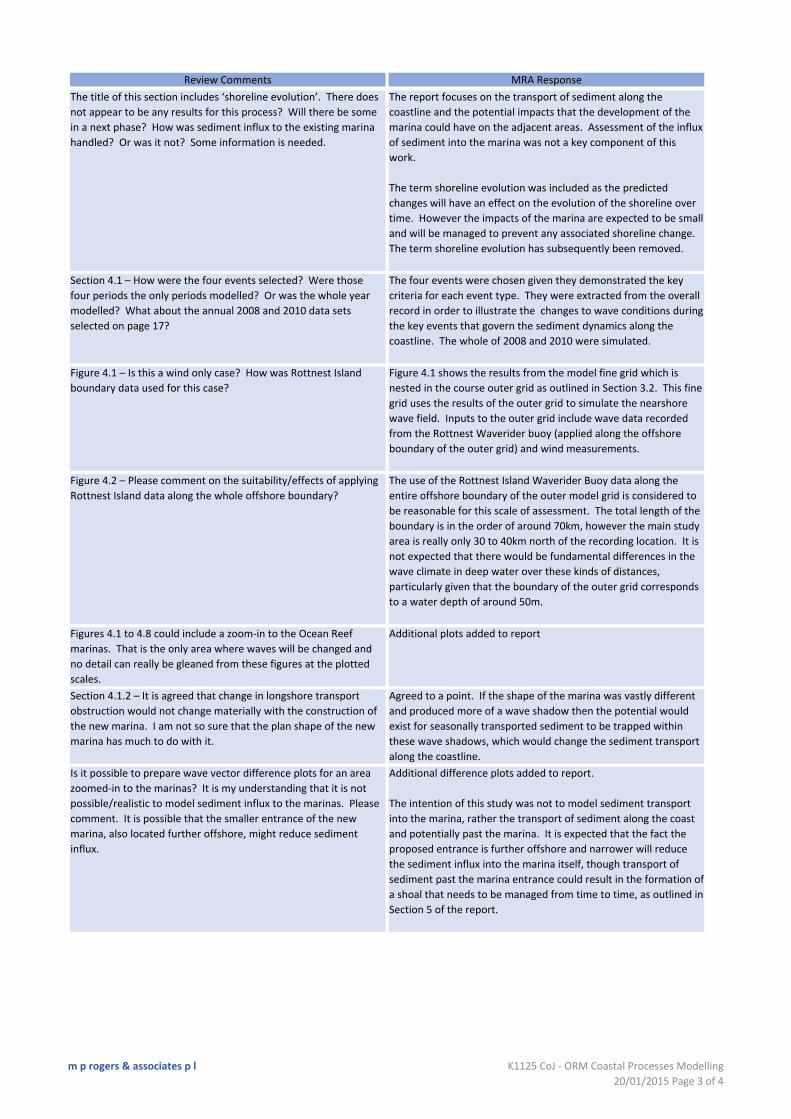
Review Comments MRA Response
The title of this section includes ‘shoreline evolution’. There does
not appear to be any results for this process? Will there be some
in a next phase? How was sediment influx to the existing marina
handled? Or was it not? Some information is needed.
The report focuses on the transport of sediment along the
coastline and the potential impacts that the development of the
marina could have on the adjacent areas. Assessment of the influx
of sediment into the marina was not a key component of this
work.
The term shoreline evolution was included as the predicted
changes will have an effect on the evolution of the shoreline over
time. However the impacts of the marina are expected to be small
and will be managed to prevent any associated shoreline change.
The term shoreline evolution has subsequently been removed.
Section 4.1 – How were the four events selected? Were those
four periods the only periods modelled? Or was the whole year
modelled? What about the annual 2008 and 2010 data sets
selected on page 17?
The four events were chosen given they demonstrated the key
criteria for each event type. They were extracted from the overall
record in order to illustrate the changes to wave conditions during
the key events that govern the sediment dynamics along the
coastline. The whole of 2008 and 2010 were simulated.
Figure 4.1 – Is this a wind only case? How was Rottnest Island
boundary data used for this case?
Figure 4.1 shows the results from the model fine grid which is
nested in the course outer grid as outlined in Section 3.2. This fine
grid uses the results of the outer grid to simulate the nearshore
wave field. Inputs to the outer grid include wave data recorded
from the Rottnest Waverider buoy (applied along the offshore
boundary of the outer grid) and wind measurements.
Figure 4.2 – Please comment on the suitability/effects of applying
Rottnest Island data along the whole offshore boundary?
The use of the Rottnest Island Waverider Buoy data along the
entire offshore boundary of the outer model grid is considered to
be reasonable for this scale of assessment. The total length of the
boundary is in the order of around 70km, however the main study
area is really only 30 to 40km north of the recording location. It is
not expected that there would be fundamental differences in the
wave climate in deep water over these kinds of distances,
particularly given that the boundary of the outer grid corresponds
to a water depth of around 50m.
Figures 4.1 to 4.8 could include a zoom‐in to the Ocean Reef
marinas. That is the only area where waves will be changed and
no detail can really be gleaned from these figures at the plotted
scales.
Additional plots added to report
Section 4.1.2 – It is agreed that change in longshore transport
obstruction would not change materially with the construction of
the new marina. I am not so sure that the plan shape of the new
marina has much to do with it.
Agreed to a point. If the shape of the marina was vastly different
and produced more of a wave shadow then the potential would
exist for seasonally transported sediment to be trapped within
these wave shadows, which would change the sediment transport
along the coastline.
Is it possible to prepare wave vector difference plots for an area
zoomed‐in to the marinas? It is my understanding that it is not
possible/realistic to model sediment influx to the marinas. Please
comment. It is possible that the smaller entrance of the new
marina, also located further offshore, might reduce sediment
influx.
Additional difference plots added to report.
The intention of this study was not to model sediment transport
into the marina, rather the transport of sediment along the coast
and potentially past the marina. It is expected that the fact the
proposed entrance is further offshore and narrower will reduce
the sediment influx into the marina itself, though transport of
sediment past the marina entrance could result in the formation of
a shoal that needs to be managed from time to time, as outlined in
Section 5 of the report.
m p rogers & associates p l K1125 CoJ ‐ ORM Coastal Processes Modelling
20/01/2015 Page 3 of 4
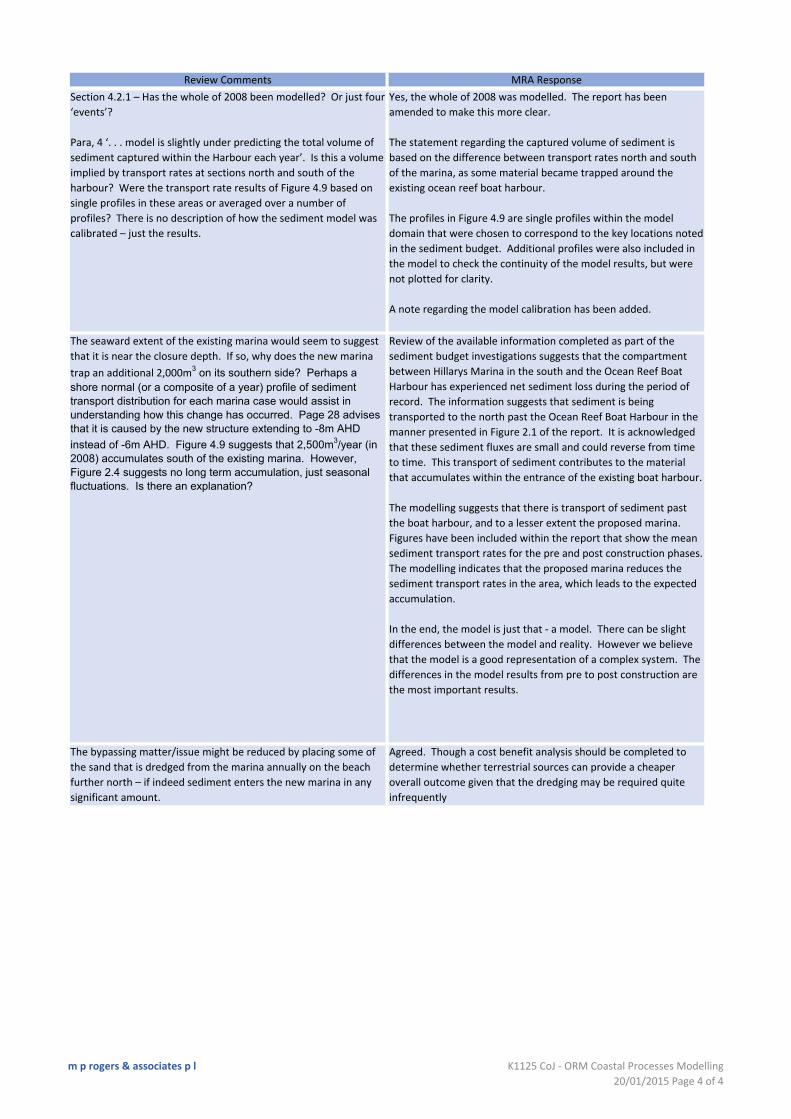
Review Comments MRA Response
Section 4.2.1 – Has the whole of 2008 been modelled? Or just four
‘events’?
Para, 4 ‘. . . model is slightly under predicting the total volume of
sediment captured within the Harbour each year’. Is this a volume
implied by transport rates at sections north and south of the
harbour? Were the transport rate results of Figure 4.9 based on
single profiles in these areas or averaged over a number of
profiles? There is no description of how the sediment model was
calibrated – just the results.
Yes, the whole of 2008 was modelled. The report has been
amended to make this more clear.
The statement regarding the captured volume of sediment is
based on the difference between transport rates north and south
of the marina, as some material became trapped around the
existing ocean reef boat harbour.
The profiles in Figure 4.9 are single profiles within the model
domain that were chosen to correspond to the key locations noted
in the sediment budget. Additional profiles were also included in
the model to check the continuity of the model results, but were
not plotted for clarity.
A note regarding the model calibration has been added.
The seaward extent of the existing marina would seem to suggest
that it is near the closure depth. If so, why does the new marina
trap an additional 2,000m3 on its southern side? Perhaps a shore normal (or a composite of a year) profile of sediment transport distribution for each marina case would assist in understanding how this change has occurred. Page 28 advises that it is caused by the new structure extending to -8m AHD
instead of -6m AHD. Figure 4.9 suggests that 2,500m3/year (in 2008) accumulates south of the existing marina. However, Figure 2.4 suggests no long term accumulation, just seasonal fluctuations. Is there an explanation?
Review of the available information completed as part of the
sediment budget investigations suggests that the compartment
between Hillarys Marina in the south and the Ocean Reef Boat
Harbour has experienced net sediment loss during the period of
record. The information suggests that sediment is being
transported to the north past the Ocean Reef Boat Harbour in the
manner presented in Figure 2.1 of the report. It is acknowledged
that these sediment fluxes are small and could reverse from time
to time. This transport of sediment contributes to the material
that accumulates within the entrance of the existing boat harbour.
The modelling suggests that there is transport of sediment past
the boat harbour, and to a lesser extent the proposed marina.
Figures have been included within the report that show the mean
sediment transport rates for the pre and post construction phases.
The modelling indicates that the proposed marina reduces the
sediment transport rates in the area, which leads to the expected
accumulation.
In the end, the model is just that ‐ a model. There can be slight
differences between the model and reality. However we believe
that the model is a good representation of a complex system. The
differences in the model results from pre to post construction are
the most important results.
The bypassing matter/issue might be reduced by placing some of
the sand that is dredged from the marina annually on the beach
further north – if indeed sediment enters the new marina in any
significant amount.
Agreed. Though a cost benefit analysis should be completed to
determine whether terrestrial sources can provide a cheaper
overall outcome given that the dredging may be required quite
infrequently
m p rogers & associates p l K1125 CoJ ‐ ORM Coastal Processes Modelling
20/01/2015 Page 4 of 4
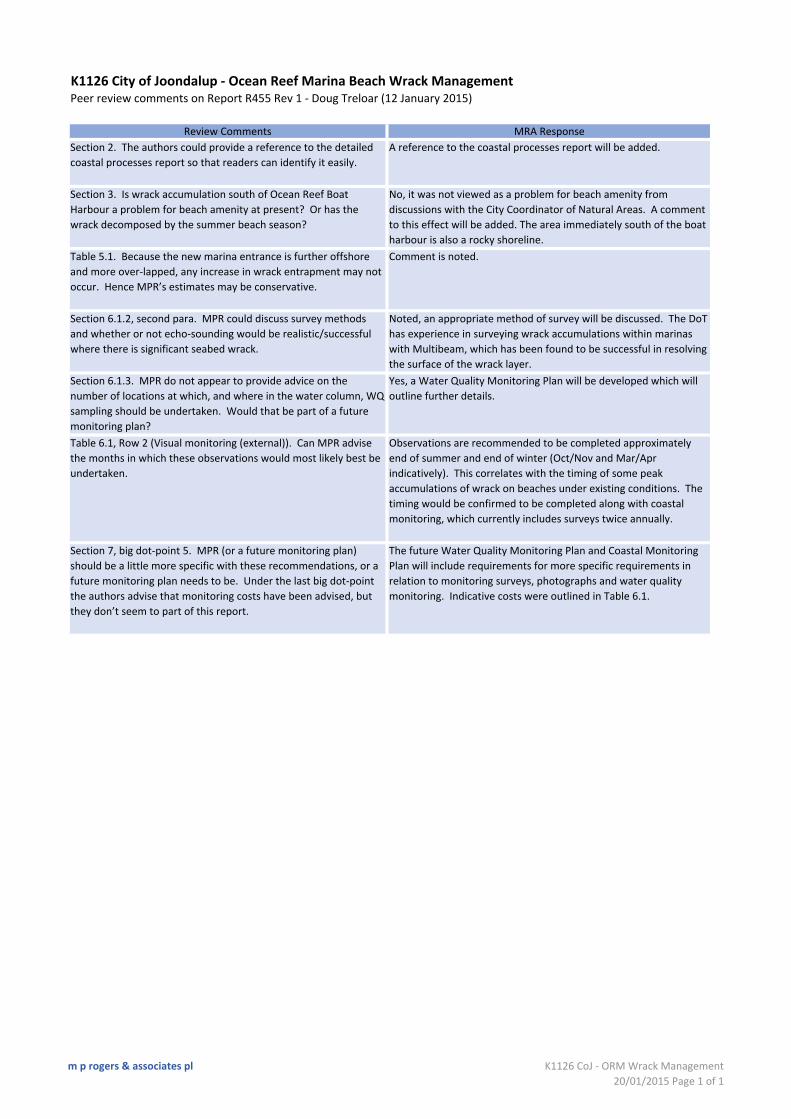
K1126 City of Joondalup ‐ Ocean Reef Marina Beach Wrack ManagementPeer review comments on Report R455 Rev 1 ‐ Doug Treloar (12 January 2015)
Review Comments MRA Response
Section 2. The authors could provide a reference to the detailed
coastal processes report so that readers can identify it easily.
A reference to the coastal processes report will be added.
Section 3. Is wrack accumulation south of Ocean Reef Boat
Harbour a problem for beach amenity at present? Or has the
wrack decomposed by the summer beach season?
No, it was not viewed as a problem for beach amenity from
discussions with the City Coordinator of Natural Areas. A comment
to this effect will be added. The area immediately south of the boat
harbour is also a rocky shoreline.
Table 5.1. Because the new marina entrance is further offshore
and more over‐lapped, any increase in wrack entrapment may not
occur. Hence MPR’s estimates may be conservative.
Comment is noted.
Section 6.1.2, second para. MPR could discuss survey methods
and whether or not echo‐sounding would be realistic/successful
where there is significant seabed wrack.
Noted, an appropriate method of survey will be discussed. The DoT
has experience in surveying wrack accumulations within marinas
with Multibeam, which has been found to be successful in resolving
the surface of the wrack layer.
Section 6.1.3. MPR do not appear to provide advice on the
number of locations at which, and where in the water column, WQ
sampling should be undertaken. Would that be part of a future
monitoring plan?
Yes, a Water Quality Monitoring Plan will be developed which will
outline further details.
Table 6.1, Row 2 (Visual monitoring (external)). Can MPR advise
the months in which these observations would most likely best be
undertaken.
Observations are recommended to be completed approximately
end of summer and end of winter (Oct/Nov and Mar/Apr
indicatively). This correlates with the timing of some peak
accumulations of wrack on beaches under existing conditions. The
timing would be confirmed to be completed along with coastal
monitoring, which currently includes surveys twice annually.
Section 7, big dot‐point 5. MPR (or a future monitoring plan)
should be a little more specific with these recommendations, or a
future monitoring plan needs to be. Under the last big dot‐point
the authors advise that monitoring costs have been advised, but
they don’t seem to part of this report.
The future Water Quality Monitoring Plan and Coastal Monitoring
Plan will include requirements for more specific requirements in
relation to monitoring surveys, photographs and water quality
monitoring. Indicative costs were outlined in Table 6.1.
m p rogers & associates pl K1126 CoJ ‐ ORM Wrack Management
20/01/2015 Page 1 of 1

K1203 City of Joondalup ‐ Ocean Reef Marina Water Quality ModellingPeer review comments on J0331 ‐ MPRA Ocean Reef Modelling Phase I ‐ Rev 1.doc ‐ Doug Treloar (16 December 2014)
Review Comments MRA/APASA Response
Section 3.1.1 – It is assumed that grid 1 in Figure 1 has the 300m grid sizes? Are all grids 3D? If not, which ones are; grid 3 only? Has APASA investigated the resolution benefits of using more than 5 vertical layers, albeit at greater computational time?
Grid 1 does have the 300m resolution and all grids are 3D. We did
early testing of different layer configurations and adopted the 5
layer option as a good balance between performance and accuracy.
Subject to performance testing in this phase, we propose to keep
the same layer structure.
Figure 2 might include the location of the current meter.
Noted, we will add a suitable figure in the study reporting
highlighting the current meter location with respect to the harbour
and related infrastructure.
Section 3.2.2, Item 3, page 6 – it is assumed that by ‘seeding’ APASA
mean that groundwater flows will include a continuous
conservative contaminant concentration that can be related to
actual nutrient concentrations. Do these concentrations vary with
season (in the model) and spatially?
Yes, the tracer will be conservative and matched to real
concentrations/loads into the marina. These will vary seasonally,
and also spatially should the groundwater analysis show meaningful
variations along the coastal margin.
It is assumed that ground water flows to the near shore area
outside the marinas would be included also. Some simulation time
would be required to reach dynamic equilibrium. Without the
exterior groundwater flows the marina may flush too quickly in
terms of nutrients – as distinct from a Rhodamine dye tracer test. It
is noted that APASA don’t appear to mention their previous model
investigations in terms of that work. Cardno had some comments
on that work from the 2011 report, see below. APASA is requested
to consider these points as they proceed to this next phase of the
project.
The intention is to include sourcing of groundwater external to the
marina to cover the requirements identified in this comment.
Related comment regarding 2011 APASA Report
Table 4.4 – The report does not seem to provide the basis for
selection of initial model temperatures ‐ the calibration period data
seems to suggest slightly higher winter temperatures? Did APASA
examine temperature time‐series when solar radiation was included
in their modelling? What do they look like?
The temperature sourcing was referenced in Section 4.4.5 of the
2011 report. We used the CTD measurements for the calibration
period, however we used monthly averages for Whitfords Lagoon
for the seasonal scenarios. The temperature time‐series were
visually inspected but not reported as noted. We will include some
examples in the reporting for this study phase.
Related comment regarding 2011 APASA Report
Figure 5.2 – is a bit mixed‐up. The title block says ‘observed’, the
legend and text say ‘Xtide’? Comparing model results driven by
Topex derived constants with measured or predicted tides prepared
using a different number of constants is not a like‐with‐like
comparison.
Our intention here was to show that the model includes a good
representation of the expected tidal variation across the domain.
Note that the fit has been improved with subsequent application in
the area, and augmented by the inclusion of sea level anomaly data
through regional model predictions.
Related comment regarding 2011 APASA Report
Figures 5.5 and 5.6 – The high modelled speeds of Figure 5.5 do not
appear in Figure 5.6? Nor in the top panel of Figure 5.4? Is there an
explanation?
Figure 5.4 is deeper in the water column, whereas the other figures
are near‐surface comparisons. The scatter plots show U and V
components, and the V component plot is slightly clipped for
presentation. Since the upper panel is speed rather than a specific
component, the direct comparison is difficult to make.
Related comment regarding 2011 APASA Report
Section 5.2.1 – last line. This outcome is contrary to the outcome in
Section 6.3 where it is stated ‘the surface layer flushes faster . . . . . .’
The earlier statement refers to the measured data during the
specific calibration period, while the latter statement relates to the
modelled scenarios under different conditions.
Related comment regarding 2011 APASA Report
Section 5.2.2 – last lines and Figures 5.11 and 5.12 – should the
curve fitting omit the first and last data points to be more realistic
with e‐folding time estimation?
We have included all data points so that all relevant observations
are included. A more conservative result might be obtained using
the middle sample set, or a different selected set of points,
however we are not sure of the validity in doing that.
Related comment regarding 2011 APASA Report
Section 7 – consider comments and request above on plan and time‐
series plots to illustrate the development of ‘dynamic equilibrium’ in
the model and spatial gradients in TN, for example.
Modelling was conducted over a 90 day period which allowed for
the build up to an equilibrium from the initial conditions. We will
ensure that analysis in this phase of the work excludes any of the
warm up period.
m p rogers & associates p l K1203 CoJ ‐ ORM Water Quality Modelling
20/01/2015 Page 1 of 3

Review Comments MRA/APASA Response
Related comment regarding 2011 APASA Report
Based on the investigations (by others) at Hilary’s marina, it is
apparent that the more buoyant ground water flows to Hilary’s
marina, the existing Ocean Reef marina and the proposed new,
expanded Ocean Reef marina, are important drivers for marina
flushing. This is considered in the APASA report, which
demonstrates that best flushing is expected in cooler, winter neap
conditions, which is counter‐intuitive. It is understood that this is
caused by the greater ground water flows in winter and the greater
stratification in neap tide conditions allowing a more structured
inflow of clean seawater at the seabed. This assumes that
exchange between the marina and the sea is high – that is, little or
none of the discharged contaminated water near the seabed returns
to the marina on the next flood tide.
We are sure as to the question here, however the comments are
noted and we believe that past measurement and the modelling
studies support the relatively rapid buoyancy driven exchange at
times, which tends to be dominant over tidal flows. Tidal induced
exchange is typically weak, and during neap tides in this area, is
almost negligible due to the very small tidal range.
As for the potential for discharged contaminents to re‐enter the
marina, this potential is accounted for by the dispersive and
advective terms in the 3d model, and by ensuring an appropriate
simulation period to reach equilibrium in this regard.
Very happy to discuss further if we have mis‐interpreted the
question/requirement.
Section 3.2, Item 4 – It is not clear what ‘most‐likely’, ‘best’ and
‘worst’ cases really mean. What is worst at one location may not be
worst at another, for example, perhaps what might be worst in
summer may not be worst for winter because some processes are
affected by temperature. Please comment.
The selection will be based on the developed model data base, and
the delineation will be made by interpretation of the data. We will
assess for a whole of marina (averaged), best and worst site case for
each of the conditions, and in reality will present the ranges in an
appropriate context.
Will the nutrient accumulation investigations include phytoplankton
processes (eventually – Section 3.5)?
In the intial phase of the work, no, predictions will be made using
conservative tracers. When the ecological component is
undertaken, phytoplankton processes will then be included.
Section 3.1.1 – What will be the basis for selecting fuel spill
volumes, location, environmental conditions? Why not include die‐
off rates for bacterial modelling?
Fuel and other contaminant volumes will be provided in
consultation with the wider project team, presumably based on an
appropriate risk assessment. Scenarios will be drawn from the
existing database of modelled conditions. Fuel spills may be
modelled either conservatively or using OILMAP. Where
contaminants have clear decay rates we can include them, however
if unknown a conservative approach should provide a suitable
prediction.
Section 3.1.1 – It is noted that it is proposed to provide modelling
results in terms of dilution. However, eventually it will be necessary
to consider concentrations of selected contaminants and that
requires the inclusion of background concentrations, which are not
just additive to nil background based results because spatial
gradients in concentration affect dispersive transport.
Understood ‐ the intension here is to present the notional dilution
contours or values so that extrapolation can be made. If the
dilution is known, then the resultant concentrations can be
predicted by formula using the source and background levels. If
modelling these explicitly, each contaminant would need to be
modelled together with appropriate background/initial conditions.
Section 3.4.1, second para. What is meant by ‘suspended sediment
load’ – concentrations, depth of deposition contours or flux? What
time‐scales for re‐suspension are to be considered? Is it intended
to model ‘typical dredging scenario cases’ or an idealised whole of
works scenario? Summer and/or winter?
Suspended sediment load refers to the TSS within the water
column, including persistence. Resuspension will be modelled
continuously through the simulations so the natural time‐scales,
which may be tidal, diurnal, weather system dependant or varying
with wave conditions will be included. Wave‐to‐wave time‐scales
will not be incorporated.
Modelling of the program will include the full works schedule for at
least two condition sets.
Section 3.4.2, Item 4 – How will APASA define bed roughness, which
affects bed shear stress. Can DREDGEMAP also include the
currents, including those generated by near shore wave activity,
from Delft3D? Is this a 3D model?
Bed roughness will be defined using a mannings n approach.
Dredgemap includes wave induced contributions to shear stress,
determined by formulations of Soulsby which are based on Van
Rijn. Current data will be fed in via the hydrodynamic model
dataset and the the model is 3D.
Section 3.4.2, Item 6 – Durations, as well as thresholds need to be
considered.
We assumed that all thresholds will likely have a magnitude and
duration component, and may be multi‐tiered as is typical of these
type of studies.
Section 3.4.2, Item 7 – The location of the wastewater treatment
outlet should be shown on a Figure.
Noted, we will add a suitable figure in the study reporting
highlighting the outlet with respect to the harbour and related
infrastructure.
m p rogers & associates p l K1203 CoJ ‐ ORM Water Quality Modelling
20/01/2015 Page 2 of 3

Review Comments MRA/APASA Response
Section 3.5.1 – Suspended sediment concentrations affect light
penetration. Will that process be included? Will the D‐WAQ
modelling be in 3D? Nutrient loads delivered by treated storm
water and groundwater within and without the proposed marina
need to be included. In the last paragraph, APASA state that
phytoplankton growth in Marmion Park will not be addressed.
However, should the new marina cause higher concentrations of
nutrients that flow out of the marina, then that outcome may cause
increased phytoplankton activity outside of the marina and it is
assumed that it is included. A map showing Marmion Park would
be helpful. Baseline nutrient concentrations are needed beyond
the marina itself for a range of reasons; including that even though
nitrogen concentration may increase, concentrations of another
contaminant may limit phytoplankton growth.
It was not our intention to model the phytoplankton dynamics
during the dredging operations, moreover looking at longer term
impacts post‐construction.
The mentioned nutrient loads will be included subject to suitable
data provision.
Appropriate baseline nutrient concentrations will be applied
throughout the domain. What we are intending is a localised
modelling concept rather than a full model of the Marine Park,
which would be a major research effort in itself.
Noted re the map ‐ we will include an appropriate representation in
the reporting of this study phase.
Section 3.5.2, Item 1 – These processes are environmentally
dependent. Has suitable literature been obtained and assessed?
Item 2 ‐ Is realistic open ocean source information available? Item 3
– Why seed? Why not allow natural phytoplankton development?
We will assess literature as part of this study scope, which has only
just commenced.
We will use the best estimate of open ocean conditions, which may
be subject to some model testing.
We find that a seed mass is needed to provide the intial source for
future potential growth ‐ think of it as the initial condition.
Overall, this requires a significant amount of computing. Does
APASA have the hardware capacity to undertake the planned
modelling in the project schedule?
Yes, we have significant computational resources and are very
experienced at completing computationally intensive projects
within very short time‐lines.
Section 3.6 – Duration of contaminant exceedance needs to be
considered as well as threshold.
Should duration components of the thresholds be provided, these
will be incorporated into the analysis.
Section 4.0, Item 4 – As well as climate change, might there not be
future depletion of the ground water resource. Item 10, is vertical
variation included? Will the report comment on large algae and
diatoms.
Acknowledged, the item would have better referred to potential
change in groundwater flows.
Vertical variation in contaminant release would be included if such
information is provided or applicable.
The ecological modelling will consider microalgae (phytoplankton)
but not macro (large) algae. Diatoms are intended to be considered
implicitly as components of a single generalised phytoplankton
group. We could model additional groups, such as diatoms
explicitly, however this has not been included in the presently
proposed study scope.
Regarding macro algae, the sediment loading maps from the
dredging component of the study could potentially be used to
assess possible dredging impacts on existing macro algae habitats if
species stress‐response can be provided.
m p rogers & associates p l K1203 CoJ ‐ ORM Water Quality Modelling
20/01/2015 Page 3 of 3

Level 2, 27-31 Troode Street West Perth WA 6005 PO Box 170 West Perth WA 6872 P +61 8 9211 1111 F +61 8 9211 1122 W apasa.com.au E [email protected]
M E M O R A N D U M
Date: 18/04/16
To: Clinton Doak
From: Ryan Alexander
Reference: J0331 – Ocean Reef Marina Development
Subject: Ocean Reef Marina Development Phase 2: Water Quality Modelling
(Rev1): responses to external review comments
Introduction
The “Ocean Reef Marina Phase 2: Water Quality Modelling (Rev1)” report was recently
reviewed P.D Treloar (DT). A new revision of the report (Rev2) has been prepared in
response to the review. The following text provides a numbered list of the review comments
(red font), followed by a responses from RPS APASA (RPS) that are now included in the
revised report.
Responses
DT01, Exec Sum, the authors need to make it clear that this report does not address the
effects of water quality changes, but rather prepares data for use by others in the overall
assessment team.
RPS: added to Exec Sum “The report doesn’t address potential subsequent effects of any
water quality changes, but rather prepares data for use by others in the overall assessment
team.”
DT02, Section 1.1, Item 2) – Is there a need to address potential spills and anti-foulant
leachate contamination? The effects of ground water should be introduced here.
RPS: added “In this context the potential contaminants include nutrients sourced from
groundwater as well as generic contaminants that might be accidentally spilt within the
marina.”
DT03, Section 1.1, last para – the authors need to explain what they mean by ‘…a common
hydrodynamic model framework.’ Is it common to MP Rogers and APASA work, or other?
RPS: changed sentence to “The various aspects of water quality modelling presented in this
report will use input data from the same hydrodynamic model”

M E M O R A N D U M
DT04, Section 1.2, Page 3, second last line – Are MP Rogers and APASA using the
same/similar Delft3D-SWAN model layouts? Please clarify any differences in layouts and
inputs.
RPS: last paragraph of Section 1.2 has been re-written
DT05, Section 2.1, last line – sediment veneer is a realistic term, but authors could add that it
is irregular in thickness and some areas are bare, at least some of the time.
RPS: added “a sediment veneer that is irregular and changeable in thickness”
DT06, Section 2.2.1, para 1 – were other anemometer sites considered? It would seem that
later in the report other wind data sources are used. The authors should advise that they use
Swanbourne only for a general description.
RPS: added “These statistics are only available for some BoM stations, which is why the
Swanbourne Station was selected as the most appropriate location for a general description
(the actual wind forcing inputs used for modelling are discussed subsequently).”
DT07, Page 8 – the authors should advise readers that the 0-15cm/s current speed is
seasonally variable.
RPS added “The alongshore component of currents speeds (monthly mean) in the Perth
coastal region (~30 m depth) are generally in the range of 0-15 cm/s depending on the
season (Pearce et al. 2006).”
DT08, Page 10, para 2 – the authors should clarify that the ≈25m is from a source point
(dredge head, for example), and that concentrations are not described well within that
distance, but that at more distant locations of environmental interest the suspended sediment
concentrations are described well.
RPS: modified paragraph 3, Section 3.3 to address the comment
DT09, Section 4.1 – Some discussion is needed about the coupling of the wave and
hydrodynamic models. They are being calibrated uncoupled (I understand), but may be used
later in the project in coupled form, which may partially ‘invalidate’ the calibration. I
understand that the model will be used in subsequent investigations to study sediment plume
movement, but not nearshore sediment transport – which is being addressed separately by M
P Rogers. This is not made clear in the report and some description would clarify the
situation.
RPS: Changed Section 4.1, second paragraph to “The wave model framework used for this
study was developed to address the specified scope of the water quality modelling. This
scope did not include nearshore sediment transport because this component was addressed
separately by MP Rogers. The wave model developed for this study was therefore
independent of that developed by MP Rogers for the assessment of coastal processes. Wave
modelling was used in this study primarily as an input to the sediment fates modelling of the
dredging and construction period, and secondarily, to provide a broad scale assessment of

M E M O R A N D U M
the potential for changes in wave climate near to abalone habitat due to the proposed ORM.
For the latter, the scope of the study didn’t include assessment of waves near enough to the
development to be affected by reflection and refraction from the ORM breakwaters (within
~100 m); this zone was assumed to within the range of abalone habitat that would be directly
impacted by the development.”
DT10, Section 3.4, para 2 – the authors should elaborate on the term ‘… respond quickly …’
in terms of whether this relates to both growth and mortality and whether or not light and
temperature are included – day and night differences; or whether this is a slightly longer term
variation in nutrient concentrations – over days.
RPS: added ”An underlying assumption of Monod-kinetics is that algal growth may respond
quickly to changes in nutrient loading, which is a conservative assumption “
added “For this study, DYNAMO was configured so that algal growth responded to nutrient
concentrations and day length. During daylight hours light was assumed non-limiting to algal
growth. The temperature dependence of algal growth was not modelled explicitly but rather,
was considered implicitly by the use of a conservative growth rate as described in Section
8.0”
DT11, Section 4.1.1, para 2 – the ≈10m grid size mentioned here conflicts with Table 4.4.
This needs to be clarified. There needs to be a statement that describes the resolution of the
ORM entrance channel and its adequacy using a 12.5m grid size for flushing processes. The
report does not advise the entrance channel width, albeit Figure 4.4 provides some
description. This figure suggests that channel width is about 30m, which is probably narrow
for major marina in terms of the marina code (AS3962). The reviewer understands that final
channel width design is part of later investigations. A wider channel would provide better
flushing and the authors should consider that point.
RPS: changed “≈10m” to “12.5m”
Added “The entrance to the ORM is resolved by at least three grid cells in the horizontal to
improve calculations of flow through this narrow structure. Therefore, the minimum entrance
width in the model is 37.5 m. This width is slightly narrower that the ~38.5 m minimum width
of the actual design entrance, implying that the model configuration is slightly conservative
with respect to flushing. “
DT12, Section 4.1.2, para 1 – implies to the reviewer that wave breaking was not included.
Discussions with MP Rogers and APASA confirm that it was and that what was meant is that
the grid size is too big to describe this process in the nearshore area, but is adequate in the
reef areas and not important near the marina entrance. The authors are requested to
clarify/elaborate this issue.
RPS: added “The chosen wave model (SWAN) was configured with a grid scale that was
adequate for the reef areas of interest but too large to resolve the nearshore areas. This
implies that the model was not configured to resolve surf zone wave breaking processes,
which are not considered relevant to transport processes related to sediment suspended by
the dredging and construction nor to the broad scale nature of the abalone habitat

M E M O R A N D U M
assessment. Similarly, the model was not configured to resolves waves in and around the
immediate vicinity of the marina (i.e. within ~100m of the breakwaters).”
DT13, Section 4.1.3, para 1 – the authors are requested to describe the selection method for
the 12-months modelling period.
RPS: added “The method for selecting a representative 12-month period is described in
Section 4.6”
DT14, Section 4.1.4 – the authors are requested to describe how the investigation has dealt
with, or how the site deals with fresh water runoff at the site – is it diverted or excluded, for
example? Or what ARI rainfall event is diverted and so on.
RPS: added “The typical operational conditions represented in the ecological model included
nutrient input from groundwater but didn’t include nutrients sourced from rainfall runoff. This
approach is based on the drainage design criteria for the ORM, which was communicated by
MP Rogers & Associates. Under the designed criteria, runoff from rainfall would not typically
discharge directly into ORM unless the rainfall event was large (i.e. 1 in 1 year event). For the
case of a large rainfall event, it was assumed that any associated runoff would be transient,
implying that the natural flushing of the ORM would counteract the potential for nutrient
accumulation and subsequent algal growth. Therefore, this type of atypical event can be
considered to fall within the broader scope of the flushing assessment presented in Section 7”
DT15, Table 4.1 – this table needs to describe the current data collection in terms of burst-
length, as well as data interval (included), and anemometer elevations and whether or not
wind data was modified to a common elevation.
RPS: added column to Table 4.1 “Sampling Burst Length”
DT16, Page 16, first sentence – does this mean that the dye experiments were used to
establish realistic eddy and dispersion coefficients?
RPS: added “, in particular, to confirm the appropriateness of the eddy and dispersion
coefficients used in the model.
DT17, Section 4.2.2.2 – clarify forecast or hindcast data application.
RPS: corrected description to hindcast
DT18, Section 4.2.2.3, para 2 – Clarify the parameter 20o – is it standard deviation?
RPS: added “A directional spread of 20° standard deviation was applied based on calibration
to the measured data sets”
DT19, Section 4.2.2.4 – The ground water flows will enhance flushing, but deliver
contaminants as well. Hence there is a difference between flushing of a contaminant not
found in the ground water and one that is found in those flows. Some discussion and

M E M O R A N D U M
understanding is needed on this point. That is, a contaminant not found in the ground water
should flush more quickly, all other matters being equal.
RPS: added paragraph “The influence of groundwater on the flushing time of a given
contaminant depends on whether the contaminant is present in the groundwater. Assuming it
is not, the effect of the groundwater will be to reduce the flushing time, all other matters being
equal. However, the reverse applies if the contaminant is present in the groundwater (e.g.
nutrients). The results of this study will address both of these cases.”
DT20, Table 4.3 – the authors should make clear that the changes in total discharges are
based on changes in marina area, but not that for both cases ground water flows beyond the
enclosed area are included so that the total flows remain the same.
RPS: added paragraph “The substantial increase in groundwater flow to the proposed ORM
relative to the existing ORBH shown in Table 4.3 is basically a result of the larger area of
ORM rather than any predicted change to groundwater flows”
DT21, Section 4.3 – the authors should confirm that dredged seabed level was included in the
ORM model set-up and that it was -3.5m AHD, broadly indicated on Figure 4.3.
RPS added “The two innermost nests of the ORBH grid were subsequently modified to
accommodate modelling of the larger proposed ORM, including updating the model
bathymetry so that nearshore areas were dredged to the design depth of -3.5 m AHD.”
Fig 4.4 Caption added “The coloured shading indicates the model bathymetry with respect to
AHD, and includes dredging of nearshore areas within the marina to a design depth of 3.5 m.“
DT22, Section 4.3.2.2 – have the different wind data sets been compared for consistency at
grid boundaries and might differences affect the outcomes? Some discussion is requested.
RPS: added “This approach can cause some discontinuity in the modelled wind field at the
boundary between grid0 and grid1, which in turn can lead to artefacts in the modelled
currents near this boundary. However, any such artefacts would not influence results because
of the distance between this boundary and the areas of interest (>10 km).”
DT23, Section 4.3.2.3 – How were salinity and temperature selected?
RPS added “The temperature and salinity HYCOM data was time matched to each simulation
period.”
DT24, Page 26 – was cloud cover modelled, and if so, was it based on measured on
modelled data? Was it really important to the analyses?
RPS added: “However, for the ORM model framework heat flux, cloud cover and atmospheric
pressure data were sourced from the CFSR model (Suranjana et al 2010). Although the
model results are typically not very sensitive to atmospheric heating, this module was
activated because of the potential for diurnal differential heating and cooling to affect marina
flushing”

M E M O R A N D U M
DT25, Page 28 – an eddy viscosity of 200m2/s seems high for a 3D model – please comment.
RPS added: The 200 m2/s value of eddy viscosity is slightly higher than the typical range
(Deltares, 2013) because the grid cells widths for grid0 are relatively large (1 km), however
the selected value is still well within the models upper limit of 1000 m2/s.
DT26, Section 4.4.1, para 2 – is the datum mean sea level or AHD?
RPS changed: “with depths given in metres relative to AHD.”
DT27, Figure 4.6 – please indicate the NOAA (WW3) data site used – if it is located on this
figure, or provide its latitude and longitude in the text.
RPS: added the lat/lon coordinate to text
DT28, Page 32, last para – are you using different wind data for the wave and current
models? Please elaborate.
RPS rearranged /modified text in 4.4.2.2 and added para “The wind data used to drive the
wave model was selected after trialing different types of wind data, i.e. measured data at fixed
stations and modelled hindcast wind data. Ultimately the hindcast wind data was selected for
the wave model while the measured data was used for the hydrodynamic model. The use of
hindcast wind data for the wave modelling and measured wind data for the hydrodynamic
modelling is inconsistent in some respects. However, this approach represents the best
compromise under the constraints of imperfect wind data and the different emphasis of the
hydrodynamic and wave models.”
DT29, Table 4.5 – are these wind speeds at 10m above ground level?
RPS added: “(corrected to 10 m)”
DT30, Table 5.1 – The speed RMSE, albeit small, are relatively large when compared with
the actual magnitudes. This is partly because current speeds are very low. Also, slight phase
differences can affect the results. Perhaps the time-series plots provide a better comparison
in this case. Please comment in the report.
RPS added: “The RMSE values, albeit small, are more significant when compared with the
actual current speed magnitudes because the actual speeds were very low. Also, slight phase
(timing) differences are likely affect the RMSE form of comparison and this means time series
plots can give a more meaningful indication of model performance.”
DT31, Section 5.1.3, para 5 and Figure 5.8, second panel up – there is a significant difference
between modelled and measured current U components, yet speed in the top panel is not so
different. Please comment on whether or not this may be caused by a directional bias in the
model?
RPS: We agree this is possible and added “It is also possible that the difference is due a
slight directional bias in the model at the AWAC-West location.” to the list of possible reasons
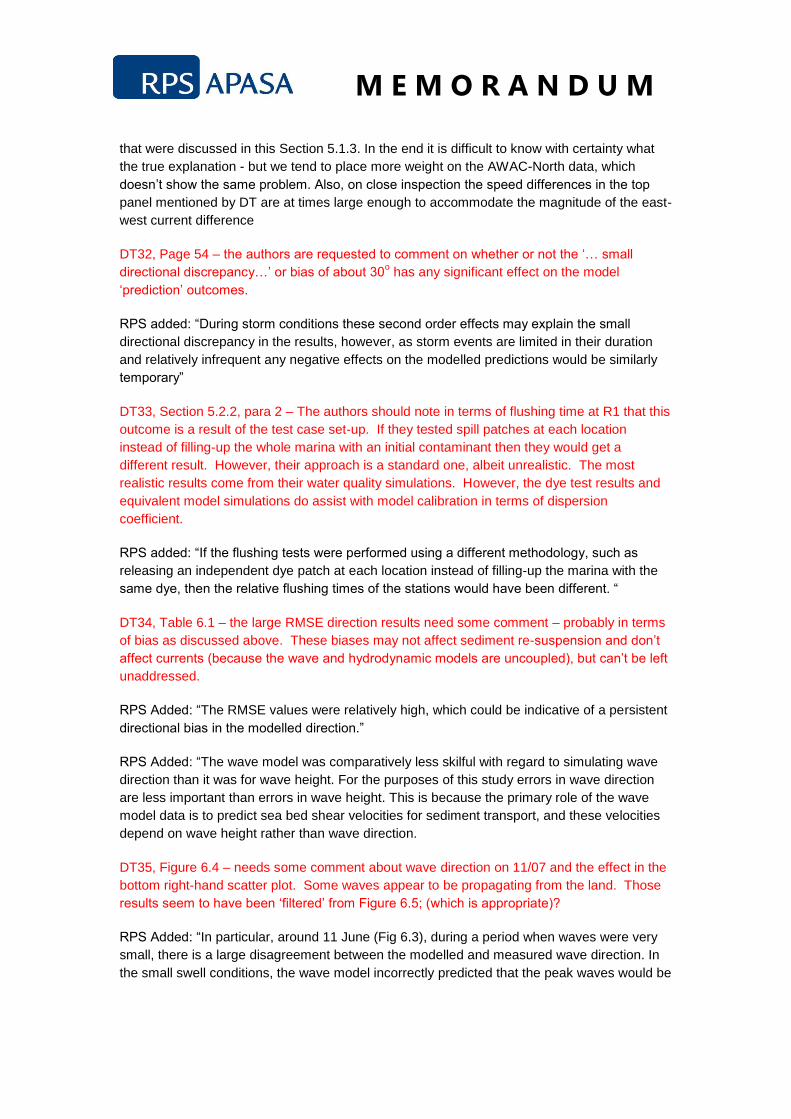
M E M O R A N D U M
that were discussed in this Section 5.1.3. In the end it is difficult to know with certainty what
the true explanation - but we tend to place more weight on the AWAC-North data, which
doesn’t show the same problem. Also, on close inspection the speed differences in the top
panel mentioned by DT are at times large enough to accommodate the magnitude of the east-
west current difference
DT32, Page 54 – the authors are requested to comment on whether or not the ‘… small
directional discrepancy…’ or bias of about 30o has any significant effect on the model
‘prediction’ outcomes.
RPS added: “During storm conditions these second order effects may explain the small
directional discrepancy in the results, however, as storm events are limited in their duration
and relatively infrequent any negative effects on the modelled predictions would be similarly
temporary”
DT33, Section 5.2.2, para 2 – The authors should note in terms of flushing time at R1 that this
outcome is a result of the test case set-up. If they tested spill patches at each location
instead of filling-up the whole marina with an initial contaminant then they would get a
different result. However, their approach is a standard one, albeit unrealistic. The most
realistic results come from their water quality simulations. However, the dye test results and
equivalent model simulations do assist with model calibration in terms of dispersion
coefficient.
RPS added: “If the flushing tests were performed using a different methodology, such as
releasing an independent dye patch at each location instead of filling-up the marina with the
same dye, then the relative flushing times of the stations would have been different. “
DT34, Table 6.1 – the large RMSE direction results need some comment – probably in terms
of bias as discussed above. These biases may not affect sediment re-suspension and don’t
affect currents (because the wave and hydrodynamic models are uncoupled), but can’t be left
unaddressed.
RPS Added: “The RMSE values were relatively high, which could be indicative of a persistent
directional bias in the modelled direction.”
RPS Added: “The wave model was comparatively less skilful with regard to simulating wave
direction than it was for wave height. For the purposes of this study errors in wave direction
are less important than errors in wave height. This is because the primary role of the wave
model data is to predict sea bed shear velocities for sediment transport, and these velocities
depend on wave height rather than wave direction.
DT35, Figure 6.4 – needs some comment about wave direction on 11/07 and the effect in the
bottom right-hand scatter plot. Some waves appear to be propagating from the land. Those
results seem to have been ‘filtered’ from Figure 6.5; (which is appropriate)?
RPS Added: “In particular, around 11 June (Fig 6.3), during a period when waves were very
small, there is a large disagreement between the modelled and measured wave direction. In
the small swell conditions, the wave model incorrectly predicted that the peak waves would be

M E M O R A N D U M
due to easterly wind waves rather than background ocean swell, which was incorrect. This
error is not significant because the wave heights are very small but it does lead to some
anomalous data points that are evident in the third panel of Fig 6.4.”
DT36, Figure 6.7 – shows directional bias. Please comment on whether this is a
consequence of model resolution. Although Table 6.1 suggests possible bias at Rottnest
Island, Figure 6.4 doesn’t. Hence bias at Ocean Reef has not been caused by model
boundary conditions. Please comment.
RPS modified/added: “The comparison wave roses at both the measurement sites show that
the model generally captures the dominant wave directions with some slight shifting evident at
the nearshore site (Fig 6.7). Specifically, the peak wave direction was slightly more northward
in the measured data. The slight shift in the overall θpeak at the nearshore site is likely due to
some smoothing of the bathymetry as a result of the resolution of the model grid. “
DT37, Section 6.3 – Rottnest Island data appears now to show bias (Table 6.2 and Figure
6.10). Comments similar to those requested for the winter period of data collection are
required, please. Could this be caused by bi-modal spectral characteristics?
RPS modified/added: “At the Rottnest measurement location there were some isolated
periods where the modelled θpeak deviated from the measured data, to a more northerly
direction (e.g. 8-13 Jun, 10-13 Jul, 8-9 Aug). These deviations occur during times of lower
wave energy (Hs < 2 m) when the wind direction is coming from the north-west to north-east.
In particular, around 11 June (Fig 6.3), during a period when waves were very small, there is
a large disagreement between the modelled and measured wave direction. In the small swell
conditions, the wave model incorrectly predicted that the peak waves would be due to
easterly wind waves rather than background ocean swell, which was incorrect. This error is
not significant because the wave heights are very small but it does lead to some anomalous
data points that are evident in the third panel of (Fig 6.4).“
DT38, Section 7.2, para 4 – please explain why flushing times during winter neap times are
shortest. Is it wind characteristics?
RPS added: “Typically, the shortest flushing times might be expected to occur in conjunction
with spring tide, all other matters being equal. But the results demonstrate that wind
conditions can dominant tidal effects if wind speeds are high.”
DT39, Table 7.2 – P50 and P80 parameters seem to be the wrong way around. Please
correct.
RPS: Tables 7.2 and 7.3 have been corrected
DT40, Figure 7.3 – is there an explanation why mean water level rises over the modelled
period?
RPS added: On some occasions the water level within the marina was affected by wind and
pressure, for example during the 9 Jan 13 period a switch to northerly winds and weather
around 15 Jan resulted in a temporary increase in water level.
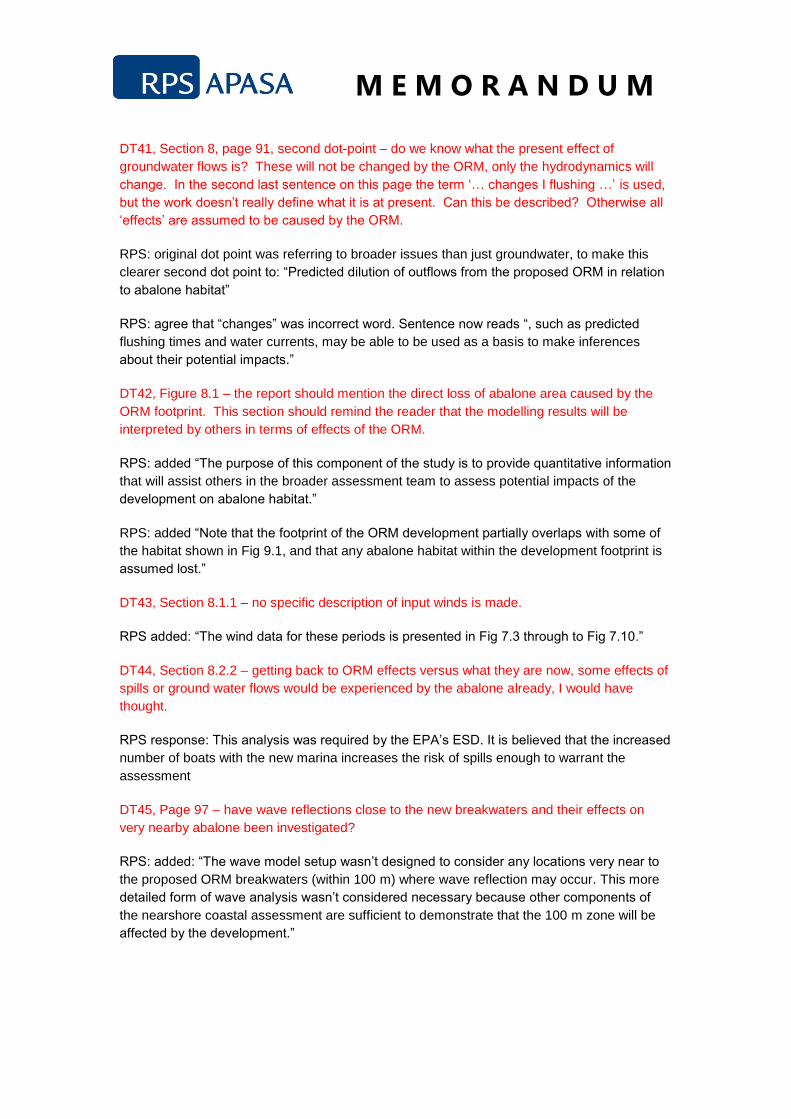
M E M O R A N D U M
DT41, Section 8, page 91, second dot-point – do we know what the present effect of
groundwater flows is? These will not be changed by the ORM, only the hydrodynamics will
change. In the second last sentence on this page the term ‘… changes I flushing …’ is used,
but the work doesn’t really define what it is at present. Can this be described? Otherwise all
‘effects’ are assumed to be caused by the ORM.
RPS: original dot point was referring to broader issues than just groundwater, to make this
clearer second dot point to: “Predicted dilution of outflows from the proposed ORM in relation
to abalone habitat”
RPS: agree that “changes” was incorrect word. Sentence now reads “, such as predicted
flushing times and water currents, may be able to be used as a basis to make inferences
about their potential impacts.”
DT42, Figure 8.1 – the report should mention the direct loss of abalone area caused by the
ORM footprint. This section should remind the reader that the modelling results will be
interpreted by others in terms of effects of the ORM.
RPS: added “The purpose of this component of the study is to provide quantitative information
that will assist others in the broader assessment team to assess potential impacts of the
development on abalone habitat.”
RPS: added “Note that the footprint of the ORM development partially overlaps with some of
the habitat shown in Fig 9.1, and that any abalone habitat within the development footprint is
assumed lost.”
DT43, Section 8.1.1 – no specific description of input winds is made.
RPS added: “The wind data for these periods is presented in Fig 7.3 through to Fig 7.10.”
DT44, Section 8.2.2 – getting back to ORM effects versus what they are now, some effects of
spills or ground water flows would be experienced by the abalone already, I would have
thought.
RPS response: This analysis was required by the EPA’s ESD. It is believed that the increased
number of boats with the new marina increases the risk of spills enough to warrant the
assessment
DT45, Page 97 – have wave reflections close to the new breakwaters and their effects on
very nearby abalone been investigated?
RPS: added: “The wave model setup wasn’t designed to consider any locations very near to
the proposed ORM breakwaters (within 100 m) where wave reflection may occur. This more
detailed form of wave analysis wasn’t considered necessary because other components of
the nearshore coastal assessment are sufficient to demonstrate that the 100 m zone will be
affected by the development.”
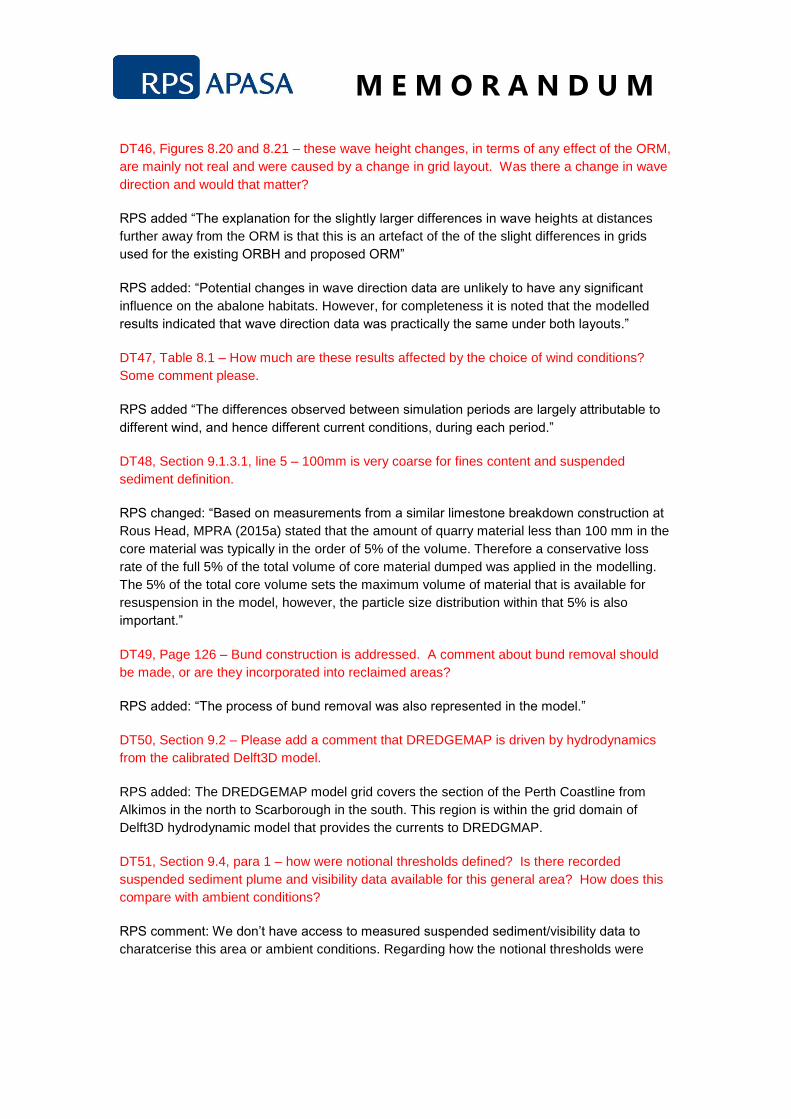
M E M O R A N D U M
DT46, Figures 8.20 and 8.21 – these wave height changes, in terms of any effect of the ORM,
are mainly not real and were caused by a change in grid layout. Was there a change in wave
direction and would that matter?
RPS added “The explanation for the slightly larger differences in wave heights at distances
further away from the ORM is that this is an artefact of the of the slight differences in grids
used for the existing ORBH and proposed ORM”
RPS added: “Potential changes in wave direction data are unlikely to have any significant
influence on the abalone habitats. However, for completeness it is noted that the modelled
results indicated that wave direction data was practically the same under both layouts.”
DT47, Table 8.1 – How much are these results affected by the choice of wind conditions?
Some comment please.
RPS added “The differences observed between simulation periods are largely attributable to
different wind, and hence different current conditions, during each period.”
DT48, Section 9.1.3.1, line 5 – 100mm is very coarse for fines content and suspended
sediment definition.
RPS changed: “Based on measurements from a similar limestone breakdown construction at
Rous Head, MPRA (2015a) stated that the amount of quarry material less than 100 mm in the
core material was typically in the order of 5% of the volume. Therefore a conservative loss
rate of the full 5% of the total volume of core material dumped was applied in the modelling.
The 5% of the total core volume sets the maximum volume of material that is available for
resuspension in the model, however, the particle size distribution within that 5% is also
important.”
DT49, Page 126 – Bund construction is addressed. A comment about bund removal should
be made, or are they incorporated into reclaimed areas?
RPS added: “The process of bund removal was also represented in the model.”
DT50, Section 9.2 – Please add a comment that DREDGEMAP is driven by hydrodynamics
from the calibrated Delft3D model.
RPS added: The DREDGEMAP model grid covers the section of the Perth Coastline from
Alkimos in the north to Scarborough in the south. This region is within the grid domain of
Delft3D hydrodynamic model that provides the currents to DREDGMAP.
DT51, Section 9.4, para 1 – how were notional thresholds defined? Is there recorded
suspended sediment plume and visibility data available for this general area? How does this
compare with ambient conditions?
RPS comment: We don’t have access to measured suspended sediment/visibility data to
charatcerise this area or ambient conditions. Regarding how the notional thresholds were
M E M O R A N D U M
defined we have added: “comparing to notional thresholds based on levels applied in previous
projects of a similar nature”
DT52, Section 9.4.1.1 – median TSS being zero is probably not realistic; could a conditional
probability be included to say that when a plume is detectable, then the median is ?
RPS response: we removed “The rapidly dispersing nature of the local waters and effect of
the daytime only construction schedule results in the median TSS elevation being zero
throughout the domain.” So that the reference to the median is no longer present, which while
it was a correct statement it could be seen as misleading in a sense.
DT53, Figures 9.10 to 9.12 – these are envelope plots and may artificially over-emphasize the
plume extents. The authors should consider including a small set of instantaneous plume
images as well, which will show smaller extents.
RPS response: We think that focusing on a random selected time step could introduce some
confusion so we have instead added “(at any particular time, the plume would only cover
fraction of this area)” to the figure legends for Fig 9.10 - 9.12 to make it explicitly clear what
these figures represent
DT54, Section 10.1 – is light penetration included? How was temperature actually included?
Was there a seasonal temperature variation? There seems to be no pre-ORM case. There
needs to be some basis for quantifying any changes caused by the ORM, which may be very
small. Please comment.
RPS Response: Comparing the ORBH and ORM layouts wasn’t part of the scope for the
water quality modelling. We agree that it would add some value to have this information but it
would require significant additional modelling effort. As the results of the water quality
modelling for ORM do not predict problematic concentrations of algae, we don’t believe
additional modelling is strictly necessary for the purpose of the assessment.
RPS added: “but solar radiation (i.e. light penetration) was assumed to be replete during
daylight hours”
RPS added: “The growth rate used in the model wasn’t dependant on water temperature;
instead this dependence was implicitly addressed by the use of a relatively high constant
growth rate.”
DT55, Figure 10.3 – might advise the reader in the caption that locations are shown on the
next figure.
RPS added: “The locations of the monitoring station are indicated in the next figure (Fig 10.2)
DT56, Figure 10.5 – a comment that there is always some growth limitation would help a
reader who is unfamiliar with these processes and plots.
RPS added: “This is due to the influence of flushing of the ORM and because the nutrient
supply isn’t ever sufficient for the algae to achieve their maximum potential growth rate.”
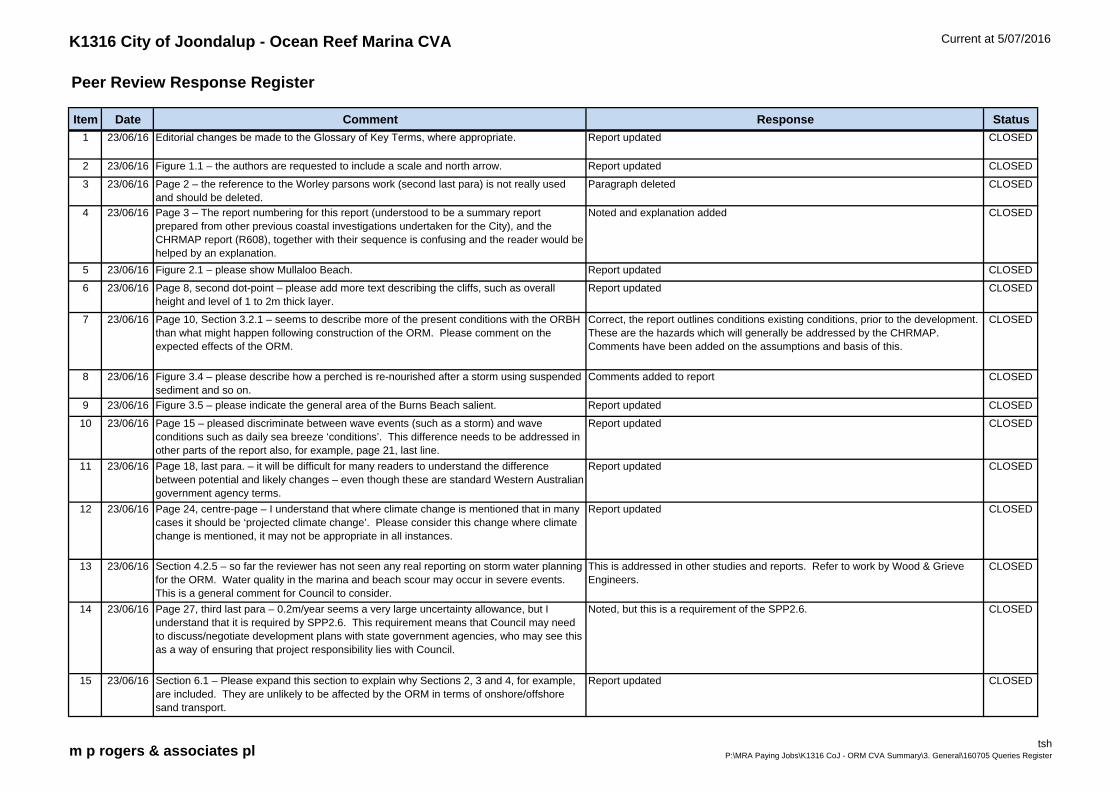
K1316 City of Joondalup - Ocean Reef Marina CVA Current at 5/07/2016
Peer Review Response Register
Item Date Comment Response Status
1 23/06/16 Editorial changes be made to the Glossary of Key Terms, where appropriate. Report updated CLOSED
2 23/06/16 Figure 1.1 – the authors are requested to include a scale and north arrow. Report updated CLOSED
3 23/06/16 Page 2 – the reference to the Worley parsons work (second last para) is not really used and should be deleted.
Paragraph deleted CLOSED
4 23/06/16 Page 3 – The report numbering for this report (understood to be a summary report prepared from other previous coastal investigations undertaken for the City), and the CHRMAP report (R608), together with their sequence is confusing and the reader would be helped by an explanation.
Noted and explanation added CLOSED
5 23/06/16 Figure 2.1 – please show Mullaloo Beach. Report updated CLOSED
6 23/06/16 Page 8, second dot-point – please add more text describing the cliffs, such as overall height and level of 1 to 2m thick layer.
Report updated CLOSED
7 23/06/16 Page 10, Section 3.2.1 – seems to describe more of the present conditions with the ORBH than what might happen following construction of the ORM. Please comment on the expected effects of the ORM.
Correct, the report outlines conditions existing conditions, prior to the development. These are the hazards which will generally be addressed by the CHRMAP. Comments have been added on the assumptions and basis of this.
CLOSED
8 23/06/16 Figure 3.4 – please describe how a perched is re-nourished after a storm using suspended sediment and so on.
Comments added to report CLOSED
9 23/06/16 Figure 3.5 – please indicate the general area of the Burns Beach salient. Report updated CLOSED
10 23/06/16 Page 15 – pleased discriminate between wave events (such as a storm) and wave conditions such as daily sea breeze ‘conditions’. This difference needs to be addressed in other parts of the report also, for example, page 21, last line.
Report updated CLOSED
11 23/06/16 Page 18, last para. – it will be difficult for many readers to understand the difference between potential and likely changes – even though these are standard Western Australian government agency terms.
Report updated CLOSED
12 23/06/16 Page 24, centre-page – I understand that where climate change is mentioned that in many cases it should be ‘projected climate change’. Please consider this change where climate change is mentioned, it may not be appropriate in all instances.
Report updated CLOSED
13 23/06/16 Section 4.2.5 – so far the reviewer has not seen any real reporting on storm water planning for the ORM. Water quality in the marina and beach scour may occur in severe events. This is a general comment for Council to consider.
This is addressed in other studies and reports. Refer to work by Wood & Grieve Engineers.
CLOSED
14 23/06/16 Page 27, third last para – 0.2m/year seems a very large uncertainty allowance, but I understand that it is required by SPP2.6. This requirement means that Council may need to discuss/negotiate development plans with state government agencies, who may see this as a way of ensuring that project responsibility lies with Council.
Noted, but this is a requirement of the SPP2.6. CLOSED
15 23/06/16 Section 6.1 – Please expand this section to explain why Sections 2, 3 and 4, for example, are included. They are unlikely to be affected by the ORM in terms of onshore/offshore sand transport.
Report updated CLOSED
m p rogers & associates pltsh
P:\MRA Paying Jobs\K1316 CoJ - ORM CVA Summary\3. General\160705 Queries Register
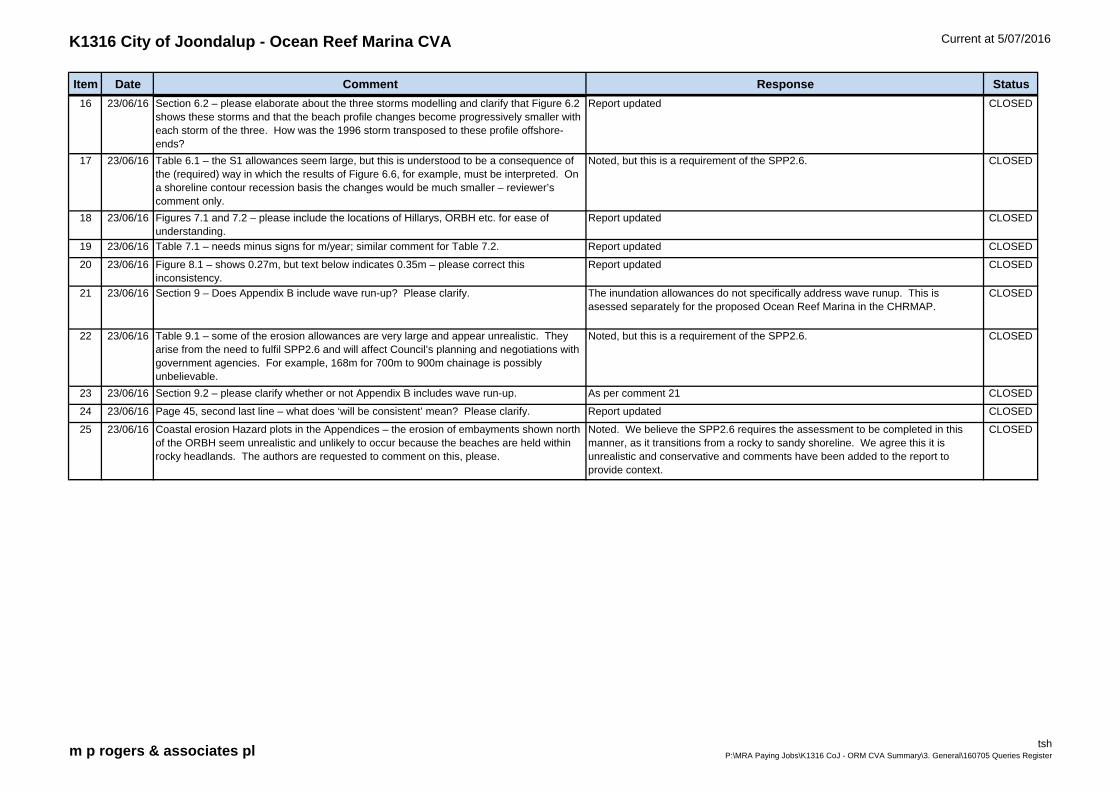
K1316 City of Joondalup - Ocean Reef Marina CVA Current at 5/07/2016
Item Date Comment Response Status
16 23/06/16 Section 6.2 – please elaborate about the three storms modelling and clarify that Figure 6.2 shows these storms and that the beach profile changes become progressively smaller with each storm of the three. How was the 1996 storm transposed to these profile offshore-ends?
Report updated CLOSED
17 23/06/16 Table 6.1 – the S1 allowances seem large, but this is understood to be a consequence of the (required) way in which the results of Figure 6.6, for example, must be interpreted. On a shoreline contour recession basis the changes would be much smaller – reviewer’s comment only.
Noted, but this is a requirement of the SPP2.6. CLOSED
18 23/06/16 Figures 7.1 and 7.2 – please include the locations of Hillarys, ORBH etc. for ease of understanding.
Report updated CLOSED
19 23/06/16 Table 7.1 – needs minus signs for m/year; similar comment for Table 7.2. Report updated CLOSED
20 23/06/16 Figure 8.1 – shows 0.27m, but text below indicates 0.35m – please correct this inconsistency.
Report updated CLOSED
21 23/06/16 Section 9 – Does Appendix B include wave run-up? Please clarify. The inundation allowances do not specifically address wave runup. This is asessed separately for the proposed Ocean Reef Marina in the CHRMAP.
CLOSED
22 23/06/16 Table 9.1 – some of the erosion allowances are very large and appear unrealistic. They arise from the need to fulfil SPP2.6 and will affect Council’s planning and negotiations with government agencies. For example, 168m for 700m to 900m chainage is possibly unbelievable.
Noted, but this is a requirement of the SPP2.6. CLOSED
23 23/06/16 Section 9.2 – please clarify whether or not Appendix B includes wave run-up. As per comment 21 CLOSED
24 23/06/16 Page 45, second last line – what does ‘will be consistent’ mean? Please clarify. Report updated CLOSED
25 23/06/16 Coastal erosion Hazard plots in the Appendices – the erosion of embayments shown north of the ORBH seem unrealistic and unlikely to occur because the beaches are held within rocky headlands. The authors are requested to comment on this, please.
Noted. We believe the SPP2.6 requires the assessment to be completed in this manner, as it transitions from a rocky to sandy shoreline. We agree this it is unrealistic and conservative and comments have been added to the report to provide context.
CLOSED
m p rogers & associates pltsh
P:\MRA Paying Jobs\K1316 CoJ - ORM CVA Summary\3. General\160705 Queries Register