Public Disclosure Authorized - World Bank · Report No: 75089-ZM . INTERNATIONAL DEVELOPMENT...
152
Document of The World Bank FOR OFFICIAL USE ONLY Report No: 75089-ZM INTERNATIONAL DEVELOPMENT ASSOCIATION INTERNATIONAL FINANCE CORPORATION AND MULTILATERAL INVESTMENT GUARANTEE AGENCY COUNTRY PARTNERSHIP STRATEGY FOR THE REPUBLIC OF ZAMBIA FOR THE PERIOD FY13-FY16 February 15, 2013 Zambia Country Management Unit Africa Region The International Finance Corporation Africa Region The Multilateral Investment Guarantee Agency This document has a restricted distribution and may be used by recipients only in the performance of their duties. Its contents may not otherwise be disclosed without World Bank Authorization Public Disclosure Authorized Public Disclosure Authorized Public Disclosure Authorized Public Disclosure Authorized Public Disclosure Authorized Public Disclosure Authorized Public Disclosure Authorized Public Disclosure Authorized Public Disclosure Authorized Public Disclosure Authorized Public Disclosure Authorized Public Disclosure Authorized
Transcript of Public Disclosure Authorized - World Bank · Report No: 75089-ZM . INTERNATIONAL DEVELOPMENT...

Document of
The World Bank
FOR OFFICIAL USE ONLY
Report No: 75089-ZM
INTERNATIONAL DEVELOPMENT ASSOCIATION
INTERNATIONAL FINANCE CORPORATION
AND
MULTILATERAL INVESTMENT GUARANTEE AGENCY
COUNTRY PARTNERSHIP STRATEGY
FOR THE
REPUBLIC OF ZAMBIA
FOR THE PERIOD FY13-FY16
February 15, 2013
Zambia Country Management Unit
Africa Region
The International Finance Corporation
Africa Region
The Multilateral Investment Guarantee Agency
This document has a restricted distribution and may be used by recipients only in the performance of their duties. Its contents may not otherwise be disclosed without World Bank Authorization
Pub
lic D
iscl
osur
e A
utho
rized
Pub
lic D
iscl
osur
e A
utho
rized
Pub
lic D
iscl
osur
e A
utho
rized
Pub
lic D
iscl
osur
e A
utho
rized
Pub
lic D
iscl
osur
e A
utho
rized
Pub
lic D
iscl
osur
e A
utho
rized
Pub
lic D
iscl
osur
e A
utho
rized
Pub
lic D
iscl
osur
e A
utho
rized
Pub
lic D
iscl
osur
e A
utho
rized
Pub
lic D
iscl
osur
e A
utho
rized
Pub
lic D
iscl
osur
e A
utho
rized
Pub
lic D
iscl
osur
e A
utho
rized

i
CURRENCY EQUIVALENTS (Exchange Rate as of February 13, 2013)
Currency Unit = Kwacha (ZMW)
US$ 1 = ZMW 5.33
FISCAL YEAR
July 1 – June 30
ABBREVIATIONS AND ACRONYMS
AAA Analytical and Advisory Activities
ACET Africa Center for Economic Transformation
ADSP Agriculture Development Support Project
AfDB African Development Bank AFR Africa region APL Adaptable Program Loan APPSA Agricultural Productivity Program for
Southern Africa ARDE Annual Review of Development
Effectiveness ARPP Annual Report on Portfolio
Performance BDS Business Development Services BW Business Warehouse CAADP Comprehensive Africa Agriculture
Development Program CAE Country Assistance Evaluation CARDESA Center for Coordination of Agricultural
Research for Southern Africa CAS Country Assistance Strategy CASCR Country Assistance Strategy
Completion Report CBPP Contagious bovine pleuropneumonia CD Country Director CFR Corporate Finance and Risk
Management CIWA Cooperation in International Waters in
Africa CMU Country Management Unit CODE Committee on Development
Effectiveness COMESA Common Market for Eastern and
Southern Africa CP Cooperating Partner CPI Corruption Perception Index
CPFL Consumer Protection and Financial Literacy
CPS Country Partnership Strategy CSO Civil Society Organization DDCC District Development Coordinating
Committee DEC Development Economics DFGG Demand for Good Governance DFID United Kingdom Department for
International Development EITI Extractive Industries Transparency
Initiative ESSD Environmental and Socially Sustainable
Development network ESW Economic and Sector Work FBD Farm Block Development FDI Foreign Direct Investment FISP Farmer Input Support Program FM Financial Management FMD Foot and mouth disease FNDP Fifth National Development Plan FPD Financial and Private Sector
Development network FRA Food Reserve Agency GAC Governance and Anti-corruption GAFSP Global Agriculture and Food Security
Program GEF Global Environment Facility GDP Gross Domestic Product GRZ Government of the Republic Zambia GPF Global Partnership Facility HDN Human Development network HDI Human Development Index HIPC Heavily Indebted Poor Countries HR Human Resources HRITF Health Results Innovation Trust Fund IBRD International Bank for Reconstruction
and Development

ii
ICR Implementation Completion and Results Report
ICRR Implementation Completion and Results Report Review
ICT Information Communication Technology
IDA International Development Association IDSP Irrigation Development Support Project IEG Independent Evaluation Group IFC International Finance Corporation IFMIS Integrated Financial Management
Information System IFPRI International Food Policy Research
Institute IL Investment Loan ILO International Labor Organization IMF International Monetary Fund INF Infrastructure network ISF Investment Support Fund ISR Implementation Status and Results
Report JASZII Second Joint Assistance Strategy for
Zambia KfW Kreditanstalt Für Wiederaufbau KLC Knowledge and Learning Council LEAP Liquidity Enhanced Asset Program LCMS Living Conditions Monitoring Survey LCR Latin America and the Caribbean region LDAHP Livestock Development and Animal
Health Project LIC Low Income Country LWSC Lusaka Water and Sewerage Company MAG Mutual Accountability Group MCA Millennium Challenge Account MD Managing Director MDG Millennium Development Goals MDR Multilateral Debt Relieve MIC Middle-income country MIGA Multilateral Investment Guarantee
Agency MLGH Ministry of Local Government and
Housing MLT Matrix Leadership Team MMD Movement for Multi-Party Democracy MNA Middle East and North Africa region MOF Ministry of Finance MSME Medium, Small and Micro Enterprises MTEF Medium Team Expenditure Framework ND Newcastle disease NFNC National Food and Nutrition
Commission NGO Non-Governmental Organization NHSP National Health Strategic Plan NWASCO National Water Regulator National
Water Supply and Sanitation Council ODA Official Development Assistance
OPCS Operations Policy and Country Services PAF Performance Assessment Framework PDCC Provincial Development Coordinating
Committee PDO Project Development Objective PEFA Public Expenditure and Financial
Accountability PETS Public Expenditure Tracking Survey PF Patriotic Front PFM Public Financial Management PIU Project Implementation Unit PRBS Poverty Reduction Budget Support PREM Poverty Reduction and Economic
Management network PRSC Poverty Reduction Support Credit PPAR Project Performance Assessment Report PPCR Pilot Program for Climate Resilience PPIAF Public-Private Infrastructure Advisory
Facility PPP Public Private Partnership PSDRP Public Sector Development Reform
Program PSRP Public Sector Reform Program P4R Program for Results QAG Quality Assurance Group RDA Road Development Agency REC-TCC Regional Economic Communities
Transport Coordinating Committee ROSC-A&A Report on Observance of Standards and
Codes-Accounting and Auditing RRMP Road Rehabilitation Maintenance
Project SACMEQ Southern and Eastern Africa
Consortium for Monitoring Educational Quality
SADC South African Development Community
SAG Sector Advisory Groups SAR South Asia Region SB Sector Board SD Sector Director SDN Sustainable Development network SDR Special Drawing Rights SEED Support for Economic Expansion
Diversification SM Sector Manager SME Small and Medium Enterprise SMS Short Message Service SMU Sector Management Unit SNDP Sixth National Development Plan SSATP Sub-Saharan Africa Transport Policy
Program TA Technical Assistance TB Tuberculosis TF Trust Fund UNDP United Nation Development Program

iii
UNICEF United Nations Children’s Fund UNWTO United Nations World Tourism
Organization UPND United Party for National Development USAID United States Agency for International
Development US United States VP Vice President VPU Vice Presidential Unit WBG World Bank Group WBI World Bank Institute WGI World Governance Indicators WDR World Development Report WHO World Health Organization WSP Water and Sanitation Program WSPIP Water Sector Performance
Improvement project
ZANACO Zambia National Commercial Bank ZDHS Zambia Demographic and Health
Survey ZEITI Zambia Extractive Industries
Transparency Initiative ZICA Zambia Institute of Chartered
Accountants ZMLCI Zambian Mining Local Content
Initiative
IDA IFC MIGA Vice President: Makhtar Diop Bernard Sheahan (Acting) Michel Wormser Director: Kundhavi Kadiresan Cheikh Oumar Seydi Ravi Vish Task Team Leaders: Nalini Kumar Sylvain Kakou Stephan Dreyhaupt

iv
REPUBLIC OF ZAMBIA COUNTRY PARTNERSHIP STRATEGY
TABLE OF CONTENTS
EXECUTIVE SUMMARY .................................................................................................... vii
INTRODUCTION .................................................................................................................... 1
I. COUNTRY CONTEXT ........................................................................................................ 2
A. Institutional and Political Context ................................................................................ 2 B. Poverty and Social Context ........................................................................................... 3 C. Economic Context ......................................................................................................... 5 D. Key Development Challenges ....................................................................................... 9 E. Zambia’s Development Strategy................................................................................. 16 F. Development Partner Support ..................................................................................... 17
II. LESSONS LEARNED FROM A REVIEW OF THE PAST WBG ASSISTANCE ......... 18
A. Implementation of the last Country Assistance Strategy (CAS) ................................ 18 B. IDA, Trust Funds and Analytical and Advisory Services........................................... 19 C. Multilateral Investment Guarantee Agency ................................................................ 19 D. International Finance Corporation .............................................................................. 20 E. Lessons Learned.......................................................................................................... 20
III. THE COUNTRY PARTNERSHIP STRATEGY IN ZAMBIA ....................................... 21
A. The CPS and the WBG Strategies .............................................................................. 21 B. The Guiding Principles for WBG Engagement in Zambia ......................................... 22 C. WBG Financial Resources under the CPS .................................................................. 24 D. CPS Instruments.......................................................................................................... 25
IV. PROPOSED CPS OBJECTIVES AND EXPECTED RESULTS .................................... 25
A. Objective One: Reducing Poverty and the Vulnerability of the Poor ......................... 25 B. Objective Two: Improving Competitiveness and Infrastructure for Growth and
Employment ................................................................................................................ 30 C. Objective Three: Improving Governance and Strengthening Economic
Management ................................................................................................................ 35
V. RISKS AND MITIGATION .............................................................................................. 40
A. Political Risks ............................................................................................................. 40 B. Institutional Risks ....................................................................................................... 41 C. External Shocks .......................................................................................................... 42
EndNote .................................................................................................................................. 42
References ............................................................................................................................... 44
Annex 1: Zambia CPS Results Matrix .................................................................................... 48
Annex 2: Zambia at a Glance .................................................................................................. 58

v
Annex 3: Key Social Indicators .............................................................................................. 60
Annex 4a: Millennium Development Goals ........................................................................... 61
Annex 4b: Progress on MDGs for Zambia ............................................................................. 62
Annex 5: Key Economic Indicators ........................................................................................ 64
Annex 6: Key Exposure Indicators ........................................................................................ 66
Annex 7: Selected Indicators* of Bank Portfolio Performance and Management ................. 67
Annex 8: Operations Portfolio (IBRD/IDA and Grants) ........................................................ 68
Annex 9: On-going IDA Projects Approved before CPS by Sector ....................................... 69
Annex 10: World Bank Indicative Lending and AAA Plan FY13-16 .................................... 70
Table 1: Summary Lending ................................................................................................ 70 Table 2: Details on the Indicative Lending noted in Table 1 .............................................. 70 Table 3: World Bank Analytical and Advisory Activities under the Africa Strategy
by Fiscal Year ............................................................................................................. 72
Annex 11: Active Trust Fund Portfolio .................................................................................. 74
Annex 12: Zambia: IFC Investment Operations Program ...................................................... 76
Annex 13: Copper in Zambia .................................................................................................. 77
Annex 14: Regional Projects and Programs ........................................................................... 80
Annex 15: Client Survey and CPS consultations .................................................................... 84
Annex 16: Gender Integration in Projects .............................................................................. 86
Annex 17: Summary of Performance Indicator Ratings, 2008 and 2012 (draft) PEFA Assessments ............................................................................................................................ 88
Annex 18: Connecting the Non-State Actors with the State to Contribute to Greater Development Impact: Approach and Tools ............................................................................ 92
Annex 19: Zambia Cooperating Partners Division of Labor Matrix ...................................... 95
Annex 20: ZAMBIA CAS COMPLETION REPORT ........................................................... 96

vi
This Country Partnership Strategy was prepared under the guidance of Kundhavi Kadiresan, Country Director for Zambia, Malawi and Zimbabwe. The CPS core team included: Nalini Kumar (task team leader, Senior Operations Officer), Jumbe Ngoma, Ngao Mubanga and Patricia Palale. Major contributions to the report were made by the following members of the Zambia Country Team: Asumani Guloba, Sylvain Kakou (IFC), Praveen Kumar, Rosemary Musonda Sunkutu, Stephan Dreyhaupt (MIGA), Pazhayannur K. Subramanian and Vijay Pillai. Support to this team was provided by Lucy Mukuka, Cathleen Chuma Sosopi and Grace Soko. In addition to the above, the following made important contributions to this strategy: John Barham (IFC), Gunhild Berg, Sofia Bettencourt, Kate Bridges, Melissa Brown, Collins Chansa, Frank Douamba (IFC), Bhadra Durgabakshi, Indira Ekanayake, David Evans, Ben Gerike, Fareed Hassan, Conor Healy (MIGA), Wedex Ilunga, Martin Kachingwe, Daniel Kirkwood, Rama Lakshminarayanan, Bryan Land, John Makumba, Patricio Marquez, Ernest Matongo, John McIntire, Jean-Michel Pavy, Brian Mtonya, Alex Mwanakasale, Cecil Nundwe, Kathrin Plangemann, Thomas Ramin, Anwar Ravat, Bobak Rezaian, Justin Runji, Henry Schiembe (IFC), Barbara Mwila Kazimbaya-Senkwe, David Sislen, Cornelia Tesliuc, Ivan Velev, Michael Webster, Marcus Wishart and Willem Zijp. This CPS also acknowledges the significant contributions of the technical team from the Government of the Republic of Zambia, in particular the Secretariat from the Ministry of Finance.

vii
REPUBLIC OF ZAMBIA COUNTRY PARTNERSHIP STRATEGY
EXECUTIVE SUMMARY
Background: Zambia has had a long period of political stability. With strong growth in the last decade the country has reached lower middle income status. However, the economy remains mainly dependent on copper and more than 60 percent of Zambians live below the poverty line. Human development indicators lag the Sub-Saharan Africa average. Over the past decade the Gini coefficient worsened from 0.47 to 0.52. The potential and the need to increase agricultural productivity and develop the private sector remain huge.
Government development plan and CPS alignment: The Government that came to power in September 2011 aims for a better Zambia for all and identified poverty reduction, jobs creation and improving governance as its main priorities. The Sixth National Development Plan identifies the following overarching objectives: to accelerate infrastructure development, economic growth and diversification; promote rural investment and accelerate poverty reduction; and enhance human development. The CPS is aligned with the Government’s development priorities. In a country that displays both low income and middle income characteristics, the CPS will support three objectives that speak to the dual nature of Zambia’s development challenges and opportunities: (i) Reducing poverty and the vulnerability of the poor; (ii) Improving competitiveness and infrastructure for growth and employment: (iii) Improving governance and strengthening economic management. The specific activities supported have been identified through the systematic application of several guiding principles to enhance relevance and selectivity.
Aid flows to Zambia are declining and the Government is looking to the private market to raise resources. The Bank’s contribution to Zambia’s needs for development finance during the CPS period will be relatively small (IDA about US$100 million a year). Building on lessons of experience from the last CAS and working with other cooperating partners, World Bank, IFC and MIGA (WBG) will: (i) intervene pragmatically and selectively in areas where its limited resources can play a catalytic role and support public goods that provide the basis for economic development; (ii) increasingly leverage its global outreach and draw upon knowledge and partnerships to bring technical expertise and knowledge to bear on Zambia’s development; (iii) adopt an incremental approach to supporting reform that has proven effective in Zambia.
Reducing poverty and vulnerability of the poor: The WBG will provide support in areas such as research, extension, irrigation, rural roads, agri-business development, to help unlock the potential of the agriculture sector in which the majority of the poor, particularly women, are engaged. Programs designed to protect vulnerable families and promote job opportunities among them will be supported.
Improving competitiveness and infrastructure for growth and employment: IFC and World Bank will together provide support for enhancing the enabling environment for private sector development. Projects for improving supply and access to electricity, transport infrastructure, access to finance and better access to water for hydro-power generation and industry will be implemented. The CPS gives special attention to promoting greater regional integration and cooperation in matters of trade, transport policy, agricultural research and water resource management.

viii
Improving governance and strengthening economic management: Strengthening institutions and capacity so that Zambia can use its growing domestic resources and non-concessional borrowing effectively to support its development will be a priority. Other activities, such as building statistical capacity, monitoring and evaluation and providing timely and credible economic information to inform policy debate will also be supported.
The Bank will work with the Government to monitor portfolio performance and is taking several steps to improve portfolio quality and disbursements. There are political, institutional and external risks involved in achieving the results of the CPS but the WBG will take steps to mitigate those risks. A CPS progress report in 2014 will provide an opportunity to update the assessment of the country context and opportunities and risks.


1
REPUBLIC OF ZAMBIA COUNTRY PARTNERSHIP STRATEGY
INTRODUCTION
1. Zambia is riding on a number of successes. The economy has grown at 5.7 percent per annum over the last decade and Zambia was among the 10 fastest growing economies of Sub-Saharan Africa in 2012. Fast growth has enabled it to attain lower middle income country (MIC) status with a nominal per capita income of US$1,299 (2011). Investor confidence has been high as evidenced in the successful issue of the US$750 million Euro bond. In 2011 it successfully held national elections in which the long standing ruling party was defeated by the opposition and there was a peaceful transfer of power. 2. Zambia also presents difficult development challenges. The economy remains largely undiversified and mainly dependent on copper with economic activity mostly concentrated in the urban areas. Income distribution is highly unequal (0.52 Gini co-efficient) and on several development dimensions the country is indistinguishable or worse than many low income countries (LIC) (Table 1). Zambia is also lagging on a number of MDG targets—particularly those on extreme poverty and maternal and child mortality (Annex 4). Institutional capacity remains weak and according to the recent public sector governance surveys such as the World Governance Indicators (WGI) (see Annex 2) and Transparency International’s Corruption Perception Index (CPI) where Zambia ranked 91st out of 153, the country’s governance challenges need to be addressed. Recent Government actions (e.g. reversal of the railway concession, interest rate cap) are perceived by some sections of stakeholders as having created incoherence in the policy environment.
Table 1: Some development dimensions: Zambia, Lower middle income and Low income countries Zambia Lower Middle Income Low Income Zambia GNI per capita (Atlas) 2011 against average cut-off for lower middle income and low income countries(US$)
1,160 (1,299 nominal per capita)
1,026 or more (average cut off)*
1,025 or less (average cut off)*
Poverty rates PPP ($1.25 per day)/National Poverty line
68.5/60.5
Comparator countries Cameroon 10/39.9 Ghana28.6/28.5
Comparator countries Ethiopia 39/38.9 Uganda 38/24.5
Under 5 mortality per 1000 live births 119 69 108
Maternal mortality per 100,000 live births
591 300 590
Life expectancy 49 65 59 Source: WDI 2012, UNDP 2011a. Note: Latest available data. *As per World Bank July 2012 classification of low-income and lower middle income countries. Lower and upper middle income countries are separated at an average income of US $4,036.
3. The Government aims to reduce poverty, create jobs and make Zambia a prosperous MIC by 2030. The Government aims for a better Zambia for all and build on the country’s rich resources (land, water and minerals) and past achievements to make growth inclusive. The Vision 2030 document lays out the country’s aspirations and the challenges of achieving prosperous MIC status over the next generation. The Sixth National Development Plan (SNDP) elaborates the medium-term development objectives for the period 2011-2015 focusing on policies, strategies and programs that contribute to addressing the challenges of realizing broad-based pro-poor growth. In this context, though there is a mixed track record globally of converting mineral wealth into widely-shared prosperity, Zambia’s mining sector, with strengthened institutions and sounder policies, could

2
potentially contribute to broader development in the country. The Government is however, keen to diversify the economy and also effectively utilize Zambia’s other resources to promote inclusive growth. 4. In a country that displays both low income and middle income characteristics, the World Bank Group’s (WBG’s) role will be twofold i.e. contributing to poverty reduction and supporting the transition to a prosperous MIC. There is an urgency to tackle the country’s poverty and diversify the sources of growth. The overall resource needs to meet Zambia’s development goals are huge; but traditional aid is declining and the IDA envelope for Zambia is also limited (about US$100 million a year). However, the WBG’s global outreach to draw on partnerships and bring technical expertise and knowledge to bear on Zambia’s development is large. The latter could be utilized more effectively to strengthen institutions and improve economic management towards helping Zambia increase its own capacity to use its resources and institutions effectively. During the next four years, the WBG will position itself to transition from a lending institution to being a solutions one that, in the words of the WBG President Dr. Kim, “connects and convenes multiple stakeholders from around the world brokering knowledge exchange across institutional boundaries.” The WBG will also draw on its tremendous experience accumulated over decades of working with different countries to find the space in the current policy environment to support programs and projects that can effectively support Zambia’s development. The WBG’s strategic plan for support is laid out in this Country Partnership Strategy (CPS). 5. The CPS covers FY13-FY16 and reflects the Government’s priorities. The last WBG Country Assistance Strategy (CAS) (FY08-11) was discussed by the Board on April 8, 2008. In 2011, a CAS Progress Report (CASPR) extended that strategy until December 2012 to provide an opportunity to engage the newly elected Government in the preparation of the new strategy. The CPS reflects the Government’s development priorities as reflected in the development plan and Vision 2030 and is a “partnership” strategy prepared collaboratively with the Government and in consultation with civil society, cooperating partners (CPs), and other stakeholders. It puts forward an integrated World Bank, IFC and MIGA strategy—a WBG strategic plan—for supporting Zambia’s development. It also reflects the principles agreed upon by the CPs as articulated in the Second Joint Assistance Strategy for Zambia (JASZII) 2011-2015. 6. Outline of the CPS. The CPS has five chapters. The first chapter provides a country context followed by a description of the key development challenges, the country’s development plan and a summary of CPs support. Chapter II reviews the WBG’s past support to the country, Chapters III and IV lay out the key features of this CPS including objectives, guiding principles of engagement and expected results. Chapter V notes the risks and the strategy for mitigation. I. COUNTRY CONTEXT
A. Institutional and Political Context
7. The Zambian Government structure consists of three arms—the executive, the legislature and the judiciary. According to the current Constitution the President, is the head of the State and is also at the apex of the executive decision-making structure. The Presidential authority is exercised through a Cabinet, comprising ministers who are drawn from among elected or nominated Members of Parliament. Zambia has a centralized system of Government. A process to review the Constitution is currently underway and is likely to result in devolution of some powers to the lower levels of Government.

3
8. Zambia has relatively well designed systems, rules and laws1 that allow for both internal and external checks and balances, but they could be more effective. A process of reform over the last two decades led to improvements in administrative systems and procedures, such as improved service conditions and rationalized payroll, reforms in public financial management and the business environment. However, inadequate institutional capacity has created implementation challenges and made internal checks and balances difficult. Citizen oversight through social accountability is also weak. The Auditor Generals’ reports continue to report misuse and misappropriation of public resources with limited follow up of audit report issues and recommendations.
9. The peaceful transfer of power in the last elections from an incumbent party has solidified Zambia’s democratic credentials. This is the second time power was transferred from a longstanding incumbent to an opposition party (1991 and 2011). Zambia has held six successful and peaceful multi-party elections. In the September 2011 elections, Patriotic Front (PF) defeated the long-ruling Movement for Multi-Party Democracy (MMD).
10. The new Government also identified poverty reduction, jobs creation and improving governance as its main priorities, however, the Government’s policies are still evolving and the implementation strategy has yet to be concretized. There is also concern amongst some stakeholders consulted during the preparation of the CPS about the negative impact of policy incoherence on effective long-term planning and the environment for private sector development. While achieving inclusive growth in Zambia is a long term agenda, the Government has found it difficult to undertake much-needed policy reforms in sectors such as agriculture on which the vast majority of the very poor are dependent. Strengthening public sector implementation capacity would help with implementation of critical policy actions. B. Poverty and Social Context
11. Zambia’s rank in the United Nations Development Program (UNDP) Human Development Index (HDI), a composite measure of life expectancy, education, and incomes, is below the Sub-Saharan Africa average. In 2011 Zambia's HDI was 0.430, a rank of 164 out of 187 countries with comparable data. Overtime, the HDI for Sub-Saharan Africa increased from 0.365 in 1980 to 0.463 today, and Zambia falls below this regional average. 12. Despite robust annual growth in the last decade, poverty, particularly in the rural areas remains stubbornly high. The effect of economic growth on overall poverty reduction has been small, as much of the benefits of growth have accrued to those already above the poverty line. Growth was driven by industries such as mining, construction and financial services and did little to create jobs and expand opportunities beyond the small labor force already employed in these industries. The urban-centered growth also did not generate better incomes, health, nutrition and key services for the majority of Zambians living in the rural areas and dependent on agriculture. Rural poverty at 74 percent is more than double the urban poverty of 35 percent. Thirty nine percent of the population lives in extreme poverty, with insufficient consumption to meet daily minimum food requirements. Almost 90 percent
Table 2: Poverty Incidence by Province, 2010 Province Population
Share (%) Moderate Poverty Incidence (%)
Extreme Poverty Incidence (%)
Central 10.6 55.7 30.5 Copperbelt 14.0 39.7 18.3 Eastern 13.7 74.9 55.1 Luapula 8.2 80.2 61.8 Lusaka 13.5 34.4 13.8 Northern 12.7 72.5 50.2 North western 5.8 68.4 48.7 Southern 12.9 66.0 42.0 Western 7.6 74.1 56.0 Source: World Bank 2012a Note: People living in moderate poverty are those whose total expenditures are below the national poverty line. People living in extreme poverty have total expenditures that are below the food-poverty line.

4
of Zambians below the extreme poverty line are in rural areas, where the poverty gap ratio2 is far higher (20 versus 3.7 percent in urban areas) (World Bank 2012d). 13. Income inequality has been growing in Zambia. Disparities between the rural and urban areas increased overtime. Annual consumption growth was less than 1 percent for most of the rural population between 2006 and 2010, whereas growth in urban areas was about 2 percent for the first four quintiles and much higher for the wealthiest quintile (World Bank 2012d). Over the past decade the Gini coefficient worsened from 0.47 to 0.52. Interprovincial comparisons also show that rural provinces, such as Western, Northern, Luapula and Eastern, have much higher poverty levels (Table 2). The recent Economic Brief produced by the Bank also found that the distribution of opportunities for access to basic education, health and infrastructure services in Zambia closely mirrors the spatial distribution of poverty, implying that poorer regions have lower access to opportunities.3
14. Women face particular challenges. In 2010, poverty incidence among female-headed households was slightly higher than male –headed households (62.5 versus 60 percent). Zambian women’s opportunity to contribute to and benefit from productive participation in the labor force appears to be less than that of men. In 2009, the female labor force participation rate was 59.5 percent, compared to a rate of 79.2 percent for men. Vocational courses present an opportunity for more market-tailored education, but there are large gender disparities in this area. Women make up less than 20 percent of technical and vocational education programs and this negatively influences their productive participation in the formal workforce. In addition, in rural areas, it is usually customary law that determines land allocation and inheritance and the traditional rules regulating land allocation and inheritance disadvantage women. Women are also more likely to be in lower productivity jobs than men—for example more women work in agriculture and micro-enterprises while men are more likely to work in mining and small and medium-sized enterprises.
15. Both deforestation and climate change, if left unaddressed, will exacerbate poverty and curb economic growth and will make it more challenging for Zambia to achieve MDG 7 on environmental sustainability. Nearly sixty six percent of Zambia's land area is classified as forests but most of the resource is highly degraded and deforestation is occurring at 0.33 percent a year (WDI 2012). The poorest and most vulnerable tend to live in districts most exposed to frequent droughts and floods. With livelihoods that are highly dependent on climate sensitive agriculture and natural resources, they also have a low capacity to adapt. In the absence of adaptation, rainfall variability alone could keep an additional 300,000 Zambians below the poverty line and cost Zambia at least US$4.3 billion in lost GDP over the next decade. This could reduce future annual growth by 0.9 percentage points (World Bank 2009).
16. Progress has occurred on health indicators but Zambia may still not be able to meet the health related MDGs. The 2007 Zambia Demographic and Health Survey (ZDHS 2007) show notable reductions in maternal, infant and under five mortality rates between 2002 and 2007 (Table 3). However, the annual rates of reduction of 2.1 percent for under-5 mortality and 2.5 percent for maternal
Table 3. Progress in health related indicators 2002 2007 Maternal mortality per 100, 000 live births
729 591
Infant mortality per 1000 live births 95 70 Under five mortality per 100 live births
168 119
Source: ZDHS 2007
Figure 1. Proportion of 15 to 19 year olds who have completed each grade
Source: Analysis of SDA 1992; LCMS 2003, 2010
0
0.2
0.4
0.6
0.8
1
0 1 2 3 4 5 6 7 8 9
Propor
tion
Grade
1992
2003
2010

5
mortality for the period 1990–2011 are less than half the annual rates of reduction required to achieve the MDGs targets. 17. Zambia has achieved high levels of access to basic education but challenges remain. The primary completion rate (PCR) increased from 67 percent in 1998 to universal completion in 2010. The proportion of children aged 15 to 19 that complete each grade has also increased substantially between 1992 and 2010 (Figure 1). Regionally benchmarked learning assessment results however, show that Zambian students have severe learning deficits.4 Learning outcomes are also an issue at institutions of higher learning and the Government has commenced the review of education policy and the Education Act of 2011. The Government is also working on legislation to put in place a framework to regulate and improve education quality standards in private universities and tertiary institutions. Overcrowding in classrooms and gender inequalities in secondary and tertiary education still remain major challenges. C. Economic Context
18. Zambia’s land area of 753,000 square kilometers holds only about 13.5 million people, an average density of 18 persons per square kilometer. The countryside particularly is very sparsely populated, making service delivery a challenge. The country’s small population is however, growing at a relatively fast rate of 2.7 percent (Annex 3).5 The population is also young, with about half being under the age of 15 years. 19. Zambia’s young population faces limited economic opportunities mainly because of inadequate economic diversification. Underemployment is the main issue in the rural areas whereas open unemployment is more of an issue in the urban areas. Policy makers in Zambia are concerned about the serious social and political implications of economic exclusion of youth. Discussions with various youth groups as a part of the CPS consultations brought out concerns about limited access to information and finance, inadequate financial literacy, few jobs and limited opportunities for acquiring relevant technical skills as some of the challenges that this group faces.6
20. The agriculture sector employs more than 70 percent of the population but contributes about 14 percent to real Gross Domestic Product (GDP)7. Two-thirds of Zambians live in the rural areas and mostly depend on rain-fed agriculture whose overall productivity remains low even in comparison with LICs (Table 4).8 The mean size of the land holding is 3.27 hectares and the small-scale farming systems are overwhelmingly dominated by a single crop—maize. Nearly eighty three percent of all households grow maize (LCMS 2010).
21. Copper mining and processing are the mainstay of the Zambian economy, the engine of GDP growth in recent years and foreign exchange earnings (Annex 13). Mining and quarrying contribute about 12 percent to real GDP and 80 percent to exports (World Bank 2012d). Manufacturing and construction together contribute about 20 percent and services 54 percent. Part of the construction and services are a result of the mining sector. The copper industry’s potential, to contribute to poverty reduction remains under-utilized (Annex 13 Box 1). 22. Zambia has a dualistic private sector. About 200 large enterprises located mostly in urban areas produce the bulk of industrial output. These large capital-intensive enterprises, mostly in mining, and to a lesser extent manufacturing, have higher productivity but provide limited employment (7 percent). The medium, small and micro enterprises (MSMEs) are located mostly in rural areas (81
Table 4: Agriculture Productivity (value added per worker 2000$ in 2010) Zambia Lower middle
income Low income
214 786 288 Source: WDI 2012

6
percent) (Zambia Business Survey 2010). They have much lower productivity and employ 88 percent of the labor force. 23. Zambia’s land-locked position is a disadvantage in many ways, although its geographical location within Southern Africa is potentially conducive to increased regional trade. As a landlocked country Zambia confronts costs (both time and dollars) in accessing global markets. Delays at intermediate borders, high fuel prices and the poor quality of roads compound the adverse impact of the long distances from the ports (World Bank 2012c). The “land-linked” position, however, is advantageous for regional trade. Zambia has borders with eight countries and is the start, destination or transit country for five of the 18 major transit corridors in Sub-Saharan Africa (World Bank 2008).9 However, the poor competitiveness of Zambian firms, among other factors, has prevented Zambia from exploiting the potential of its strategic geographical location to further its own development. RECENT ECONOMIC DEVELOPMENTS AND PROSPECTS Economic Developments
24. Zambia's rich natural endowments offer opportunities for growth from diverse economic activities such as agriculture (including livestock and fisheries), tourism, and hydro-energy. However, even with some exceptional natural tourism resources, such as Victoria Falls, Luangwa
Table 5. Zambia: Key Economic Indicators and Prospects
2011 2012 2013 2014 2015
prelim proj proj proj
GDP growth (%) 5.7 6.4 7.6 6.8 7.3 7.8 8.0 7.7
GDP per capita growth (%) 3.1 3.8 5.0 4.0 .. .. .. ..
Inflation Rate (end of period) 16.6 9.9 7.9 7.2 7.2 6.0 5.0 5.0
T-Bill Yield (91 days, annual average) 12.2 13.4 4.6 6.7 .. .. .. ..
Nominal Exchange Rate (K/US$ period average) 3,746 5,046 4,797 4,861 5,234 5,424 .. ..
Real Effective Exchange Rate (depreciation -) -15.2 14.2 -5.8 -2.6 .. .. .. ..
Copper Export Price (US$/tonne, average) 6,275 4,716 6,951 8,828 7,900 8,500 8,000 7,000
Total Revenues and Grants 23.0 18.9 19.6 21.7 21.5 22.0 22.5 22.6
Domestic revenue 18.9 16.0 17.8 20.9 19.9 20.7 20.9 21.1
o/w Mining revenue 1.9 1.0 1.9 5.5 3.8 4.5 4.6 4.8
Grants 4.1 2.9 1.8 0.8 1.6 1.3 1.6 1.4
Total Expenditure 23.9 21.3 22.6 23.9 25.8 26.9 26.4 26.9
Current 20.4 17.9 19.4 19.7 19.7 19.6 18.4 17.4
o/w wages & salaries 8.2 8.2 8.1 7.9 8.9 9.2 9.1 8.8
Capital 3.5 3.4 3.2 4.2 6.1 7.3 8.0 9.6
Overall Balance after grants (cash basis)a -1.5 -2.4 -3.1 -3.9 -4.3 -4.9 -3.9 -4.3
Trade Balance 404 906 2,704 2,276 1,351 1,564 2,163 2,724
Merchandise Exports 4,959 4,319 7,414 8,731 9,445 10,608 11,942 13,614
Copper Exports 3,684 3,179 5,768 6,663 6,461 7,205 8,112 9,319
Merchandise Imports 4,554 3,413 4,710 6454 8,094 9,044 9,779 10,891
Current Account Balance, after grants (% of GDP)
-7.2 4.2 7.1 1.5 -3.4 -3.1 -1.4 -0.2
International Reserves (months of imports) 2.1 3.7 3.0 2.8 3.0 3.2 3.2 3.3
Nominal GDP (billions ZMK) 54,839 64,616 77,667 93,345 105,255 120,138 136,514 153,908
Nominal GDP (US$ Millions) 14,641 12,805 16,190 19,204 20,112 22,148 24,590 27,196
Net public debt 19.9 22.0 22.1 20.1 23.8 25.8 25.2 24.7
External 9.4 10.0 9.1 10.2 13.3 14.0 13.8 13.6
Domestic 10.5 12.1 12.9 9.9 10.5 11.8 11.4 11.1
a. Reflects carryover budget releases not included in expenditures
Central Government Accounts (% GDP)
External Sector (in US$ millions)
National accounts
Public debt (% GDP)
Source: Zambia Authorities and IMF Estimates
Prices, Interest Rate, and Exchange Rates
2008 2009 2010
Real Output

7
National Park and the Lower Zambezi, tourism today contributes less than 3 percent to GDP. With the favorable land and water resources both food and cash crop production could be significantly increased and agro-processing developed to create jobs. Similarly, Zambia's outstanding natural grazing areas and water resources in rivers, lakes and swamps could support a much larger livestock and fisheries population and provide for substantially increased animal food production. Zambia could also better exploit its strategic position within the Zambezi River Basin and improve energy production and irrigation to contribute to diversification and growth. 25. A combination of prudent macroeconomic management, market liberalization and privatization efforts have enabled Zambia to accelerate growth. Substantially increased copper production in response to privatization and steep increase in world copper prices contributed to this achievement. The Government consolidated macroeconomic stability under the International Monetary Fund (IMF) programs (the last of which concluded in June 2011) and successfully navigated the shocks connected with the 2008 global economic and financial crises. Annual inflation declined from about 30 percent in 2000 to 7.2 percent in 2011 (Table 5). The completion of the Heavily Indebted Poor Countries (HIPC) and Multilateral Debt Relieve Initiative (MDRI) provided Zambia with about US$6.5 billion in debt relief, which provided the much-needed fiscal space by reducing debt service obligations. In addition, debt relief improved Zambia's external position and enabled building up of foreign-exchange reserves. This, in turn, has strengthened the country's ability to manage volatility in its exchange rate and bolstered the financial system. This enduring stability has supported robust growth, a marked turnaround from a decade ago. 26. With declining aid, the Government has escalated domestic resource mobilization efforts. The level of aid to Zambia has sharply declined in the past five years. In 2012, grants, including both budget support and project grants, amounted to about 6 percent of Government expenditure (1.6 percent of GDP) compared to 22 percent in 2004 and a peak of 27 percent in 2002. The decline in aid highlighted the importance of domestic resource mobilization and the Government is making attempts to increase domestic revenues. Several changes were made to the mining fiscal regime in 2009. During the period 2008-11, mining revenues averaged around 2.6 percent of GDP, a sharp increase from the previous range of 1-1.4 percent of GDP. In 2012 revenues are expected to come in at 3.8 percent of GDP despite a decline in mining output, partly due to an increase in royalty rates. The 2013 budget proposes further rationalization of the mining fiscal regime and measures to improve tax compliance while keeping the regime predictable. A comprehensive review of tax policy is also proposed in 2013 focusing on rationalizing of tax incentives and simplification of the tax system for small and medium enterprises (SMEs). 27. To meet its needs for development finance, the Government has also accelerated borrowing on non-concessional terms. Between July 2011 and September 2012, the Government borrowed about $1.25 billion from non-concessional sources alone including the recent issue of a sovereign bond for US $750 million. The Government is also relying on public-private partnerships in infrastructure to meet the demands for infrastructure finance.
Table 6: Proposed Use of the Sovereign Bond Proceeds ZMK billions US$ millions % GDP Energy (Generation and Transmission)
1,275 255 1.2
Transport (Road and Rail)
2,150 430 2.0
Rehabilitation of Central Hospitals
145 29 0.1
Access to Finance (DBZ-SME Credit line)
100 20 0.1
Fee and Transaction Cost (Actual)
7 1.4 0.0
Discount Premium (Actual)
73 14.6 0.1
3,750 750 3.6 Source: World Bank 2012d drawing on Government’s 2013 budget speech

8
28. Zambia is using its growing central budget resources mostly to provide for ramping up of public investments in infrastructure but the capacity to appraise and implement projects is weak. The capital budget has risen from 3.2 percent of GDP in 2010 to 6.0 percent of GDP in 2012. The 2013 budget proposes a capital budget of a similar magnitude with bulk of the resources planned to be spent on transport and energy infrastructure. Most of the proceeds of the sovereign bond are also proposed to be used to finance infrastructure projects (Table 6). The Finance Minister’s 2013 budget speech also acknowledged that project appraisal is weak and promises to “institutionalize a rigorous appraisal system for screening investment projects in order to ensure that borrowed funds are only applied to infrastructure projects that directly and demonstrably contribute to the nation’s economic growth.” 29. Foreign Direct Investment (FDI) is complementing public investment in a significant manner but could be at risk. Zambia's FDI regime is one of the most open in Africa (see for example OECD, 2012 Investment Policy Review Zambia 2012). Political stability is one of the major factors explaining the country’s attractiveness for investments (para 9). FDI rose from approximately US$164.9 million in 2003 to US$1.73 billion in 2010 with most investments going to mining, manufacturing, wholesale and retail trade10. However, the signals emanating from several policy actions by the Government, such as abrupt reversals of Zamtel privatization and the railway concession, are perceived by some stakeholders as creating an incoherent policy environment for private investment. The mining companies have also complained about changes to the fiscal regime such as the doubling of royalty in 2012 and treatment of capital expenditure for tax purposes. The adoption of Statutory Instrument (SI) 33 which prohibits domestic transactions in any currency other than Kwachas is also seen by some stakeholders to have increased uncertainty among investors. MEDIUM TERM PROSPECTS AND DEBT SUSTAINABILITY 30. Overall, Zambia’s medium-term economic outlook remains steady but vulnerable to downside risks from a global economic slowdown. Real GDP growth is projected to stay above 7 percent in the medium-term based on continued growth in the mining, construction, and tourism sectors, and expansion in the manufacturing, transportation, and communications industries (Table 5). In 2013 and 2014, mining and quarrying are projected to grow at 14.3 and 18 percent respectively (World Bank 2012d). These projections however, face downside risks because of global economic slowdown, particularly in China. An unexpectedly large drop in copper prices resulting from slowdown in emerging economies could weaken the country’s prospects for growth and affect its fiscal and external balances severely. In addition, the tourism sector is especially susceptible to adverse changes in the external environment. 31. The macroeconomic framework will be put to test should the risks materialize but can withstand the shocks with some adjustment. If risks materialize, Zambia will have some maneuverability on the monetary side. The foreign reserve position covering three months of imports should allow absorption of shocks to the overall balance of payments to some extent, beyond which, the flexible exchange rate regime should keep external balance from swinging too far. However, unlike the 2008-09 crises, the Government does not have a fiscal cushion and adjustment will be needed. It is expected that the Government should be willing to cut spending pro-cyclically, if needed given that most of the recent increase in spending is on discretionary capital budget.
32. There are also perceived concerns emanating from recent policy actions. Several policy actions such as the rebasing of the currency, adoption of Statutory Instrument (SI) 33, increase in capital requirements for foreign banks and interest rate caps on lending by commercial banks have been taken by the Government to strengthen economic management. However, a range of stakeholders have been concerned about economic policy priorities of the Government and the process by which they are

9
arrived at. Unbudgeted fuel subsidies, significant overruns in the cost of maize marketing, and pension arrears have also led to the weakening of fiscal discipline. 33. Zambia’s stock of external and public debt remains relatively low but needs careful management. The Joint Fund-Bank Debt Sustainability Analysis for Low Income Countries (LIC DSA) conducted in April 2012 suggests that Zambia’s risk of debt distress remains low.11 The external debt indicators remain well below their thresholds in the baseline scenario and bound tests. The public debt DSA also suggests that Zambia’s overall public sector debt dynamics are sustainable in light of the current size and the evolution of the domestic debt stock in the baseline scenario. The non-concessional borrowing in 2011-12 is unlikely to worsen Zambia’ debt outlook if debt is managed carefully.12 Besides sound macroeconomic policies, both strong debt management and project appraisal capacity are needed to maintain debt sustainability in the face of increasing dependence on non-concessional borrowing. An exception to IDA’s Non-concessional Borrowing Policy is being considered by Bank’s Management and the country team is discussing non-zero limits on non-concessional borrowing for 2013 with the Government. D. Key Development Challenges
34. Development challenges in four broad areas are discussed in this section —reducing poverty, related vulnerabilities and accelerating human development; promoting agricultural growth and diversification; improving competitiveness; and improving governance and strengthening economic management. Chapter 3—paragraph 96 then notes what contribution the WBG will make in each area. REDUCING POVERTY, RELATED VULNERABILITIES AND ACCELERATING HUMAN DEVELOPMENT 35. Reducing poverty is the greatest development challenge for Zambia. The country’s low rank on the HDI (para 11), indicates the vulnerabilities faced by the majority of Zambians: malnourishment, limited education opportunities to improve their conditions, health and water supply and sanitation services. According to 2010 LCMS, 46.7 percent of children under-five years are stunted, close to the high levels of the early 1990s. There are two main reasons for under-nutrition in children: inadequate dietary intake resulting from suboptimal maternal and infant feeding practices and the heavy burden of malaria, diarrheal diseases, and acute respiratory infections (World Bank 2012m)—both factors associated with poverty. Chronic malnutrition in childhood has also negatively influenced learning abilities among children from the poorest households. 36. There are several on-going safety net programs in Zambia that directly transfer either in-kind resources or cash to poor households, but have limited effectiveness (World Bank 2012m). Government is committed to addressing chronic under-nutrition and strengthening the country's capacity for service delivery for vulnerable and at-risk populations. It requested the World Bank to undertake a comprehensive review of existing safety nets that is expected to inform the policy makers' work in this area. The Bank's analysis found that current Government transfers and safety net programs are not targeted to the poor and that almost none of the very poor are currently benefitting from public transfer programs. In addition, benefits from education and health spending have also not been progressive. 37. For close to two decades, successive Zambian governments have supported health sector reforms, to provide cost-effective and quality health services to the population. The reforms have generally centered on the delivery of primary health care through a decentralized health system. Multilateral and bilateral CPs, faith-based and for-profit private health providers have also provided significant support to the health sector over the years.

10
38. But achieving the health-related MDGs by 2015 remains a key development challenge. At the current pace, (1990-2011 level), Zambia will only be able to meet the MDG targets for under-5 mortality and maternal mortality after the year 2040.13 Zambia is also one of the reproductive health priority countries because of both high maternal mortality and high fertility rate of 6.26 (World Bank 2010b). The recent WDR 2012 on Gender notes that average fertility among women in the poorest quintile in Zambia is 8.5 children (the highest in the world) but for women in the richest fifth it is just over 3.
39. External aid has contributed to increased access to essential services but most of it has been targeted for specific diseases. Malaria control has been impressive (Table 7). The TB treatment success rate increased from 79 percent in 2005 to 86 percent in 2010, slightly above the WHO target of 85 percent. HIV/TB collaborative activities are being implemented in all the provinces and districts and this increased the rate of HIV testing among TB patients from 23 percent in 2006 to 72 percent in 2009. The number of centers administering services to prevent mother to child transmission of HIV increased to 1,100 in 2010 from 936 in 2009. However, Zambia continues to have a very high HIV prevalence of about 14.3 percent for the 15-49 year-old cohort. Most of the external assistance has been targeted for HIV/AIDS, malaria, and tuberculosis and not for overall health system strengthening. As highlighted in the 2009 Zambia health public expenditure review, much of the donor funding is off-budget while the priorities of the global vertical sponsors often supersede national priorities and needs. 40. The joint work by the Government, Bank and other partners identifies severe shortages in human resources for health, weak drug and medical supplies logistic management, poor health infrastructure, among others14,15,16 There is a 59 percent gap in the total number of staff positions for clinical health workers (doctors, clinical officers, nurses, midwives and other paramedics). Severe understaffing and low morale among health workers, as highlighted in the 2007 Public Expenditure Tracking Survey (PETS), adds to the challenge. Weak drug and medical supplies logistic systems, poor health infrastructure, low quality monitoring and evaluation systems, cultural and community barriers, and the overall mixed record of the country on service delivery are other critical constraints to improving health and nutrition outcomes.
41. Inadequate access to clean and safe water and sanitation also increases the risks of diseases. Despite improvements over time, Zambia is behind schedule in meeting the clean water and sanitation MDG targets (Table 8). In addition, the quality of service is poor, particularly in the rural and peri-urban areas. The lack of adequate water supply and sanitation result in annual outbreaks of cholera and dysentery and overall poor environmental conditions. The economic burden of poor sanitation falls disproportionally on the poor.17 There has been significant progress on many of the reforms laid down in the 1994 National Water Policy, such as the separation of water resources management from water supply and sanitation, the separation of regulatory and executive functions and the devolution of authorities from central to local governments. However, much more needs to be done to strengthen local capacity to deliver on these services.
Table 7. Improvements in Malaria Control (%) 2006 2010 Malaria parasitemia in children aged 0-59 months 22 16 Households owning at least one insecticide-treated net 38 64 Source: Zambia Malaria Indicator Survey, 2010
Table 8: Access to Clean Water and Sanitation
1990 2008 MDG 2015
Target Population with access to an improved drinking source (%)
49 60 75
Population with access to improved sanitation facilities (%)
46 49 73
Source: AMCOW: CSO2 2012

11
42. With the new Government there is renewed commitment to decentralization and the Government is reviewing the decentralization policy to take into account latest developments on the ground. Devolution has been articulated as formal Government policy since 2005, and the Decentralization Implementation Plan (DIP) was adopted in 2009, and implementation is at different stages in the various sectors. The functional and fiscal devolution of responsibility is so far limited with local government expenditures constituting about 1.5 percent of total budgetary expenditure. Inter-governmental transfers represent less than 1 percent of the national budget. Some progress has been made on the decentralization agenda over the past year: total allocation of inter-governmental transfers to local governments increased by 98 percent between 2011 and 2012, however, intergovernmental transfers remain low; the draft Constitution provides a broad framework for decentralization; a consensus has been reached in the Government on implementing a phased approach, i.e., devolving a limited number of sectors; and the Government has progressed with the design and costing of the new organizational structures for the devolved functions. However, in order to implement a program of this magnitude, strong leadership and technical capacity will be needed. PROMOTING AGRICULTURAL GROWTH AND DIVERSIFICATION 43. The vast majority of the very poor derive their livelihoods from subsistence smallholder agriculture, whose productivity remains low. The SNDP recognizes agriculture as a principle sector for poverty reduction and for promoting economic diversification. Increased agricultural productivity will not only improve the income of women as the majority (68 percent) of those who are economically active work in that sector, but also increase the nutritional intake of children as women have consistently been found to be more likely than men to invest in their children’s health and well-being (World Bank 2008b) when they have the means to do so. 44. Farmers face numerous constraints that keep productivity low. Inadequate rural infrastructure, particularly feeder roads and irrigation systems, poor access to markets, inadequate research and access to improved inputs, limited advice on their proper use are examples of constraints faced. Women farmers tend to have even lower access than men to agricultural inputs. Government expenditure on agriculture has risen consistently since 2000 but two main subsidy programs, Farmer Input Support Program (FISP) and the Food Reserve Agency (FRA), have absorbed more than 60 percent of the sector's budget and have distorted incentives in favor of maize, and created unpredictability that has hindered private investment in agriculture. Political economy constraints have made reforms of these subsidy programs difficult, but they are critical for ensuring optimum development benefits accrue from public expenditure. Recently the Government has proposed scaling down and reforming FRA purchase activities and reforming the FISP and undertaking a reform of land tenure system. The challenge, however, will be in defining the size of the strategic food reserve and employing transparent and competitive processes for procuring the reserve stock and bringing closure to land tenure reform issues in a timely manner. The 2013 Budget also increased allocations to non-maize investment components, signaling steps towards diversification. 45. Since 2002 the Government has supported the development of farm blocks-one per province, whose development has been limited by resource constraints and infrastructure deficits. The Government proposes to provide the infrastructure (roads, electricity and irrigation) on a farm block to attract investors who develop a core venture and/or any of the commercial farms into centers of excellence for production, processing and management under an out-grower arrangement. So far development is in an advanced stage in only Nansanga farm block. The Government faces resource constraints for developing infrastructure and inadequate irrigation, the high cost of borrowing and high production costs have kept away potential investors. There is a need to conduct a careful analysis of the existing farm blocks to better understand the costs and benefits of use of public resources to create jobs and improve agricultural production through this program.

12
46. The value chains for both crops and animal products are inefficient and weak. Weaknesses are there at every link-from shortage of inputs, inadequate research, limited access to technology, inadequate storage infrastructure and transport, agro-processing and marketing and distribution. Livestock and aquaculture sector development is also hampered by animal diseases, inadequate extension, poor animal husbandry and chronic shortages of quality fish seed and fingerlings. Recently, the Government announced measures to increase forward (by promoting local value addition to crop and livestock products) and backward (through local production of key agriculture inputs) linkages with agriculture.
IMPROVING COMPETITIVENESS
47. Despite progress on investment climate reform, Zambia still lags behind neighbors on the World Bank’s Doing Business 2013 (Figure 2). Zambia's ranking on Doing Business 2013 dropped from 90 in 2012 to 94.Three issues stand out in the 2013 report: (i) Dealing with construction permits (rank 151), (ii) Getting electricity (rank 151); and (iii) Trading across borders (rank 156). The latter is a matter of concern since Zambia is landlocked and depends on smooth border crossings to promote all trade. The Government is taking steps, such as creating one-stop border posts, to improve trade facilitation. 48. Zambia's businesses face serious constraints in improving competitiveness. Labor costs are high while productivity is low. Both hard and soft infrastructure is poor including energy, transport, telecom, water and also insurance, marketing and professional services—particularly outside the urban areas.
49. Transportation, both road and rail, is seriously limited outside the main provincial towns and major regional transit routes. Since 2003, the Government has been implementing a ten-year road development program, known as ROADSIP II, partially financed by the World Bank and other CPs. In addition, Government recently announced a further paved road construction program, Link 8000, planned for implementation over the next 5-10 years in which it is investing a significant amount of its own resources. The sector has faced several governance challenges that the CPs have raised as a concern. Connecting remote rural areas also still remains a challenge. Performance-based road contracting could remove the road infrastructure gap and allow meaningful agricultural development to take place. The rail and road network asset condition also needs attention.18 The rail network condition and service has continued to deteriorate. The concession was cancelled in September 2012, with a commitment from Government to recapitalize the railway service.
50. Access to electricity is limited. The mining industry accounts for about 50 percent of national electricity consumption. The overall national electrification rate is about 23 percent, with 47 percent of the population in urban and peri-urban areas and only 3 percent in rural areas having access to electricity.
Figure 2: Zambia and comparator economies on ease of doing business
Source: Doing Business 2013

13
51. The inadequate electricity supply is a binding constraint to growth. Zambia has a strategic position within the Zambezi River Basin that affords it significant potential to develop new hydropower generation, and improve existing energy production through cooperation. Inefficiencies in the sector have however, deterred new investments and the country has not made major investments in generation capacity since the development of the major hydro-power stations in the mid-1960s and early 1970s. The poor financial condition and weak operational performance of ZESCO, the state-owned power company, had been an obstacle to new investments needed to build power-generating capacity. Investment needs in generation alone are estimated at about US$6 billion in the next 10 years and transmission and distribution networks also need to be rehabilitated. 52. The Government’s strategy addresses short-, medium-, and long-term issues in the energy sector. The strategy’s focus is on opening the transmission network to private electricity providers in addition to the state-owned ZESCO; improving the operational and financial performance of ZESCO, while gradually phasing out the need to subsidize new capital investments; and raising electricity tariffs to total cost recovery levels in order to attract private investors to the market. 53. Access to information and communication technology (ICT) is limited in Zambia (Table 9) and costs are high, constraining private sector development. Zambia has yet to fully exploit the transformational opportunities provided by ICT. 54. Access to finance remains a serious constraint, as is availability of skilled workers. Limited access to financial services for both large corporations and small enterprises, but particularly for the latter, is a major factor in poor productivity in Zambia. The generally poor financial literacy level in the country also increases the vulnerability of the borrowers. A major input of concern is labor, the cost of which is high and the productivity of which is well below international standards. There is a significant gap between the vocational skills demanded by the private sector and those produced by the educational system. The cost of other inputs, such as equipment, spares, fuel and other consumables is also high as most items need to be imported.
55. Factors that hinder private sector development have also constrained tourism development. If the infrastructure and the business climate in Zambia were as in South Africa, Zambia's tourist flows would be 51 percent higher than existing levels (Mattoo and Payton 2007). In addition, policies that help improve the regulatory and marketing aspects of the tourism industry are also needed.
56. Improving Zambia’s infrastructure requires reforms (for example in ZESCO) and also substantial capacity to implement. While Zambia’s debut US$750 million Euro bond is largely earmarked to fund infrastructure (Table 6) selecting projects that contribute to high growth, and capacity to spend effectively needs to be enhanced.
57. The Government’s capacity for undertaking public-private partnerships (PPPs) also needs to be enhanced. The Government has supported PPPs to leverage the strengths of both the private and public sectors to deliver and maintain infrastructure investments in the country. Following the approval and adoption of the Public-Private Partnership Policy in 2008 and the enactment of the PPP Act by Parliament in August 2009, the Government has continued to firm up institutional
Table 9: Benchmarking ICT Indicators Zambia Middle-income
countries GSM coverage % population 53 85.1 Internet subscribers/100 people 0.2 3.0 Landline subscribers/100 people 8.5 34.8 Mobile phone subscribers/100 people 20.9 30.0 Quality of service Faults/100 mainlines
90.8 50.8
Source: World Bank 2010a

14
arrangements to implement PPP financed infrastructure projects. In September 2012, the Government announced the merger of the Zambia Development Agency and the Public-Private Partnership Unit in the MOF to establish an Industrial Development Commission to enhance capacity for implementation of PPPs. An adequate institutional framework, however, to spearhead project identification, appraisal and implementation still remains a constraint.
58. Concerns remain among civil society, media and the general public about the generally low level of participation by Zambians in the mining industry. Effective strategies for broad-based development anchored in mining will be needed to deal with these concerns. Planned infrastructure, value-addition and small business development can help turn “enclave” mining projects into sustainable mining districts. Capacity gaps in the Government’s ability to monitor mining operations, ensure full tax compliance, and maintain a smooth-functioning cadaster19 and license-award processes also need to be addressed. 59. Zambia’s regulatory regime for mining has not kept pace with the structure and size of the industry. The current regulatory structure and capacity was designed to oversee a single state-owned copper and cobalt mining company. But today Zambia has a private sector-led industry, comprising many large and small mining operations and ever-growing exploration activity, including by some of the largest global mining companies. New minerals are also being discovered. Continued clean-up on legacy environmental contamination in now-closed mining sites is also needed. The regulatory framework for mining-related environmental protection also needs to be solidified.
60. Integration into a dynamic and more open Southern African region will contribute to further growth and poverty reduction in Zambia. With eight neighbors, Zambia is favorably positioned to take advantage of increased regional demand. World Bank analytical work has demonstrated the scope for increased exports of animal products to other countries in the region, provided that non-tariff barriers to imports are eliminated or at least reduced (World Bank 2011). The Common Market for Eastern and Southern Africa (COMESA) and the South African Development Community (SADC)20, the two regional trade blocs of which Zambia is a member, have supported liberalization of market access for road freight and harmonization of rules to ensure interoperability in member states (MCA 2010). In this regard Zambia could exploit further the presence of COMESA headquarters in Lusaka to source financing for trade and commerce related developmental matters. Recently, Zambia has initiated dialogue with four other like-minded countries in Southern Africa to accelerate trade integration. This has the potential to expand regional trade to the mutual benefit of all participating countries. 61. As a member of the Southern African Power Pool, Zambia could be a supplier and transmitter of energy regionally by increasing its power generation capacity and transmission infrastructure including regional interconnectors. The growing demand for electricity at both domestic and regional levels, and the regional power shortages in the foreseeable future provide a solid market for any additional electricity supply that can be offered. Regional interconnectors such as the Zimbabwe-Zambia-Botswana-Namibia and the Zambia-Tanzania-Kenya interconnectors could help Zambia become a regional hub for power trade in southern and eastern Africa. IMPROVING GOVERNANCE AND STRENGTHENING ECONOMIC MANAGEMENT 62. Improving governance and strengthening economic management is critical to making good policy and effective and efficient use of public resources. Good governance and sound economic management also provide the enabling environment for private sector development and for improving service delivery. While Zambia has reached low MIC status, its economic management capacity remains weak, similar to that in several LICs. Policy coordination within the Government is

15
also poor. Efficiency and effectiveness gaps in public spending as well as transparency and accountability challenges in public service delivery continue to pose a serious threat to continued growth, competitiveness and service-delivery. The statistical base to provide accurate information for policy making also remains feeble. The main constraints are less the availability of resources, but the knowledge, capacity and incentives to improve government performance. As the Government increasingly approaches international capital markets for meeting its needs for development finance, its systems for managing public finances, debt, and expenditure will come under greater scrutiny. 63. Public sector management (PSM) reforms have been implemented by the Government in the last ten years. Progress has been made on civil service reforms (e.g. payroll policy), and service-delivery measures such as service-delivery charters, and process re-engineering which have resulted in steady improvements in the six WGI indicators.21 There is renewed momentum to accelerate reforms and the Government has over the last six months approached the Bank with a number of different requests for support such as: civil service reform, including pay policy, performance management system for senior government officials, public pension reform, design of a system for assets disclosure, and creating a public sector credit union; and strengthening decentralization.
64. Since early 2000, PFM reforms with support from CPs through the Public Expenditure Management and Financial Accountability (PEMFA) program have also been undertaken. A number of diagnostic studies (CFAA of 2003, Public Expenditure and Financial Accountability (PEFA) assessments of 2005, 2008 and 2012 (draft)) found that Zambia’s PFM system exhibits several weaknesses. A comparison of the draft 2012 and 2008 PEFA assessments reveals that scores for eight indicators have improved while the remaining ones show a stagnant or downward trend (see Annex 17). Some of the achievements to date are: the change in the Government budget cycle in 2009, which the 2008 PEFA assessment identified as the biggest impediment to improved PFM in Zambia, improved infrastructure and logistics for internal and external audits, parliamentary committees and Zambia Institute of Chartered Accountants (ZICA); and a significant amount of training across all components including for the Integrated Financial Management Information Systems (IFMIS). The GRZ has committed to implementing the new PFM strategy (recently approved by Cabinet) and has made specific commitments to implementing public procurement reforms. Since January 2013, the Zambia Public Procurement Authority (ZPPA) has been transformed into an oversight and regulatory body and public procurement has been decentralized to ministries, provinces and spending agencies.
65. GRZ has been attempting to also strengthen capacity in other areas that would improve economic management. These include a monitoring and evaluation (M&E) system including strengthening statistical capacity, project appraisal and investment management, debt management, and the ability of the MOF to influence sector expenditure policies. The Ministry has also recently developed a strategic plan to address these areas over the next five years. The Government has approached CPs for support in building a government-wide M&E system and for supporting e-government, including a review of existing ICT systems to get efficiency gains, expand inter-operability, and strengthen fiduciary controls and transparency. The World Bank has also recently proposed an action plan for strengthening Government’s debt management.
66. Developing a high level platform for civil society, the public and the CPs to engage with the Government on development issues is important for making progress on promoting transparency and accountability (see Annex 18). Zambia has an active civil society, which has been working towards greater representation of citizens’ voice in Government. It has promoted key initiatives recently, such as the Extractive Industries Transparency Initiative (EITI), the Access to Information Law and investigative journalism, supported by Bank financing. But despite this progress, civil society’s influence continues to be limited by a lack of institutionalized mechanisms, inadequate information and knowledge of policy processes, poor use of communication strategies and weak links

16
with other actors. It will also be important to strengthen and scale up non-state actor participation for improved budget oversight (e.g. procurement watch), transparency of budget allocation processes (e.g. Open Budget Initiative), service-delivery (e.g. score-cards) and to ensure that these are linked with corresponding government-led interventions wherever possible. 67. The Government has also shown its preference for reducing corruption by increasing funding to good governance institutions, appointing individuals who have championed the anti-corruption agenda, and continuing support for transparency and accountability initiatives. In fact, the EITI Board declared Zambia compliant with the EITI standard on September 19, 2012.22 The administration has also declared the strengthening of public institutions and accountability as clear priorities and has undertaken some initial institutional, regulatory and legal measures to prevent and fight corruption. This includes the updating of the Anti-Corruption Act (which reinstates the criminalization of abuse of public office for corrupt purposes), preparation of an access to information law and work initiated to strengthen the asset disclosure system. E. Zambia’s Development Strategy 68. The country’s long-term development objectives are articulated in the National Vision 2030 that recognizes some important challenges to attaining MIC status. Among the objectives are: attaining high sustained annual growth rates, reduction of poverty to less than 20 percent of the population, and reduced inequality. Among the challenges noted are: achieving an adequate supply of competent, highly skilled human resources, a knowledge-based economy, maintaining efficiency, effectiveness, transparency and accountability in the use of public financial resources. The development strategy to achieve the Vision 2030 objectives has been elaborated in a series of national development plans. The Fifth National Development Plan (FNDP 2006-10) was the first in this series. 69. The SNDP 2011–15 builds on the FNDP gains and was prepared through a highly consultative process before the PF Government came to power. There is a high degree of consistency between the SNDP and the PF Government’s Manifesto and the new Government has indicated that the SNDP and the Vision 2030 will remain the main development frameworks for Zambia. The SNDP identifies the following overarching objectives:
• To accelerate infrastructure development, economic growth and diversification; • To promote rural investment and accelerate poverty reduction; and • To enhance human development.
The Plan focuses on policies, strategies, and programs that contribute significantly to addressing the challenges of realizing broad based pro-poor growth, employment creation and human development as outlined in the Vision 2030. The SNDP identifies growth areas that could unlock Zambia’s natural resource endowments that should provide a basis for development. These are: agriculture, livestock, fisheries, mining, tourism, and manufacturing. The need to diversify the economy along these sectors is stressed. 70. National development plans provide a broad development strategy, but more specific and priority policies and institutional actions are elaborated in other programs documents and speeches from time to time. These include Public Sector Reform Program (PSRP), the Private Sector Development Reform Program (PSDRP), the rolling Medium-Term Expenditure Framework (MTEF), the annual budget, the MOF Strategic Plan 2012-16 and the Performance Assessment Framework (PAFs) agreed with Poverty Reduction Budget Support (PRBS) CPs. The President’s speech during the second session of the 11th National Assembly and the Finance Minister’s speech for the 2013 National Budget have also conveyed Government direction and priorities. The PF Government’s pre-election Party Manifesto also provides indications of policy preferences during its rule.

17
71. The Government has put emphasis on job creation to reduce poverty but a road-map to achieve goals is still to be articulated. Job creation is emphasized as a strategy to reduce poverty and the recent MTEF Green Paper and the 2013 budget speech recognizes four sectors—agriculture, tourism, construction and manufacturing as having the greatest potential to support labor intensive growth. The goal is to create 1,000,000 formal jobs over the next five years. While the jobs lens holds a solution for poverty reduction its achievement may be difficult given the size and composition of the entire labor force of 5.5 million in the country. Private sector led investments are to be encouraged, in addition to PPPs and good governance is emphasized. The Government has also emphasized the importance of closing the development gap between rural and urban areas. However, a road-map, and a specific set of actions that are regularly monitored with clear accountability for the delivery of outcomes is still to be concretized. Some sector specific national strategic plans such as the Rural Development Strategy are under preparation and are likely to provide specific direction.
72. The government-wide results-oriented M&E system currently under development by the MOF and the Cabinet Office aims at strengthening the linkages between planning, budgeting and M&E and focuses on strengthening budget efficiency, policy and program effectiveness. It could also help strengthen budget transparency and overall accountability. However, quality of M&E needs to be gradually strengthened, including of data and the gradual establishment of M&E functions over time, accompanied by the necessary capacity-strengthening. 73. The SNDP explicitly underlines the prioritization of women’s empowerment and gender mainstreaming in the development process. Specific areas of intervention include: agriculture, land, energy, water and sanitation, commerce, trade and industry, access to finance, education and training, maternal and child health, governance, and social protection. The review and harmonization of customary and statutory land ownership laws, procedures and administrative practices to develop gender responsive policies and legal framework is also emphasized.
F. Development Partner Support 74. The second Joint Assistance Strategy (JASZ II) for Zambia sets out the principles for CPs’ support to the SNDP (Annex 19 for CPs division of labor matrix). The overall goal is to support broad-based inclusive growth and poverty reduction as set out in the SNDP while reducing duplication of effort and help focus support in areas that align with each donor’s comparative advantage. The CPs supporting Zambia’s development agenda, including the WBG, have in the past worked with the Government to implement the Paris Declaration in the Mutual Accountability Group (MAG). Currently the MAG is adjusting to the Busan Framework that allows room for new CPs such as the BRICS (Brazil, Russia, India, China and South Africa) to be part of the MAG. 75. While aid to Zambia has been declining (para 26), other sources of finance have become important. United States, EU, UK, World Bank, African Development Bank (AfDB) and the UN system have been the top CPs contributing to Zambia’s total aid between 2006 and 2010. Other significant CPs included Norway, Denmark, Germany, Japan, Finland, Canada and Sweden. In recent years Zambia has received considerable investments from the BRICS, and in particular China. The Zambian Government has also begun borrowing on regional and international markets—for example the US$750 million sovereign bond.
76. The Bank’s role as a global knowledge partner is yet to be fully exploited by Zambia. Consultations with various stakeholders, including the Government reveal that the value of the WBG support to the country is still judged mainly on the amount of financing it brings. The institution’s role as a global knowledge partner and as an objective facilitator of development experience is yet to be

18
fully recognized. Nearly half of the respondents to the client survey reported that they rarely or never used the Bank’s knowledge products in Zambia. During the CPS the WBG will give greater importance to undertaking analytical work and just-in-time notes in critical areas as well as reaching a broader set of stakeholders through improved dissemination so that the Bank’s work can provide the basis for generating solutions for development problems (see Annex 18 for details). 77. Seven development partners—including the Bank—that provide budget support have formed the Poverty Reduction Budget Support (PRBS) group.23 The PRBS group has agreed on a common review process, the Performance Assessment Framework (PAF), which is a multi-year matrix of policy reforms. Budget support has become important as a percentage of total aid. The share of ODA going to general budget support was 8 percent in 2006, while in 2010 it was 23 percent (equivalent to US$217 million or 7 percent of government revenue). Similarly, the share of budget support in total IDA disbursements was substantial in some years (estimated at some 50 percent in 2010), exceeding the envisaged CAS range of 15-20 percent. There is interest in the Government to continue with budget support but the current PAF remains weak.
II. LESSONS LEARNED FROM A REVIEW OF THE PAST WBG ASSISTANCE A. Implementation of the last Country Assistance Strategy (CAS)
78. The last WBG CAS (FY2008-11) was fully aligned with the Government’s FNDP. The CAS Completion Report (Annex 20) rates both the program under the CAS and Bank performance as moderately satisfactory. Of the 23 outcomes under the 2008 CAS, 10 were achieved, 8 were partially achieved, and 5 were not achieved. Achievements were in areas critical to the growth of the economy, such as macroeconomic stability, public financial management, public management and transparency of mining and natural resources, strengthening vocational training, and improving the business environment. While the outcome on improving agricultural productivity was not achieved, the basis was laid for significant contribution from the World Bank during the next strategy period in this area through the design and approval of critical interventions in irrigation (FY11), livestock sector development (FY12) and agriculture research (FY13). MIGA through its guarantees (para 86) and IFC through, among other things, the Emergent Farmers Program (para 88), also supported the development of the agriculture sector. The Bank also managed to maintain a constructive dialogue with the Government and CPs and having a well-staffed office in Lusaka helped. The Bank collaboration with other CPs helped leverage additional resources and strengthen prospects for reforms. 79. The CAS program was, however, not selective. With four pillars, two cross cutting themes, the CAS focus was fairly broad and covered 11 sectors each with several objectives. The scope of the Bank program was ambitious for an envisaged three-year time frame and limited IDA envelope, and in relation to Zambia’s weak institutional capacity—even though some of the program activities were aimed at strengthening that capacity. The CAS design did not reflect the lessons of experience drawn from the previous CASCR that noted “future CASs need to be more realistic in their strategic objectives and should be based on a careful review of past experience and political economy issues” (2008 IEG CAS Review for the FY04-07 CAS). The CASPR recognized that the growth and macroeconomic stability had not translated into jobs and reduced poverty. It recommended that going forward the Bank’s program deliberately focus on poverty reduction. 80. A World Bank supported client survey (Annex 15) in early 2012 rated the Bank’s overall effectiveness as 6 on a 10 point scale. Respondents in 2012 had significantly higher levels of agreement that the Bank plays a relevant role in Zambia’s development, that the programs and strategies the Bank supports are realistic, and that the Bank treats stakeholders in Zambia with respect

19
compared to respondents in the 2004 and 2007 surveys. They indicated that the Bank’s greatest weakness in its work in Zambia was in being too influenced by developed countries. Also, being too bureaucratic in its operational policies and procedures; imposing technocratic solutions without regard to political realities; and not adequately collaborating with non-state actors to ensure better development results were also noted as weaknesses. These have been important considerations in preparing this CPS. 81. In preparing the CPS the Bank undertook consultations (Annex 15) with government officials, civil society, private sector, CPs, women and youth groups. These emphasized the importance of the Bank’s support to the agriculture sector to directly improve the livelihood of rural Zambians. Support for energy and improving access to finance was also emphasized as a means to contribute to private sector development to create jobs. Policy inconsistency, weak regulatory environment, poor governance, weak capacity and poor statistics were recognized as challenges for development. The biggest concern for the youth representatives was lack of opportunities for formal and informal jobs. B. IDA, Trust Funds and Analytical and Advisory Services
82. World Bank Executive Directors approved about US$438 million in IDA for 8 operations and additional financing for 4 projects for about US$75 million during the last CAS period. Three regional projects, one IDA and two GEF supported, were also approved during this period. 83. The sector distribution of IDA resources moved towards agriculture. As the new projects got approved during the CAS period the focus shifted towards agriculture (Annex 20 CAS CR Figure 1).
84. The Bank provided a substantial program of analytical work and capacity building support during the last CAS. Thirty-seven AAA were completed during the CAS period, and 20 were active as of end December 2012. Some of the core diagnostic AAA delivered during the last CAS included a safety net review, a poverty assessment, an investment climate report and a report on jobs and prosperity. Analytical work was also done on the potential of the tourism industry, copper fabrication, beef and dairy industry and the Zambezi river basin.
85. About US$124 million were provided in trust fund resources during the CAS period through 45 trust funds of which 4 were approved in the last few months (Annex 11 covers the active trust funds). Some of these resources were available through stand-alone trust funds (for example the Russian Education Aid Development (READ)) whereas in other cases the trust funds were associated with an IDA project. For example, the Malaria Booster project has trust funds of US $26 million. In addition, Zambia also benefited from global and regional trust funds.
C. Multilateral Investment Guarantee Agency
86. MIGA for the first time issued guarantees for US$18.7 million for investments in manufacturing and agribusiness in Zambia during FY11. The guarantees to Hitachi Construction Machinery Africa Pty. Ltd. and Hitachi Construction Machinery Southern Africa Co., Ltd. of South Africa involved the construction and operation of a re-manufacturing plant24 in Lusaka. The guarantee to Chayton Atlas Investments of Mauritius for its equity in Chobe Agrivision Company Limited in Zambia involved the acquisition of two adjacent commercial farms in the Mkushi farm block in the Central Province of Zambia. The investor plans to increase the amount of land under irrigation from 210 to 580 hectares through increased capital expenditure.

20
D. International Finance Corporation
87. IFC provided substantial investment lending support. IFC commitment over the last CAS period amounted to US$87.6 million for 9 projects to support growth through: (1) helping improve the investment climate; (2) infrastructure development (3) investment in power and telecommunications; (4) diversification of the economy by increasing the competitiveness of agricultural and services sector; and (5) increasing access to finance to underserved market segments, including MSMEs and low-income individuals. A US$25 million loan facility was committed in June 2010 to support Zambia National Commercial Bank’s (ZANACO’s) increased financing for its agribusiness portfolio clients, SMEs, and other sectors including telecom, tourism and manufacturing. IFC also committed US$7 million to Zambeef, a major agribusiness company in Zambia. 88. IFC’s advisory services contributed to improving competitiveness and expanding access to finance. Under IFC’s advisory service on Emergent Farmer Finance a total of 171 farmers (of which 30 percent were women) received financing exceeding the project target of 150 farmers. Since March 2009, the Investment Climate Department (CIC) has assisted the Government with a program that focuses on two activities: licensing and Doing Business reform. In July 2009, the Government announced a wholesale streamlining of 517 business licenses. A total of 130 licenses have so far been streamlined, and legislation has been prepared by the Ministry of Justice to streamline a further 72. IFC also designed and developed a 3-year (2007-10) supply chain development program, the Copperbelt SME Supplier Development Program, jointly with leading mining Multinationals Companies focusing on assisting them with integrating local SME suppliers in the mining operations.
E. Lessons Learned 89. Key lessons of experience that are incorporated in this CPS are as follows: • The WBG needs to use all constituent institutions and instruments—partnerships, knowledge
and lending—to the same level to strategically support the country’s development efforts. Different parts of the WBG have different counterparts in the country. Depending on the situation the need often is not financing but good analysis and information or simply putting stakeholders together. All instruments need to be strategically used to inform the national development process.
• The Bank needs to enhance attention to the impact of political economy and governance in designing its program. Realism is needed in identifying the policy environment where projects and programs can be designed and implemented as well as working in alliance with reform minded factions to contribute to inclusive growth.
• The CPS needs to be more selective in its strategic objectives and consistent with allocated time, resources and available Government and WBG capacity. There are lessons to be learnt from the experience of past projects. The CPS should also not underestimate key risks: in particular, complex project/program design, shortage of skills and capacity for implementation. Sufficient attention must be given to ensuring readiness for implementation and developing an adequate results framework and M&E system.
• An explicit approach of "incremental progress" has proven effective in Zambia and should be adopted in areas where reforms are difficult to bring about. This approach involved the Bank staying the course in a particular policy area and addressing the same or closely related issues in that policy area with successive analytical work or lending operations, but each time incrementally and patiently introducing additional measures until more complete progress is achieved over time as for example in the energy sector. The Bank assistance supported the country expand access to electricity, improve the efficiency of the electricity company, and introduce tariff reforms that enhanced the financial viability of the sector, resulting in recent foreign investment in power generation.

21
III. THE COUNTRY PARTNERSHIP STRATEGY IN ZAMBIA
A. The CPS and the WBG Strategies
90. To be equally responsive to Zambia's LIC related vulnerabilities and MIC transition opportunities, the CPS has two pillars (Figure 3), grounded in the World Bank's Africa Strategy and IFC and MIGA strategies. The World Bank Africa Strategy pillars – vulnerability and resilience and competitiveness and employment—and foundation—governance and public sector capacity—have been adapted to Zambia's context. The CPS is also grounded in IFC’s Africa Strategy and the overall MIGA Strategy. The IFC Strategy for Africa focuses on promoting sustainable private sector development, through improving the investment climate, enhancing support to SMEs and developing projects more proactively in sectors such as infrastructure and agribusiness. The MIGA strategy gives priority to supporting investments in IDA countries that are frequently considered higher risk by the international investment community.
Figure 3. Zambia CPS 2013-16: Framework for WBG Engagement

22
91. The CPS has three objectives (Figure 3), that contribute to the pillars and the foundation and respond to the country's development goals of reducing poverty and inequality, promoting diversification and sustained growth to become a prosperous MIC by 2030: (i) Reducing poverty and the vulnerability of the poor; (ii) Improving competitiveness and infrastructure for growth and employment; (iii)Improving governance and strengthening economic management; 92. Seven outcomes are included under the three objectives. The indicators and milestones under each outcome are presented in the Results Framework included in Annex 1.
B. The Guiding Principles for WBG Engagement in Zambia
93. Seven guiding principles explain the choice of the areas of engagement under each objective. These are elaborated below: 94. Principle 1: Reflecting client priorities. The areas of WBG engagement reflect client priorities. The Government appointed a technical committee of staff from MOF and line Ministries to work with the World Bank team drafting the CPS. The discussions with the committee have ensured that the CPS goes beyond merely aligning with the Government vision and program documents to reflect specific client priorities of support from the WBG. The engagement with the technical committee has also enhanced awareness and ownership of the CPS process at all levels of Government. 95. Principle 2: Building-in flexibility. Chapter 4 provides details on the program of support during the CPS period and Annex 10 Tables 1 to 3 provide a summary on financing and AAA activities. Some degree of flexibility is being maintained to allow the WBG to respond quickly to significant changes in the country context. The CPS Progress Report will be the next opportunity to take note of major changes and realigning the priorities of WBG support, as required. 96. Principle 3: Exercising Selectivity. The CPS focuses on a limited number of outcomes and a few areas of engagement. To address the development challenges noted in Chapter 1 the financing support will be provided as follows in the identified areas: • Reducing poverty, related vulnerabilities and accelerating human development. The WBG will
support programs to protect vulnerable families, promote job opportunities among poor people. The dialogue on safety nets will be deepened and support will be provided for strengthening health systems for results. The Bank’s engagement in education will be through critical analytical work to enhance the effort of ten CPs who recently (September 2012) pledged US$211.25 million to support the sector. Trust fund resources will also continue to be used and the Bank will mobilize partnerships to foster learning and skills improvement in critical sectors (see for example para 147). The Bank will not support water supply where several CPs are active, including the Millennium Challenge Corporation, Germany and AfDB. However, discussions on whether continued support will be provided to support sanitation improvement are underway.
• Promoting agricultural growth and diversification: The WBG will continue working with other CPs to build greater consensus within the country for reform of FRA and FISP and provide financing support in much needed areas such as irrigation, rural roads, research and extension, and livestock development to promote agricultural diversification. Such simultaneous support in several areas has not been provided in the past and will help unlock the potential of Zambia’s agriculture sector.
• Improving competitiveness: Continued support for enhancing the enabling environment and activities for improving supply and access to electricity, transport infrastructure, access to finance and better access to water for hydro-power generation and industry will be supported. Building

23
capacity to improve efficiency and effectiveness and for promoting greater regional integration will also be given importance.
• Improving governance and strengthening economic management: This is a cross-cutting issue which will be supported across the portfolio. In the prevailing policy environment, institutional reform and capacity building activities will be given particular attention.
Principle 4: Improving Effectiveness to leverage IDA. Building on the lessons from the implementation of the last CAS, the Bank will continue to engage in sectors where an “incremental” approach has proven effective. Energy is a good example where over the years the Bank has supported policy reform to improve the governance and performance efficiency of ZESCO and the Government’s objective of increased access to electricity services for the population. Similarly, the Bank-supported process in formulating the Country Water Resources Assistance Strategy, has contributed to the on-going reforms in water resources and facilitated increased awareness around the role of water in the national economic agenda. Both energy and water resource development have public good aspects to them with positive implications for Zambia’s development in the long-run. 97. Principle 5: Incorporating cross-cutting elements. This would include regional integration, strengthening institutional capacity, addressing governance, gender25 and climate change challenges. Box 1: Knowledge Creation for Zambia through Impact Evaluation The World Bank is working closely with Zambian policy makers to evaluate government programs in agriculture and health. One agriculture evaluation examining the impact of a government irrigation program is in the design stage. Another evaluation, the impact of rural road improvement on access to agricultural product markets, was rolled out under the last CAS and will be completed under the CPS. Under the last CAS, an evaluation tested how best to guarantee that health facilities had essential medicines; the Government is designing a nationwide scale-up based on those results. An evaluation of a results-based financing pilot for maternal and child health is underway. These evaluations were developed in careful consultation with the GRZ, complemented by training workshops, to fill knowledge gaps and inform the scale-up of programs in the future. The current CPS will continue this strategy, to support strategic impact evaluations designed and implemented in partnership between the World Bank and the GRZ to improve the quality of operations and other government activities.
98. Principle 6: Transitioning the WBG from primarily a lending to a solutions institution would involve: • Giving as much importance to analytical and advisory activities as lending. Just-in-time analysis in
critical areas can provide the analytical basis for generating solutions for vexing development problems. Strategic impact evaluations can provide hard evidence on which to design scale-up of programs (Box 1).
• Promoting south-south learning partnerships. At the MIC Forum at the Tokyo Annual Meetings 2012, countries stressed the importance of expert advice from experienced, former, successful policy makers who the Bank could bring to work with MICs on specific issues. A "smart mixture" of technical assistance, advisory services, and resources from the Bank was emphasized as being invaluable in promoting development. For Zambia’s mineral sector learning from the Chilean experience could be very relevant as it was for Mongolia.26 The experience of Mauritius that used its tourism sector as a driver of growth and for creating jobs could also be relevant for Zambia.
• Enhance WBG cooperation. IFC and World Bank will increase collaboration in agriculture, infrastructure, private sector development and health. The joint support of the World Bank, IFC and MIGA, particularly on development of PPPs, is expected to show how the strength of different parts of the WBG can be leveraged to produce results on the ground.
• Enhance cooperation between sectors within the World Bank to build synergies for better outcomes. For example, as an input to the CPS process the Health, Safety Net and Education teams have together produced a Human Development Note that gives a holistic view of the status of human development in the country and provides a good basis for undertaking new interventions.

24
• Enhance partnerships and convening role. The Bank will build strategic partnerships through trust funds and co-financing arrangements in sectors such as health and energy and will also engage with existing CPs to better align and strengthen the PAF to meet the new Government’s reform priorities. It will also play a convening role in connecting diverse stakeholders together for example in identifying and dealing with constraints to increasing local content in mining (see para 148).
99. Principle 7: Building on the lessons of experience from the past CAS. Specifically giving greater attention to implementation readiness, using more realistic approaches to risk management and providing effective implementation support to projects.
C. WBG Financial Resources under the CPS
100. IDA resources during the CPS period are estimated at US$400 million –about US$100 million a year. SDR 221 million (US$344 million equivalent) will also be available as undisbursed resources in ongoing projects as of January 1, 2013 (Annex 9). It is assumed that IDA17 allocations will at least be equivalent to IDA16 levels. That said the amounts beyond FY13 are indicative only. Actual allocations will depend on: i) the country's own performance; ii) its performance relative to that of other IDA recipients; iii) the amount of overall resources available to IDA; iv) changes in the list of active IDA-eligible countries; v) terms of financial assistance provided (grants or loans); and vi) the amount of compensatory resources received from the MDR initiative. IDA allocations are made in SDRs and the US dollar equivalent is dependent on the prevailing exchange rate. 101. Regional projects leverage additional IDA resources.27 Examples include the Regional Agricultural Productivity Project and the Kafue-Town-Muzuma-Victoria Falls Regional Transmission Line Reinforcement Project that bring in US$20 and US$30 million of regional IDA respectively. 102. The Global Partnership on Output- Based Aid,28 and the Climate Investment Fund will bring added resources. The Pilot Program for Climate Resilience (PPCR) includes about US$33 million administered through the World Bank and US$15 million through IFC. With the finalization and signing (expected later this year) of the CAADP29 investment plan, Zambia will be eligible for global funding from the Global Agriculture and Food Security Program (GAFSP).30
103. Trust funds will be used strategically to complement IDA. About US$13.7 million is available in undisbursed resources from existing trust funds. Additional resources are also expected from CPs for supporting progress on MDG 4 and 5. Regional trust funds will also be available. 104. The Bank will continue to attract complementary financing from other CPs where possible. The Bank is already working with the European Union and the European Investment Bank (EIB) in the energy sector. The Bank is also working closely with the AfDB, United Nations, Nordic Development Fund, KfW, and other partners on the climate change intervention. Netherlands is providing trust fund resources for supporting activities that promote gender equality in the agriculture sector and for improving competitiveness, financial literacy and consumer protection.
105. IFC brings additional investment resources and MIGA will play a facilitating role to attract Foreign Direct Investment (FDI). IFC is set to grow substantially over the next few years in support of agribusiness, mining and private sector development activities. MIGA will foster development in Zambia by providing political risk insurance to investors and lenders.

25
Outcome 1.1. Summary table of interventions On-going Financing IDA: Irrigation Development and Support Project; Livestock Development and Animal Health Project; Agricultural Development Support Program; IFC: Zambeef. ZANACO, investments on farm-blocks Trust Funds: CAAPD Child trust fund; Regional trust fund on gender equality; Global fund on knowledge and learning; Linking women and the private sector; Livestock Data Collection and Analysis in Zambia Pipeline Financing Regional IDA project: Agriculture Productivity Program for Southern Africa (APPSA) IFC: Additional support to ZANACO MIGA: Guarantees for investments in aquaculture and agribusiness On-going AAA Linking Women and the Private Sector; Cashew Value Chain Proposed AAA Farm blocks; Agriculture and Rural Employment Land Policy; DTIS, Next Step notes FISP, FRA etc. Partnership and Leverage South-south learning events, Collaboration with Indaba Agriculture Policy Research Institute; regional research
106. The Government has expressed interest in accessing IBRD resources. In response, the Bank undertook a preliminary desk review of Zambia's creditworthiness. A more detailed mission will follow. In the meantime, options for enclave IBRD investments will be explored.
D. CPS Instruments
107. The CPS will draw on partnerships, knowledge and financing instruments to transition the WBG from a lending institution to one that can bring all kinds of knowledge-based solutions to support the country’s development goals. All three parts of the WBG will partner to build synergy and focus for results. IV. PROPOSED CPS OBJECTIVES AND EXPECTED RESULTS
A. Objective One: Reducing Poverty and the Vulnerability of the Poor 108. Two specific outcomes will be supported under this objective. CPS OUTCOME 1.1: IMPROVED ANIMAL AND CROP PRODUCTIVITY IN SELECTED
AREAS
109. Analytical Underpinnings. The poor in Zambia are overwhelmingly engaged in agriculture. Productivity is low because of inadequate access to technology, weak research and extension systems, limited irrigation and lack of access to markets particularly for small-scale farmers, poor rural roads and limited or expensive finance. The WDR 2008 on Agriculture for Development reported that GDP growth originating in agriculture is about four times more effective in raising the incomes of such poor than GDP growth originating outside the sector. Both Bank and non-Bank analytical work demonstrates both the potential as well as the constraints to improving agricultural productivity in Zambia. 110. Expected Results of IDA-financed operations. An irrigation project expects to increase yields per hectare and value of products marketed by smallholders; a livestock project aims to improve the productivity of key livestock production systems for targeted female and male smallholder producers; another agriculture project has been supporting increased commercialization of smallholder agriculture. Projects that support infrastructure development, such as electricity, roads and water resources discussed under objective 2, will provide market linkages, access to electricity and better management of water resources and contribute to agriculture development.
111. Expected Results of regional operations. A regional project involving Malawi, Mozambique and Zambia will strengthen regional approaches to agricultural technology generation and dissemination by establishing regional centers
26
of research leadership. The project will support legume research in Zambia and maize and rice research in the other two countries.
112. World Bank AAA and IFC advisory activities. World Bank AAA provided the analytical basis for the reform of FRA and FISP. Next step-notes on these and other key issues (FISP, FRA, rural roads, land and farm blocks) will be undertaken. The Bank and IFC are together undertaking a review of the cashew value chain, a crop important for one of the poorest regions—Western Province. A study on farm blocks will explore the concept, its progress and its feasibility as an approach. A policy note is looking at the potential of the agriculture sector for creating jobs. A Diagnostic Trade Integration Study (DTIS) will, among other things, focus on unlocking the potential of trade in agricultural products. 113. Trust funds. A regional Gender Equality trust fund will support the development of best practices for women's empowerment and entrepreneurship. The focus is on one of the key issues identified in the 2012 WDR on Gender -gaps in male and female productivity in agriculture. A global trust fund on Knowledge and Learning targets female farmers and is linked to their access to land. 114. Another trust fund on Linking Women and the Private Sector will finance activities for identifying good practices for the improvement of labor standards in agribusiness and for increasing the participation of women in the private sector. A trust fund is helping build statistical capacity in the Ministry of Agriculture and Livestock. 115. The specific project development objective of the CAADP - Child Trust Fund (CTF) is to improve strategic planning and implementation of agricultural investments at the national and regional levels. This will be accomplished by supporting COMESA's capacity to support the CAADP Roundtable process at both the country and regional levels. 116. IFC. IFC recently disbursed a 10 year US$30 million loan to Zambeef for expanding processing capacity, adding new retail outlets and improving efficiency and will provide opportunities for development of out-grower farmers. IFC could also support agriculture related infrastructure development in farm blocks through PPPs and construction of storage infrastructure such as silos. IFC will provide support for scaling-up access to finance for growing emergent farmers through its partnership with ZANACO—the expected beneficiaries mostly being MSMEs engaged in agribusiness.
117. MIGA. MIGA will continue to seek opportunities to support agribusiness development. Currently, two projects are under consideration: An investment by Liongate Venture Fund of the Cayman Islands in Yalelo Limited in Zambia that involves the establishment of an aquaculture facility on the Zambian side of Lake Kariba. Yalelo will contribute to food security by providing a local source of tilapia on a commercial scale. The project is also expected to generate 100 local jobs. Secondly, an expansion project by Chayton Atlas Investments of Mauritius in Chobe Agrivision Company Ltd. in Zambia will cultivate maize, wheat, and soya for consumption in Zambia and eventually neighboring countries. Introduction of highly efficient agricultural practices such as crop rotation and zero tillage, soil and water management, and certain technological improvements is expected to result in increased productivity and sustainable crop yield enhancement. The project will also contribute to increased food security within Zambia and the broader Southern African Development Community – the target market for consumption.
118. Partnership and leverage. The World Bank will facilitate south-south learning between Zambia and countries such as Brazil and India on increasing agricultural productivity, particularly under rain-fed conditions.

27
Outcome 1.2 Summary table of interventions On-going Financing IDA: Irrigation Development and Support Project, Zambia Malaria Booster Project Trust Funds: GEF projects; Zambezi river basin support program; The Russian Trust Fund under the Malaria Booster; Capacity Building for Public Expenditures; Health Results Innovation Trust Fund Pipeline Financing Water Resource Development; Health and Nutrition Pipeline Trust funds PPCR Phase II administered by IBRD and IFC; COMACO Landscape Management Project under Bio Carbon Fund; Support to work on MDG 4 and 5 On-going AAA Safety Net Review; ICT for Health Initiatives; Zambia Health Financing; Results-Based Financing Impact Evaluation; Nutrition Institution capacity building; Analytics on HIV Proposed AAA Rural-urban linkages; Peri-urban sanitation improvement; reform of public service pension system; analytical work on education and health Partnership and Leverage Between the WBG and CPs for strengthening community resilience to shocks and improving their asset and resource base; PPP for the delivery of health services; the World Bank and USAID in the health
119. The regional project (para 111) will support the development of collaborative partnerships between weak and strong systems in the region. In line with its support under the CAADP, SADC is currently in the process of defining a new regional agenda for research and development (R&D) and is supporting the establishment of an autonomous sub-regional research organization to implement this agenda. The newly established Center for Coordination of Agricultural Research for Southern Africa (CARDESA) is expected to significantly increase the capacity available to support regional R&D activities, and the proposed regional program is seen as an important activity in the initial implementation of its operational plan.
120. The Bank will also continue to collaborate with the Indaba Agriculture Policy Research Institute in Lusaka to share knowledge and explore opportunities for joint work. The Bank is actively working with other CPs such as the Food and Agriculture Organization and the World Food Program (WFP), to continue to bring pressure to bear on FRA and FISP reform. World Bank and IFC will continue to cooperate in supporting activities that promote agribusiness development.
CPS OUTCOME 1.2: IMPROVED ACCESS TO RESOURCES FOR STRENGTHENING
HOUSEHOLD RESILIENCE AND HEALTH IN TARGETED AREAS
121. Analytical Underpinnings. The poor are vulnerable to climatic and other shocks. Decreasing vulnerability for the poor requires access to resources for improving resilience such as irrigation, policies that help build their human capital, and contribute to improved health and nutrition among them. Jobs in maintenance and construction of infrastructure, afforestation and land conservation activities provide returns and build community assets that increase the productivity of the poor. 122. Expected Results of IDA-financed operations. Several projects involve construction and maintenance of infrastructure—for example, roads and bridges, irrigation and water supply will create jobs for the poor and increase their incomes. Development of irrigation will also help decrease vulnerability to droughts for farmers in the areas where such infrastructure is constructed. A water resource development project will contribute to increased water security and decreased vulnerability to droughts by increasing the reliability of water for productive purposes and thereby strengthening community resilience to climatic variability.
123. The Bank will continue supporting Government with strengthening health systems through scaling up activities to expand access to malaria prevention and treatment; improving the capacity of the Ministry of Health to implement the National Health Care Waste Management Plan and the capacity of local communities to effectively prevent, control and treat malaria based on community demand-driven interventions. As part of the

28
Malaria Booster Project, IDA continues to support innovative ways of improving the supply chain system of essential medicines by introducing ICT for health initiatives in the public sector. A follow-on intervention in the health sector focused on health system strengthening to accelerate improvement in maternal and child health outcomes, building on some of the lessons of the Malaria Booster is in the pipeline. 124. The Bank will also deepen the dialogue on social protection and nutrition to provide input for developing a sustainable safety net program in the coming years. Discussions are also under way to explore the possibility of a public work program that could generate income for the poor while also contributing to afforestation, land and soil conservation. In addition, opportunities for collaboration across sectors within the Bank will be explored, such as linking increased food production in the irrigated sites supported under the irrigation project with intensified nutrition education to address malnutrition. 125. Trust Funds. The Pilot Program for Climate Resilience (PPCR) Phase II will intervene in some of the poorest districts of Western and Southern Provinces, working at the community and district level through improved climate information, access to credit and weather-index insurance (supported by IFC), better planning for floods and droughts, and diversification of sources of income to address the root causes of vulnerability. The project would help generate an estimated 3,250 person-days of labor-intensive works in the region and directly benefit the rural population estimated to live in wards adjacent to the canals (about 41,700 people). The interventions would specifically target women-headed households, as well as households classified as very or extremely vulnerable. The PPCR will also promote climate risk financing, including preparing the Government to eventually receive financing from the Green Climate Fund and supporting the establishment of a new inter-sectoral institutional framework to improve coordination amongst the growing number of climate change mitigation and adaptation projects in Zambia. 126. A series of projects on the Zambezi River basin are expected to strengthen cooperative management and development within the river basin to facilitate sustainable climate resilient growth.
127. The Government has also requested support for building capacity for scaling up of the Cash Transfers Schemes for the most vulnerable and linking them with other interventions. The Bank is exploring accessing trust fund resources to address this request.
128. There are two Global Environment Facility (GEF) projects—one regional and one national—being implemented by the World Bank in Zambia. The national project is expected to contribute to sustainable conservation and management of both Lavushi Manda and Kasanka National parks. The supported activities will contribute to tourism development and the welfare of poor communities in game management areas. The regional project, being jointly implemented with Malawi, is expected to also contribute to sustainable management of biodiversity in the conservation area. It will also strengthen the ability of community members living in the Chama district to enter the economic mainstream by leveraging tourism opportunities and improve farming practices through conservation farming.
129. A project under the Bio-Carbon Fund will increase small-holder crop yields from sustainable climate-smart agriculture, increase farmer income and welfare, reduce uncontrolled forest loss and degradation and increase net forest cover in the Luangwa Valley.
130. The Malaria Booster Project has leveraged a significant amount of trust funds resources. The Russian TF has supported procurement and delivery of bed nets, rapid diagnostic tests, and indoor residual spraying. The Health Results Innovation Trust Fund has provided resources for piloting

29
innovative mechanisms for improving maternal and child health outcomes and is being implemented in ten intervention districts. It aims to address systemic issues for improved service delivery such as human resource constraints. The country grant is accompanied by a US$ 2.0 million Bank-executed grant for an impact evaluation to measure the impact of the program to help the Government answer some key questions before scale-up to national level. 131. The Capacity Building for Public Expenditure Tracking trust fund is expected to strengthen the capacity of the Government and partners for tracking expenditure, particularly HIV/AIDs related public expenditure, and assist in developing a mechanism for tracking expenditure within the MOF, CSOs and the University of Zambia's Health Economics Department.
132. IFC. Through the Pilot Program for Climate Resilience, IFC will be promoting climate-resilient investments and access to credit for vulnerable communities living in the Barotse and Kafue sub-basins of the Zambezi. IFC recently committed four teams of consultants to focus on identifying viable business opportunities to (i) build climate resilience in agri-business, water supply, energy production and natural capital; (ii) develop a mobile phone platform to facilitate the dissemination of market and climate information to farmers though private sector investment; (iii) provide weather index-based insurance products to farmers; and (iv) promote microfinance to build climate resilience.
133. Partnerships. The World Bank will be working closely with IFC and the AfDB in strengthening community resilience to shocks and improving their asset and resource base in critical sub-basins of the Zambezi. The Climate resilience project is expected to leverage an estimated US$105 million in parallel financing from other partners (AfDB, IFC, Nordic Development Fund, UN, GEF, World Fish, Red Cross, Concern etc.)
134. Currently the Government and the WBG are exploring the possibility of a PPP for the delivery of health services. There is opportunity for Zambia to learn from the experience of the Government of Lesotho in this regard that has recently negotiated and launched a unique PPP with a private sector consortium to establish and operate a national referral hospital and mini health care network.
135. The World Bank and USAID are also collaborating to improve results in the health sector by identifying and removing bottlenecks to increased collaboration at the country level. The initiative, supported at the highest levels in the two organizations, is expected to lead to improved communication between the two CPs, including on sharing data and complementary support in areas such as health care financing and supply chain management. The World Bank (World Bank Institute (WBI) in partnership with the country team) is also working with the European Commission in developing and delivering innovative tools for capacity development and participative governance, with an emphasis on the health sector.
136. DFID is starting sector budget support in education in 2013 and the Ministry has agreed to carry out a public expenditure review in Education in 2014 in which the Bank will be engaged through the provision of sector expertise in its preparation.
137. AAA. The dialogue on safety nets will be deepened building on the recent review of safety net programs by the Bank (see para 36) before a decision is made on whether to support an IDA project in this area in the outer years. The analytical work on safety nets is expected to inform the Government’s new Social Protection Policy expected to be finalized soon. The World Bank will also be supporting a study of rural-urban linkages to understand why growth has had limited impact on rural areas so far and to explore the options for improving service delivery to sparsely populated rural areas.

30
The Bank will engage in policy dialogue and technical assistance on options for reform of the public service pension system and for strengthening old age income protection.
138. The Bank will engage in analytical work and policy dialogue with the GRZ to analyze and diagnose areas in which the education system needs further improvement. In particular, to identify causes of low learning outcomes among students, and ways in which the country can foster skills required by growing industries. Tools like Service Development Indicators and impact evaluation could be used for this analysis.
139. The Bank has also been part of considerable analytical work done on the economic impact of tourism and management of wildlife policies on poor communities and can inform policies and implementation as the Government moves ahead on the diversification agenda. These reports will be shared with stakeholders in relevant fora. As needed, additional analytical work will be supported.
140. In the health sector the Government has indicated interest in Bank’s assistance to develop a comprehensive Health Financing Strategy to improve health sector performance. A series of analytical work are planned and will be used by the Ministry of Health and other partners to develop a detailed implementation plan. The Government and other CPs are keen for Bank assistance to explore the efficiency and effectiveness gains as a result of integrating HIV services within the broader health system services and the best way to increase the demand for safe medical male circumcision services. Technical assistance will also be provided to build the capacity of the National Food and Nutrition Commission (NFNC), a statutory government body, which is responsible for coordinating policy and strategic planning on nutrition and the Ministry of Community Development, Mother and Child to develop an M&E framework for the National Food and Nutrition Strategic Plan and costing of the 1000-day action program.
B. Objective Two: Improving Competitiveness and Infrastructure for Growth and Employment
141. The recent WDR on Jobs recognizes the key role of the private sector in job creation in the developing world while noting the vital role that governments play in ensuring that the conditions are in place for alleviating the constraints to private sector development. Three related outcomes are supported under this objective—improving the business environment, improvements in transport, energy, water and telecommunication infrastructure and access to finance for SMEs. CPS OUTCOME 2.1: IMPROVING KEY ASPECTS OF THE REGULATORY ENVIRONMENT
FOR BUSINESS 142. Analytical Underpinnings. The Doing Business Survey continues to be the main guide in the Bank's investment climate work in countries. In Zambia joint Bank/DFID analytical work –Jobs and Prosperity, Copper Mining, Beef and Dairy and Tourism—has also been instrumental in dialoguing on investment climate issues as has the recent Light Manufacturing in Africa Report (2012) and its Zambia case study. 143. The Bank prepared the Report on Observance of Standards and Codes-Accounting & Auditing (ROSC-A&A) in 2009 which recommended many measures to enhance compliance with corporate accounting and auditing standards, improve accounting education and for setting up an independent oversight mechanism for monitoring and enforcing compliance with prescribed standards. There has not been much appetite for the setting up of an independent oversight mechanism and the reforms dialogue in this area has not progressed as expected. During the CPS implementation efforts will be made to move on the reform dialogue in this area.

31
Outcome 2.1 Summary table of interventions On-going Financing IFC: Investment Climate Program phase II Trust Funds: IFC’s Zambia Investment Climate Program; Proposed Financing IDA: Likely budget support credit for improving the enabling environment for private sector development. On-going AAA Updating the regulation and supervision framework for micro insurance; Bi-annual economic brief series Proposed AAA Analytical work on Job Skills Partnership and Leverage AUSAID and WBG, and possibly the EU in mining sector; World Bank and IFC are facilitating ZMLCI, a collaborative public-private initiative; WB also working with ACET in Ghana; IFC and the World Bank on PPPs; IFC and WB on investment climate reform
144. Expected results of IDA-financed interventions. The support for institutional reforms and capacity development under the CPS (para 175) will contribute towards improving the enabling environment for private sector development. 145. IFC. A new Investment Climate Program approved in January 2012 is helping improve Zambia's regulatory environment and overall competitiveness and focuses on business regulation reform, trade logistics, e-Government, and industry-specific investment climate reform. 146. Trust Fund. A trust fund will provide technical assistance support for updating the regulatory and supervisory framework for micro-insurance. This work builds on research done in Zambia by the International Labor Organization (ILO) and is required to adapt the existing regulatory and supervisory framework to support the expansion of the micro-insurance market. Another trust fund is funding an expert to work with the Bank of Zambia to review their current use of risk-based supervision and make recommendations for this approach focusing on identifying, assessing and responding to risk accumulation.
147. Partnerships and Leverage. AUSAID and WBG, and possibly the EU, will collaborate to provide capacity building and skill-building support in priority technical areas, such as mining cadaster improvements, geo-data mapping and physical audits monitoring, and integrated planning for mining and infrastructure. AUSAID will take the lead in providing study tours and scholarships for Government officials to countries where capacity in these areas is advanced.
148. World Bank and IFC are facilitating the Zambian Mining Local Content Initiative (ZMLCI), a collaborative public-private initiative (launched in July 2012) comprising representatives of the large-scale mining industry, the Zambian manufacturing and SME sectors and key Government agencies. It is expected that through sustained collaboration, local manufacturers can become an integral part of mining supply chains, ultimately leading to greater industrialization in the country. AUSAID has also expressed interest in supporting the initiative. The World Bank is also working with the Africa Center for Economic Transformation (ACET), a Ghana-based think-tank that is conducting a multi-country comparative assessment of the mining regulatory and legal frameworks covering Zambia, Botswana, Namibia and South Africa in the SADC region. Discussions are in progress on two regional projects, one that would help alleviate the institutional, legal, policy and road infrastructure along the North-South Corridor and the other, to accelerate the process of economic integration between Malawi, Mauritius, Zambia, Mozambique and Seychelles. 149. IFC has joined a new initiative with Bank of Zambia for monthly meetings with the World Bank and IMF to discuss economic and financial sector issues that are of importance to private sector development. In this regard, the World Bank and the IFC will also assist Zambia with financial and technical assistance and discuss practical steps that the Government can undertake to regain the reform momentum going forward (see para 47 on drop in Zambia's ranking on 2013 Doing Business). IFC and the World Bank are also coordinating their support to the Government for PPPs in

32
key areas such as capacity building (institutional capacity for identification, appraisal and implementation of PPPs) through implementation of actual PPP transactions. 150. The Bank will complement IFC's Investment Climate Program through supporting the promotion of Business Development Services (BDS), business linkages and the public-private dialogue. Continued structural transformation toward labor intensive industries is crucial for job creation and sustainable development. The recent study on Light Manufacturing in Zambia (World Bank 2012c) provides analytical insights and recommendations for developing the country's light manufacturing and labor-intensive industries. According to this work, inputs, both the availability and quality, are the main binding constraint to Zambia's competitiveness in light manufacturing. The Bank will facilitate, together with other CPs, a process of dialogue between all stakeholders to address these binding constraints.
151. The ILO in collaboration with the Zambia Federation of Employers (ZFE) has launched an assessment of the Enabling Environment for Sustainable Enterprises (EESE) in Zambia to which the World Bank is contributing. 152. AAA. The World Bank is contributing to a Chamber of Mines and International Council on Mining and Metals collaborative study on nation-wide benefits to the economy from the mining sector. If needed an assessment of the legal framework for investment climate reform could be carried out. With Zambia’s improving economic status there is an increasing demand for good and timely economic information from the domestic private sector as well as potential investors in US, UK and South Africa looking at frontier markets in Africa. Policy debate in the country also remains weakly grounded in good information and evidence. Respondents to the client survey also highlighted the importance of adequate data and statistics on the country’s economy. The Bank will meet this development need through frequent assessments and will launch a new bi-annual economic brief series to provide good and credible economic information on the country and build a Bank “brand.” These economic briefs will be a flagship production of the Zambia country team.
153. The Bank will undertake analytical work and a review of its experience across Africa to draw lessons on what can be done to build skills for jobs. The Bank in coordination with the GRZ will diagnose ways in which the country can foster skills required by growing industries like manufacturing and extractive Industries. CPS OUTCOME 2.2: SELECTED INFRASTRUCTURE BUILT AND REHABILITATED
154. Analytical Underpinnings. Critical infrastructure investment gaps constrain the competiveness of the Zambian private sector. A World Bank Policy Paper (World Bank 2011a) found that Zambia would need to spend an average of $1.6 billion a year over the decade 2006–15 to develop the infrastructure found in the rest of the developing world. This is equivalent to 20 percent of Zambia’s GDP and about double the country’s rate of investment in recent years.

33
Outcome 2.2 Summary table of interventions On-going Financing IDA: Road Rehabilitation Maintenance (RRMP) Project ; RRMP II; Increased Access to Electricity Services Project; Water Sector Performance Improvement Project Regional IDA projects: Transmission Line Reinforcement Project; Southern Africa Power Market Project Trust Fund GEF Increased Access to Electricity Zambezi River Basin Support Program Pipeline Financing IDA: Electricity Distribution and Rehabilitation project; Water Resource Development Project IFC: Support for PPPs and telecommunication MIGA: Guarantees Trust Fund: ESMAP; GPOBA resources; PPAIF, Proposed AAA WSP: Promoting peri-urban sanitation approaches; study for growth poles Partnership and Leverage WBG and CPs on PPPs; Updating of the 2003 National Transport Policy; Facilitating a meeting between Zambia and Zimbabwe on Kariba dam and Batoka Gorge.
155. Expected Results from IDA-financed operations. Two road projects support the construction of new bridges and the rehabilitation of selected sections of paved roads and will help improve connectivity and build institutional capacity for sustainable management of transport infrastructure. An electricity project supports increased access and improved efficiency and quality of distribution. Another pipeline electricity project will provide support for rehabilitation of the run-down transmission and distribution network in Lusaka, improvement in the efficiency and effectiveness of ZESCO and the overall energy system in Lusaka. A water project will support the Government in implementation of the new legislative framework for the development of the country's abundant water resources and advance on a pipeline of infrastructure projects. Another project is providing support for improving access and sustainability of water supply and sanitation services for consumers in Lusaka and discussions are on-going on whether the Bank should be supporting another intervention in this area. 156. Expected Results from Regional Projects. A regional project is facilitating development of an efficient power market in the region. Another regional project will help improve electricity availability and reliability of supply by supporting the reinforcement of the existing transmission network, increasing ZESCO's power transfer capacity to the southern part of the country, and reducing the high level of technical losses in the network. The World Bank is also helping to push the agenda on regional transport (for example, through the Sub-Saharan Africa Transport Policy Program) and regional water resource management (for example, the Zambezi River Basin Development Program). The Bank recently (October 2012) organized a multi-country and multi-sectoral regional conference in Lusaka on road safety in African cities that is expected to move the multi-sectoral road safety agenda forward. 157. Trust Funds. Use will be made of Public-Private Infrastructure Advisory Facility (PPIAF) resources to provide PPP support. A European Community grant is supporting grid intensification for ZESCO and grid extension for the Rural Electrification Authority.
158. A project under the Cooperation in International Waters (CIWA) trust fund will help in supporting regional efforts to enhance development gains through cooperation around the Zambezi River basin. This includes building on efforts to alleviate historical geopolitical constraints to cooperation and advance development of the Batoka Gorge Hydro-Electric Scheme.
159. An ESMAP trust fund will provide technical assistance to support a comprehensive mapping exercise for wind, solar, and mini-hydro resources in Zambia. Resources from GPOBA (endnote 28) will also be available for solar energy programs in schools and health centers as well as connection fee subsidies to reduce the cost of grid connection for low income families. 160. IFC: Support for PPPs will help improve infrastructure as discussed in paragraph 149. IFC is also looking to invest in a company that is strengthening telecommunications—through fiber

34
infrastructure to connect the company’s backbone network to densely-populated towns and corporate clusters in the Zambian copper mining belt aimed at providing better internet service and connectivity. 161. MIGA: MIGA's value added under this outcome will be (i) termination guarantee credit enhancement, regulatory risk and other investment guarantees; (ii) ability to guarantee public sector projects through non-honoring products;(iii) knowledge and experience of infrastructure/ power sectors in other countries with similar types of reform; (iv) client relationship with major players, including sponsors and lenders; (v) dispute resolution expertise (as between public and private sector stakeholders). MIGA will work closely with IFC on the investment side as well as with the Bank to seek opportunities for transfer and exchange of knowledge. In addition, MIGA will explore opportunities for relevance in critical sectors such as energy and mining. 162. Partnerships and Leverage. There is already an existing partnership with EIB in the energy sector. The Bank will work closely with IFC and CPs such as DFID to support the Government with PPPs for infrastructure. A partnership is also expected to be developed between the World Bank and IFC in the water and sanitation sector. The World Bank is taking the lead in the review and updating of the 2003 National Transport Policy. Similarly, the AfDB is funding the development of a National Transport Master Plan for Zambia. In these policy discussions, the World Bank is actively providing input in the overall position of the CPs. 163. The World Bank is also facilitating a series of meetings between the Energy Ministers of Zambia and Zimbabwe and the Zambezi River Authority on the financing and rehabilitation options for the Kariba dam and the financing options for the Batoka Gorge. 164. AAA: Technical assistance on water and sanitation will support the Ministry of Local Government and Housing (MLGH) to develop a mechanism for introducing condominial sewer systems in peri-urban settlements. A review and updating of the 2003 National Transport Policy to include the impact of climate change, gender policies, intermodal transport services and provision of disaster risk management is also underway. 165. An initial piece of analytic work will be carried out to assess the feasibility of a regional growth pole development model. The growth pole concept explores the linkages and synergies possible from a coordinated cross-sector approach. It encourages the development of mutually beneficial infrastructure (mainly power and transport) and explores how private capital can be attracted to finance this infrastructure.
CPS OUTCOME 2.3: IMPROVED ACCESS TO FINANCE FOR SMALL ENTERPRISES
166. Analytical Underpinning. The availability and cost of finance in Zambia is one of the most significant constraints to the operations and growth of SMEs. The 2010 Zambia Business Survey highlighted that only 10 percent of Zambian MSMEs were banked and that less than 2 percent had a business loan. An SME Forum organized by the World Bank and the Bank of Zambia in June 2012 drew on the experience of China and Turkey (models used in these two countries) and identified several areas that would facilitate access to finance for SMEs.31 As a follow-up to the forum, the Government requested Bank assistance for designing and funding a line of credit for SMEs.

35
Outcome 2.3 Summary table of interventions On-going Financing Trust Funds: Global trust fund on Growth and Equity IFC interventions: Local currency programs to support economic development (Swaps, Liquidity Enhanced Asset Program (LEAP), Bond issue). Pipeline Financing IDA: Access to Finance for SMEs On-going AAA CPFL Proposed AAA Financial Sector Assessment Program (FSAP) Enterprise Survey; Financial Sector Assessment Program Partnership and leverage Between WB and IFC and WB and CPs for the access to finance agenda for lower income groups, transformational banking and the use of technology in increasing access to finance;
167. IDA-financed operations. An access to finance project will provide a line of credit to broaden and deepen access to medium- and long-term finance for SMEs in Zambia. The Bank will also attempt to support SMEs in their development, for instance through BDS, to ensure that the proposed supply side intervention is equally supported from the demand side. The project will draw on the experience of successful credit lines around the world to increase access to finance for SMEs in Zambia.
168. The World Bank will also support the financial sector reform dialogue during the CPS. The policy, legal and regulatory reform agenda in the Zambian financial sector is supported by the Government’s Financial Sector Development Plan Phase II (FSDP II).32 About 20 bills, laws, and regulations are currently being revised, but progress has been relatively slow. Three of the most important reforms to facilitate access to finance for SMEs are the Credit Reporting Act, the Leasing Law, and the Branchless/Agent Banking Regulations.
169. IFC. IFC will also focus on the SME sector and increase local currency programs to support economic development (Swaps, Liquidity Enhanced Asset Program (LEAP), Bond issue). IFC is also looking to assist Bank of Zambia with support for access to finance for MSMEs. The Bank of Zambia has indicated interest in IFC support for both credit bureaus and collateral registry. 170. AAA. An Enterprise Survey will inform a demand side analysis for SME finance. A Financial Sector Assessment Program update is also planned. On the request of the Bank of Zambia, a diagnostic review of CPFL was conducted, the findings of which will inform the IDA project (paragraph 167).
171. Trust Funds. A trust fund on Growth and Equity is supporting improvement of financial literacy and consumer protection to build consumer trust in the financial sector and expand the confidence of households to wisely use financial services.
172. Partnerships and leverage. The World Bank and IFC are coordinating their support for financial and private sector development through better information sharing, overall business planning and complementary support. As the FSDP II is phasing out, the World Bank will also work with CPs such as DFID in addressing the access to finance agenda for lower income groups, transformational banking and the use of technology in increasing access to finance.
C. Objective Three: Improving Governance and Strengthening Economic Management
173. There is a strong recognition within Government that accountability, transparency and good governance remain the cornerstone for prudent management of public affairs, provide the enabling environment for private sector development and for development outcomes to benefit the people of Zambia. On the supply side this will entail continued efforts to reform policies and improve the information base in the country by, among others things, helping to develop good statistical capacity. On the demand side this will entail the enhancement of non-state actor voice around issues of public service delivery. Wherever possible, the linkages or interface between these two sides will be emphasized. Contribution to development of skills will also be important for improving the
36
Outcome 3.1 Summary table of interventions On-going Financing Trust funds: GPF; EITI; Technical assistance to support efficiency of mineral revenues collection and investment Pipeline Financing IDA: Budget support Trust funds: Public Financial Management Reform Program MDTF, Externally Financed Output (EFO) Ongoing AAA Zambia Mining Sector Governance Reform; Public Sector Management; Economic Briefs Proposed AAA Just in time advice on IFMIS and procurement; Support for M&E; TA on project appraisal and analysis; Improvement in statistics and surveys; TA Procurement; Evaluating the use of ICT and community radio to strengthen governance; Annual Update of PEFA Paper writing using data from ZAMMOD Partnership and leverage WB and other CPs, e.g. DFID on PSM and PFM reforms
performance of both public and private sectors as the low quality of human capital constraints both public and private sector performance.
OUTCOME 3.1: STRENGTHENED SYSTEMS AND PROCESSES FOR PUBLIC SECTOR
PERFORMANCE
174. Analytical Underpinnings: Substantial analytical work is available to underpin Bank’s dialogue and support on public sector issues. Analytical work includes the PEMFAR 2004, the Jobs and Competitiveness Report (2010), the Public Expenditure Review (PER, 2010), the Poverty Assessment 2012. Several reports and evaluations have also been prepared by the Government such as PEFA, 2005, 2008, and 2012 (draft). The Bank has also carried out an assessment of debt management capacity (DEMPA 2011) and prepared a Public Debt Management Reform Plan (World Bank 2013b). 175. Trust Fund and IDA resources: The previous CAS included a PSM project and a series of three budget support operations, the latter in coordination with other PRBS donors.33 During this CPS, the Bank will explore, in partnership with other donors, budget support credits that would disburse against agreed milestones. Given the prevailing environment around major policy reforms, the CPS proposes a flexible approach. The credits could include policy actions if the Government prepares a strong program of policy reforms that are reflected in the PAF. In the absence of strong policy actions, the Bank will consider other instruments (e.g. Program-for-Results (PforR)) also to support a program of institutional reforms and capacity building for economic and public sector management. The areas covered could include PFM, procurement, debt management, fiscal decentralization, project appraisal, M&E and statistical capacity building. The underlying strategy would be to complement financial support with advisory activities through trust funds. An institutional assessment of the Road Development Agency is also being undertaken using a Governance Partnership Facility (GPF) funds with a view to identifying institutional weaknesses and entry points for reform.
176. A multi-donor trust fund will provide support for PFM activities such as improved financial reporting, continued roll out of IFMIS to district levels, internal and external audit, budget preparation and execution and public procurement reform. Support will also be provided for addressing weaknesses in processes and systems in institutions charged with ensuring that public resources are utilized for the purposes that they are intended, such as the Anti-Corruption Commission and the Office of the Auditor General.
177. The global EITI trust fund will generally promote greater transparency and accountability in the operations of extractive industries in Zambia. Globally the international EITI standard is moving towards leveraging EITI compliance towards concrete actions on PFM improvements (specifically PEFA indicators) and formal links towards budget transparency initiatives such as open budge index. The World Bank’s TA program for Zambia EITI is in its post compliance phase and is emphasizing these “beyond EITI” goals. Another trust fund is providing technical assistance to support the efficiency of mineral revenue collection and investment in Zambia.

37
178. Partnership and Leverage: The Bank will continue to work closely with other CPs (including in the direct budget support group) to support strategic PSM and PFM reforms. For example, the Bank is partnering with DFID to provide technical assistance on IFMIS through an externally financed output (EFO) mechanism and has offered to provide the lead technical support for the next phase of PFM reforms. Discussions are in progress for a possible multi-donor trust fund for pooling the resources for PFM reforms that will build on lessons learned from PEMFA and successful practices elsewhere. The Bank will also seek to provide technical support to decentralization in collaboration with Germany provided certain policy agreements are forthcoming within the Government.
179. AAA. The Bank will use regular Economic Briefs, along with structured regular meetings with the Bank of Zambia for macroeconomic policy dialogue. In the area of strengthening public sector performance the current requests from the Government are for targeted expert knowledge and advice. The Bank will thus support a just-in-time advisory approach through brief policy and guidance notes, peer-to-peer learning (e.g. the regional Workshop on M&E) to present different reform options to the Government and then gradually expand engagement and set the foundation for more transformational reforms. The underlying Bank strategy would be to use a flexible, incremental approach in line with reform appetite. The Bank will focus on those PSM areas, where not only the demand for engagement is high, but also where there is likely to be a high economic or social impact on service-delivery which can over time build the foundation for more fundamental public sector reforms. The Bank is well-positioned to bring its knowledge to bear to also analyze the political economy of reforms and facilitate knowledge exchanges and access to international good practices. All Bank supported activities will seek to assist the Government in strengthening the results-orientation of public institutions, improving the effectiveness of service delivery, and enhancing accountability and transparency in the civil service. Knowledge products will initially be focused on areas for which the Government has requested immediate support: Civil service performance and pay policies, assets declarations and related -e-government initiatives; Government-wide performance, monitoring and evaluation system, improvement of statistics and labor surveys, project appraisal and analysis, policy paper writing using data from the Zambia Macroeconomic model (ZAMMOD).
180. Analytical activities will also be carried out to update the PEFA scores on an annual basis using them as the basis for monitoring some of the proposed reforms. The Bank team will also carry out a gap analysis to assess the variances between national and international accounting and auditing standards and practices in the public sector. Technical assistance is also expected to be provided for strengthening of Government’s capability for physical monitoring of mining production, assay and exports and effective licensing and cadaster administration systems.
181. Regular economic briefs prepared by the Zambia country team (para 152) will provide credible economic information and an assessment of recent economic developments and outlook in the short to medium term. In addition it will include an analysis on a specific development topic or theme which is expected to support evidence-based policy debate in the country, strengthen public demand for good policies and outcomes and inform government policies and programs.

38
Outcome 3.2 Summary table of interventions Ongoing Financing IDA: Demand-side engagement components incorporated in projects Trust fund: GPF; EITI Pipeline Financing Anti-Corruption trust fund Ongoing AAA EITI Initiative; Governance Improvement in the Road Sector; Support to Increased Accountability; Support to demand for good governance; Supporting CSOs’ participation in EITI Zambia; GPF Snapshots Partnerships and leverage WB and Cambridge University’s Centre for Governance and Human Rights; WB with media; WB and DfID on the possibility of a joint media fund; On Track pilot; Zambia EITI, and Zambian civil society, are supported by WB with technical assistance and grant funding via the EITI MDTF. ZEITI is additional supported by the EU/Norway/DFID-funded Mining Basket Fund and AfDB
OUTCOME 3.2: CITIZEN ACCESS TO INFORMATION INCREASED
182. Analytical underpinnings: The Bank’s support to demand for good governance (DFGG) is grounded in the recognition that institutional reforms will be most effective when supported by genuine demand from an informed citizenry. The Bank’s current non-state actor engagement is informed by a review entitled Stocktaking of DFGG Mechanisms in the Zambia Portfolio (2011) as well as by analytical work carried out under the GPF. A number of specific pilot activities have been undertaken in FY11-12. Evaluations of these initiatives have further helped refine the activities outlined herein. In line with the Government’s own priorities, the underlying objective of the Bank’s citizen-engagement is to strengthen public service-delivery. 183. Trust Funds and IDA resources: To mainstream a governance approach across the Zambia lending portfolio, Bank lending projects do increasingly incorporate demand-side engagement components as part of their attempt to mitigate risks. For example, the Road Rehabilitation and Maintenance Project Phase II makes awarded contract proactively available for review by local communities. Beyond the first year the emphasis will be on scaling and mainstreaming the most promising of the DFGG activities.
184. Through an EITI Trust Fund the World Bank will continue to support the capacity-building of non-state actors to engage in the EITI process.
185. The GPF will remain the main source of DFGG funding until it ends in January 2014. The categories of activity under the GPF are threefold: • Improving beneficiary feedback in Bank projects: The development and piloting of “On Track”, an
ICT-enabled feedback system that will enable beneficiaries to submit issues and request information whilst also allowing project teams to proactively survey beneficiaries on a regular basis is being supported. The platform builds upon lessons learned from the e-ISR plus initiative.
• Coalition-building and citizen-monitoring: To build the capacity of key issues-based coalitions to generate informed public discussion and citizen monitoring on important reform topics. The Bank has been engaging with the Zambia Extractives Watch coalition, the Procurement Watch Coalition and the Access to Information Coalition. Support is also being considered to implement a third party monitoring pilot in the roads sector.
• Building public interest media: To address structural impediments to a strong public interest media in Zambia and train journalists in investigative skills. A radio pilot utilizes a combination of SMS technologies and community radio to create a model, interactive radio program that improves information dissemination amongst rural constituents on key policy issues and provides communities with a direct mechanism to hold public service providers to account.
186. A possible new Anti-Corruption Fund is expected to provide resources for strengthening the efforts of state and non-state actors in Zambia to fight corruption and improve governance.

39
187. AAA. The GPF supports several pieces of analytical work and technical assistance activities including to the mining sector for EITI, to the Ministry of Information and Broadcasting on Access to Information, institutional assessment for RDA, political economy analyses and technical notes. Regular GPF Snapshots provide updates on GPF activities. 188. Partnerships and leverage: On the Accountability through Community radio pilot the Bank has partnered with Cambridge University’s Centre for Governance and Human Rights. With the Support to Investigative Journalism pilot the Bank has established strong partnerships with The Mail & Guardian in South Africa and The Bureau for Investigative Journalism in UK. The Bank is currently exploring the possibility of a joint media fund with other CPs. The On Track pilot is the result of an internal Bank collaboration between WBI, AFTOS and PREM. Support to Procurement Watch is also the result of a partnership with WBI.
D. Implementing and Monitoring the CPS
189. The WBG will provide support for the implementation of the CPS through a lean, high-capacity team core team while drawing on global expertise on specific areas (for example, PPP, pension reform, debt management) as needed. Technical expertise will be maintained in the country office in sectors such as agriculture and energy and in cross- sector areas such as fiduciary compliance. The World Bank, IFC and MIGA management will ensure better information sharing between the three organizations to increase collaboration for better results. The Bank’s current reform agenda, including improving existing products, increasing results-based financing, increasing the use of Bank guarantees, and simplifying Bank procurement procedures, provides a good opportunity to adapt Bank policies to support MICs generally and implementation of a flexible CPS in Zambia. 190. The Bank will strive for increased use of Zambia’s financial management systems for investment operations, in line with the Accra Agenda for Action and consistent with World Bank financial management policy. Zambia has already made a start in the use of country systems, and the Irrigation Development and Support Project and the Livestock Development and Animal Health Project are using country systems. The Bank carried out a study (January, 2012) to assess fiduciary risks in using country FM systems. The assessment shows that overall there is scope for increased use of Zambia’s PFM system for Bank-financed investment projects provided appropriate mitigation measures are implemented for various aspects of the financial management system. Based on implementation experience with the two projects, the plan is to expand the use of country FM systems to other projects also using a cautious approach. 191. The CPS Results framework presents the results chain for the WBGs’ program of support (Annex 1). It uses Zambia’s SNDP as its starting point, and narrows down the range of outcomes to those that the Bank can demonstrably influence over the CPS period. Where possible, interventions will support impact assessments before scale up or mainstreaming into Government programs. For example, the health operation is supporting an innovative results-based financing program that finances agreed priority health results rather than inputs. Impact evaluations of close to completion projects, for example ADSP in collaboration with PREM DIME team are also being undertaken and are also planned for newly implementing projects (irrigation and livestock projects) by mid-term. As new projects and programs are prepared task teams will be encouraged to adopt design options that link financing to results. This will be done through use of performance-linked incremental financing and output based aid. It will also be explored to what extent the recently designed PforR instrument can be used in new operations. 192. The Bank will work with the Government to monitor portfolio performance and is taking several steps to improve portfolio quality. Regular meetings will be held with World Bank project

40
coordinators with the participation of MOF where portfolio wide issues will be identified and discussed. As needed, focused technical assistance will be provided to deal with capacity constraints, including for PFM and PSM. The Bank is also working with relevant Government officials to resolve some of the root causes of past poor disbursements—capacity constraints in ZPPA—through providing the agency with training, support with creating service standards, preparing standard bidding documents and simplification of clearance procedures. Internal World Bank constraints that could be inhibiting disbursements are also being examined. A governance team, located in the Zambia country office, that meets periodically to assess governance and anti-corruption initiatives will advise the Country Director and the CMU on project specific governance issues.
193. The World Bank has taken measures to integrate trust fund programs and Bank-funded programs and to ensure that trust funds are aligned with the CPS. Analytical work activities supported through trust funds undergo an equally rigorous quality assurance process and trust fund financed activities are implemented in accordance with the same fiduciary requirements as IDA financed operations. 194. The WBG will prepare a CPS progress report in 2014 that will assess progress towards outcomes and adjust the strategy as needed. V. RISKS AND MITIGATION 195. The risks involved in achieving the results targeted by the CPS during its implementation period are categorized into political, institutional and external risks.
A. Political Risks
196. Having seen four peaceful transitions Zambia has a stable political system. The risk of a big, disruptive political change is low. The CPS is co-terminus with the time span of the new PF Government. Therefore, no major changes in political leadership are foreseen. The country is working on a new constitution and the transition to it will likely be smooth and peaceful, providing enough space for the Bank to adjust its business plan to changes, if needed. 197. Risk of major change in development priorities is low. The new PF Government has largely adopted the Vision 2030 and the SNDP. The remaining SNDP period is also co-terminus with the CPS life. Therefore it is unlikely that the development strategy that underpins the CPS will see a major shift during the CPS. It is however, still unclear how the Government will address issues in several critical areas such as subsidies in the agriculture sector, and reforms in the energy and road sectors. The Bank will continue to work with Government and other CPs to generate momentum for reform of these policies. In the energy sector it will continue to support reforms as a part of its, lending, analytical work and policy dialogue. Where possible, it will bring lessons of experience from other developing countries to inform the dialogue in the country on these issues. The Bank will also focus on activities that are not influenced by radically changing policies and on institutional reforms and capacity building in areas where a wide government ownership exists. As described earlier these areas relate to PFM, procurement reform, building M&E capacity, capacity of statistical systems, and for project appraisal. 198. Risk from frequent administrative changes is high. In the last year there have been frequent changes in senior management positions, including at the ministerial level that have affected the functioning of the Government machinery. Ministries and districts have also been re-aligned frequently. These changes have been disruptive to the smooth implementation of programs. To mitigate the risk, the Bank will strengthen its engagement with a wider set of stakeholders within the Government on the

41
programs it pursues so that departure of individuals does not derail the program. Overall pace of movement on Bank-supported programs is likely to remain a function of administrative stability. B. Institutional Risks
199. The Government’s need to tackle fundamental reforms in public governance. Governance remains weak where institutions charged with oversight have not been very effective and public administration systems and controls are challenged. Procurement capacity also remains weak. Successive governments have been implementing reforms addressing the efficiency and accountability of the public sector, and tackling corruption, but with limited success. There are now new opportunities to work with the new Government as it has placed improving governance institutions and anti-corruption at the core of its programs. The MOF for example, realizes the need to strengthen debt management capacity (as evident in the recently released MOF Strategy for the next five years) and initiated the request for a follow-up to the DEMPA mission. 200. The Bank will continue working with Government on improving PFM and building institutions under the PSM program. The Bank is working in the roads sector, at Government’s request, to assist in the development and implementation of an integrity plan to address governance weaknesses identified by various reviews and assessments. Government had engaged an independent fiduciary review agent for one year who addressed fiduciary concerns and built capacity in the health sector. A multi-sectoral governance team works with task teams in addressing governance challenges at project level. 201. The World Bank has started, as a pilot, activities to improve accountability of the Government vis-à-vis citizens by supporting demand for good governance. These activities are aimed at enhancing the capability of citizens to hold the state and service providers accountable and make them responsive to the needs of the citizenry. Such activities could help improve the efficiency of government interventions, for example by better targeting, and improve effectiveness of institutions through feedback mechanisms and monitoring. These improvements would ultimately lead to better development outcomes.
202. The fiduciary risk of the portfolio is substantial. After the governance issues in the health and road sectors came to light, the Bank carried out an in-depth financial management review of all projects in the portfolio. Ineligible expenses were identified in many projects and the Government is in the process of repaying the agreed amounts. The generic issues for occurrence of ineligible expenses as highlighted in these in-depth reviews relate to: weak control environment, differing treatment of allowances, weak internal audit, lack of understanding of Bank’s FM, procurement and disbursement procedures, poor contract management, submission of duplicate claims, unretired advances, insufficient controls over the usage of government property and serious lack of follow up on audit findings. While there have been improvements in some of these areas, efforts are being taken by the Bank and the government project teams to discuss and agree on corrective steps through fiduciary clinics and discussions during implementation support missions. The generic issues are also being brought to the attention of MoF and the Internal Audit Unit for regular monitoring/compliance. The progress is slow and some of the capacity building interventions take time to translate to positive outcomes. A two pronged approach is being used– interventions through multi-donor PFM program at the country level and targeted interventions through individual projects at the sector level. The Bank will also organize periodic portfolio review meetings focusing on fiduciary and implementation aspects to address the issues in a timely fashion. Country systems use is being done only cautiously and on a pilot basis. The Bank is also improving the internal work flow and monitoring mechanisms to ensure that delays do not occur within the Bank system in providing clearances and responding to letters from the government.

42
203. Procurement risks. While reforms have picked up and procurement has been decentralized it still remains to be seen how far this will improve implementation. Actions on procurement will also be monitored in the new PEFA indicators as part of decentralization of procurement. The Bank will continue to provide procurement training for private sector consultants and suppliers and contractors and public sector officials.
204. Implementation Capacity. The Government has had challenges in policy implementation, specifically policies linked to public sector reform, the civil service compensation structure, and budget execution in public finance management. This risk will be mitigated to a large extent by the activities of ongoing lending and TA programs. The Bank and other CPs are also supporting Government capacity building in PSM and public expenditure management, and in the reform of financial accountability protocols. Several CPs are also supporting implementation of reform programs involving oversight institutions such as the Office of the Auditor General and the Parliament.
C. External Shocks
205. The lasting effects of the global financial crisis and the economy’s continued reliance on a single primary-commodity export could threaten Zambia’s growth rate if copper prices were to fall significantly. It is not clear that there will be consensus on how to respond to such a circumstance and, more importantly, that the political resolve by the Government to tackle difficult issues involved will be present. However, the adequate size of the country’s international reserves combined with continued flexible exchange rate policy should allow absorption of the economic shock that such an event would trigger. Besides sound macroeconomic policies, both strong debt management and project appraisal capacity are needed to maintain debt sustainability in the face of increasing dependence on non-concessional borrowing. The Bank and other CPs are also helping the Government to diversify the national economy through support for agriculture, private sector development and policy dialogue on structural reforms. This effort has thus far been successful, as evidenced by an increase in Zambia’s exports of non-mineral products. EndNote 1. For example, the Anti-Corruption Act No 3 of 2012, Public Finance Act 2004, Public Procurement Act 2008. 2. Poverty gap ratio is a measure of how far average incomes fall below the poverty line. 3. The Human Opportunity Index measures in a single indicator the coverage rate of a particular service, adjusted by how equitably the service is distributed among groups differentiated by circumstance (World Bank 2012l).
4. An Early Grade Reading Assessment (EGRA) in Zambia for example, found that 91 percent of students at the end of second grade could be classified as non-readers. 5. Rate of growth of the population is high compared to the Sub-Saharan growth rate of 2.5 percent and that of lower middle income countries of 1.5 percent. 6. The recent World Development Report (WDR) on Jobs notes how many countries with high youth unemployment have education and training systems that are not developing the kinds of skills needed by the private sector. 7. In current GDP this number is potentially higher, about 20 percent. But due to higher deflator for agriculture the contribution reduces to 14 percent in real GDP terms. 8. The increased production in recent years is because of good weather conditions rather than a structural increase in agricultural productivity. 9. All five transit routes have unit road transport costs that are below the regional average (World Bank 2009b). 10. There has been some diversification, however, with increasing investments in agriculture (directed mainly at the production of fruit, flowers, horticultural products, cotton, maize, tobacco, and sugar), construction, telecommunications, tourism and other services.
11. World Bank/IMF, Joint Fund-Bank Debt Sustainability Analysis, 2012

43
12. The baseline scenario for the April 2012 DSA assumed new public external borrowing of US$3.5 billion during 2012-2017 of which US$ 1.7 billion was assumed to be on non-concessional terms. Accordingly, the recently issued international bond is not seen as having a material effect on debt dynamics. However, the country will need to manage debt carefully. 13. Hogan and others 2010; Lozano and others 2011; Rajaratnam and others 2010. 14. World Bank 2009. Zambia Health Sector Public Expenditure Review: Accounting for Resources to Improve Effective Service Coverage. Washington, DC: The World Bank. 15. World Bank 2010. World Bank Policy Note: Enhancing Public Supply Chain Management in Zambia. Washington, DC: The World Bank. 16. Ministry of Health 2011. National Human Resources for Health Strategic Plan 2011-2015. Lusaka, Ministry of Health 17. World Bank 2012. Economics of Poor Sanitation in Zambia, Water and Sanitation Program. www.wsp.org 18. The recent Annual Work Plans of the Road Development Agency (RDA) shows that there is a very strong focus on rehabilitation and upgrading roads to paved standard and that significant parts of the unpaved road network are not maintained at all. The OPRC-contracting methodology is ideally suited to improve the quality of this part of the road network with the RDA already having decided to roll it out over the entire unpaved road network. Successful roll-out would reduce business costs significantly. 19. 40 percent of the country has not been geologically surveyed. 20. COMESA and SADC are regional economic groupings with a mission to achieve sustainable development through increased cooperation and regional integration. 21.World Governance Indicators monitor six areas namely: (i) Voice and Accountability; (ii) Political Stability; (iii) Government Effectiveness; (iv) Regulatory Quality; (v) Rule of Law; and (vi) Control of Corruption.
22. The EITI is the global standard that ensures transparency of the revenues from a country’s extractive sector. Zambia becomes the 15th EITI compliant country and the first in the East, Central and Southern African region. EITI compliance means that the country has an effective process for annual disclosure and reconciliation of all revenues from its extractive sector, allowing citizens to see how much their country receives from oil, gas and mining companies.
23. The Poverty Reduction Budget Support Group comprises the European Union, UK (DIFD), Germany, Norway, Finland, the World Bank, and the AfDB.
24. The facility was to recondition used parts and components from heavy-duty earth-moving machinery, primarily in the mining sector, to provide a more cost-effective maintenance solution to serve clients within Zambia as well as in adjacent countries.
25 A gender portfolio review was undertaken in preparing the CPS and its findings will inform country policy and dialogue on gender in the coming years. The current portfolio is above the IDA16 target of 60 percent on mainstreaming gender as all active projects are gender informed on at least one of the following dimensions: (1) analysis; (2) actions; (3) M&E (see Annex 16 for details). The WBG will further deepen attention to gender to go beyond the simple fulfillment of the IDA16 target through: increasing attention to gender in M&E frameworks; increasing the integration of gender into current AAA work; increasing the proportion of operations that use existing gender diagnostics and analytical work to inform their design
26. The extensive wide ranging dialogue between Mongolian and their Chilean counterparts facilitated by a strong IMF and World Bank partnership significantly helped Mongolian policy makers understand the challenges posed by Mongolia’s mineral wealth, learn from Chile’s success and move decisively to take appropriate reforms (World Bank 2012j).
27. Projects must cover at least 3 countries, and demonstrate benefits to more than one country. 28. GPOBA is a World Bank-administered global program with funding from DFID, DGIS, IFC, AUSAID, and SIDA. 29. The African Union (AU) and the New Partnership for Africa’s Development (NEPAD) launched CAADP in 2003 at the Maputo African Heads of State summit. The CAADP emphasizes the role of agriculture in reducing poverty and food insecurity in Africa and aims to accelerate agricultural development in African countries to a minimum annual sector growth of 6 percent with allocations of at least 10 percent of the national budget to the agriculture sector. 30. GAFSP is a multilateral mechanism to address the underfunding of country and regional agriculture and food security strategic investment plans. Nine donors, including the US and the Gates Foundation have pledged US$1.2 billion equivalent to GAFSP and as of August end 2012 US$ 855 million equivalent had been received. Several countries in Africa and Asia are already benefiting from these resources.
31. See Bank of Zambia 2012. 32. In June 2004, the Government approved a five year Financial Sector Development Plan (FSDP) for Zambia covering the period 2004 – 2009. A further three-year extension of the FSDP into phase II was approved by the Government in January 2010. 33. ICRs for these projects are yet to be prepared.

44
References African Development Bank (AfDB). 2006. Republic of Zambia Multi-Sector Country Gender Profile. African Development Bank, Tunis. A. de Kemp, J. Faust, and s. Leiderer.2011. Between high expectations and reality: An evaluation of budge support in Zambia.
Alive 2012. The Livestock Sector in Zambia for economic growth and poverty reduction An analysis. University of Zambia, Alive, CIRAD, IAPRI and the World Bank
AMCOW 2012. Country Status Overviews Regional Synthesis Report, Pathways to Progress, Transitioning to Country-led Service delivery Pathways to Meet Africa’s Water Supply and Sanitation Targets, 2012.
Bank of Zambia. 2012. Report of the Strategic Forum on the Role of Finance for Unleashing the Potential of Local Zambian Businesses.
Brenthurst Foundation 2010. Mobilizing Zambia A Strategy on Accelerating Economic Growth
CSO 2011. Living Conditions Monitoring Survey Report 2006 and 2010.
Development Cooperation Report 2010. Ministry of Finance and National Planning Republic of Zambia
EIU 2012. Zambia Country Report
GEG 2011. Buying better Governance. The Political Economy of Budget Reforms in Aid-Dependent Countries. Global Economics Governance programme. University College Oxford
Hogan MC, Foreman KJ, Naghavi M, et al. 2010. Maternal Mortality for 181 countries,. 1980–2008: A systematic analysis of progress towards Millennium Development Goal 5. 2010; 375: 1609–23
Human Development Report 2011. Zambia. Service Delivery for Sustainable Human Development
IEG 2011. Growth and productivity in Agriculture and Agribusiness.
IFPRI 2012. Strategies and Priorities for African Agriculture Economy-wide Perspectives from Country Studies. Edited by Xinshen Dia, James Thurlow, Samuel Benin and Shenggen Fan
IMF 2012. IMF Executive Board Concludes 2012 Article IV Consultation with Zambia IMF Public Information Notice (PIN) No. 12/82, July 19, 2012
JAZII 2011. Joint Assistance Strategy for Zambia II. 2011-2015.
Kaufman D. A Kray and M Mastruzzi 2010. The World Wide Governance Indicators Methodology and
Lozano R, Wang H, Foreman KJ, and others 2011. Progress towards Millennium Development Goals 4 and 5 on Maternal and Child Mortality: An updated systematic analysis. 2011; 378: 1139–65
Mattoo A and L. Payton, ed. 2007. Services trade and Development: The Experience of Zambia. Palgrave McMilland and World Bank: Washington D.C
Ministry of Agriculture and Cooperatives. 2011. Annual Report
Ministry of Finance 2012. Annual Economic Report 2011
45
MSU 2011. Food Security Research Project: Technical Compendium: Descriptive Agricultural Statistics and Analysis for Zambia in support of the USAID mission’s Feed the Future Strategic Review
PPCR 2011. Strategic Program for Climate Resilience.
Rajaratnam JK, Marcus JR, Flaxman AD, and others 2010. Neonatal, postneonatal, childhood, and under-5 mortality for 187 countries, 1970–2010: a systematic analysis of progress towards Millennium Development Goal 4.
Republic of Zambia 2006. Vision 2030
Road Development Agency 2012. Road Condition Report, (Trunk, Main, District, Urban and Primary Feeder Roads)
MCA 2011.An Analysis of Constraints to Inclusive Growth in Zambia. Report prepared by the Millennium Challenge Account–Zambia (MCA-Zambia).
NRCF 2007. The Real Economic Impact of Nature Tourism in Zambia. Royal Danish Embassy, the Royal Norwegian Embassy, the United Nation Development Program and the World Bank. Natural Resources Consultative Forum.
NRCF 2008. The Impact of Wildlife Management Policies on Communities and Conservation in Game Management Areas in Zambia. Natural Resource Consultative Forum.
UNICEF 2012. Committing to Child Survival: A Promise Renewed
UNDP2011. Human Development Report 2011 Sustainability and Equity: A Better Future for All
UNDP2011a. Millennium Development Goals Progress Report 2011.
World Bank 2013. Doing Business 2013 Smarter Regulations for Small and Medium Sized Enterprises.
World Bank 2013a. ZAMBIA -- The Problem of Rural Employment Policy Note draft
World Bank 2013b. Public Debt Management Reform Plan Zambia January 2013
World Bank 2012.CPIA Africa. Assessing Africa’s Policies and Institutions. Office of the Chief Economist for the Africa Region
World Bank 2012a. Zambia Poverty Assessment.
World Bank 2012b. Africa can help feed Africa Removing Barriers to regional Trade in Food staples. Poverty Reduction and Economic Management. Africa region.
World Bank Group 2012c. Light Manufacturing in Africa: Targeted Policies to Enhance Private Investment and Create Jobs. Zambia Country Report draft.
World Bank 2012d. Zambia Economic Brief. Recent Economic Developments and the State of Basic Human Opportunities for Children.
World Bank 2012e. Avoiding Tokenism in Demand for Good Governance (DFGG) Activities Lessons from World Bank-financed Lending Projects in Zambia.
World Bank 2012f. Zambia Gender Portfolio Review.

46
World Bank 2012g. Africa’s Pulse. An analysis of issues shaping Africa’s economic future. October Volume 6
World Bank 2012h. Why Does Cargo Spend Weeks in Sub-Saharan African Ports? Lessons from Six Countries
World Bank 2012i. Health Equity and Financial Protection Report Zambia
World Bank 2012j. South-South Cooperation: How Mongolia learned from Chile on Managing a Mineral-Rich Economy. September
World Bank 2012k. Economics of poor sanitation in Zambia, Water and Sanitation Program. www.wsp.org
World Bank 2012l. Zambia’s Infrastructure Linkages to Production and Trade. Powerpoint
World Bank 2012m. ZAMBIA: Using Productive Transfers to Accelerate Poverty Reduction
World Bank 2012n. The World Bank 2012-2022 Social Protection and Labor Strategy
World Bank 2011. Zambia More Jobs and Prosperity in Zambia what would it take? Based on the Jobs and Prosperity: Building Zambia’s Competitiveness Program
World Bank 2011a. Zambia’s Infrastructure: A Continental Perspective. Policy Research Working Paper 5599.
World Bank 2011b. Bridging the Atlantic Brazil and Africa South-South Partnership for Growth. World Bank and the Brazilian Institute for Applied Economic Research
World Bank 2011c. Rising global interest in farmland
World Bank 2011d. The State of World Bank Knowledge Services. Knowledge for Development
World Bank 2011e. Political Economy Studies: Are They Actionable? Some Lessons from Zambia. Policy Research Working Paper.
World Bank 2011f. What would it Take for Zambia’s Copper Mining Industry to achieve its Potential?
World Bank 2011g. Reproductive Health at a Glance. Zambia.
World Bank 2011h. Zambia Country Health Status Report 2010.
World Bank 2011i. Zambia Water Public Expenditure Review
World Bank 2010a. Africa’s Infrastructure A Time for Transformation. A copublication of the Agence Française de Développement and the World Bank
World Bank 2010b. World Development Indicators. Washington DC
World Bank 2009. Zambia Managing Water for Sustainable Growth and Poverty Reduction. A Country Water Resource Assistance Strategy
World Bank 2009a. Zambia Commercial Value Chains in Zambian Agriculture: Do Smallholders Benefit? Report No. 48774-ZM

47
World Bank 2009b. Inclusive Growth Analytics Framework and Application. Policy Research Working Paper 4851. Economic Policy and Debt Department.
World Bank 2008. Zambia What Are the Constraints to Inclusive Growth in Zambia? A Policy Note. Report No. 44286-ZM
World Bank 2008a. The Economic Empowerment of Young People in Zambia.
World Bank 2008b. The World Bank Group’s Role in Africa’s Middle-Income Countries A Plan of Action
World Bank 2008b. From Agriculture to Nutrition: pathways, Synergies and Outcomes. Agriculture and Rural Development Notes Issue 40.
World Bank 2004. An Assessment of the Investment Climate. Report No. 29741-ZM
Zambia Business Survey. 2010. The profile and productivity of Zambian businesses. Zambia Business Forum; Private Sector Development Reform Programme; FinMark Trust and World Bank Zambia Country Office

48
Annex 1: Zambia CPS Results Matrix
Country Development Objectives and Results
Issues and Obstacles CPS Outcomes Milestones Bank Group Program (and Partners)
Strategic Objective 1: REDUCING POVERTY AND THE VULNERABILITY OF THE POOR In order to reduce the high poverty levels in the rural areas focus will be on stimulating agriculture productivity and promotion of agro-businesses Indicator: Baseline Rural Poverty: 77.9(LCMS 2010) Target Rural Poverty:<50% (2015) During the SNDP period, overall crop production increase is expected to come from expansion of areas under cultivation and irrigation as well as increased productivity through the use of improved seed varieties and linkages between research and extension services. Indicator: Agriculture Exports as a percentage of non-traditional exports 2011: 44% Target: 55% (2015) The main thrust of the livestock sub–sector will be to increase livestock production through prevention and control of livestock diseases, improving production and productivity of the various livestock species and promotion of the Public Private
Zambia’s land and water resources could be used more effectively to promote the development of the agriculture sector whose role in the economy has stayed well below potential. Productivity is low because of inadequate use of fertilizers, weak research and extension systems, lack of irrigation and access to markets particularly for small-scale operators in remote areas, poor rural roads and limited or expensive finance. There is limited investment in these priority areas for the development of the sector.
The livestock sub-sector that accounts for about 35% of agriculture GDP suffers from inadequate disease control and other problems
Indicator 1.1.1: Yields increase (tons /ha) for major irrigated crops in target sites Baseline (2010): Tomatoes: 10 Onions: 12 Wheat: na Bananas na Target (2016): Tomatoes 31 Onions: 32 Wheat: 29 Banana:31 Indicator 1.1.2: Increase in livestock productivity in project areas Baseline: (2012) hen mortality %: 40 kid (young goat) mortality %:33 weaned piglets per sow per year %: 12 milk per cow per day liters: 6 Target (2015) Reduced hen mortality %: 33 Reduced kid (young goat) mortality %:30 Increased weaned piglets per sow per year %: 14 Increase milk per cow per day liters: 7
Milestones for indicator 1.1. 1: • Area covered by feasibility
studies • Area provided with new
irrigation • New technologies
demonstrated Milestones for indicator 1.1. 2: • Vaccination coverage in
project risk areas against diseases
• Small holder livestock owners (male and female) satisfied by the quality of veterinary services supported by the project
• Smallholder livestock owners adopt at least one project recommended improved animal husbandry practice in project area
On-going Financing IDA: Agricultural Development Support Program (P070063) Livestock Development and Animal Health Project (P122123) Irrigation Development and Support Project (P102459) IFC: Investments in Zambeef. ZANACO, investments on farm-blocks Trust Funds: CAAPD Child trust fund strategic planning and implementation of agricultural investments at the national and regional levels (TF097527) Regional trust fund on gender equality (TF011505) Global fund on knowledge and learning (TF095612) National trust fund on Linking women and the private sector (TF01317) Livestock Data Collection and Analysis in Zambia (TF096485) Pipeline Financing Regional IDA project: Agriculture Productivity Program for Southern Africa APPSA) (P094183) IFC: Additional Support to ZANACO MIGA: Investment by Liongate Venture Fund I SPC of the Cayman Islands in Yalelo Limited in Zambia; An expansion project by Chayton Atlas Investments (CAI) of Mauritius in Chobe Agrivision Company Ltd. in Zambia.
Outcome 1.1 Improved crop and animal productivity in selected areas

49
Country Development Objectives and Results
Issues and Obstacles CPS Outcomes Milestones Bank Group Program (and Partners)
Partnerships in value addition and processing of livestock products as well as in the provision of effective service delivery and marketing of livestock products. Indicator: Decrease in Incidence of major livestock disease outbreaks, FMD,CBPP, ECF 2011: 2% Target: 1% (2015)
On-going AAA (Knowledge products) Linking Women and the Private Sector (P132953) Cashew Value Chain Proposed AAA Farm blocks Agriculture and Rural Employment Land Policy DTIS Next Step notes FISP, FRA etc. Partnership and Leverage South-south learning events, APPSA project will support the development of collaborative partnerships between weak and strong systems in the region Collaboration with Indaba Agriculture Policy Research Institute Other cooperating partner USAID, EU, Finland, AfDB, JICA, IFAD
During the SNDP the focus will also be to effectively coordinate and provide social protection through empowering low capacity households, providing social assistance to incapacitated households and supporting various vulnerable groups. Indicator: percentage of social cash transfer beneficiary households who are judged as severely food insecure 2011:50% Target:20% (2015) Irrigation development will lead to less reliance on rain-fed agriculture Indicator: Hectares of land irrigated Baseline: 173,000 (2011) Target: 187,500 (2015)
The poor are vulnerable to climatic and financial shocks, food insecurity during the lean periods and high food prices.
Agriculture production is mostly carried out under rainfed conditions and therefore exposed to climatic variability. Zambia’s climate is highly variable, with frequent
Indicator1.2.1: Area provided with new irrigation and drainage facilities (ha) Baseline (2012): 0 Target (2016): 10000
Milestones for Indicator 1.2.1: 2013: National Irrigation Plan (NIP) and National irrigation Strategy : Consultant hired 2016: 2004 NIP reviewed and Updated Number of water users provided with irrigation and drainage services Baseline: 2011: 0 Target: 2015: 8,000 2018: 14,000
On-going Financing IDA: Irrigation Development and Support Project (P102459) Zambia Malaria Booster Project (P096131) Trust Funds: GEF Extension of the Kasanka Management System to Lavushi Manda National Park (TF097552) Sustainable Management of Nyika Transfrontier Conservation Project (TF099858) Zambezi river basin support program (CIWA trust fund) (TF011577) The Russian Trust Fund Capacity Building for Public Expenditures Health Results Innovation Trust Fund
Outcome: 1.2. Improved access to resources for strengthening household resilience and health in targeted areas

50
Country Development Objectives and Results
Issues and Obstacles CPS Outcomes Milestones Bank Group Program (and Partners)
During the SNPD period, the main aim is to reduce the socio-economic impact of disasters by enhancing and building strong disaster risk management mechanisms at community, district and national level as well as building infrastructure that can withstand natural disasters. This will be achieved through enhanced planning, response, reconstruction, rehabilitation and disaster mitigation. Efforts to achieve this include the integration of disaster risk management into sustainable development planning and programming at all levels. Indicator: Vulnerability Assessment and Mitigation Plans completed Annual targets Yr Target 2011 9 2012 18 2013 27 2014 18 2015 0 During the SNDP, in addition to improving agriculture productivity, improving the provision of basic services such as water and sanitation, health, education and skills development is also emphasized. The Government recognizes health as one of the priority sectors. During the SNDP the focus will be on promoting preventive, curative and rehabilitative health services. Indicator: Under-5 Mortality Rate (per
and prolonged droughts, seasonal and flash floods, extreme temperatures and dry spells during the wet season. These trends are expected to intensify in the future. In the absence of adaptation, rainfall variability alone could keep an additional 300,000 people below the poverty line over the next decade, and affect annual GDP growth by 0.9 percent.
Maternal and child mortality continue to be at unacceptably high levels despite the progress Zambia made in 2007.
Zambia is unlikely to meet MDGs 4 and 5.High prevalence of malnutrition, malaria and HIV/AIDS also contributes to the high maternal and child mortality.
Indicator 1.2.2: Direct Project Beneficiaries from small water resources infrastructure developments Baseline (2013):0 Target: (2016): 80,000 beneficiaries Indicator: 1.2.3: Increase the percentage of children under five years of age who slept under an insecticide treated net last night (Reduced incidence of morbidity and mortality due to malaria in children under-5) . Baseline (2010): 50% Target (2013): 55% Indicator: 1.2.4: To increase the percentage of women delivering in facilities by a skilled birth attendant in RBF eligible districts (Improved maternal and child health outcomes in Results-based financing (RBF) intervention districts) Baseline (2010): 31 Target (2013): 36
Milestones for Indicator 1.2.2: 2013: Approval of dam/other infrastructure designs and user committees established 2014: construction works in progress 2015: 20,000 beneficiaries 2016: 80,000 beneficiaries Milestones for Indicators 1.2.3. and 1.2.4: • Analytics on ICTs for
Health conducted and report produced (2013)
• Implementation Plan for the Scaling-up Nutrition (SUN): 1000 days strategy developed and costed
• Capacity Building in Nutrition provided (targets to be decided during preparation of TA)
• Analytics (in 3-5 priority areas) for the Health Care Financing
• Strategy developed • Analytics on HIV
conducted and report produced
Pipeline Financing Water Resource Development (P114949) Health and Nutrition project under discussion Pipeline Trust funds Strengthening Climate Resilience (PPCR Phase II, administered by IBRD) Pilot Program for Climate Resilience Phase II (administered by IFC) COMACO Landscape Management Project Support to work on MDG 4 and 5 On-going AAA Safety Net Review ICT for Health Initiatives (2013) Zambia Health Financing (2013-2015) (P129661) Results-Based Financing Impact Evaluation (2014) Nutrition Institution capacity building (2013) Analytics on HIV (2013) Proposed AAA Rural-urban linkages Peri-urban sanitation improvement (P132003); reform of public service pension system, analytical work on education and health Partnership and Leverage The World Bank will be working closely with IFC and the AfDB in strengthening community resilience to shocks and improving their asset and resource base in critical sub-basins of the Zambezi. The World Bank and IFC will support a
PPP for the delivery of health services. The World Bank and USAID are also collaborating to improve results in the health sector by identifying and removing

51
Country Development Objectives and Results
Issues and Obstacles CPS Outcomes Milestones Bank Group Program (and Partners)
1000 live births): Baseline (2007): 119 Target (2013) 77 Target (2015) 63 Maternal mortality ratio per 100,000 live births Baseline (2007): 591 Target (2013): 267 Target (2015): 159
Zambia not only needs to invest more money into health (Abuja target of 15% still to be achieved), but also needs to examine whether current investments are efficient and cost- effective. Without updated financial and performance data, and a comprehensive health financing strategy, Zambia faces a huge challenge in optimally mobilizing and allocating resources.
bottlenecks to increased collaboration at the country level. Other cooperating partner AfDB, Nordic Development Fund, UN, GEF, World Fish, Red Cross, Concern etc. Sweden, USAID, UK, European Union, WHO, UNICEF and other UN Organizations
Strategic Objective 2: IMPROVING COMPETITIVENESS AND INFRASTRUCTURE FOR GROWTH AND EMPLOYMENT The policy of the Government is to accelerate private sector investment to achieve increased and diversified growth. The Government will continue to reform the business environment in Zambia to improve its competitiveness and to attract and sustain private investment. Government is also encouraging public private partnerships. Within the overall strategy and policy thrust of Government to accelerate private sector-led diversification and industrialization, Government has emphasized it will facilitate value-addition by putting in place industrial infrastructure to help SMEs to
Considerable progress has been achieved but weaknesses in investment climate persist as shown by Doing Business 2013 Limited key players to leverage agricultural value chain
Indicator 2.1.1: Number of achieved reforms per year on ease of Doing Business e.g. priorities include trading across borders and construction permit Baseline (2011): 3 Target (2016): 4+ Indicator 2.1.2 Number of days to provide business registration Baseline (2012) 3 days Target 2014: 1 day
Milestones for Indicator 2.1.1: 2014: 3 2015: 4 2016: 4+ Milestones for Indicator 2.1.2 • Stakeholder agencies
(NRA, NAPSA and PACRA) for one stop shop in Lusaka connected
• One stop shop becomes operational
On-going Financing IFC: Investment Climate Program phase II Trust Funds: IFC’s Zambia Investment Climate Program Proposed Financing IDA: The support for institutional reforms and capacity development from the likely budget support credits will contribute towards improving the enabling environment for private sector development. On-going AAA Updating the regulation and supervision framework for micro insurance (P127312). Bi-annual economic brief series to provide good and credible economic information on the country and build a Bank “brand.” (P132380) Proposed AAA: Analytical work on Job Skills Partnership and Leverage AUSAID and WBG, and possibly the EU,
Outcome 2.1: Improving key aspects of the regulatory environment for business

52
Country Development Objectives and Results
Issues and Obstacles CPS Outcomes Milestones Bank Group Program (and Partners)
manufacture locally in a way that can substitute for manufactured inputs or be exported. Local content for mining operations, in Zambia and in the region, offers promise in this regard.
will collaborate on capacity building and skill-building support in priority technical areas, e.g. mining cadaster improvements, geo-data mapping and physical audits monitoring, and integrated planning for mining and infrastructure. AUSAID study tours and scholarships for Government officials to countries where capacity in these areas is advanced. World Bank and IFC are facilitating ZMLCI, a collaborative public-private initiative. World Bank also working with ACET in Ghana; IFC and the World Bank are also coordinating their support to the Government for PPPs in key areas such as capacity building through implementation of actual PPP transactions Main Development partners AUSAID, EU, DFID
To enhance economic development of the prioritized economic sectors through provision of improved quality infrastructure The SNDP emphasizes road and railway transport maintenance and rehabilitation, including improving access for rural communities. It also puts emphasis on increasing access to electricity. The Government recognizes the energy sector as a key driver of growth and increasing irrigation infrastructure. Percentage of households with access to electricity (Zambia/Rural/) Baseline: 22/ 3 (2012) Target: 26/4 (2015) Indicator: Percentage of rural households within 2 Km of all season passable road Baseline: not available in SNDP Target: 80 (2015)
Critical infrastructure investment gaps and inadequate supply of electricity, water supply and sanitation, and high transport costs constrain growth Limited access to electricity particularly in rural areas In the urban areas lack of reliability of supply of electricity is a big issue Zambia could also better exploit its strategic position within the Zambezi River Basin and improve energy production and irrigation to contribute to
Indicator 2.2.1: Metered electricity customers in the project target areas (number) Baseline (2012):400,000 (number) Target (2016): 480,000 (number)
Milestones for indicator 2.2.1: Intermediate results: • Sub-transmission lines
constructed under the project (km)
• Sub-transmission lines rehabilitated under the project (km)
• Substations constructed under the project (number)
• substations upgraded under the project (number)
On-going Financing IDA: Road Rehabilitation Maintenance Project (P071985) Road Rehabilitation Maintenance Program Phase II (P105696) Increased Access to Electricity Services Project (P077452) Water Sector Performance Improvement Project (P110458) Regional IDA projects: Kafue-Muzuma-Victoria Falls Regional Transmission Line Reinforcement Project (P124351) Southern Africa Power Market Project (P069258) Trust Fund GEF Increased Access to Electricity Zambezi River Basin Support Program (CIWA trust fund)
Outcome 2.2 Selected Infrastructure built and rehabilitated

53
Country Development Objectives and Results
Issues and Obstacles CPS Outcomes Milestones Bank Group Program (and Partners)
Trunk main and district roads (PPPs) Annual targets 2012 160 km 2013 257.4km 2014 308.9km The SNDP also puts emphasis on effective water resource management at catchment, regional and national level
diversification and growth. One of the challenges facing Zambia is the vulnerability and increasing constraints derived from a number of water related factors. Frequent droughts and floods, hydrological variability and seasonal water shortages compounded by growing water demand from the major sectors of the economy and limited water infrastructure impose a serious constraint on medium and long term growth prospects
Indicator 2.2.2 Households with access to an all season roads as percentage of total population in targeted 5 districts Baseline 2010: >5% Target 2014 >60% Indicator 2.2.3: Water storage and regulation established in at least 20 target rural communities Baseline (2013): 0 Target (2016) : 20 new / 30 rehab
Milestone for 2.2.2 • 120 kilometers of roads
benefiting from spot improvements in the targeted 5 districts
• 6. small bridges rehabilitated in the 5 targeted districts
Milestone for Indicator 2.2.3: 2013: Water Resources Management Authority (WARMA) established 2014: Infrastructure inventory completed 2015: Average annual storage increased to a volume greater than 5 million cu meters per year
Pipeline Financing IDA: Electricity distribution and rehabilitation project (P133184) Water Resource Development Project (P114949) IFC: Support for PPPs and telecommunication Trust Fund: ESMAP GPOBA resources PPAIF Proposed AAA WSP: Promoting peri-urban sanitation approaches (P132003); Feasibility study for growth pole development model Partnership and Leverage The Bank will work closely with IFC and CPs such as DFID to support the Government with PPPs for infrastructure. Updating of the 2003 National Transport Policy. The World Bank is also facilitating a meeting between the Energy Ministers of Zambia and Zimbabwe and the Zambezi River Authority to discuss the financing and rehabilitation options for the Kariba dam and the financing options for the Batoka Gorge. Main Development partners DFID, AfDB, EU, EIB, Germany, MCA, China
The high cost of finance and limited access to financial services is a constraint to capital formation and growth. The objective of Government during the Plan period is to continue making improvements in the macroeconomic environment so as to support activities across all spheres of
The limited availability and high cost of financial services poses a serious constraint on the ability of entrepreneurs to start and/or to expand their operations. Small and medium enterprises are the most
Indicator:2.3.1:
Milestones for Indicator 2.3.1:
On-going Financing Trust Funds: Global trust fund on Growth and Equity (TF098867) IFC interventions: IFC will also focus on the SME sector and increase local currency programs to support economic
Outcome 2.3: Improved Access to finance for small enterprises

54
Country Development Objectives and Results
Issues and Obstacles CPS Outcomes Milestones Bank Group Program (and Partners)
business and enterprises. This is meant to support the expected reduction in lending rates by the commercial banks. The Financial Sector Development Programme (FSDP) is the broad reform programme for the financial sector and will continue to be implemented under Phase II in the SNDP. The reform measures will be focused at addressing weaknesses in the financial sector so as to:- (i) Improve market infrastructure; (ii) Increase competition; and (iii) Increase access to finance.
affected In the mining sector also that has been the engine of growth. Large-scale mining operations are largely dependent on imported capital equipment and procuring consumables for mining operations. Constraints reported by SME sector in their ability to fulfill quality and price demands are high cost of imported inputs; access to finance and lack of long-term orders from mining companies.
Increase in the percentage of SMEs that have access to formal financial institutions Baseline (2010): <10% Target (2016): 25%
2014: 15%; 2015: 20%; 2016: 25%;
development (Swaps, Liquidity Enhanced Asset Program (LEAP), Bond issue). Pipeline Financing IDA: Access to Finance for SMEs (P143050) On-going AAA Zambia Financial Consumer Protection (P143892) Proposed AAA Financial Sector Assessment Program (FSAP) Enterprise Survey Financial Sector Assessment Program Partnership and leverage The World Bank and IFC are coordinating their support for financial and private sector development in Zambia through better information sharing, overall business planning and complementary support. As the FSDP II is phasing out, the World Bank will also work with CPs such as DFID in addressing the access to finance agenda for lower income groups, transformational banking and the use of technology in increasing access to finance. Potential for related funding (and IFC) TA for SME advisory work) for SME / local content work under proposed WB-DBZ credit line operation (FY14) Main Development partners DFID, Finland, AfDB
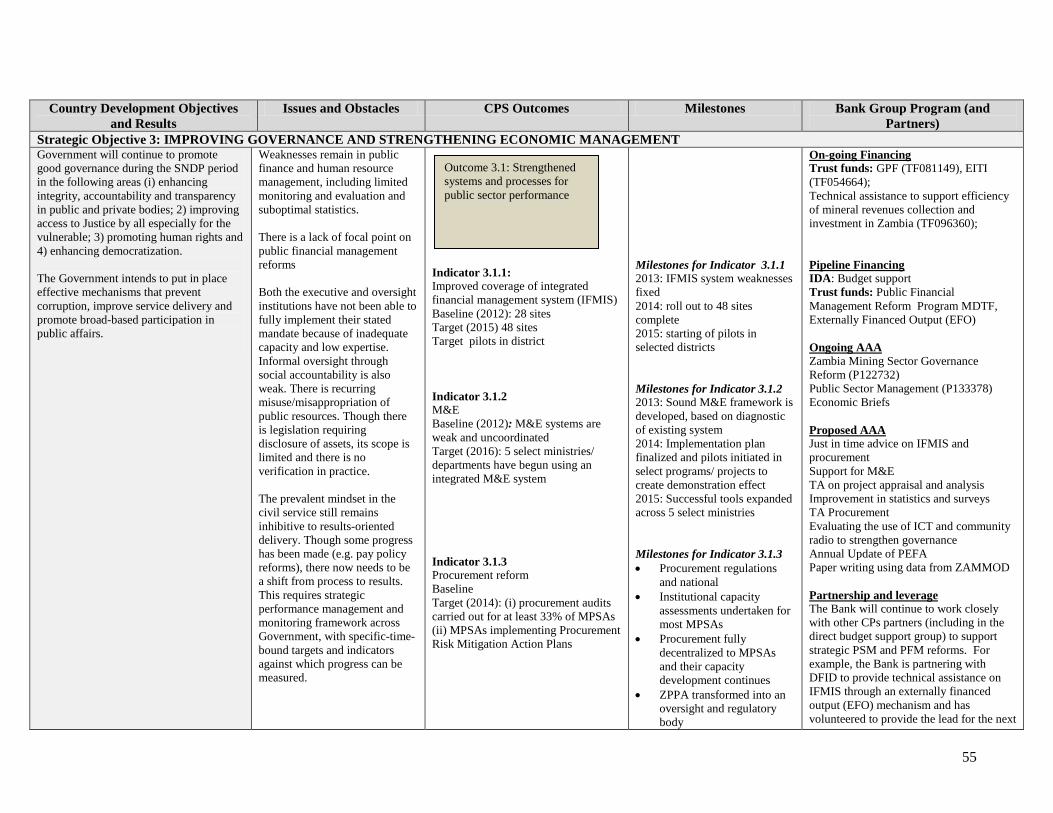
55
Country Development Objectives and Results
Issues and Obstacles CPS Outcomes Milestones Bank Group Program (and Partners)
Strategic Objective 3: IMPROVING GOVERNANCE AND STRENGTHENING ECONOMIC MANAGEMENT Government will continue to promote good governance during the SNDP period in the following areas (i) enhancing integrity, accountability and transparency in public and private bodies; 2) improving access to Justice by all especially for the vulnerable; 3) promoting human rights and 4) enhancing democratization. The Government intends to put in place effective mechanisms that prevent corruption, improve service delivery and promote broad-based participation in public affairs.
Weaknesses remain in public finance and human resource management, including limited monitoring and evaluation and suboptimal statistics. There is a lack of focal point on public financial management reforms Both the executive and oversight institutions have not been able to fully implement their stated mandate because of inadequate capacity and low expertise. Informal oversight through social accountability is also weak. There is recurring misuse/misappropriation of public resources. Though there is legislation requiring disclosure of assets, its scope is limited and there is no verification in practice. The prevalent mindset in the civil service still remains inhibitive to results-oriented delivery. Though some progress has been made (e.g. pay policy reforms), there now needs to be a shift from process to results. This requires strategic performance management and monitoring framework across Government, with specific-time-bound targets and indicators against which progress can be measured.
Indicator 3.1.1: Improved coverage of integrated financial management system (IFMIS) Baseline (2012): 28 sites Target (2015) 48 sites Target pilots in district Indicator 3.1.2 M&E Baseline (2012): M&E systems are weak and uncoordinated Target (2016): 5 select ministries/ departments have begun using an integrated M&E system Indicator 3.1.3 Procurement reform Baseline Target (2014): (i) procurement audits carried out for at least 33% of MPSAs (ii) MPSAs implementing Procurement Risk Mitigation Action Plans
Milestones for Indicator 3.1.1 2013: IFMIS system weaknesses fixed 2014: roll out to 48 sites complete 2015: starting of pilots in selected districts Milestones for Indicator 3.1.2 2013: Sound M&E framework is developed, based on diagnostic of existing system 2014: Implementation plan finalized and pilots initiated in select programs/ projects to create demonstration effect 2015: Successful tools expanded across 5 select ministries Milestones for Indicator 3.1.3 • Procurement regulations
and national • Institutional capacity
assessments undertaken for most MPSAs
• Procurement fully decentralized to MPSAs and their capacity development continues
• ZPPA transformed into an oversight and regulatory body
On-going Financing Trust funds: GPF (TF081149), EITI (TF054664); Technical assistance to support efficiency of mineral revenues collection and investment in Zambia (TF096360); Pipeline Financing IDA: Budget support Trust funds: Public Financial Management Reform Program MDTF, Externally Financed Output (EFO) Ongoing AAA Zambia Mining Sector Governance Reform (P122732) Public Sector Management (P133378) Economic Briefs Proposed AAA Just in time advice on IFMIS and procurement Support for M&E TA on project appraisal and analysis Improvement in statistics and surveys TA Procurement Evaluating the use of ICT and community radio to strengthen governance Annual Update of PEFA Paper writing using data from ZAMMOD Partnership and leverage The Bank will continue to work closely with other CPs partners (including in the direct budget support group) to support strategic PSM and PFM reforms. For example, the Bank is partnering with DFID to provide technical assistance on IFMIS through an externally financed output (EFO) mechanism and has volunteered to provide the lead for the next
Outcome 3.1: Strengthened systems and processes for public sector performance

56
Country Development Objectives and Results
Issues and Obstacles CPS Outcomes Milestones Bank Group Program (and Partners)
phase of PFM reforms. Discussions are in progress for a possible multi-donor trust fund for pooling the resources for PFM reforms that will take into account the lessons learned from PEMFA and successful practices elsewhere. Main Development partners DFID, Swedish, EU, Finland, Germany, UNDP
The SNDP notes the Government’s commitment to improve the efficiency, effectiveness, transparency and accountability of public funds. Specifically for the mining sector, Government has also committed to sustain and build upon the gains made by the Zambian Extractive Industry Transparency Initiative (ZEITI) on transparency of mining revenues and civil society participation
Suboptimal transparency and accountability levels and use of demand-side governance instruments, especially at the sub-national levels Transparency in the mining sector is key. Transparency through Zambia EITI process, including quality improvements in EITI data disclosure and IT automation, as well as strong engagement by civil society building upon Zambia's recent attainment of EITI-compliant status
Indicator 3.2.1: Strengthened capacity of journalists Baseline (2012): Low levels of investigative journalism in Zambian media Target (2016): Increase in levels of investigative journalism in Zambian media Indicator 3.2.2: Transparency Baseline (2012): Zambia is now EITI-compliant Target (next validation due 2017): Maintain EITI-compliant status, including regular publication of mining revenues.
Milestones for Indicator 3.2.1 75 of Zambia’s most promising journalists (15 per year) trained and mentored in investigative skills. Journalists trained in skills of reporting on technical topics (including EITI, mining taxation, roads, access to information etc.) Milestones for Indicator 3.2.2. Continued publication of ZEITI (mining transparency) reports of revenues and payments and wide communication of same, annually in line with EITI International requirements Milestones for indicator 3.2.3.
Ongoing Financing IDA: Demand-side engagement components incorporated in projects (e.g. Road Rehabilitation Maintenance Program Phase II (P105696)) Trust fund: GPF (TF081149), EITI (TF 054664) Pipeline Financing Anti-Corruption trust fund Ongoing AAA EITI Initiative (P102422) Governance Improvement in the Road Sector (P131231) Support to Increased Accountability (P121142) Support to demand for good governance (P125474) Supporting CSOs’ participation in EITI Zambia (P132556) GPF Snapshots Partnerships and leverage On the Accountability through Community radio pilot the Bank has been partnering with Cambridge University’s Centre for Governance and Human Rights, to evaluate the use of ICT-enabled systems for improved governance. With the Support to Investigative Journalism pilot
Outcome 3.2: Citizen access to information increased

57
Country Development Objectives and Results
Issues and Obstacles CPS Outcomes Milestones Bank Group Program (and Partners)
Indicator 3.2.3: Freedom of Information Baseline (2012): Zambia has no Freedom of information Bill Target (2016): Bill is passed and Legislation is being implemented
2012: Draft legislation is finalized 2013: Draft Bill is launched and consultation undertaken. 2014: Bill is tabled and passed. 2016: Act is being implemented
the Bank has established strong partnerships with The Mail & Guardian in South Africa and The Bureau for Investigative Journalism in UK. WB and DfID are currently exploring the possibility of a joint media fund that would provide institutional grants towards the development of investigative journalism. The On Track pilot is the result of an internal Bank collaboration between WBI, AFTOS and PREM. Zambia EITI, and Zambian civil society, are supported by WB with technical assistance and grant funding via the EITI MDTF. ZEITI is additional supported by the EU/Norway/DFID-funded Mining Basket Fund and AfDB Main Development partners DFID, Germany, Swedish, EU, Irish, USAID, Finland, UNDP
Note: (i) Because of the flexible nature of the CPS, operations for the outer year have not yet been finalized and therefore do not figure in this results matrix. These will be reflected in the results matrix for the CPS Progress Report. For projects that are currently being designed (e.g. energy, access to finance for SMEs) changes in the indicators as the design is finalized will also get reflected in the CPS Progress Report. (ii) The country development objectives and results are from the Sixth National Development Plan (SNDP) 2011–2015 and the indicators are also derived from that plan. The objectives of the SNDP are to: accelerate infrastructure development; economic growth and diversification; promote rural investment and accelerate poverty reduction and enhance human development.

58
Annex 2: Zambia at a Glance
Zambia at a glance 1/16/13
Sub- LowerKey Development Indicators Saharan middle
Zambia Africa income(2011)
Population, mid-year (millions) 13.5 853 2,519Surface area (thousand sq. km) 753 24,243 23,579Population growth (%) 2.8 2.5 1.5Urban population (% of total population) 39 37 39
GNI (Atlas method, US$ billions) 15.7 1,004 4,078GNI per capita (Atlas method, US$) 1,160 1,176 1,619GNI per capita (PPP, international $) 1,380 2,148 3,632
GDP growth (%) 6.8 4.8 6.9GDP per capita growth (%) 4.0 2.4 5.3
(most recent estimate, 2005–2011)
Poverty headcount ratio at $1.25 a day (PPP, %) 69 48 ..Poverty headcount ratio at $2.00 a day (PPP, %) 83 69 ..Life expectancy at birth (years) 48 54 65Infant mortality (per 1,000 live births) 69 76 50Child malnutrition (% of children under 5) 15 22 25
Adult literacy, male (% of ages 15 and older) 81 71 80Adult literacy, female (% of ages 15 and older) 61 54 62Gross primary enrollment, male (% of age group) 115 104 110Gross primary enrollment, female (% of age group) 116 95 104
Access to an improved water source (% of population) 61 61 87Access to improved sanitation facilities (% of population) 48 31 47
Net Aid Flows 1980 1990 2000 2011 a
(US$ millions)Net ODA and official aid 317 475 795 913Top 3 donors (in 2010): United States 41 12 46 225 European Union Institutions 20 26 26 93 United Kingdom 43 43 111 79
Aid (% of GNI) 8.8 15.8 25.7 6.2Aid per capita (US$) 55 60 78 71
Long-Term Economic Trends
Consumer prices (annual % change) .. 137.0 26.0 8.7GDP implicit deflator (annual % change) 11.8 106.4 30.8 12.9
Exchange rate (annual average, local per US$) 0.8 34.5 3,110.8 4,860.7Terms of trade index (2000 = 100) .. 155 100 236
1980–90 1990–2000 2000–11
Population, mid-year (millions) 5.8 7.9 10.2 13.5 3.1 2.6 2.5GDP (US$ millions) 3,884 3,288 3,254 19,206 1.0 0.5 5.7
Agriculture 15.1 20.6 22.2 19.5 3.6 4.2 2.7Industry 42.1 51.3 25.1 37.3 1.0 -4.2 8.5 Manufacturing 18.3 36.1 11.3 8.4 4.1 0.8 4.1Services 42.8 28.1 52.7 43.2 -0.2 2.5 7.0
Household final consumption expenditure 55.2 64.4 87.0 45.4 3.6 8.5 3.2General gov't final consumption expenditure 25.5 19.0 9.5 20.6 -3.4 -8.1 13.0Gross capital formation 23.3 17.3 17.4 25.0 -4.3 7.6 11.9
Exports of goods and services 41.4 35.9 26.5 46.0 -3.3 4.7 10.7Imports of goods and services 45.4 36.6 40.4 37.0 -2.0 15.4 8.6Gross savings 7.3 6.7 -0.9 27.8
Note: Figures in italics are for years other than those specified. 2011 data are preliminary. .. indicates data are not available.a. Aid data are for 2010.
Development Economics, Development Data Group (DECDG).
(average annual growth %)
(% of GDP)
15 10 5 0 5 10 150-4
15-19
30-34
45-49
60-64
75-79
percent of total population
Age distribution, 2010
Male Female
020406080
100120140160180200
1990 1995 2000 2010
Zambia Sub-Saharan Af rica
Under-5 mortality rate (per 1,000)
-15
-10
-5
0
5
10
95 05
GDP GDP per capita
Growth of GDP and GDP per capita (%)

59
Zambia at a Glance (continued)
Zambia
Balance of Payments and Trade 2000 2011
(US$ millions)Total merchandise exports (fob) 757 8,731 Total merchandise imports (cif) 978 6,454Net trade in goods and services -446 1,469
Current account balance -588 289 as a % of GDP -18.1 1.5
Workers' remittances and compensation of employees (receipts) 36 44
Reserves, including gold 114 2,167
Central Government Finance
(% of GDP)Current revenue (including grants) 20.3 21.7 Tax revenue 19.1 19.3Current expenditure 13.8 19.7
Technology and Infrastructure 2000 2010Overall surplus/deficit -3.5 -3.9
Paved roads (% of total) 22.0 ..Highest marginal tax rate (%) Fixed line and mobile phone Individual 30 .. subscribers (per 100 people) 2 43 Corporate 35 35 High technology exports
(% of manufactured exports) 0.3 1.0External Debt and Resource Flows
Environment(US$ millions)Total debt outstanding and disbursed 5,811 4,360 Agricultural land (% of land area) 30 31Total debt service 185 261 Forest area (% of land area) 68.8 66.5Debt relief (HIPC, MDRI) 3,662 1,871 Terrestrial protected areas (% of land area) 36.0 36.0
Total debt (% of GDP) 178.6 22.7 Freshwater resources per capita (cu. meters) 7,500 6,303Total debt service (% of exports) 20.8 2.9 Freshwater withdrawal (billion cubic meters) .. ..
Foreign direct investment (net inflows) 122 699 CO2 emissions per capita (mt) 0.18 0.15Portfolio equity (net inflows) -1 ..
GDP per unit of energy use (2005 PPP $ per kg of oil equivalent) 1.7 2.1
Energy use per capita (kg of oil equivalent) 612 617
World Bank Group portfolio 2000 2010
(US$ millions)
IBRD Total debt outstanding and disbursed 25 0 Disbursements 0 – Principal repayments 8 – Interest payments 3 –
IDA Total debt outstanding and disbursed 1,823 430 Disbursements 210 32
Private Sector Development 2000 2011 Total debt service 17 5
Time required to start a business (days) – 18 IFC (fiscal year)Cost to start a business (% of GNI per capita) – 27.9 Total disbursed and outstanding portfolio 22 34Time required to register property (days) – 40 of which IFC own account 22 34
Disbursements for IFC own account 16 6Ranked as a major constraint to business 2000 2010 Portfolio sales, prepayments and (% of managers surveyed who agreed) repayments for IFC own account 1 7 Access to/cost of financing 84.5 .. Tax rates 57.5 .. MIGA
Gross exposure 31 –Stock market capitalization (% of GDP) 7.2 17.4 New guarantees 30 0Bank capital to asset ratio (%) .. ..
Note: Figures in italics are for years other than those specified. 2011 data are preliminary. 1/16/13.. indicates data are not available. – indicates observation is not applicable.
Development Economics, Development Data Group (DECDG).
0 25 50 75 100
Control of corruption
Rule of law
Regulatory quality
Polit ical stability andabsence of violence
Voice and accountability
Country's percentile rank (0-100)higher values imply better ratings2010 2000
Governance indicators, 2000 and 2010
Source: Worldw ide Governance Indicators (www.govindicators.org)
IBRD, 0IDA, 430
IMF, 395
Other multi-lateral, 1,215
Bilateral, 353
Private, 827
Short-term, 1,191
Composition of total external debt, 2010
US$ millions

60
Annex 3: Key Social Indicators
Zambia Social IndicatorsLatest single year Same region/income group
Sub- Lower-
Saharan middle-1980-85 1990-95 2005-11 Africa income
POPULATION Total population, mid-year (millions) 6.8 8.9 13.5 853.4 2,518.7 Grow th rate (% annual average for period) 3.2 2.5 2.7 2.5 1.6Urban population (% of population) 39.7 37.1 38.7 37.4 39.4Total fertility rate (births per woman) 6.8 6.2 6.3 4.9 2.9
POVERTY(% of population)National headcount index .. 73.8 59.3 .. .. Urban headcount index .. 44.9 26.7 .. .. Rural headcount index .. 92.2 76.8 .. ..
INCOMEGNI per capita (US$) 350 350 1,070 1,176 1,619Consumer price index (2005=100) .. .. .. 147 140Food price index (2000=100) .. .. .. .. ..
INCOME/CONSUMPTION DISTRIBUTIONGini index .. 52.6 54.6 .. ..Low est quintile (% of income or consumption) .. 3.0 3.6 .. ..Highest quintile (% of income or consumption) .. 56.6 59.4 .. ..
SOCIAL INDICATORSPublic expenditure Health (% of GDP) .. 3.4 3.6 3.0 2.0 Education (% of GNI) .. .. .. 5.0 4.0Net primary school enrollment rate(% of age group) Total 84 75 91 75 85 Male 87 77 90 77 87 Female 81 74 92 73 83Access to an improved water source(% of population) Total .. 51 61 61 87 Urban .. 88 87 83 93 Rural .. 29 46 49 83Immunization rate(% of children ages 12-23 months) Measles 58 86 91 75 80 DPT 66 86 82 77 79Child malnutrition (% under 5 years) .. 21 15 22 25Life expectancy at birth(years) Total 51 44 48 54 65 Male 50 43 48 53 64 Female 53 44 49 55 67Mortality Infant (per 1,000 live births) 106 108 53 76 50 Under 5 (per 1,000 live births) 175 184 83 121 69 Adult (15-59) Male (per 1,000 population) 482 434 491 379 244 Female (per 1,000 population) 413 377 493 346 175 Maternal (per 100,000 live births) .. 530 440 650 300Births attended by skilled health staff (%) .. 51 47 46 57
CAS Annex B5. This table w as produced from the CMU LDB system. 09/26/12Note: 0 or 0.0 means zero or less than half the unit show n. Net enrollment rate: break in series betw een 1997 and 1998 due tochange from ISCED76 to ISCED97. Immunization: refers to children ages 12-23 months w ho received vaccinations before oneyear of age or at any time before the survey.

61
Annex 4a: Millennium Development Goals
Millennium Development Goals Zambia
With selected targets to achieve between 1990 and 2015(estimate closest to date shown, +/- 2 years)
Goal 1: halve the rates for extreme poverty and malnutrition 1990 1995 2000 2010 Poverty headcount ratio at $1.25 a day (PPP, % of population) 61.1 62.1 55.7 68.5 Poverty headcount ratio at national poverty line (% of population) 69.7 68.1 66.8 59.3 Share of income or consumption to the poorest qunitile (%) .. 4.2 3.4 3.6 Prevalence of malnutrition (% of children under 5) 21.2 19.6 19.6 14.9
Goal 2: ensure that children are able to complete primary schooling Primary school enrollment (net, %) 84 75 70 91 Primary completion rate (% of relevant age group) .. .. 63 103 Secondary school enrollment (gross, %) 21 21 20 .. Youth literacy rate (% of people ages 15-24) 66 .. 69 75
Goal 3: eliminate gender disparity in education and empower women Ratio of girls to boys in primary and secondary education (%) 87 .. 91 .. Women employed in the nonagricultural sector (% of nonagricultural employment) 17 .. 22 .. Proportion of seats held by women in national parliament (%) 7 10 10 14
Goal 4: reduce under-5 mortality by two-thirds Under-5 mortality rate (per 1,000) 183 177 157 111 Infant mortality rate (per 1,000 live births) 109 105 94 69 Measles immunization (proportion of one-year olds immunized, %) 90 86 85 91
Goal 5: reduce maternal mortality by three-fourths Maternal mortality ratio (modeled estimate, per 100,000 live births) 470 530 540 440 Births attended by skilled health staff (% of total) 51 47 47 47 Contraceptive prevalence (% of women ages 15-49) 15 26 22 41
Goal 6: halt and begin to reverse the spread of HIV/AIDS and other major diseases Prevalence of HIV (% of population ages 15-49) 12.7 15.0 14.4 13.5 Incidence of tuberculosis (per 100,000 people) 710 788 713 462 Tuberculosis case detection rate (%, all forms) 30 51 68 73
Goal 7: halve the proportion of people without sustainable access to basic needs Access to an improved water source (% of population) 49 51 54 61 Access to improved sanitation facilities (% of population) 46 47 47 48 Forest area (% of land area) 71.0 .. 68.8 66.5 Terrestrial protected areas (% of land area) 36.0 36.0 36.0 36.0 CO2 emissions (metric tons per capita) 0.3 0.2 0.2 0.2 GDP per unit of energy use (constant 2005 PPP $ per kg of oil equivalent) 1.8 1.6 1.7 2.1
Goal 8: develop a global partnership for development Telephone mainlines (per 100 people) 0.8 0.9 0.8 0.7 Mobile phone subscribers (per 100 people) 0.0 0.0 1.0 42.1 Internet users (per 100 people) 0.0 0.0 0.2 10.1 Computer users (per 100 people) .. .. .. ..
Note: Figures in italics are for years other than those specified. .. indicates data are not available. 1/16/13
Development Economics, Development Data Group (DECDG).
Zambia
0
25
50
75
100
125
2000 2005 2010
Prim ary net enrollment ratio
Ratio of girls to boys in primary & secondary education (. .)
Education indicators (%)
0
10
20
30
40
50
2000 2005 2010
Fixed + m obi le subscribers Internet users
ICT indicators (per 100 people)
0
25
50
75
100
1990 1995 2000 2010
Zambia Sub-Saharan Af rica
Measles immunization (% of 1-year olds)

62
Annex 4b: Progress on MDGs for Zambia
GoalTarget Indicator Latest
Figure2015
TargetWill Target be Achieved under
the Present Trend?51 29
Poverty Gap Ratio (%) 34 31.1Yes
Target 1.C: Halve, between 1990 and 2015, the proportionof people who suffer from hunger
Prevalence of underweight children U-5 (%)
14.6 12.5
Acceleration required
Primary school net enrolment rate (%) 102* 100 Yes
Pupils reaching Grade 7 (%) 91.7 100Acceleration required
Literacy rates: 15-24 year olds (%) 70 100Acceleration required
Ratio of girls to boys in primary education 0.96 1Yes
Ratio of girls to boys in secondary education
0.88 1Acceleration required
Ratio of girls to boys in tertiary education 0.74 1Acceleration required
Ratio of literate women to men 15-24 years old
0.8 1Acceleration required
Share of women in wage employment (%) 0.34 --
Proportion of seats held by women in parliament (%)
14 30 Significant reforms and investments needed
U-5 mortality rate (deaths per 1,000 live births)
119 63.6Acceleration required
Infant mortality rate (deaths per 1,000 live 70 35.7 Acceleration required
One-year olds immunized against measles (%)
84.9 100Acceleration required
Maternal mortality ratio per 100,000 live births
591.2 162.3 Significant reforms and investments needed
Births attended by skilled personnel (%) 46.5 -
Target 5.B: Achieve, by 2015, universal access to reproductive health
Contraceptive prevalence rate (%) 24.6-
* NER cannot exceed 100%; however, it is based on demographic data, which does not include factors such as migration within Zambia
Millennium Development Goals
STATUS AT A GLANCE
MDG 1:Eradicate Extreme Poverty and Hunger
Target 1.A: Halve, between 1990 and 2015, the proportion of people living
Proportion of population in extreme poverty (%)
Significant reforms and investments needed
MDG 5: Improve Maternal Health
Target 5.A: Reduce by three-quarters, between 1990 and 2015, the
MDG 2:Achieve Universal Primary Education
Target 2.A: Ensure that by 2015, children everywhere, boys and girls alike, will be able to complete a full course of
MDG 3:Promote Gender Equality
Target 3.A:Eliminate gender disparity in primary and secondary education, preferably by 2005, and in all levels of education no later than 2015
MDG 4: Reduce Child Mortality
Target 4.A: Reduce by two-thirds, between 1990 and 2015, the under-five mortality rate

63
Progress on MDGs for Zambia (Continued)
GoalTarget Indicator Latest
Figure2015
TargetWill Target be Achieved under
the Present Trend?HIV prevalence rate (%) 14.3 <15.6
Yes
Ratio of school attendance of orphans to non-orphans
97 100
Yes
Households with ITNs (%) 64.3 - -
Land covered by forests (%) 45 - -
Foreign direct investment (US$ m) 699.15 - -
Source: UNDP 2011a
MDG 6: Combat HIV /AI DS, Malaria and other Major Diseases
Target 6.A: Have halted by 2015, and begun to reverse the spread of HIV/AIDS
Target 6.C: Have halted by 2015, and begun to reverse, the incidence of malaria and other major diseases
39 11Acceleration required
252 ≤255Acceleration required
New malaria cases per 1,000 population
Malaria fatality rate per 1,000 population
Proportion of population (15-24 years) with comprehensive, correct knowledge of HIV/AIDS (%)
48
- -
Target 6.B: Achieve, by 2010, universal access to treatment for HIV/AIDS for all those who need it
Proportion of population with advanced HIV infection with access to ARVs
79 80
-
MDG 7: Ensure Environmental Sustainability
Target 8.B: Address the special needs of the least developed countries
Proportion of population without access to improved sanitation facilities (%)
36.1 13 Significant reforms and investments needed
Target 7.C: Halve by 2015 the proportion of the population without sustainable access to safe drinking water and basic sanitation
Target 7.A: Integrate the principles of sustainable
development into country policies and programmes
and reverse loss of environmental resources
Proportion of population without access to an improved drinking water source (%)
40 25.5
Acceleration required
-
- -
-
Access to markets in developed countries - - -
Overseas development assistance (US$ m) 918.6 - -Target 8.A: Develop further an open, rule-based, predictable, non-discriminatory trading and financial system
0.22
41 - -Land protected to maintain biological diversity (%)
Carbon dioxide emissions (MT per capita)
Proportion of population using solid fuels (%) 83.8 -
Yes
Target 8.F: In cooperation with the private sector, make available the benefits of new technologies, especially information and communications
MDG 8: Develop a Global Partnership for Development
Cellular subscribers per 1,000 people 322.8 -
Fixed telephone lines per 1,000 people 7 -

64
Annex 5: Key Economic Indicators
Estimate
Indicator 2007 2008 2009 2010 2011 2012 2013 2014 2015
National accounts (as % of GDP)
Gross domestic producta 100 100 100 100 100 100 100 100 100
Agriculture 21 21 22 20 20 19 .. .. ..
Industry 33 34 34 36 37 41 .. .. ..
Services 46 45 44 44 43 40 .. .. ..
Total Consumption 76 81 76 66 66 69 63 61 60Gross domestic fixed investment 21 20 20 21 23 22 26 27 28 Government investment 4 3 3 3 5 7 7 8 9 Private investment 17 16 16 18 18 15 19 19 19
Exports (GNFS)b 41 35 35 47 46 45 49 50 50Imports (GNFS) 39 37 32 35 37 37 39 40 40
Gross domestic savings 24 19 24 34 34 31 37 39 40
Gross national savingsc 15 13 25 29 28 20 32 33 34
Memorandum itemsGross domestic product 11542 14608 12805 16190 19204 21632 22446 24808 27479(US$ million at current prices)GNI per capita (US$, Atlas method) 750 970 1070 1110 1160 1290 .. .. 1680
Real annual growth rates (%, calculated from 94 prices) Gross domestic product at market prices 6.2 5.7 6.4 7.6 6.8 7.3 7.8 8.1 8.0 Gross Domestic Income 15.2 -2.5 -4.0 50.1 8.1 .. .. .. ..
Real annual per capita growth rates (%, calculated from 94 prices) Gross domestic product at market prices 3.5 2.9 3.5 5.9 4.0 4.1 .. .. .. Total consumption 49.4 0.5 -25.8 20.2 8.5 .. .. .. .. Private consumption 58.1 0.5 -29.3 23.8 5.1 .. .. .. ..
Balance of Payments (US$ millions)
Exports (GNFS)b 4,783.1 5,258.3 4,560.0 7,725.2 9,055.4 9,967.9 11,352.8 12,677.4 14,163.1 Merchandise FOB 4,509.7 4,958.7 4,319.1 7,413.6 8,731.0 9,445.0 10,884.9 12,160.3 13,590.3
Imports (GNFS)b 4,523.5 5,469.2 4,118.8 5,649.6 7,637.2 8,566.4 9,504.2 10,560.0 11,783.6 Merchandise FOB 3,610.5 4,554.3 3,413.4 4,709.9 6,454.3 8,094.0 8,114.5 9,061.2 10,165.0 Resource balance 259.6 -211.0 441.2 2,075.6 1,418.3 1,401.5 1,848.6 2,117.4 2,379.5 Net current transfers 530.5 560.1 516.0 431.8 381.7 314.0 424.7 429.1 438.0 Current account balance -754.4 -1,049.5 538.5 1,144.4 289.0 -674.0 576.6 715.7 827.4
Net private foreign direct investment 1,323.9 938.6 425.2 633.9 831.5 953.2 1,141.7 1,286.6 1,452.5 Long-term loans (net) -352.0 -116.0 148.0 -788.0 -390.0 -23.0 67.0 .. .. Official 85.4 55.5 39.4 129.9 72.5 152.8 209.5 142.7 90.9 Private -437.4 -171.5 108.6 -917.9 -462.5 -175.8 -142.5 .. .. Other capital (net, incl. errors & ommissions) 93.1 239.5 -571.6 -906.9 -441.5 -930.2 -1,257.6 .. ..
Change in reservesd -310.5 -12.7 -540.1 -83.3 -208.0 -764.0 -527.7 -744.1 -947.9
Memorandum itemsResource balance (% of GDP) 2.2 -1.4 3.4 12.8 7.4 6.5 8.2 8.5 8.7Real annual growth rates ( YR94 prices) Merchandise exports (FOB) 1.1 13.6 19.6 20.3 2.7 16.0 14.3 13.7 13.8 Primary .. .. .. .. .. .. .. .. .. Manufactures .. .. .. .. .. .. .. .. .. Merchandise imports (CIF) 30.7 10.7 -14.2 30.7 25.1 15.2 11.6 12.2 12.7
(Continued)
Actual Projected

65
Zambia - Key Economic Indicators(Continued)
Actual Estimate Projected
Indicator 2007 2008 2009 2010 2011 2012 2013 2014 2015
Public finance (as % of GDP at market prices)e
Current revenues 19.6 20.1 17.3 19.0 21.6 19.7 21.3 22.3 23.2 Current expenditures 18.3 19.6 17.4 19.2 19.0 17.4 17.1 17.1 17.2 Current account surplus (+) or deficit (-) 1.2 0.5 0.0 -0.2 2.6 2.3 4.2 5.2 6.0 Capital expenditure 5.9 2.7 5.4 3.0 5.5 7.6 7.3 8.1 8.9 Foreign financing 3.6 3.4 1.5 0.9 2.5 4.4 2.7 2.5 2.4
Monetary indicators M2/GDP 22.5 23.4 21.4 23.1 23.4 24.2 24.8 25.5 25.9 Growth of M2 (%) 25.3 23.2 7.7 29.9 21.7 17.0 16.5 15.5 15.0 Private sector credit growth / 148.4 99.4 -34.1 40.2 116.4 87.2 83.8 86.6 87.4 total credit growth (%)
Price indices( YR94 =100) Merchandise export price index 325.9 315.4 229.6 327.8 373.7 354.3 353.4 347.3 341.2 Merchandise import price index 164.6 187.5 163.7 172.8 189.2 184.8 185.1 184.2 183.3 Merchandise terms of trade index 198.0 168.2 140.3 189.7 197.6 191.7 190.9 188.6 186.1
Real exchange rate (US$/LCU)f 271.4 262.1 197.7 202.1 201.2 .. .. .. ..
Real interest rates Consumer price index (% change) 10.7 12.4 13.4 8.5 8.7 5.6 5.2 5.0 5.0 GDP deflator (% change) 12.8 12.3 10.7 11.7 12.9 4.8 4.8 4.6 4.6
a. GDP at factor costb. "GNFS" denotes "goods and nonfactor services."c. Includes net unrequited transfers excluding official capital grants.d. Includes use of IMF resources.e. Consolidated central government.f. "LCU" denotes "local currency units." An increase in US$/LCU denotes appreciation.

66
Annex 6: Key Exposure Indicators
Actual Estimated
Indicator 2007 2008 2009 2010 2011 2012 2013 2014 2015
Total debt outstanding and 2857 3080 3774 4411 4360 3879 3827 3717 3613
disbursed (TDO) (US$m)a
Net disbursements (US$m)a .. .. .. .. .. .. .. .. ..
Total debt service (TDS) .. .. .. .. .. .. .. .. ..
(US$m)a
Debt and debt service indicators
(%)
TDO/XGSb 58.6 57.5 81.9 56.7 47.8 38.7 33.4 29.0 25.2
TDO/GDP 24.8 21.1 29.5 27.2 22.7 17.9 17.1 15.0 13.1
TDS/XGS .. .. .. .. .. .. .. .. ..
Concessional/TDO 27.0 28.4 25.5 25.4 28.0 35.4 41.6 47.0 51.1
IBRD exposure indicators (%)
IBRD DS/public DS .. .. .. .. .. .. .. .. ..
Preferred creditor DS/public .. 51.0 51.8 59.8 61.3 .. .. 67.2 73.3
DS (%)c
IBRD DS/XGS .. .. .. .. .. .. .. .. ..
IBRD TDO (US$m)d .. .. .. .. .. .. .. .. ..
Of which present value of .. .. .. .. .. .. .. .. ..
guarantees (US$m)
Share of IBRD portfolio (%) .. .. .. .. .. .. .. .. ..
IDA TDO (US$m)d 323 371 407 430 492 535 570 589 597
IFC (US$m)
Loans .. .. .. .. .. .. .. .. ..
Equity and quasi-equity /e .. .. .. .. .. .. .. .. ..
MIGA
MIGA guarantees (US$m) .. .. .. .. .. .. .. .. ..
a. Includes public and publicly guaranteed debt, private nonguaranteed, use of IMF credits and net short-
term capital.
b. "XGS" denotes exports of goods and services, including workers' remittances.
c. Preferred creditors are defined as IBRD, IDA, the regional multilateral development banks, the IMF, and the
Bank for International Settlements.
d. Includes present value of guarantees.
e. Includes equity and quasi-equity types of both loan and equity instruments.
Projected

67
Annex 7: Selected Indicators* of Bank Portfolio Performance and Management
As Of Date 1/8/2013
Indicator 2010 2011 2012 2013
Portfolio Assessment Number of Projects Under Implementation a 10 9 8 8
Average Implementation Period (years) b 4.8 5.6 4.9 5.5
Percent of Problem Projects by Number a, c 0.0 11.1 0.0 12.5
Percent of Problem Projects by Amount a, c 0.0 5.4 0.0 6.5
Percent of Projects at Risk by Number a, d 20.0 22.2 0.0 12.5
Percent of Projects at Risk by Amount a, d 29.8 22.7 0.0 6.5
Disbursement Ratio (%) e 19.0 18.3 10.9 7.6
Portfolio Management CPPR during the year (yes/no) Supervision Resources (total US$) Average Supervision (US$/project)
Memorandum Item Since FY 80
Last Five FYs
Proj Eval by OED by Number 69 5 Proj Eval by OED by Amt (US$ millions) 3,026.5 154.0 % of OED Projects Rated U or HU by Number 46.3 0 % of OED Projects Rated U or HU by Amt 38.9 0** Note: OED is now called IEG (Independent Evaluation Group)
a. As shown in the Annual Report on Portfolio Performance (except for current FY).
b. Average age of projects in the Bank's country portfolio. c. Percent of projects rated U or HU on development objectives (DO) and/or implementation progress (IP). d. As defined under the Portfolio Improvement Program. e. Ratio of disbursements during the year to the undisbursed balance of the Bank's portfolio at the beginning of the year: Investment projects only. * All indicators are for projects active in the Portfolio, with the exception of Disbursement Ratio, which includes all active projects as well as projects which exited during the fiscal year. ** one of the five was rated MU not fully U Source: BW CAS Annexes and updates

68
Annex 8: Operations Portfolio (IBRD/IDA and Grants)
As Of Date 1/8/2013
Closed Projects 87 IBRD/IDA * Total Disbursed (Active) 190.59 of which has been repaid 0.00 Total Disbursed (Closed) 605.93 of which has been repaid 121.30 Total Disbursed (Active + Closed) 796.52 of which has been repaid 121.30 Total Undisbursed (Active) 313.57 Total Undisbursed (Closed) 0.00 Total Undisbursed (Active + Closed) 313.57
Active Projects Last PSR
Difference Between Expected and Actual
Project ID Project Name
Supervision Rating DO IP Fiscal
Year
Original Amount in US$ Millions IBRD IDA Grant Cancel Undisb.
Disbursements a/
Orig. Frm Rev’d P102459 ZM- Irrigation Development Project S S 2011 115 109.8 -4.3
P070063 ZM-Agr Dev Support Program S S 2006 37.2 10.4 8.2 -29.0
P076320 ZM-GEF Increased Access to Elec MS MS 2008 4.5
P077452 ZM-Incr.Eff.&Access to Elec SIL MS MS 2008 53 44.0 22.6 24.7
P096131 ZM-Malaria Health Booster SIL S MS 2006 50 8.1 -22.5 5.2
P071985 ZM-Road Rehab Maintenance Prj MS MS 2004 90 19.9 -22.3 -0.7
P106596 ZM-RRMP PHASE II APL S MU 2010 75 63.3 24.7
P071259 ZM-Water Sector Performance Improv MS MS 2007 33 12.3 1.1 6.9
P122123 ZM: Livestock Develop & Animal Health Prj MS MS 2012 50 45.7
Overall Result 503.2 4.5 313.6 3.0 7.2
Undisb. National IDA Regional IDA Regional Projects
Comm. Amt.
Total for Zambia
P069258 3A-Southern Afr Power Mrkt APL 1 MS MS 2004 560.7 1.1 0.37 0.73 P124351 ZM: Regional Transmiss. Line Reinforcement # # 2012 60 60 57.2 30 30 P108879 Nyika Transfrontier Conservation Area Project
(GEF) S MS 2011
2.3
Overall Result 620.7 61.1 2.3 57.2 30.37 30.73
Source: BW CAS Annexes a. Intended disbursement to date minus actual disbursement to date as projected at appraisal

69
Annex 9: On-going IDA Projects Approved before CPS by Sector
As of 01/8/2013
Source: Operations portal2
Project Short Name Fiscal Year
Development Objective Net Comt Amt (US$ million)
Undisb (US$ M) as of Jan 8, 2013.
Estimated Undisb (US$ M) as of Jan. 2013
Agriculture
ZM-Agriculture Development Support Program
2006 The project development objective is to advance smallholder agriculture commercialization along value chains through (a) providing resources for working capital and term lending for capital investments in productive and marketing assets/activities to improve productivity, quality and efficiency of supply chains; (b) targeted investments into public/collective goods, such as feeder roads and into key public service functions; and (c) building market, technical and managerial knowledge of farmer groups and producer organizations through extension.
37.2 10.4 9.1
Total 202.2 165.9 162.6Transport
Total 165 83.2 75.1Water
EnergyZM-Incr.Eff.&Access to Elec SIL 2008 The objective of this project is to increase access to electricity services and improve efficiency and quality
of the electricity distribution system in targeted areas53 44 43.6
ZM:Regional Transmiss Line Reinforcement
2012 To improve the reliability of ZESCO's regional power trade transmission network infrastructure along the Kafue Town - Muzuma - Victoria Falls corridor.
30 (National IDA) 30 30
3A-Southern Afr Power Mrkt APL 1 2004 To facilitate further development of an efficient power market in the Southern African Development Community.
0.37(National IDA)
Health
Overall Result 533.6 343.5 329.2
Note
46
ZM: Livestock Develop & Animal Health Project
2012 The Project Development Objective (PDO) is to improve the productivity of key livestock production systems for targeted female and male smallholder producers in selected areas of the Recipient’s territory. Specifically, the project will target selected species including cattle, small ruminants (sheep and goats), pigs and poultry for smallholder producers in Eastern, Southern and Western provinces and the Disease Free Zone comprising Central, Lusaka and parts of Copperbelt provinces.
50 45.7
ZM- Irrigation Development Project 2011 The project development objective is to increase yields per hectare and volume of products marketed by smallholders benefitting from investments in irrigation in selected sites served by the project 115 107.5109.8
ZM-Road Rehab Maintenance Project
ZM-Malaria Health Booster SIL 2006 The overall project development objective is to increase access to, and use of, interventions for malaria prevention and treatment by the target population. The PDO of the project has been modified during restructuring: To increase coverage of interventions for malaria prevention and treatment and other key maternal and child health interventions.
50
ZM-Water Sector Performance Improvement
2007 The objective of the Project is to support the Recipient's efforts towards the: (i) improvement of access to, and sustainability of, the water supply and sanitation services for consumers in Lusaka; and (ii) development of a comprehensive institutional structure supporting a coordinated approach to water supply and sanitation investments
33
ZM-RRMP PHASE II APL 2010 The overarching goal is to stimulate economic growth and contribute to poverty reduction through appropriate investment in road infrastructure, adequate policy and institutional reforms, and enhanced road sector management.
75
2004 The project development objectives are to: (i) develop the institutional capacity for sustainable management of public road infrastructure and road safety, (ii) preserve road assets in targeted transport corridors, and (iii) rehabilitate and construct targeted transport infrastructure.
90
6.8
11.1
58.9
16.2
a. Project distribution by sector based on the undisbursed balance as of January 2013.
19.9
63.3
12.3
8.1
Agriculture48%Transport
24%
Water4%
Energy22%
Health2%
Figure 1:Undisbursed IDA resources by sector for on-going projects a

70
Annex 10: World Bank Indicative Lending and AAA Plan FY13-16
Table 1: Summary Lending
Fiscal Year Project US$ millions 2013 Water Resources Development, 50
Energy 100
Regional agriculture, 10 (national IDA) 20(regional IDA) PPCR 33 (trust funds) 2014 Access to Finance for Small and Medium Enterprises (SMEs)/Budget support 30
2015 Health and Nutrition 40 (with 25 from IDA and rest trust fund and other resources)
Budget support 30 2016 Unallocated options under consideration
Safety Net and Nutrition Road APL3 Sanitation Regional trade and transport facilitation operation Regional DPO
Note: *trust fund resources will be available for Zambezi River Basin Development
Table 2: Details on the Indicative Lending noted in Table 1
Project Name Project ID
Fiscal Year
Amount(US$ million
Project Description
ZM-Electricity Distribution Rehab P133184 2013 100 This proposed project will rehabilitate the electricity distribution infrastructure in Lusaka and Copperbelt regions.
ZM-Water Resources Development P114949 2013 50 To assist in realizing the greater contribution of water resources to economic growth and climate resilience. Involves, among other things, scaling up of small scale water resource investments programs in support of community development and livelihood diversification; supporting development of a pipeline of infrastructure investment programs through feasibility studies; strengthening water resource management capacity in the Kafue and Zambezi basins.
ZM: Strengthening Climate Resilience
P127254 2013 33 The development objective of the project is to strengthen the institutional framework for climate resilience in Zambia and improve the adaptive capacity of vulnerable rural communities in the Barotse sub-basin. Considering Zambia’s long-term institutional strengthening needs, the project would be implemented over a six year period, from 2013 to 2019, with subsequent programmatic phases expected.
Zambia Access to Finance for SMEs/ Budget support
2014
30 SME credit: The proposed development objective of the project is to broaden and deepen access to medium- and long-term finance of small and medium enterprises in Zambia, with a view to ultimately contributing to increased productivity and job creation. Budget Support: During this CPS, the Bank will explore, in partnership with other donors, budget support credits that would disburse against agreed milestones. The credits could include policy actions if the Government prepares a strong program of policy reforms that are reflected in the PAF.

71
Project Name Project ID
Fiscal Year
Amount(US$ million
Project Description
Health and Nutrition 2015
40 (with 25 from IDA and rest from trust funds or other sources)
This will be a follow-up intervention to the Malaria Booster Project ( closing 30/06/2013) with focus on improving health systems for service delivery
Budget support 2015 30 Follow-on to 2014 budget support
OPTIONS UNDER DISCUSSIONS WITH THE GOVERNMENT for 2016
Safety net and Nutrition To provide support to the most vulnerable through targeted cash transfers and generate job in rural areas through large scale public work schemes.
Road APL3 The proposed RRMP APL3 would assist Government (RDA and NRFA) with setting up the project offices to manage the roll-out program over about 30,000km of roads, support several of the new asset management contracts and will assist RDA to readjust its structure to properly manage the new contracts.
Sanitation
The Lusaka Sanitation Project would seek to improve sanitation services in Lusaka, and improve the operational and financial performance of LWSC. The project would finance investments in wastewater collection, treatment and disposal and technical assistance to LWSC and MLGH.
Project Name Project ID
Fiscal Year Amt
Participating Countries
Total by Country (US$)
Regional IDA (US$)
National IDA (US$)
Project Description
Regional Agricultural Productivity Program for Southern Africa (RAPPSA)
P094183 2013 90.0 Malawi 30 20.0 10.0 The objective of the proposed operation is to (i) enhance regional specialization in agricultural research; (ii) enhance regional collaboration in agricultural training and dissemination; and (iii) facilitate increased sharing of agricultural information, knowledge and technology across boundaries of participating countries.
Mozambique 30 20.0 10.0
Zambia 30 20.0 10.0
OPTIONS UNDER DISCUSSIONS WITH THE GOVERNMENT
Southern Africa trade and transport facilitation program (SATTFP)
Under discussion
Tanzania, Malawi, Mozambique & Zambia
Is a regional project intended to further facilitate trade integration in the region by contributing to the alleviation of institutional, legal, policy, and road infrastructure constraints along the North-South Corridor (NSC)
Regional DPO
Under discussion
Malawi, Mauritius, Zambia Mozambique, Seychelles
This will help to accelerate the process of economic integration in Malawi, Mauritius, Zambia Mozambique, Seychelles

72
Table 3: World Bank Analytical and Advisory Activities under the Africa Strategy by Fiscal Year
Pillar 1: Poverty and Vulnerability Pillar 2: Competitiveness Foundation: Improving Governance and Strengthening Economic management
2011(Recent completions) Zambia - Reproductive health at a glance Zambia - More jobs and prosperity: what would it take? Based on
the jobs and prosperity - building competitiveness program DeMPA Assessment - Zambia
A tale of two projects : lessons from Malawi and Zambia What is the potential for more copper fabrication in Zambia?
Political economy studies: are they actionable? some lessons from Zambia
The human resources for health crisis in Zambia: an outcome of health worker entry exit, and performance within the national labor health market
Zambia - What would it take for Zambia's beef and dairy industries to achieve their potential?
Zambia's infrastructure : a continental perspective
What would it take for Zambia's tourism industry to achieve its potential?
2012 (Recent completion) Economic impacts of poor sanitation in Africa (Zambia loses ZMK946 billion annually due to poor sanitation)
Resource Allocations and Financial Flows in the Water Sector in Zambia
TA on Access to Information
Policy Research Working Paper on How pro-poor and progressive is social spending in Zambia
World Bank policy note : Enhancing public supply chain management in Zambia
Public Debt Management Reform Plan
Zambia - Health equity and financial protection report Doing business in a more transparent world 2012 - economic profile : Zambia - comparing regulation for domestic firms in 183 economies
Gender Portfolio Review ( input for the CPS) Zambia Infrastructure Linkages to Production and Trade Social Safety Net Review Light Manufacturing in Africa Zambia Poverty Assessment Agriculture Policy Note
2013( underway & planned)
Nutrition Institution capacity building Zambia Economic Update (Bi-annual) Lessons learned from support to informed media
Analytics on HIV Diagnostic Trade Integration study TA to Zambia Mining Sector Governance Reform including EITI
ICT for Health Initiatives Consumer Protection & Financial Literacy Diagnostic Evaluating the use of ICT & community radio to strengthen Governance
Zambia Health Financing Cashew Value Chain TA for a national M&E system Skills and youth employment in Zambia Risk-Based Supervision TA on creation of Public Sector Credit Union Options for Reform for Public Service Pension Scheme
TA on Access to Information

73
Source: Operations portal and input from TTLs
Pillar 1: Poverty and Vulnerability Pillar 2: Competitiveness Foundation: Improving Governance and Strengthening Economic management
Regulation and Supervision Framework for Micro Insurance TA for review of pay policy
Farm blocks Institutional Assessment of the Road Development Agency
Rural Urban Linkages Guidance note on asset disclosure
GPF Snapshots Supporting CSOs’ participation in EITI Zambia
2014(underway & planned) Zambia Health Financing Zambia Economic Update (Bi-annual) Governance Improvement in the Road Sector Socio-Economic Benefits of Performance-based Contracting in the Transport Sector
Enterprise Survey
EITI Initiative
How can human capital be built in Zambia: learning from international experience
Finscope Survey Zambia Mining Sector Governance Reform
Results-based financing impact evaluation Zambezi River Basin Support Program TA Procurement reform World Bank Involvement in Chamber of Mines Study on nation-
wide benefits to the economy from the mining sector Gap analysis of public sector accounting and audit standards
Feasibility study for growth poles TA on strengthening service delivery Updated National Transport Policy TA for national M&E system
Zambia Supply Chain Innovation Political Economy Analysis (PEA) on the demand for good governance
Policy paper writing using data from ZAMMOD (Zambia Macroeconomic Model)
Improvement of statistics and surveys Project Appraisal and Analysis GPF Snapshots
2015 (underway &planned) Peri-Urban Sanitation Improvement Zambia Economic Update (Bi-annual) TA on strengthening service delivery Linking Women and the Private Sector Financial Sector Assessment Program (FSAP) Update TA for e-Government
Pension Reform Zambezi River Basin Support Program Policy paper writing using data from ZAMMOD (Zambia Macroeconomic Model)
Zambia Health Financing Improvement of statistics and surveys
Project Appraisal and Analysis
2016 (planned and options under consideration) Just in time notes Zambia Economic Update (Bi-annual) Improvement of statistics and surveys
Land Policy Legal framework for investment climate reform Technical support on decentralization

74
Annex 11: Active Trust Fund Portfolio As of Date 1/8/2013
Trust Fund # Trust Fund Name Fund Usage Exec. By Grant Sign
Date
Grant Closing Date
End Disb. Date
Net Grant Amount
Funds Disb. to Date
Cash Balance Disb.% National
TF010148Zambia Strengthening Climate Resilience (PPCR Phase II) Bank 7/7/2011 7/30/2020 11/30/2020 491.00 371.33 119.67 76% Zambia
TF010166 Zambia: 10084 Risk Based Supervision TA&AS Bank 7/11/2011 12/30/2012 4/30/2013 376.30 76.75 299.55 20% Zambia
TF010435
Zambia # 10107 Regulatory and Supervisory Framework for Microinsurance and Insurance Intermediaries TA&AS Bank 8/19/2011 12/31/2012 4/30/2013
314.70 138.63 176.0744% Zambia
TF011075
Preparation of the: (i) Zambia: Strengthening Climate Resilience Project (Phase II) and (ii) Strengthening Climate Res ilience in the Kafue Basin Project Recipient 4/19/2012 6/30/2014 12/31/2014
2,000.00 400.00 1,600.00
20% ZambiaTF012542 Zambia HRBF Impact Evaluation Bank 5/14/2012 4/22/2014 8/22/2014 500.00 0.00 150.00 0% Zambia
TF012558Support to Improve Governance in the Road Sector in Zambia TA&AS Bank 6/3/2012 10/30/2013 2/28/2014 381.00 24.88 75.12 7% Zambia
TF013047 EIF Zambia DTIS TA&AS Bank 8/21/2012 8/30/2013 12/30/2013 379.05 57.18 208.16 15% Zambia
TF013171
Incentivizing the Market - Linking Women and the Private Sector: a Human Rights Based Approach TA&AS Bank 9/15/2012 11/30/2014 3/30/2015
125.00 3.39 121.613% Zambia
TF091376ZAMBIA BOOSTER PROGRAM FOR MALARIA CONTROL CF Recipient 2/22/2008 1/31/2013 7/31/2013 6,850.00 5,775.56 1,074.44 84% Zambia
TF092134 Zambia Booster Program for Malaria Control CF Bank 5/8/2008 10/31/2013 10/31/2013 84.00 81.26 2.74 97% Zambia
TF092315Zambia Supervision: Russian Federation grant to the Booster Program for Malaria control in AF TA&AS Recipient 10/21/2008 12/31/2013 6/30/2014
4,500.00 820.38 3,679.6218% Zambia
TF092762GEF FSP - Republic of Zambia: Increased Access to Electricity Services Project TA&AS Bank 9/1/2008 1/31/2013 5/31/2013 1,000.00 958.74 41.26 96% Zambia
TF094423 Zambia HRBF Impact Evaluation TA&AS Recipient 4/18/2012 9/17/2012 3/17/2013 318.68 198.30 120.38 62% Zambia
TF094917 Zambia CF grant supervised by the NetherlandsFiscal Transfers Recipient 8/3/2009 12/31/2011 6/30/2012 60,200.00 60,200.00 0.00 100% Zambia
TF095228
IDF: Zambia-Capacity Buiding for Public Expenditure Tracking(PET) through HIV/AIDS PET Survey TA&AS Recipient 10/16/2009 10/16/2012 4/16/2013
450.60 450.59 0.01100% Zambia
TF095437 Zambia - Support to EITI Implementation TA&AS Recipient 3/10/2010 6/30/2012 12/31/2012 320.00 309.11 10.89 97% ZambiaTF095772 Zambia HRBF Results Based Financing Project CF Recipient 12/30/2010 1/31/2013 7/31/2013 16,760.00 6,032.07 2,967.93 36% Zambia
TF096360
Technical Assistance to Support the Efficiency of Mineral Revenues Collection and Investment in Zambia TA&AS Bank 2/20/2010 10/31/2012 2/28/2013
375.00 367.79 7.2198% Zambia
TF096361 Support to increased accountability TA&AS Bank 3/5/2010 10/31/2013 2/28/2014 492.00 334.70 157.30 68% Zambia
TF096485Zambia: Institutionalizing Livestock Data Collection and Analysis in Zambia TA&AS Recipient 8/16/2010 9/14/2012 3/14/2013 297.90 287.35 10.55 96% Zambia
( Figures in thousands of USD )

75
Active Trust Fund Portfolio (Continued)
Source: e-trust fund portal
Trust Fund # Trust Fund Name Fund Usage Exec. By Grant Sign
Date
Grant Closing Date
End Disb. Date
Net Grant Amount
Funds Disb. to Date
Cash Balance Disb.% National
TF096943Zambia: Pilot Program for Climate Resilience - Phase I Recipient 6/14/2010 9/30/2013 3/31/2014 1,500.00 942.38 557.62 63% Zambia
TF097260EC Grant for the Co-financing of Increased Access to Electricity Services Project CF Recipient 12/13/2010 6/30/2013 12/31/2013 12,435.46 1,445.56 983.32 12% Zambia
TF097552Extension of Kasanka Management System to Lavushi Manda National Park Recipient 11/17/2010 7/30/2013 1/31/2014 835.00 522.79 312.21 63% Zambia
TF097817 Zambia PPCR Bank 8/13/2010 9/30/2013 1/31/2014 280.95 130.10 87.56 46% ZambiaTF097982 READ Zambia II TA&AS Bank 9/25/2010 12/31/2012 4/30/2013 2,113.50 1,284.07 829.43 61% Zambia
TF099158Support to Increase Demand for Good Governance in Zambia TA&AS Bank 2/15/2011 10/31/2013 2/28/2014 652.00 431.85 104.15 66% Zambia
TF099384 Zambia HRBF-Supervision and Monitoring TA&AS Bank 3/28/2011 1/31/2013 5/31/2013 350.00 326.60 48.43 93% ZambiaTotal 27 114,382.14 81,971.36 13,745.23 72%
Trust Fund # Trust Fund Name Fund Usage Exec. By Grant Sign
Date
Grant Closing Date
End Disb. Date
Net Grant Amount
Funds Disb. to Date
Cash Balance Disb.% Global &
Regional
TF054664EXTRACTIVE INDUSTRIES TRANSPARENCY INITIATIVE - CHILD TF TA&AS Bank 1/24/2005 2/28/2016 6/30/2016 9,897.19 6,203.85 3,699.05 63% Global
TF056242PPIAF MDTF II - MULTI-DONOR CORE ACTIVITIES TA&AS Bank 2/1/2006 12/31/2012 4/30/2013 28,942.34 27,893.58 1,104.28 96% Global
TF090446BANK EX.SUPPORT FOR EITI IN COUNTRY IMPLEMENTATION TA&AS Bank 6/9/2007 2/28/2016 6/30/2016 8,000.00 7,765.40 234.60 97% Global
TF092246 AFRICA CORE MDTF TA&AS Bank 6/1/2008 3/31/2013 3/31/2013 16,124.69 13,386.57 2,738.12 83% GlobalTF093589 NEW GLOBAL CORE MDTF (AFR) TA&AS Bank 1/12/2009 7/30/2015 11/30/2015 14,410.64 9,452.01 4,958.63 66% GlobalTF093705 SDC EAST AND SOUTHERN AFRICA TA&AS Bank 1/28/2009 12/31/2012 4/30/2013 1,470.60 1,468.83 1.77 100% GlobalTF093895 MTDS TA&AS Bank 2/18/2009 12/31/2012 4/30/2013 1,990.00 1,723.78 266.22 87% GlobalTF093900 DEMPA TA&AS Bank 2/12/2009 12/31/2012 4/30/2013 3,590.00 3,058.45 543.46 85% GlobalTF095612 NTF Knowledge and Learning TA&AS Bank 10/29/2009 11/15/2014 3/15/2015 700.00 617.63 82.37 88% Global
TF098867
BNPP-GROWTH AND EQUITY: Improving Financial Literacy & Consumer Protection in Low Income Countries TA&AS Bank 1/12/2011 5/31/2013 9/30/2013
559.99 456.34 103.6681% Global
TF092183GEF MSP - OPEN AFRICA NORTH SOUTH TOURISM CORRIDOR (OANSTC) TA&AS Recipient 5/31/2008 5/31/2012 11/30/2012 540.00 534.78 5.22 99% Regional
TF011505BNPP-GENDER EQUALITY: Gender and Agriculture Bank 12/16/2011 12/16/2013 4/16/2014 675.00 84.19 265.81 12% Regional
TF011577 Zambezi River Basin Support Program TA&AS Bank 1/12/2012 11/1/2013 3/1/2014 950.00 257.95 692.05 27% Regional TF052640 SSATP COMPREHENSIVE SUPPORT TA&AS Bank 12/10/2003 12/31/9999 12/31/9999 13,921.63 13,177.64 92.16 95% Regional
TF055007CITIES ALLIANCE-AFRICA:CITIES WITHOUT SLUMS FACILITY TA&AS Bank 4/15/2005 12/31/9999 12/31/9999 1,608.01 1,399.96 208.05 87% Regional
TF056377NORWEGIAN POST-PRIMARY EDUCATION TRUST FUND TA&AS Bank 2/27/2006 12/31/2012 4/30/2013 17,974.16 13,156.96 466.41 73% Regional
TF097527 CAADP MDTF CTF for COMESA Recipient 8/27/2010 12/31/2013 6/30/2014 4,500.00 3,115.01 1,384.99 69% Regional TF099857 Nyika Transfrontier Conservation Area Project Recipient 11/2/2011 6/30/2016 12/31/2016 2,280.00 591.44 1,688.56 26% Regional
TF099858Sustainable management of Nyika Transfrontier Conservation Area Project Recipient 11/14/2011 6/30/2016 12/31/2016 2,540.00 571.53 1,968.47 23% Regional
Total 19 130,674.25 104,915.90 20,503.88 80%
TA & AS= Technical Assistance & Advisory Services(Bank Executed); CF= co-financingNote: It is difficult to give the specific amount of the grant to Zambia from the Global and Regional Trust funds were Zambia is a beneficiary

76
Annex 12: Zambia: IFC Investment Operations Program
2010 2011 2012 2013*
Original Commitments (US$m)
IFC and Participants
41.05 1.70 31.85 1.16
IFC's Own Accounts only
41.05 1.70 31.85 1.16
Original Commitments by Sector (%)- IFC Accounts only AGRICULTURE AND FORESTRY
17.05
FINANCE & INSURANCE
61.02 100 5.82 100
FOOD & BEVERAGES
94.18 OIL, GAS AND MINING
21.92
Total
99.99 100 100 100
Original Commitments by Investment Instrument (%) - IFC Accounts only
Equity
21.92 43.18
Guarantee
0.12 56.82 5.82 100
Loan
77.95
94.18
Total
99.99 100 100 0
* Data as of January 01,2013
Committed and Disbursed Outstanding Investment Portfolio As of 12/31/2012
(In USD Millions)
Committed Disbursed Outstanding
FY Approval Company Loan
Equity
**Quasi Equity
*GT/RM
Partici pant Loan
Equity
**Quasi Equity
*GT/RM
Partici
pant
2010 Access Zambia 0 0.75 0 0 0 0 0.75 0 0 0
2007 Aef protea hotel 0.45 0 0 0 0 0.45 0 0 0 0
2008 Madison group 2.24 2.00 0 0 0 2.24 2 0 0 0
2010/12 Zambeef 35.28 0 0 0 0 35.28 0 0 0 0
2010 Zanaco 25 0 0 0 0 25 0 0 0 0
Total Portfolio: 62.97 2.75 0 0 0 62.97 2.75 0 0 0
* Denotes Guarantee and Risk Management Products. ** Quasi Equity includes both loan and equity types.
Source: BW CAS Annexes

77
Annex 13: Copper in Zambia A bifurcated history
The history of Zambia’s copper mining is one of decline under State ownership followed by revival. From a production level of around 700,000 tons in the early 1970s when the industry was in the private sector, copper production under state ownership gradually fell to just 255,000 tons in 1998-2000. Although stakeholders did perceive some benefit from state-ownership of the mining industry, in overall terms nationalization of the mines proved to be counter-productive. When the reversal of state-ownership began to occur in the early 2000s, the industry was loss-making (financial losses of almost US$1 million/day) and suffering from little or no investment and ever-declining output. Since that period, mining in Zambia has rebounded greatly though the industry’s potential to contribute to poverty reduction remains underutilized (Box 1). Several new international and domestic companies entered the industry. Buoyed by high copper prices over this period, and an attractive investment climate, Zambia saw FDI flows estimated at US$5 billion over this period, both in greenfield sites and in expansion of existing operations. As a result, output is now at the 800,000 metric tons (m/t) mark, expected to grow to around 1.3 million m/t by 2015 (which would place Zambia among the top 5-6 producers globally). This growth has resulted in jobs with large-scale mining operations now accounting for over 60,000 people in direct employment (with almost as many engaged in smaller or artisanal mining). Overall, mining now accounts for around 10% of Zambia’s GDP.
Box 1: Mining and Job Creation Despite the large copper production the country has yet to benefit fully from the industry. Part of the reason for this is historical. It is widely accepted that the nationalization of the mines during the 1970s led to under-investment, falling output and financial losses to the stage where the industry became a major drain on the exchequer (World Bank 2011e). After privatization, in the 2000s, the immediate policy priority was to stabilize the sector. Rising commodity prices and an enabling environment led to higher investment and copper output revived significantly. Output is now stated to be at the 800,000 metric tons (m/t) mark, and is expected to grow to around 1.3 million m/t by 2015 (placing Zambia among the top 5-6 producers globally). The mining sector, however, has not so far provided much for needed investment in infrastructure and human development though the contribution of the sector towards Government revenues is increasing. During the period 2008-11, mining revenues averaged around 2.6 percent of GDP, a sharp increase from the previous range of 1-1.4 percent of GDP. One factor behind the past low contribution was the investment incentives then prevailing and the overhang of accumulated income tax losses within the mining companies. Further, copper mining is capital-intensive and employs only about 2 percent of the population. It has also not provided the backward and forward linkages for development of local industry. To this day mining companies’ source 95 percent of their inputs (such as capital plant, operating consumables, engineering inputs, safety equipment) for mining operations from overseas.
The rebound in Zambia’s mining sector over the past decade and the continuing strong
investment flows in the sector have underpinned Zambia’s macro-economic performance in recent years - and it’s attaining of lower middle-income status in 2011. Indeed, mining has been a key factor in Zambia’s recent GDP growth story. Notwithstanding this, Zambia’s poverty levels remain stubbornly high and the benefits of mining not seen as having had much impact yet on Zambia’s broader development goals. Indeed, deep-seated concerns about mining remain, in particular the sense that the benefits of the mining boom have not been widely or fairly shared; that mining revenues have not made a dent in Zambia’s human development; and that the environmental and social costs of mining are not fully factored -in nor regulated effectively. On the latter, there are legacy concerns from old mining operations yet to be fully addressed, while the growing extent of exploration and extraction activities in new minerals like uranium require an even more effective set

78
of regulations and enforcement capacity. Similarly there are misgivings among many about perceived low level of tax payments by companies (seen as resulting from overly-generous mining development agreements and of inadequate oversight by Government of mining operations and production and in ensuring effective tax compliance).
Further, there are two overarching factors that are relevant: One is that Zambia’s
regulatory regime for mining (and its key linkages - fiscal, environment and social) has not kept pace with the structure and size of the sector. Zambia’s current regulatory structure and capacity was designed to oversee a single state-owned mining company. But today Zambia has a private sector-led industry, comprising many large and small mining operations and ever-growing exploration activity, including by some of the largest global mining companies. The second factor is the need for effective strategies for broad-based development anchored on mining – infrastructure, value-addition and small business development – to help turn “enclave” mining projects into sustainable development in mining districts - and the institutions and mechanisms to achieve these goals.
Promoting transparency and community engagement, building on Zambia Extractive Industries Transparency Initiative process (EITI): The Extractive Industries Transparency Initiative, launched in 2003, is the leading standard for promoting transparency and accountability in resource rich countries. It is also a global coalition of resource rich developing countries, donors, major companies, civil society groups, and investors. Countries implementing EITI commit to publishing all payments made by oil, gas, and mining companies to government, and all revenues received by the government from those companies. EITI implementers also commit to closely involving civil society in the design and monitoring of the EITI process. Zambia is actively implementing the global EITI standard and has an effective multi-stakeholder process for this.
On the plus side, The EITI Board declared Zambia compliant with the EITI standard on September 19, 2012. Zambia becomes the 15th EITI compliant country and the first in the East, Central and Southern Africa region. EITI compliance means that the country has an effective process for annual disclosure and reconciliation of all revenues from its extractive sector, allowing citizens to see how much their country receives from oil, gas and mining companies. EITI compliance is a basic platform that encourages the transparency necessary for Zambians to be able to agree how best to better manage the mining sector. Further, EITI helps in addressing the gender dimensions of mining especially in artisanal mining and community development initiatives, linked to mining companies’ corporate social responsibility (CSR) commitments in mining districts. The Opportunity Ahead
Zambia’s mineral wealth represents an important opportunity for the Government and people of Zambia to generate financial resources (albeit in a volatile commodity price environment) which enables investment in human and infrastructure development and in diversifying the economy over time - in order to help create jobs, raise incomes and reduce poverty. This path of resource-based development is being successfully charted by a number of countries who have created the needed laws, policies and effective institutions to achieve their national goals, while avoiding the so-called “resource curse” that has often been associated with extractive resources.
Accordingly, the WBG strategy for engaging with GRZ and stakeholders on mining, emphasizes a broad-based approach, built around the WBG’s convening role and knowledge-sharing. The specific WBG interventions under this strategy (as detailed elsewhere in this CPS

79
document) include bringing together policy-makers and stakeholders and linking them to global best practice (for example in facilitating a public-private process of increasing local content of mining inputs as a means for job creation and expanding the benefits of mining more widely). Also a priority is analytical support and technical assistance (in partnership with development partners), such as that for the Zambia Extractive Industries Transparency Initiative (ZEITI) and ongoing improvements in license cadaster systems and capacity to monitor mining operations and production.
Beyond that is the potential for financing support for GRZ’s overarching strategies to achieve a well-governed and environmentally-sustainable mining sector, including (i) continued clean-up on legacy environmental contamination in now-closed mining sites while solidifying the regulatory framework for mining-related environmental protection; (ii) developing an integrated approach across GRZ for mining and its key linkages (fiscal, infrastructure, environment and social, skills and business development), especially to help move from “enclave” mining towards a wider pattern of development, jobs and incomes anchored on mining projects; and (iii) building institutions and capabilities fit for a new era of mining in Zambia (with more private-sector participants and exploration interest than ever) - and which helps achieve national aspirations for a well-governed mining sector, with greater Zambian participation, which delivers widely-shared benefits and sustainable development over the long haul.
The Economic Contribution of Zambian Copper Mining is Key: Over the long term, the
performance of the Zambian economy has closely followed the fortunes of copper mining. Research has well-documented that the decline of copper output after the 1970s set the stage for a period of low economic growth with falling per capita GDP. The revival of copper output has helped the economy to grow more rapidly, averaging growth of over 6 percent a year during the 2000s. Nonetheless, there is the opportunity to advance even further while also managing volatility risks of a mineral- dependent economy.
How Zambia uses its mineral wealth to reduce poverty and improve its development prospects is therefore the key development challenge ahead. An adequate base of domestic taxation is of fundamental importance for sustainable development. In order for developing countries to escape aid dependency and reduce poverty more broadly, it is imperative that their revenue authorities are able to collect tax effectively. Zambia is a case in point, with its major multinational mining companies with huge investments supporting large operations in its mines. Unfortunately doubts remain on the state’s revenue collection ability and whether all the mining revenues that are due are in fact collected. In any case, it is perceived that the revenues collected from these operations have so far had minimal impact on the economic development of the poor Zambians measured by static poverty indicators. Although mining revenues are growing, so far the mining industry’s contribution to government revenues is yet to translate into pro-poor economic development and the majority of the people still live in poverty particularly in rural areas. This is the fundamental challenge – and opportunity – that the mineral sector affords to Zambia, through a long-term effort to harness the nation’s below-the-ground wealth into financial resources that enables sustained development, growth and poverty reduction.

80
Annex 14: Regional Projects and Programs
As a landlocked country, Zambia’s economic development potential is closely linked to the fate and development of its eight bordering countries and other countries in the region. Through its membership in the Common Market for Eastern and Southern Africa (COMESA) and Southern Africa Development Community (SADC), Zambia recognizes the importance of regional integration to the development of the country’s economic infrastructure and to boosting intra-regional trade and global competitiveness. The two trade blocs have supported liberalization of market access for international road freight and harmonization of rules to ensure interoperability in member states (MCA 2010). The World Bank has provided support for Zambia’s integration in the region through projects in several critical sectors and programs. 1. Regional Projects
Energy: Access to energy is critical for socio-economic development. Energy underpins the provision of clean water, health services, education and communication. It is obvious that efficient and clean energy supplies are needed to fuel Africa’s development and fight against poverty. Yet the proportion of its people still dependent on traditional, inefficient and polluting energy sources is higher than on any other continent (World Energy Council 2005).1
As a member of the Southern African Power pool (SAPP), Zambia has a great potential
to play a pivotal role in the regional power market by increasing its power generation capacity and transmission infrastructure including regional interconnectors. The growing demand for electricity at both domestic and regional levels, and the regional power shortages in the foreseeable future provide a solid market for any additional electricity supply that can be offered. To make trade expansion possible, significant additional investments would be required within SAPP and the heaviest transmission investments would need to be made in Zambia (7,526 MW), the Democratic Republic of Congo (5,984 MW), and Zimbabwe (3,072 MW). These three countries have the onus of developing 70 percent of the total required interconnection capacity for the power pool (World Bank 2011).2 Therefore regional interconnectors such as the Zimbabwe-Zambia-Botswana-Namibia and the Zambia-Tanzania-Kenya interconnectors could help Zambia become a regional hub for power trade in southern and eastern Africa.
Ongoing interventions on regional integration in Zambia have mostly been in the Energy sector. In 2004, the Bank approved the Southern Africa Power project for US$ 560.7 million between Zambia and DRC (a total of US$ 1.1 for Zambia, closing FY16) to facilitate further development of an efficient power market in the SADC region. In 2012 the Zambia Kafue- Town-Muzuma-Victoria Falls Regional Transmission Line Reinforcement project was approved for a total of US$ 60 million. This is meant to improve electricity availability and reliability of supply by supporting the reinforcement of the existing transmission network, increasing ZESCO’s power transfer capacity to the southern part of the country and reducing the high level of technical losses in the network.
1 World Energy Council (2005), Regional Energy Integration in Africa, A Report of the World Energy Council, United Kingdom. 2 The World Bank, 2011, The SADC’s Infrastructure- a regional perspective. Policy research working paper

81
Agriculture: As part of the World Bank’s support to agricultural research and development in the region, an Agricultural Productivity Program for Southern Africa (APPSA) is being prepared. It involves Malawi, Mozambique and Zambia for a total of US$ 90 million (US$ 30 million per country, approval FY13). The project is expected to strengthen regional approaches to agricultural technology generation and dissemination by establishing regional centers of research leadership (RCoLs) on programs of regional importance. Under APPSA countries would work together in a number of different ways: (i) by undertaking joint technology generation, dissemination, and training activities; (ii) by coordinating their respective national activities to achieve a shared regional objective; and (iii) by sharing knowledge and technological outputs from their national programs throughout the region. To the extent possible, APPSA implementation will rely on existing regional platforms, networks, and partnerships to share information and create opportunities for collaboration.
Environment and Natural Resource Management: The Regional Sustainable Management of Nyika Transfrontier Conservation Area project being jointly implemented with Malawi is financed by two regional trust funds. It is expected to contribute to sustainable management of biodiversity in the conservation area while strengthening the ability of community members living in the Chama district to enter the economic mainstream by leveraging tourism opportunities and improve farming practices through conservation farming.
2. Regional Programs
Water Resource Management: The Bank is supporting the implementation of the Zambezi River Basin Development Program to be financed through the Multi-Donor Trust Fund for Cooperation in International Waters in Africa (CIWA). This program will finance a series of activities in the Zambezi River basin over 10 to 15 years to support the objectives of the Zambezi Watercourse Commission (ZAMCOM) Agreement, promoting equitable and reasonable utilization of the water resources of the Zambezi as well as the efficient management and sustainable development thereof. The program is envisaged as a series of three potential projects. The first project is designed to provide support over three years under six component that include three supporting the Zambezi Watercourse Commission, two supporting the Zambezi River Authority and a Bank executed analytical component using a programmatic approach aligned to the overall objectives of the project.
Transport Policy: The Sub-Saharan Africa Transport Policy Program (SSATP). Zambia
is among six countries that are participating in the SSATP's Transport Sector Policy Performance Review. The extent of transport sector policy reforms undertaken by African governments and regional economic communities in the last two decades has been significant. The reforms have focused on aspects aimed at enhancing transport sector impact, efficiency, and sustainability and included the integration of transport policy and national economic growth and poverty reduction policies; setting up road funds; creating road management agencies; concessioning railway operations; liberalizing port operations and concessioning container terminals; setting up one-stop border post operations; and harmonization of regional and national transport regulations. These policy reforms, championed by the SSATP, have led to improved infrastructure and related services. Due to the continuing global and regional changes, which place peculiar challenges to transport infrastructure and services, it has been found expedient to review the transport sector policy performance in Africa by assessing in detail how some countries performed. The first phase of six countries will be followed by a second phase that will assess the performance of twelve other

82
countries. The objectives of the review is to demonstrate and advocate the contribution of transport to economic growth and poverty reduction, identify and propagate good practice, identify potential solutions for sustaining monitoring systems and to meet specific national and regional demands. Zambia was selected together with five other countries (Ethiopia, Ghana, Burkina Faso, Gabon and Benin) for the review. The outcome would inform SSATP's future dialogue with the countries and also help countries identify specific sector policy adjustments. The work will be funded entirely through SSATP.
Road Safety: Zambia will be part of the ongoing SSATP’s activities aimed at assisting
countries achieve the UN Decade of Action for road safety through the adoption of the African Road Safety Action Plan 2011-2020. Worldwide, the number of people killed in road traffic crashes each year is estimated at almost 1.2 million, while the number injured could be as high as 50 million. Road crashes are estimated to cost between 1 and 3% of GDP worldwide, and in Sub Saharan Africa, they amount to about US$10 billion per year, more than the sum of all Official Development Aid (ODA) dedicated to Infrastructure. Overall, Africa has fatality rates per capita higher than those of other regions and rates per vehicles are even more out of line, by a factor of 10 or up to 100, when compared to those of well performing economies. Africa road crash casualties are estimated to be around 322,000 per year, and with no change in performance, they are forecast to grow to 540,000. SSATP member countries recognize the need for action and have proclaimed their support to the UN Decade of Action for Road Safety 2011-2020, which aims at stabilizing and then reducing the number of road fatalities before 2020. In 2011, UNECA facilitated the preparation of a joint African Action Plan for the Decade of Action, which would guide national authorities to prepare their own country specific action plans. In recognition of the demand for road safety improvements, and to support the above initiatives, the SSATP has created the Road Safety Program to facilitate the development of sound road safety policies, institutional reforms and road safety pilot programs in its member states. The Road Safety Program is a cross-cutting issue in SSATP Development Program 2 (DP2) whose objectives are to support the: (i) establishment of road safety lead agencies in countries where none exist; (ii) preparation of country specific road safety action plans where none exist; and (iii) identification of high-impact road safety policy and practical interventions. The program will be funded out of SSATP resources.
Transport Sector Data Management and improving M&E functions: Zambia will benefit from SSATP's ongoing collaboration with member countries on data management and M&E. Management of transport sector data in Africa still remains a major challenge and one of the results of this shortcoming is weak M&E systems. Data collection is not well harmonized across countries and this hampers comparability of achievements. The lack of standardized reliable data, particularly in transport, is a critical limitation to policy modernization and large-scale infrastructure investment. It limits sector analysis and gap identification, and it impedes economic and financial packaging of large bankable investment programs. The Africa Infrastructure Country Diagnostic (AICD) addressed these issues. This study of the infrastructure in Africa was launched as a result of the 2005 G-8 Summit at Gleneagles, to collect detailed economic and technical data in the infrastructure sectors in Africa— especially transport—while at the same time building a sustainable knowledge instrument and delivering it for management by African development institutions. The study was commissioned by the Infrastructure Consortium for Africa (ICA), and implemented by the World Bank on behalf of a steering committee representing the AU, New Partnership for Africa’s Development (NEPAD), Regional Economic Communities (RECs), the AfDB and major infrastructure donors. SSATP will continue to provide technical support on transport data collection and analysis to the Africa Infrastructure Knowledge Program (AIKP), the Africa Infrastructure

83
Knowledge Partnership— located in the African Development Bank—an offshoot of the AICD study.
In Zambia, some stakeholders— such as the Common Market for Eastern and Southern Africa (COMESA) and the Zambia Institute for Policy Analysis and Research (ZIPAR)—have sought partnership with SSATP to enhance their data management capacities. There will be growing demand for these services— and AIKP and SSATP will organize their cooperation for best synergy. Some initial capacity building work has already started in Zambia, at the Ministry responsible for Transport. A national institutional capacity assessment has already been carried out and it proposes new institutional arrangements for data management systems as well as development of a sustainable implementation plan. It also provided advice on the initial systems set up and prepared a TOR for the next phase. Some of the costs of this initiative, especially capacity building in M&E would be co-funded from the ongoing IDA transport project.
Governance in Transport: Zambia, together with Kenya and Cameroon, will participate as a pilot country in which tools for assessing sector governance will be refined. Good governance is a concern to transport sector policy makers and stakeholders. The sector has a major contribution to make towards poverty reduction and economic growth and billions of dollars have been spent on improving and rehabilitating transport infrastructure. However, despite this considerable investment and much associated effort to build supportive technical, financial and management capability, performance continues to lag behind expectation. “Poor governance” is often cited as an underlying reason, the concept encompassing a range of shortcomings from weak leadership to outright corruption. Several studies have also shown that the quality of governance significantly affects the quality of public transport infrastructure and unit costs of works. A study carried out by SSATP in 2011 on selected countries in Africa proposed a set of ten indicators that could be used to assess country performance on governance in the sector. SSATP wishes to implement the report’s recommendations and discussions are ongoing to obtain funding from such sources as the Governance Partnership Facility (GPF). The objective of the next immediate activity would be to: (a) refine indicators and scoring system based on feedback; (b) score the three pilot countries; (c) formalize scoring methodology and guidance; (d) develop a simple methodology for institutional mapping; (e) prepare briefing papers and communication tools for roll-out; and (f) conduct a robust impact assessment to evaluate changes in governance scores as they relate to transport sector performance improvement.

84
Annex 15: Client Survey and CPS consultations
CPS Consultations World Bank Client Survey On March 29, 2012 the World Bank officially launched the consultation process for the Zambia Country Partnership Strategy (CPS) in Lusaka. This was officially launched by the Vice President of the Republic of Zambia, Dr. Guy Scott. From March to October 2012 the World Bank consulted with stakeholders in Lusaka, the Copperbelt, and Solwezi. The stakeholders included: government officials, civil society organizations, NGOs, academia, private sector, youth, traditional leaders and other cooperating partners. Agriculture was emphasized as the most important sector for support from the Bank throughout the consultation process. Not only was agriculture described as the major engine of economic growth it was noted that the sector directly improves the livelihood of the majority of Zambians because of its ability to employ a large number of people.
In May and June 2012, 553 stakeholders of the World Bank in Zambia were invited to provide their opinions on the Bank’s assistance to the country by participating in a country survey. Participants in the survey were drawn from among the offices of the President, Ministers, Parliamentarians, ministerial departments, consultants/contractors working on World Bank supported projects/programs, project management units (PMUs), local government officials, bilateral and multilateral agencies, private sector organizations, the financial sector, NGOs, community- based organizations, the media, trade unions, faith-based groups, academia, research institutes, the judiciary branch, and local citizens. A total of 312 stakeholders participated in the country survey (56 percent).
In developing the CPS further the consultations were taken on a much more technical level with the government in order to develop a CPS that represents the countries development priorities. The government emphasized that the strategy should have projects that support investment in rural areas to increase employment and reduce poverty. The government stakeholders also noted that the CPS should carry on some of the programs from the CAS with focus towards infrastructure (energy & health), agriculture and education sector. In addition, they also noted that there is need for a deliberate effort to foster a competitive mind-set among citizens with change in belief and attitudes by stakeholders, confidence and belief in the private sector. The youth representatives highlighted concrete steps that need to be taken to ensure that there is real and sustained investment in supporting the development of, and creation of jobs for young people in Zambia. The representatives identified key growth areas and among these was agriculture. They also encouraged the Bank to offer support on access to finance and financial literacy advancement among the youth. Civil society organizations observed that the Bank has been a consistent development partner for Zambia and urged the institution to keep four issues in mind as it moves forward with the preparation of the new CPS: the World
The purpose of the client survey was to assist the World Bank in gaining a better understanding of how stakeholders in Zambia perceive the Bank; obtain systematic feedback from stakeholders regarding: the general environment in Zambia; their perceived overall value of the World Bank in Zambia; overall impressions of the World Bank as related to poverty reduction, personal relationships, effectiveness, knowledge base, collaboration, and day-to-day business operations; perceptions of the World Bank’s future role in Zambia; and perceptions of the World Bank’s communication and outreach in Zambia. The survey revealed that in a number of areas, perceptions of the Bank’s work and effectiveness have improved since the FY 07 Country Survey. At the same time there are areas of opportunity for the Bank in terms of its emphasis, future focus, outreach, knowledge and results. The survey also revealed that the development priorities of stakeholders in Zambia appear to have shifted since the last FY 07 Country Survey. Whereas then, HIV/AIDS, education and governance were identified as top priorities, the agriculture and rural sectors are now of particular importance in terms of poverty reduction and growth, as are education and job creation. The stakeholders would like to see the Bank focus its resources primarily in the agriculture sector, infrastructure development and education. Poverty

85
Bank should be proactive in bettering the lives of the poor even though Zambia has been re-classified as a lower middle income country; it should support diversification of the economy; it should support the country’s agenda for job creation; and it should increase interaction and consultation with civil society. Private sector representatives from the mining sector noted the difficult business environment due to high taxation, loyalties, duties, statutory instruments that are not favorable. They emphasized the importance of consistent policy messages from the Government in influencing the business environment. The representatives also looked at promoting private sector and SME development to create jobs. They recommended that the Bank should use its global knowledge to advise the government on policies that will help to achieve these.
reduction emerged as an area for greater Bank emphasis, and a top development priority. The survey rated World Bank’s overall effectiveness as 6 on a 10 point scale. Respondents in 2012 gave significantly higher ratings for Bank’s effectiveness in poverty reduction, gender, health and public sector reform compared to respondents in the 2007 and 2004 surveys. However, the World Bank has significantly lower ratings in comparison to earlier years for effectiveness at anti-corruption, law and justice, basic infrastructure, domestic private sector development and social protection. Respondents in 2012 also had significantly higher levels of agreement that the Bank plays a relevant role in Zambia’s development, that the programs and strategies the Bank supports are realistic for Zambia, and that the Bank treats clients and stakeholders in Zambia with respect compared to respondents in the 2007 and 2004 surveys. Respondents indicated that the Bank’s greatest weakness in its work in Zambia was being too influenced by developed countries. Other weaknesses noted were: the Bank was too bureaucratic in its operational policies and procedures; it imposed technocratic solutions without regard to political realities; and it did not collaborate enough with non-state actors. Nearly half of all respondents indicated that the World Bank should reduce the complexity of obtaining financing to make itself of greater value in Zambia and nearly 40 percent noted that the Bank should improve the quality of its experts as related to Zambia’s specific challenges. Respondents also indicated that the World Bank should work more closely with local governments, the private sector, NGOs and beneficiaries to ensure better development results in Zambia. The survey revealed that the stakeholders have mixed views on the Bank’s knowledge and the majority identifies financial resources as the Bank’s greatest value. The stakeholder’s views of the Bank’s collaboration with the government and with other donors have improved profoundly sine the FY07 survey.

86
Annex 16: Gender Integration in Projects
The integration of gender objectives and indicators into the CPS and its results framework is one of the most effective ways to maximize the accountability of the Bank for achieving gender outcomes and the ability to highlight and learn from these outcomes. The integration of gender into the CPS is in line with the World Bank’s current corporate strategy on gender integration. The inclusion of gender as a specific theme of the recent IDA16 replenishment has resulted in a push to integrate gender into all CPSs.
A gender portfolio review was conducted for Zambia to feed into the new CPS mainly focusing on the 8 on-going IDA projects3. The review found that 100 percent of the IDA portfolio is gender informed in at least one of the following dimensions: (1) analysis; (2) actions; (3) M&E. Health and agriculture projects however, had better gender integration compared to the others. With 100 percent of IDA projects rated as gender informed, the portfolio is currently above the IDA16 target of 60 percent. The assessment also found that overall, the portfolio is supporting among others the following gender related outcomes: improved health (including maternal health) for urban and rural women; increased access to basic social services and infrastructure for rural and urban women (including gender-sensitive sanitation, water, and roads); improved knowledge of the gender dimensions of poverty in Zambia and of the gender-related benefits of malaria interventions; improved agricultural productivity, market access for female smallholder farmers; improved responsiveness /accountability of governance to both women and men. However, challenges still remain, particularly with regard to reducing maternal mortality, improving access to safe water and sanitation, reducing gender inequalities in secondary education, improving women’s access to agricultural inputs and providing other avenues that can allow women to better benefit from economic growth that has in the past tended to be weak in terms of job creation.
The vision of the 2013-CPS is to maintain the current level of 100 percent of IDA projects in the country portfolio rated as gender informed and to further strengthen gender integration for Trust Fund and AAA. The CPS will further deepen attention to gender to go beyond the simple fulfillment of the IDA16 target, especially by focusing on improvements in four key areas: (1) increasing attention to gender in M&E frameworks; (2) increasing the integration of gender into current AAA work; (3) increasing the proportion of operations that use existing gender diagnostics and analytical work to inform their design; (4) improving the integration of gender in infrastructure work to ensure women’s greater participation and greater share in sector benefits. The Irrigation Development and Support Project that was approved in FY11 took into account many of these aspects (see Box below).
3 The focus of the review is on IDA because the World Bank’s corporate targets and guidelines on the integration of gender are specific to IDA projects (i.e. not including AAA or Trust Funds).

87
Box: Gender and the Irrigation Development and Support Project The project was informed by a substantial amount of analytical work in gender and agriculture including: the Gender in Agriculture Sourcebook, the TF ESSD Gender support project; and the Gender Action Plan-funded study on the Role of Gender in Irrigation Development. While the project indicates that the latter of these informed the design of the M&E system, the current results framework does not include any sex-disaggregated indicators beyond the obligatory project beneficiaries disaggregated by sex. However, discussions with the project task team indicate that the project does intend to sex-disaggregate many of the indicators currently listed in the results-framework. Additionally, there will be a gender dimension to the user satisfaction and impact assessments, which should generate interesting results on the gender-distribution of project benefits. The project has also been informed from a gender perspective by an Institutional assessment of the Ministry of Agriculture and Cooperatives and by continuous focus group discussions, which led to the creation of mechanisms to improve women’s access to potential benefits. The project has also benefited from additional trust fund financing via the Nordic Trust Fund (OPCS) for a study on women’s land ownership and compensation to investigate the impact of different land ownership practices on the ability of women to benefit from the ISDP’s objectives. IDSP is aiming for a minimum quota of one third of beneficiaries to be women and the project’s actions specifically target women farmers and entrepreneurs in a number of ways: (1) there is a special window under the Investment Support Fund (ISF) for women and other vulnerable groups to support investments including in job and business skills training and in developing women’s business plans, and the project will encourage women to take advantage of this window via social marketing campaigns; (2) the project plans to use a participatory approach to land use planning and to ensure equal access of men and women to irrigated land; (3) women will have preferential access to group and individual training events. In terms of specific mechanisms for ensuring effective female participation in the project, a project-specific gender action plan was developed. This includes, inter alia, a requirement for gender competency and expertise to be included in the TORs for community mobilization. Significantly, men in project sites have also been sensitized to the emerging issues – the inclusion of men in gender mainstreaming efforts is often overlooked, so it is encouraging to see this avenue being pursued by the project. Men’s active engagement in gender issues on the project is reflected in the assertion by men during a men’s focus group session on the importance of including women in the project’s decision making processes. Source: Gender Portfolio Review 2012

88
Annex 17: Summary of Performance Indicator Ratings, 2008 and 2012 (draft) PEFA Assessments
PFA: BUDGET CREDIBILITY Score 2008 PEFA
Score 2012 PEFA
Performance changes
PI-1/M1 Aggregate expenditure out-turn compared to original approved budget
B C Lower predictability (actual versus budget)
PI-2/ M1 Composition of expenditure out-turn compared to original approved budget
D D+(i)D (ii) 0 Indicator revised and 2008 score not directly comparable. High variance, broadly unchanged
PI-3/ M1 Aggregate revenue out-turn compared to original approved budget
A B Very marginal decline in performance (-5.5 %) in 2010 n
PI-4/ M1 Stock and monitoring of expenditure payment arrears
B+ C+ (i) C (ii) A
Performance appears to have diminished, with end-year stock of payments arrears increasing sharply to 4.3 percent of primary expenditure in 2011 from 1.8 percent in 2009, particularly in the areas of Personnel Emoluments, Recurrent Departmental Charges and utility bills. These figures exclude pension arrears, data on which have not yet been provided to the team.
B. KEY CROSS-CUTTING ISSUES: Comprehensiveness and Transparency
Score 2008 PEFA
Score 2012 PEFA
Performance changes
PI-5/ M1 Classification of the budget A B
No change in performance; the rating in the 2008 assessment appears too high. The classification system indicates the purpose of expenditure, but in a non-transparent way.
PI-6/ M1 Comprehensiveness of information included in budget documentation
B C
Four out of the nine benchmarks are met. The 7th benchmark is not met, as only revised revenue outturns are shown. The reason for the change in ratings may be the preparation of the budget earlier in the year, at which time revised expenditure estimates, may not be available.
PI-7/ M1 Extent of unreported government operations B+
To be scored The accessibility of budget reporting has improved with the introduction of a Financial Report narrative summary, which makes budget performance more easily understood. Information is awaited on the situation in 2011; the Financial Report for 2011 had not been finalized at the time of the assessment team’s visit
PI-8/ M2 Transparency of Inter-Governmental Fiscal Relations
D+ (i) B (ii) D (iii) D
C(i) A (ii) C (iii) D
Improvement in performance due to change in budget calendar so that central govt. budget is approved before end of the year, so that Councils have more certain information on grants they will receive.
PI-9/ M1 Oversight of aggregate fiscal risk from other public sector entities
C (i) C (ii) C
C (i) C (ii) C
No change in performance. Still no consolidated report on fiscal risk
PI-10/ M1
Public access to key fiscal information A B Timeliness in publishing reports has slipped somewhat, partly due to MoFNP not keeping its website up to date.

89
C. BUDGET CYCLE Score
2008 PEFA
Score 2012 PEFA
Performance changes
C (i) Policy-Based Budgeting PI-11/ M2
Orderliness and participation in the annual budget process
C+ (i) C (ii) A) (iii) D
A (i) B (ii) A (iii) A
Performance has improved, partly due to the improved budget calendar
PI-12/ M2
Multi-year perspective in fiscal planning, expenditure policy and budgeting
B+ (i) B (ii) B (iii) A (iv) B
B (i) B (ii) D (iii) A (iv) B
Performance diminished due to no DSA carried out in last 3 years.
C (ii) Predictability & Control in Budget Execution
Revenue Administration PI-13/ M2
Transparency of taxpayer obligations and liabilities
B (i) B (ii) B (iii) B
B▲ (i)B (ii)B▲ (iii) B
Progress is being made, though not by enough as yet to increase the ratings.
PI-14/ M2
Effectiveness of measures for taxpayer registration and tax assessment
B (i) C (ii) B (iii) B
B+ (i) B (ii) B (iii) A
Performance has improved due to progress under dimensions (i) and (iii) – greater registration and tax audit coverage
PI-15/ M1
Effectiveness in collection of tax payments D+ (i) NR (ii) B (iii) B
D+ (i) NR (ii)B▲ (iii) B
Performance is unchanged. Still insufficient information on tax debt collection. The speed of tax collection has increased.
Budget Execution & Cash/Debt Management PI-16/ M1
Predictability in the availability of funds for commitment of expenditures
D+ (i) B (ii) D (iii) C
C+ (i) B (ii) B (iii) C
Improvement in performance due to greater reliability of information on resources available for spending under (ii). But predictability still a major issue
PI-17/ M2
Recording and management of cash balances, debt and guarantees
C+ (i) C (ii) C (iii) C
C+▲ (i) C (ii)C▲ (iii) B
Progress is being made. Cash management has improved, translating into an increase in the amounts consolidated.
Internal Controls PI-18/ M1
Effectiveness of payroll controls D+ (i) A (ii) D (iii) A (iv) B
B+ (i) A (ii) B (iii) A (iv) A
Performance has improved due to: (i) sharp reduction in the time for changes in personnel records to be reflected in the payroll (due to decentralization of PMEC to line ministries and provincial administration; and (ii) increased frequency and scope of payroll audits.

90
PI-19/ M2
Competition, value for money and controls in procurement
NA (i) NA (ii) B (iii) NA (iv) NA
D+ (i) B (ii) D (iii) D (iv) D
The methodology for assessing this indicator changed in January 2011, and the scores are not directly comparable, except for dimension (ii), which appears to have been over-scored as the data were not available.
PI-20/ M1
Effectiveness of internal controls for non-salary expenditures
C+ (i) C (ii) B (iii) C
C+ (i) B (ii) B (iii) C
Expenditure commitment controls have improved, but compliance with other control systems is deficient in a number of areas
PI-21/ M1
Effectiveness of internal audit C+ (i) B (ii) B (iii) C
C+ (i) A (ii) B (iii) C
Performance is unchanged. The quality of internal audit has improved, but its effectiveness continues to be constrained by limited follow-up by MPSAs.
C. BUDGET CYCLE Score 2008 PEFA
Score 2012 PEFA
Performance changes
C (iii) Accounting, Recording and Reporting
PI-22/ M2
Timeliness and regularity of accounts reconciliation
B (i) A (ii) C
B (i) A (ii) C
No change in performance.
PI-23 Availability of information on resources received by service delivery units
B B No change in performance
PI-24/ M1
Quality and timeliness of in-year budget reports
C (i) C (ii) C (iii) C
C+ (i) C (ii) B (iii) C
No change in performance. The rating for dimension (ii) in the 2008 assessment appears to have been too low.
PI-25/ M1
Quality and timeliness of annual financial statements
C+ (i) C (ii) B (iii) C (revised from B)
B (i) B (ii) A (iii) B
Performance has improved. The rating for dim (iii) in the 2008 PEFA is revised downwards as accounting standards were not disclosed in the accounts.
C (iv) External Scrutiny and Audit PI-26/ M1
Scope, nature and follow-up of external audit B (i) B (ii) B (iii) B
B (i) B (ii) B (iii) B
No change in performance, but nevertheless the quality of the external audit function is strengthening over time.
PI-27/ M1
Legislative scrutiny of the annual budget law C+ (i) B (ii) B (iii) B (revised from A) (iv) C
C+ (i) B (ii) B (iii) A (iv) C
No overall change in performance, the use of supplementary estimates being a limiting factor, but the revised timetable for approving the budget represents an improvement under dimension (iii); the 2008 rating appears to be too high.

91
PI-28/ M1
Legislative scrutiny of external audit reports C+ (i) C (ii) A (iii) B
C+ (i) C (ii) A (iii) B
No change in performance, but generally this function is performing well, the main limitation being the time lag between review by PAC and adoption of PAC reports by the whole House.
D. DONOR PRACTICES Score 2008 PEFA
Score 2012 PEFA
Performance changes
D-1/ M1 Predictability of Direct Budget Support D+ (i) C (ii) D
C (i) C (ii) C
Performance has improved.
D-2/ M1 Financial information provided by donors for budgeting and reporting on project and program aid
D+ (i) B (ii) D
B (i) B (ii) B
Performance has improved due to greater frequency of reporting on disbursements and greater use of GRZ’ budget classification system.
D-3/ M1 Proportion of aid that is managed by use of national procedures
C C No change. Use of country systems fell due to mis-use of donor funds in the health sector, but not by enough to lower the score.
Source: Zambia PEFA Draft Report 2012

92
Annex 18: Connecting the Non-State Actors with the State to Contribute to Greater Development Impact: Approach and Tools
Traditionally, the Bank has focused on working primarily with state actors and
institutions (the “supply-side”) in its attempt to support development and public-management reform around the world. But in the past decade, there has been a realization that interaction with state actors is not sufficient in and of itself to bring development, since it tends to assume, rather optimistically, that governments both want and need help to deliver development honestly and effectively. Development practitioners have increasingly shifted to a focus on engaging citizens, civil society and other non -state actors (the “demand side”) in holding government to account for their actions4.
This shift to reforms that stimulate demand is a welcome one, though the approach
needs to go beyond simplistic oppositions between supply and demand; The demand-side approach has risked reproducing the simplistic assumptions of the supply approach in that it implicitly assumes that citizens have an uncomplicated and clear motivation to hold government to account for their performance. A number of recent studies and the Bank’s own evaluations have demonstrated that the theoretical separation between supply and demand actors can be a hindrance, in that it unhelpfully presents Africa’s governance challenges as being fundamentally about one set of actors (non-state) getting another set of actors (state) to behave better. In reality, governance challenges are fundamentally about getting both state and non-state actors to find ways of acting collectively in their own best interests.
Instead of focusing on separate supply and demand side interventions, more must be
done to focus on the linkages between the two. User demand is seldom a sufficient factor for improving service delivery. Studies show that in the absence of top down performance pressures and institutional coherence, bottom-up demand tends to have little impact. In other words a more holistic approach is needed. Since our recent evaluations indicate that governance challenges are fundamentally about getting both state and non-state actors to find ways of acting collectively in their own best interests, far more must be done in bringing these actors together. The Bank’s focus during this CPS period will be on facilitating constructive relationships among providers and users based on a detailed appreciation of barriers to behavior change in specific local settings.
This CPS shall ensure enhanced attention to communication and dissemination of Bank data and analysis amongst varied stakeholders. Too often Bank product dissemination starts and ends with the specific government institution that the work addresses. Given that our technical reforms often fail because of a lack of broader public support or awareness, this is clearly a missed opportunity. Much more will be done during this CPS period to ensure that Bank research, evidence papers, economic briefs etc. are transmitted to a broad mix of stakeholders (including think tanks, youth organisations, media, parliamentarians, civil society and academia). What’s more, in contrast to the traditional dissemination approach which focuses primarily on putting the information out there, the approach going forward will be to engender ownership and mobilisation around the work. This means organising more debates instead of press conferences and being willing to allow and facilitate the use of World Bank data in forums that are not controlled by the Bank itself. It also
4 WDR 2004 Accountability Framework

93
means proactively bringing together a vast mix of stakeholders to discuss the implications of the work amongst themselves.
The World Bank shall utilised ICT to enhance dialogue between state and non-state actors as well as between project teams and project beneficiaries. ICT has a great but largely untested potential to help disseminate information and enhance dialogue across project stakeholders. In the CPS period, the Bank shall proactively seek to better exploit the potential of ICT. In collaboration with WBI we shall pilot an ICT solution (utilising on online mapping platform and mobile text) that enables project teams to better engage with beneficiaries in a two-way conversation about effectiveness of the project.
The World Bank had held entrepreneurship training for the youth in preparation for the African Growth and Opportunity Act (AGOA) forum held in Zambia in 2011; the participation of the youth in the forum led to the formation of a Business young professionals association in Zambia and in Southern Africa region. As a result of this training provided by the Bank a desk has been established for young professionals by AGOA.
As part of the Pilot Project for Climate Resilience (PPCR), Zambian youth were introduced and trained in new ICT approaches and technologies to integrate climate risk management into regional planning and to promote the importance of addressing climate change risks from national to local levels.
Media shall be treated as a key partner and target for reform. Media is the gatekeeper of public opinion in Zambia. It is the “agora” in which debates are had and opinions formed. As such, it is a critical arena that the Bank can utilise in bringing together diverse voices across the state, non-state actor divide. Already the Bank has been undertaking pilot activities with community radio – funded by the GPF - that are aimed at using radio as the channel via which flows of information are enhanced amongst these groups. The Bank has also been actively supporting the enhancement of investigative journalism skills in Zambia. But much more can be done. During the CPS period there shall be a specific focus on enhancing the capacity of the media to act as a credible provider of information and a site for inclusive dialogue. This will include continued development of strong partnerships with reform-minded media institutions and media individuals via the GPF. The new Anti-Corruption Fund will also be utilized to support media projects that seek to increase the quality of information and debate in the public sphere.
The Bank needs to go beyond “the usual suspects”. Civil society in Zambia is dominated by a few core organisations that are largely over-burdened with donor demand. The Bank will need to go beyond these usual suspects as it seeks to engage non-state actors in its own projects and to enhance their ability to engage with government. In particular, this CPS will focus on building capacity of rural organisations, community radios and community-based associations. There shall also be a greater emphasis on women and youth organisations. Parliamentarians are another set of actors that the Bank shall be seeking greater engagement with, particularly in mobilizing opinion around key Bank knowledge products. Of course, in deciding to engage beyond the typical donor-funded organisations, there are likely to be greater transaction costs for the Bank as well as a need for Bank staff to be both relational and locally immersed. The new Anti-corruption fund will be implemented and staffed with these principles in mind.

94
The Bank shall continue with measures that seek to facilitate the creation of locally-anchored solutions to collective action problems. During the past CPS, the Bank began facilitating constructive dialogues across stakeholders around reform that related to extractives industries, procurement and on access to information. Though there has been some success with these initial endeavours, they still tend to suffer from too much of a heavy Bank hand when it comes to agreeing on solutions. In the upcoming CPS, the approach shall increasingly be to operate “at arm’s length” with these initiatives, by utilising credible, locally immersed intermediaries who also have a detailed appreciation of barriers to behavior change in specific local settings.
The Bank needs to ensure that it facilitates the development of locally-relevant solutions to problems of collective action: Sometimes the mechanical application of donor-inspired policy guidelines by sector ministries results in additional policy incoherence and prevents local actors coming together to provide their own solutions. The Bank shall endeavour to avoid this possibility by ensuring that we do not sweep aside pre-existing institutions, regardless of their potential to contribute to reform efforts. Successful reforms need to draw on what is right and proper in existing local cultural systems. The emphasis shall be on adapting rather than supplanting existing practices, thus creating “practical hybrids”. The new Anti-Corruption Fund, which has as one of its objectives “to strengthen innovation and capacity within supply side integrity institutions/ structures”, shall retain this lesson as an underlying principle.

95
Annex 19: Zambia Cooperating Partners Division of Labor Matrix
Division of Labor 2012-2015
(JASZ II Signatories)
SNDP Cluster Lead Ministry
AfD
B
EU
UN
S
yste
m
Wor
ld
Ban
k
Can
ada
Den
mar
k
Fin
lan
d
Ger
man
y
Irel
and
Japa
n
Net
her
lan
ds
Nor
way
Sw
eden
UK
US
A
Tot
al
lead
/act
ive
Infrastructure Energy MEWD A B B L L P B/N L 3L/1A
Transport MWS/MCT A L L A/P A/P A B 2L/4A
Human Development
Education & Skills Development MOE/MSTVT A L A P B L A P B/P A 2L/4A
Health MOH A L A P B A L L 3L/3A HIV & AIDS MOH B L A P A/P B L A/P P B/P A A L 3L/5A Water & Sanitation MEWD/MLGH L B A L A/P L A B/N A/N 3L/4A
Growth
Agriculture, Livestock & Fisheries
MACO L L A A L A A A A 3L/6A
Manufacturing, Commerce & Trade (PSD)
MCT/CO-DSC A B A A L A P L A 2L/6A
Tourism MTENR B L 1L/0A
Support
Environment & Natural Resources
MTENR A L L A/P L A A/N 3L/4A
Governance MOJ L L A A/P B A A P A B L A 3L/6A Local Government & Decentralization
MLGH B A B L A A/P 1L/3A
Science, Technology & Innovation
MSTVT A B A B/N 0L/2A
Crosscutting
Gender CO-GIDD B L B B L P A B L A 3L/2A Housing MLGH/MOL B/N B/P 0L/0A Macroeconomics MOFNP A L A L A A B P A A L A 3L/8A Social Protection MCDSS L B/N A A/N L 2L/2A
Total Lead Responsibilities 3 4 7 6 - - 3 2 3 1 1 - 1 6 2 LEGEND: DOL MAIN CLASS: L – Lead, A - Active, B – Background/Silent. SUB-CLASS: N – New Entrant, P – Phasing Out
* The DoL is a living document and will be updated following changes in CP's country strategies * The EU, Finland, Sweden and the World Bank will develop new country strategies during 2012 and will revise participation in sector groups accordingly

96
Annex 20: ZAMBIA CAS COMPLETION REPORT
CAS Board Discussion: April 8, 2008 CAS Progress Report Board Discussion: November 15, 2011 Period Covered by the CAS: April 2008-December 2012 (after the extension by the CASPR) Period Covered by the CASCR: April 2008-November 2012 CAS Completion Report Prepared by: Nalini Kumar, Senior Operations Officer; Fareed M Hassan, Consultant; Ngao Mubanga, Research Assistant Date: December 20, 2012

97
Table of Contents
Executive Summary……...……………………………………..………………..……………..…........99 Introduction…………...……………………………………………………………….....……….…..101 Relevance: National Development Priorities and alignments to the CAS objectives……….………101 Achievements of CAS Outcomes and Milestones………………………………….………….........104 Pillar I: Macroeconomic and Expenditure Management…………………. …....……..……………...104 Pillar II: Institutional capacity enhancement……………………….……..……................................106 Pillar III: Infrastructure development……………….....…………………….….……………….........110 Pillar IV: Human capital development………………………….…..................................................112 Cross cutting themes: Governance and HIV………………………………………..…..……………..113 World Bank Performance …………………………………………….……...……...…………..........116 Portfolio performance…….………………………………………......………………………….…......118 Lessons Learned for Subsequent Strategy Design…………..………………………...………..…….119
List of Tables Table 1: Official Development Assistance (ODA) and IDA support (US$ million otherwise stated)….103 Table 2: Disbursement Ratio for Zambia, SSA and Bank-wide (%), FY08-FY13 Q2……………….....119 Annex Table 1: Comparison of Planned and Actual Lending FY08-12………………...………………121 Annex Table 2: Comparison of Planned and Actual Analytical and Advisory Work FY08-12…………122 Annex Table 3a: IEG Project Rating for Zambia, FY08-12……………………...……………………..123 Annex Table 3b: IEG Project Rating for Zambia and Comparators…...…………………………….......123 Annex Table 4: Portfolio Rating for Zambia and Comparators, FY08-12………………...…………….123 Annex Table 5: IBRD/IDA Net Disbursement and Charges Summary Report for Zambia………......…124 Annex Table 6: Total Net Disbursements of ODA and Official Aid, 2004-2010 (in US$ million)……..124 Annex Table 7: Zambia – Millennium Development Goals…………...………………………………...126 Annex Table 8: Economic and Social Indicators for Zambia and Comparators, 2008-2010…………....127 Annex Table 9 Summary of Achievements of the CAS objectives……………………...………………128 Annex Table 10: CAS Results Summary……………………………………………...…………………136 Annex Table 11: Active Trust Funds FY08-FY13Q1………………………………………..………….137 Annex Table 12a: Public Expenditures Allocations (constant 2008 billion ZKW) 2008-2012……...….138 Annex Table 12b: Percentage Public Expenditure Allocations in pro poor sectors 2008-2012……...….139 Annex Table 12c: Recording and management of cash balances, debt and guarantees……………...….139 Annex Table 12d: Agriculture contribution to GDP growth (average annual growth% and as % of GDP)……………………………………………………………………………………………………..139 Annex Table 12e: Project Implementation delays……………………………………………………….140
List of Figures Figure 1: Projects under implementation in FY08 and FY12 by sector…………………………………104
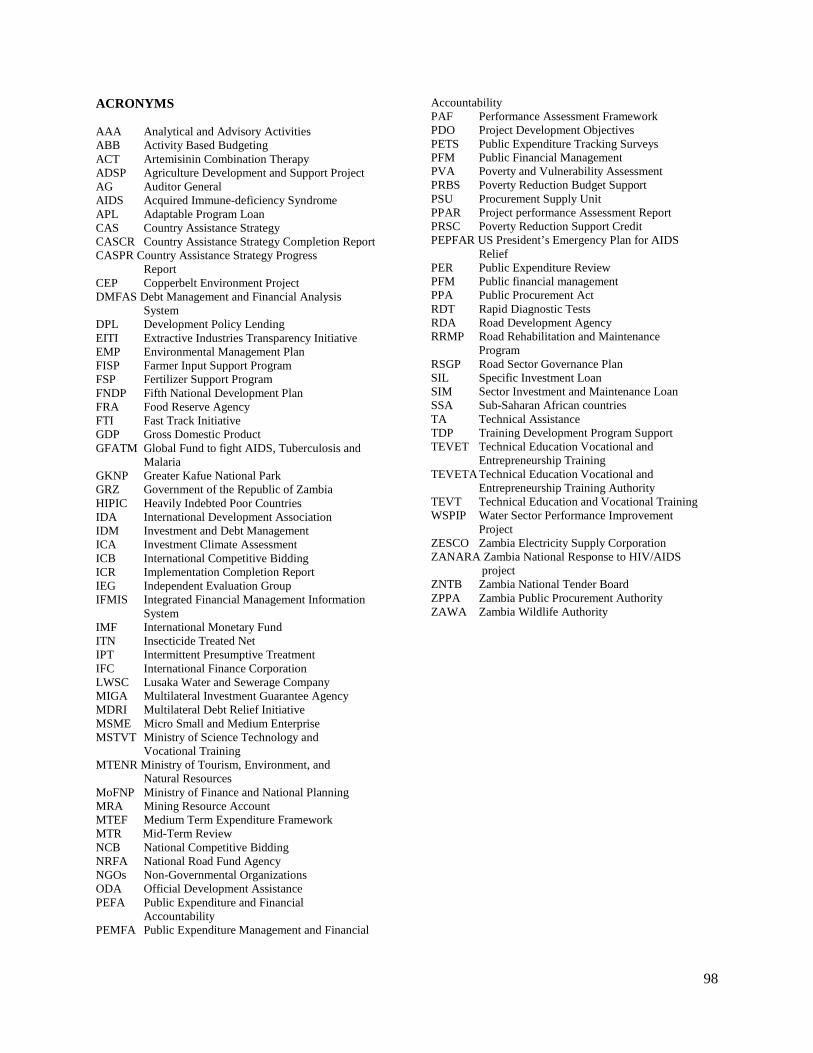
98
ACRONYMS
AAA Analytical and Advisory Activities ABB Activity Based Budgeting ACT Artemisinin Combination Therapy ADSP Agriculture Development and Support Project AG Auditor General AIDS Acquired Immune-deficiency Syndrome APL Adaptable Program Loan CAS Country Assistance Strategy CASCR Country Assistance Strategy Completion Report CASPR Country Assistance Strategy Progress
Report CEP Copperbelt Environment Project DMFAS Debt Management and Financial Analysis
System DPL Development Policy Lending EITI Extractive Industries Transparency Initiative EMP Environmental Management Plan FISP Farmer Input Support Program FSP Fertilizer Support Program FNDP Fifth National Development Plan FRA Food Reserve Agency FTI Fast Track Initiative GDP Gross Domestic Product GFATM Global Fund to fight AIDS, Tuberculosis and
Malaria GKNP Greater Kafue National Park GRZ Government of the Republic of Zambia HIPIC Heavily Indebted Poor Countries IDA International Development Association IDM Investment and Debt Management ICA Investment Climate Assessment ICB International Competitive Bidding ICR Implementation Completion Report IEG Independent Evaluation Group IFMIS Integrated Financial Management Information
System IMF International Monetary Fund ITN Insecticide Treated Net IPT Intermittent Presumptive Treatment IFC International Finance Corporation LWSC Lusaka Water and Sewerage Company MIGA Multilateral Investment Guarantee Agency MDRI Multilateral Debt Relief Initiative MSME Micro Small and Medium Enterprise MSTVT Ministry of Science Technology and
Vocational Training MTENR Ministry of Tourism, Environment, and
Natural Resources MoFNP Ministry of Finance and National Planning MRA Mining Resource Account MTEF Medium Term Expenditure Framework MTR Mid-Term Review NCB National Competitive Bidding NRFA National Road Fund Agency NGOs Non-Governmental Organizations ODA Official Development Assistance PEFA Public Expenditure and Financial Accountability PEMFA Public Expenditure Management and Financial
Accountability PAF Performance Assessment Framework PDO Project Development Objectives PETS Public Expenditure Tracking Surveys PFM Public Financial Management PVA Poverty and Vulnerability Assessment PRBS Poverty Reduction Budget Support PSU Procurement Supply Unit PPAR Project performance Assessment Report PRSC Poverty Reduction Support Credit PEPFAR US President’s Emergency Plan for AIDS Relief PER Public Expenditure Review PFM Public financial management PPA Public Procurement Act RDT Rapid Diagnostic Tests RDA Road Development Agency RRMP Road Rehabilitation and Maintenance
Program RSGP Road Sector Governance Plan SIL Specific Investment Loan SIM Sector Investment and Maintenance Loan SSA Sub-Saharan African countries TA Technical Assistance TDP Training Development Program Support TEVET Technical Education Vocational and
Entrepreneurship Training TEVETA Technical Education Vocational and Entrepreneurship Training Authority TEVT Technical Education and Vocational Training WSPIP Water Sector Performance Improvement Project ZESCO Zambia Electricity Supply Corporation ZANARA Zambia National Response to HIV/AIDS
project ZNTB Zambia National Tender Board ZPPA Zambia Public Procurement Authority ZAWA Zambia Wildlife Authority

99
Executive Summary
i. This Country Assistance Strategy Completion Report for Zambia (CASCR) takes stock of the effectiveness of the FY08 CAS and draws lessons for the Country Partnership Strategy (CPS) for 2013-2016. The FY08 CAS, which was developed in close partnership with the Government and other stakeholders, supported Zambia's Fifth National Development Plan (FNDP 2006-10) through four pillars: (i) macro-economic and expenditure management; (ii) institutional capacity enhancement; (iii) infrastructure development; and (iv) human capital development.
ii. Although the CAS was aligned with the Government plan, it was not selective in the areas chosen for support. The scope of the Bank Group program was ambitious in relations to allocated time, resources, and available capacity. In addition to the four pillars, the CAS design called for two cross cutting themes (governance and HIV/AIDS) and covered 11 sectors each with several objectives. This in turn led to a proliferation of CAS outcome indicators (totaling 23) and milestones (39). The CAS Progress Report dropped some milestones, revised four indicators, and dropped one.
iii. There was a consistent decline in IDA disbursements to Zambia during the CAS period, when the rate dropped from about 29% in FY08 to 18% in FY11 and further to about 11% in FY12. Disbursements have however, picked up significantly in the last six months as the CMU has worked with the task teams and the Government to address bottlenecks.
iv. Within the Bank's relatively small assistance program, the share of budget support (PRSCs) in total IDA disbursements was substantial, exceeding the envisaged CAS range of 15-20%. The PRSCs, in conjunction with many development partners, addressed energy, private sector, and public sector reforms. In terms of non-lending activities, the Bank supported several capacity building activities and produced a number of analytical pieces that informed policies in key sectors.
v. The CASCR rates both overall program and Bank performance under the CAS as moderately satisfactory. Of the 23 CAS outcome indicators, 10 were achieved, 8 were partially achieved, and 5 were not achieved. The CAS was relevant and consonant with Government priorities. Achievements include improving macroeconomic and expenditure management, increasing access to roads and electricity, reducing under-five child deaths due to malaria, and stemming the spread of HIV/AIDS. There was also progress towards strengthening public financial management, improving public management and transparency of mining and natural resources, enhancing access to water, strengthening vocational training, and improving the business environment (IFC and MIGA support was also relevant with respect to the last). But challenges remain in these areas. While agriculture productivity did not improve during the CAS period, the strategic focus of the Bank program shifted towards the agriculture sector, through the design and preparation of critical interventions in irrigation, livestock and agriculture research laying the basis for achievements under the next CAS in this area. The analytical and advisory activities undertaken by the Bank were also relevant, of high quality and helped the Bank carry out its strategy. The CAS was a results-based one, but the Bank, in some cases, did not pay adequate attention to the development of realistic and monitorable indicators. The weak results framework was corrected only during the CAS Progress Report. Implementation of on-going projects proceeded slowly, primarily because of ambitious design relative to existing capacity, but the outcome of completed projects was mostly moderately satisfactory. The Bank managed to maintain a dialogue with the Government and donors and having an office in Lusaka has helped. The Bank collaboration with other cooperating partners helped leverage additional donor resources and strengthen prospects for reforms.

100
vi. Zambia's progress has been mixed in implementing reforms needed to achieve country-level goals. The Government has overseen and implemented sound macroeconomic policies. But the strong economic growth of the past decade has not yet translated into substantial reduction of poverty, especially in rural areas. Income inequity is high and the urban-rural divide is wide.
vii. Several lessons have been learnt from implementation of the FY08 CAS, and which have
been taken into account in the preparation of the new CPS. These include the following: (i) the CPS needs to be more realistic in its strategic objectives and consistent with allocated time and resources, and available capacity; (ii) simplification of project design in future operations is critical to avoid implementation delays; (iii) the need for a sound CPS results matrix that clearly shows the link between projects/AAA and outcomes; (iv) adopting a low risk piloting approach to major reforms; and (v) pursuing an approach of "incremental progress" that involved the Bank staying the course in a particular policy area and addressing the same or closely related issues in that area with successive analytical work or lending operations, but each time incrementally and patiently introducing additional measures until more complete progress was achieved over time.

101
I. Introduction
1. This Country Assistance Strategy Completion Report (CASCR) assesses the implementation of the Zambia Country Assistance Strategy (CAS) (FY08-11) discussed by the Board on April 8, 2008.It draws lessons for the preparation of the new Country Partnership Strategy (CPS). Where appropriate—i.e., in areas where there is a high degree of continuity between activities under the FY08 CAS and previous CASs (e.g., improving public sector management and enabling business environment)—the review takes a medium-term look at the impact of Bank assistance. 2. The CASCR draws on several key reports, most notably the CAS Progress Report (CASPR, Nov. 2011), project completion reports, ISRs, as well as independent evaluations and studies. The CASPR, which was discussed in-depth with the Government, Parliament and other stakeholders, also made adjustments to the strategy based on realities on the ground. It recommended extending the CAS period to the end of CY2012 to pave the way for engaging the newly elected Government in the preparation of the new strategy. Based on implementation progress and available data, the CAS indicators were also revised. These changes have been taken into account in the CASCR’s assessment of the Bank’s performance in Zambia.
3. The remainder of the report is structured as follows. Section II provides an overview of the CAS relevance, examining the alignment between the CAS design and the objectives of the Government program. Sections III reviews progress towards achievement of CAS objectives. Section IV analyses the Bank’s performance and its role in supporting observed progress towards these objectives. The last section draws lessons learned for subsequent CPS design.
II. Relevance: National Development Priorities and Alignments to the CAS Objectives 4. An overarching context of stable politics and sound macroeconomic fundamentals but reliant on mining. Zambia has a long history of political stability and in the last election in September 2011 there was a peaceful change of regime with the opposition party (the Patriotic Front) coming to power after 20 years of rule by the Movement for Multiparty Democracy. Mining remains the backbone of the country's economy. Economic growth, that averaged 5.7 % annually in the last decade, was driven by a combination of prudent macroeconomic management, market liberalization as well as high international copper prices, increased copper production, a bumper maize harvest, and a boom in the construction sector. However, despite favorable growth, poverty and income inequality have remained stubbornly high and the urban-rural divide remains large. Sustaining growth and ensuring that the majority of the population can benefit from this growth remain Zambia’s central development challenges. The new Government has put emphasis on re-orienting policies towards more inclusive economic growth, employment generation and poverty reduction. 5. Zambia’s long-term development objectives are articulated in the National Vision 2030, which projects Zambia attaining a prosperous middle-income country status by 2030, through developing infrastructure and human resources to stimulate wealth and jobs. The development strategy to achieve the Vision’s objectives has been elaborated in a series of medium-term national development plans. The Fifth National Development Plan (FNDP 2006-2010)—the first in the series of these plans acknowledges that the linkage between growth and poverty reduction has been weak, as growth has been narrowly driven by a few sectors. While the FNDP recognizes the importance of continued contributions of the mining, construction, and energy sectors to overall growth, it advocates a major shift in emphasis towards rural development, agriculture, tourism, and manufacturing that might have greater pro-poor impact through increased employment and income opportunities. Agriculture is a key

102
economic sector, providing employment to three-quarters of the workforce, and contributing about 10% of GDP and some 10 % of export. The Plan emphasizes four priorities/themes as follows: (i) sustaining fiscal and financial stability and deepening structural reforms; (ii) supporting governance, institutional capacity, the business environment and agricultural development, (iii) enhancing public infrastructure; and (iv) improving health performance, education and skills training. In addition, it highlights several cross-cutting issues, such as governance, HIV/AIDS, environment, and gender. The plan had strong Government ownership and was prepared through a robust participatory process involving diverse stakeholders from throughout Zambian society.
6. In turn, the CAS FY08-11, developed in close partnership with Government and other stakeholders, was fully aligned with the FNDP. Support was organized around four pillars: (i) macroeconomic and expenditure management; (ii) institutional capacity enhancement; (iii) infrastructure development; and (iv) human capital development. Improved governance was interwoven throughout the CAS program through a governance filter that emphasized smart project design to achieve transparency, participation, and third party monitoring; outreach to stakeholders and proactive supervision during project implementation; and synergies between Bank operations to contribute to strengthening of country systems. It was recognized that better governance is essentially a longer-term activity, likely exceeding the CAS period by several years. The importance of the issue however, justified its inclusion in the CAS even in the absence of specified end-outcomes by the end of the CAS period. Similarly, mainstreaming HIV measures into all operations was planned.
7. Although the CAS program was aligned well with the Government plan, it was not selective. The CAS design called for four pillars, two cross cutting themes (governance and HIV/AIDS), and kept its focus fairly broad, covering 11 sectors (e.g. agriculture, mining, infrastructure, PFM, natural resources, business environment, health, tourism, transport and education) each with several objectives. This in turn led to a proliferation of CAS outcome indicators (totaling 23) and milestones (39) as shown in Annex Tables 9 and 10. The scope of the Bank program was exceedingly ambitious, for the small time frame and limited IDA envelope, and in relation to Zambia’s weak institutional capacity-even acknowledging that some of the program activities were aimed at strengthening that capacity. The CAS design did not reflect the lessons of experience drawn from the previous CASCR that noted “future CASs need to be more realistic in their strategic objectives and should be based on a careful review of past experience and political economy issues.” (2008 IEG CAS Review for the FY04-07 CAS). 8. Although the Bank has had a relatively small role in providing financial assistance to Zambia, it provided a substantial program of analytical work and capacity building support. Net Official Development Assistance (ODA) disbursements to Zambia as well as IDA disbursements have been declining since 2006. ODA rapidly decreased from US$1.5 billion in 2006 (equivalent to 80% of government revenue) to US$914 million in 2010 (or 30% of government revenue). IDA disbursements also declined, contributing, on average, some US$50 million per year or about 5% of total ODA disbursements during the review period. More than 50 development partners provide assistance to Zambia, including bilateral partners (Table 1). IDA supported several capacity building activities and analytical work that informed policies in key sectors as discussed below (see also Annex Table 2).

103
Table 1: Official Development Assistance (ODA) and IDA support (US$ million otherwise stated) 2006 2007 2008 2009 2010 2011 ODA net flows 1,468 1,008 1,116 1,267 914 NA Bilateral ODA 1,118 713 704 703 593 NA Multilateral ODA 350 295 412 564 321 NA IDA disbursements 61 71 59 43 36 63 General budget support (PRBS) 113 143 195 226 217 149 PRSCs 0 0 0 10 20 30 PRSCs as % of GBS total 0 0 0 4 9 20 PRSCs as % of IDA disbursements 0 0 0 22 55 47 Government revenue excluding grants 1838 2129 2846 2091 2965 3971 General budget support as % of government revenue 6 7 7 11 7 4 PRSCs as % of government revenue 0 0 0 1 1 1 Note: The Poverty Reduction Budget Support Group (PRBS) comprises the European Union, UK (DIFD), Germany, Norway, Finland, the World Bank, and the African Development Bank. Source: Annex Table 6 and Bank staff estimates.
9. Budget support has become important as a percentage of total aid. The share of ODA going to general budget support was 8% in 2006, while in 2010 it was 23% (equivalent to US$217 million or 7% of government revenue). Similarly, within the Bank's relatively small assistance program, the share of budget support in total IDA disbursements is substantial exceeding the envisaged CAS range of 15-20%. 10. The CAS included a results matrix with generally defined outcomes and milestones for each of the four pillars, however, the link between project/program outputs/outcomes and CAS outcomes were not always explicitly spelled out. The outcomes and milestones identified in the CAS results matrix were drawn directly from the projects across the portfolio and were generally relevant to the country development context as outlined in paragraphs 4 and 5. However, the links between project/program outputs/outcomes and CAS outcomes were not always explicitly spelled out and this was partly because the links between outputs and outcomes were not clearly specified in the projects. As such the selection of outcome indicators in some cases could not be clearly linked to the Bank interventions. For example, in the Technical Education Vocational & Entrepreneurship Training Development Program Support (TDP) results framework, improvements in the technical education system and enhanced training (outputs) were expected to result in raising graduate employments and speeding up the process of finding employment (outcomes). The outcome indicators neglected the important role of factors, such as the relatively strong growth of the economy during the period of program implementation, as well as whether the employed graduates were working in a field related to their training 5.In other cases there was no baseline survey undertaken to define the starting point of project activities such as in the Zambia National Response to HIV/AIDS. Further, no quantitative targets were specified for some indicators. For example, the CAS results framework noted that the baseline and target for the CAS outcome indicator of increased primary education completion rate would be assessed at the Fast Track Initiative (FTI) for education effectiveness date, which was delayed till FY11. Some CAS outcome indicators were also phrased in general terms, “GRZ put in place clear guidance for allocation of additional resource flows from mining”, and were more focused on process (putting in place) than outcomes (gains from mining adequately used to support country’s development). 11. The CAS matrix was revised by the CASPR. The CAS implementation experience suggested the need to streamline the number of indicators to be monitored and to ensure that the milestones and outcome indicators were better aligned with desired CAS goals. The CASPR involved a systematic effort to streamline the results matrix: a number of milestones were dropped (5 out of 39) and another 4
5 The links between outputs and outcomes were however, clearly specified in the road, energy and malaria projects/programs.

104
milestones were revised. Similarly a number of CAS outcomes indicators were revised (4 out of 23) and one was dropped (Annex Table 9 and CAS Progress Report Annex Table 4 provide details).
III. Achievements of CAS Outcomes and Milestones
12. Overall, the outcome of the Bank’s relatively small assistance program is rated moderately satisfactory. Nearly 43% of specified CAS outcomes having been fully achieved and another 35 percent partially achieved (Annex Table 10). Progress on the milestones - linked directly to Bank supported activities - has been higher, with 46% achieved, and another 41% on track to be achieved. The outcomes achieved were in areas critical to the growth of the economy such as macroeconomic stability, infrastructure improvement and human capital development. There was also progress towards strengthening public financial management, improving public management and transparency of mining and natural resources, enhancing access to water, strengthening vocational training, and improving the business environment. While agricultural productivity did not improve under the CAS period the basis was laid for significant contribution from the World Bank during the next strategy period through the design and approval of critical interventions in irrigation, livestock sector development and agriculture research (the last through a regional agricultural productivity program (Annex Table 1). By the end of the CAS period support for the agriculture sector increased from being 10% to 36% of the portfolio (see figure below). Overall budget allocation (constant 2008 billon ZKW) to the agriculture sector also increased during the period 2008-12 (see more on this in para 17). The following sub-sections summarize progress made across the four CAS pillars. Figure 1: Projects under implementation in FY08 and FY12 by sector.
Pillar I: Macroeconomic and Expenditure Management 13. Zambia’s macroeconomic performance has been commendable when measured by aggregate indicators such as growth, inflation, balance of payments, external debt, and the budget balance. Transfers under the PRSC series—identified by the FY08-11 CAS as the primary vehicle to support the Bank’s macroeconomic and public expenditure management program—helped fund the budget, in turn contributing to stabilizing the real economy. As seven donors, including the Bank, have provided budget support to help stabilize the country (Table 1), the outcomes cited above are not necessarily attributable to the Bank6. Prior actions aimed at public expenditure management helped improve government capacity in these areas. In addition, the PRSC allowed the Bank to participate in the dialogue on macroeconomic management, even though the IMF took the lead. The external debt position of Zambia 6 The Poverty Reduction Budget Support Group comprises the European Union, UK (DIFD), Germany, Norway, Finland, the World Bank, and the African Development Bank.
Source: BW and CASCR calculations.
Agriculture 10% Energy,
Mining & Industry
17%
Economic & Public
Policy 11%
Transport 21%
Health 17%
Education 7%
Environment
11%
Water 6%
FY08
Agriculture 36%
Energy, Mining & Industry
9%
Economic & Public
Policy 11%
Transport 29%
Health 9%
Water 6%
FY12

105
also improved appreciably, largely due to the Heavily Indebted Poor Countries (HIPIC) Initiative and the Multilateral Debt Relief Initiative (MDRI) arrangements. The economy also responded positively to reforms. Maintaining annual growth that averaged 5.7% for a decade was a commendable achievement. 14. Nevertheless, despite the positive performance of growth and overall macroeconomic achievements, a number of concerns have remained. First, the pace of growth has been fueled to a large extent by high international copper prices and the economy’s reliance on a single commodity export could expose it to severe external shocks if copper prices fall. In addition, growth has been driven by few sectors (e.g. mining and construction) and has not been inclusive. The labor-intensive rural economy has only experienced substantial growth in the last two years, because of good weather conditions rather than any structural increase in agricultural productivity. Listed as the third growth sector in the FNDP, tourism has also been stagnant during the CAS period. Long term sustainability of growth will require greater attention to economic diversification and improvement in agricultural productivity and competitiveness and tourism. 15. Poverty did not decrease much and the already high income disparities widened further. The 2010 national incidence of poverty is 60%, not much different from the 62.8% in 2006. With the majority of the population dependent on subsistence agriculture, rural poverty was at 78% in 2010, not much different from 80% in 2006. Zambia’s Gini coefficient is now around 0.54, much higher than 0.47 in 1996. Finally, growth has not translated into commensurate improvement in living standards, and Zambia’s rank in the Human Development Index for 2010 is 150 out of 169 countries. 16. Under this pillar the Bank also intended to help Zambia better manage its expenditure to support the inclusive growth agenda. The Bank identified three CAS outcome indicators: (i) public expenditure allocation to pro-poor sectors shows real increase from 2008; (ii) GRZ put in place clear guidelines for allocation of additional resource flows from mining; and (iii) budget presentation includes reporting on donor funding and revenues and expenditures of quasi-fiscal institutions. 17. Public expenditure allocation to pro-poor sectors shows real increase (Achieved). Overall budget allocation (constant 2008 billon ZKW) to pro-poor sectors (agriculture, tourism and transport) increased during the period 2008-12 (Annex Table 12a)—the increase is reflected in agriculture and transport, while in relative terms, the tourism budget was halved. The share of transport increased from 8.5% of the budget in 2008 to 16.8% in 2012 whereas that of agriculture increased only from 5.8% to 6.1%. Tourism declined from 0.5% of the budget to 0.2% (Annex Table 12b). In terms of the CAS milestone, the Government carried out a mid-term review of the FNDP and presented the report to various stakeholders. Government held annual consultations through the life of the FNDP such as PRSC annual reviews with donors. 18. GRZ put in place clear guidelines for allocation of additional resource flows from mining (Partially Achieved). Although the Government agreed to put in place an appropriate mechanism to harness mining flows (such as a sovereign wealth fund), the envisaged fund has not yet been established. However, staff from Ministry of Finance and National Planning (MoFNP) undertook field visits to multiple countries to study sovereign wealth funds. On the positive side, a Mining Resource Account (MRA) was created in 2008 and mining revenues increased from 1.4% of GDP in 2008 to an estimated 2.3% of GDP in 2012. The Mining & Minerals Act was revised; audit of mining companies has commenced and reconciliation of mining taxes paid by the companies; and an audit program was undertaken by the Zambia Revenue Authority (meeting the CAS milestones).

106
19. Budget presentation includes reporting on donor funding and revenues and expenditures of quasi-fiscal institutions (Achieved). There has been improvement in the availability and quality of debt data. The records on external debt are complete, updated and reconciled semi-annually.7 The records pertaining to all components of domestic debt stock are captured in a data base. Investment and Debt Management (IDM) is upgrading its Debt Management and Financial Analysis System (DMFAS) to the latest version (DMFAS 6.0), allowing both foreign and domestic debt to be centrally recorded. The quality of debt data recording and reporting—according to the public expenditure and financial accountability (PEFA) performance indicator—improved to a “B” in 2010 from a “C” and recording and management of cash balances, debt and guarantees posted an improvement from a “C” in 2005 to a “C+” in 2008 and remained at that level in 2010 (Annex Table 12c). In terms of the CAS milestones, medium term expenditure framework (MTEF) and activity based budgeting (ABB) were rolled out to the Bank of Zambia, the Public Service Pension Fund and state owned enterprises including ZESCO. The last CAS (FY04-07) also supported improvement in public expenditure management and efforts at enhancing the transparency of the budget. During that time frame ABB was approved and the MTEF was started. Thus sustained Bank efforts in this area are beginning to have some positive results.
Pillar II: Institutional Capacity Enhancement 20. This CAS pillar served as an umbrella for actions in a number of mutually-reinforcing or complementary areas. As such, the Pillar II objective of institutional capacity enhancement in public management and productive sectors was to be achieved through concerted action in four main areas: (i) public financial management (PFM), procurement and oversight capacity; (ii) public management and transparency of mining and natural resources sectors; (iii) business environment; and (iv) agricultural productivity (Annex Table 10). The Bank supported the pillar through lending (e.g. PRSC I-III, Public Sector Management Program Support, Support to Economic Expansion Diversification (SEED), Agricultural Development Support Program (ADSP); the Irrigation Development and Support Project (IDSP) and the Livestock project were approved only in FY 2011 and 2012 respectively) and AAA (e.g. PER, policy notes, EITI scoping study, analytical work on copper fabrication, potential of the tourism sector, investment climate assessment Financial Sector Assessment Update, Zambia Business Survey, Jobs and Prosperity Initiative). IFC advisory services and investments also contributed to improving competitiveness and expanding access to finance. 21. Strengthen PFM, procurement and oversight capacity (Partially Achieved).Consistent with the priority to help Zambia better manage its resources was support to the multi-donor supported Public Expenditure Management and Financial Accountability (PEMFA) program, whose aim is to improve Government capacity to effectively and efficiently mobilize and utilize public resources and strengthen financial accountability. The flagship of the PEMFA program is an integrated financial management information system (IFMIS). Other major elements of the program include public procurement reform implementation and strengthening of the audit function. The World Bank is the current lead donor for the PEMFA program. The program had mixed results because the objectives of several components of the program have not been fully achieved and have been delivered later than envisaged. The program has facilitated the installation of IFMIS in the MoFNP and in 27 other ministries/provinces. IFMIS coverage is intended to expand to 48 Government entities by 2013. The implementation of IFMIS was delayed significantly due to challenges which are now being addressed by the Government such as high
7 Public Expenditure Management and Financial Accountability (PEMFA) Program Evaluation, Overview Report, prepared on behalf of Ministry of Finance and National Planning, Government of the Republic of Zambia by REPIM in association with Oxford Policy Management, Aug. 2010; p 36.

107
staff turnover at project management level, and challenges in contract management with the supplier. Timely production of financial statements (a CAS outcome indicator) depends on full implementation of IFMIS.8 However, the implementation of the Payroll Management and Establishment Control (PMEC) system was well accepted by the Cabinet Office and MoFNP and a clear benefit of the system has been the removal of ghost workers. 22. There have been some improvements in procurement legislation and procedures albeit with delays compared to the original planning. Despite slow progress in reform of the public procurement system (attributable to lack of capacity as well as the long turnaround time to enact legislation), results are now beginning to manifest themselves. The Public Procurement Act (PPA) was enacted into law through a statutory instrument in December 2008 (i.e. 4 years into the PEMFA procurement reforms).9 The Act is expected to transform the Zambia National Tender Board (ZNTB) into an oversight and regulatory body for all procurement entities in the public sector. The new body is called the Zambia Public Procurement Authority (ZPPA). Another outcome is the development and implementation of record management systems in the Procurement Supply Units (PSUs) and the training associated with this (meeting the CAS milestone). Whilst it is of concern that some PSUs that have not been certified and do not have a functioning record management system continue to have a procuring responsibility. It is, however, positive to note that ZPPA is using a “Capacity Ladder Approach” which means that there has to be a minimum capacity in a PSU before a threshold can be devolved. PSUs with more capacity will take on a higher threshold compared to the weaker ones. There has been an improvement in the high level PEFA indicator for procurement (PI-19) from a “D+” score in the 2005 baseline assessment to a “C+” score in the 2008 assessment. The 2010 independent evaluation of the PEMFA program suggests that this should now be moved to a score of “B”, following the passing into law of the Public Procurement Act No. 12 of 2008 that provides for a procurement complaints mechanism. However, actual implementation of the procurement law has been slow to take off as the Government amended the law to allow for a further two-year transition period to allow ZPPA to review procurement actions. The envisaged CAS outcome indicator, “procurement processing time is maintained at 8 weeks for national competitive bidding (NCB) and at 12 weeks for international competitive bidding (ICB) in 90% of procurement supply units (PSUs) carried out by procurement committees” was not achieved. Bank projects are being negatively affected by delays and the time taken by the agency. 23. Annual audit coverage has increased considerably, surpassing the CAS outcome indicator. The Office of the Auditor General (OAG) is now present in all nine provinces and nearly one-half of the districts and there is a minimum of one provincial officer per province in place. The percentage of entities covered by annual audit has increased significantly in recent years to about 80% in 2010 (surpassing the CAS outcome indicator of 60%). The OAG has emerged as a strong oversight institution, and besides the usual financial audits, the OAG has recently carried out performance, systems and forensic audits in the Ministry of Health and the Roads Development Agency. 24. Improve public management and transparency of mining and natural resources sectors (Partially Achieved). The Bank has supported the Government with the implementation of the Extractive Industries Transparency Initiative (EITI). Zambia became an EITI candidate country in May
8 An independent evaluation of the Public Expenditure Management and Financial Accountability (PEMFA) program conducted in 2010 notes that there is significant potential to achieve the program objectives if the government can complete the IFMIS exercise successfully and embark upon a continuing PFM reform program avoiding the mistakes of the past. After the evaluation, the government committed to drastically reducing the scope of PEMFA (from 13 to four components) as part of the extension of the program. The extended PEMFA focuses on four components—IFMIS, internal audit, procurement and revenue administration. 9 Development Cooperation Report (2010). Republic of Zambia, Ministry of Finance and National Planning; January 2012, p. 21.

108
2009 and following the completion of the external validation process, Zambia was recently declared EITI compliant. The Zambia EITI council comprising 15 members drawn from Government, mining companies and civil society was formed in 2009, supported by a Zambia EITI Secretariat (meeting the envisaged CAS milestone). As part of the EITI process, the first EITI Revenue Reconciliation Report was published in February 2011 and the second one in March 2012 (in accordance with the CAS outcome indicator) - and the third Zambia EITI report is now in progress. With EITI-compliance, Zambia is among the few Sub-Saharan African countries to be validated as EITI compliant, and is looking at ways to deepen its EITI process. The Bank has also supported the development of a mining cadaster, which is operational, but its full functionality and transparency, as well as supportive institutional arrangements, are still under development, as are broader dimensions of mining sector transparency. 25. The Bank played an important role in strengthening the capacity of Zambia’s environmental regulatory institutions to improve compliance of the mining sector with environmental and social regulations. All major mines submitted their environmental management plans (EMPs) and about 90 inspections per year in 23 mine areas were carried out during 2005 – 2010 and the industry compliance with EMPs increased from 35% in 2005 to 60% in 2010 (below the CAS target of 85%). The lower than hoped for level of compliance “is partly due to the fact that, during privatization, the Government exempted various new investors from having to comply with environmental standards to give them time to phase out or retrofit the old technology they inherited.” (CEP ICR, para. 60, p.24) While the Copperbelt Environment Project (CEP) entailed extensive environment risk awareness activities and other forms of community consultation, a more proactive involvement of mining communities would have helped ensure sustainability, in accordance with the project’s design. In addition, while some indicators such as “pollution flows and loads resulting from mining operations are regularly monitored” they were more focused on process (monitoring) than outcome (compliance with environmental standards). Finally, changes in air and soil contamination were not captured (CEP ICR, p.14). 26. The Bank also supported a program to improve the governance and transparency of other natural resources. The SEED project supported capacity building and infrastructure development in the Kafue National Park, one of the largest in the world. There are indications of recovery in wildlife and tourism revenues have increased. The ICR for the project reports on the increase in numbers and distribution of selected indicator mammal species within the National Park as demonstrated by the series of aerial surveys and confirmed by increased wildlife sightings by tourism operators although some areas continue to face encroachment and related poaching threats. However, weak coordination between the Zambia Wildlife Authority (ZAWA) and the Ministry of Tourism, Environment, and Natural Resources (MTENR), insufficient budgetary allocations to the sector (Table 12a), and slow progress in addressing key policy constraints in the forest and in the wildlife sectors continue to impede progress in the sector. 27. Improve business environment (Partially Achieved). With support from both the Bank and IFC, there has been progress toward improving the business environment, but challenges remain. The objective of improving the business environment was also pursued during the last CAS (FY04-07). With the assistance from IDA FY08 CAS program and in close collaboration with IFC, the Government has been implementing regulatory reforms.10 Under the IFC Zambia Investment Climate Program Phase one, a number of key legislative and licensing reforms were implemented. Thirty one licensing laws were adopted by parliament, 166 licenses were reformed, and an electronic registry of business licenses and a
10 The World Bank works in close collaboration with IFC, through the joint Investment Climate Advisory Services, on the implementation of Doing Business and business license reforms. The first Investment Climate Program started in 2009 and ended in December 2010. A successor program is being prepared.

109
One Stop Shop were established. Licensing procedures have been made simpler and more transparent through the elimination or consolidation of a significant number of administrative requirements. 28. In 2009, following completion of the PRSC-I a baseline for all licenses to be eliminated was established by the Government's Business Licensing Reform Committee, which in 2009, proposed that, out of the total 517 business licenses that existed at the time in Zambia, 170 were to be eliminated, and the rest retained, amalgamated or reclassified. Rationalization of business licenses has been followed by the establishment of an informational e-registry in 2011 for all approved business licenses, which was supported by PRSC III. Zambia has made progress in the areas of ease of starting a business, with the elimination of the minimum capital requirement, and in the area of enforcing contracts, with the introduction of an electronic case management system. Thus the Bank has managed to stay the course in the business environment policy area, but each time introduces additional measures as the process matured. Successive Bank strategies, analytical work and lending operations covered the same set of areas but each time building on previous progress and adding new dimensions. This “incremental approach” helped improve Zambia’s business environment with the country being recognized as among the top 10 reformers globally in 2011. MIGA support also contributed in this area during the CAS period.11 29. Despite progress, three issues stand out in the 2013 Doing Business report: (i) Dealing with construction permits (rank 151), (ii) Getting electricity (rank 151); and (iii) Trading across borders (rank 156). Besides licensing and regulatory framework, reforms in the areas of access to finance by MSME, labor market and skills supply, and infrastructure development will enhance competitiveness of Zambia’s private sector. For a land-locked country such as Zambia, streamlined procedures and reduced delay at border posts could also go a long way in improving the environment for the private sector. According to the World Economic Form’s Global Competitiveness Index 2010-2011, Zambia is not a competitive place in which to do business (ranking 115th out of 139 countries). In terms of the envisaged CAS outcome indicators, some target dates have been delayed as the associated Act was not promptly approved (e.g., the reduction in the licensing requirements, including the number of days to issue tourism licenses and license fees have been delayed since the Tourism and Hospitality Act is being revised). Similarly, the Financial Sector Development Plan was only completed and approved by the Government in 2011 and is expected to increase access to finance. As traditional concessional financing phases out and the country relies increasingly on international markets and foreign direct investment, it will be important to further improve its business environment and competitiveness. This will enhance Zambia’s international reputation as a destination for investment flows by reducing uncertainty. 30. Improve agricultural productivity (Not Achieved). This was one of the four outcomes under the Institutional Capacity pillar. Results of the Bank’s intervention in agriculture and marketing schemes for smallholders were below expectation. Bank assistance through the ongoing ADSP achieved a number of its objectives, including improved infrastructure (about 1,000 km of rural road network has been improved against an end of the project target of 1,133 km), support to some 100,000 farmers and agribusiness enterprises including matching grants and TA, and improvement in cotton value chain with considerable success in terms of cotton seed production increase and meeting national demand. However, the program did not have a significant impact on the productivity of smallholders and the small increase in commercial export of targeted commodities (e.g. cotton, paprika, and coffee) is partly attributed to the Government subsidy programs that favored maize production. The expectation that the Bank’s intervention in agriculture under this CAS period could improve agricultural productivity was
11 MIGA for the first time issued guarantees for $18.64 million in support of investments in the manufacturing and agribusiness sectors in Zambia during FY11.

110
overly ambitious. While the CAS provided the strategic shift towards the agriculture sector (paragraph 12), the actual disbursements during the CAS period for improving agriculture productivity were small.12 Project preparation took time and the Irrigation project became effective only in November 2011 and the Livestock Development and Animal Health Project in July, 2012. On a positive note however, the ADSP supported monitoring gender dis-aggregated data since 2010 and the IFC launched the Zambia Emergent Farmers Program in June 2008 in partnership with the Zambia National Commercial Bank, Rabobank and the Zambia National Farmers Union. 31. The Government agriculture subsidy program has biased the sector toward the production of maize, to the disadvantage of cotton, other cereals and roots and tubers. The Farmer Input Support Program (FISP), subsidizes fertilizer, seeds, and other agricultural inputs, and the operation of the Food Reserve Agency (FRA) intervenes in the market for maize. These two programs account for 60-70% of Government spending on agriculture. The FISP is not effectively targeted: poor farmers are frequently unable to access the subsidy regime, and a large proportion of the subsidy is devoted to areas where there is already an adequate private sector supply of agricultural inputs; more remote, less populous areas—where farmers have fewer private sector alternatives—are typically excluded.13 For 2007-2008 the World Bank estimated that the FISP wasted an amount equal to roughly 20% of its total inputs. Audits of the program performed by the Ministry of Agriculture are expected to result in improved targeting and the implementation of a voucher scheme could reduce leakages in the execution of the subsidy. The FRA plays a major role in domestic maize-pricing mechanisms and is directly involved in crop purchasing, sale and the overall management of the national maize stock. In addition, the Government uses export bans, import tariffs rates and Government import programs with the stated objective of stabilizing prices and ensuring “food security”. In 2010, maize production reached a record high of 2.8 million metric tons, mostly due to good weather conditions. As the FRA guarantees a minimum floor price, the Government decided to buy 800,000 metric tons of maize at a cost of ZMK1.3 trillion (about $280 million). Because the floor price is about twice the current market price, the implicit subsidy will likely reach ZMK 650 billion ($140 million) about 4.8% of domestic revenues or 0.9% of GDP. 32. The Bank’s recent analytical work highlighted the need to adjust FRA and FISP through (i) including multiple crop inputs, not only maize to encourage diversification; (ii) proposing a stock size of 300,000 tons of maize (or 3 months of domestic consumption), which is sufficient to cover historical maize imports in any year from 1992 up to date; and (iii) FRA should buy through open tenders at market prices. The Government is well aware of the fiscal impact of financing the maize surplus and has agreed with the IMF to revise the current maize marketing and pricing mechanisms. This revision will establish a pricing system more reflective of market conditions and will act as an incentive to farmers in both deficit and surplus years. The Government has delayed approval of the proposed Agricultural Marketing Act which will allow the market to play a role in maize pricing, minimize fiscal costs and provide more effective market interventions. Irrigation schemes that were rehabilitated or constructed reached only 559 hectares against the target of 6,200 hectares. Political economy constraints have made reforms in the agriculture sector a difficult task.
12 In terms of investment volume, actual sector specific activities during the CAS period were about US$20 million, since not all of ADSP funds were disbursed. The rural roads that were built under this project while improving connectivity also could not be expected to show an immediate impact on productivity. IFC’s program to engage with the Food Reserve Agency to rehabilitate and construct new silos for grain storage across the country is also recent. 13 A. de Kemp, J. Faust, and s. Leiderer (2011), Between high expectations and reality: An evaluation of budge support in Zambia ( P. 148).
111
Pillar III: Infrastructure Development 33. The infrastructure objectives under Pillar III of the CAS program were largely met with respect to transport but progress on water and energy has been relatively slow and difficult—although sustained effort appears to be finally bearing fruit. Bank instruments in support of these objectives include lending (e.g. Road Rehabilitation and Maintenance Program (RRMP I-II), PRSCs, Water Sector Performance Improvement Project (WSPIP), Increased Efficiency and Access to Electricity and AAA (e.g. Country Water Resource Assistance Strategy, Zambezi Multi-Sector Opportunity Analysis, Review of the Road SIP, and TAs). 34. Improve transport infrastructure (Achieved). Transport activities under the CAS focused on rural roads upgrading and maintenance, construction/rehabilitation of sections of the trunk road and all weather accessible river crossings following the floods in 2006-07, which caused severe damage to river crossings throughout Zambia and reduced access to social services and markets by local communities. Stated CAS outcome indicators were met in each of these areas; namely by 2010 about 80% of rural population has access to all weather river crossings, and links between producers and agricultural markets in targeted areas improved, following the construction/rehabilitation of about one thousand one hundred km of unpaved rural roads. Moreover, the Bank played an important role in supporting the Government to rehabilitate and expand its network of roads, both through the Bank-financed projects and, equally importantly, through catalyzing around US$270 million from other development partners for road improvement and construction.14 However, the road sector faces challenges with regard to governance issues (as discussed below). 35. Improve access to energy (Achieved). Improvement in the electricity sector has been relatively slower and more difficult but sustained efforts are beginning to have some positive impacts - most notably the increasing household access to electricity and improving operational efficiency of ZESCO, the state owned Power Company, and raising electricity tariffs to total cost recovery levels, attracting private sector participation in the energy sector. The Bank’s incremental approach towards reform reflected in its PRSC series helped the Government achieve these targets. In 2008, the first year of electricity reform implementation, new domestic connections reached 25,700, substantially exceeding the target of 18,000. The relevant PRSC-2 target was also exceeded. As of end-2009, ZESCO added 35,709 new connections to the grid, well above the target number of 20,000. For PRSC-3 the target is a net increase of 10%, which has been met and the total number of customers reached nearly half a million by 2011.15 In addition, the Bank has recently approved a regional transmission line project that would support increase in ZESCO’s power transfer capacity to the southern part of the country. The implementation of incremental electricity tariff increases scheduled since 2008 has improved the financial position of ZESCO and the financial viability of the sector, which combined with increasing demand, has resulted in attracting significant investments in power generation. An explicit approach of incremental progress involved the Bank sustaining efforts and staying the course in the sector, and addressing the same or closely related issues in that sector with successive interventions, but each time incrementally introducing additional measures until more progress was achieved over time.
14 Besides the Bank, other development partners participating in the sector include Arab Bank for Economic Development in Africa, Danish International Development Agency, European Union, Kreditanstalt für Wiederaufbau (German Development Bank), Japan International Cooperation Agency, and Nordic Development Fund (NDF). The World Bank (2010), Republic if Zambia: Road Rehabilitation and Maintenance Project in Support of the First Phase of the Road II Program” Report No. 53773-Zm, Sep 2010, para 5, p.2. 15 Despite progress access to electricity remains low at about 22 percent in May 2010 according to ZESCO estimates.

112
36. Improve access to safe water (Partially Achieved). Under the World Bank supported WSPIP, the Lusaka Water and Sewerage Company (LWSC) has constructed/rehabilitated 99 water kiosks in 12 Lusaka peri-urban areas, with 56 currently supplying water. An estimated 4, 000 people have access to safe water with this number expected to increase when the rest of the constructed kiosks become functional. There have been delays in implementation of WSPIP, mainly due to the two year effectiveness delay due to the non-payment of Government debt to the LWSC. Despite progress, only about 60% of the population has access to safe water, necessitating further efforts. The Bank-supported process in formulating the Country Water Resources Assistance Strategy has helped to advance reforms in water resources and facilitated increased awareness around the role of water in the national economic agenda. This contributed to the Government adopting a new legal framework for water resources approved by Parliament in 2011, replacing the 1948 Act and introducing a contemporary framework for ensuring sustainable development that can capitalize on Zambia's abundance of water resources. In parallel, the Bank undertook a Multi-Sector Investment Opportunity Analysis within the Zambezi River basin to demonstrate the benefits of regional cooperation. This highlighted the significant gains possible in energy production and food security through cooperation development and informed the formulation of a program of support in the Zambezi River basin through the Multi-Donor Trust Fund for Cooperation in International Waters in Africa. Pillar IV: Human Capital Development 37. The human capital development objectives under Pillar IV of the CAS program were largely met, although progress lagged in a few areas in education. The CAS program emphasized strengthening skills and education for the formal and informal sectors and fighting malaria and Bank instruments in support of these objectives included lending (e.g. TEVET, and Malaria Booster) and AAA (e.g. PETS basic education). 38. Strengthen skills and education (Partially Achieved). The Bank supported the TDP with the objectives of developing a high-quality, sustainable, demand-driven and equitable training system capable of improving skills in both the formal and informal sectors of the economy. The objectives were highly relevant as improving work-force skills, is critical for improvement of productivity and competitiveness. The objectives, however, were found to be excessively ambitious in relation to the allocated time and resources, the available capacity, and the institutional challenges and the incentives required in shifting the technical education and vocational training (TEVT) from supply to demand orientation (IEG (2011) Project performance Assessment Report (PPAR)).16 39. With the Bank support considerable progress was made toward raising the quality of the technical education system, in particular through the new quality assurance and curriculum development procedures implemented by the Technical Education Vocational and Entrepreneurship Training Authority (TEVETA). Buildings and new equipment were also procured for training institutions. Progress was also made toward increasing the demand orientation of training, by involving industry experts through TEVETA in setting standards, reviewing curricula, and developing modular and in-service training capacity (as envisaged in the CAS milestones). Other demand-relevant measures, including strengthening the influence of the private sector through local management boards of training institutions, and the channeling of government and private finance for training through the Technical
16 Considering the institutional challenges and the incentives required in shifting TVET from supply to demand orientation, involving changes in the expectations and behavior of public and private sector stakeholders, as well as the time needed to achieve demonstrated improvements in graduate outcomes throughout a reformed TVET system, it was unrealistic to expect to achieve the program objectives within five years or within the TDP budget.

113
Education Vocational and Entrepreneurship Training (TEVET) Fund, were not fully accomplished: management boards were established, with some delay, but they had limited authority and did not take on an important role; and the TEVET Fund was only briefly piloted with donor funding, without contribution from the government or private sector, hampering the Fund’s sustainability prospects. On the objective to create an equitable system, bursaries were awarded and sector policies were developed for gender and HIV/AIDS, contributing to the equity of the system. 40. The TEVET Fund lacked a viable financing strategy when the TDP ended. The initial proposal of introducing a payroll levy to help finance the TEVET Fund was not followed up and no alternative mechanism for private sector contributions was put forward. In the two years following closure of the project, government funding for the sector was not channelled (as had been agreed) through the TEVET Fund which therefore ceased operation. At the time of the IEG PPAR mission in 2011, the proposed autonomous status of the ministry-affiliated training institutions was not fully implemented in practice and their training operations continued to suffer from shortage and uncertainty of funding. The IEG mission found substantial disagreement among stakeholders on the best way forward for these institutions: whether to revert fully to direct Ministry of Science, Technology and vocational Training (MSTVT) funding and management, or pass control fully to the management boards and TEVETA. 41. The selection of outcomes indicators for the TDP reform did not focus on results that could be clearly and directly linked to the project interventions (already discussed in para 10). It would have been useful for the project to focus on indicators that could be directly linked to the Bank interventions—such as an established system for regular tracking of employment and incomes of graduates, with strong analysis and dissemination of the information. 42. Improve health planning in fighting malaria (Achieved). The Malaria Booster Program (IDA credit and Russian Trust Fund) has made a significant contribution to the increased coverage of key malaria prevention activities that took place between 2006-11. The CAS envisaged targets were substantially achieved that is: (i) the percentage of children under 5 years of age who slept under an insecticide treated bed net increased from 30 to 70%; (ii) the percentage of pregnant women who took 2+ doses of intermittent presumptive treatment (IPT) for malaria increased from 59 to 70%; and (iii) the percentage of households that have at least one insecticide treated net (ITN) increased from 38 to 64 percent. As a result of these interventions, the annual number of malaria deaths decreased by at least 50% during the period 2008-10. Additional financing for the Malaria Booster Program is supporting the purchase of bed nets in close collaboration with the UN and other development partners. The essential drugs public pilots program, supported by the Bank, has led to dramatic increase in the availability of drugs in rural areas. The Government has decided to scale-up the program and it is estimated that the improvement in the availability of Artemisinin Combination Therapy (ACT) will result in a 21% reduction in under-five child deaths due to malaria. The ESW—Improving Access to ACT—informed the Government’s scale-up decision.17 The Bank has also supported the Government to pilot innovative approaches to improve safe access to drugs through the private sector in underserved areas by piloting a price subsidy of ACTs and Rapid Diagnostic Tests to accredited private sector drug sellers in 4 districts in the country.
17 The Development Impact Evaluation Initiative (DIME) brief gives an overview, plus presentations on the public and private-sector arms of the study.

114
Cross Cutting Themes: Governance and HIV 43. Sector governance weaknesses. The World Bank was a strong voice among donors on critical governance issues during the CAS period. Concerns have been raised regarding governance issues involving the Ministry of Health and roads sector agencies. Implementation of programs in the roads sector was adversely impacted when the Office of the Auditor General (OAG) identified numerous instances of financial irregularity and implementation weaknesses in the roads sectors in 2009. To address the issues raised by the OAG, Government has responded expeditiously and has made good progress in developing and implementing a governance action plan, which included changes in the Board and Management of the Road Development Agency (RDA) and the National Road Fund Agency (NRFA). Similarly, the misappropriation of resources in the health sector resulted in disciplinary action against several officials from the Ministry of Health and substantial remedial actions being implemented to improve governance in the sector. 44. The Bank, jointly with the cooperating partners in these sectors, is taking the necessary actions to ensure that remedial measures are in place to correct the sector governance weaknesses. Specific steps in this regard also focus on safeguarding the proposed investments and ensuring that professional integrity and the principles of transparency and accountability are upheld.18 One notable step is that full implementation of the Road Sector Governance Plan (RSGP) as agreed and the inclusion of the plan as a covenant under the additional financing of the Bank-supported roads project (RRMP II). The Bank has been supporting the road sector at another level with implementation of efficiency improvements through performance-based contracting that resulted in significant cost savings and administrative improvements. Under ADSP the Bank supported the award of four Output and Performance-based Road Contracts on about 1,133 km of unpaved roads. These four contracts have 5-year duration and have replaced a multitude of traditional contracts with the contractor being paid a fixed monthly sum for providing the roads at a good level of service. These contracts reduced internal administration for the road sector (fewer contracts to let and administer) and resulted in about a 30% savings when compared to traditional contracts. These very positive results led the road sector to decide to roll out the OPRC-contracting methodology over the complete unpaved road network, a program aimed to commence in 2013 and to be fully implemented in 2018. In the health sector Government has engaged an independent fiduciary review agent who is addressing fiduciary concerns and building capacity in the sector. The Bank continues to work with the Government on improving public financial management and building institutions under the public service management program. 45. The Bank has also started, as a pilot approach, activities to improve accountability of the Government vis-à-vis citizens by supporting demand for good governance. User feedback mechanisms, community monitoring and stronger linkages are likely to lead to more effective institutions, processes and systems. A number of specific pilot activities are being undertaken: examples include (i) technical support to issues-based civil society coalitions (on procurement monitoring, freedom of information and monitoring of extractive industries) in the form of trainings, sensitizations and communications campaigns; (ii) capacity building of the media including journalism workshops and funded internships as well as the piloting of interactive radio programs that improve dialogue between rural constituents and their service providers; (iii) development of formalized beneficiary feedback mechanisms in Bank-funded projects. Each of these activities is being undertaken on an
18 See for example, “In depth Financial Review of First Additional Financing for Road Rehabilitation and Maintenance Project undertaken by the Bank in May 2010.

115
experimental basis and with an overall view towards finding what are the most effective means of stimulating and sustaining demand amongst Zambian citizens for good governance. 46. Social accountability in the mining sector. Building on progress achieved under the CEP, the ICR for that project proposed that future Bank programs should strengthen social accountability by engaging mining-affected communities and civil societies in measuring water, air and soil quality. The Bank’s comparative advantage in supporting these activities lies in its international experience in facilitating governance, on the demand side, by strengthening the environmental management capacity of community-based entities, such as Resident Development Committees, and NGOs, and on the supply side, by supporting the Government in providing an enabling environment to jointly improve governance and compliance in the mining sector which instills trust in local authorities and the government (ICR, p.16). This would also help enhance sustainability prospects of progress made. 47. HIV/AIDS. The Government’s FNDP emphasizes social sector development, including spending on HIV/AIDS, as important not only for improving social welfare but also for spurring economic growth. Zambia is still a hyper-epidemic country (with prevalence of HIV in population ages 15-45 amounting to 14%) and will continue to face the consequences of HIV/AIDS in the medium and long terms, making these objectives strongly relevant vis-à-vis the epidemiology in the country. The objectives of the Bank-supported Zambia National Response to HIV/AIDS (ZANARA) project, to reduce the spread of HIV and AIDS, mitigate the socio-economic impact of the disease, and increase access to care and support for people infected or affected by HIV and AIDS in Zambia, was consistent with the FY08 CAS. It is worth noting that high-risk, high-transmission groups (e.g. miners, sex workers, and long-distance truck drivers) were not fully captured in the objectives. In addition, the ICR noted (p.91) an opportunity to undertake a baseline survey to define the starting point of project activities was missed. This, followed by impact assessments done at the conclusion of the project would have allowed a more systematic measure of the impact of the project on key sectors. 48. The ZANARA project provided about US$55 million for HIV/AIDS along with global funds, namely, the Global Fund to fight AIDS, Tuberculosis and Malaria (GFATM) (US$300 million in grants) and the US President’s Emergency Plan for AIDS Relief (US$577 million), covering treatment, prevention and care (IEG ICR Review). Thus the outcomes cited below are not necessarily entirely attributable to the Bank project.
49. The Bank objective of preventing and reducing the spread of HIV/AIDS was substantially achieved and gender disaggregated data is provided by the ICR.19 Measures to mitigate the socioeconomic impact of HIV/AIDS were effectively introduced. For example, school enrollment among orphans and vulnerable children exceeded the target and about 88% of orphans and vulnerable children attending school, compared with 91% of other children. Progress in terms of increased access to care and support—through provision of drugs for treatment, training in advocacy and positive living, syndrome management and home-based care—was modest (IEG ICR Review, 2010).
50. Some lessons learned included: despite the progress achieved, prevention of new HIV infections at community level is still a challenge and should receive priority for the next generation of subprojects,
19 Outcomes reported by the ICR include condom use increased from 44% in 2002 to 50% in 2008 for males (DHS) (against a target increase of 15 percentage points – from 30 percent to 45 percent); among women in the same age group, condom use increased from 33% in 2002 to 37.4% in 2008 (exceeding the target of 30 percent). During the same period, the percentage of youth’s age 15-24 years who knew that abstaining from sexual intercourse is a key intervention to prevent HIV transmission increased to 83% among females, and 84% among males.

116
according to the ICR (p.41). Communities should be encouraged to improve their understanding of the dynamics of a generalized epidemic and the remedies needed to address it. Mainstreaming HIV and AIDS in line ministries took the form of a standard menu of interventions. Interaction between ministries was enhanced through the planning meetings. This opened avenues for sharing information and lessons learnt in implementation of work place activities. However, there is also an urgent need to strengthen work place programs within the private sector especially small business. Finally, sustainability remains a challenge. Availability of internal and external resources is limited, particularly considering the global financial crisis. For example, the GFATM’s current 10% cut on round 8 and further 25% cuts in future GFATM funding will certainly limit Zambia ability to further expand HIV programs to vulnerable populations. IV. World Bank Performance
51. The Bank strategy was guided by a substantial program of analytical and advisory services and non-lending technical assistance from both the Bank and IFC. Several key economic and sector work were important forerunners to reform dialogues and lending operations as noted below; but a governance diagnostic study would have been desirable given governance weaknesses in several sectors.
• The Public Expenditure Review (PER, 2010) influenced the design of measures to strengthen efficiency and equity in public spending and suggested measures to improve the budget and planning processes, as well as to account properly for the economic effects of an exhaustible resource such as copper, and the need to improve project-specific investment management. The PER provides a detailed analysis of the major infrastructure sub-sectors, such as roads and water and the lending program including the PRSC series draw heavily on the PER.
• The Poverty and Vulnerability Assessment (2007) found that despite recent gains, poverty levels are unacceptably high in Zambia, especially among the rural poor. The assessment identified major challenges faced by the country in its efforts to reduce poverty and promote economic equity and guided the preparation of the PRSC series.
• The Bank and IFC were very responsive, as evidenced by quick response to Government demand on the Doing Business agenda that yielded Zambia’s performance as top ten reformers in 2011. The World Bank worked in close collaboration with IFC, through the joint Investment Climate Advisory Services, on the implementation of Doing Business and business license reforms. The first Investment Climate Program started in 2009 and ended in December 2010.
• A number of sector studies such as the tourism study and the study on copper identified key issues and helped inform sector analyses and policies.
52. In some cases, the objectives and design of assistance were complex and ambitious, particularly in light of the country’s weak implementation capacity. For the TDP, with nine separate components, it was unrealistic to expect to achieve the program objectives within five years or within the TDP budget. The TDP experienced a two-year extension. Likewise, the ICR for the CEP project noted in para 22, “the approach was rather complex, and, in retrospect, achieving the proposed outcomes within the original timeframe of the project (5 years) was overly optimistic”. The CEP project closing date was extended by nearly 3 years. Similarly, there were delays over the life of the WSPIP mainly due to the two year effectiveness delay due to the non-payment of government debt to the Lusaka Water and Sewerage Company. The implementation of the Increased Access to Electricity Services (IAES) Project was, however, slower than expected due to management changes at ZESCO and long lead times needed for procurement.

117
53. Project design often did not take into sufficient account the challenges of stakeholder ownership and participation and their implication in implementation and sustainability. Project design is often not based on in-depth information and analysis of the relevant strength, perceptions, interests and incentives of different stakeholder groups; all necessary for facilitating implementation and ensuring sustainability. While the CEP design envisioned meaningful participation of mining communities, this did not materialize during implementation. A more proactive involvement of mining communities would have also helped to ensure sustainability. Low level of ownership and lack of strong leadership are particularly noticeable in public sector reform, as evidenced by significant delays in implementing, the IFMIS and the broader PEMFA program. An independent evaluation of PEMFA notes that an underlying requirement for successful PEMFA reform is the vital importance of ownership. 20 54. The CAS results matrix does not clearly show the link between projects/AAA and outcomes. The design and implementation experience of the FY08-11 CAS showed the link between projects and CAS outcomes was sometimes weak. The selection of outcome indicators for a project/program was not always based on results that can be clearly and directly attributed to the program interventions. The ADSP that aimed to increase cotton exports is a notable example. The selection of the exports indicator raises the question of attribution and controlling for other factors. It may be more useful for ADSP to focus on indicators that can be directly linked to the Bank interventions—such as crop diversification—than on trying to demonstrate higher level impacts—such as increasing exports—within the course of one institutional reform project. The TDP program is another example. By focusing on higher level CAS outcome objectives, such as the employment of TEVET graduates, the TDP results framework failed to make explicit the linkages or chain between program outputs and outcomes. 55. The Bank collaborated with other development partners and mobilized a high parallel/co-financing ratio for its support. The Bank is part of a group of eight development partners supporting the road sector and the Bank attracted US$270 million in co-financing against its support of US$ 90 million for the road project (RMDT), a ratio of US$3 on every Bank dollar. Similarly the Bank contributed US$8million towards a US$76 million PEMFA program and US$24 million towards a US$78 million TDP program. The ZANAR program triggered an inflow of financing from global funds. The Bank is a lead donor in six clusters and cross cutting themes (i.e. transport, energy, water &sanitation, tourism, environment and natural resources, and macroeconomics) and is playing an active role in six other clusters/sectors, including agriculture, education and health. High co-financing ratios were raised by the PRSC series that draws upon a collaborative and harmonized process for providing budget support to the GRZ by donors. Zambia’s seven development partners—including the Bank—that provide budget support have formed the Poverty Reduction Budget Support (PRBS) group. The PRBS group has agreed on a common review process, the Performance Assessment Framework (PAF), which is a multi-year matrix of policy reforms supported by the PRBS group and the PRSCs prior actions are drawn from the PAFs. 21 The Bank’s harmonization and close collaboration with the PRBS group was facilitated by the presence of the PRSC task team leaders in the Country Office. 56. Going forward the Bank and donors are looking for ways to further strengthen harmonization. Some studies have noted areas for further improvement in harmonization and
20 Public Expenditure Management and Financial Accountability (PEMFA) Program Evaluation, Overview Report, prepared on behalf of Ministry of Finance and National Planning, Government of the Republic of Zambia by REPIM in association with Oxford Policy Management, Aug. 2010. 21 While budget support targeted poverty reduction, the PAFs do not include indicators for the measurement of poverty.

118
alignment in line with Paris Declaration.22 Similarly, an evaluation of the first Joint Assistance Strategy for Zambia (JASZ, 2007-2010)—that was meant to help improve aid effectiveness and manage donor cooperation in line with Paris Declaration and the FNDP— found that the JASZ has been less effective in enhancing government ownership, building mutual accountability between government and development partners, and managing for results. 23 More recently, the World Bank Group along with the donor community is working on a Mutual Accountability Framework to not only improve the process but also the outcomes of harmonization. There is also on-going effort among cooperating partners about strategies for mainstreaming the gender agenda. Portfolio Performance 57. The IDA lending program proceeded as anticipated with few exceptions. The proposed competiveness DPL operations as well as the three investment credits (Hydro Energy Generation, Small Towns Water and Sanitation Services Project and Water Resource Development Project) were dropped or delayed, and the Kafue-Livingstone transmission Upgrade Project and additional financing for Malaria Booster SIL, Water Sector Performance Investment Project, Increased Access to Electricity Services, were added. The CAS had planned 11 projects, of which 8 were delivered during the CAS period (not counting those regional/global projects). Overall lending for FY08-11 amount to US$362 in line with the original CAS lending allocation. The country program also included 45 Zambia specific trust funds (amounting to US$124 million. Four of these trust funds were approved in the last year of the CAS (Annex 11). In addition, Zambia also benefited from global and regional trust funds. 58. Completed and ongoing projects have mostly MS performance. Three completed projects with total net commitment of over US$140 million were rated MS by IEG (Annex Table 3). The SEED, the Public Service Management Program Support project (PSMPSP), the CEP and the PRSP series also closed during the CAS period. The CEP project was rated MS by the ICR but the IEG ICR reviews for it is still being finalized. The SEED project was however, rated MU by the ICR and by IEG. The ICRs for the PSMPSP and the PRSP series are under preparation. Zambia’s current portfolio comprises eight investment operations (Annex Table 4) with commitments of US$503.2 million. ISRs rate progress towards DO as fully S (3) and MS(5). Implementation progress was rated as fully S(2), MS (5) and MU (1) as of December 18th.
59. The quality of the portfolio has improved. With respect to the quality of the portfolio, over 20% of the portfolio was deemed projects at risk during FY09-11, but this was reduced to zero percent by FY12. However, the country risk flag continues. Overall, Zambia’s commitments at risk were on line with the Sub-Saharan African countries (SSA) average during FY09-11, but much better in FY12 (Annex Table 4). 60. The Zambian country assistance program is relatively expensive. The average cost of project preparation during the CAS period was US$412, 000, higher than the SSA average of about US$336, 000. The average cost of supervision was US$138, 000 per project, above the regional average of US$110, 000. The high cost of the assistance program suggests that the projects being prepared could be complex and taking too long to prepare. 22 A donor-led evaluation of budget support in Zambia concludes that budget support has helped to realize a number of objectives in Zambia but notes that budget support could have been more effective and that the weaknesses on the part of the Government as well as a lack of harmonization on the donor side have undermined the potential of the instrument. A. de Kemp, J. Faust, and s. Leiderer (2011). Between high expectations and reality: An evaluation of budge support in Zambia. 23 See Joint Assistance Strategy for Zambia II (2011-2015) prepared by the AfDB, CIDA, Demark, EU, Finland, Germany, Irish Aid, Japan, Netherlands, Norway, Sweden, UK, UN, and USA, November 2011, p.3.

119
61. The disbursement rate in the CAS period sharply declined, compared with SSA and Bank-wide trends but has picked up in the last six months. There was a consistent decline in IDA disbursements to Zambia during the CAS period, when the rate dropped from about 29% in FY08 to 18% in FY11 and further to about 11% in FY12 (Table 2). Disbursements have picked up in the last quarter and for FY13 Zambia’s disbursement ratio is 7.1 as of December 18th. Slow disbursing projects include the 8-year old road project (RRMP) with a disbursement ratio of 63% and the 5.5-year old water project (WSPIP) that spends just over half of its budget. The low disbursement rates reflected delays associated with project implementation and the adverse impact of the death of the Zambian president and national elections that followed on the Bank program during FY09-10. In addition, the low disbursements appear to be the results of an extended project cycle, slow preparation, poor readiness for implementation, slow start-up, and routine extensions. The overall disbursement rates for SSA and Bank-wide fluctuated during the period under review, but remained higher than Zambia’s rate until FY 12. Table 2: Disbursement Ratio for Zambia, SSA and Bank-wide (%), FY08-FY13 Q2
FY08 FY09 FY10 FY11 FY12 FY13 (as of Dec. 18, 2012)
Zambia 29.4 24.5 19.0 18.3 10.9 7.1 SSA 22.7 23.8 24.0 19.3 19.0 7.1 Bank-wide 22.1 26.5 26.9 22.4 19.2 7.8
Source: Business warehouse
62. Bank performance. The FY08 CAS was aligned with the government’s strategy and the Bank responded swiftly to the government’s request for support in the area of business environment. A number of key outcomes were achieved and a broadly sound assistance program, particularly for promoting agricultural development was put in place with the approval of the Irrigation and Livestock Development projects in FY11 and 12. Preparation also began for a regional agriculture research project which will be approved in 2013. A broad range of relevant analytical work was also undertaken and will provide the basis for dialogue and interventions in a range of sectors during the next strategy. However, the overall assistance program turned out to be ambitious for the period and the circumstances of Zambia.
63. The CAS was a results-based one, but the Bank, in some cases, did not pay adequate attention to the development of realistic and monitorable indicators. The weak results framework was corrected during the CASPR. Implementation of on-going projects proceeded slowly, primarily because of ambitious design relative to existing capacity, but the outcome of completed projects was mostly moderately satisfactory. The AAA activities undertaken by the Bank were relevant, of high quality and helped the Bank carry out its strategy. The Bank managed to maintain a dialogue with the government and donors and having an office in Lusaka has helped. The Bank collaboration with other development partners helped leverage additional donor resources and strengthen prospects for reforms. On balance, Bank performance is rated moderately satisfactory. V. Lessons Learned for Subsequent Strategy Design
64. Several lessons have been learnt from implementation of the FY08CAS, and which will be brought to bear in the design of new projects and the scope and composition of the new CPS 2013-2016:

120
65. The CPS needs to be more realistic in its strategic objectives and consistent with allocated time and resources, and available capacity. The CPS should not underestimate key risks: in particular, complex project/program design and implementation challenges; shortage of skills and capacity for implementation; sufficient attention must be given to ensuring readiness for implementation (e.g., through piloting); and developing adequate results framework and M&E system. 66. Simplification of project design in future operations is critical to avoid implementation delays. Many projects were extended, signifying the need to pay attention to design and capacity issues that have contributed to delays in implementation. A simpler design based on available capacity and on in-depth information and analysis of the relevant strength, perceptions, interests and incentives of different stakeholders may help ameliorate implementation delay risks. While community consultations were extensive during the preparation of the mining environment management plan (i.e. the identification of potential subprojects), the extent of community involvement in the implementation of remedial subprojects (e.g. through labor-intensive public works opportunities), was lower than anticipated, and may have adversely affected their sustainability and ownership as mining-affected communities may have felt that they did not share the benefits of a prosperous extractive industry. In the TDP and IFMIS programs attention was given to the technical soundness of the vision for the new demand-driven vocational training system and the new PFM system but not enough to the implementation challenges (which produces winners and losers) -and the need to ensure buy-in by different stakeholders to their new roles. Strengthening stakeholder involvement and participation would enhance ownership and sustainability. 67. The need for a sound CPS results matrix that clearly shows the link between projects/AAA and outcomes. The selection of indicators for a CPS should focus on results that can be clearly and directly linked to the Bank instruments. A more explicit results chain showing how inputs and outputs would produce outcomes to meet objectives needs to be explicitly laid out. Selection of some of the outcome indicators such as the employability of graduates and increased cotton exports raises the question of attribution and controlling for other factors. It would be better in such cases – when higher level outcomes cannot be expected within the time frame of the project, or the specific contribution of the project interventions cannot readily be separated from other factors – to focus on the intermediate outcomes for which the project or program can clearly be held accountable. In addition, a sound results matrix would require baselines for subsequent evaluations to be established right from the beginning so that preliminary results are available at CPS Progress Report/MTR to discern whether changes to the results are warranted. 68. An explicit approach of “incremental progress” by all the parties involved has proven effective in Zambia. This approach involved the Bank staying the course in a particular policy area and addressing the same or closely related issues in that policy area with successive analytical work or lending operations, but each time incrementally and patiently introducing additional measures until more complete progress was achieved over time. This approach worked particularly well in energy sector, where the Bank assistance supported the country expand access to electricity, improve the efficiency of the electricity company, and introduce tariff reforms that enhanced the financial viability of the sector, resulting in recent foreign investment in power generation. Similarly, the incremental progress constituted a needed investment in building blocks required for success over a longer period in the areas such as public financial management (PFM) and business environment.
69. The Bank should continue to forge close partnership with other development partners to leverage resources and strengthen prospects for reforms. The experience during this strategy period showed that the Bank mobilized a high co-financing ratio for its relatively small assistance program and worked in close collaboration with other development partners including PRBS group in helping the

121
GRZ implement reforms supported by general budget support or sector/investment support. The Bank’s harmonization and close collaboration with other budget support development partners was facilitated by the presence of the PRSC task team leaders in the Country Office. Nevertheless, further improvement in harmonization and alignment in line with Paris Declaration is needed.

122
Annex Table 1: Comparison of Planned and Actual Lending FY08-12 Planned FY08
Actual FY08
Economic Management and Growth Credit II Energy Efficiency Improvement and Access Project
Economic Management and Growth Credit II - $10m Increased Access to Electricity Services SIL - $33m Increased Access to Electricity (GEF Funded) - $4.5m
FY09 FY09(Bank program impacted by the death of President Mwanawasa and national elections that followed)
Roads Rehabilitation and Maintenance Project II Competitiveness DPL Poverty Reduction Support Credit I
Water Sector Performance Improvement Project – Additional Financing - $10m
FY10 FY10 Water Resources Development Project Irrigation Development Project Poverty Reduction Support Credit II Kasanka and Lavushi Manda NP (GEF)
Roads Rehabilitation and Maintenance Project II - $75m Poverty Reduction Support Credit I - $20m Kasanka and Lavushi Manda NP (GEF)-$0.8m
FY11 FY11 Hydro Energy Generation Project Small Towns Water and Sanitation Project Poverty Reduction Support Credit III Kafue-Livingstone Transmission Upgrade Project Nyika TFCA (GEF w/Malawi)
RRMP II – Additional Financing - $15m IAES – Additional Financing - $20m Malaria Booster Program – Additional Financing - $30m Irrigation Development and Support Project - $115m Poverty Reduction Support Credit II - $30m
FY12 FY12 Livestock Development Project Water Resources Management Project Poverty Reduction Support Credit III-$30m
Kafue-Livingstone Transmission Upgrade Project -$60m Zambia Livestock Development and Animal Health project -$50m Zambia Poverty Reduction Support Credit III - $30m Nyika TFCA (GEF w/Malawi) -$2.5 m
FY 13 PIPELINE Zambia Water Resources Development Project- $50m ZM-Electricity Distribution Rehabilitation - $100m ZM: Strengthening Climate Resilience (PPCR phase II) -$33m Regional Agricultural Productivity Program for Southern Africa (APPSA) -$10m ( National IDA)
Regional Programs a
Planned Actual FY08 GEF MSP Open Africa South-North Tourism Corridor(Zambia -Namibia) FY09 GEF FSP Sustainable Management of Nyika TFC ( Zambia -Malawi)* Southern Africa Power Market Program (Zambia-Tanzania Interconnection) Dropped Eastern & Southern Africa TA for Large Infrastructure Projects Dropped FY10
Regional Communication Infrastructure Program (Telecommunications)
There are RCIP programs for Kenya, Madagascar, Burundi, Rwanda, Malawi, Mozambique and Tanzania with the Comoros to be added this FY. This was not raised as a priority by the CMU during the last few rounds of consultations so no project has materialized including Zambia.
Nacala Development Corridor Dropped Southern Africa Transport Corridors HIV/AIDS Program (regional) Dropped FY11
GEF MSP Open Africa South-North Tourism Corridor(Zambia -Namibia)*
FY12
GEF FSP Sustainable Management of Nyika TFC ( Zambia -Malawi)*
Kafue-Livingstone Transmission Upgrade Project* Note: a This separate section on regional programs has been added to include projects that IEG requested after the report was submitted to IEG on December 20, 2012. There is some repetition of projects from the section above.
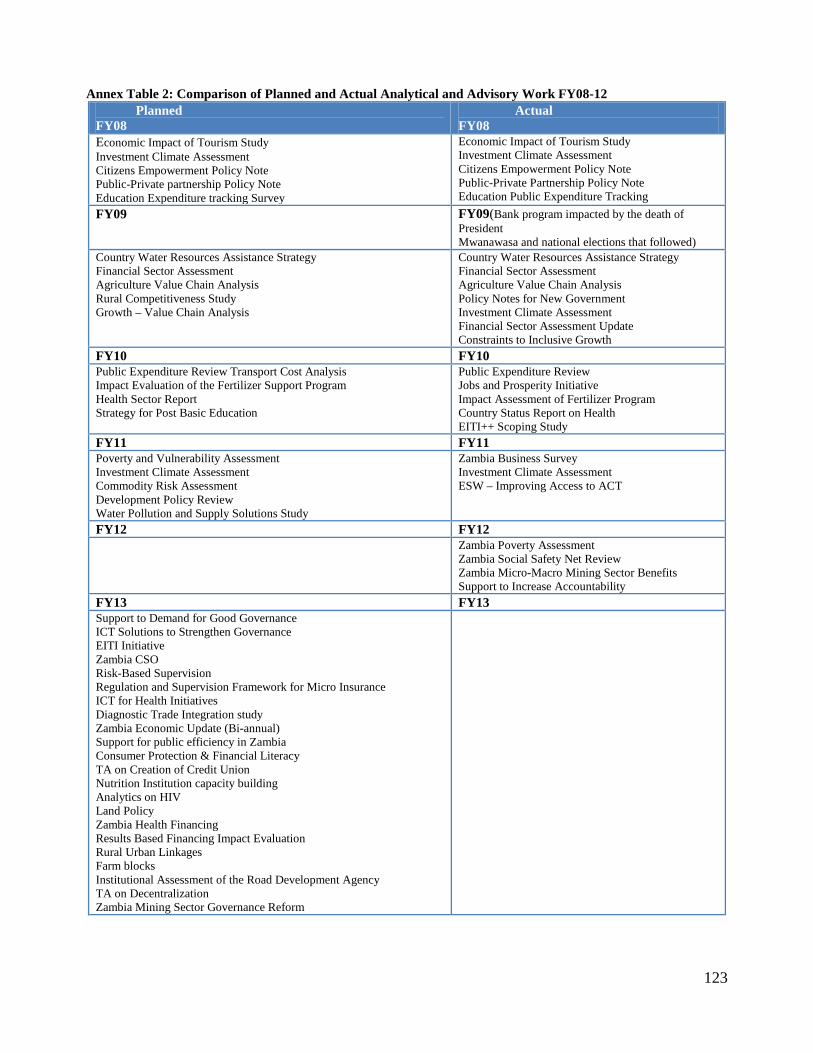
123
Annex Table 2: Comparison of Planned and Actual Analytical and Advisory Work FY08-12 Planned FY08
Actual FY08
Economic Impact of Tourism Study Investment Climate Assessment Citizens Empowerment Policy Note Public-Private partnership Policy Note Education Expenditure tracking Survey
Economic Impact of Tourism Study Investment Climate Assessment Citizens Empowerment Policy Note Public-Private Partnership Policy Note Education Public Expenditure Tracking
FY09 FY09(Bank program impacted by the death of President Mwanawasa and national elections that followed)
Country Water Resources Assistance Strategy Financial Sector Assessment Agriculture Value Chain Analysis Rural Competitiveness Study Growth – Value Chain Analysis
Country Water Resources Assistance Strategy Financial Sector Assessment Agriculture Value Chain Analysis Policy Notes for New Government Investment Climate Assessment Financial Sector Assessment Update Constraints to Inclusive Growth
FY10 FY10 Public Expenditure Review Transport Cost Analysis Impact Evaluation of the Fertilizer Support Program Health Sector Report Strategy for Post Basic Education
Public Expenditure Review Jobs and Prosperity Initiative Impact Assessment of Fertilizer Program Country Status Report on Health EITI++ Scoping Study
FY11 FY11 Poverty and Vulnerability Assessment Investment Climate Assessment Commodity Risk Assessment Development Policy Review Water Pollution and Supply Solutions Study
Zambia Business Survey Investment Climate Assessment ESW – Improving Access to ACT
FY12 FY12
Zambia Poverty Assessment Zambia Social Safety Net Review Zambia Micro-Macro Mining Sector Benefits Support to Increase Accountability
FY13 FY13 Support to Demand for Good Governance ICT Solutions to Strengthen Governance EITI Initiative Zambia CSO Risk-Based Supervision Regulation and Supervision Framework for Micro Insurance ICT for Health Initiatives Diagnostic Trade Integration study Zambia Economic Update (Bi-annual) Support for public efficiency in Zambia Consumer Protection & Financial Literacy TA on Creation of Credit Union Nutrition Institution capacity building Analytics on HIV Land Policy Zambia Health Financing Results Based Financing Impact Evaluation Rural Urban Linkages Farm blocks Institutional Assessment of the Road Development Agency TA on Decentralization Zambia Mining Sector Governance Reform

124
Annex Table 3a: IEG Project Rating for Zambia, FY08-12 Closed Projects Evaluated by IEG Exit FY Project Name Total Evaluated ( US$M) IEG Outcome IEG Risk to Development
Outcome* Project ID
2009 ZM-Zanara HIV/AIDS APL (FY03)
50.5 MODERATELY SATISFACTORY
MODERATE P003248
ZM-TEVET SIM (FY01)
27.8 MODERATELY SATISFACTORY
SIGNIFICANT P057167
ZM-Econ Mgmt & Growth Credit 2
9.6 MODERATELY SATISFACTORY
SIGNIFICANT P074445
Source: Business Warehouse Table 4a.5 as of 10/31/2012. Note: Since the report was sent to IEG on December 20, 2012, two additional ICR reviews were finalized by IEG—one on the Copperbelt project that was rated moderately satisfactory and the other on the SEED project that was rated moderately unsatisfactory
Annex Table 3b: IEG Project Rating for Zambia and Comparators Region Total Evaluated
($M) Total Evaluated (No)
Outcome % Sat/Ms($)
Outcome % Sat /Ms(No)
RDO % Moderate or Lower ($)
RDO % Moderate or Lower (No)
Zambia 87.9 3 100 100 57.5 33.3 Malawi 191.2 6 74.3 66.7 33.0 33.3 Angola 107.9 3 87.0 66.7 31.2 33.3 Tanzania 810.9 10 54.5 50 28.2 20.3 AFR 10,874.1 206 77.1 66.7 38.5 39.0 World 63,831.4 823 84.7 73.0 68.7 55.8
Source: WB Business Warehouse Table 4a.6 and 4a.5 as of 10/31/12
Annex Table 4: Portfolio Rating for Zambia and Comparators, FY08-12 Fiscal year 2008 2009 2010 2011 2012 Zambia
#Proj 11 8 10 9 8
# Proj At Risk 0 2 2 2 0 Net Comm Amt 363.4 296.4 391.4 511.4 503.2 Comm At Risk 0.0 58.2 115.0 118.2 0.0 % Commit at Risk 0.0 19.6 29.4 23.1 0.0
Malawi # Proj 11 9 11 12 13
# Proj At Risk 1 3 2 1 0
Net Comm Amt 364.9 309.9 479.2 662.8 860.8 Comm At Risk 20.0 97.0 80.0 64.0 0.0 % Commit at Risk 5.5 31.3 16.7 9.7 0.0
Angola # Proj 6 6 8 5 5 # Proj At Risk 2 5 5 5 4 Net Comm Amt 278.3 277.3 429.8 461.5 461.5 Comm At Risk 152.7 256.3 256.3 461.5 284.5 % Commit at Risk 54.9 92.4 59.6 100.0 61.6
Tanzania # Proj 23 26 24 23 22 # Proj At Risk 2 3 2 5 6 Net Comm Amt 1,984.9 2,444.9 2,687.3 2,572.9 2,680.8 Comm At Risk 103.5 117.0 240.0 565.0 724.9 % Commit at Risk 5.2 4.8 8.9 22.0 27.0
AFR # Proj 376 385 401 418 404 # Proj At Risk 80 111 115 94 91 Net Comm Amt 20,940.8 25,394.1 31,567.0 34,987.4 36,698.7 Comm At Risk 4,383.5 5,914.7 7,914.7 6,083.5 4,869.1 % Commit at Risk 20.9 23.3 25.1 17.4 13.3
World # Proj 1,372 1,393 1,432 1,438 1,357 # Proj At Risk 243 303 318 291 293 Net Comm Amt 102,189.5 126,161.9 153,505.2 163,769.5 164,414.1 Comm At Risk 16,735.5 18,630.2 26,240.1 20,855.3 21,970.4 % Commit at Risk 16.4 14.8 17.1 12.7 13.4
Source: WB Warehouse Table 3a.4 as of 10/31/2012

125
Annex Table 5: IBRD/IDA Net Disbursement and Charges Summary Report for Zambia
Source: Loan Kiosk - Disbursements NOTE: Net Disbursement and Charges Report (in US Dollars) as of 11/4/2012 The Interest column is charges and Fees is service charges and commitment fees. Net Transfer is equal to Net Disbursement minus Interest Annex Table 6: Total Net Disbursements of Official Development Assistance (ODA) and Official Aid, 2004-2010 (in US$ million)
Bilaterals 2004 2005 2006 2007 2008 2009 2010 Australia 0.81 0.27 0.49 1.13 1.13 1.49 1.95 Austria 0.32 0.24 8.43 0.08 0.04 .. .. Belgium 3.4 3.38 4.16 0.97 2.17 1.89 1.85 Canada 24.98 49.7 10.62 23.83 14.25 12.95 8.69 Denmark 45.1 48.43 48.66 49.85 35.08 47.82 24.93 Finland 6.07 8.82 8.54 21.21 16.51 24.52 21.68 France 103.8 15.81 63.71 1.11 1.22 7.37 0.84 Germany 36.22 118.15 287.54 40.68 45.47 55.53 33.28 Greece 0.11 0.11 0.16 0.28 0.43 0.1 0.05 Ireland 25.44 27.58 31.13 37.14 43.41 38.16 33.02 Italy 1.73 0.23 51.66 0.45 5.86 1.95 1.39 Japan 14.25 131.94 31.53 94.61 37.14 36.64 46.14 Korea 0.02 0.11 0.21 1.05 0.68 0.92 0.62 Luxembourg .. .. 0.01 0.01 .. .. .. Netherlands 53.55 55.94 55.7 71.54 85.05 64.79 36.07 New Zealand 0.57 0.69 0.67 0.66 1.17 1.87 1.32 Norway 37.36 48.97 66.22 74.42 73.27 62.69 54.05
Spain 0.94 0.2 0.35 0.93 1 11.8 0.16 Sweden 26.22 34.2 48.28 53.69 51.54 24.23 21.86 Switzerland 0.62 1.32 0.64 0.81 0.39 0.47 0.61 United Kingdom 282.55 165.73 86.77 74.02 61.56 73.53 79.3 United States 81.77 110.79 309.91 165.29 226.49 231.86 225.12 DAC Countries, Total 745.83 822.61 1115.39 713.76 703.86 700.58 592.93
Cyprus .. 0.01 0.02 0.01 .. .. .. Czech Republic 0.13 0.36 0.87 0.41 0.96 1.31 0.78 Israel 0.01 0.04 0.02 .. 0.03 0.01 0.02 Kuwait 2.38 1.57 0.83 -0.99 -1.08 0.39 -1.01 Poland 0.01 0.02 0.03 0.06 0.4 0.4 0.19 Thailand .. .. 0.01 .. 0.01 .. .. Turkey .. .. 0.05 0.1 0.03 0.01 0.01 United Arab Emirates .. .. .. .. .. .. 0.04 Non-DAC Countries, Total
2.53 2 1.83 -0.41 0.35 2.12 0.03
Multilaterals AfDB .. 7.11 13.51 10.23 5.01 4.71 2.72
YEAR LOAN COUNT
GROSS DISB REPAYMENTS NET DISB INTEREST FEES NET TRANSFER
FY08 26 68,947,572.36 536,468.75 68,411,103.61 1,040,609.94 1,484,963.93 67,370,493.67
FY09 27 54,738,811.02 768,788.19 53,970,022.83 0 2,671,386.91 53,970,022.83
FY10 26 27,199,867.57 1,241,383.57 25,958,484.00 0 2,975,530.11 25,958,484.00
FY11 30 89,985,602.89 2,749,543.89 87,236,059.00 0 3,138,251.03 87,236,059.00
FY12 33 68,863,073.04 3,576,741.07 65,286,331.97 0 3,698,267.68 65,286,331.97
FY13 27 20,634,136.46 1,348,720.89 19,285,415.57 0 1,736,188.65 19,285,415.57
Grand Total
169.00 330,369,063.34 10,221,646.36 320,147,416.98 1,040,609.94 15,704,588.31 319,106,807.04

126
Bilaterals 2004 2005 2006 2007 2008 2009 2010 AfDF 10.7 16.03 76.88 19.96 44.06 34.53 55.31 BADEA 1.13 0.25 1.72 0.15 -0.32 0.95 -0.08 EU Institutions 123.78 139.08 98.27 66.44 134.97 152.35 92.53 GAVI .. .. .. 4.79 8.16 3.63 7.76 GEF 3.28 6.56 0.21 4.74 5.43 .. .. Global Fund 43.96 52.09 25.7 41.84 102.9 55.19 40.96 IAEA .. .. 0.49 0.36 0.83 0.34 0.56 IDA 156.02 100.58 60.84 70.76 58.51 42.58 33.45 IFAD 3.18 2.83 4.48 1.43 0.94 1.39 1.71 IMF (Concessional Trust Funds)
-4.46 -6.92 24.28 42.06 11.04 243.52 55.29
Nordic Dev.Fund 4.11 2.4 1.2 1 1.93 3.63 2.57 OFID 9.56 2.32 5.77 1.88 0.39 -0.19 -1.67 UNAIDS .. 0.78 1.23 2.01 0.79 0.87 0.95 UNDP 4.34 5.27 8.36 3.71 12.61 -0.24 6.04 UNFPA 1.48 1.75 1.18 1.91 3.1 3.28 3.68 UNHCR 10.41 2.22 1.82 2.58 3.12 3.7 2.39 UNICEF 4.01 4.53 5.75 10.01 8.81 8.95 8.99 UNTA 2.95 3.17 2.2 2.6 1.63 .. .. WFP 7.66 7.39 16.43 6.03 8.12 5.17 8.05 Multilateral, Total 382.11 347.44 350.32 294.49 412.03 564.36 321.21 All Donors, Total 1130.47 1172.05 1467.54 1007.84 1116.24 1267.06 914.17
Source: OECD Stat. as of 17/04/12 16:19 UTC (GMT)

127
Annex Table 7: Zambia – Millennium Development Goals
1990 1995 2000 2005 2010
Employment to population ratio, 15+, total (%) 65 65 70 67 67Employment to population ratio, ages 15-24, total (%) 47 48 53 52 51GDP per person employed (constant 1990 PPP $) 2,154 1,561 1,566 1,811 2,174Income share held by lowest 20% .. 4 3 4 ..Malnutrition prevalence, weight for age (% of children under 5) 21 20 20 15 ..Poverty gap at $1.25 a day (PPP) (%) 40 29 27 37 ..Poverty headcount ratio at $1.25 a day (PPP) (% of population) 61 62 56 69 ..Vulnerable employment, total (% of total employment) 65 78 81 81 ..
Literacy rate, youth female (% of females ages 15-24) 66 .. 66 .. 67Literacy rate, youth male (% of males ages 15-24) 67 .. 73 .. 82Persistence to last grade of primary, total (% of cohort) .. .. 66 75 53Primary completion rate, total (% of relevant age group) .. .. 63 87 103Total enrollment, primary (% net) 83 75 71 96 93
Proportion of seats held by women in national parliaments (%) 7 10 10 13 14Ratio of female to male primary enrollment (%) 91 92 93 96 101Ratio of female to male secondary enrollment (%) 59 .. .. .. ..Ratio of female to male tertiary enrollment (%) 39 .. 46 .. ..Share of women employed in the nonagricultural sector (% of total nonagricultural employment) 16.6 .. 22.0 .. ..
Immunization, measles (% of children ages 12-23 months) 90 86 85 85 91Mortality rate, infant (per 1,000 live births) 114 108 91 76 56Mortality rate, under-5 (per 1,000 live births) 193 184 154 127 90
Adolescent fertility rate (births per 1,000 women ages 15-19) .. 143 153 152 142Births attended by skilled health staff (% of total) 51 47 47 47 ..Contraceptive prevalence (% of women ages 15-49) 15 26 22 41 ..Maternal mortality ratio (modeled estimate, per 100,000 live births) 470 530 540 500 440Pregnant women receiving prenatal care (%) 92 96 83 94 ..Unmet need for contraception (% of married women ages 15-49) 31 27 13 27 ..
Children with fever receiving antimalarial drugs (% of children under age 5 with fever) .. .. 58 58 34Condom use, population ages 15-24, female (% of females ages 15-24) .. 11 17 17 ..Condom use, population ages 15-24, male (% of males ages 15-24) .. 34 36 39 ..Incidence of tuberculosis (per 100,000 people) 710 788 713 566 462Prevalence of HIV, female (% ages 15-24) .. .. .. .. 8.9Prevalence of HIV, male (% ages 15-24) .. .. .. .. 4.2Prevalence of HIV, total (% of population ages 15-49) 12.7 15.0 14.4 13.9 13.5Tuberculosis case detection rate (%, all forms) 30 51 68 76 73
CO2 emissions (kg per PPP $ of GDP) 0 0 0 0 0CO2 emissions (metric tons per capita) 0 0 0 0 0Forest area (% of land area) 71.0 .. 68.8 67.7 66.5Improved sanitation facilities (% of population with access) 46 47 47 48 48Improved water source (% of population with access) 49 51 54 58 61Marine protected areas (% of territorial waters) .. .. .. .. ..Net ODA received per capita (current US$) 60 228 78 102 71
Debt service (PPG and IMF only, % of exports, excluding workers' remittances) 15 18 16 6 1Internet users (per 100 people) 0.0 0.0 0.2 2.9 10.1Mobile cellular subscriptions (per 100 people) 0 0 1 8 42Telephone lines (per 100 people) 1 1 1 1 1Fertility rate, total (births per woman) 6 6 6 6 6
GNI per capita, Atlas method (current US$) 440 350 310 500 1,070GNI, Atlas method (current US$) (billions) 3.5 3.1 3.1 5.7 13.8Gross capital formation (% of GDP) 17.3 15.9 17.4 23.8 22.4Life expectancy at birth, total (years) 47 44 42 44 48Literacy rate, adult total (% of people ages 15 and above) 65 .. 68 .. 71Population, total (millions) 7.9 9.1 10.5 0.0 12.9Trade (% of GDP) 72.5 75.8 68.6 71.2 79.1
Goal 4: Reduce child mortality
Goal 5: Improve maternal health
Goal 6: Combat HIV/AIDS, malaria, and other diseases
Goal 7: Ensure environmental sustainability
Millennium Development Goals
Goal 1: Eradicate extreme poverty and hunger
Goal 2: Achieve universal primary education
Goal 3: Promote gender equality and empower women
Goal 8: Develop a global partnership for development
Other
Source: World Development Indicators, MDGs Country tables as of 7/11/2012

128
Annex Table 8: Economic and Social Indicators for Zambia and Comparators, 2008-2010
Series Name
Zambia Zambia Malawi Angola Tanzania Sub-Saharan AFR(
developing only)
World
2008 2009 2010 Average 2008-2010
Growth and Inflation GDP growth (annual %) 5.7 6.4 7.6 6.6 7.8 6.8 6.8 4.0 1.1 GDP per capita growth (annual %) 2.9 3.5 5.9 4.1 4.5 3.8 3.8 1.5 0.0 GNI per capita, PPP (current international $) 1260 1310 1380 1316.7 826.7 5246.7 1373.3 2092.5 10754.3 GNI per capita, Atlas method (current US$) 970 990 1070 110 306.7 3706.7 500 1141.4 8803.3 Inflation, consumer prices (annual %) 12.4 13.4 8.5 11.4 8.2 13.5 9.5 - - Composition of GDP (%) Agriculture, value added (% of GDP) 18.9 21.5 9.1 16.5 30.3 8.9 28.9 12.3 2.8 Industry value added (% of GDP) 41.4 34.1 37.2 37.6 16.1 63.0 24.3 30.8 26.3 Services, etc, value added (% of GDP) 39.7 44.3 53.6 45.9 53.6 28.1 46.8 56.9 70.9 Gross fixed capital formation (% of GDP) 22.2 22.1 22.4 22.2 22.3 15.1 28. 21.5 20.1 Gross domestic savings (% of GDP) 24.6 25.6 31.5 27.2 7.2 30.0 16.8 16.2 20.1 External Accounts Exports of goods and services (% of GDP) 36.0 35.6 44.1 38.6 28.9 61.8 24.8 32.4 27.6 Imports of goods and services (% of GDP) 33.5 32.2 35.0 33.6 46.9 46.9 3.3 35.8 27.8 Current account balance (% of GDP) -.1 4.2 3.8 0.3 -15.9 2.4 -10.2 - - Total debt services (% of GNI) 1.3 1.5 1.0 1.3 0.6 3.6 0.6 1.4 - Fiscal Accounts Expense (% of GDP) 20.5 17.5 17.2 18.4 - - - 24.2 29.6 Revenue excluding grants (% of GDP) 18.4 15.6 17.4 17.1 - - - 24.3 24.5 Social Indicators Health life expectancy at birth, total (years) 47.1 47.8 48.5 47.8 52.7 50.3 56.6 53.7 69.4 Immunization, DPT (% of children ages 12-23 months) 79 82 82 81 92.3 81.7 87.3 74.5 84.4 Improved sanitation facilities (% of population with access) - - 48 48 51 58 10 30.6 62.5 Improved water sources (% of population with access) - - 61 61 83 51 53 61.1 88.3 Mortality rate, infant (per 1,000 live births) 74.1 71.5 68.9 1.5 61.4 99.9 55.8 78.1 42.0 Population Population, total 12379612 12723746 12927000 12676786 14449467.67 18558359.67 43544468.3 832818360.0 6815995263.5 Population growth (annual %) 2.7 2.7 1.6 2.3 3.1 2.8 2.9 2.5 1.2 Urban population (% total) 35.4 35.6 35.7 35.6 19.3 30.0 36.9 50.3 Education School enrolment, preprimary (% gross) - - - - - 110.1 33.6 16.9 49.7 School enrolment, primary (% gross) 122.0 115.8 115.3 117.7 133.5 122.7 106.5 99.6 107.0 School enrolment, secondary (% gross) - - - - 31.7 28.0 26.3 35.4 67.9
Source: World databank- World Development Indicators (18/04/12)

129
Annex Table 9 Summary of Achievements of the CAS objectives FY08-FY12 Zambia CAS - Results Framework
Achieved ≈ Partially Achieved ( on track) Not Achieved (off track) ∂ Dropped /Delayed (used for milestones only) ℜ Revised /Replaced (used for milestones only)
FNDP Theme: Achieving broad based wealth and job creation24
Sustaining fiscal and financial stability and deepening structural
reforms
Supporting governance, institutional capacity, the business environment &
agricultural development
Enhancing public infrastructure
Improving health performance,
education and skills training
C A S O u t c o m e s Macroeconomic & Expenditure
Management Institutional Capacity Infrastructure Development Human Capital Development
1.1 Macroeconomic framework and expenditure management maintain stability and support the growth and diversification of the economy.
2.1 Strengthened public financial
management, procurement and oversight capacity.
3.1 Improved transport infrastructure.
4.1 Improved health programming.
2.2 Improved public management and transparency of the mining sector and improved management of the natural resources sector.
3.2 Improved access to water, energy
services and irrigation systems.
4.2 Strengthened skills and education for
the formal and informal sectors.
2.3 Improved business environment,
especially for micro-, small- and medium-size enterprises (MSMEs).
2.4 Improved agricultural productivity and marketing schemes for smallholders.
Mainstreaming ‘Good Governance’ and HIV measures into all operations Good governance: increased Country Policy and Institutional Assessment (CPIA) score for Public Sector Management and Institutions by 2010.
HIV: # of people reached through HIV mainstreaming activities in interventions. ‘Mainstreaming’ is a set of minimum requirements each intervention has to support for implementing agencies/ clients: focal point(s), HIV policy, strategy and an HIV related M&E system operational covering target project areas.
24 Alignment and Harmonization: Under the JASZ division of labor the World Bank is a lead donor in 6 FNDP sectors: macro-economics, agriculture, private-sector development, tourism decentralization and energy. At the time of the writing of this CAS the division of labor is being discussed. The JASZ has organized donor responses not in a results framework, but as “priority responses” - see chapter ‘Managing Effectively for Results” for a complete results chain including JASZ alignment.

130
Zambia’s Long Term Development Program WB CAS Program 2008-2011 FNDP Goals25 Key constraints CAS outcomes & indicators Milestones for outcomes Instruments & Partners
Sustaining fiscal and financial stability and deepening structural reforms FNDP Priority Area Macroeconomics
Macroeconomic Objectives, Policies and Strategies:
Maintenance of Macroeconomic Stability
Strengthening the revenue base
Improving Budget Execution and preparation
Strengthening Financial Accountability and Expenditure Monitoring Systems
• Current composition of expenditures is not fully supportive of high and sustainable long-term growth, which would affect the poor more strongly
• Expenditure programs do not get executed as planned due to low absorption capacity by line ministries.
• Low level of public investment in programs that support growth and benefit the rural areas.
• Limited institutional capacity of fiscal management in the mining sector.
• Large external inflows from the mining sector lead to symptoms of ‘Dutch Disease’
and hamper diversification.
1.1. Macroeconomic framework and expenditure management maintain stability and support the growth and diversification of the economy.
The composition of public expenditure prioritizes and shows real increase in allocation to pro-poor sectors (e.g. agri-culture, tourism, rural infrastructure) from 2007 levels.
≈ GRZ has put in place clear guidelines for allocation of additional resource flows from mining.
Budget presentation includes reporting on donor funding and revenues and expenditures of quasi-fiscal institutions (Bank of Zambia, the Public Service Pension Fund and state owned enterprises (SOEs), especially ZESCO).
MoFNP consults stakeholders annually on the performance of the country’s development programs under the FNDP.
≈ GRZ agrees on instruments for managing the uncertainty & volatility of revenue flows from mining and puts in place an appropriate mechanism to harness the flows (such as a sovereign wealth fund).
≈ ZRA submits reports for MTEF and annual budget based on corporate fiscal models to (a) audit mining returns and (b) to predict and collect taxes from mining.
≈ Development of a centralized data base of domestic & external debt in MoFNP.
MTEF Framework and ABB rolled out to Bank of Zambia, the Public Service
Pension Fund and SOEs, esp. ZESCO.
≈ Harmonization of public expenditure mgmt legislation: Public Procure-ment Act, Accountants Act, Loans & Guarantees Act, Public Finance
On-going Lending: • Public Service Management Support
Program
Ongoing AAA: • Investment Climate Assessment
• PPP Policy Note
Proposed Lending: • EMGC II
• PRSC
Proposed AAA: • PER
• TA Commodity Risk Management
• Development Policy Review
• EITI++ Implementation
• NLTA Energy Sector
Main Development Partners DFID, EU, IMF, Denmark,
Netherlands/Ireland, Finland, Sweden, Norway, UNDP, GTZ
25 For better readability, the indicators used by government to measure progress towards FNDP goals (FNDP Key Performance Indicators and Performance Assessment Framework indicators) and which CAS outcomes intend to influence are appended to the matrix and are not directly included:

131
Zambia’s Long Term Development Program WB CAS Program 2008-2011 FNDP Goals25 Key constraints CAS outcomes & indicators Milestones for outcomes Instruments & Partners
Act (Amendment).
Supporting governance, institutional capacity, the business environment and agricultural development FNDP Priority Areas: Accountability, Mining, Natural Resources, Private Sector Development, Agriculture
Accountability & Transparency
Effective mechanisms for prevention of corruption, abuse of office and misappropriation in public and private bodies
PEMFA
Implementation of the new financial management system (through IFMIS)
Reform of the public procurement systems
Strengthening of oversight processes
Create efficiency in audits
• Effective public financial management is hampered by absence of accurate and timely financial management reports.
• Inefficient procurement systems cause delays in implementation of programs.
• Lack of transparency in procurement processes.
• Insufficient coverage and comprehensiveness of audit oversight.
2.1 Strengthened public financial management, procurement and oversight capacity.
Public financial management capacity
≈ Financial statements of institutions where IFMIS is operational are produced within 6 months of the financial year end by 2010 (from 9 months in 2007).
Procurement capacity
Procurement processing time for national competitive bidding is maintained at 8 weeks and for international competitive bidding at 12 weeks (2007 levels) in 90% of PSUs.
Oversight capacity & audits:
Percentage of entities (48 entities: 22 ministries, 9 provinces and 17 spending agencies) covered by annual audit increases from 50% in 2006 to 60% by 2010.
IFMIS fully implemented and integrated with PMEC in at least 5 key ministries & piloted in at least 2 provinces (North Western, Eastern) by 2010.
New payroll system in place; no discrepancies between clean payroll and staff establishment.
By 2010, Zambia National Tender Board established as regulatory authority.
National Appeals Tribunal established and operational by 2010.
PSUs established in all MPSAs and 500 staff trained
All provincial offices to be handed over to Auditor General by September 2008.
≈ At least 18 professional audit staff based in provincial audit offices with minimum of one auditor per provincial office.
On-going Lending: • Public Service Management Support
Program Proposed AAA: • PER Main development partners: UK, Denmark, Netherlands/Ireland, Finland, Sweden, Norway, EC, UNDP, Germany
Mining & Natural Resources
Institutional strengthening in large-Scale Mining
• Weak public-private dialogue and accountability in natural resources sector.
• Outdated policies and legal
2.2 Improved public management and transparency of the mining sector and improved management of the natural resources sector.
Zambia EITI Council formed as multi-stakeholder group of government, civil
On-going Lending: • Copperbelt Environment Project
• SEED Ongoing AAA

132
Zambia’s Long Term Development Program WB CAS Program 2008-2011 FNDP Goals25 Key constraints CAS outcomes & indicators Milestones for outcomes Instruments & Partners Revitalize/ Realize potential of small-scale mining.
Ensure environmental sustainability
Environmental institutional strengthening & capacity building for sustainable utilization of natural resources.
Develop, rehabilitate tourism & support infrastructure for key tourism destination areas.
framework.
• Absence of online cadastre GIS constrains mining rights issuance and results in delays & conflicts.
• Mining in the Copperbelt leads to environmental degradation and environmental laws are not efficiently enforced.
• Management capacity of NP too weak to effectively establish NPs as economic sources of income.
a) Mining
EITI report published (making all financial flows of mining operations to GRZ transparent and available to the public). ≈ Percentage of mining companies in
compliance with Environmental Management Plans for the identified priority environmental liabilities is 85% by 2010 (from 35% in 2005).
b) Conservation, tourism as economic catalysts (revised by CASPR)
≈ WB/WWF management effectiveness score for 3 National Parks increases from 2007 by end of 2011 for
Kafue NP from 41 to 64
Kasanka NP from 61 to 76
Lavushi Manda NP from 9 to 55
society, and companies.
≈ Multi-Stakeholder EITI Council has agreed on auditing templates.
Gemstone mining license application processing time reduced by 50% (from 30 days to 15 for small scale and from 60 days to 30 days for large scale mining licenses.
Consolidated environmental management plans (CEMP) submitted to EMF Steering Committee.
Monitoring system for CEMPs migrated to Environm. Management Information System & made available to the public.
≈ % of lodges accessible all year in Kafue National Park increases from 10% to 60% by 2011.
2 air strips and 200km all season accessible roads built in Kafue NP.
• Zambia Country Water Resources Assistance Strategy
Proposed AAA/ TF: • EITI++ Implementation
• Micro Foundations of Growth Proposed Lending: • PRSC
• GEF MSP OASNTC (regional with Namibia)
• GEF FSP: "Sustainable Management of Nyika Transfrontier Conservation Area" TFCA (reg. with Malawi)
• "GEF MSP" Extension of Kasanka Management System to Lavushi Manda National Park
Main Development Partners MDTF, AU, IMF, EU, Norway, DFID
Improving the business climate
Remove administrative barriers to business entry and operation
• Starting and operating tourism and gemstone businesses is especially challenging for Micro and small businesses.
• Multiple constraints impede competitiveness.
2.3 Improved business environment, especially for micro-, small- and medium-size enterprises (MSMEs).
a) Cost of doing business:
Average number of total days to process MTENR tourism licenses issued at Livingstone’s new "one stop shop" decreases from 90 days in 2004 to 60 days in 2010.
b) Access to Finance: dropped by CASPR
≈ Livingstone’s one-stop-shop is established and operating.
Statutory Instruments (such as license fees) for tourism and gemstone sectors are submitted for legislative action.
Licensing audit completed.
On-going Lending: • SEED Ongoing AAA: • Licensing & Regulatory Reform (IFC)
• Investment Climate Assessment Proposed Lending: • PRSC
• Regional Communications Infrastructure Program
• Competitiveness DPL Proposed AAA: • Micro Foundations of Growth • Financial Sector Assessment

133
Zambia’s Long Term Development Program WB CAS Program 2008-2011 FNDP Goals25 Key constraints CAS outcomes & indicators Milestones for outcomes Instruments & Partners
Access to affordable finance
goal listed across several FNDP sectors
• High cost of borrowing, thin capital market and absence of affordable financial services in most peri-urban and rural areas.
Proportion of adult population with access to affordable financial services (according to FinScope definition) increases from 37.7% in 2007 to 45% by 2011.
Completed consultations with private sector and GRZ to generate competitiveness program.
≈ Implementation of Phase II of the Financial Sector Development Plan (FSDP) leads to the introduction of new financial products (based on findings Financial Sector Assessments)
• Investment Climate Assessment
• Rural competitiveness survey Main Development Partners GEF, Norway & Nordic Fund, FSDP: Sweden, Norway, DFID, SIDA
Agricultural Marketing, Trade & Agribusiness Development:
Promotion of a competitive, efficient and transparent public and private sector driven marketing system for agricultural commodities and inputs.
• Lack of enabling environment for market development especially for small-holders.
• Low profitability of commodity value chains of smallholders.
2.4 Improved agricultural productivity and marketing schemes.
Value of agricultural exports for target value chains (cotton lint) from US$43.4 mill in 2006 to US$ 65 mill by 2011.
Value of agricultural exports for target value chains (cotton lint) is US$ 57 mill in 2009.
Volume of commodities produced by out-grower schemes for cotton from 170,000 tons in 2006 to 180,000 tons in 2009 to 205,000 tons by 2011
On-going Lending: • Agricultural Dev. Support Project Ongoing AAA: • Agriculture P. Value Chain Analysis Proposed Lending: • PRSC
• Irrigation Development Project Proposed AAA: • TA Commodity Risk Mgmt • Impact Evaluation Fertilizer SP Main Development Partners GEF, IFAD, AfDB, SIDA, USAID
Enhancing public infrastructure FNDP Priority Areas: Infrastructure, Energy, Water and Sanitation
Public Infrastructure Management:
To effectively manage public infrastructure in order to ensure accountability, serviceability and prolonged life span.
• Lack of capacity in the construction industry (both contractors, and supervision engineers)
• Roads in rural areas in poor condition & often impassable during wet season.
3.1 Improved transport infrastructure (Both revised by CASPR).
% of rural population with access to an (re-instated) all weather river crossing in target provinces (Luapula, Northern, Copperbelt provinces) from 40% in 2007
≈ By 2010, all weather river crossings built/rehabilitated in 2 provinces: Luapula: 33, Northern: 31, Copperbelt: 40).
On-going Lending: • RRMP-APL I
• Agricultural Dev. Support Project Proposed Lending: • RRMP – APL II
• E & S Africa TA (Regional)
• Nacala Development Corridor (Regional)
Main Development Partners:

134
Zambia’s Long Term Development Program WB CAS Program 2008-2011 FNDP Goals25 Key constraints CAS outcomes & indicators Milestones for outcomes Instruments & Partners
Road infrastructure development
• 50% of rural HH are > 9km from food market and travel >25 km to reach an agricultural input market.
to 80% in 2010. Indicator from ADSP on improved links
between producers and agricultural markets in targeted project areas to be added after assessment in 08/08.
≈ 636 km rural roads rehabilitated and OPRC contracts under implementation in targeted areas.
EU, KFW, DANIDA, Japan, AfDB, BADEA, GEF; PPIAF
Water/Sanitation:
Water Resource Development and Infrastructure Development.
Energy:
Electricity generation & transmission line development.
Rural electrification.
Agriculture:
Irrigation development and support
• Little investment in past 30 years: only 1.5% of water resources utilized
• Water resources legislation outdated and inadequate.
• Insufficient reliability of water supply and cost recovery for urban and peri-urban water utilities.
• Infrastructure limitations for mining (copper mining uses about 50% of Zambia’s electricity).
• Rural electrification stagnant at only 2%
• Agriculture mostly rain-fed.
3.2 Improved access to water, energy services and irrigation systems.
Water storage and regulation established in 20 target rural communities by 2011 (final determination by project effectiveness).
≈ 25,000 additional people have access to safe water in Lusaka peri-urban area (ca. 250/newly installed water kiosk) by 2011.
Access to electricity services increased from 20% of HH in 2006 to 23% in 2009.
≈ 6200 ha of newly irrigated land under PPP management.
≈ Sites for 3 medium and 30 small dams identified and construction designs completed by end of 2009.
60% of total new water kiosks installed and operational by end of 2009.
Number of projects implemented by REA is 7 by end of 2009.
PPPs of smallholders and commercial farmers/agro-entrepreneurs for use of irrigation systems are established in selected project areas.
On-going Lending: • WSPIP Proposed Lending: • Water Resources Dev. Project
• Small Towns WSS Dev. Project
• Energy Efficiency & Access Project
• Irrigation Development Project
• Hydro Energy Generation Project
• S-A Africa Power Market Program Ongoing AAA: • Country Water Resources Strategy
• Zambezi Multi-Sector Investment Opportunity Analysis
Proposed AAA: • NL TA Energy Sector
• Water Pollution & Supply Solutions Study
Main Development Partners GEF, EU, SIDA, JBIC/JICA, USAID
Improving health performance, education and skills training FNDP Priority Areas: Health, Education & Skills Development
Health:
Health policy and planning: mobilize sustainable and ensure efficient use to promote equity of access to
• 45% of the rural health centers are operating with unqualified staff only.
4.1 Improved health programming.
≈ Percentage of institutional deliveries from 43% in 2006 to 50% in 2011.
≈ Results-based financing implemented (based on 8 indicators) in 9 districts (yr 1) 18 districts (yr 2) after TF effectiveness.
On-going Lending: • Malaria Booster + Russian TF
• ZANARA Ongoing AAA: • Country Sector Health Report Proposed Lending:

135
Zambia’s Long Term Development Program WB CAS Program 2008-2011 FNDP Goals25 Key constraints CAS outcomes & indicators Milestones for outcomes Instruments & Partners cost-effective and quality health care
Integrated reproductive health: to reduce the Maternal Mortality Ratio (MMR) by three-quarters.
Malaria Control and Prevention: To reduce morbidity and mortality due to malaria in the general population
• Malaria incidence rates nearly tripled over three decades mostly due to chloroquine resistance, limited access to quality care and poor clinical management.
• Almost half of visitations to health facilities are on account of malaria.
Percentage of children under 5 years of age who sleep under a treated bed net increases from 30% in 2006 to 60% by 2011.
Percentage of people in indoor residual spraying (IRS) eligible districts areas who sleep in appropriately sprayed structures from 40% in 2006 to 80% by 2011.
HR retention scheme implemented.
Scale up of IRS campaign from 15 districts in 2007 to 36 districts in 2010
• Southern Africa Transport Corridors HIV/AIDS Program (regional)
Proposed TFs and other grants: • Norwegian TF Maternal Mortality
• Russian Debt swap Main Development Partners Health SWAp incl. Roll Back Malaria (RBM), HIV/AIDS and Partnerships: UN Family, MACEPA. DFID, Global Fund, USG/PEPFAR, NORAD, USAID, JICA, RNE, EU, SIDA, DANIDA, JICA, CIDA, Ireland Aid.
Education and Skills Development:
Develop appropriate training, assessment and qualification systems to meet current and future demands of the labor market.
Ensure universal basic education provision to children
• Not enough skilled trade labor available.
• Inconsistent quality of TEVET.
• Course provision often supply driven.
• Rural-urban and gender gap in access and quality of education.
4.2 Strengthened skills and education for the formal and informal sectors.
> 90% of the 2004 and 2005 TEVET graduates find employment within 12 months and > 70% within 6 months of graduation (intermediary result in 2005: 89% within 12 months and 72% within 6 months).
≈ Increased primary completion rate towards reaching MDG. Baseline and target assessed at FTI effectiveness date.
∂ Percentage of national training courses whose curricula are reviewed per annum in response to market demands increases from 4 % in 2002.
∂ National education sector plan endorsed by GRZ and donors.
∂ Policy for expanded access to post-basic
education formulated.
On-going Lending: • TEVET Ongoing AAA: • PETS basic education Proposed Lending & TF: • “Education for All” Catalytic TF Proposed AAA: • Strategy post-basic education
• PVU Main Development Partners: GTZ, DANIDA, NL; Multi-donor (FTI) Catalytic Trust Fund

136
Annex Table 10: CAS Results Summary CAS Outcome Indicators Status Pillar I: Macroeconomic and Expenditure Management
1. Public expenditure allocation to pro-poor sectors (e.g. agriculture, tourism, rural infrastructure) shows real increase from 2007 levels. . Budget 2008 allocation (ZKW billion) for Agriculture, Tourism and Roads: 1,964.2
Achieved
2. Clear GRZ guidelines for allocation of additional resource flows from mining Partially achieved 3. Budget presentation includes reporting on donor funding and revenues and expenditures of quasi-fiscal institutions Achieved
Pillar II: Institutional capacity enhancement 4. Time for production of financial statements decreases to 6months Partially achieved
5. Procurement processing time is maintained at 8 weeks for NCB and at 12 weeks for ICB in 90 % of PSUs Not achieved
6. Percentage of entities covered by annual audit increases from 50% in 2006 to 60% by Achieved 7. EITI report published and available to public Achieved 8. Percentage of mining companies in compliance with Environmental Management Plans for the identified priority
environmental liabilities increases to 85% by 2010 Partially achieved
9. WB/WWF management effectiveness score for 3 National Parks increases from 2007 by end of 2011 for: - Kafue NP from 41 to 64; - Kasanka NP from 61 to 76; - Lavushi Manda NP from 9 to 55
Partially achieved
10. No. of days to process tourism license decreases to 60 days in 2010 (from 90 days in 2004) Not achieved
11. Proportion of adult population with access to affordable financial services increases from 37.15 in 2007 to 45% by 2011 Dropped at time of CASPR 12. Value of agricultural exports for target value chains (cotton lint) from US$43.4 m. in 2006 to US$ 65 m. by 2011 Not achieved
Pillar III: Infrastructure development 13. Percentage of rural population with access to an (reinstated) all weather river crossing in target provinces (Luapula, Northern,
Copperbelt provinces) increases from 40% in 2007 to 80% in 2010 Achieved
14. Improved links between producers and agricultural markets in target project areas to be added after assessment in august 2008 Achieved
15. Water storage and regulation established in 20 target rural communities by 2011 (final determination by project effectiveness Not achieved
16. > 25,000 additional people have access to safe water in Lusaka peri-urban area (250/new installed water kiosk) by 2011 Partially achieved
17. Access to electricity services increased by 18,000 in 2008, 20, 000 in from 2009 and 25,000 in 2010 Achieved
18. > 6200 ha of newly irrigated land under PPP management Partially achieved
Pillar IV: Human capital development 19. > 90% of the 2004 and 2005 TEVET graduates find employment within 12 months and > 70% within 6 months of graduation
(intermediary result in 2005: 89% within 12 months and 72% within 6 months). Achieved
20. Increase primary completion rate towards reaching MDG. Baseline and target assessed at FTI effectiveness date Partially achieved
21. Percentage of institutional deliveries increases from 43% in 2006 to 50% in 2011 Partially achieved
22. Percentage of children under 5 years of age who sleep under a treated bed net increases from 30% in 2006 to 60% by 2011 Achieved
23. Percentage of people in indoor residual spraying (IRS) eligible districts areas who sleep in appropriately sprayed structures from 40% in 2006 to 80% by 2011
Achieved
Summary Achievements on Outcome Indicators
Achieved Partly Not achieved Total 10 (43%) 8 (35%) 5 (22%) 23
Source: See Annex Table 9 for details.
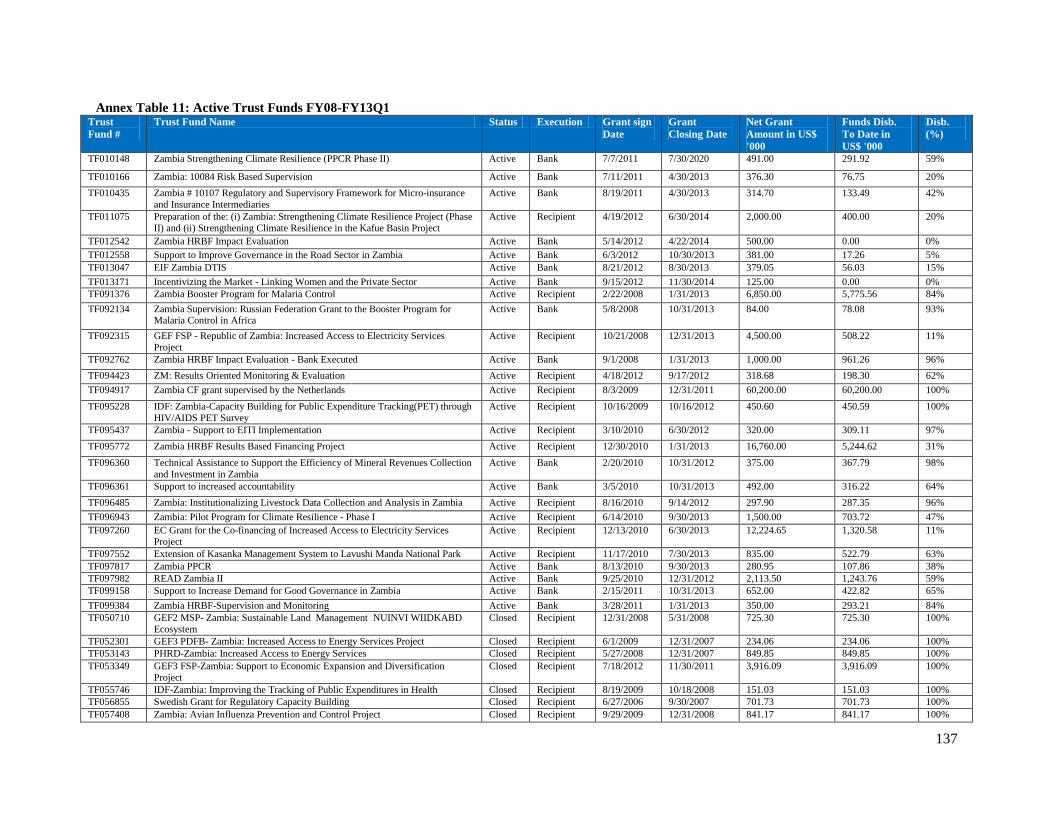
137
Annex Table 11: Active Trust Funds FY08-FY13Q1 Trust Fund #
Trust Fund Name Status Execution Grant sign Date
Grant Closing Date
Net Grant Amount in US$ '000
Funds Disb. To Date in US$ '000
Disb. (%)
TF010148 Zambia Strengthening Climate Resilience (PPCR Phase II) Active Bank 7/7/2011 7/30/2020 491.00 291.92 59%
TF010166 Zambia: 10084 Risk Based Supervision Active Bank 7/11/2011 4/30/2013 376.30 76.75 20%
TF010435 Zambia # 10107 Regulatory and Supervisory Framework for Micro-insurance and Insurance Intermediaries
Active Bank 8/19/2011 4/30/2013 314.70 133.49 42%
TF011075 Preparation of the: (i) Zambia: Strengthening Climate Resilience Project (Phase II) and (ii) Strengthening Climate Resilience in the Kafue Basin Project
Active Recipient 4/19/2012 6/30/2014 2,000.00 400.00 20%
TF012542 Zambia HRBF Impact Evaluation Active Bank 5/14/2012 4/22/2014 500.00 0.00 0% TF012558 Support to Improve Governance in the Road Sector in Zambia Active Bank 6/3/2012 10/30/2013 381.00 17.26 5% TF013047 EIF Zambia DTIS Active Bank 8/21/2012 8/30/2013 379.05 56.03 15%
TF013171 Incentivizing the Market - Linking Women and the Private Sector Active Bank 9/15/2012 11/30/2014 125.00 0.00 0% TF091376 Zambia Booster Program for Malaria Control Active Recipient 2/22/2008 1/31/2013 6,850.00 5,775.56 84%
TF092134 Zambia Supervision: Russian Federation Grant to the Booster Program for Malaria Control in Africa
Active Bank 5/8/2008 10/31/2013 84.00 78.08 93%
TF092315 GEF FSP - Republic of Zambia: Increased Access to Electricity Services Project
Active Recipient 10/21/2008 12/31/2013 4,500.00 508.22 11%
TF092762 Zambia HRBF Impact Evaluation - Bank Executed Active Bank 9/1/2008 1/31/2013 1,000.00 961.26 96%
TF094423 ZM: Results Oriented Monitoring & Evaluation Active Recipient 4/18/2012 9/17/2012 318.68 198.30 62%
TF094917 Zambia CF grant supervised by the Netherlands Active Recipient 8/3/2009 12/31/2011 60,200.00 60,200.00 100%
TF095228 IDF: Zambia-Capacity Building for Public Expenditure Tracking(PET) through HIV/AIDS PET Survey
Active Recipient 10/16/2009 10/16/2012 450.60 450.59 100%
TF095437 Zambia - Support to EITI Implementation Active Recipient 3/10/2010 6/30/2012 320.00 309.11 97%
TF095772 Zambia HRBF Results Based Financing Project Active Recipient 12/30/2010 1/31/2013 16,760.00 5,244.62 31%
TF096360 Technical Assistance to Support the Efficiency of Mineral Revenues Collection and Investment in Zambia
Active Bank 2/20/2010 10/31/2012 375.00 367.79 98%
TF096361 Support to increased accountability Active Bank 3/5/2010 10/31/2013 492.00 316.22 64%
TF096485 Zambia: Institutionalizing Livestock Data Collection and Analysis in Zambia Active Recipient 8/16/2010 9/14/2012 297.90 287.35 96%
TF096943 Zambia: Pilot Program for Climate Resilience - Phase I Active Recipient 6/14/2010 9/30/2013 1,500.00 703.72 47% TF097260 EC Grant for the Co-financing of Increased Access to Electricity Services
Project Active Recipient 12/13/2010 6/30/2013 12,224.65 1,320.58 11%
TF097552 Extension of Kasanka Management System to Lavushi Manda National Park Active Recipient 11/17/2010 7/30/2013 835.00 522.79 63% TF097817 Zambia PPCR Active Bank 8/13/2010 9/30/2013 280.95 107.86 38% TF097982 READ Zambia II Active Bank 9/25/2010 12/31/2012 2,113.50 1,243.76 59% TF099158 Support to Increase Demand for Good Governance in Zambia Active Bank 2/15/2011 10/31/2013 652.00 422.82 65%
TF099384 Zambia HRBF-Supervision and Monitoring Active Bank 3/28/2011 1/31/2013 350.00 293.21 84% TF050710 GEF2 MSP- Zambia: Sustainable Land Management NUINVI WIIDKABD
Ecosystem Closed Recipient 12/31/2008 5/31/2008 725.30 725.30 100%
TF052301 GEF3 PDFB- Zambia: Increased Access to Energy Services Project Closed Recipient 6/1/2009 12/31/2007 234.06 234.06 100% TF053143 PHRD-Zambia: Increased Access to Energy Services Closed Recipient 5/27/2008 12/31/2007 849.85 849.85 100% TF053349 GEF3 FSP-Zambia: Support to Economic Expansion and Diversification
Project Closed Recipient 7/18/2012 11/30/2011 3,916.09 3,916.09 100%
TF055746 IDF-Zambia: Improving the Tracking of Public Expenditures in Health Closed Recipient 8/19/2009 10/18/2008 151.03 151.03 100% TF056855 Swedish Grant for Regulatory Capacity Building Closed Recipient 6/27/2006 9/30/2007 701.73 701.73 100% TF057408 Zambia: Avian Influenza Prevention and Control Project Closed Recipient 9/29/2009 12/31/2008 841.17 841.17 100%

138
Trust Fund #
Trust Fund Name Status Execution Grant sign Date
Grant Closing Date
Net Grant Amount in US$ '000
Funds Disb. To Date in US$ '000
Disb. (%)
TF091476 GAVI TF for HNP Strategy Implementation - Zambia Closed Bank 1/22/2008 3/30/2009 180.74 180.74 100% TF091602 Zambia - HRBF Proposal Preparation Closed Bank 2/4/2008 6/30/2008 46.87 46.71 100%
TF092280 Zambia HRBF Design - Recipient Executed Closed Recipient 6/24/2011 11/12/2010 92.66 92.66 100%
TF092281 Zambia HRBF Design - Bank Executed Closed Bank 6/15/2008 8/31/2011 499.16 499.16 100%
TF092323 GEF PPG- Zambia: Extension of Kasanka Management System to Lavushi Manda National Park project
Closed Recipient 3/11/2010 8/31/2009 64.16 64.16 100%
TF092666 PPIAF: LADM 4279 - Zambia: Lighting the Way Closed Recipient 1/9/2009 4/29/2010 199.80 199.80 100% TF094352 GAVI Proposal for Africa HSS Work in Zambia Closed Bank 5/5/2009 6/30/2011 328.31 328.31 100% TF094524 READ-Zambia Closed Bank 6/3/2009 12/30/2011 236.74 236.74 100% TF095207 FIRST: Zambia: 9004 Developing and Strengthening Contingency Planning Closed Bank 9/11/2009 6/30/2010 161.48 161.48 100% TF096208 Support to EITI Implementation Closed Bank 1/24/2010 4/30/2012 96.55 96.55 100%
TF096931 Sustainable Intensification of Agricultural Production and Marketing: The Role of Gender in Irrigation Development
Closed Bank 5/11/2010 12/31/2011 45.68 45.68 100%
Total 45 123,542.71 89,658.51
Source: e-trust fund portal
Annex Table 12a: Public Expenditures Allocations (constant 2008 billion ZKW) 2008-2012 2008 2009 2010 2011 2012 General Public Services 4,514.2 4,290.7 4,371.4 4,379.8 5,805.4 Defense 981.3 941.8 1,079.6 1,111.3 1,152.4 Public Order and Safety 581.8 538.6 628.2 687.4 711.2 Economic Affairs 2,300.8 2,664.3 2,619.9 3,928.4 5,676.2 o/w Agriculture, Forestry and Fishing 800.5 966.8 927.4 921.2 1,187.0 o/w Fuel and Energy 48.3 105.9 219.4 266.1 957.5 o/w Transport 1,181.4 1,329.6 1,239.5 2,477.3 3,256.7 o/w Tourism 65.6 68.4 98.4 47.1 36.8 Environmental Protection 95.7 103.4 120.9 90.7 22.2 Housing and Community Amenities 830.6 51.9 536.6 483.6 246.7 o/w Water and Sanitation 399.4 189.1 353.1 415.1 105.1 Recreation, Culture and Religion 174.1 161.6 79.4 80.8 95.7 Education 2,118.5 2,317.6 2,703.9 2,868.8 3,390.7 Health 1,586.6 1,608.0 1,109.3 1,326.1 1,803.5 Social Protection 577.7 330.0 362.3 409.5 458.3 13,761.3 13,473.9 13,611.6 15,361.4 19,362.2 Source: MFNP, Budget Speech data

139
Annex Table 12b: Percentage Public Expenditure Allocations in pro poor sectors 2008-2012 2008 2009 2010 2011 2012 Agriculture, Forestry and Fishing 5.82 7.18 6.81 6.0 6.13 Transport 8.58 9.87 9.11 16.13 16.82 Tourism 0.48 0.51 0.72 0.31 0.19
Source: CASCR calculations based on data in 11a.
Annex Table 12c: Recording and management of cash balances, debt and guarantees Indicator 2005 2008 2010 Brief Explanation PI-17 Recording and management of cash balances, debt and guarantees
C C+ C+ No explanation provided as rating did not change
(i) Quality of debt data recording and reporting
C C B There has been improvement in the availability and quality of debt data. The records on external debt are complete, updated and reconciled semi-annually. All the records pertaining to all components of domestic debt stock is captured in an excel spread sheet. The current version of DMFAS does not have a functionality to capture the parameters of domestic debt. IDM is considering upgrading to the latest version of DMFAS. In future the score of a “B” will be possible on this dimension.
Source: Public Expenditure Management and Financial Accountability (PEMFA) Program Evaluation, Overview Report, Prepared on behalf of Ministry of Finance and National Planning, GRZ by REPIM in association with Oxford Policy Management, August 2010
Annex Table 12d: Agriculture contribution to GDP growth (average annual growth% and as % of GDP) 2000-
2009 2010 2011 2012 2000-2009 2010 2011 2012
annual real growth % % of nominal GDP
Agriculture 1.8
6.6
8.0
7.1 22.0
20.4
19.5
18.6
Industry 8.7
8.9
4.4
5.4
29.4
36.0
37.4
41.3
Services 6.3
11.5
9.6
5.2
48.6
43.6
43.1
40.1
Overall GDP 5.2
7.6
6.8
7.3
100.0
100.0
100.0
100.0
Source: World Bank (2012), Zambia at a glance.

140
Annex Table 12e: Project Implementation delays Project Name Project ID Original
closing Date Actual closing date
Delays
Economic Management and Growth Credit II P074445 12/31/2008 05/13/2009 5 months Technical Education Vocational & Entrepreneurship Training Development Program Support (TDP)
P106596
30/12/2006
30/12/2008
2 years
Roads Rehabilitation and Maintenance Project P071985 30/06/2010 30/06/2012 2years Support for Economic Expansion and Diversification (SEED)
P071407
30/11/2009
30/11/2011
2years
Agricultural Development Support Program P070063 30/06/2012 31/03/2014 1year-10months Public Sector Management Program Support Project P082452 12/2010 30/06/2012 2years Zambia Malaria Booster Project P096131 31/01/2010 31/01/2013 3years Zambia Copper belt Environment Project (CEP) P070962 01/08/2008 31/03/2011 2years-7 months Water Sector Performance Improvement Project P071259 30/01/2010 30/01/2012 2years
Note: The Roads Project is technically delayed by two years as the project closing date was extended following two additional financings. Source: ISRs


Mafinga HillsMafinga Hills(2301 m)(2301 m)
KaulishishiKaulishishi(1420 m)(1420 m)
MachecheteMachechete(1488 m)(1488 m)
MMuulloonnggaaPPllaaiinn
BBuussaannggaaSSwwaammpp
LLuukkaannggaaSSwwaammpp
MMuucchhiinnggaa
MMttss
..
MumbwaMumbwa
MutandaMutanda
MwinilungaMwinilunga
NamwalaNamwalaKafueKafueMazabukaMazabuka
KaemaKaema
PokumaPokumaSenkoboSenkobo
KalomoKalomo
ChomaChoma
BowwoodBowwood
PembaPemba
ChirunduChirundu
KaribaKaribaShangomboShangombo
KasempaKasempa
ChisasaChisasa
ChingolaChingola
Kapiri MposhiKapiri Mposhi
RufunsaRufunsa
Old MkushiOld Mkushi
MkushiMkushi
NyimbaNyimba
PetaukePetauke
MfuweMfuwe
MpikaMpika
ChambeshiChambeshi
KopeKope
ChembeChembe
SamfyaSamfya
LuwinguLuwingu
MpulunguMpulungu
MbalaMbala
SumbuSumbu
MwenzoMwenzoNchelengeNchelenge
KaputaKaputa
KawambwaKawambwa
MporokosoMporokoso
MufuliraMufuliraMwanyaMwanya
ChisomoChisomo
KateteKatete
SerenjeSerenje
LubunguLubungu
KawanaKawana
MavuaMavua
LuampaLuampaKalaboKalabo
SenangaSenanga
KabompoKabompo
ManyingaManyinga
LukuluLukulu
ZambeziZambezi
ChavumaChavuma
MulobeziMulobezi
KatabaKataba
MalundanoMalundano
SeshekeSesheke
SitotiSitoti S O U T H E R NS O U T H E R N
C E N T R A LC E N T R A L
N O RN O R T H E R NT H E R N
E A S T E R NE A S T E R N
W E S T E R NW E S T E R N
N O RN O R T H -T H -W E S T E R NW E S T E R N
C O P P E R -C O P P E R -B E LB E L TT
LLUUAA
PP UU LL AA
LL UU SS AA KK AA
KabweKabwe
LivingstoneLivingstone
MonguMongu
SolweziSolwezi
NdolaNdola
ChipataChipata
MansaMansa
KasamaKasama
LUSAKALUSAKA
ANGOLA
DEMOCRATIC REPUBLICOF CONGO
TANZANIA
MALAWI
ZIMBABWE
NAMIBIA
BOTSWANA
MOZAMBIQUE
MO
ZAM
BIQ
UE
To Caianda
To Lumbala
To Lutembo
To Chiume
To Ngoma
To Mpandamatenga
To Matetsi
To Harare
To Cahora Bassa
To Lubumbashi
To Mokambo
To Sumbawanga
To Mbeya
To Karonga
To Mzuzu
To Lilongwe
To Furancungo
S O U T H E R N
C E N T R A L
N O R T H E R N
E A S T E R N
W E S T E R N
N O R T H -W E S T E R N
C O P P E R -B E L T
LUA
P U L A
L U S A K A
Mumbwa
Mutanda
Mwinilunga
NamwalaKafueMazabuka
Kaema
PokumaSenkobo
Kalomo
Choma
Bowwood
Pemba
Chirundu
KaribaShangombo
Kasempa
Chisasa
Chingola
Kapiri Mposhi
Rufunsa
Old Mkushi
Mkushi
Nyimba
Petauke
Mfuwe
Mpika
Chambeshi
Kope
Chembe
Samfya
Luwingu
Mpulungu
Mbala
Sumbu
MwenzoNchelenge
Kaputa
Kawambwa
Mporokoso
MufuliraMwanya
Chisomo
Katete
Serenje
Luangwa
Lubungu
Kawana
Mavua
LuampaKalabo
Senanga
Kabompo
Manyinga
Lukulu
Zambezi
Chavuma
Mulobezi
Kataba
Malundano
Sesheke
Sitoti
Kabwe
Livingstone
Mongu
Solwezi
Ndola
Chipata
Mansa
Kasama
LUSAKA
ANGOLA
DEMOCRATIC REPUBLICOF CONGO
TANZANIA
MALAWI
ZIMBABWE
NAMIBIA
BOTSWANA
MOZAMBIQUE
MO
ZAM
BIQ
UE
Zam
bezi
Lung
a
Luns
emfw
a
Luan
gwa
Kafue
Cuando
Lungwebungu
Kafue
LakeBangwelu
LakeMweru
Wantipa
LakeMweru
Lake Tanganyika
LakeKariba
LakeMalawiTo
Caianda
To Lumbala
To Lutembo
To Chiume
To Ngoma
To Mpandamatenga
To Matetsi
To Harare
To Cahora Bassa
To Lubumbashi
To Mokambo
To Sumbawanga
To Mbeya
To Karonga
To Mzuzu
To Lilongwe
To Furancungo
MulongaPlain
BusangaSwamp
LukangaSwamp
Muchinga
Mts
.
Mafinga Hills(2301 m)
Kaulishishi(1420 m)
Machechete(1488 m)
22°E 26°E 30°E
22°E 26°E 30°E
12°S
16°S
8°S
12°S
ZAMBIA
0 15010050
0 50 100 150 Miles
200 Kilometers IBRD 33514
OC
TOBER 2004
ZAMBIASELECTED CITIES AND TOWNS
PROVINCE CAPITALS
NATIONAL CAPITAL
RIVERS
MAIN ROADS
RAILROADS
PROVINCE BOUNDARIES
INTERNATIONAL BOUNDARIES
This map was produced by the Map Design Unit of The World Bank. The boundaries, colors, denominations and any other information shown on this map do not imply, on the part of The World Bank Group, any judgment on the legal status of any territory, o r any endorsemen t or a c c e p t a n c e o f s u c h boundaries.