Public Disclosure Authorized UNIVERSAL HEALTH COVERAGE...
44
UNIVERSAL HEALTH COVERAGE STUDY SERIES NO. 28 Please cite this paper as: Bonilla-Chacin, M.E., Afandiyeva, G., and Suaya, A. 2018. “Challenges on the Path to Universal Health Coverage: The Experience of Azerbaijan”. Universal Health Care Coverage Series 28, World Bank Group, Washington, DC. Public Disclosure Authorized Public Disclosure Authorized Public Disclosure Authorized Public Disclosure Authorized
Transcript of Public Disclosure Authorized UNIVERSAL HEALTH COVERAGE...
UNIVERSAL HEALTH COVERAGE STUDY SERIES NO. 28
Please cite this paper as: Bonilla-Chacin, M.E., Afandiyeva, G., and Suaya, A. 2018. “Challenges on the Path to Universal Health Coverage: The Experience of Azerbaijan”. Universal Health Care Coverage Series 28, World Bank Group, Washington, DC.
Pub
lic D
iscl
osur
e A
utho
rized
Pub
lic D
iscl
osur
e A
utho
rized
Pub
lic D
iscl
osur
e A
utho
rized
Pub
lic D
iscl
osur
e A
utho
rized

2

3
UNIVERSAL HEALTH COVERAGE STUDY SERIES No. 28
Challenges on the Path to Universal Health
Coverage: The Experience of Azerbaijan
María Eugenia Bonilla-Chacín, Gulara Afandiyeva, and Agustina Suaya
The World Bank, Washington, DC, 2018

4
ABBREVIATIONS AND ACRONYMS
AMSSW Azerbaijan Monitoring Survey of Social Welfare
EU European Union
GDP Gross Domestic Product
HCP Health Coverage Program
HIV/AIDS Human Immunodeficiency Virus Infection/Acquired Immune
Deficiency Syndrome
IHME Institute of Health Metrics and Evaluation
MoH Ministry of Health
MSHI Mandatory Social Health Insurance
NCDs Noncommunicable Diseases
OOP Out-of-Pocket
PHC Primary Health Care
USSR Union of Soviet Socialist Republics
WDI World Development Indicators
WHO World Health Organization
5
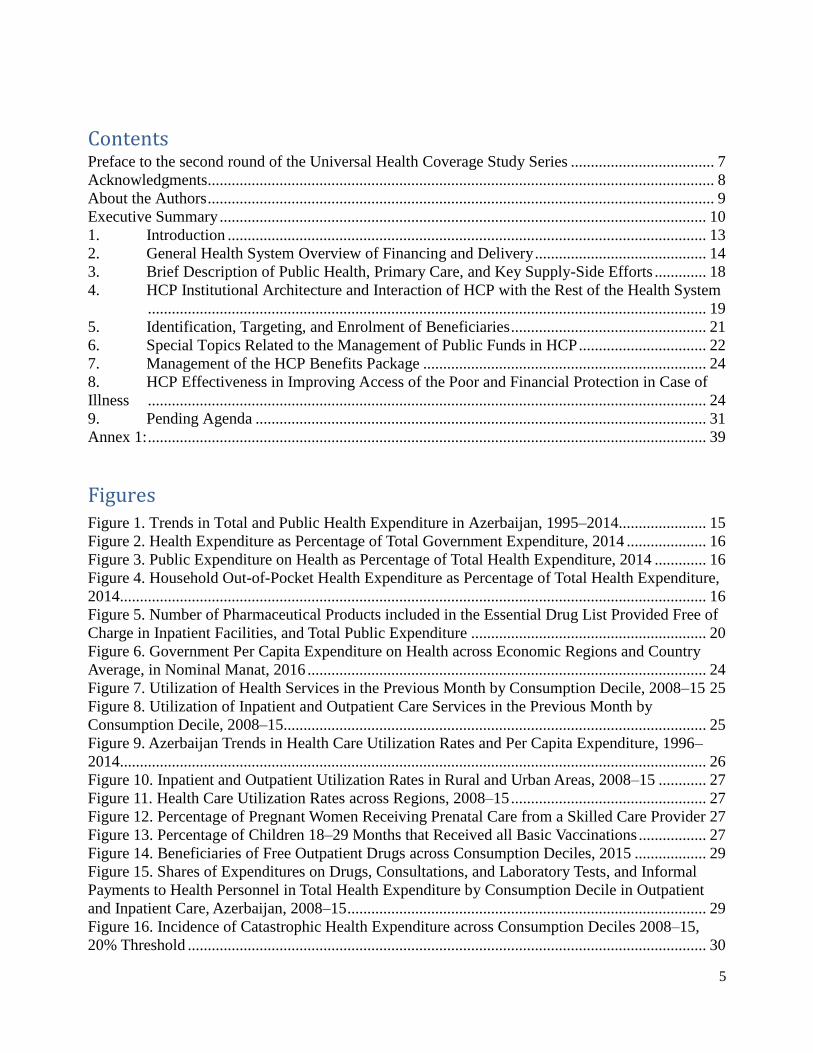
Contents Preface to the second round of the Universal Health Coverage Study Series .................................... 7 Acknowledgments............................................................................................................................... 8 About the Authors ............................................................................................................................... 9 Executive Summary .......................................................................................................................... 10 1. Introduction ........................................................................................................................ 13 2. General Health System Overview of Financing and Delivery ........................................... 14 3. Brief Description of Public Health, Primary Care, and Key Supply-Side Efforts ............. 18 4. HCP Institutional Architecture and Interaction of HCP with the Rest of the Health System
............................................................................................................................................ 19 5. Identification, Targeting, and Enrolment of Beneficiaries ................................................. 21 6. Special Topics Related to the Management of Public Funds in HCP ................................ 22 7. Management of the HCP Benefits Package ....................................................................... 24 8. HCP Effectiveness in Improving Access of the Poor and Financial Protection in Case of
Illness ............................................................................................................................................ 24 9. Pending Agenda ................................................................................................................. 31 Annex 1: ............................................................................................................................................ 39
Figures Figure 1. Trends in Total and Public Health Expenditure in Azerbaijan, 1995–2014...................... 15 Figure 2. Health Expenditure as Percentage of Total Government Expenditure, 2014 .................... 16 Figure 3. Public Expenditure on Health as Percentage of Total Health Expenditure, 2014 ............. 16 Figure 4. Household Out-of-Pocket Health Expenditure as Percentage of Total Health Expenditure,
2014................................................................................................................................................... 16 Figure 5. Number of Pharmaceutical Products included in the Essential Drug List Provided Free of
Charge in Inpatient Facilities, and Total Public Expenditure ........................................................... 20 Figure 6. Government Per Capita Expenditure on Health across Economic Regions and Country
Average, in Nominal Manat, 2016 .................................................................................................... 24 Figure 7. Utilization of Health Services in the Previous Month by Consumption Decile, 2008–15 25 Figure 8. Utilization of Inpatient and Outpatient Care Services in the Previous Month by
Consumption Decile, 2008–15.......................................................................................................... 25 Figure 9. Azerbaijan Trends in Health Care Utilization Rates and Per Capita Expenditure, 1996–
2014................................................................................................................................................... 26 Figure 10. Inpatient and Outpatient Utilization Rates in Rural and Urban Areas, 2008–15 ............ 27 Figure 11. Health Care Utilization Rates across Regions, 2008–15 ................................................. 27 Figure 12. Percentage of Pregnant Women Receiving Prenatal Care from a Skilled Care Provider 27 Figure 13. Percentage of Children 18–29 Months that Received all Basic Vaccinations ................. 27 Figure 14. Beneficiaries of Free Outpatient Drugs across Consumption Deciles, 2015 .................. 29 Figure 15. Shares of Expenditures on Drugs, Consultations, and Laboratory Tests, and Informal
Payments to Health Personnel in Total Health Expenditure by Consumption Decile in Outpatient
and Inpatient Care, Azerbaijan, 2008–15 .......................................................................................... 29 Figure 16. Incidence of Catastrophic Health Expenditure across Consumption Deciles 2008–15,
20% Threshold .................................................................................................................................. 30

6
Figure 17. Incidence of Catastrophic Health Expenditure across Consumption Deciles, 2008–15,
30% Threshold .................................................................................................................................. 30 Figure 18. Overshoot of Household Catastrophic Health Expenditure in Azerbaijan, 2008 and 2015,
across Consumption Deciles, 20% Threshold .................................................................................. 30 Figure 19. Overshoot of Household Catastrophic Health Expenditure in Azerbaijan in 2008 and
2015 across Consumption Deciles, 30% Threshold ......................................................................... 30 Figure 20. Hospital Beds per 100,000 in Selected European and Central Asian Countries, 2014 ... 34 Figure 21. Azerbaijan, Trends in Hospital Beds per 100,000 People ............................................... 34 Figure 22. Bed Occupancy Rates, Acute Care Hospitals only, in Selected Countries in Eastern
Europe and Central Asia, 2014 ......................................................................................................... 35 Figure 23. Average Hospital Length of Stay in Selected Countries in Eastern Europe and Central
Asia, 2014 ......................................................................................................................................... 35 Figure 24. Type of Health Facility Used for Outpatient Care ........................................................... 37
Tables
Table 1. Health Outcomes and GDP Per Capita in Upper-Middle-Income Countries in Eastern
Europe and Central Asia, 2012 ......................................................................................................... 13 Table 2. Average Monthly Salary across Economic Activity in Azerbaijan, 2015 .......................... 17 Table 3. Total Budget of State National Programs in Azerbaijan for 2009–15, in Thousand Manat
of 2000 .............................................................................................................................................. 21 Table 4. Trends in Number of Beneficiaries of State National Programs, 2010–16 ........................ 22 Table 5. Azerbaijan Total Household OOP Expenditure on Health and Share of Health Expenditure
out of Total Expenditure across Consumption Deciles, 2008 and 2015 ........................................... 28

7
Preface to the second round of the Universal Health Coverage
Study Series
All over the world countries are implementing pro-poor reforms to advance universal health
coverage. The widespread trend to expand coverage resulted in the inclusion of the “achieving
universal health coverage by 2030” target in the Sustainable Development Agenda. Progress is
monitored through indicators measuring gains in financial risk protection and in access to quality
essential health-care services.
The Universal Health Coverage (UHC) Studies Series was launched in 2013 with the objective of
sharing knowledge regarding pro-poor reforms advancing UHC in developing countries. The series
is aimed at policy-makers and UHC reform implementers in low- and middle-income countries.
The Series recognizes that there are many policy paths to achieve UHC and therefore does not
endorse a specific path or model.
The Series consists of country case studies and technical papers. The case studies employ a
standardized approach aimed at understanding the tools –policies, instruments and institutions-
used to expand health coverage across three dimensions: population, health services and
affordability. The approach relies on a protocol involving around 300 questions structured to
provide a detailed understanding of how countries are implementing UHC reforms in the following
areas:
• Progressive Universalism: expanding population coverage while ensuring that the poor
and vulnerable are not left behind;
• Strategic Purchasing: expanding the statutory benefits package and developing incentives
for its effective delivery by health-care providers;
• Raising revenues to finance health care in fiscally sustainable ways;
• Improving the availability and quality of health-care providers; and,
• Strengthening accountability to ensure the fulfillment of promises made between citizens,
governments and health institutions.
By 2017, the Series had published 24 country case studies and conducted a systematic literature
review on the impact of UHC reforms. In 2018 the Series will publish an additional15 case studies,
A book analyzing and comparing the initial 24 country case studies is also available: Going
Universal: How 24 Developing Countries are Implementing UHC Reforms from the Bottom Up.
Links to the Series and the book are included below.
Daniel Cotlear, D. Phil.
Manager and Editor
Universal Health Coverage Study Series
Links:
http://www.worldbank.org/en/topic/health/publication/universal-health-coverage-study-series
http://www.worldbank.org/en/topic/universalhealthcoverage/publication/going-universal-how-24-
countries-are-implementing-universal-health-coverage-reforms-from-bottom-up

8
Acknowledgments
This document would not have been possible without support from the Mandatory Health Insurance
Agency; the Ministry of Health of Azerbaijan; and the following officials from the Mandatory
Health Insurance Agency: Mr. Zaur Aliyev (Director), Mr. Isa Aliyev, Mr. Tural Gulu, and Mr.
Fadai Mammadov. Ms. Zakiyya Mustafayeva, from the Ministry of Health, also provided key
support. Finally, Ms. Elvira Anadolu provided invaluable guidance to the team in the development
of this case study.

9
About the Authors
Gulara Afandiyeva is a health economist with special expertise in directing and managing complex
and sensitive studies. She has worked with a variety of partners and stakeholders including local
communities, civil society organizations, the public sector, international development agencies,
multilateral and bilateral agencies, the private sector, and donor agencies. Gulara has more than 10
years of professional experience in health financing, health insurance, cost accounting in health
care, costing, and business management of health care facilities. Gulara’s experience is supported
by strong skills in general medicine, business development, resource mobilization,
communications, project management, and technical writing, research, and data analysis. She holds
a Medical Doctor Degree from the Azerbaijan State Medical University, and an MBA from the
Azerbaijan State Economical University.
María Eugenia Bonilla-Chacín is a Senior Economist in the Health, Nutrition and Population
Global Practice at the World Bank. Her areas of interest are health promotion policies and primary
health service delivery. Maria Eugenia earned a PhD in Economics from The Johns Hopkins
University. As an economist working on health issues in the Latin America and the Caribbean,
Africa, and Eastern Europe and Central Asia regions, she has led several technical assistance and
analytical studies on various health issues, including health financing, service delivery, and health
in all policy areas. She has also been lead investigator on several regional and global analytical
studies, such as on Governance of Multisectoral Interventions to Reduce Health Risk Factors in
Latin America and the Caribbean, and she is currently coordinating a global analytical study on
obesity prevention. In addition to her work in health, she has also led and participated in the design
and implementation of projects in education, social protection, and multisectoral operations.
Agustina Suaya is a consultant to the Health, Nutrition and Population Global Practice at the
World Bank. She has a Master’s degree in Public Policy from the George Washington University,
with a concentration in program evaluation and statistical analysis. At the World Bank, she focuses
on Latin America and the Caribbean, contributing to studies on the performance of health policies
and the efficient delivery of services. In addition to working with the Health Global Practice, she
has also participated in projects of the Social Protection & Labor Global Practice. Agustina has also
been a consultant at the Inter-American Development Bank.

10
Executive Summary
Over the last decade, Azerbaijan has been able to increase significantly public resources for health.
In 2015, per capita public expenditure on health was about 74 manats, which was six times higher
in real terms than in 2000. Despite these increases, Azerbaijan still spends much less that other
Former Soviet Union (FSU) countries as a share of total government expenditure.
The additional resources for health were used to renovate the health infrastructure and to increase
the number and availability of pharmaceutical products provided at no cost to the population.
There were also new government policies with the aim of increasing the list of pharmaceuticals
and medical supplies provided at no cost to patients. The Government increased several times the
list of drugs provided free of charge for inpatient care; it increased the number and resources to
state national programs that provide free pharmaceuticals and medical supplies for the control of
specific diseases or conditions, such as maternal and child care, diabetes, and HIV/AIDS; and it
increased the availability of outpatient drugs provided at no cost to certain beneficiary groups.
These efforts, however, have had only a limited effect on access to health services and on
catastrophic health expenditure. Analyses based on two household surveys (Azerbaijan
Monitoring Survey of Social Welfare - AMSSW 2008 and 2015) show that most of the increase
in health care utilization between those two years occurred in inpatient care and among the
highest income population groups. There was even a slight decrease in utilization of outpatient
care among the poor. Nevertheless, there is evidence of an improvement in coverage of key
maternal and child health services supported by one of the state national programs.
Regarding financial protection, there was a sharp increase in the incidence of catastrophic health
expenditure in the population between 2008 and 2015. However, this increase was concentrated
among households in the richest two deciles of the consumption distribution. In contrast, among
the poor, the incidence of catastrophic expenditure decreased. Nevertheless, overall the incidence
of catastrophic health expenditure, remains very high. In 2015, as many as 16 percent of
households had health expenditures higher than 30 percent of total expenditure.
The country’s macroeconomic and fiscal environment has changed significantly in the last three
years, and thus any additional progress toward universal health coverage would require a different
approach to the one used so far. It would require an increase in resources for health and stronger
efforts to pool these resources, a strengthened prioritization in the use of funds, a more efficient
use of existing health resources, and a reform in the organization and functioning of the health
delivery network.
In this context, the Government is currently piloting the introduction of a Mandatory Social Health
Insurance (MSHI) scheme. The main objective is to improve financial protection in case of illness
and to provide access to quality healthcare services. This new MSHI scheme could not only
increase revenue collection, but it could also generate needed structural changes in the system by

11
creating a single purchasing agency and by changing provider-payment mechanisms from line-
item budgets to payments linked to outputs.
To achieve these results the MSHI faces some challenges in the design and implementation
process. First, collecting revenue from non-poor informal sector workers is complex, and few
countries have been able to do so. Second, in other FSU countries where similar schemes were
introduced, only in Moldova it resulted in an unambiguous increase in resources for health, at least
during the first years after introduction.1 In addition, the payroll tax rate tended to be small, as is
the one planned for Azerbaijan—from 2 to 4 percent (increased in Moldova later on), reducing the
potential of the MSHI payroll taxes for increasing revenues. In contrast, other countries in the
region that also introduced health insurance, such as Latvia, Bulgaria, and Estonia, health taxes
were much higher, reaching up to 17 percent.2
The introduction of the scheme will require much preparation to ensure its success. It will be
particularly important to define a package of services for which beneficiaries would be entitled
and ensure that this package can be fully funded by the scheme. For the pilot project, currently an
extensive list of services is included in the essential package to be financed by the MSHI. However,
to make this package sustainable and fully funded by the scheme, a revision would be advisable.
A mechanism for identifying and enrolling beneficiaries and for collecting and pooling resources
would also be needed. Currently, the decision is that the Mandatory Health Insurance Agency will
collect revenue during the pilot phase. However, for the national implementation of MSHI, other
agencies that routinely collect taxes and premiums from workers could be considered, such as Tax
Authorities and the Ministry of Labor and Social Protection.
In addition to implementing the MSHI reform, other reforms will also be needed to ensure that the
potential impact of the mandatory health insurance scheme is realized. For instance, other sources
of revenue collection for health will be needed as well as a reform in the organization and
functioning of the public delivery network. Due to the small size of the formal labor market,
about 33 percent of the workforce, the revenue collection capabilities of the MSHI will be limited.
Thus, other revenue collection efforts will be needed. Since public expenditure on health as share
of total expenditure remains among the lowest in the region, there is room to increase this share
and generate needed fiscal space for health.
Tobacco taxation might be another source of funds for health that would be important to consider.
As many as 36 percent of adult men in the country smoke.3 Azerbaijan is one of the four countries
in the world where tobacco prevalence has actually increased over the last 15 years. At the same
time, Azerbaijan in 2014 had the lowest taxation on tobacco in all Europe.4 Higher taxes on
tobacco can provide more resources for health while reducing the prevalence of smoking- a major
risk factor for population health in the country.
Another important source of fiscal space for health could be achieved through efficiency gains and
input cost reductions. Currently, some of the drugs procured for the state national programs are
brand-name pharmaceuticals, not generics. In addition, despite seemingly adequate numbers of
health personnel and infrastructure, health service utilization rates have not significantly changed;
they remain among the lowest in the region. This reflects large inefficiency in the use of these

12
resources. Similarly, despite previous efforts to consolidate the hospital infrastructure, the system
still has significant overcapacity.
Improving the allocative efficiency of the resources used for health could also generate fiscal space
for the sector. The prioritization of drugs and services provided free of charge to patients should
be strengthened. Moreover, health technology assessments could be conducted regularly to inform
and to update the list of pharmaceuticals that are provided at no cost as well as to decide which
services have to be included in the State Guarantee Package of Services under the MSHI. The
criteria used to include some drugs are unclear. The basket of drugs provided free of charge is
highly focused on inpatient care and curative care and not on prevention, with some exceptions
such as childhood immunization.
Finally, improving effective coverage and financial protection of the population will not only
require a health financing reform, but also a reform in the organizational structure and functioning
of the health delivery network. Currently, the system remains heavily biased toward hospital care,
leaving primary health care (PHC) underfunded and underdeveloped. PHC facilities are not the
first point of contact with the health sector; rather, it is often hospital care. Thus, the PHC services
remain underutilized.
The strengthening of PHC is a key pending reform, particularly given the high burden of illness
from noncommunicable diseases (NCDs) that are more effectively and efficiently detected and
controlled in a PHC setting, preventing exacerbation of the diseases and hospitalization. Indeed,
the utilization of health services to diagnose, detect, and treat these illnesses is limited. For
example, only 17 percent of people who suffer from high blood pressure have it under control, and
as many as 18 percent of people with diagnosed diabetes were not registered at the policlinic and
thus were not beneficiaries of the state diabetes program.5
The state national programs are managed as vertical programs; their financing is managed centrally
by the Ministry of Health (MoH) and does not flow through the district authorities who are in
charge of most service provision in the country. They take up a substantial share of the public
budget for health—in 2015, up to 35 percent. They focus mostly on treatment, while prevention
is a crucial part of the intervention protocol of these conditions, particularly in the case of NCDs,
which do not receive much attention or funding.
Finally, for providers to be able to respond to incentives for production and quality improvement,
they would need a much higher degree of autonomy than they currently have. This includes, among
other things, autonomy in financial management, which they currently lack due to inflexible line-
item budgets, and autonomy in personnel management. Otherwise, any attempt to reap benefits
from strategic purchasing is unlikely to succeed.
In summary, Azerbaijan has initiated an important health financing reform aimed at improving
access to health services and financial protection against ill health. To ensure the country reaps
all the potential benefits of the scheme, additional efforts will be needed, not only to increase
revenue collection for health, but also to improve the performance of the service delivery network.
13
1. Introduction
Azerbaijan is an upper-middle-income country with a Gross Domestic Product (GDP) per capita
of US$5,496.6 In 2015, the country had a population of about 9.6 million.7 During the last 15
years, Azerbaijan has had a strong economic performance that has been translated into important
reductions in poverty and in middle-class growth. According to the World Bank Systematic
Country Diagnostic,8 the poverty rate went from 50 percent in 2000 to only 6 percent in 2012.
This strong performance was driven by natural-resource-based economic growth, which allowed
the country to recover from the negative economic and social impact it suffered after the breakup
of the Soviet Union and mass displacement of people after the Nagorno-Karabakh armed
conflict.
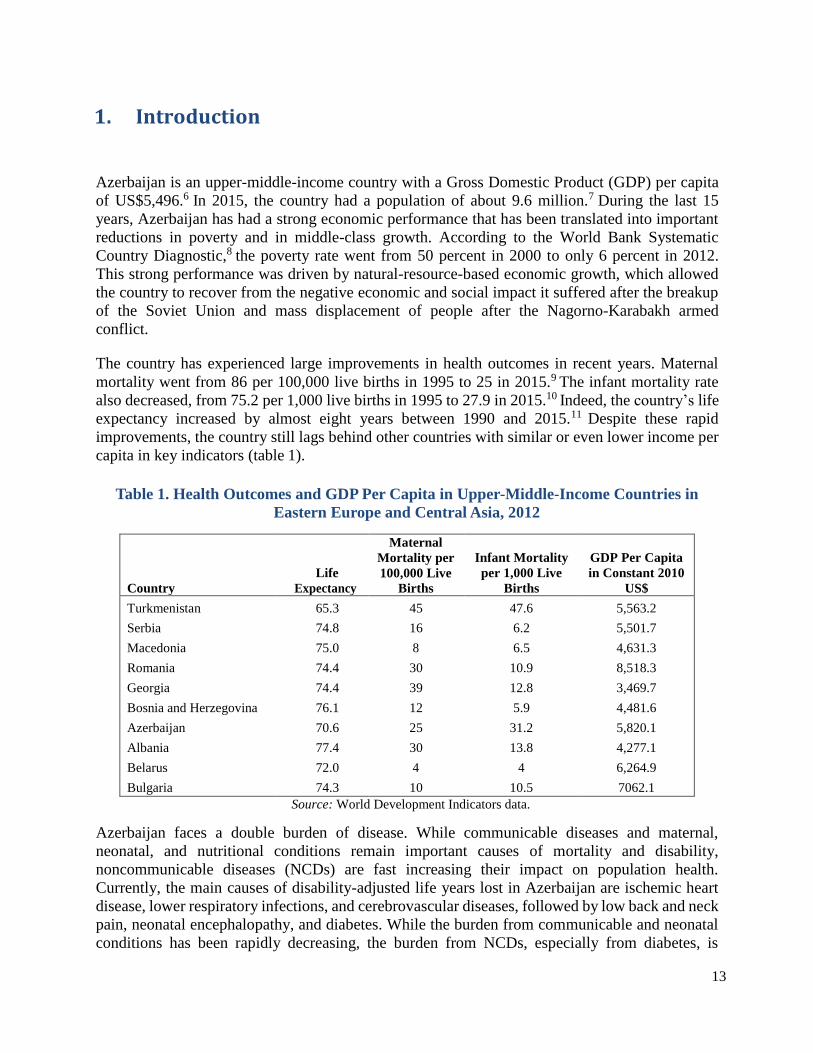
The country has experienced large improvements in health outcomes in recent years. Maternal
mortality went from 86 per 100,000 live births in 1995 to 25 in 2015.9 The infant mortality rate
also decreased, from 75.2 per 1,000 live births in 1995 to 27.9 in 2015.10 Indeed, the country’s life
expectancy increased by almost eight years between 1990 and 2015.11 Despite these rapid
improvements, the country still lags behind other countries with similar or even lower income per
capita in key indicators (table 1).
Table 1. Health Outcomes and GDP Per Capita in Upper-Middle-Income Countries in
Eastern Europe and Central Asia, 2012
Country
Life
Expectancy
Maternal
Mortality per
100,000 Live
Births
Infant Mortality
per 1,000 Live
Births
GDP Per Capita
in Constant 2010
US$
Turkmenistan 65.3 45 47.6 5,563.2
Serbia 74.8 16 6.2 5,501.7
Macedonia 75.0 8 6.5 4,631.3
Romania 74.4 30 10.9 8,518.3
Georgia 74.4 39 12.8 3,469.7
Bosnia and Herzegovina 76.1 12 5.9 4,481.6
Azerbaijan 70.6 25 31.2 5,820.1
Albania 77.4 30 13.8 4,277.1
Belarus 72.0 4 4 6,264.9
Bulgaria 74.3 10 10.5 7062.1
Source: World Development Indicators data.
Azerbaijan faces a double burden of disease. While communicable diseases and maternal,
neonatal, and nutritional conditions remain important causes of mortality and disability,
noncommunicable diseases (NCDs) are fast increasing their impact on population health.
Currently, the main causes of disability-adjusted life years lost in Azerbaijan are ischemic heart
disease, lower respiratory infections, and cerebrovascular diseases, followed by low back and neck
pain, neonatal encephalopathy, and diabetes. While the burden from communicable and neonatal
conditions has been rapidly decreasing, the burden from NCDs, especially from diabetes, is
14
increasing (Institute of Health Metrics and Evaluation - IHME 2016).
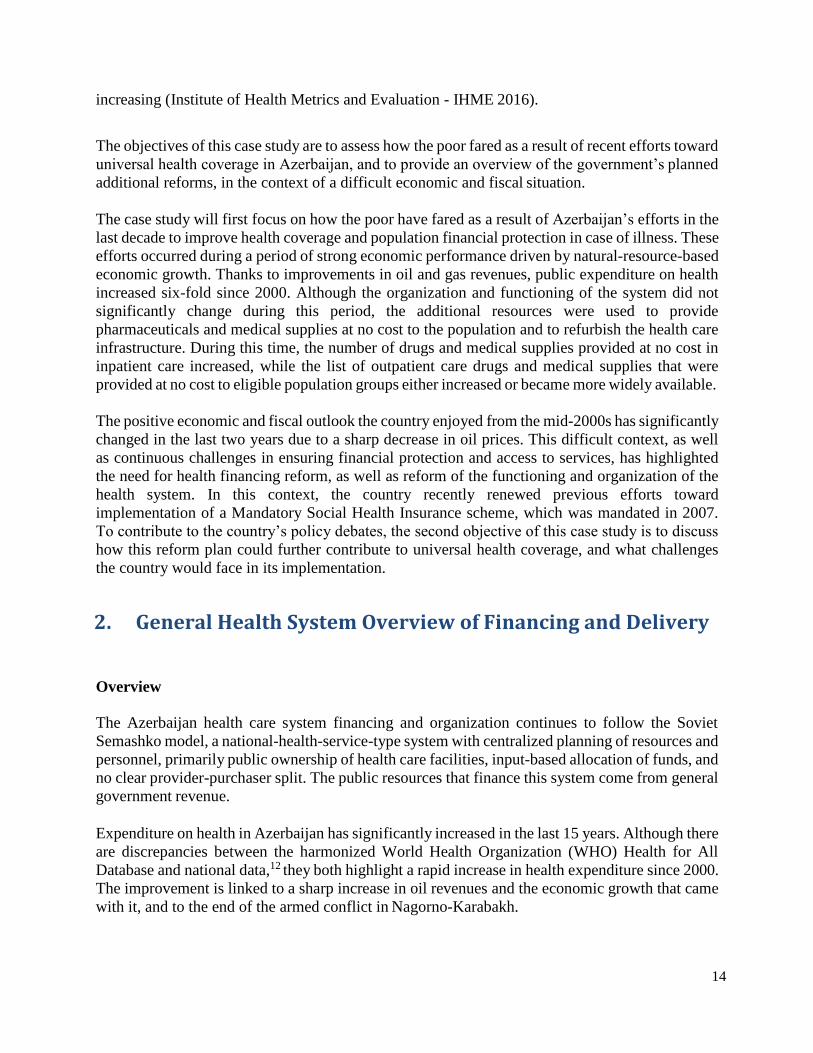
The objectives of this case study are to assess how the poor fared as a result of recent efforts toward
universal health coverage in Azerbaijan, and to provide an overview of the government’s planned
additional reforms, in the context of a difficult economic and fiscal situation.
The case study will first focus on how the poor have fared as a result of Azerbaijan’s efforts in the
last decade to improve health coverage and population financial protection in case of illness. These
efforts occurred during a period of strong economic performance driven by natural-resource-based
economic growth. Thanks to improvements in oil and gas revenues, public expenditure on health
increased six-fold since 2000. Although the organization and functioning of the system did not
significantly change during this period, the additional resources were used to provide
pharmaceuticals and medical supplies at no cost to the population and to refurbish the health care
infrastructure. During this time, the number of drugs and medical supplies provided at no cost in
inpatient care increased, while the list of outpatient care drugs and medical supplies that were
provided at no cost to eligible population groups either increased or became more widely available.
The positive economic and fiscal outlook the country enjoyed from the mid-2000s has significantly
changed in the last two years due to a sharp decrease in oil prices. This difficult context, as well
as continuous challenges in ensuring financial protection and access to services, has highlighted
the need for health financing reform, as well as reform of the functioning and organization of the
health system. In this context, the country recently renewed previous efforts toward
implementation of a Mandatory Social Health Insurance scheme, which was mandated in 2007.
To contribute to the country’s policy debates, the second objective of this case study is to discuss
how this reform plan could further contribute to universal health coverage, and what challenges
the country would face in its implementation.
2. General Health System Overview of Financing and Delivery
Overview
The Azerbaijan health care system financing and organization continues to follow the Soviet
Semashko model, a national-health-service-type system with centralized planning of resources and
personnel, primarily public ownership of health care facilities, input-based allocation of funds, and
no clear provider-purchaser split. The public resources that finance this system come from general
government revenue.
Expenditure on health in Azerbaijan has significantly increased in the last 15 years. Although there
are discrepancies between the harmonized World Health Organization (WHO) Health for All
Database and national data,12 they both highlight a rapid increase in health expenditure since 2000.
The improvement is linked to a sharp increase in oil revenues and the economic growth that came
with it, and to the end of the armed conflict in Nagorno-Karabakh.
15
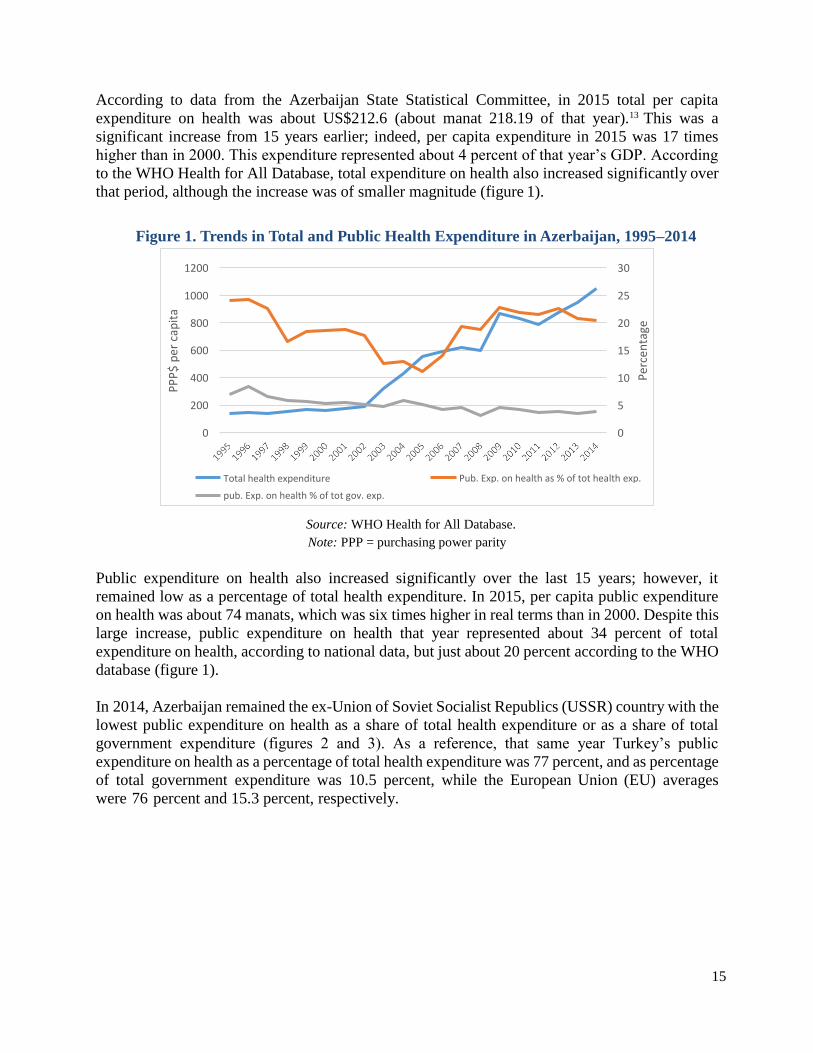
According to data from the Azerbaijan State Statistical Committee, in 2015 total per capita
expenditure on health was about US$212.6 (about manat 218.19 of that year).13 This was a
significant increase from 15 years earlier; indeed, per capita expenditure in 2015 was 17 times
higher than in 2000. This expenditure represented about 4 percent of that year’s GDP. According
to the WHO Health for All Database, total expenditure on health also increased significantly over
that period, although the increase was of smaller magnitude (figure 1).
Figure 1. Trends in Total and Public Health Expenditure in Azerbaijan, 1995–2014
Source: WHO Health for All Database.
Note: PPP = purchasing power parity
Public expenditure on health also increased significantly over the last 15 years; however, it
remained low as a percentage of total health expenditure. In 2015, per capita public expenditure
on health was about 74 manats, which was six times higher in real terms than in 2000. Despite this
large increase, public expenditure on health that year represented about 34 percent of total
expenditure on health, according to national data, but just about 20 percent according to the WHO
database (figure 1).
In 2014, Azerbaijan remained the ex-Union of Soviet Socialist Republics (USSR) country with the
lowest public expenditure on health as a share of total health expenditure or as a share of total
government expenditure (figures 2 and 3). As a reference, that same year Turkey’s public
expenditure on health as a percentage of total health expenditure was 77 percent, and as percentage
of total government expenditure was 10.5 percent, while the European Union (EU) averages
were 76 percent and 15.3 percent, respectively.
1200 30
1000 25
800 20
600 15
400 10
200 5
0 0
Total health expenditure
pub. Exp. on health % of tot gov. exp.
Pub. Exp. on health as % of tot health exp.
PP
P$
per
cap
ita
Per
cen
tage

16
Figure 2. Health Expenditure as
Percentage of Total Government
Expenditure, 2014
Figure 3. Public Expenditure on Health as
Percentage of Total Health Expenditure,
2014
Source: WHO, Health for All Database.
Note: CIS = Commonwealth of Independent States.
As a result of the low public expenditure on health, Azerbaijan has the highest out-of-pocket (OOP)
expenditure on health in the region (figure 4). According to the last household survey (AMSSW
2015), households spend on average 12.5 percent of their consumption on health. That same year,
23 percent of households incurred catastrophic health expenditures, allocating more than 20
percent of their total consumption to health.
Figure 4. Household Out-of-Pocket Health
Expenditure as Percentage of Total Health
Expenditure, 2014
Source: WHO Health for All Database.
Note: CIS = Commonwealth of Independent States; EU = European Union.
Azerbaijan Tajikistan
Georgia
Armenia
Ukraine
CIS Russian Federation
Kazakhstan
Uzbekistan
Kyrgyzstan
Turkmenistan
Belarus
European Region
EU members since May 2004 Turkey
EU
EU members before May 2004
0 10 20 30 40 50 60 70 80
EU members before May 2004
EU
Belarus
European Region
EU members since May 2004
Kyrgyzstan
Kazakhstan
Ukraine
Uzbekistan
Turkey
CIS
Russian Federation
Turkmenistan
Armenia
Tajikistan
Georgia
Azerbaijan
0 5 10 15 20
Turkey
EU members before May 2004
EU
EU members since May 2004
European Region
Belarus
Turkmenistan
Kyrgyzstan
Kazakhstan
Uzbekistan
Russian Federation
CIS
Ukraine
Armenia
Tajikistan
Georgia
Azerbaijan
0 20 40 60 80 100

17
Most of this OOP expenditure is on pharmaceutical products, both with and without a prescription.
According to the 2015 AMSSW, 80 percent of household OOP in health was expenditure on
pharmaceuticals. Another 10 percent was spent on lab exams, and the remaining 10 percent was
spent on payments (both formal and informal) to medical personnel.
Although in principle all health consultations in public facilities are meant to be free of charge, in
practice most patients continue to provide payments (often informal) to medical personnel. Health
personnel working in public facilities are paid through salaries. However, these salaries remain
low. The average monthly salary of health personnel is among the lowest in the country, averaging
less than half the average monthly salary and only twice the current minimum wage of manat 105
(table 2).
Table 2. Average Monthly Salary across Economic Activity in Azerbaijan, 2015
Economic Activity Salary
(manat)
On economy – total 466.9
Agriculture, forestry, and fishing 245.8
Mining 2171.1
Manufacturing 527.9
Electricity, gas, and steam production, distribution, and supply 513.2
Water supply; waste treatment and disposal 333.3
Construction 677.7
Trade; repair of transport means 378.1
Transportation and storage 575.8
Accommodation and food service activities 464.6
Information and communication 747.2
Financial and insurance activities 1210.9
Real estate activities 308.2
Professional, scientific, and technical activities 752.4
Administrative and support service activities 542.6
Public administration and defense; social security 494.7
Education 301.1
Human health and social work activities 204.2
Arts, entertainment, and recreation 252.7
Other service activities 441.9
Source: http://www.stat.gov.az/source/labour/indexen.php; Table 004_2-3.
Organization of the Public Health Sector
The MoH is responsible for most decisions on key health policy initiatives at the national level,
including health system management, health policy development, environmental health, and
control of communicable diseases. At the regional level, however, the MoH has limited means to
influence health care providers, because they are financially dependent on the local district
authorities. District authorities have direct managerial responsibilities for health provision in
their districts. The regional health care providers (such as rural hospitals, policlinics,

18
Dispensaries, rural health centers, rural outpatient clinics) are formally attached to the District
Health Authority, which is usually represented by the Head of the Central Regional Hospital, and
he or she is the administrator of the District Health Authority.
In addition to the public providers managed by the Ministry of Health and by the District Health
Authorities, the country also has several parallel networks of public providers. These are the
networks managed by State Customs Committee, State Railways, the Ministry of Defense, the
Ministry of Internal Affairs, and the Ministry of Emergency Situations. Each caters to the workers
of these particular agencies.
Public health facilities include policlinics, which offer outpatient services; hospitals; and
specialized clinics, which offer inpatient services. There are 553 public hospitals in the country,
1,744 policlinics, and 1,799 medical stations in the districts.
Part of the additional resources received from the increase of oil revenue that went to the health
sector were used to renovate, build, and equip health facilities. In recent years, the government has
started to allocate more and more resources for capital investment, primarily for the renovation or
construction of hospitals and for new diagnostic equipment. As in many other ex-USSR countries,
the health infrastructure in Azerbaijan suffered significantly from a low level of capital investment
through the 1990s.
More than 500 medical institutions were renovated and a number of new regional hospitals were
built between 2005 and 2013. In 2014, 25 additional hospitals were remodeled, while in 2015, 62
additional hospitals and policlinics were reconstructed and/or renovated. Initially, the Ministry of
Health also improved the efficiency of its hospital network, through infrastructure consolidation
and other efforts that resulted in an increase in the hospital occupation rates and a decrease in the
average length of hospital stays. However, these consolidation efforts have been stalled with the
construction of new facilities.
Private provision of health care has also been increasing over time. Currently, there are about 500
private providers in the country, including hospitals and outpatient clinics.
3. Brief Description of Public Health, Primary Care, and Key Supply-Side Efforts
Azerbaijan public health efforts are mainly limited to the control of communicable diseases, which
is the responsibility of the sanitary-epidemiological network. Currently, the responsibility for
public health services is divided among different agencies, including the Sanitary-
Epidemiological Service, the Public Health and Reforms Centre of the Ministry of Health, and the
National HIV/AIDS Centre.
Primary health care in the country is provided through ambulatory facilities that also offer
outpatient specialized care. The model differs between rural and urban areas. In rural areas, there
are two types of health care facilities that provide ambulatory care: rural health centers and rural
outpatient clinics.

19
The rural health centers are usually small health centers with one or two rooms and basic medical
equipment staffed by medical assistant, midwife, and/or nurse. They provide first aid, prenatal and
postnatal care, basic disease prevention activities such as immunization and health education, and
simple medical procedures (injections and wound dressing).
The rural outpatient clinics are staffed by a physician, a pediatrician, and midwife/nurses. They
are responsible for providing primary health care services, including management of the most
common health conditions, prenatal and postnatal care, and preventive services including
immunization and health promotion. In some cases, when patients are unable to come to the
clinic, physicians make home visits to provide care.
Outpatient departments of rural hospitals have a broader scope of care, and provide the services
available through rural outpatient clinics plus delivery care, laboratory services, and dental care.
Rural hospitals usually have an obstetrician-gynecologist, a dentist, and laboratory personnel.
The organization of inpatient care in Azerbaijan also differs between rural and urban areas. In each
rural district, inpatient care is provided by the network of central regional hospitals, rural hospitals,
dispensaries, and specialized hospitals providing services for certain conditions. The most
common types of specialized health care facility are maternity, Tuberculosis,
dermatovenereology,14 psychiatric, oncological, and endocrinological clinics. The specialized
hospitals are not present in every district but are located based on regional principles to cover the
entire country, while all tertiary-level facilities are located in Baku.
Emergency care is provided through ambulance stations, which function in each region and city
either as a stand-alone facility or as a department within the central district hospital.
4. HCP Institutional Architecture and Interaction of HCP with the Rest of the Health System
This case study considers the health coverage program (HCP) for Azerbaijan to be the country’s
efforts to increase the number of pharmaceuticals and medical supplies provided free of charge to
the population. There were different government policies with the aim of increasing the list of
pharmaceuticals and medical supplies provided at no cost in inpatient care; increasing the number
and resources to state national programs that provide free pharmaceutical and medical supplies for
the control of specific diseases or conditions, such as maternal and child care, diabetes, and
HIV/AIDs; and increasing the availability of outpatient drugs provided at no cost to certain
beneficiary groups.
From independence to 2008, the health system did not change significantly. It retained the main
features of the Semashko system. During this period, public facilities were allowed to charge
formal user fees for health services. Income from user fees was mainly used to supplement salaries
and, on the rare occasion where there was a surplus, to pay for drugs and/or improvements to a
given facility.

20
140
120
100
80
60
40
20
0
184 305
128 146
2009 2010 2011 2012 2013 2014 2015 2016
Between 1994 and 2008, state services were entirely free of charge only for certain population
groups, such as children, pensioners, students, military personnel and conscripts, women during
pregnancy and postpartum, disabled patients, refugees and internally displaced people, those
involved in national sports teams, and prisoners. All others had to pay formal copayments to
receive certain services.15
Following the adoption of the National Concept on Health Financing Reform in 2008, the Ministry
of Health discontinued formal user charges in all state health facilities. Effectively, this meant that
all services provided at state health facilities were, at least in theory, fully state funded.
However, there were important exceptions to the services and pharmaceuticals that were not
funded through the state budget and for which patients continue to pay formally. Efforts to reduce
these exceptions constitute the health coverage program discussed in this case study. The first is
related to the list of pharmaceutical products provided free of charge for public hospital patients.
In 2005, the Ministry of Health enacted the first list of 60 pharmaceutical products and 23 medical
supplies that were fully funded by the state budget and provided free of charge to hospitalized
patients. Over the years, this list has significantly increased, as has the budget allocated to the
procurement of these pharmaceuticals and medical supplies. As figure 5 shows, by 2015 there were
305 pharmaceuticals and medical supplies in the drug list provided free of charge in hospitals.
Figure 5. Number of Pharmaceutical Products included in the Essential
Drug List Provided Free of Charge in Inpatient Facilities, and Total
Public Expenditure
on Pharmaceutical Products in Azerbaijan, 2009–16
Source: Ministry of Health.
A second effort to reduce the exceptions was that of state national programs, the number of which
increased in the last few years, as have the resources allocated to them. From 2006, a significant
share of the health care budget has been allocated to these programs. By 2015, the funding for
targeted health programs was almost double in real terms, representing in 2015 about 35 percent
of total public expenditure on health. A list of state health programs and their corresponding
budgets for 2008–16 is provided in table 3. The majority target certain health conditions aimed at
covering the cost of providing equipment and pharmaceuticals through centralized procurement.
Indeed, the number of drugs, laboratory tests, and medical supplies linked to 11 programs have
increased yearly, as has the budget allocated to them.
US
$,
mil
lio
ns

21
Table 3. Total Budget of State National Programs in Azerbaijan for 2009–15, in Thousand
Manat of 2000 2009 2010 2011 2012 2013 2014 2015
1. State Program on Hemophilia and
Thalassemia Hereditary Blood Diseases 5,420 7,576 7,192 9,285 9,252 9,191 8,675
2. State Program on Diabetes 3,712 5,688 5,284 5,526 5,700 5,663 14,459
3. State Program on Development of
Donorship of Blood, Components of Blood,
and Blood Service
669
718
607
679
702
698
795
4. State Program on Chronic Kidney
Failure 10,553 10,309 9,769 10,598 12,580 9,731 10,725
5. Program of Immuno-Prophylaxis of
Infectious Diseases 2,599 2,135 1,980 2,038 1,973 1,264 1,217
6. Action Plan for Protection of Health of
Maternity and Childhood 2,052 1,368 903 906 877 872 1,704
7. Expenses for the Action Plan for 2008–
12 on Prevention and Combating
HIV/AIDS
514
1,412
1,332
1,359
1,315
1,308
1,318
8. State Program on Oncology 5,121 5,224 6,451 13,318 13,112 13,064 13,344
9. Expenses related to financial support of
the Action Plan on Combating Tuberculosis
1,355 1,585 881 219 608
10. Expenses for the Action Plan for the
Medical Treatment of Multiple Sclerosis
Patients
1,754
1,189
1,339
11. Mandatory medical checkup for
children 2,177 2,028
Total budget 30,641 34,429 34,875 45,294 48,145 45,376 56,212
Sources: Calculations based on unpublished data from the MoH and Consumer Price Index; www.stat.gov.az.
Finally, the third effort relates to a list of 184 drugs provided at no cost to specific beneficiary
groups. The Cabinet of Ministries created the list, which includes the following categories of
beneficiaries: disabled of 20th January Day; disabled during all national conflicts; disabled
children; disabled (disability category 1 and 2); children born during the Chernobyl disaster;
people who lived or worked in the Chernobyl disaster zone; elderly people, children, disabled
asylum seekers from the Nagorno-Karabakh conflict zone; vulnerable people receiving a financial
allowance from the Ministry of Labor and Social Protection; people with HIV/AIDS; and people
with transplanted organs. The budget for these pharmaceuticals has also been increasing over the
years, particularly after 2014, when the budget benefited from a twofold increased. The large
increase in 2015 was due to a change in policy. Before that year, these pharmaceuticals were only
provided in Baku policlinics, considerably reducing their availability to the population outside the
capital city. Starting in 2015, these drugs have been available throughout the country.
5. Identification, Targeting, and Enrolment of Beneficiaries
All inpatients receive available drugs free of charge. Therefore, no specific registration or
enrolment in this program is needed.

22
In the case of state health programs, the enrolment of beneficiaries depends on the targeted health
condition. The list of beneficiaries in the programs is provided by family and ambulatory center
doctors. Since 2008, the information about these beneficiaries has formed part of a national registry
that includes identification number, personal data, diagnosis, results of laboratory analysis, and
details of treatment. Table 4 shows trends in the number of beneficiaries of some these national
programs.
Table 4. Trends in Number of Beneficiaries of State National Programs, 2010–16
2010 2011 2012 2013 2014 2015 2016
State Program on hemophilia and
thalassemia hereditary blood
diseases
1,650
2,794
3,123
3,517
4,022
4,074
4,403
State Program on diabetes 121,095 135,711 153,506 177,474 194,520 209,377 218,778
State Program on chronic kidney failure
2,967
3,045
3,477
3,790
3,933
4,214
Expenses related to financial
support of the Action Plan on
combating tuberculosis
12,469
11,505
11,383
11,456
9,757
9,695
9,620
State Program on patients with
cancer
28,,052
29,585
32,285
34,681
37,932
40,653
41,370
Expenses for the Action Plan for
the medical treatment of multiple
sclerosis patients
727
694
1,118
1,126
Source: Ministry of Health.
There are different registration mechanisms for beneficiaries of drugs free of charge at the
outpatient-care level. For instance, vulnerable people receiving financial support from the Ministry
of Labor are registered in the Targeted State Social Assistance Program. These beneficiaries are
identified using a means test. Currently, there are about 451,538 people in this registry. People
with disabilities and those who lived or worked in the Chernobyl disaster area are also registered
at the Ministry of Labor and Social Protection. The asylum seekers are registered in the State
Committee of the Republic of Azerbaijan on Refugees and Internally Displaced People. People
with HIV/AIDS and with transplants are included in a special registry of the Ministry of Health.
They all have special certificates from the respective ministries confirming their beneficiary status.
6. Special Topics Related to the Management of Public Funds in HCP
The MoH budget includes resources for hospitals attached to the MoH, polyclinics and ambulatory
units, sanatoriums, sanitation-epidemiology stations, and other facilities in the Baku area. It also
includes resources for the state health programs (Annex figure A.1).
Medicines and other consumables from these programs are distributed from a central ministerial
body—the Innovation and Supply Center—to medical facilities throughout the country to be
provided for registered beneficiary patients. The procurement of drugs for these health programs
is based on requests from these facilities.

23
The Ministry of Finance provides resources directly to the districts, and these resources are used
to fund all health facilities under the district authorities. There is no connection between the MoH,
district, and other state departments’ budgets. The parallel health services provision (State
Customs Committee, State Railways, Ministry of Defense, Ministry of Internal Affairs, Ministry
of Emergency situations) is outside the influence of the Ministry of Health, as providers are
subordinate to, and financed through, the relevant line ministry.
The line item budgets for health, including budgets of all public health care facilities, are based on
the expense categories, such as salaries, food, and pharmaceuticals. Once the budget is approved,
switching funds across line items is almost impossible, since the approval of the prime minister is
required. This rigidity provides incentives to administrators to overestimate budgetary needs and
to spend the entire budget, since the unspent funds are returned to the Ministry of Finance.
The budgets for health at all levels follow historical trends. The previous year’s budget is the
starting point for the current year’s preparations. Each line item is based on norms linked to bed
numbers, staffing levels, and other factors. Budgets are prepared on the assumption of 100 percent
bed occupancy. Thus, there are no incentives for production or quality improvement at the health
facility level, and although certain pharmaceuticals are provided free of charge, the actual
provision of services beyond the prescription of pharmaceuticals is not assured. Indeed, even
though Azerbaijan has a similar number of physicians per 100,000 as the EU average (although a
smaller number of nurses), and despite large increases in public resources for health, health service
utilization rates have not significantly changed in recent years and, at least with respect to inpatient
care, remain the lowest in Eastern Europe and Central Asia. Outpatient care also remains
comparatively low.16
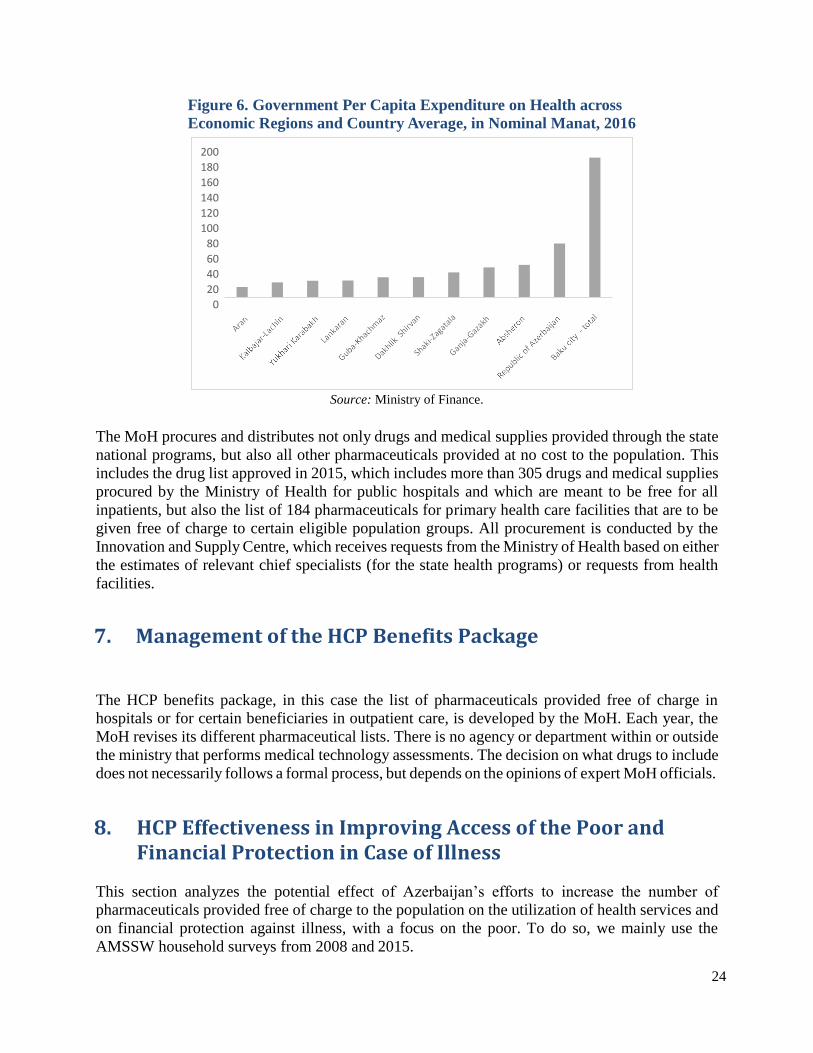
In addition, since the budgets do not reflect the needs of the population, but the existing
infrastructure and historical trends, there are large inequalities in per capita health expenditure
across regions (figure 6). The city of Baku receives the largest per capita expenditure. This might
reflect expenditure from the MoH aimed at the entire country. However, even excluding Baku, the
differences continue to be large. For instance, Absheron per capita expenditure on health is four
times as high as that of Aran. Other policies are also behind these large differences in expenditure
per capita. Until recently, the outpatient care pharmaceuticals provided free of charge to specific
beneficiary groups were only available in health facilities in Baku.
24
Figure 6. Government Per Capita Expenditure on Health across
Economic Regions and Country Average, in Nominal Manat, 2016
Source: Ministry of Finance.
The MoH procures and distributes not only drugs and medical supplies provided through the state
national programs, but also all other pharmaceuticals provided at no cost to the population. This
includes the drug list approved in 2015, which includes more than 305 drugs and medical supplies
procured by the Ministry of Health for public hospitals and which are meant to be free for all
inpatients, but also the list of 184 pharmaceuticals for primary health care facilities that are to be
given free of charge to certain eligible population groups. All procurement is conducted by the
Innovation and Supply Centre, which receives requests from the Ministry of Health based on either
the estimates of relevant chief specialists (for the state health programs) or requests from health
facilities.
7. Management of the HCP Benefits Package
The HCP benefits package, in this case the list of pharmaceuticals provided free of charge in
hospitals or for certain beneficiaries in outpatient care, is developed by the MoH. Each year, the
MoH revises its different pharmaceutical lists. There is no agency or department within or outside
the ministry that performs medical technology assessments. The decision on what drugs to include
does not necessarily follows a formal process, but depends on the opinions of expert MoH officials.
8. HCP Effectiveness in Improving Access of the Poor and Financial Protection in Case of Illness
This section analyzes the potential effect of Azerbaijan’s efforts to increase the number of
pharmaceuticals provided free of charge to the population on the utilization of health services and
on financial protection against illness, with a focus on the poor. To do so, we mainly use the
AMSSW household surveys from 2008 and 2015.
200
180
160
140
120
100
80
60
40
20
0
25
In summary, these efforts have had relatively little impact on access to health services or financial
protection against ill health. Most of the increase occurred in inpatient care and among the highest
income population groups. There was even a slight decrease in utilization of outpatient care among
the poor. Nevertheless, there is evidence of an improvement in coverage of key maternal and child
health services supported by one of the state national programs that is part of the Health Care
Program. Regarding financial protection, there was a sharp increase in the incidence of
catastrophic health expenditure in the population between 2008 and 2015. However, this increase
was concentrated among households in the richest two deciles of the consumption distribution. In
contrast, among the poor, the incidence of catastrophic expenditure actually decreased.
The HCP was focused on providing some pharmaceutical products free of charge. Indeed,
household expenditure in pharmaceuticals decreased significantly between 2008 and 2015.
However, since this list was limited in terms of products and beneficiaries, and there was no major
change in the organization and functioning of health services, the impact of the HCP on
contributing to the achievement of universal health coverage was limited, as will be detailed below.
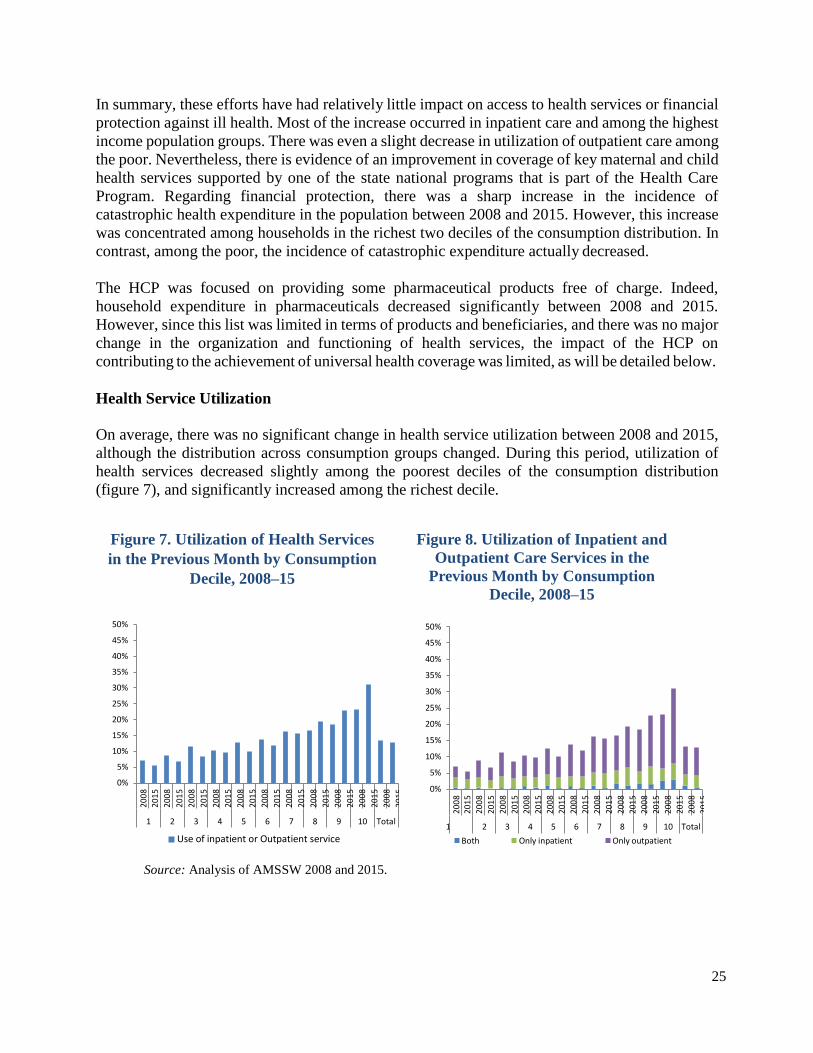
Health Service Utilization
On average, there was no significant change in health service utilization between 2008 and 2015,
although the distribution across consumption groups changed. During this period, utilization of
health services decreased slightly among the poorest deciles of the consumption distribution
(figure 7), and significantly increased among the richest decile.
Figure 7. Utilization of Health Services
in the Previous Month by Consumption
Decile, 2008–15
Figure 8. Utilization of Inpatient and
Outpatient Care Services in the
Previous Month by Consumption
Decile, 2008–15
50%
45%
40%
35%
30%
25%
20%
15%
10%
5%
0%
50%
45%
40%
35%
30%
25%
20%
15%
10%
5%
0%
Use of inpatient or Outpatient service
Source: Analysis of AMSSW 2008 and 2015.
1 2 3 4 5 6 7 8 9 10 Total
Both Only inpatient Only outpatient
1 2 3 4 5 6 7 8 9 10 Total
200
8
201
5
200
8
201
5
200
8
201
5
200
8
201
5
200
8
201
5
200
8
201
5
200
8
201
5
200
8
201
5
200
8
201
5
200
8
201
5
200
8
201
5
200
8
201
5
200
8
201
5
200
8
201
5
200
8
201
5
200
8
201
5
200
8
201
5
200
8
201
5
200
8
201
5
200
8
201
5
200
8
201
5
200
8
201
5

26
Between 2008 and 2015, the only difference captured by the surveys is in types of services. In
2015, the utilization rate of inpatient care was higher than in 2008 (4 percent compared to 3
percent), while that of outpatient care was about the same. The distribution across income deciles
also differs. Inpatient care utilization remained the same among the poorest end of the consumption
distribution, but it slightly increased among the rich, while outpatient care decreased in most of
the income distribution with the exception of the richest deciles, where it increased significantly
(figure 8).
Data from the WHO Health for All Database show a similar overall trend. Outpatient care contacts
per person per year did not change much, although there was a slightly decreasing trend. Inpatient
discharges show a slight increasing trend, particularly after 2010 (figure 9). Although it is not
possible to establish causation, in 2005 the government started providing a few inpatient
pharmaceuticals free of charge, and this list has increased several times since. In contrast,
outpatient care pharmaceuticals were provided free of charge for only particular population groups
in Baku, and for certain health conditions in the entire country, largely limiting the benefits of
these later policies.
Figure 9. Azerbaijan Trends in Health Care Utilization Rates and Per Capita
Expenditure, 1996– 2014
Source: WHO Health for All Database.
Note: PPP = purchasing power parity.
There are large differences in utilization rates across urban and rural areas and across regions
(figures 10 and 11). Between 2008 and 2015, utilization rates changed in rural and urban areas and
in geographic regions, but there is no clear pattern to these changes. For instance, utilization rates
in 2008 were higher in rural than urban areas, but by 2015 this pattern had reversed. Similarly,
except in the Aran and Upper Karabakh regions, the utilization rates within regions changed
between 2008 and 2015, but not always in the same direction, as shown in figures 10 and 11.
250 8
7 200
6
150 5
4
100 3
2 50
1
0 0
Pub exp on health $PPP
Outpatient contacts per person per year
Inpatient care discharges per 100
$P
PP
per
cap
ita
19
96
19
97
19
98
19
99
20
00
20
01
20
02
20
03
20
04
20
05
20
06
20
07
20
08
20
09
20
10
20
11
20
12
20
13
20
14 Inp
atie
nt
dis
char
ges
per
10
0 p
erso
ns
and
o
utp
atie
nt
con
tact
s p
er p
erso
n p
er y
ear

27
Figure 10. Inpatient and Outpatient
Utilization Rates in Rural and Urban
Areas, 2008–15
Figure 11. Health Care Utilization Rates
across Regions, 2008–15
Source: Analysis of AMSSW 2008 and 2015.
The main cause of non-utilization of health services is the lack of resources to pay for them; this
did not change in the two years of the AMSSW. As many as three-fourths of the population listed
the lack of resources to pay as the main cause for non-utilization of services in both years.
However, a larger percentage of the poor reported this in 2008 than in 2015, while among the
higher-income population, a larger percentage reported this in 2015 than in 2008.
The MoH state national programs are often linked to a particular health condition affecting limited
population groups. It is difficult to look at their effects on the poor, with the sole exception of the
Action Plan for Maternal and Child Health. Data from the Demographic and Health Surveys of
2006 and 2011 show an improvement in the coverage of key maternal and child care services in
the country, improvements that have been more marked among the poorest 20 percent of the
population (figures 12 and 13).
Figure 12. Percentage of Pregnant
Women Receiving Prenatal Care from a
Skilled Care Provider
Figure 13. Percentage of Children 18–29
Months that Received all Basic Vaccinations
Source: Azerbaijan Demographic and Health Surveys 2006 and 2011.
12%
10%
8%
6%
4%
2%
0%
Urban 2008 Rural 2008 Urban 2015 Rural 2015
Outpatient Impatient Both
Mountainous Shirvan
Shaki-Zagatala
Absheron
Upper Karabakh
Guba-Khachmaz
Baku
Total
Ganja-Gazakh
Lankaran
Aran
0% Utilization 2008
10% Utilization 2015
20%
100
80
60
40
20
0
Poorest II III IV Richest 2006 2011
100
80
60
40
20
0
Poorest II III IV Richest
2006 2011

28
Financial Protection
The HCP should also have improved the financial protection of the population by decreasing OOP
expenditure on pharmaceutical products. Table 5 shows that expenditure on health increased across
all income levels between 2008 and 2015. In these two years, income per capita significantly
increased but, as shown in table 5, the share of total household expenditure that goes to health also
increased. Most of the increase in the total share that goes to health took place among the richest
end of the consumption distribution. In 2015, the richest two deciles allocated between 20 and 33
percent of their resources to health care; in 2008, they allocated between 14 and 18 percent. In
contrast, among the poorest end of the income distribution, the share of expenditure decreased.
Table 5. Azerbaijan Total Household OOP Expenditure on Health and Share of Health
Expenditure out of Total Expenditure across Consumption Deciles, 2008 and 2015
(manat of 2008)
1 2 3 4 5 6 7 8 9 10 Total
Total household expenditure on health
2015 32.6 50.4 61.2 77.9 85 119 168.7 251.5 389.4 1120.2 234.7
2008 24 37.9 57.9 64.6 82.8 103.5 134.3 165.5 225.5 530.1 142.5
Percent
increase 36% 33% 6% 21% 3% 15% 26% 52% 73% 111% 65%
Share of health expenditure out of total household expenditure
2015 6% 6% 7% 8% 7% 9% 12% 16% 20% 33% 12%
2008 7% 7% 9% 9% 10% 11% 12% 12% 14% 18% 11%
Source: Analysis of AMSSW 2008 and 2015.
Most OOP expenditure was on pharmaceutical products, and mainly those prescribed in outpatient
care settings. However, the share of the total expenditure that went to drugs decreased from 75
percent in 2008 to 56 percent in 2015. This includes all pharmaceutical products, with or without
a prescription. This decrease in the share of expenditure on drugs occurred in all income levels,
but was highest among people from the richest consumption deciles. In contrast, expenditure on
consultations and lab tests increased from 14 to 39 percent, while payments for gifts to health
personnel decreased from 11 to 6 percent between 2008 and 2015.
The pattern observed in the expenditure on pharmaceutical products could be related to the HCP
policies. First, there was an increase in the number of inpatient care drugs provided free of charge.
This policy benefited the entire population, independently on their income level. The data seem to
confirm this, since for some consumption deciles, we can observe a small reduction in the share
of this expenditure—a reduction that is not, however, always significant.

29
Figure 14. Beneficiaries of Free Outpatient Drugs across Consumption Deciles, 2015
Source: Analysis of AMSSW 2015.
The second policy was targeted to vulnerable groups and consisted of providing some medicines
free of charge in outpatient settings. The effect of this policy should be stronger on lower-income
families if vulnerable groups are concentrated among the poor. However, overall, the different
vulnerable categories are not necessarily related to income levels (figure 14). The data suggest that
there was a reduction in the share allocated to this item between 2008 and 2015; this, however,
could also be the result of a decrease in outpatient care utilization among the poor. This effect
though was present at all income levels (figure 15). It is possible that this lack of results is related
to difficulties in the implementation of this policy, particularly difficulties in having the required
pharmaceuticals at the health facilities when eligible patients seek care. Unfortunately, there are
no data that would allow us to evaluate this further.
Figure 15. Shares of Expenditures on Drugs, Consultations, and Laboratory Tests, and
Informal Payments to Health Personnel in Total Health Expenditure by Consumption
Decile in Outpatient and Inpatient Care, Azerbaijan, 2008–15
Panel A 2015 Panel B 2008
100%
90%
80%
70%
60%
50%
40%
30%
20%
10%
Without prescription medicines
Inpatient care financial or non- financial payments or gifts to medical staff Inpatient care drugs and medical supplies
Inpatient care treatment consultations and exams/tests
Outpatient care financial or non- financial payments or gifts to medical staff Outpatient care drugs and medical supplies
Outpatient care consultations and
100%
90%
80%
70%
60%
50%
40%
30%
20%
10%
0% 1 2 3 4 5 6 7 8 9 10
exams/tests 0%
1 2 3 4 5 6 7 8 9 10
Source: Analysis of AMSSW 2015.
Between 2008 and 2015, the two years for which data are available, the incidence of catastrophic
health expenditure significantly increased. In other words, the share of households with health
expenditures higher than 20 or 30 percent of total expenditure increased. However, the incidence
25%
20%
15%
10%
5%
0%
1 2 3 4 5 6 7 8 9 10
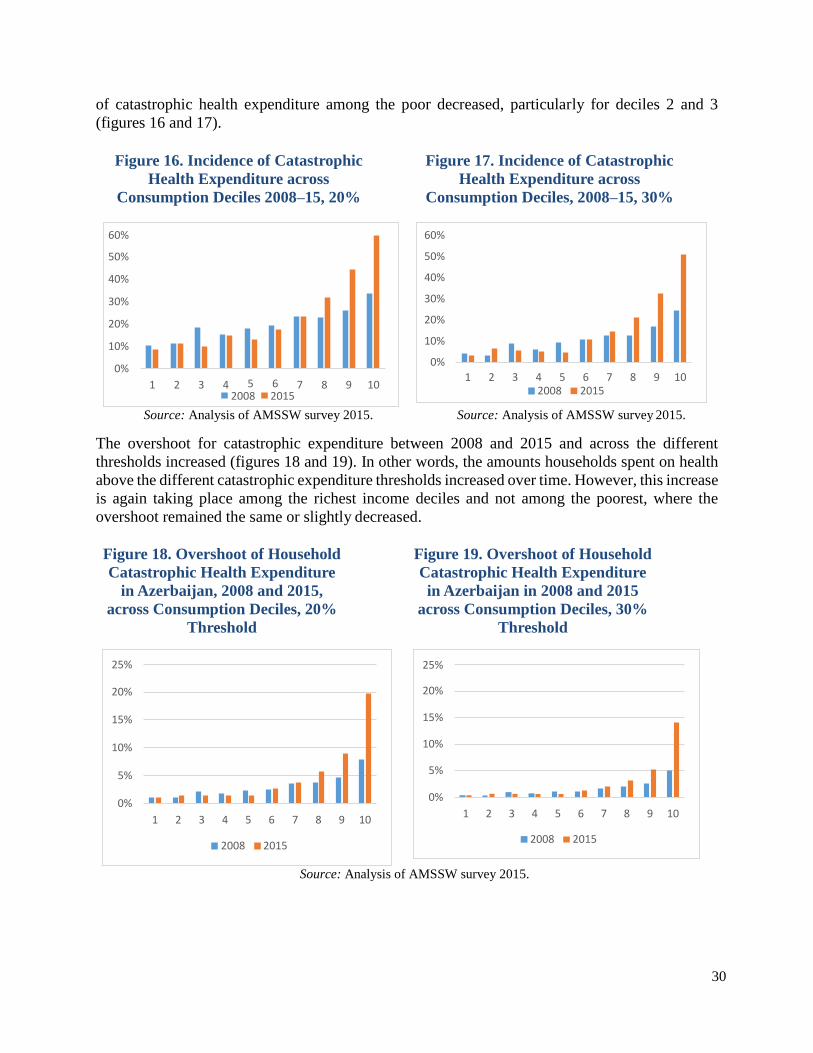
30
of catastrophic health expenditure among the poor decreased, particularly for deciles 2 and 3
(figures 16 and 17).
Figure 16. Incidence of Catastrophic
Health Expenditure across
Consumption Deciles 2008–15, 20%
Threshold
Figure 17. Incidence of Catastrophic
Health Expenditure across
Consumption Deciles, 2008–15, 30%
Threshold
Source: Analysis of AMSSW survey 2015. Source: Analysis of AMSSW survey 2015.
The overshoot for catastrophic expenditure between 2008 and 2015 and across the different
thresholds increased (figures 18 and 19). In other words, the amounts households spent on health
above the different catastrophic expenditure thresholds increased over time. However, this increase
is again taking place among the richest income deciles and not among the poorest, where the
overshoot remained the same or slightly decreased.
Figure 18. Overshoot of Household
Catastrophic Health Expenditure
in Azerbaijan, 2008 and 2015,
across Consumption Deciles, 20%
Threshold
Figure 19. Overshoot of Household
Catastrophic Health Expenditure
in Azerbaijan in 2008 and 2015
across Consumption Deciles, 30%
Threshold
Source: Analysis of AMSSW survey 2015.
25%
20%
15%
10%
5%
0%
1 2 3 4 5 6 7 8 9 10
2008 2015
25%
20%
15%
10%
5%
0%
1 2 3 4 5 6 7 8 9 10
2008 2015
60%
50%
40%
30%
20%
10%
0%
1 2 3 4 5 6 2008 2015
7 8 9 10
60%
50%
40%
30%
20%
10%
0%
1 2 3 4 5 6 7 8 9 10 2008 2015
31
9. Pending Agenda
Thanks to growing oil revenues, Azerbaijan significantly increased public resources for health in
the last decade, resources that were used to renovate the health infrastructure and increase the
number and availability of pharmaceutical products at no cost to the population. These efforts,
however, had a limited impact on decreasing catastrophic health expenditure, and on improving
access to health services. In addition, the country’s macroeconomic and fiscal environment has
changed significantly, and thus any additional progress toward universal health coverage would
require a very different approach. It would require an increase in resources for health and stronger
efforts to pool these resources, a strengthened prioritization in the use of funds, a more efficient
use of existing health resources, a change in provider-payment mechanisms, and a reform in the
organization and functioning of the health sector.
Increasing and Pooling Resources for Health – Plans for a Mandatory Social Health
Insurance
Increasing public resources for health remains an important pending agenda. Despite large
increases in resources, public expenditure on health remains low as a percentage of GDP, as a
percentage of total expenditure, and as a percentage of total government expenditure. As a result,
Azerbaijan remains one of the countries in Eastern Europe and Central Asia with the highest out-
of-pocket expenditures on health.
Mandatory Social Health Insurance: The government plans to introduce a mandatory social health
insurance (MSHI) scheme as a way to mobilize resources for the sector in a more efficient and
equitable manner. The introduction of this scheme was initiated with a pilot project that covers
Mingachevir (a city) and Yevlakh (a district) with a total population of 228,100.
The plans for implementation of the MSHI face many challenges to ensure it can improve financial
protection and access to services, particularly among the poor. One of the main challenges is to
ensure that it significantly increases resources for health. According to data from the State Social
Protection Fund, in 2015, only about 33 percent of the labor workforce, about 1.5 million people,
was employed in the formal sector and thus contributed to this fund.
According to the Framework Document for the Implementation of the Mandatory Health Insurance
in Azerbaijan,17 the country plans to levy a 3 percent payroll tax, 2 percent to be paid by employees
and 1 percent by employers; this, however, refers only to the 1.5 million people in the formal labor
market. This would provide manat 200 million in additional resources per year, or about 26 percent
of the total government budget for health in 2015.
Collecting revenue from the nonpoor informal sector workers is challenging, and few countries
have been able to do it. Nevertheless, the country plans to collect about 4 percent of the annual
living wage of the self-employed informal sector workers, an estimated 3.8 million people. In
addition, it plans to finance, through general taxation, the premiums of the poor and specific
beneficiary groups (including internally displaced people, beneficiaries of the Targeted State
Social Assistance Program, and people with disabilities), an estimated 4.3 million people.

32
Experience in the region can highlight the challenges involved in increasing resources for health
by introducing a mandatory social health insurance scheme. In the other ex-USSR countries where
these schemes were introduced, only in one country, Moldova, did it result in an unambiguous
increase in resources for health, at least during the first years after introduction.18 In some of these
countries, transfers from the local authorities to the MSHI fund were supposed to finance the
premiums of state-subsidized groups, such as children, students, and pensioners, but often these
transfers did not take place, resulting in an overall decrease in resources. Moldova avoided this by
centralizing the resources from the rayon to the national level, and thus the transfers for the
subsidized groups came from the central budget.
Also, in most ex-USSR countries, the payroll tax rate tended to be small, as is the one planned for
Azerbaijan—from 2 to 4 percent (increased to 5 percent in Moldova later on), reducing even more
the potential of the MSHI payroll taxes for increasing revenues. In contrast, in other countries in
the region that also introduced health insurance, such as the ex-Yugoslav republics that introduced
insurance schemes, Latvia, Bulgaria, and Estonia, the taxes were much higher, ranging from 6 to
17 percent.19
The introduction of the scheme will require much preparation to ensure its success. It will be
particularly important to define a package of services for which beneficiaries would be entitled
and ensure that this package can be fully funded by the scheme. For the pilot project, an extensive
list of services was included in the essential package to be financed by the MSHI. However, to
make this package sustainable and fully funded by the scheme, a revision would be advisable.
The government would also need to design a mechanism for identifying and enrolling beneficiaries
and for collecting and pooling resources for them. Currently, the decision is that the Mandatory
Health Insurance Agency will collect revenue during the pilot phase. However, for the MSHI scale-
up, other agencies that routinely collect taxes and premiums from workers could be considered.
For instance, this role could be played by the tax authorities or even by the Ministry of Labor and
Social Assistance, since they collect resources for the pension plans. In addition, to eliminate the
existing inequalities and inefficiencies generated by the fragmentation of resource pools, it would
be important to consider pooling all resources that are now going to the district authorities and to
the different parallel networks (such as the Railways and State Customs Committees), with those
to be collected by the MSHI.
It will also require a change in provider payment mechanisms. Currently, the MSHI, which will
be the single health service purchaser agency, is planning to use per capita payments for primary
health care with additional bonus payments, fee-for-services for specialized outpatient care, and
global budgets for hospitals. However, for these new payment mechanisms to generate incentives
to increase efficiency and/or productivity, a reform to the functioning and organization of the
health delivery network needs to occur. Some of these issues are detailed below, since they would
be needed even without implementation of the MSHI.
Tobacco taxation: There are other sources of funds for health that will be important to consider,
particularly under the current, more restricted, macroeconomic and fiscal environment. Tobacco
taxation is one of them. The country has a high prevalence of tobacco smoking. As many as 36
percent of adult men smoke.20 At the same time, Azerbaijan in 2014 had the lowest taxation on
33
tobacco in all Europe.21 Higher taxes on tobacco can provide more resources for health while
reducing the prevalence of smoking, a major risk factor for health in the country.
Input-cost reduction: Another important source of fiscal space for health could be achieved
through efficiency gains (discussed below) and input cost reductions. Currently, some of the drugs
procured for the state national programs are brand-name pharmaceuticals, not generics. For
instance, data from the MoH show that 95 percent of pharmaceuticals procured under the state
program on diabetes were branded, as were 97 percent of those procured for the state program on
hemophilia and thalassemia hereditary blood diseases, and 100 percent of immune depressants for
chronic kidney failure.
Reducing the fragmentation of resource pools: Finally, the resources that are already allocated for
health are fragmented in different pools. In addition to the MoH and the district health authorities,
there are several agencies and ministries that run their own health delivery network, generating
fragmentation in the risk pooling that results in inequalities and inefficiencies. Eliminating this
fragmentation is also part of the pending agenda.
Improving Allocative Efficiency – Revising the State Guarantee Package of Services
Improving the allocative efficiency of the resources used for health could also generate fiscal space
for the sector. The prioritization of drugs and services provided free of charge to patients could be
strengthened. For instance, no health technology assessment informs the development of the list
of pharmaceuticals that are provided at no cost or to decide which services will be included in the
State Guarantee Package of Services that will be financed by the MSHI. In addition, the criteria
used to include some drugs are unclear. For instance, cardiovascular diseases are the main cause
of death and disability in the country; however, other diseases affecting smaller population groups
have dedicated state programs that procure drugs free of charge, such as hemophilia; chronic
kidney disease, which is largely the consequence of advanced cardiovascular disease and diabetes;
and multiple sclerosis.
The basket of drugs provided free of charge is highly focused on inpatient care and curative care
and not on prevention, with some exceptions such as childhood immunization. While the list of
inpatient care drugs benefits all, only a limited list of pharmaceuticals is provided free of charge
for primary health care (PHC), and often for selected beneficiary groups, even though the main
burden of disease comes from NCDs, which would require early detection and control and which
can be provided more cost-effectively at the PHC level. In addition, as a result of this prioritization
of drugs to be provided at no cost, household OOP expenditure remains very high, and they are
mainly concentrated on pharmaceutical expenditure linked to outpatient care (both PHC and
specialized care) and to nonprescription pharmaceuticals.
Improving the Efficiency in the Use of Health Resources
Azerbaijan has a similar number of physicians per 100,000 as the EU average, and slightly fewer
than the number of nurses. It also has a relatively high number of hospital beds compared to other
ex-USSR countries, despite much effort to consolidate hospital infrastructure (figures 20 and 21).

34
Belarus Ukraine
Lithuania CIS
Kazakhstan
Republic of Moldova Latvia
European Region EU
Estonia
Azerbaijan Tajikistan
Slovenia Kyrgyzstan
Armenia Turkmenistan
Uzbekistan Georgia
0 200 400 600 800 1000 1200
1200
1000
800
600
400
200
0
Figure 20. Hospital Beds per 100,000 in
Selected European and Central Asian
Countries, 2014
Figure 21. Azerbaijan, Trends in
Hospital Beds per 100,000 People
Source: WHO Health for All Database. Source: WHO Health for All Database.
Note: CIS = Commonwealth of Independent States;
EU = European Union.
Despite seemingly adequate numbers of health personnel and infrastructure and large increases in
public resources, health service utilization rates have not significantly changed; they remain among
the lowest in the region. This reflects large inefficiency in the use of these resources. Indeed, bed
occupation rates in Azerbaijan are among the lowest in the region (figure 22). Despite previous
efforts to consolidate the hospital infrastructure, the system still has significant overcapacity.
Previous efforts to optimize the delivery network seem to have stalled and even slightly reversed
when several regional hospitals were constructed. In addition, there is considerable inefficiency in
the use of the beds that are occupied; the country has one of the largest hospital average lengths of
stay in the region (figure 23).
19
90
19
92
19
94
19
96
19
98
20
00
20
02
20
04
20
06
20
08
20
10
20
12
20
14

35
Figure 22. Bed Occupancy Rates, Acute
Care Hospitals only, in Selected
Countries in Eastern Europe and
Central Asia, 2014
Figure 23. Average Hospital Length of
Stay in Selected Countries in Eastern
Europe and Central Asia, 2014
Source: WHO Health for All Database. Source: WHO Health for All Database. Note: CIS = Commonwealth of Independent States; Note: CIS = Commonwealth of Independent
States; EU = European Union. EU = European Union.
Generating Incentives for Performance through Changing Provider-Payment Mechanisms
Provider payment mechanisms based on historical line item budgets and a lack of clear division
between purchaser and provider do not generate performance incentives. Health personnel
receive salaries that do not depend on services provided. These salaries are also very low, which
might explain why the country has not been able to eliminate informal payments to providers.
Similarly, the budgets for hospitals and PHC facilities do not depend on service provision but on
historical trends, which perpetuates geographic inequalities in resource allocation. The
inflexibility in the line item budgets also generates inefficiencies, because providers cannot
decide where is best to use resources, while at the same time having an incentive to spend all
resources within categories to avoid future budget reductions.
In addition, the lack of a clear purchasing/provider split also limits incentive for performance
improvement by precluding strategic purchasing. Currently, services are purchased passively, as
they are financed through historical budgets and salaries in the case of health personnel. This
limits the possibility of the purchasing agency deciding what to buy, when, and from whom.22
Thus, it limits options to improve efficiency and quality of services.
The plans for the new MSHI could reduce some of these challenges, although this is not
necessarily assured. The MSHI would create a single purchaser of services autonomous from the
MoH, and is planning to use different provider-payment mechanisms that are meant to increase
efficiency and in some cases productivity. A major challenge for the implementation of the
Uzbekistan
CIS
Turkmenistan
Kyrgyzstan
European Region
Kazakhstan
EU
Tajikistan
EU members since May…
Turkey
Armenia
Azerbaijan
0 100 200 300 400
CIS Kazakhstan
Belarus Azerbaijan Kyrgyzstan
Tajikistan European Region
EU members before May… EU
Turkmenistan Armenia
EU members since May… Uzbekistan
Georgia Turkey
0 5 10 15

36
MSHI would be the preparedness of health providers, and particularly public ones, to face
completely different payments and incentives, as detailed below.

37
Changing the Organization and Functioning of the Heath System
Another important pending reform is that of the organization and functioning of the health delivery
network. Currently, the system remains heavily biased toward hospital care, leaving PHC
underfunded and underdeveloped. PHC facilities are not the first point of contact with the health
sector; rather, it is often hospital care. Figure 24 shows that more than 50 percent of outpatient
care visits across all consumption deciles occur in hospitals, both public and private. Without a
major reform in the organization of the service delivery network, a reform to create an MSHI and
increase prepayment for health will not be enough to achieve significant progress toward universal
health care coverage.
Figure 24. Type of Health Facility Used for Outpatient Care
Source: Analysis of AMSSW survey 2015.
This is an inefficient use of resources, particularly given the high burden of disease coming from NCDs in the country. Indeed, the utilization of health services to diagnose, detect, and treat these illnesses is limited. For example, only 17 percent of people who suffer from high blood pressure have it under control, and as many as 18 percent of people with diagnosed diabetes were not
registered at the policlinic and thus were not beneficiaries of the state diabetes program.23
While major investments in construction and rehabilitation were made in secondary care, during
2009–15, MoH reconstructed and rehabilitated 86 hospitals, but only 25 primary health care
facilities were rehabilitated. Especially in rural areas, outpatient visits remain low, with 2.5 visits
per person per year in Guba-Khachmaz in 2009 compared to 6 visits in Baku and 7.3 in Absheron.
The state national programs are managed as vertical programs; their financing is managed centrally
by the MoH and does not flow through the district authorities who are in charge of most service
provision in the country. They take up a substantial share of the public budget for health—in 2015,
up to 35 percent. They focus mostly on treatment, while prevention is a crucial part of the
intervention protocol of these conditions, particularly in the case of NCDs, which do not receive
much attention or funding.
0%
20%
40%
60%
80%
100%
1 2 3 4 5 6 7 8 9 10 TotalCentral region hospital Clinic Doctor's Outpatient CenterOther Primary Health Center Private hospitalRepublican hospital Traditional healer Village Hospital
38
Finally, for providers to be able to respond to incentives for production and quality improvement,
they would need a much higher degree of autonomy than they currently have. This includes, among
other things, autonomy in financial management, which they currently lack due to inflexible line
item budgets, and autonomy in personnel management. Otherwise, any attempt to reap benefits
from strategic purchasing is unlikely to succeed.
Improving the Targeting of Vulnerable People
The majority of the beneficiaries of pharmaceutical products free of charge are not poor (see figure
14). Better targeting of beneficiaries could free up resources that could be used to finance other
services for the poor.

39
Annex 1:
Figure A.1: Budgeting Mechanism in Azerbaijan

40
NOTES
1 Kutzin, Cashin, and Jakab 2010. 2 Kutzin, Cashin, and Jakab 2010. 3 World Health Organization Health for All Database 2014.
http://data.euro.who.int/hfadb/. 4 WHO et al. 2015. 5 Azerbaijan 2011 Risk Factor Survey.
https://isim.az/upload/File/docs/NCD_Survey_Report_Nov_2012.pdf.
6 WDI (World Development Indicators) 2016. 7 State Statistical Committee of Azerbaijan.
http://www.stat.gov.az/source/healthcare/indexen.php. 8 World Bank Systematic Country Diagnostic.
http://documents.worldbank.org/curated/en/755761467994680534/pdf/97113-
ADDENDUM- SECM2015-0198-1-IFC-SecM2015-0068-1-MIGA-SecM2015-
0044-1-Box391471B-OUO-9- REPLACE-FILE.pdf. 9 WHO et al. 2015. http://apps.who.int/iris/bitstream/10665/194254/1/9789241565141_eng.pdf 10
http://data.worldbank.org/indicator/SP.DYN.IMRT.IN?end=2015&locations=AZ&start=1993. 11 IHME 2016. 12 These discrepancies are likely due to an underestimation of private expenditure
on health and because the national data show only public expenditure from the
Ministry of Health and District Health Authorities, and not health expenditure from
other sources such as the State Customs Committee, State Railways, Ministry of
Defense, Ministry of Internal Affairs, and Ministry of Emergency Situations. These
agencies are likely to manage as much as 20 percent of all resources allocated to
health, since they manage their own parallel health networks. 13 www.stat.gov.az. 14 A term for the combined specialty of dermatology and sexually transmitted
infections. 15 Ibrahimov et al. 2010. 16 WHO Health for All Database 2014 17 MHI 2017. 18 Kutzin, Cashin, and Jakab 2010. 19 Kutzin, Cashin, and Jakab 2010. 20 World Health Organization Health for All Database 2014.
http://data.euro.who.int/hfadb/. 21 WHO et al. 2015. 22 Busse 2007.
23 Azerbaijan 2011 Risk Factor Survey.
https://isim.az/upload/File/docs/NCD_Survey_Report_Nov_2012.pdf.
41
References
AMSSW (Azerbaijan Monitoring Survey of Social Welfare). 2015.
Average monthly nominal wages and salaries by economic activities.
http://www.stat.gov.az/source/labour/indexen.php. Table 004_2-3.
Azerbaijan Demographic and Health Survey. 2006.
https://dhsprogram.com/pubs/pdf/FR195/FR195.pdf.
Azerbaijan Demographic and Health Survey. 2011.
https://www.isim.az/upload/File/docs/Demographic_and_Health_Survey-
2011._Azerbaijan._Final_Report.pdf.
Azerbaijan 2011 Risk Factor Survey.
https://isim.az/upload/File/docs/NCD_Survey_Report_Nov_2012.pdf.
Busse, R., J. Figueras, R. Robinson, and E. Jakubowski. 2007. “Strategic
Purchasing to Improve Health System Performance: Key Issues and
International Trends.” Healthcare Papers 8 (Sp): 62–76.
“Consumption expenditures of households, manat per capita per month in 2001–
2015” (Private Health expenditures).
http://www.stat.gov.az/source/budget_households/indexen.php.
Demographic and Health Survey, Azerbaijan. 2011. Final Report.
https://www.isim.az/upload/File/docs/Demographic_and_Health_Survey-
2011._Azerbaijan._Final_Report.pdf.
Distribution of employed population by property forms.
http://www.stat.gov.az/source/labour/indexen.php.
Ibrahimov F., A. Ibrahimova, J. Kehler, and E. Richardson. 2010. “Azerbaijan:
Health system review.” Health Systems in Transition 12 (3): 1–117.
IHME 2016. http://www.healthdata.org/azerbaijan.
Kutzin J., C. Cashin, and M. Jakab. 2010. “Implementing Health Financing Reform:
Lessons from countries in transition.” World Health Organization, on behalf
of the European Observatory on Health Systems and Policies. World Health
Organization, Geneva.
MHI (Mandatory Health Insurance). 2017. “Framework Document for the
Implementation of the Mandatory Health Insurance in Azerbaijan.”
Mandatory Health Insurance, Baku.
“Revenues and expenditures of state budget.” (Public Health expenditures).
http://www.stat.gov.az/source/finance/indexen.php.
State Statistical Committee of Azerbaijan. 2015.
State Statistical Committee of Azerbaijan, Baku. Unified Tariff Scale for Public
Sector Employees.
42
http://www.cabmin.gov.az/?/az/pressreliz/view/1104/.
WDI 2016. World Bank, Washington, DC.
http://mydatabank.worldbank.org/reports.aspx?source=wdi-central.
WHO (World Health Organization) Health for All Database. 2014.
http://data.euro.who.int/hfadb/.
WHO et al. (World Health Organization, UNICEF, UNFPA, World Bank Group,
and the United Nations. 2015. Trends in maternal mortality: 1990 to 2015.
Geneva: World Health Organization.
http://apps.who.int/iris/bitstream/10665/194254/1/9789241565141_eng.pdf.
World Bank Systematic Country Diagnostic. http://documents.worldbank.org/curated/en/755761467994680534/pdf/97113-
ADDENDUM-SECM2015-0198-1-IFC-SecM2015-0068-1-MIGA-SecM2015-0044-1-
Box391471B-OUO-9-REPLACE-FILE.pdf.

43