Public Disclosure Authorized - All...
16
SEAR ENERGY ACCESS AND ELECTRICITY PLANNING SPECIAL FEATURE Mark Howells, Royal Institute of Technology; Hans Holger Rogner, International Institute for Applied Systems Analysis; Dimitris Mentis, Royal Institute of Technology; and Oliver Broad, University College London Public Disclosure Authorized Public Disclosure Authorized Public Disclosure Authorized Public Disclosure Authorized
Transcript of Public Disclosure Authorized - All...

SEAR ENERGY ACCESS AND
ELECTRICITY PLANNING
SPECIAL FEATURE
Mark Howells, Royal Institute of Technology; Hans Holger Rogner, International Institute for Applied
Systems Analysis; Dimitris Mentis, Royal Institute of Technology; and Oliver Broad, University College London
Pub
lic D
iscl
osur
e A
utho
rized
Pub
lic D
iscl
osur
e A
utho
rized
Pub
lic D
iscl
osur
e A
utho
rized
Pub
lic D
iscl
osur
e A
utho
rized

b STATE OF ENERGY ACCESS REPORT | 2017
Copyright © 2017 International Bank for Reconstruction and Development / THE WORLD BANK Washington DC 20433 Telephone: +1-202-473-1000 Internet: www.worldbank.org
This work is a product of the staff of the World Bank with external contributions. The findings, interpretations, and conclusions expressed in this work do not necessarily reflect the views of The World Bank, its Board of Executive Directors, or the governments they represent.
The World Bank does not guarantee the accuracy of the data included in this work and accept no responsibility for any consequence of their use. The boundaries, colors, denominations, and other information shown on any map in this work do not imply any judgment on the part of The World Bank concerning the legal status of any territory or the endorsement or acceptance of such boundaries.
The material in this work is subject to copyright. Because The World Bank encourages dissemination of its knowledge, this work may be reproduced, in whole or in part, for non- commercial purposes as long as full attribution to this work is given. Any queries on rights and licenses, including subsidiary rights, should be addressed to World Bank Publications, The World Bank Group, 1818 H Street NW, Washington, DC 20433, USA; fax: +1-202-522-2625; e-mail: [email protected]. Furthermore, the ESMAP Program Manager would appreciate receiving a copy of the publication that uses this publication for its source sent in care of the address above, or to [email protected]
Cover photo: © Malcolm Cosgrove-Davies | World Bank

ENERGY ACCESS AND ELECTRICITY PLANNINGMark Howells , Royal Institute of Technology; Hans Holger Rogner, International Institute for Applied Systems Analysis; Dimitris Mentis, Royal Institute of Technology; and Oliver Broad, University College London
INTRODUCTION
As developing countries look for ways to achieve sustainable energy services, which is essential to lift people out of poverty, the big challenge cen-
ters around providing access for all while avoiding past pitfalls without creating new ones. The reality is that this can only occur if there is a fundamental transformation of energy systems along the entire set of resource to energy service chains—and that will necessitate greater energy efficiency and a bigger role for renewables in the global energy mix energy. Moreover it must occur at a time when projected global electricity demand calls for installing some 6.7 Terawatt (TW) of new electricity generating capacity worth an aggregate investment of $20 trillion from 2015 to 2040 (IEA, 2015).
Clearly, this is a tall order, especially given that modern energy systems are highly complex and capital intensive, constantly interacting with many other sectors like the environment, natural resource systems, and infrastructure. This means that countries will have to undertake compre-hensive and systematic analyses and planning to identify and avoid (or at least minimize) expensive stop-gap mea-sures and long-term “lock-in” into inadequate and unsus-tainable infrastructures. In many instances, short-term pressure for immediate action will take precedence over long-term consideration for sustainability.
In practice, comprehensive energy planning at the national, regional, or local levels is further complicated because there is no one size fits all energy system and priorities vary sharply. In developing countries, access to affordable energy services is primarily a priority for rural areas to combat energy poverty, but increasingly also in the large metropolitan areas as urbanization accelerates. These countries have 2 billion people without electricity and nearly 3 billion people relying on dirty fuels (such as firewood and animal dung) for cooking and heating. At the regional level, nearly 90 percent of people suffering from energy poverty reside in South Asia and Sub-Saharan Africa (Bazilian, 2015). And recent projections for Sub-Sa-haran Africa indicate an increase in energy demand of 80 percent and a fourfold expansion of electricity generating capacity by 2040 to improve the socio-economic welfare of a population twice as large as today’s (IEA, 2014).
In contrast, the developed countries of Europe, North America, and Asia struggle with the replacement of aging plant and equipment—for electricity, some 40 percent of
the existing capacity stock is scheduled for retirement by 2040 (IEA, 2015)—and the timely integration of new and renewable energy sources into existing infrastructures. But investment decisions are clouded by demand uncertainty due to ongoing efficiency improvements in end-use sec-tors, the emergence of smart grids, and potential develop-ments of new electricity markets (such as electric vehicles). Competitive and private sector dominated energy markets rely on clear and consistent government energy-environ-ment policies to align their investment decisions with sus-tainable development objectives. After all, energy system transformation is largely a capital-intensive affair that can conflict with short-term profit maximization.
The beneficial role of access to energy for socio-eco-nomic development has been acknowledged since the onset of industrialization more than two centuries ago. But there are no roses without thorns—the thorns of energy access are numerous: (i) scarred landscapes caused by mining activities; (ii) land-use change from fuel wood pro-duction; (iii) pollution emissions from fossil fuel combus-tion that are chiefly responsible for adverse impacts on human health, environmental degradation, and climate instability; and (iv) energy security concerns and interna-tional conflicts about the very issue of access to energy. In essence, sustainable energy avoids or minimizes these adverse side effects of energy access. Past energy transi-tions from wood to coal to oil were often meant to miti-gate some of these consequences, only to cause new and potentially worse impacts aggravated by a seemingly ever-increasing demand for energy fueling economic growth—the blue print for unsustainability.
This paper tries to shed light on how developing coun-tries can carry out energy planning by reviewing the avail-able methodologies and tools, including their potential to integrate rural energy access and encourage the uptake of renewable energy technologies. It also probes how invest-ment needs and cost-effectiveness are reflected in differ-ent analytic and planning tools—with a case study on Ethiopia. And it examines the interaction of energy plan-ning and scenario development and how these are applied to informed policy making. The findings suggest that energy planning is essential and feasible. However, support is required to improve data collection and access, develop open accessible modelling tools, and build sus-tainable national capacity to undertake planning.
1

2 STATE OF ELECTRICITY ACCESS REPORT | 2017
PLANNING FOR ELECTRICITY ACCESS What exactly do we mean by electricity planning? It is the act of assessing the ability of a regional system to provide dependable energy services under constantly changing conditions—which involves variables such as the cost of materials and fuels, investment costs in technologies, demand levels, and distribution. Drawing on the field of operations research, planning applies advanced analytical methods and tools to make better decisions when faced with complex decisions. This activity is inherently iterative due to the fast, and potentially drastic, transformations that can take place over very limited periods of time (IAEA 1984). Developed as a way of mitigating the impacts of external events on the ability of a system to provide its specific service, this process typically identifies the most cost effective way of delivering energy to the final con-sumer over time (Wilson, R. & Biewald, B., 2013).
Of course, this process takes on different meanings in different parts of the world—especially in developing countries’ poor rural areas and burgeoning megacities, where electricity access is a challenge in itself. Fortunately, quantitative energy modeling (using mathematically coded images of current and future energy needs), which is increasingly being used by industrial countries offers a promising tool (see box). The main barriers for developing countries are the lack of adequate data and a shortage of skilled human resources to perform the analysis. Thus, investment decisions are often based on ill-informed pol-icy targets and the need for ad-hoc stop-gap measures. This means that targets or measures tend to focus on cheap and quick to build (often popular) technologies or emergency fuel purchases, resulting in high operating and environmental costs and expensive end-use services. Given that such actions serve the supply shortfalls of already connected consumers, increasing access is rarely part of the strategy.
Moreover, energy planning is not an end in itself and involves more than mastering energy modeling tools. Planning without subsequent implementation is an inef-fective use of resources. Plus, implementation needs a
functional institutional framework to ensure the availability of funding, the timely readiness of the many pieces needed for energy infrastructure investments, and a mechanism to oversee progress and control quality. In this context one should note that:
Sound project economics mobilizes the necessary finance. This is particularly the case for large infrastructure investments (Goodman and Hastak, 2006). Costs and cash-flow streams must be established and mapped to national budgetary, extra-budgetary, and external funding. The matching provides insights for estimates of investment requirements and operating and maintenance costs over the project’s life-cycle. It specifies projected costs to con-sumers, expected revenues, and subsidies. It quantifies potential implementation barriers resulting from budget-ary or financial constraints. And, depending on condition-alities, it can help leverage funding from foreign and international sources (Onyeji et al., 2012). Examples of such funding include foreign direct investment (FDI), the Clean Development Mechanism (CDM), and financing from international development banks.
Physical deployment of infrastructure needs to match schedule logistics. The introduction of a large hydro-power plant serving initially a small market may exceed current electricity demand. Thus it would have to gener-ate the needed stream of revenue to cover generating costs for many years, making it difficult to pay dividends and service debt. Then, again, shortages result when electricity demand grows faster than supply, prompting stop-gap measures and delaying economic develop-ment. Moreover, connecting millions of new customers presents a formidable logistic challenge that requires coordinating the timely and consistently staged deploy-ment of generation, transmission, and distribution, along with developing complementary chains for system main-tenance and consumer services. Failing to map these dynamically evolving factors may lead to severe demand and supply mismatches, thereby impeding the energy system’s effective expansion.
BOX 1
Challenges for Energy Access in a Warmer World
Quantified models of complex systems help decision makers in numerous ways. From a technical perspec-tive, they enable analysts to compare different sys-tem configurations without incurring the upfront cost of actually building them, which helps to mitigate uncertainty. From a practical perspective, they facili-tate the design of systems in a way that accounts for local resources, demands, and constraints that are placed upon real life electricity systems. This ensures that generation meets demand in the most cost effective way and that public utilities and governmen-
tal institutions can structure tariffs to minimize con-sumer electricity bills. It also ensures that scenarios of future energy system developments are internally consistent. Such scenarios can serve as effective com-munication tools for non-partisan political commit-ment—which will help both to garner and mobilize private sector support and to solicit agreement and feedback from society at large. And for developing countries, even minor system improvements often have disproportionally high positive economic and environmental returns.

ENERGY ACCESS AND ELECTRICITY PLANNING 3
Functional institutions are required to support the implementation and operation of an expanding energy system. These include market regulators, system opera-tors, vendors, environmental protection agencies, line min-istries, educational institutions, and public-private sector partnerships (Bazilian et al., 2011). Jointly these institutions are tasked with developing milestones for implementation (IAEA, 2009) and inter-ministerial coordination
TOOLS AND METHODOLOGIES
The key to such an enormous undertaking as energy plan-ning is the availability of energy planning toolkits, which, at least in their contemporary form, date back to the oil crises of the 1970s, when governments and industries were caught by surprise by an unforeseen and unprecedented curtailment of global oil supplies. Initially these models focused on sector specific issues such as ensuring a suffi-cient supply of oil or expanding electricity generating capacity. But they were later expanded to also account for energy-economy-environment interlinkages or externali-ties (see figure 1)—leading to a vastly improved and increasingly inclusive energy systems planning process (Bhattacharyya, C., and Timilsina, G.R., 2010).
Models and toolkits were primarily developed by, and for use in, the industrialized countries of the OECD and the former CMEA (or Comecon), which had relatively
good energy statistics and well educated energy analysts. As a result, these tools are, for the most part, ill adapted to applications in developing countries. Adapting models to the data situation in developing countries is not only aggravated by the tools’ data intensities but also by a lack of options for simplified yet meaningful reduced-form model setups. Proprietary codes, “closed-source” fea-tures, and often poor documentation make their simplifi-cation difficult (Howells et al., 2011). Recent simplified open source models—such as OSeMOSYS (Howells et al, 2011), Temoa (Hunter et al, 2013), and SWITCH (i4e, n.d.) have a stripped down code base allowing analysts to add analytical features. This reduces barriers to entry for new analysts and developing country practitioners (DeCarolis et al., 2012 and Howells et al., 2011), although it limits their off-the-shelf analytical functionality.
Given the evolving nature of energy systems, a contin-uous advancement of the modeling tools is inevitable. Delineating energy access or poverty in mathematical terms (Nussbaumer et al., 2013), costing energy access (Fuso Nerini et al., 2014), and developing open access energy planning tools (Bazilian et al., 2012) are new and expanding fields. The challenge is to align new model fea-tures such as energy access with the moving “goal posts” of energy systems that become more dynamic (Bazilian et al., 2013) and integrated well beyond the traditional energy system boundaries (Howells, M., and Rogner, H.-H., 2014).
FIGURE 1 A framework for comprehensive energy planning
Source: Rogner, 2011
Social and Economic Perspective
Identification oftechnology choices
Regional trade of electricity and fuels
Assessment ofnatural resources
Sustainablesupply strategy
Exogenous assumptions
Assessment ofenergy needs
Analysis ofenergy supply
options
Environmentalburdens andmitigation
Financial andother resourcerequirements

4 STATE OF ELECTRICITY ACCESS REPORT | 2017
Energy systems modelsElectricity systems models are tools used by electricity ana-lysts (such as engineers, economists, and planners) to man-age and plan the electricity system, trade electricity, and expand generation capacity (Foley et al. 2010). Here, we focus on three types.
• Macroeconomic or “top-down” models. These include econometric, input-output, and computable general equilibrium approaches (Welsch 2013). They are driven by projected developments of major economic indica-tors, using prices to balance demand and supply within the energy sector as well as the rest of the economy. They provide insights on broad relationships between economic development and the associated energy de-mand and supply. And they may or may not (but usually do not) include details on technology.
• “Bottom-up models. These are largely technology driven—accounting for the physical configuration of the energy system’s technologies and infrastructures, their vintage situation, energy efficiency, and econom-ic and environmental performance. They are driven by the usually hard-wired requirement that supply has to meet demand, which is externally determined (possi-bly by a macroeconomic model). The most popular ones are optimization models, which identify optimal pathways for meeting demand; optimal can be least cost, highest level of energy security, or fastest access to energy services.
• Hybrid models. These incorporate aspects of both bot-tom-up and top-down models, and are either integrat-ed or “soft-linked” (data is explicitly transferred be-tween two stand-alone tools in an iterative manner). Linking and integrating models from different scientific disciplines has become a necessity for understanding
energy-related greenhouse gas (GHG) emissions and land-use changes, along with their impacts on climate change (and vice versa). Integrated Assessment Models (IAMs)1 account for elements that cross boundaries of different domains (especially between energy, atmo-sphere, oceans, and land-use).
Focusing on bottom-up models, which are most relevant for identifying investment requirements in developing countries, they are chiefly characterized by their temporal scope (figure 2)—which can range from maintaining volt-ages (stability analysis) to the operation and dispatch of electricity (load flow and market power analyses) to invest-ment requirements (long-term energy system analysis). Models focusing on AC or DC load flow analysis may serve to investigate various grid configurations. Such models may cover timeframes of hours or years. Based on the derived transmission capacities, steady-state, transient, or dynamic stability analyses may serve to assess distur-bances in power systems. Stability analyses usually cover timeframes of up to several minutes. They may provide important insights on the design of the components of the transmission and distribution system.
Geographic information system modelsCost-effective electricity supply systems serving rural households and businesses are diverse and site specific, meaning that the cost-optimal technology choice depends on several parameters. These can be geophysi-cal, technical, economic, or social—such as local popula-tion density, distance to the grid, fuel costs, and electricity usage, respectively—and many are strongly spatial in nature (like wind regimes, potential micro-hydropower sites, settlement positions, and grid expansion). Develop-ing a clear transparent approach to capturing these parameters and translating them into potential technol-
FIGURE 2 The temporal scope of power sector models
Source: Welsch, 2013
Tim
e fr
ame
cove
red
with
in m
odel
Assessed year(s)
Information flow
Stability analysise.g. for various faults
Load flow analysisfor various iterations of grid configuration
Power market analysisconsidering bidding areas and
interconnectors
Long-term energy system analysisfor multiple connected aggregated systems
Now 2020 2030 2050 2100
Long
-term
(dec
ades
)M
id-te
rm(d
ays–
year
s)Sh
ort-t
erm
(sec
s–da
ys)
Srta
tegy
Des
ign
ENERGY ACCESS AND ELECTRICITY PLANNING 5
ogy suites to meet energy access goals, is crucial to informing effective policy.
Geographical Information System (GIS) models respond to this need by enabling the analyst to assess the cost of electricity provision at each specific location in a given area. By combining detailed geo-referenced layers of data for each relevant parameter, site specific investment needs and energy cost implications of competing technological systems can be compared in space and time.
The use of GIS-based analyses has increased since the mid-1990s with a clear focus on using levelized energy cost2 (that is, the breakeven cost) for choosing the appro-priate technology. The value of the geo-referenced ap- proach in these situations lies in its ability to combine com-prehensive information relating to site specific technologi-cal information to in depth regional resource availability data thus assessing an “integration of all the possibilities” for electrification (Amador and Domínguez, 2005).
Further, the application of such tools to remote areas, where information is scarce, enables and supports analy-ses that could otherwise not take place. The use of remote sensing data and technologies, combined with the inter-polation capabilities of GIS models can, when applied to macro-economic and statistical data for a given area, “answer some of the key questions” relating to energy planning and rural electrification (Szabó et al., 2011). Take the following examples:
In some Sub-Saharan African countries, the Network Planner model is used to compare the implications of either extending the national grid, rolling out solar PV household systems supplemented by diesel generators for productive uses, or opting for low voltage diesel-based mini-grid systems (Kemausuor et al., 2014). In the case where grid extension is the cost optimal solution for a given location, the tool assigns each settlement an eco-nomic radius that the grid would reach from such a start-ing point. Using a modified version of Kruskal’s minimum spanning tree algorithm, it then connects the locations using the least additional kilometers of additional grid (Parshall et al., 2009).
In Nigeria and Ethiopia, the ONSSET electrification tool is used to develop a cost model for comparing the levelized cost of electricity generation of grid extension with mini-grid and off-grid diesel-based and renewable options (Fuso Nerini et al., 2015). It generates a set of boundary conditions that inform a GIS related algorithm assessing grid compatibility of all non-connected settle-ments and, in case of negative outcomes, selecting the most cost effective mini-grid or household level solution (Mentis et al., 2015)
In northern Brazil, GIS analysis is used to answer ques-tions of renewable energy management in semi-arid rural areas (Tiba et al., 2010). By crossing a variety of data banks relating to (i) raw data for infrastructure, resource, and socio-economic parameters and (ii) technological data for solar power, water pumping requirements and other renewable energy systems, the study generates a repre-sentation of “the best localities for inclusion of a deter-mined renewable energy technology.”
DEMAND FORECASTING FOR POOR COUNTRIESOf course, a critical element in these models is how much energy will be demanded. Typically, electrification efforts that focus on connecting new households are driven by policy, while for commercial users, the driver is economics (Gaunt, 2003).
Starting at the household level, where there are rela-tively high connection and distribution costs, demand pro-jections for electrification efforts are typically engineered as a function of a limited number of key parameters (such as population density, location, and governmental targets for energy access). For example, the Network Planner Tool uses parameters like energy intensity per rural and urban household, projected population growth, and economic demand elasticity to derive geo-spatial demands. Similar end use accounting (Bhattacharyya and Timilsina, 2009) techniques to derive rural and urban household demand are employed by the popular LEAP (Heaps, 2014) and MAED (IAEA, 2006) models (which do not provide any geo-spatial information).
At the country level, a variety of methods are used to project demand for total electricity sales (which often include little or no explicit geo-spatial consideration). (Bhat-tacharyya and Timilsina, 2009) group these approaches into end use accounting and econometric. An end use account-ing approach may begin with exogenous and detailed economic projections that are delineated by economic subsector, with energy use split between thermal and other requirement, and assumptions made about how that energy intensity will change over time. These are then combined with potential fuel substitution for thermal requirements to make projections by sector and fuel. Sim-ilar, but more flexible approaches are available in LEAP. Less complex approaches include simple econometric regressions with population and economic growth. Other approaches account for feedback between the cost and configuration of the energy sector with the demand for its fuels. For example, fuel price elasticities by sector may be accounted for directly (Loulou and Lavigne, 1996) or via broader macroeconomic feedback (Howells et al., 2010; Winkler et al., 2007).
In addition, metrics have been developed to support governmental goals for energy access and inform demand projections. The World Bank’s Multi-Tier approach (World Bank, 2015) determines tiers of energy intensity per house-hold, with each tier associated with different levels of elec-tricity use—ranging from (at the lowest level) lighting and cooking to (at the highest level) services that provide com-fort (such as air-conditioning). Other metrics account for a broader range of parameters involving other aspects of energy poverty and development, such as the Multi-dimen-sional Energy Poverty Index (MEPI) (Nussbaumer et al., 2013) and IEA Energy Development Index EDI (IEA, n.d.).
CASE STUDY: ETHIOPIATo better understand how these tools work in practice, we explore what would need to happen in Ethiopia to provide

6 STATE OF ELECTRICITY ACCESS REPORT | 2017
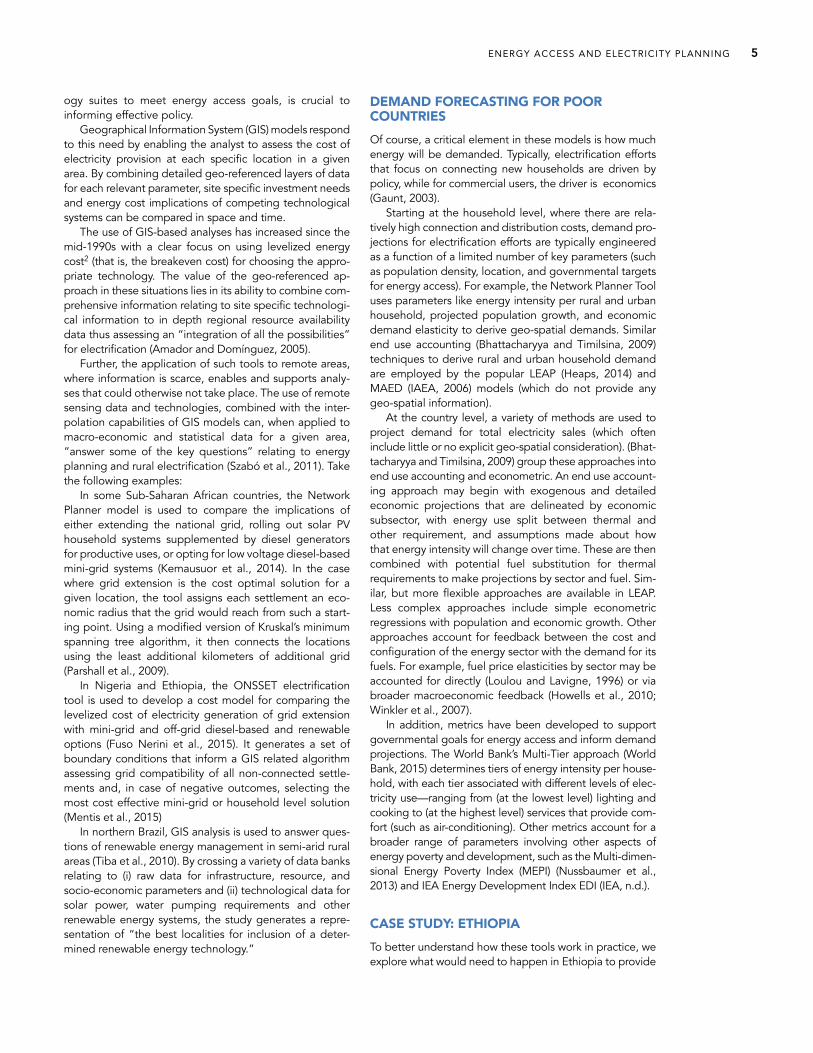
Source: Author’s calculation based on Mentis et al 2016 b.
FIGURE 3 Optimal electrification mix in Ethiopia
B. Lower targetA. Higher target
TABLE 1 Optimal split for new connections(Population-based for different rural electrification targets)
SPLIT POPULATION (150/300) POPULATION (50/300) CHANGE
Grid 65,431,650 62,270,395 ↘–4.8%
Mini Grid 3,958,695 245,825 ↘–93.8%
Stand Alone 656,767 7,530,892 ↗1046.7%
Source: Authors’ calculations
better electricity access and services in a cost-effective manner. We use two tools: (i) the ONSSET –GIS-based tool for rural electrification to determine the cost optimal way of providing high levels of electricity access; and (ii) the OSeMOSYS tool to determine the cost optimal way of expanding grid-based bulk generation. The combination of these two tools forms a consistent approach to minimiz-ing the cost of electrification (Bekker et al., 2008) while concurrently meeting the economics of supplying bulk quantities of low cost, reliable electricity. Current per cap-ita electricity consumption in Ethiopia is as low as about 50kWh—compared to 13,200kWh in the United States and 1,750kWh in neighboring Egypt (World Bank, 2014).
Providing high levels of electricity accessWe begin by considering the least cost configuration of grid, micro-grid, and stand-alone technologies to meet two rural (50 and 150 kWh/capita/year) and one urban electrification target (300 kWh/capita/year). As figure 3 shows, a higher target results in the deployment of grid and mini-grid systems, with remote and low density pop-ulations relying on stand-alone electrification. The change in technology from high to low is indicated in table 1, with a noticeably large shift to stand alone systems.
Underlying the shift in technology is how the cost of electricity. Figure 4 indicates how the levelized cost of supply on a geo-spatial basis changes in response to the higher and lower supply targets. With higher levels of pro-vision, the cost per unit is reduced in rural areas. With
lower targets, unit costs are higher. Note that costs near the grid in urban areas remain unchanged, following their constant electrification target.
What would happen if electricity costs increase where there is no systematic deployment of solar and mini-grids? As figure 5 (panel A) shows, if the grid is not extended and users only have access to diesel generators, electricity costs are high. But if the PV market becomes more fluid, or the government helps facilitate investment, the cost of rural electrification drops significantly (Figure 5, panel B). This occurs because the deployment of PV stand-alone solu-tions decreases the levelized cost of electricity in some set-tlements as compared to just diesel stand-alone options. PV stand-alone technology would be more viable than die-sel stand alone for 22,624,921 people (or 32 percent of the population that needs to be electrified). If grid extension and mini-grid technologies were to contribute to the elec-trification mix of the country, only 656,767 people would be electrified by stand-alone systems (diesel, PV).)
Thus, an optimal deployment strategy would include extra grid extension and the deployment of micro-grids—information that could be used to support better poli-cy-making. And knowing the cost optimal deployment characteristics could be used to develop specific poli-cies—ranging from state-led deployment to facilitation of market development. At this point, Ethiopia is undergoing rapid expansion in its generation capacity. Consistent with the most recent eastern African power pool development plan (EAPP/EAC, 2011), the power system grew by 20 per-
ENERGY ACCESS AND ELECTRICITY PLANNING 7
Source: Author’s calculation based on Mentis et al 2016 b.
FIGURE 4 Higher levels of provision mean lower per unit rural area costs Spatial levelized cost of electricity
B. Lower levels of provision A. Higher levels of provision
Source: Author’s calculation based on Mentis et al 2016 b.
Note: Left panel: Population already connected to the grid is grid connected and the rest are electrified by stand-alone diesel. Right panel: Population already connected to the grid is grid connected and the rest are electrified by stand-alone diesel and PV solar.
FIGURE 5 A case for more grids and PV solar(Spatial levelized cost of electricity for the electricity access targets 150–300 kWh/capita/year
B. Grid, stand alone diesel and solar PVA. Grid and stand alone diesel
cent between 2013 and 2016, increasing by over 4.7GW. One baseline projection (WB) of electricity growth is around 5 percent per year.
Pinpointing the lowest cost route for grid expansionTo determine the lowest cost expansion of the grid-based electricity system, we use the Open Source energy Model-ing System (OSeMOSYS)—which is driven by demand for “grid” electricity resulting from the ONSSET analysis, as well as a national projection of other (bulk) demand growth (based on GDP projections). It captures potential candidate power plants, fuel costs, and resource availability (fossil and renewable) to calibrate the model cost and performance data relating to existing power plants and their retirement schedule. A cost optimal system is then calculated (Howells et al 2011). On the resource front, hydropower is expected
to form the foundation for Ethiopia’s electricity system (Taliotis et al 2016), although recent analysis (IRENA, 2014) also indicates relatively high potentials of non- hydropower renewables available. Plus there are limited reserves of crude oil and larger quantities of natural gas. The model assumes that newly electrified households meet their demand target of 150kWh per capita in rural areas and 300kWh per capita in urban areas.
Our results show that generation investment is dom-inated by hydropower (Figure 6 panel A), with large quantities used for export—although there are signifi-cant new investments in capacity required for electrifica-tion (indicated hashed lines in figure 6 panel B). But if trade in Africa is to reach its cost optimal potential, Ethi-opia will need to join a number of countries that gener-ate significant quantities of electricity for export by 2030 (figure 6 panel C) (Taliotis et al., 2016).

8 STATE OF ELECTRICITY ACCESS REPORT | 2017
INVESTMENT NEEDS AND SOURCES OF FUNDINGBetween 2010 and 2030, an investment of $12 billion to 279 billion per year will be needed to provide energy access for all (Bazilian et. al. 2014). These values vary sig-nificantly as a function of electricity demand per capita. Locally, the scale of investment depends on a variety of parameters, such as geography, resource endowment, and investment risk. Recent studies estimate that the cost of electrification can range from less than $100 per house-hold for basic access solutions, to about $7,000 per house-hold for high targets of access (Fuso Nerini et al., 2014) .
Once investment needs are clearly delineated, a variety of options are available to raise and channel funds—at the international, bilateral, and national levels, involving the public and private sectors and nongovernmental organiza-tions (NGOs).
National and local governments play a key role in cre-ating an enabling environment for private energy invest-ments based on clear legislation, plans, policy, and effective institutions. The extent to which these will be called into play can be derived from planning, indicating the market size, scale of investment, and operation. More direct intervention is, in no small part, dependent on the type of technology and investment that needs to be made.
FIGURE 6 Hydropower will dominate in Ethiopia
Source: Taliotis et al., 2016 and author’s calculation based on Mentis et al 2016 b.
100
80
60
40
20
0
–20
–40
–60
–80
Coal
Generation mix per country, 2030 (%)
Generation mix Total capacity
Diesel
HFO
Gas
Wind
Solar
Hydro
Geothermal
Nuclear
Biomass
Dist. diesel
Dist. solar
Net imports
Electrification
Alg
eria
Ang
ola
Bot
swan
a
Cen
tral
Afr
ican
Rep
.
Côt
e d’
Ivoi
re Djib
outi
Ben
in
Cam
eroo
n
Bur
kina
Fas
o
Bur
undi
Cha
d
Con
go
Egyp
t
Equa
toria
l Gui
nea Eritr
ea
Gam
bia
Gab
on
Gha
na
Gui
nea-
Bis
sau
Liby
a
Mal
awi
Mal
i
Mau
ritan
ia
Nig
eria
Nig
er
Nam
ibia
Moz
ambi
que
Gui
nea
Ethi
opia
Ken
ya
Leso
tho
Libe
ria
Mor
occo
Rwan
da
Sene
gal
Sier
ra L
eone
Tanz
ania
, Uni
ted
Rep.
of
Tuni
sia Uga
nda
Som
alia
Sout
h A
fric
a
Suda
n
Swaz
iland
Togo
Zim
babw
e
Zam
bia
Con
go, t
he D
em. R
ep. o
f the
80
60
40
20
0
–20
–40
16
14
12
10
8
6
4
2
0
2010
2011
2012
2013
2014
2015
2016
2017
2018
2019
2020
2021
2022
2023
2024
2025
2026
2027
Cap
acity
(GW
)
2028
2029
2030
2010
2011
2012
2013
2014
2015
2016
2017
2018
2019
2020
2021
2022
2023
2024
2025
2026
2027
2028
2029
2030
Gen
erat
ion
(Tw
h)
ENERGY ACCESS AND ELECTRICITY PLANNING 9
For example, if solar panels are to play a key role, they might be sourced from a producer country—which might supply soft loans or other subsidies to secure the sale and promote development.
At the international level, financing might be forthcom-ing if expanding the system results in better environmental performance compared to “business as usual.” Perhaps the expanded system reduces carbon dioxide, by replacing fossil fuels. If so, it may be eligible for financing support through global facilities such as the Global Environmental Forum (GEF) or the Nationally Appropriate Mitigation Action (NAMA) facility. Or perhaps it will reduce household woodfuel consumption in homes and thus demonstrably reduce deforestation. If so, REDD (Reducing Emissions from Deforestation and forest Degradation) funding might be available. Should transparent development progress be demonstrated (which the planning will help establish), a variety of tied or untied aid and trade potential might be unlocked through bilateral, regional, or global agreements.
The public sector can directly support electrification and power system expansion via several routes. Common ones include: (i) fund raising through increased tariffs, cross subsidies, or taxes; (ii) providing tax credits; (iii) providing secure power or fuel purchase agreements; (iv) providing grants or direct payments; (v) disseminating information and building capacity; and (vi) supporting the develop-ment of supply chains. Again the type of measure will be a function of the technology choice. For example, a hydro-power plant may be supported by a power purchase agreement. But a coal fired power plant may need facilita-tion with respect to granting mining rights, a fuel supply agreement, and a power purchase agreement. The power purchase agreements may also vary. If climate change is expected to affect water flows, hydropower sales may need to tailor the agreements to mitigate associated risks (which can be uncovered in extended energy modeling exercises) (WB, 2015).
The right enabling environment can be used to secure funding through local NGOs, with less “hands on” policy intervention—or even no intervention at all, except for information dissemination. For instance, cooperatives have been used to set up community owned and operated local energy systems. Additionally, local NGOs can sup-port local electrification projects and help create enabling environments for energy access at the community level.
POWER PLANNING AND POLICY COHERENCEGiven that energy needs to be both socially acceptable and environmentally compliant, it is vital that energy pol-icy is integrated into broader development strategies. Consider, for example, expanding education to the rural poor in a least developed country. This will require not only building schools but also supplying electricity. But expanding the energy sector can be capital intensive; the demands for its fuels may be inelastic and taxable; and there might be a need for significant imports or produce exports. As a result, fiscal and economic policy would need to be consistent with the needs of the energy sec-tor. If expenditure on investments is too high, for instance,
it may crowd out funding needed for other purposes. In the longer run, high upfront investments may result in low running, and therefore low electricity prices. Low prices may reduce the cost of production factors and boost eco-nomic growth. The energy sector is often the most important contributor to GHG emissions. Yet environ-ment ministries may be called on to communicate GHG projections and mitigation targets.
The need for integration becomes particularly clear where there are physical links among the critical resource systems. The term nexus3 is increasingly being used to describe the interlinked nature of resource systems. The importance of interlinkages in the supply chains that pro-vide water, energy, and food has been raised by the IAEA (2009), among others, emphasising prudent integrated management of climate, land-, energy- and water-use (CLEW) strategies. As gains may be had with increased inte-gration in these supply chains, it is argued that there is a clear need to develop quantitative frameworks to support future sustainability policies (Howells and Rogner (2014).
Links to climate, water, land, and other resource planningPlanning approaches have been developed to study and develop policy for resource management. However, these approaches can be lacking—especially when different resource systems are tightly interwoven (UN, 2014). Exist-ing approaches typically examine future development sce-narios of one sector, with little account of consistent and concurrent scenarios of other sectors. Often termed “inte-grated,”4 such planning processes make inter-sector link-ages explicit, but they do not necessarily look beyond those. Resource planning approaches typically assume that the related sectors are static, or that their develop-ment is not fundamentally changed by the primary sector being considered. This can result in important feedbacks being ignored or overlooked (M. Howells et al., 2013a). For example, a drying climate change may drive up energy prices at a time when energy needs become amplified. Unless considered concurrently under the same scenario drivers, such a negative and reinforcing situation may go undetected. Efforts to overcome these methodological shortfalls are beginning to be made at a policy level, nota-bly EU strategic environmental assessments (EU, n.d.).
While in their infancy, nexus studies have started to zoom in on exploring different geographical scales: from global (United Nations, 2014) to regional (Smajgl and Ward, 2013; UNECE, 2014)) and national (Hermann et al., 2012; M. Howells et al., 2013b; Macknick et al., 2012; Sat-tler et al., 2012). At the sub-national level, Bartos and Ches-ter (2014) illustrate missed opportunities in the United States from the lack of formal integration of the water and energy service infrastructure in Arizona. In Sub-Saharan Africa, a major World Bank study (WB, 2015) that covers over 40 countries combines agricultural, hydrological, cli-mate, and energy modelling to assess the interference and climate vulnerability of each. This allowed for not only a resource consistent approach but also a regionally consis-tent analysis. And it was delivered by a small team using open tools5 over a relatively short period—which bodes well for making such approaches easily available.

10 STATE OF ELECTRICITY ACCESS REPORT | 2017
NOTES 1. Notable integrated assessment models include: DICE (Dynamic Integrated Climate-Economy), RICE (Regional DICE), MERGE (Model for
Estimating the Regional and Global Effects of greenhouse gas reductions), MESSAGE-MACRO, IMAGE (Integrated Model to Assess the Greenhouse Effect), IMAGE/TIMER (Targets IMage Energy Regional), MiniCAM (Mini Climate Assessment Model), GCAM (Global Change Assessment Model), WITCH (a World Induced Technical Change Hybrid System), DNE21 (Dynamic New Earth 21), MIND, ReMIND (Regional Model of Investments and Development), AIM/CGE (Asian Pacific Integrated Model). (Després et al., 2015)
2. The levelized cost is the total costs (including capital investments, operating costs, and financing costs) divided by the total energy output over the lifetime of the system.
3. Nexus refers to the interplay and interconnections among different societal or natural systems or resources. Most commonly, it covers water, energy, and food, but it can also involve security, eco-systems, climate, sanitation, health, and gender (see for instance Beck and Walker, 2013; UNECE, 2014)
4. Examples include Integrated Water Resource Management (IWRM), Integrated Energy Planning (IEP), Integrated Land-use Assessment (ILUA), etc.5. For the electricity modelling OSeMOSYS was employed.
Role in economic, social, and regional development strategiesEnergy provision to the poor is vital. Consider the typical least developed country, which is highly dependent on agriculture. Electricity is needed to support enabling basic activities such as lighting and powering ICT devices, and mechanical power and heat are needed to farm and treat crops. In addition, there is a strong correlation between electricity use per capita and human development, with countries with higher per capita use ranking higher on the human development index. Studies in rural states of India have pointed out the potentials for increased literacy relating to electricity access (Kanagawa and Nakata, 2008). Others have theorized that such relations are best described as saturation phenomena where we observe a steep rise in human development relative to energy demand for energy-poor nations, a moderate rise for tran-sitioning nations, and essentially no rise in human devel-opment for energy-advantaged nations (Martínez and Ebenhack, 2008).
At the regional level, extending modeling to look across borders has become important to assess integra-tion, trade, and security issues. At the global level, extend-ing models to analyze the potential development of power pools is also occurring. A power pool coordination program may use a computer generated power pool “master plan” to help understand how best to mobilize resources (SAPP, 2009) or the role of technology deploy-ment where resource rich countries may supply others (IRENA, Forthcoming). Other examples include continen-tal efforts, such as the Program for Infrastructure Develop-ment for Africa (SOFRECO, 2011).
CAPACITY BUILDING FOR PEOPLE AND INSTITUTIONS FOR PLANNING Without in-depth national energy planning capacity, the poorest will always be at the mercy of big industry and relying on the goodwill of the international and donor community (Rogner, 2011)—especially given that no one size fits all with respect to the energy system. Local condi-tions are unique, physically, politically, economically, and socially. Thus local capacity to develop, run, analyze, and interpret model results is crucial. Without the capacity to undertake this cornerstone of energy policy development, national development strategies may be ill informed with unwanted consequences.
This is particularly the case with changes to capital intensive energy investments or radical policy reforms, which will likely require more capacity development to obtain the needed skills to manage the new market situa-tion. Take the case of reforms coupled with multinational operations within a larger regional market that also involve the entry of private players (AfDB, 2013). Such skills would include: (i) developing energy balances and projections; (ii) configuring energy supply and trade scenarios; (iii) esti-mating financing as well as the institutional support; and (iv) understanding broader metrics for sustainable devel-opment and cross-sector impacts ((IAEA, n.d.)), (Howells and Roehrl, 2012)).
Capacity building should be seen as a long-term exer-cise—in effect, an investment project with limited imme-diate, higher long-term pay-offs. According to the African Development Bank (AfDB, 2013), “in order to ensure sus-tainability, capacity building should be migrated over time to the Centres of Excellence, tertiary institutions, and the utility affiliated academies of learning.” Ideally this should build and regional networks of experts, train-ers and trainees.
CONCLUSIONThus, energy planning is feasible and essential. There is a strong imperative to calculate quantitative and internally consistent scenarios of a country’s energy sector develop-ment to understand the needed institutional, incentive, technological, and financial requirements. This information can also be used to: (i) help harmonize policies, (ii) plan across different resources systems, and (iii) inform energy and technology trade. Scenarios are developed with mod-els, and given the strategic nature of the energy sector, models and the capacity to run them are required for both regions and countries.
At present there exist a useful, but limited set of accessible cases studies and open toolkits. This means that support efforts should focus on assisting data collec-tion, contributing to open modeling development, and building human capacity to analyze the energy sector. Such capacity building should include, but go beyond, technocrats. It should also include the establishment of centers of excellence, tertiary education, and networks of experts—the latter will be needed to ensure that the planning process is sustainable and will continue after short-term assistance ends.

Després, J., Hadjsaid, N., Criqui, P., Noirot, I., 2015. Modelling the impacts of variable renewable sources on the power sector: Reconsidering the typology of energy modelling tools. Energy 80, 486–495. doi:10.1016/j.energy.2014.12.005
Després, J., Hadjsaid, N., Criqui, P., Noirot, I., Modelling the impacts of variable renewable sources on the power sector: Reconsidering the typology of energy modelling tools, Energy, Volume 80, 1 February 2015, Pages 486-495, ISSN 0360-5442, http://dx.doi.org/10.1016/j.energy.2014.12.005.
Energyplan, 2015. Advanced energy system analysis computer model [Online]. Available at: http://www.energyplan.eu/markaltimes/ [Accessed May 12 2015]
EU, E.U., n.d. EU Strategic Environmental Assessment Directive [WWW Document]. Eur-Lex—Rech. Simple. URL http://eur-lex.europa.eu/LexUriServ/LexUriServ.do?uri=CELEX:32001L0042:EN:NOT (accessed 2.25.14).
FAO. “Energy-Smart Food For People And Climate.” Issue paper, Food and Agricultural Organization, 2011.
Foley, A.M., Ó Gallachóir, B.P., Hur, J., Baldick, R., McKeogh, E.J., A strategic review of electricity systems models, Energy, Volume 35, Issue 12, December 2010, Pages 4522-4530, ISSN 0360-5442, http://dx.doi.org/10.1016/j.energy.2010.03.057.
Fuso Nerini, F., Dargaville, R., Howells, M., Bazilian, M., 2014. Estimating the cost of energy access: The case of the village of Suro Craic in Timor Leste. Energy.
Fuso Nerini, F.; Broad, O.; Mentis, D.; Bazilian, M.; Howells, M.; A Cost Comparison Of Technology Approaches for Improving Access to Electricity Services. Elesevier’s Energy, 2015
Goodman, A.S., Hastak, M., 2006. Infrastructure Planning Handbook: Planning, Engineering, and Economics. ASCE.
Hafele, W., 1975. Objective Functions (Working Paper No. WP-75-025). International Institute for Applied Systems Analysis, Laxenburg, Austria.
Hermann, S., Welsch, M., Segerstrom, R.E., Howells, M.I., Young, C., Alfstad, T., Rogner, Hans-Holger, Steduto, P., 2012. Climate, land, energy and water (CLEW) interlink-ages in Burkina Faso: An analysis of agricultural intensifi-cation and bioenergy production. Nat. Resour. Forum 36, 245–262. doi:10.1111/j.1477-8947.2012.01463.x
Howells, M., Hermann, S., Welsch, M., Bazilian, M., Segerström, R., Alfstad, T., Gielen, D., Rogner, H., Fischer, G., van Velthuizen, H., Wiberg, D., Young, C., Roehrl, R.A., Mueller, A., Steduto, P., Ramma, I., 2013a. Integrated analysis of climate change, land-use, energy and water strategies. Nat. Clim. Change 3, 621–626. doi:10.1038/nclimate1789
Howells, M., Hermann, S., Welsch, M., Bazilian, M., Segerström, R., Alfstad, T., Gielen, D., Rogner, H., Fischer, G., van Velthuizen, H., Wiberg, D., Young, C., Roehrl, R.A., Mueller, A., Steduto, P., Ramma, I., 2013b. Integrated analysis of climate change, land-use, energy and water strategies. Nat. Clim. Change 3, 621–626. doi:10.1038/nclimate1789
Howells, M., Roehrl, R.A., 2012. Perspectives on Sustainable Energy for the 21st Century., Sustainable Development in
REFERENCES AfDB, A.D.B., 2013. Energy Sector Capacity Building
Diagnostic & Needs Assessment Study.
Amador, J., Domínguez, J., Application of geographical information systems to rural electrification with renewable energy sources, Renewable Energy, Volume 30, Issue 12, October 2005, Pages 1897-1912, ISSN 0960-1481, http://dx.doi.org/10.1016/j.renene.2004.12.007.
Angel, S., J. Parent, D. L. Civco & A. M. Blei, 2010. Atlas of Urban Expansion. Available at http://www.alnap.org/resource/6808.aspx
Bartos, M.D., Chester, M.V., 2014. The Conservation Nexus: Valuing Interdependent Water and Energy Savings in Arizona. Environ. Sci. Technol. 48, 2139–2149. doi:10.1021/es4033343
Baser, H., 2011. Special Report: Perspectives on Capacity Development in Fragile Situations. Ottawa, Canada. Available at http://www.oecd.org/dac/governance-peace/governance/docs/48311487.pdf
Bazilian, M., 2015. Power to the Poor. Foreign Affairs [Online] March/April 2015 Issue, Available at: https://www.foreignaffairs.com/articles/africa/2015-02-16/power-poor [Accessed] 2015 05 07
Bazilian, M., Cordes, L., Nussbaumer, P., Yager, A., 2011. Partnerships for access to modern cooking fuels and technologies. Curr. Opin. Environ. Sustain., Energy Systems 3, 254–259. doi:10.1016/j.cosust.2011.05.004
Bazilian, M., Miller, M., Detchon, R., Liebreich, M., Blyth, W., Futch, M., Modi, V., Jones, L., Barkett, B., Howells, M., MacGill, I., Kammen, D.M., Mai, T., Wittenstein, M., Aggarwal, S., O’Malley, M., Carvallo, J.P., Welsch, M., Pugh, G., Weston, R., Arent, D.J., 2013. Accelerating the Global Transformation to 21st Century Power Systems. Electr. J. 26, 39–51. doi:10.1016/j.tej.2013.06.005
Bazilian, M., Rice, A., Rotich, J., Howells, M., DeCarolis, Joseph, Macmillan, S., Brooks, C., Bauer, F., Liebreich, M., 2012. Open source software and crowdsourcing for energy analysis. Energy Policy.
Bazilian, M.; Economy, R.; Nussbaumer, P.; Haites, E.; Yumkella, K.; Howells, M.; Takada, M.; Rothman, D.; Levi, M; Behond Basic Access, The Scale of Investment Required For Universal Energy Access, Book Chapter, Energy Poverty Global Challenges and Local Solutions, 2014
Beck, M.B., Walker, R.V., 2013. On water security, sustainabil-ity, and the water-food-energy-climate nexus. Front. Environ. Sci. Eng. 7, 626–639. doi:10.1007/s11783-013-0548-6
Bekker, B., Eberhard, A., Gaunt, T., Marquard, A., 2008. South Africa’s rapid electrification programme: Policy, institu-tional, planning, financing and technical innovations. Energy Policy 36, 3125–3137. doi:10.1016/j.enpol.2008.04.014
Bhattacharyya, C., and Timilsina, G.R., A Review or Energy System Models, INternational Journal of Energy Manage-ment, Vol. 4, No. 4, 2010, pp. 494-518, DOI 10.1108/17506221011092742
DeCarolis, J.F., Hunter, K., Sreepathi, S., 2012. The case for repeatable analysis with energy economy optimization models. Energy Economics
ENERGY ACCESS AND ELECTRICITY PLANNING 11

12 STATE OF ELECTRICITY ACCESS REPORT | 2017
the 21st Century (SD21) project. United Nations Depart-ment of Economic and Social Affairs, Division for Sustainable Development., New York.
Howells, M., Rogner, H., Strachan, N., Heaps, Charles, Huntington, H., Kypreos, S., Hughes, A., Silveira, S., DeCarolis, Joe, Bazillian, M., 2011. OSeMOSYS: the open source energy modeling system: an introduction to its ethos, structure and development. Energy Policy 39, 5850–5870.
Howells, M., Rogner, H.-H., 2014. Water-energy nexus: Assessing integrated systems. Nat. Clim. Change 4, 246–247. doi:10.1038/nclimate2180
Howells, M., Rogner, H.-Holger, 2014. Water-energy nexus: Assessing integrated systems. Nat. Clim. Change 4, 246–247. doi:10.1038/nclimate2180
Hunter, K., Sreepathi, S., DeCarolis, JS. 2013. Modeling for Insight Using Tools for Energy Model Optimization and Analysis (Temoa), Energy Economics, 40, 339-349, ISSN 0140-9883
i4e, i4 energy, n.d. The SWITCH modelling project. [WWW Document]. URL http://i4energy.org/index.php?op-tion=com_content&view=arti-cle&Itemid=206&id=473:switch
IAEA, 2009. Annex VI: seeking sustainable climate land energy and water (CLEW) strategies—Nuclear Technology Review 2009 Supplement. Presented at the 53rd IAEA General Conference.
IAEA, I.A.E.A., n.d. Planning & Economic Studies Section (PESS): Capacity Building for Sustainable Energy Development [WWW Document]. URL http://www.iaea.org/OurWork/ST/NE/Pess/capacitybuilding.html
IIASA, MESSAGE–A modeling framework for medium -to long—term energy system planning, energy policy analysis, and scenario development, International Institute of Applied Systems Analysis, Available at: http://www.iiasa.ac.at/web/home/research/modelsData/MESSAGE/MESSAGE.en.html [Accessed May 12, 2015]
International Atomic Energy Agency (IAEA), 1984. Expansion Planning for Electrical Generating Systems, A Guidebook.
International Atomic Energy Agency (IAEA), 2009. IAEA tools and methodologies for Energy Systems Planning and Nuclear Energy.
International Energy Agency (IEA), 2009. IEA Energy Training Capacity-building Programme. [Online] Available at: https://www.iea.org/publications/freepublications/
Accessed May 12 2015]
International Energy Agency (IEA), 2014. Africa Energy Outlook: A Focus on Energy Prospects in Sub-Saharan Africa. Organisation for Economic Co-operation and Development, Paris.
International Energy Agency (IEA), 2015. World Energy Outlook. Organisation for Economic Co-operation and Development, Paris.
International Renewable Energy Agency (IRENA) 2012, Capacity Building Strategic Framework for IRENA (2012-2015). IRENA, United Arab Emirates, pp. 25
IRENA, I.R.E.A., 2014. Estimating the Renewable Energy Potential In Africa. Bonn.
Jenkins, R.T., Joy, D.S., 1974. Wein Automatic System Planning Package (WASP): An Electric Utility Optimal
Generation Expansion Planning Computer Code (No. ORNL-4945). Oak Ridge National Lab., Tenn. (USA).
Kaijuka, E., GIS and rural electricity planning in Uganda, Journal of Cleaner Production, Volume 15, Issue 2, 2007, Pages 203-217, ISSN 0959-6526, http://dx.doi.org/10.1016/j.jclepro.2005.11.057.
Kanagawa, M., Nakata, T., Assessment of access to electricity and the socio-economic impacts in rural areas of developing countries, Energy Policy, Volume 36, Issue 6, June 2008, Pages 2016-2029, ISSN 0301-4215, http://dx.doi.org/10.1016/j.enpol.2008.01.041.
Kemausuor, F., Adkins, E., Adu-Poku, I., Brew-Hammond, A., Modi, V., Electrification planning using Network Planner tool: The case of Ghana, Energy for Sustainable Develop-ment, Volume 19, April 2014, Pages 92-101, ISSN 0973-0826, http://dx.doi.org/10.1016/j.esd.2013.12.009.
Loulou, R., Goldstein, G., Noble, K., 2004. Documentation for the MARKAL family of Models.
Macknick, J., Sattler, S., Averyt, K., Clemmer, S., Rogers, J., 2012. The water implications of generating electricity: water use across the United States based on different electricity pathways through 2050. Environ. Res. Lett. 7, 045803. doi:10.1088/1748-9326/7/4/045803
Martínez, D.M., Ebenhack, B.W., Understanding the role of energy consumption in human development through the use of saturation phenomena, Energy Policy, Volume 36, Issue 4, April 2008, Pages 1430-1435, ISSN 0301-4215, http://dx.doi.org/10.1016/j.enpol.2007.12.016.
Martinot, E., Energy efficiency and renewable energy in Russia: Transaction barriers, market intermediation, and capacity building, Energy Policy, Volume 26, Issue 11, September 1998, Pages 905-915, ISSN 0301-4215, http://dx.doi.org/10.1016/S0301-4215(98)00022-6.
Mentis, D., Welsch, M., Fuso Nerini, F., Broad, O., Howells, M., Bazilian, M., Rogner, H., 2015. A GIS-based approach for electrification planning—A case study on Nigeria. Energy Sustain. Dev. 29, 142–150. doi:10.1016/j.esd.2015.09.007
Mentis, D., Andersson, M., Howells, M., Rogner, H., Siyal, S., Broad, O., Korkovelos, A., Bazilian, M., 2016.a. The benefits of geospatial planning in energy access— A case study on Ethiopia. Appl. Geogr. 72, 1–13. doi:10.1016/j.apgeog.2016.04.009
Mentis, D., Andersson, M., Howells, M., Rogner, H., Siyal, S., Broad, O., Korkovelos, A., Bazilian, M., 2016.b. The benefits of geospatial planning in energy access— A case study on Ethiopia. Appl. Geogr. 72, 1–13. doi:10.1016/j.apgeog.2016.04.009
Niet, T., Pitt, L., Rowe, A., Wild, P., Storage and the Shift to Low Carbon Energy. Journal of Clean Energy Technologies vol. 4, no. 1, pp. 26-31, 2016.
Nerini, F.F., Dargaville, R., Howells, M., Bazilian, M., 2014. Estimating the cost of energy access: The case of the village of Suro Craic in Timor Leste. Energy.
Nussbaumer, P., Fuso Nerini, F., Onyeji, I., Howells, M., 2013. Global Insights Based on the Multidimensional Energy Poverty Index (MEPI). Sustainability 5, 2060–2076. doi:10.3390/su5052060
Ohiorhenuan, John F.E.; Wunker, Stephen M.; UNDP; UNEP. 1995. Capacity building requirements for global environ-mental protection. Global Environment facility working paper series ; no. 12. Washington, D.C. : The World Bank.

ENERGY ACCESS AND ELECTRICITY PLANNING 13
Onyeji, I., Bazilian, M., Nussbaumer, P., 2012. Contextualizing electricity access in sub-Saharan Africa. Energy Sustain. Dev. 16, 520–527. doi:10.1016/j.esd.2012.08.007
Parshall, L., Pillai, D., Mohan, S., Sanoh, A., Modi, V., National electricity planning in settings with low pre-existing grid coverage: Development of a spatial model and case study of Kenya, Energy Policy, Volume 37, Issue 6, June 2009, Pages 2395-2410, ISSN 0301-4215, http://dx.doi.org/10.1016/j.enpol.2009.01.021.
Ravita D. Prasad, R.C. Bansal, Atul Raturi, Multi-faceted energy planning: A review, Renewable and Sustainable Energy Reviews, Volume 38, October 2014, Pages 686-699, ISSN 1364-0321, http://dx.doi.org/10.1016/j.rser.2014.07.021.
Rogner, H.H., 2011. Energy Planning and Application to Nuclear Power. [Online] Available at: http://www.iaea.org/NuclearPower/Downloadable/Meet-ings/2011/2011-May-Africa/EnergyPlanningApplica-tions-H.Rogner-IAEA.pdf
SAPP, S.A.P.P., 2009. SAPP Regional Generation and Transmission Expansion Plan Study.
Sattler, S., Macknick, J., Yates, D., Flores-Lopez, F., Lopez, A., Rogers, J., 2012. Linking electricity and water models to assess electricity choices at water-relevant scales. Environ. Res. Lett. 7, 045804. doi:10.1088/1748-9326/7/4/045804
Schrattenholzer, L., 1981. The energy supply model MES-SAGE. IIASA Laxenburg, Austria.
Smajgl, A., Ward, J., 2013. The Water-Food-Energy Nexus in the Mekong Region: Assessing Development Strategies Considering Cross-Sectoral and Transboundary Impacts. Springer Science & Business Media.
SOFRECO, 2011. Africa Energy Outlook 2040: Study on Programme for Infrastructure Development in Africa (PIDA) [WWW Document]. URL http://www.pidafrica.org/PIDA-Sector-speccific%20Terms%20of%20Reference%20for%20Energy%20Sector.pdf
Sustainable Energy for All (SE4ALL), 2015. Capacity Building Hub for Sustainable Energy. [Online] Available at: http://www.se4allcapacityhub.org/index.php?option=com_ content&view=article&id=2&Itemid=160##vision [Accessed May 12 2015]
Szabó, S., Bódis, K., Huld, T., Moner-Girona, M., 2011. Energy solutions in rural Africa: mapping electrification costs of distributed solar and diesel generation versus grid extension. Environ. Res. Lett. 6, 034002. doi:10.1088/1748-9326/6/3/034002
Taliotis, C., Shivakumar, A., Ramos, E., Howells, M., Mentis, D., Sridharan, V., Broad, O., Mofor, L., 2016. An indicative analysis of investment opportunities in the African electric-ity supply sector—Using TEMBA (The Electricity Model Base for Africa). Energy Sustain. Dev. 31, 50–66. doi:10.1016/j.esd.2015.12.001
Tiba, C., Candeias, A.L.B., Fraidenraich, N., Barbosa, E.M. de S., de Carvalho Neto, P.B., de Melo Filho, J.B., 2010. A GIS-based decision support tool for renewable energy management and planning in semi-arid rural environ-ments of northeast of Brazil. Renew. Energy 35, 2921–2932. doi:10.1016/j.renene.2010.05.009
Timmerman, J., Vandevelde, L., Van Eetvelde, G., Towards low carbon business park energy systems: Classification of techno-economic energy models, Energy, Volume 75, 1 October 2014, Pages 68-80, ISSN 0360-5442, http://dx.doi.org/10.1016/j.energy.2014.05.092.
UN, U.N., 2014. Prototype Global Sustainable Development Report . Online unedited edition.
UNECE, W.C. secretariat, 2014. Alazani/Ganikh RiverBasin Water-Food-Energy-Ecosystems Nexus assessment—First draft for comments.
United Nations, 2014. Prototype Global Sustainable Development Report. United Nations Department of Economic and Social Affairs, Division for Sustainable Development, New York.
WB, World Bank, 2015. Enhancing the Climate Resilience of Africa’s Infrastructure. Washington.
Welsch, M., 2013. Enhancing the Treatment of Systems Integration in Long-term Energy Models. Ph.D. Stock-holm: Royal Institute of Technology.
Welsch, M., 2013. Enhancing the Treatment of Systems Integration in Long-term Energy Models. KTH—Royal Institute of Technology, Sweden, Stockholm.
Welsch, M., Deane, P., Howells, M., Gallachóir, B.Ó., Rogan, F., Bazilian, M., Rogner, H.-H., 2014. Incorporating flexibility requirements into long-term energy system models–A case study on high levels of renewable electricity penetration in Ireland. Appl. Energy 135, 600–615.
Wilson, R., Biewald, B., 2013. Best Practices in Electric Utility Integrated Resource Planning, Examples of State Regulations and Recent Utility Plans. Synapse Energy Economics (June 2013)
World Bank (W.B.), 2010. Africa’s Infrastructure—A time for Transformation.
World Bank (W.B.), 2014. World Development Indicators [WWW Document]. URL http://data.worldbank.org/indicator/EG.USE.ELEC.KH.PC (accessed 9.5.14).
World Bank (W.B.). 2015. Africa. Planning Africa’s Infrastruc-ture in An Uncertain Climate Future. Available at: http://www.worldbank.org/en/region/afr/publication/planning-africas-infrastructure-uncertain-climate-future [Accessed May 12 2015]
To download the State of Electricity Access Report, overview, and Special Features, visit:http://esmap.org/SEAR
SPECIAL FEATURES