Public and Private School Distinction, Regional ...
13
ISSN 1303-0485 • eISSN 2148-7561 DOI 10.12738/estp.2015.2.2386 Copyright © 2015 EDAM • http://www.estp.com.tr Educational Sciences: Theory & Practice • 2015 April • 15(2) • 419-431 Received | 24 December 2013 Accepted | 10 March 2015 OnlineFirst | 17 April 2015 a Assoc. Prof. Seher Nur Sulku (PhD), Department of Econometrics, Gazi University, Ankara, Turkey Email: [email protected] b Corresponding author Assoc. Prof. Zehra Abdioglu (PhD), Department of Econometrics, Karadeniz Technical University, Trabzon, Turkey Research areas: Applied econometrics, macroeconomics Email: [email protected] Abstract This study investigates the factors influencing the success of students in primary schools in Turkey. TIMSS 2011 data for Turkey, measuring the success of eighth-grade students in the field of mathematics, were used in an econometric analysis, performed using classical linear regression models. Two hundred thirty-nine schools participated in the TIMSS 2011 study for Turkey, and the sample size comprised 6,928 students. The results of our regression analyses revealed that regional differences, in particular, significantly impacted the success of students. Greater success in mathematics was achieved by students who live in urban areas and in socioeco- nomically more developed regions. Furthermore, math success rates of private school pupils were higher than those of public school students. The economic status of students’ families, as well as their surroundings, sex, the educational background of their fathers, and educational instruments owned are substantial factors affect- ing the students’ performance. We found that students whose fathers have a low level of education, who come from socioeconomically disadvantaged groups, and who live in poorly developed areas have lower performance. Keywords: Student Success • TIMSS • Socioeconomic Factors • Regional Differences • Private Schools • Public Schools. Seher Nur Sulku a Gazi University Zehra Abdioglu b Karadeniz Technical University Public and Private School Distinction, Regional Development Differences, and Other Factors Influencing the Success of Primary School Students in Turkey
Transcript of Public and Private School Distinction, Regional ...

ISSN 1303-0485 • eISSN 2148-7561
DOI 10.12738/estp.2015.2.2386
Copyright © 2015 EDAM • http://www.estp.com.tr
Educational Sciences: Theory & Practice • 2015 April • 15(2) • 419-431
Received | 24 December 2013
Accepted | 10 March 2015
OnlineFirst | 17 April 2015
a Assoc. Prof. Seher Nur Sulku (PhD), Department of Econometrics, Gazi University, Ankara, Turkey Email: [email protected]
b Corresponding author Assoc. Prof. Zehra Abdioglu (PhD), Department of Econometrics, Karadeniz Technical University, Trabzon, Turkey Research areas: Applied econometrics, macroeconomics Email: [email protected]
AbstractThis study investigates the factors influencing the success of students in primary schools in Turkey. TIMSS 2011 data for Turkey, measuring the success of eighth-grade students in the field of mathematics, were used in an econometric analysis, performed using classical linear regression models. Two hundred thirty-nine schools participated in the TIMSS 2011 study for Turkey, and the sample size comprised 6,928 students. The results of our regression analyses revealed that regional differences, in particular, significantly impacted the success of students. Greater success in mathematics was achieved by students who live in urban areas and in socioeco-nomically more developed regions. Furthermore, math success rates of private school pupils were higher than those of public school students. The economic status of students’ families, as well as their surroundings, sex, the educational background of their fathers, and educational instruments owned are substantial factors affect-ing the students’ performance. We found that students whose fathers have a low level of education, who come from socioeconomically disadvantaged groups, and who live in poorly developed areas have lower performance.
Keywords: Student Success • TIMSS • Socioeconomic Factors • Regional Differences • Private Schools • Public Schools.
Seher Nur Sulkua
Gazi University
Zehra Abdioglub
Karadeniz Technical University
Public and Private School Distinction, Regional Development Differences, and Other Factors Influencing the Success of Primary School Students in Turkey

E d u c a t i o n a l S c i e n c e s : T h e o r y & P r a c t i c e
420
Education accelerates a country’s economic development by ensuring personal growth and social progress. Assuring the spread of community-specific values among generations, education is one of most basic elements of human capital. A country’s investments in education produce valuable future savings. Educational policies adopted in any country, and resources directed towards education, in either public or private sectors, are very important for education.
Quality in education is only possible through educational plans and training programs, implemented in an efficient and equal manner. A quality training program meets the requirements of its time, closely follows the development of information and communication technologies, and pursues equality of opportunity and facility. The success of a country’s educational policies can be measured by its students’ success. Many studies, at the national level, conducted especially in recent years, assess the training efficiency of schools, in relation to students’ academic success. In addition, programs continuously determine countries’ comparative academic success versus other countries. Studies such as the Trends in International Mathematics and Science Study (TIMSS), Program for International Student Assessment (PISA), and Progress in International Reading Literacy Study (PIRLS) compare the success of students in international platforms. By providing preliminary information for researchers, for those who prepare school curricula, and for educational politicians regarding the operation of educational systems, these studies, repeated at certain intervals, become guides for criticism, assessment of educational systems, and required regulations.
International examinations cause large reactions in many countries. Many countries try to improve their performances on these exams, as a strong relation exists between student success and economic development (Barro, 2013). Following the inputs or outputs of an educational system closely, determining shortcomings and stop points, and implementing proper policies is extremely important for national economies. Using data from TIMSS 2011, an international success evaluation program, this study investigates the factors affecting the mathematical success of eighth-grade students in Turkey. The findings of this study, in which the impact of a large number of variables concerning the socioeconomic status of students, regional differences, and school types upon success are comprehensively examined, will uncover required
preliminary information for those preparing training programs. The study will further provide the required feedback for policy makers who shape the educational system, while answering the question: “what kind of an educational system should it be?’’ which recently has received wide coverage in public.
Programs that rate student success at an international level, in which Turkey participated, included TIMSS (1999, 2007, and 2011), PIRLS (2001), and PISA (2000, 2003, 2006, 2009, and 2012). Remarkably, Turkey ranks among the group of countries with the lowest performance in student success rating. Regarding TIMSS, PIRLS, and PISA, policy makers changed the curriculum in 2005. Although improved in recent years, Turkey’s performance in these international examinations is far below that of European Union member states and some Asian countries (Alacacı & Erbaş, 2010; Anıl, 2009; Bayraktar, 2010; Berberoğlu & Kalender, 2005; Çelen, Çelik, & Seferoğlu, 2011; Gümüş & Atalmış, 2012; Güner, Sezer, & Akkuş İspir, 2013; Gür, Çelik, & Özoğlu, 2012; Özer & Anıl, 2011; Özgün-Koca & Şen, 2002; Yücel, Karadağ, & Turan, 2013; Zopluoğlu, 2013). Thus, it is essential to understand the factors affecting students’ performance to create an efficient and productive educational system in Turkey and to increase students’ success. This study uses the most up-to-date TIMSS data to identify such factors (TIMSS, 2011).
When studies examining TIMSS (2011) data for Turkey are reviewed (Abazaoğlu, Yıldızhan, & Yıldırım, 2014; Buluç, 2014; Oral & McGivney, 2013; Yücel et al., 2013; Zopluoğlu, 2013), it is remarkable that Turkey’s performance is compared with other countries involved in TIMSS only within the scope of main indicators and graphics. Variables affecting the success levels of students were not investigated in these studies, within the framework of an extensive econometric analysis. Due to such drawbacks, this study examines factors affecting the success of students in Turkey, applying regression analysis, a basic econometric approach. In addition, it underlines regional differences and provides insight into students’ success, emphasizing the distinction between private and public schools, which recently has led to substantial discussions in Turkey.
This study was organized as follows: First, the literature and findings were presented. Samples from TIMSS 2011 and the variables used in analysis, e.g., factors affecting students’ success, plus the regression method and its application were

Sulku, Abdioglu / Public and Private School Distinction, Regional Development Differences, and Other...
421
introduced in the methodology section. Findings obtained from regression analysis were presented in the findings section. Assessment and policy recommendations regarding the findings then were included in the discussion section.
Literature
Mincer (1958; 1974) estimated the return of investment to education at the microeconomic level by means of an earnings function, noted with his own name. Effects of human capital on economic growth are investigated, within the scope of Mincer’s earning function, for several country groups. Barro and Lee (1993; 1996; 2001; 2010) analyzed the effects of human capital on economic growth, within the framework of a large data set, consisting of counting and survey data. Comparatively analyzing the educational backgrounds of adults, on the basis of several educational levels and gender differences, in a large number of countries, they stated that human capital has a substantial and positive effect on the national outcome. They opined that developing countries still lagged behind developed countries, despite their progress in education. Gender inequality decreased in many countries, and the return of investment to education for primary education is negative. However, the return for secondary and higher education is positive.
Psacharopoulos (1973; 1985; 1994) analyzed income level, gender, educational level, and return of public and private investments to education, by general and vocational education, in a large number of countries, using a large set of data obtained within the scope of these surveys. He stated that elementary education is the number one investment priority for developing economies, that it is more profitable to train women rather than men, and that the higher the level of education and per capita income, the lower the return of investment to education. He further determined that the return of investment for education, made in private economic sectors, is higher compared to that of the public sector, and that public finance receded in higher education. He also specified that the social return of general secondary education is higher than that of vocational secondary education.
Revealing the effects of human capital, within the scope of test scores, for the assessment of students’ academic success at an international level, Hanushek (2009) analyzed South Asian countries, based on international adult literacy survey data. Hanushek
emphasized the necessity of quality teaching for quality education, determining that the cognitive skills of a population significantly correlate with personal income, distribution of income, and economic development. In addition, Hanushek and Woessman (2010) analyzed the effects of student success on economic growth, for European Union countries, within the scope of PISA scores, conducted between 1964 and 2003. They concluded that a positive correlation exists between cognitive skills and economic development in European Union countries and that, in the current period, countries’ educational reforms form in accordance with current economic performance and educational achievements. Additionally, Hanushek and Woessman (2012) analyzed schooling in Latin America, the relationship between success in education and growth within the scope of all international student achievement test scores, performed between 1964 and 2003, and local test scores used in Latin America. They stated that schooling correlates with economic development in Latin American countries as long as it ensures educational success.
Analyzing students’ levels of success for U.S., within the scope of TIMSS 2007 data, Enck (2011) noted that there is no significant correlation between the use of constructive learning strategies, student success, and classroom size, and that teachers should be given free authorization by directors of educational policies about the best teaching strategy to implement in classrooms. Also within the scope of TIMSS 2007, Badr, Morrissey, and Appleton (2012) analyzed variables affecting student success in mathematics for Algeria, Egypt, Jordan, Iran, Saudi Arabia, Syria, Turkey, and Tunisia. They determined that characteristic features of students more significantly influence success than features of schools. In another study, conducted as part of TIMSS 2007 surveys, Chen (2013) emphasized that student gender, the number of books read at home, frequency of mathematics homework, attitude of students toward math, school safety, perception of students, and occupational development opportunities of teachers explain low math scores in Singapore. In addition to such studies, analyzing academic success performances of students in Morocco as part of TIMSS (1999, 2003, and 2007), Ibourk (2013) determined that characteristic features of students, their family environments, and school types have substantial effects on student success. He further stated that the performance of students in private schools was better than that of public schools.

E d u c a t i o n a l S c i e n c e s : T h e o r y & P r a c t i c e
422
The most remarkable issue appearing in studies assessing academic success levels of students in Turkey is that Turkey is ranked among the countries with the lowest success levels in student rating. Although some progress has been made in Turkey’s educational system over time, Turkey has displayed low performance compared with other countries (Alacacı & Erbaş, 2010; Anıl, 2009; Bayraktar, 2010; Beberoğlu & Kalender, 2005; Çelen et al., 2011; Gümüş & Atalmış, 2012; Güner et al., 2013; Gür et al., 2012; Özer & Anıl, 2011; Özgün-Koca & Şen, 2002; Uzun, Bütüner, & Yiğit, 2010; Yücel et al., 2013; Zopluoğlu, 2013).
In particular, in both empirical studies and status evaluations based on TIMSS, PISA, and PIRLS data (Alacacı & Erbaş, 2010; Gümüş & Atalmış, 2012; Oral & McGivney, 2013; Yücel et al., 2013), inequality based on developmental differences among regions is one of the underlying reasons of students’ failure in Turkey. Using PISA 2006 findings from Turkey, Alacacı and Erbaş (2010) stated that living in the Eastern Anatolia and Southeastern Anatolia regions negatively affected students’ success in mathematics. Comparing Turkey’s TIMSS for 2011, 1999, and 2007; Yücel et al. (2013) determined that the success of students living in rural areas is lower than that of students attending school in urban areas. Using PISA 2003 and 2009 data for Turkey, Gümüş and Atalmış (2012) remarked that students living in Eastern Anatolia who showed the lowest regional success (based on 2003 PISA data) made the highest progress in terms of success among the regions. By 2009, the success gap between the Western regions began to decrease. Oral and McGivney (2013) determined, based on TIMSS 2011 findings, that academic achievement at schools increases with a region’s socioeconomic position.
Another important issue revealed by analysis of international educational program data is the inequality created by different school types (Alacacı & Erbaş, 2010; Berberoğlu & Kalender, 2005; Gümüş & Atalmış, 2012; Mohammadi, Akkoyunlu, & Şeker, 2011). Based on student selection exam data (SSE) and PISA 2003, Berberoğlu and Kalender (2005) indicated that differences between school types, rather than regional differences, are significant for student success. Similarly, Alacacı and Erbaş (2010) and Gümüş and Atalmış (2012) underlined that success differences are high because of different school types, and that a success gap between regions could be eliminated over time. However; even a slight convergence does
not come into question when considering school types. Mohammadi et al. (2011) emphasized that the effect on success of public and private schools differ, and that the existence of laboratory and sport activities positively impacts student success.
Undoubtedly, another variable having a substantial influence on student success, based on international educational programs, is the socioeconomic status of families (Alacacı & Erbaş, 2010; Atar & Atar, 2012; Güner et al., 2013; Mohammadi et al., 2011; Şirin, 2005; Yalçın, Aslan, & Usta, 2012; Yücel et al., 2013). Şirin (2005) emphasized that the correlation between income and education is one of the most important components of high student socioeconomic status. Drawing on the reports of PISA 2006, PISA 2009, and TIMSS 2011, Alacacı and Erbaş (2010), Yalçın et al. (2012), and Yücel et al. (2013) emphasized the importance of socioeconomic status on mathematical success. One of the most crucial factors in transnational comparisons of student success is income difference between countries. Programs in international platforms that have improved student success are more effective in countries with high income levels, compared with those in low-income countries (Eğitimi Araştırma Geliştirme Dairesi Başkanlığı [EARGED], 2007, 2010).
Gender is another important issue uncovered by programs undertaking international success comparisons. When student achievement is evaluated according to gender (Atar & Atar, 2012; EARGED, 2005, 2010; Yücel et al., 2013; Zopluoğlu, 2013), female students are more successful than male students However, according to OECD averages based on PISA 2006 findings for Turkey, male students are more successful in math than female students. Alacacı and Erbaş (2010) described this condition as low participation by girls in education. They also specified that attitudes of students and parents towards lessons, resources of materials at home, and school details have substantial influences on student success in Turkey (EARGED, 2005, 2010).
In the literature, studies analyzing the most up-to-date TIMSS (2011) data for Turkey compared students’ achievements, using basic statistical indicators, with students of other countries that participated in TIMSS (Abazaoğlu et al., 2014; Buluç, 2014; Oral & McGivney, 2013; Yücel et al., 2013; Zopluoğlu, 2013). However, these studies did not perform an extensive econometric analysis to determine the variables affecting success levels of students. Therefore, as stated in the introductory section, our study bridges this gap in the literature.

Sulku, Abdioglu / Public and Private School Distinction, Regional Development Differences, and Other...
423
Purpose
This study reveals factors affecting the success of primary school students in Turkey. For this, TIMSS 2011 data for Turkey, measuring the success of eighth-grade students in the field of mathematics, were used. Basic statistical and econometric techniques, descriptive statistics, and classical linear regression models were employed to determine pupils’ success.
Method
TIMSS 2011 data about mathematics were used in this study to assess the success of eighth-grade math students in Turkey. The effect of a large number of variables on students’ success in math, specified within the scope of the literature, was analyzed. These variables, which included socioeconomic status, geographical difference of students, and school types are important because they provide a point of view, from the perspective of student success, for the discussion of private versus public schools, which lately has come to the fore in the country’s agenda.
Sampling
As one of the major studies to assess student success in an international platform, TIMSS was first conducted in 1994–1995 and has been repeated since every four years. The TIMSS and PIRLS International Study Center is affiliated with Boston College in the USA and the International Association for the Evaluation of Educational Achievement (IEA) Executive Center in Amsterdam. Until 2011, coordination of TIMSS in Turkey has been carried out by the head of the Educational Research and Development Department (EARGED) of the Ministry of National Education. After enforcement of the statutory decree in 2011, this duty was undertaken by the Group Presidency of Assessment, Evaluation, and Placement under the Directorate General for Innovation and Educational Technology (Yenilik ve Eğitim Teknolojileri Genel Müdürlüğü [YEĞİTEK], 2014) of the Ministry of National Education.
TIMSS is one of the most comprehensive international comparative educational studies for fourth- and eighth-grade students. It was organized to provide a basis for educational policy makers, specialists, and investigators, who prepare curriculums, and to understand the operation of their own education systems. Utilizing surveys, videocassette recordings, and analysis of
curriculum materials, it also investigated existing terms and environments for mathematics and science education in participant countries. Thanks to the TIMSS study, information was gathered on educational systems, teaching programs, characteristic features of teachers, schools, and teaching methods (EARGED, 2003a, 2003b).
The 2011 TIMSS program for assessing students’ academic achievement at an international level was used in this study. TIMSS measures the success in mathematics and science of fourth- and eighth-grade students from participant countries all over the world, observes the implementation of curriculum, and defines good practices. Sixty-three countries, including Turkey, participated in the 2011 TIMSS study.
The TIMSS study uses a two-stage, stratified sampling method. In the first stage, the list of all primary schools in Turkey is sent by YEĞİTEK to IEA. Depending upon the variables such as the number of students at a school, the type of school, and the geographic region where the school is located, IEA randomly selects the schools from this list. In the second stage, branches are randomly chosen by YEĞİTEK from the schools in the sample. Two hundred thirty-nine schools from Turkey participated in the TIMSS 2011 study. These schools were selected to represent all of Turkey, thereby creating a strata with seven geographic urban and rural regions. Six thousand nine hundred twenty-eight students in total were included in the survey. When reviewed together with their weights, reflecting the complex structure of the survey, this observation totaled 1,165,721 students, (Martin & Mullis, 2012; TIMSS data set, 2011).
Data Analysis
The TIMSS International Research Center provides survey questions used to compare international success levels of students in math. The data obtained in these surveys are available on the institution’s official Web page (TIMSS data set, 2011). Data of Turkish students, who participated in TIMSS 2011 at the eighth-grade level, were downloaded from the Web page, designed as per the scope of the study. This study uses TIMSS 2011 data to determine, within the scope of classical linear regression analysis, possible variables likely to have an impact on achievement performance, displayed by eighth-grade mathematics students in Turkey. Changes in the value of explanatory variables on the value of outcome variables is

E d u c a t i o n a l S c i e n c e s : T h e o r y & P r a c t i c e
424
analyzed via regression equations. The regression model with multiple variables is indicated as Yi = β0 + β1X1i + β2X2i + ... + βkXki + εi, where Y, is the dependent variable, indicating the average mathematical success rates of students; Xj, j = 1,…, k shows explanatory variables having an impact on the success of students; β0, indicates a constant; βj indicates partial regression coefficients of the jth independent variable; and ε shows error terms. Although the regression analysis calculating the unit change upon the dependent variable, caused by one unit change, occurred in independent variables (ceteris paribus), the sign and magnitude of the relationship between the variables are determined.
Eight regression models (Model 1, Model 2, … Model 8) were constructed in this study to determine the variables affecting student success. In Model 1, only the variables considering geographical regions and residential areas (URBAN) are used to describe the success of students. A dummy variable presenting school type (PRIVATE) is included in Model 2, in addition to the variables in Model 1. The (SEX) variable is included in Model 3. While the model includes previous explanatory variables, new variables are put into the model in a particular order (considering t and F statistics, and the coefficient of determination (R2), to ascertain whether the change they create in the model is significant. In this manner, Model 8 was seen as the most comprehensive model. By determining which variables have an impact on student success, and the simple effectiveness of such variables, inferences were made regarding the success levels of elementary math students in Turkey.
Analyses in this study were performed through the SPSS version 18 International Database (IDB) Analyser, developed by IEA and utilized in the SPSS program. Thus, standard errors of regression coefficients are corrected, with weights specified by TIMSS, in consideration of the survey’s complex design.
Variables
In this study, potential variables that likely impacted student success were determined, following studies in the literature that compare students’ performance. This literature review showed that factors influencing students’ academic achievement, either at a national or international level, are the family’s socioeconomic status, regional differences, gender of the student, school type, attribute towards lessons, and the lessons’ potential.
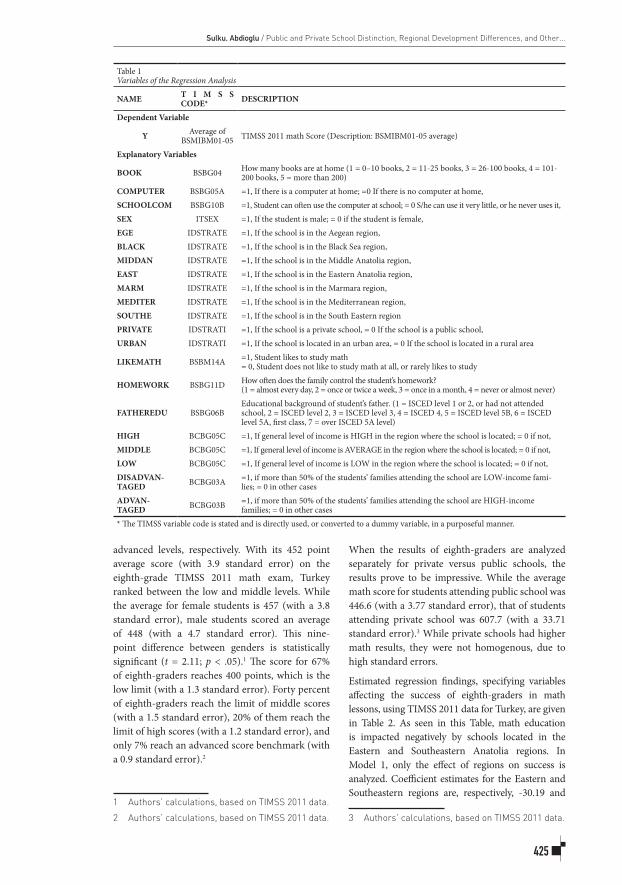
The names of the variables used in regression models, TIMSS codes, and their detailed descriptions are presented in Table 1. The dependent variable was taken as the average of all plausible values (plausible values 1-5) of students’ success rates in math.
The first factors analyzed in the study are regional variables (see Table 1. EGE, BLACK, etc.). Seven dummy variables are generated to determine the region where students live and to prevent the perfect multi-collinearity problem, while forming the dummy variables. Among the seven regional dummy variables presented in Table 1, the (MARM) dummy, created for the Marmara region, is excluded, to prevent causing perfect multi-collinearity.
A multicollinearity state often is observed among economic variables. Even if almost perfect multi-collinearity exists, least squares estimators remain unbiased and efficient (Gujarati & Porter, 2009, p.327). However, when multicollinearity is high, standard errors of coefficient estimations become inflated, and coefficient estimations contrary to economic views and expectations may be obtained. Indeed, with a high level of multicollinearity, coefficients of explanatory variables alone have low importance; that is, t-statistics are insignificant, even though the model has a high R2 value. For this study, the problem of high multicollinearity is analyzed in the discussion section, where it is determined that it does not constitute a problem.
In our analysis, another variable, whose effect on the success of student is analyzed, is school type (PRIVATE). Factors measuring the socioeconomic level of the family (FATHEREDU, HIGH, MIDDLE, LOW, DISADVANTAGED, and ADVANTAGED) also are considered. The educational opportunities of students (BOOK, COMPUTER, and SCHOOLCOM) and their attitudes toward math lessons (LIKEMATH) are in the study as explanatory variables, following the literature. In addition, parents’ relevance regarding their children’s’ education are approximated, using the frequency that families control homework (HOMEWORK). Further, the influence of gender on student success is analyzed, through the (SEX) variable.
Results
First, eighth-graders’ success in the TIMSS 2011 math examination for Turkey is analyzed through descriptive statistics. In TIMSS international comparisons, scores of 400, 475, 550, and 625 are the benchmark points for low, middle, high, and
Sulku, Abdioglu / Public and Private School Distinction, Regional Development Differences, and Other...
425
advanced levels, respectively. With its 452 point average score (with 3.9 standard error) on the eighth-grade TIMSS 2011 math exam, Turkey ranked between the low and middle levels. While the average for female students is 457 (with a 3.8 standard error), male students scored an average of 448 (with a 4.7 standard error). This nine-point difference between genders is statistically significant (t = 2.11; p < .05).1 The score for 67% of eighth-graders reaches 400 points, which is the low limit (with a 1.3 standard error). Forty percent of eighth-graders reach the limit of middle scores (with a 1.5 standard error), 20% of them reach the limit of high scores (with a 1.2 standard error), and only 7% reach an advanced score benchmark (with a 0.9 standard error).2
1 Authors’ calculations, based on TIMSS 2011 data.
2 Authors’ calculations, based on TIMSS 2011 data.
When the results of eighth-graders are analyzed separately for private versus public schools, the results prove to be impressive. While the average math score for students attending public school was 446.6 (with a 3.77 standard error), that of students attending private school was 607.7 (with a 33.71 standard error).3 While private schools had higher math results, they were not homogenous, due to high standard errors.
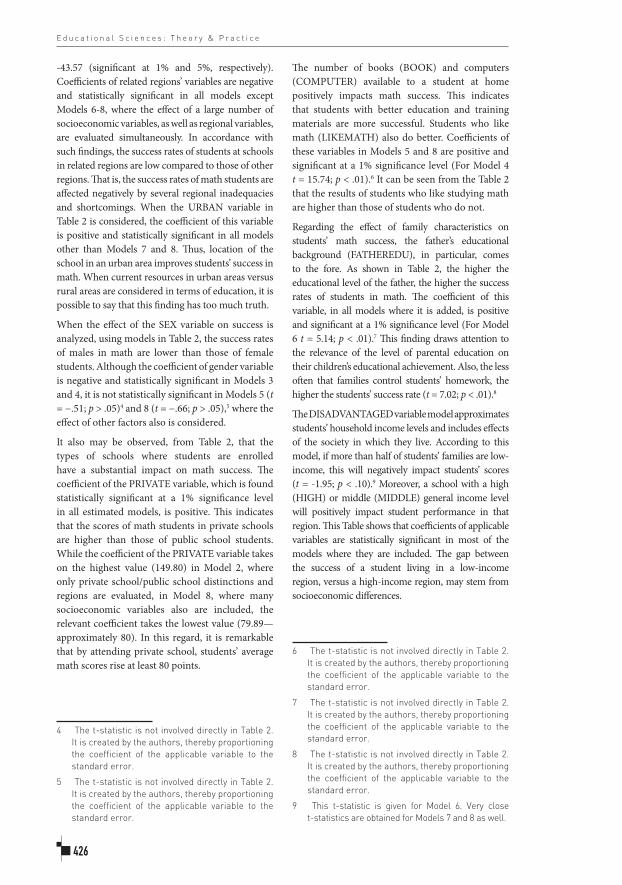
Estimated regression findings, specifying variables affecting the success of eighth-graders in math lessons, using TIMSS 2011 data for Turkey, are given in Table 2. As seen in this Table, math education is impacted negatively by schools located in the Eastern and Southeastern Anatolia regions. In Model 1, only the effect of regions on success is analyzed. Coefficient estimates for the Eastern and Southeastern regions are, respectively, -30.19 and
3 Authors’ calculations, based on TIMSS 2011 data.
Table 1Variables of the Regression Analysis
NAME T I M S S CODE* DESCRIPTION
Dependent Variable
Y Average of BSMIBM01-05 TIMSS 2011 math Score (Description: BSMIBM01-05 average)
Explanatory Variables
BOOK BSBG04 How many books are at home (1 = 0–10 books, 2 = 11-25 books, 3 = 26-100 books, 4 = 101-200 books, 5 = more than 200)
COMPUTER BSBG05A =1, If there is a computer at home; =0 If there is no computer at home,SCHOOLCOM BSBG10B =1, Student can often use the computer at school; = 0 S/he can use it very little, or he never uses it,SEX ITSEX =1, If the student is male; = 0 if the student is female,EGE IDSTRATE =1, If the school is in the Aegean region,BLACK IDSTRATE =1, If the school is in the Black Sea region,MIDDAN IDSTRATE =1, If the school is in the Middle Anatolia region,EAST IDSTRATE =1, If the school is in the Eastern Anatolia region,MARM IDSTRATE =1, If the school is in the Marmara region,MEDITER IDSTRATE =1, If the school is in the Mediterranean region,SOUTHE IDSTRATE =1, If the school is in the South Eastern regionPRIVATE IDSTRATI =1, If the school is a private school, = 0 If the school is a public school,URBAN IDSTRATI =1, If the school is located in an urban area, = 0 If the school is located in a rural area
LIKEMATH BSBM14A =1, Student likes to study math= 0, Student does not like to study math at all, or rarely likes to study
HOMEWORK BSBG11D How often does the family control the student’s homework?(1 = almost every day, 2 = once or twice a week, 3 = once in a month, 4 = never or almost never)
FATHEREDU BSBG06BEducational background of student’s father. (1 = ISCED level 1 or 2, or had not attended school, 2 = ISCED level 2, 3 = ISCED level 3, 4 = ISCED 4, 5 = ISCED level 5B, 6 = ISCED level 5A, first class, 7 = over ISCED 5A level)
HIGH BCBG05C =1, If general level of income is HIGH in the region where the school is located; = 0 if not,MIDDLE BCBG05C =1, If general level of income is AVERAGE in the region where the school is located; = 0 if not,LOW BCBG05C =1, If general level of income is LOW in the region where the school is located; = 0 if not,DISADVAN-TAGED BCBG03A =1, if more than 50% of the students’ families attending the school are LOW-income fami-
lies; = 0 in other casesADVAN-TAGED BCBG03B =1, if more than 50% of the students’ families attending the school are HIGH-income
families; = 0 in other cases* The TIMSS variable code is stated and is directly used, or converted to a dummy variable, in a purposeful manner.
E d u c a t i o n a l S c i e n c e s : T h e o r y & P r a c t i c e
426
-43.57 (significant at 1% and 5%, respectively). Coefficients of related regions’ variables are negative and statistically significant in all models except Models 6-8, where the effect of a large number of socioeconomic variables, as well as regional variables, are evaluated simultaneously. In accordance with such findings, the success rates of students at schools in related regions are low compared to those of other regions. That is, the success rates of math students are affected negatively by several regional inadequacies and shortcomings. When the URBAN variable in Table 2 is considered, the coefficient of this variable is positive and statistically significant in all models other than Models 7 and 8. Thus, location of the school in an urban area improves students’ success in math. When current resources in urban areas versus rural areas are considered in terms of education, it is possible to say that this finding has too much truth.
When the effect of the SEX variable on success is analyzed, using models in Table 2, the success rates of males in math are lower than those of female students. Although the coefficient of gender variable is negative and statistically significant in Models 3 and 4, it is not statistically significant in Models 5 (t = −.51; p > .05)4 and 8 (t = −.66; p > .05),5 where the effect of other factors also is considered.
It also may be observed, from Table 2, that the types of schools where students are enrolled have a substantial impact on math success. The coefficient of the PRIVATE variable, which is found statistically significant at a 1% significance level in all estimated models, is positive. This indicates that the scores of math students in private schools are higher than those of public school students. While the coefficient of the PRIVATE variable takes on the highest value (149.80) in Model 2, where only private school/public school distinctions and regions are evaluated, in Model 8, where many socioeconomic variables also are included, the relevant coefficient takes the lowest value (79.89—approximately 80). In this regard, it is remarkable that by attending private school, students’ average math scores rise at least 80 points.
4 The t-statistic is not involved directly in Table 2. It is created by the authors, thereby proportioning the coefficient of the applicable variable to the standard error.
5 The t-statistic is not involved directly in Table 2. It is created by the authors, thereby proportioning the coefficient of the applicable variable to the standard error.
The number of books (BOOK) and computers (COMPUTER) available to a student at home positively impacts math success. This indicates that students with better education and training materials are more successful. Students who like math (LIKEMATH) also do better. Coefficients of these variables in Models 5 and 8 are positive and significant at a 1% significance level (For Model 4 t = 15.74; p < .01).6 It can be seen from the Table 2 that the results of students who like studying math are higher than those of students who do not.
Regarding the effect of family characteristics on students’ math success, the father’s educational background (FATHEREDU), in particular, comes to the fore. As shown in Table 2, the higher the educational level of the father, the higher the success rates of students in math. The coefficient of this variable, in all models where it is added, is positive and significant at a 1% significance level (For Model 6 t = 5.14; p < .01).7 This finding draws attention to the relevance of the level of parental education on their children’s educational achievement. Also, the less often that families control students’ homework, the higher the students’ success rate (t = 7.02; p < .01).8
The DISADVANTAGED variable model approximates students’ household income levels and includes effects of the society in which they live. According to this model, if more than half of students’ families are low-income, this will negatively impact students’ scores (t = -1.95; p < .10).9 Moreover, a school with a high (HIGH) or middle (MIDDLE) general income level will positively impact student performance in that region. This Table shows that coefficients of applicable variables are statistically significant in most of the models where they are included. The gap between the success of a student living in a low-income region, versus a high-income region, may stem from socioeconomic differences.
6 The t-statistic is not involved directly in Table 2. It is created by the authors, thereby proportioning the coefficient of the applicable variable to the standard error.
7 The t-statistic is not involved directly in Table 2. It is created by the authors, thereby proportioning the coefficient of the applicable variable to the standard error.
8 The t-statistic is not involved directly in Table 2. It is created by the authors, thereby proportioning the coefficient of the applicable variable to the standard error.
9 This t-statistic is given for Model 6. Very close t-statistics are obtained for Models 7 and 8 as well.

Sulku, Abdioglu / Public and Private School Distinction, Regional Development Differences, and Other...
427
Discussion
This study reveals factors affecting the success of eighth-grade math students in Turkey. Statistical and econometric analyses were used alongside TIMSS 2011 data for Turkey.
When combined with classical linear regression models, the variables making a difference in the performance of eighth-grade math students in Turkey are: geographic region, rural/urban settlement, school type, father’s educational background, family location and economic status, ownership of educational and training materials, gender, and attitudes towards math.
In this study, the correlation matrix presented in Annex Table 1 is employed to investigate the problem of high degree multicollinearity. Correlation coefficients of .70 or higher indicate a high degree of collinearity. However; correlation coefficients in Annex Table 1 are very low. Except for two cases, all are under .40, and most are below .20. The correlation between ADVANTAGED, (the student comes from an advantaged region) and DISADVANTAGED (the student comes from a disadvantaged region) was −.484. In addition, a −.96, almost perfect, negative correlation existed when general income level was LOW or MIDDLE, in the region where the school is located. The aforementioned variables are included in
Table 2Findings of the Regression AnalysisVariables Model 1 Model 2 Model 3 Model 4 Model 5 Model 6 Model 7 Model 8
Constant 428.48a
(9.05)424.06a
(8.07)428.09a
(7.98)381.04a
(7.84)358.09a
(8.92)400.69a
(13.59)355.28a
(13.25)319.06a
(12.80)
EGE 2.67(13.28)
0.42(12.26)
0.28(12.20)
2.17(12.08)
0.37(11.98)
1.05(10.27)
2.37(9.02)
4.58(8.74)
BLACK 6.70(12.18)
8.58(11.38)
8.27(11.35)
7.52(11.37)
6.09(11.24)
16.30c
(8.89)15.98c
(8.56)15.41c
(8.60)
MIDDAN -1.94(12.88)
-2.48(11.85)
-2.72(11.86)
-2.23(11.58)
-3.68(11.46)
-2.58(11.25)
0.63(10.96)
1.01(10.47)
EAST -30.19b
(12.90)-23.53b
(10.47)-23.33b
(10.44)-26.06b
(10.90)-28.62a
(10.89)-4.87(9.45)
-6.75(8.61)
-8.26(9.00)
MEDITER -9.19(12.89)
-8.30(11.69)
-8.62(11.61)
-9.15(11.29)
-9.51(11.13)
-1.69(11.43)
-0.76(11.36)
-1.35(10.80)
SOUTHE -43.57a
(14.20)-36.75a
(13.35)-36.89a
(13.38)-38.92a
(13.14)-41.93a
(12.97)-12.23(12.10)
-10.76(11.13)
-12.00(11.03)
URBAN 41.48a
(7.64)38.26a
(7.30)38.17a
(7.27)37.92a
(7.24)40.29a
(7.22)18.45a
(7.00)8.42
(7.17)8.71
(7.05)
PRIVATE 149.80a
(33.90)149.67a
(33.90)146.93a
(31.93)145.62a
(30.91)106.93a
(31.67)81.42a
(29.17)79.89a
(27.61)
SEX -7.54b
(3.25)-6.32b
(3.17)-1.59(3.12)
-1.98(3.01)
LIKEMATH 57.14a
(3.63)58.22a
(3.87)51.44a
(3.49)
HOMEWORK 8.85a
(1.26)
BOOK 27.21a
(1.59)25.78a
(1.59)
FATHEREDU 6.23a
(1.21)3.73a
(1.08)3.87a
(1.08)
DISADVANTAGED -18.95c
(9.68)-16.26c
(8.96)-17.94b
(8.72)
HIGH 44.04b
(21.86)31.92c
(18.56)23.94
(18.78)
MIDDLE 19.89b
(7.81)15.48b
(7.41)14.29b
(7.13)
COMPUTER 33.50a
(3.88)20.28a
(3.48)21.46a
(3.40)
SCHOOLCOM 6.14(4.86)
7.22(4.64)
4.96(4.53)
R2 0.10 0.11 0.11 0.14 0.15 0.23 0.23 0.26F 109.84a 106.89a 95.00a 112.60a 110.95a 147.49a 137.64a 142.81a
n* 6928 6928 6928 6928 6928 6928 6928 6928a, b, and c state that relevant coefficients are significant at 1%, 5%, and 10% levels, respectively. *This observation of 6,928 represents a population of 1,165,721. Standard errors and number of observations are adjusted in the study using complex survey weights specified by TIMSS. The values in parenthesis indicate standard errors.

E d u c a t i o n a l S c i e n c e s : T h e o r y & P r a c t i c e
428
Models 6, 7, and 8, and ADVANTAGED and LOW variables are excluded from the models to avoid high degree multicollinearity. Since multiregression models were used in the study, one cannot assess high degree multicollinearity by considering only the correlation coefficients. Therefore, all regression models (Models 1 to 8) were analyzed, and no indications of high degree multi-collinearity were encountered (that is, low and insignificant t-statistics against high R2). Besides, coefficient estimations of regression models ensured the signs anticipated in the literature, as discussed below. Thus, there are no high degree multicollinearity problems in the models created.
One of the most striking findings of our study is the significance of the effect on success of regional differences in Turkey. The success of students living in the Eastern Anatolia and Southeastern Anatolia regions is significantly lower than that of students living in other regions. The Eastern Anatolia and Southeastern Anatolia regions are the most disadvantageous, in terms of investment distribution, because of population, geography, and security. Indeed, the lack of sufficient infrastructure and facilities for education and training in Eastern regions is the main reason for this result. A similar difference reveals itself in the urban/rural distinction. The performance of students in rural areas, where restrictions exist regarding access to education, are lower than that of students in cities, who are closer to educational facilities. Regarding regional differences, our findings support the results of Alacacı and Erbaş (2010) and Gümüş and Atalmış (2012). Our results used the most up-to-date data for assessing student success and parallel results reached using earlier data sets. This indicates that regional differences continue to affect student success in Turkey.
Another important finding of this analysis is that student success differs according to school types. The average math score of students in private schools is at least 80 points higher than that of public school students. This finding can be explained by the different quality of facilities in private versus public schools. In particular, the number of students per classroom, the number of teachers per student, and the amount of material per student are substantial issues to consider when evaluating student success (Bakioğlu & Polat, 2002; Uludağ & Odacı, 2002; Yaman, 2006). This study also finds that educational and training materials owned by students have a significant positive impact on student success. Moreover, students’ math achievement increases, according to the results of the regression analysis, with the higher
economic condition of a student’s family and society. Therefore, the success difference between private and public schools also can be explained by differences in household income levels. This study’s findings, regarding the different of success levels of students by school type, supports the findings of Alacacı and Erbaş (2010), Berberoğlu and Kalender (2005), and Gümüş and Atalmış (2012).
This study also finds a difference in students’ math success based on gender: female eighth-grade students are more successful than male students. While these finding parallels those of Yücel et al. (2013) and Zopluoğlu (2013), it does not coincide with those of Alacacı and Erbaş (2010). Attitudes of students toward mathematics also significantly impacts success. According to this study, students who like math are more successful than those who do not. Hence, Anıl (2009), Öztürk and Uçar (2010), Bayraktar (2010), and Anıl (2011) emphasized that a student’s attitude toward a lesson positively affects his success.
Moreover, we find that the educational status of the student’s father positively affects success in math. While parents with a high level of education are aware of the importance of education, they also may direct material resources to training, to ensure that their children get a better education. While the relevant results parallel the findings of Anıl (2009), Bayraktar (2010), Yalçın et al. (2012), Oral and McGivney (2013), and Abazaoğlu et al. (2014), they do not coincide with the findings of Mohammadi et al. (2011).
In conclusion, this study’s findings indicate that regional differences are critical for student success in mathematics. Success is significantly lower in disadvantaged regions. In addition, success differences can be attributed to the distinctions between private and public schools. Consequently, to correct these differences between private and public schools in Turkey, medium- and long-term educational policies are needed. To improve the quality of education, public school policies also should be established to minimize regional differences.
This study provides feedback for policy makers and those working in the educational sector. It determines factors affecting the success of primary school students through classical linear regression analysis, using TIMSS 2011 data. The TIMSS survey will be prepared again in 2015. It is essential to continuously monitor the educational progress of Turkey between 2011 and 2015 and to compare it with other countries, using internationally accepted data sets such as TIMSS and PIRLS. Such an evaluation can determine if reforms made in the educational system have achieved the desired

Sulku, Abdioglu / Public and Private School Distinction, Regional Development Differences, and Other...
429
success, can make possible decisions regarding the school differences that could be eliminated, and can suggest regional and socioeconomic changes necessary to improve students’ achievement. As a consequence, studies assessing the success of
Turkish educational system, using statistical and econometric approaches, are required in future to provide necessary feedback for the implementation of correct educational policies.
ReferencesAbazaoğlu, İ., Yıldızhan, Y., & Yıldırım, O. (2014). TIMSS 2011 Türkiye 8. sınıf fen bilimleri sonuçlarının değerlendirilmesi. Eğitim ve Öğretim Araştırmaları Dergisi, 3(1), 278-288.Alacacı, C., & Erbaş, A. K. (2010). Unpacking the inequality among Turkish schools: Findings from PISA 2006. International Journal of Educational Development, 30, 182-192.Anıl, D. (2009). Uluslararası öğrenci başarılarını değerlendirme programı (PISA)’nda Türkiye’deki öğrencilerin fen bilimleri başarılarını etkileyen faktörler. Eğitim ve Bilim Dergisi, 152, 87-100.Anıl, D. (2011). Türkiye’nin PISA 2006 fen bilimleri başarısını etkileyen faktörlerin yapısal eşitlik modeli ile incelenmesi. Kuram ve Uygulamada Eğitim Bilimleri, 11(3), 1253-1266.Atar, H. Y., & Atar, B. (2012). Türk eğitim reformunun öğrencilerin TIMSS 2007 fen başarılarına etkisinin incelenmesi. Kuram ve Uygulamada Eğitim Bilimleri, 12(4), 2621-2636.Badr, M., Morrissey, O., & Appleton, S. (2012). Determinants of educational attainment in Mena. CREDIT Research Paper, 12(3), 1-38. Bakioğlu, A., & Polat, N. (2002). Kalabalık sınıfların etkileri, bir ön araştırma çalışması. Eğitim Araştırmaları Dergisi, 7,147-156.Barro, R. J., & Lee, J. W. (1993). International comparisons of educational attainment. Journal of Monetary Economics, 32, 363-394.Barro, R. J., & Lee, J. W. (1996). International measures of schooling years and schooling quality. American Economic Review, 86(2), 218-223.Barro, R. J., & Lee, J. W. (2001). International data on educational attainment: Updates and implications. Oxford Economic Paper, 3, 541-563.Barro, R. J., & Lee, J. W. (2010). A new data set of educational attainment in the world, 1950-2010. NBER Working Paper, 15902, 1-47.Barro, R. J. (2013). Education and economic growth. Annals of Economics and Finance, 14(2), 301-328.Bayraktar, Ş. (2010). Uluslararası fen ve matematik çalışması (TIMSS 2007) sonuçlarına göre Türkiye’de fen eğitiminin durumu: Fen başarısını etkileyen faktörler. Selçuk Üniversitesi Ahmet Keleşoğlu Eğitim Fakültesi Dergisi, 30, 249-270.Berberoğlu, G., & Kalender, İ. (2005). Öğrenci başarısının yıllara, okul türlerine, bölgelere göre incelenmesi: ÖSS ve PISA analizi. Eğitim Bilimleri ve Uygulama, 4(7), 21-35.
Buluç, B. (2014). TIMSS 2011 sonuçları çerçevesinde, okul iklimi değişkenine göre öğrencilerin matematik başarı puanlarının analizi. Gazi Üniversitesi Endüstriyel Sanatlar Eğitim Fakültesi Dergisi, 33, 105-121.Çelen, F. K., Çelik, A., & Seferoğlu, S. S. (2011, February). Türk eğitim sistemi ve PISA sonuçları. Paper presented at the İnönü Üniversitesi Akademik Bilişim Konferansı, İnönü Üniversitesi, Malatya, Turkey. Chen, O. (2013, June). A multilevel analysis of mathematically low-achieving students in Singapore. Paper presented at the 5th IEA International Research Conference, Singapore.Eğitimi Araştırma Geliştirme Dairesi Başkanlığı. (2003a). TIMSS 1999 üçüncü uluslararası matematik ve fen bilgisi çalışması ulusal raporu. Ankara: Milli Eğitim Basımevi.Eğitimi Araştırma Geliştirme Dairesi Başkanlığı. (2003b). PIRLS 2001 uluslararası okuma becerilerinde gelişim projesi ulusal raporu. Ankara: Milli Eğitim Basımevi.Eğitimi Araştırma Geliştirme Dairesi Başkanlığı. (2005). PISA 2003 projesi ulusal nihai raporu. Ankara: Milli Eğitim Basımevi.Eğitimi Araştırma Geliştirme Dairesi Başkanlığı. (2007). PISA 2006 uluslararası öğrenci değerlendirme programı ulusal ön raporu. Ankara: Milli Eğitim Basımevi.Eğitimi Araştırma Geliştirme Dairesi Başkanlığı. (2010). PISA 2009 uluslararası öğrenci değerlendirme programı ulusal ön raporu. Ankara: Milli Eğitim Basımevi.Enck, R. (2011). A study of the relationships between student achievement on the TIMSS-2007 and constructivist teaching pedagogy and class size. Education Doctoral, 50, 1-122.Gujarati, D. N., & Porter, D. C. (2009). Basic econometrics. New York, NY: McGraw-Hill.Gümüş, S., & Atalmış, E. H. (2012). Achievement gaps different school types and regions in Turkey: Have they changed over time? Mevlana International Journal of Education, 2(2), 50-66.Güner, N., Sezer, R., & Akkuş İspir, O. (2013). İlköğretim ikinci kademe öğretmenlerinin TIMSS hakkındaki görüşleri. Pamukkale Üniversitesi Eğitim Fakültesi Dergisi, 33, 11-29.Gür, B. S., Çelik, Z., & Özoğlu, M. (2012). Policy options for Turkey: A critique of the interpretation and utilization of PISA results in Turkey. Journal of Education Policy, 27(1), 1-21. Hanushek, E. A., & Woessman, L. (2010). The cost of low educational achievement in the European Union. EENEE Analytical Report, 1-51.Hanushek, E. A., & Woessman, L. (2012). Schooling, educational achievement, and the Latin American growth puzzle. Journal of Development Economics, 99, 497-512.

E d u c a t i o n a l S c i e n c e s : T h e o r y & P r a c t i c e
430
Hanushek, E. A. (2009). School policy: Implications of recent research for human capital investments in South Asia and other developing countries. Education Economics, 17(3), 291-313.Ibourk, A. (2013). Determinants of educational achievement in Morocco: A micro-econometric analysis applied to the TIMSS study. International Education Studies, 6(12), 25-36.Martin, M. O., & Mullis, I. V. S. (Eds.). (2012). Methods and procedures in TIMSS and PIRLS 2011. Chestnut Hill, MA: TIMSS & PIRLS International Study Center, Boston College. Mincer, J. (1958). Investment in human capital and the personal income distribution. Journal of Political Economy, 66(4), 281-302.Mincer, J. (1974). Schooling, experience, and earnings. New York, NY: Columbia University Press for the National Bureau of Economic Research.Mohammadi, H., Akkoyunlu, P., & Şeker, M. (2011). School resources, family characteristics and student performance: Evidence from secondary school entrance exam in Turkey. Eğitim ve Bilim Dergisi, 159, 155-164.Oral, I., & McGivney, E. (2013). Türkiye’de matematik ve fen bilimleri alanlarında öğrenci performansı ve başarının belirleyicileri: TIMSS 2011 analizi. Eğitim Reformu Girişimi Analiz Raporu. Retrieved from http://erg.sabanciuniv.edu/sites/erg.sabanciuniv.edu/files/ERG%20-TIMSS%202011%20Analiz%20Raporu-03.09.2013.pdf Özer, Y., & Anıl, D. (2011). Öğrencilerin fen ve matematik başarılarını etkileyen faktörlerin yapısal eşitlik modeli ile incelenmesi. Hacettepe Üniversitesi Eğitim Fakültesi Dergisi, 41, 313-324. Özgün-Koca, S. A., & Şen, A. İ. (2002). 3. Uluslararası matematik ve fen bilgisi çalışması-Tekrar sonuçlarının Türkiye için değerlendirilmesi. Hacettepe Üniversitesi Eğitim Fakültesi Dergisi, 23, 145-154.Öztürk, D., & Uçar, S. (2010). TIMSS verileri kullanılarak Tayvan ve Türkiye’deki 8. sınıf öğrencilerinin fen başarışına etki eden faktörlerin belirlenmesi ve karşılaştırılması. Çukurova Üniversitesi Sosyal Bilimler Enstitüsü Dergisi, 19(3), 241-256.
Psacharopoulos, G. (1973). Returns to education: An international comparison. San Francisco, CA: Elsevier, Jossey-Baas.Psacharopoulos, G. (1985). Returns to education: A further international update and implication. The Journal of Human Resources, 20(4), 583-597.Psacharopoulos, G. (1994). Returns to investment in education: A global update. World Development, 22(9), 1325-1340.Şirin, S. R. (2005). Socioeconomic status and academic achievement: A meta-analytic review of research. Review of Educational Research, 75(3), 417-453.TIMSS veri seti (2011). TIMSS data set. Retrieved from http://timssandpirls.bc.edu/timss2011/international-database.html Uludağ, Z., & Odacı, H. (2002). Eğitim öğretim faaliyetlerinde fiziksel mekan. Milli Eğitim Dergisi, 153-154. Retrieved from http://dhgm.meb.gov.tr/yayimlar/dergiler/Milli_Egitim_Dergisi/153-154/uludag.htmUzun, S., Bütüner, S. Ö., & Yiğit, N. (2010). A comparison of the results of TIMSS 1999-2007: The most successful five countries: Turkey sample. Elementary Education Online, 9(3), 1174-1188.Yalçın, M., Aslan, S., & Usta, E. (2012). Analysis of PISA 2009 exam according to some variables. Mevlana International Journal of Education, 2(1), 64-71.Yaman, E. (2006). Eğitim sistemindeki sorunlardan bir boyut: Büyük sınıflar ve sınıf yönetimi. Gazi Üniversitesi Türk Eğitim Bilimleri Dergisi, 4(3), 261-274.Yenilik ve Eğitim Teknolojileri Genel Müdürlüğü. (2014). Tanıtım. Retrieved from http://yegitek.meb.gov.tr/www/tanitim/icerik/16 Yücel, C., Karadağ, E., & Turan, S. (2013). TIMSS 2011 Ulusal ön değerlendirme raporu. Eskişehir Osmangazi Üniversitesi Eğitim Fakültesi Eğitimde Politika Analizi Raporlar Serisi 1, 1-38. Zopluoğlu, C. (2013). V. Uluslararası matematik ve fen eğilimleri araştırması (TIMSS) Türkiye değerlendirmesi: Matematik. Siyaset, Ekonomi ve Toplum Araştırmaları Vakfı, 64, 1-14.

Sulku, Abdioglu / Public and Private School Distinction, Regional Development Differences, and Other...
431
Ann
ex T
able
1Co
rrela
tion
Mat
rix
(1)*
(2)
(3)
(4)
(5)
(6)
(7)
(8)
(9)
(10)
(11)
(12)
(13)
(14)
(15)
(16)
(17)
(18)
(19)
(20)
(21)
BOO
K (1
)1
CO
MPU
TER
(2)
0.34
5 a1
SCH
OO
LCO
M (3
)-0
.022
a-0
.05 a
1
SEX
(4)
-0.0
59 a
0.01
8 a-0
.036
a1
EGE
(5)
0.02
3 a0.
063 a
0.01
1 a-0
.001
1
BLA
CK
(6)
-0.0
25 a
-0.0
53 a
0.04
5 a-0
.016
a-0
.108
a1
MID
DA
N (7
)0.
002 b
0.05
7 a0.
022 a
-0.0
14 a
-0.1
4 a-0
.151
a1
EAST
(8)
-0,0
28 a
-0.1
28 a
0.08
7 a0.
028 a
-0.0
98 a
-0.1
06 a
-0.1
37 a
1
MA
RM (9
)0.
1 a0.
222 a
-0.1
14 a
0.02
a-0
.199
a-0
.215
a-0
.277
a-0
.195
a1
MED
ITER
(10)
-0.0
15 a
-0.0
53 a
0.02
1 a-0
.02 a
-0.1
31 a
-0.1
41 a
-0.1
82 a
-0.1
28 a
-0.2
6 a1
SOU
THE
(11)
-0.0
95 a
-0.2
06 a
-0.0
17 a
0-0
.12 a
-0.1
29 a
-0.1
66 a
-0.1
17 a
-0.2
37 a
-0.1
56 a
1
PRIV
ATE
(12)
0.25
4 a0.
148 a
0.06
2 a-0
.008
a0.
042 a
-0.0
09 a
0.03
3 a-0
.061
a0.
039 a
0.00
7 a-0
.074
a1
URB
AN
(13)
0.23
7 a0.
299 a
-0.0
59 a
-0.0
08 a
0.01
3 a-0
.094
a0.
025 a
-0.0
72 a
0.13
7 a-0
.036
a-0
.038
a0.
057 a
1
LIK
EMAT
H (1
4)0.
061 a
-0.0
11 a
0.06
5 a-0
.028
a-0
.032
a0.
005 a
-0.0
17 a
0.03
1 a-0
.01 a
0.00
3 a0.
027 a
0.01
8 a0.
001
1
DIS
AD
VAN
TAG
ED (1
5)-0
.233
a-0
.27 a
-0.0
19 a
0.00
5 a-0
.023
a0.
02 a
-0.1
07 a
0.11
8 a-0
.059
a-0
.084
a0.
191 a
-0.2
33 a
-0.1
a0.
016 a
1
AD
VAN
TAG
ED (1
6)0.
21 a
0.20
9 a0.
016 a
-0.0
12 a
-0.0
18 a
-0.0
31 a
0.03
a-0
.066
a0.
049 a
0.09
9 a-0
.104
a0.
481 a
0.07
5 a-0
.005
a-0
.484
a1
HO
MEW
ORK
(17)
-0.1
09 a
-0.0
95 a
-0.0
29 a
-0.1
35 a
-0.0
08 a
0.02
a0.
02 a
0.01
5 a-0
.076
a-0
.001
0.05
8 a-0
.019
a-0
.097
a-0
.096
a0.
031 a
-0.0
04 a
1
FATH
ERED
U (1
8)0.
295 a
0.24
a-0
.02 a
0.03
4 a0.
01 a
-0.0
13 a
0.04
9 a-0
.01 a
0.02
3 a-0
.006
a-0
.068
a0.
23 a
0.13
5 a0.
001
-0.2
38 a
0.22
5 a-0
.04 a
1
HIG
H (1
9)0.
062 a
0.06
7 a-0
.001
-0.0
04 a
0.10
4 a-0
.033
a-0
.043
a-0
.03 a
-0.0
61 a
-0.0
4 a0.
139 a
-0.0
19 a
0.05
a0.
032 a
-0.1
7 a0.
062 a
-0.0
07 a
0.06
2 a1
MID
DLE
(20)
0.22
6 a0.
263 a
0.02
6 a-0
.001
0.01
5 a-0
.026
a0.
145 a
-0.0
85 a
0.09
8 a-0
.012
a-0
.198
a0.
203 a
0.10
7 a0.
005 a
-0.4
87 a
0.23
9 a-0
.056
a0.
207 a
-0.0
93 a
1
LOW
(21)
-0.2
41 a
-0.2
84 a
-0.0
28 a
0.00
1-0
.028
a0.
04 a
-0.1
27 a
0.09
8 a-0
.095
a-0
.004
a0.
179 a
-0.1
95 a
-0.1
27 a
-0.0
14 a
0.46
a-0
.286
a0.
061 a
-0.2
21 a
-0.0
97 a
-0.9
6 a1
a, b
and
c sta
tes t
hat r
eleva
nt co
effici
ents
are s
igni
fican
t in
1%, 5
% an
d 10
% si
gnifi
canc
e lev
els re
spec
tively
. *: S
eque
nce n
umbe
r allo
cate
d fo
r the
relev
ant e
xplan
ator
y var
iabl
e is s
tate
d in
par
enth
esis.
It w
as en
sure
d to
fit A
nnex
Tab
le
1 in
to o
ne p
age t
here
by u
sing
such
sequ
ence
num
bers
inste
ad o
f the
nam
es o
f var
iabl
es in
colu
mns
. The v
alues
on
top
of th
e dia
gona
l wer
e not
giv
en si
nce c
orre
latio
n m
atrix
is sy
mm
etric
.