Public Affairs Index 2016 report
118
INDEX PUBLIC AFFAIRS Governance in the States of India | 2016 10 Themes | 25 Focus Subjects | 68 Indicators Dr. C.K.Mathew | Athreya Mukunthan | Vivek Divekar Committedtogoodgovernance PUBLIC AFFAIRS CENTRE www.pai.pacindia.org www.publicaffairsindex.in
description
A ranking of Indian States on Governance. Can governance be measured in an objective manner using data available in the public domain so as to capture the essence of this quality of governance? Can we identify the critical aspects of governance and use the same for comparison between the States? Can we assign scores and ranks to the States based on the aggregation of the data in various key areas of governance? These were the issues that attracted the curiosity of Public Affairs Centre and prompted it to undertake this study.
Transcript of Public Affairs Index 2016 report

INDEXPUBLIC
AFFAIRSGovernance in the States of India | 2016
10 Themes | 25 Focus Subjects | 68 Indicators
Dr. C.K.Mathew | Athreya Mukunthan | Vivek Divekar
Committed to good governancePUBLIC AFFAIRS CENTRE www.pai.pacindia.org
www.publicaffairsindex.in


AF IF RSA IC NI DLB EXUP
Copyright © 2016 Public Affairs Centre
Public Affairs Index - Governance in the States of India - 2016
Authors: Dr. C.K.Mathew, Athreya Mukunthan, Vivek Divekar for the Public Affairs Centre.
ISBN: 978-81-88816-98-9
Public Affairs Centre (PAC) is a not for profit organization, established in 1994 that is dedicated to improving the quality of governance in India. The focus of PAC is primarily in areas where citizens and civil society organizations can play a proactive role in improving governance. In this regard, PAC undertakes and supports research, disseminates research findings, facilitates collective citizen action through awareness raising and capacity building activities, and provides advisory services to state and non-state agencies.
Public Affairs CentreNo. 15, KIADB Industrial AreaBommasandra – Jigani Link RoadBangalore 562106 IndiaPhone +91 (0) 80 278 399 18 / 19 / [email protected]
Copyright © 2016 Public Affairs Centre
Some rights reserved. Content in this publication can be freely shared, distributed, or adapted. However, any work, adapted or otherwise, derived from this publication must be attributed to Public Affairs Centre, Bangalore. This work may not be used for commercial purposes.
Website design : Shaibig Infosystems & Solutions www.shaibiginfosystem.com
Book & PAI Logo design : Mallikarjun R Hosmath [email protected]
Printed in Bangalore at -------------
FAIF RA S IC NIL DB EXUP
www.pai.pacindia.org
www.publicaffairsindex.in
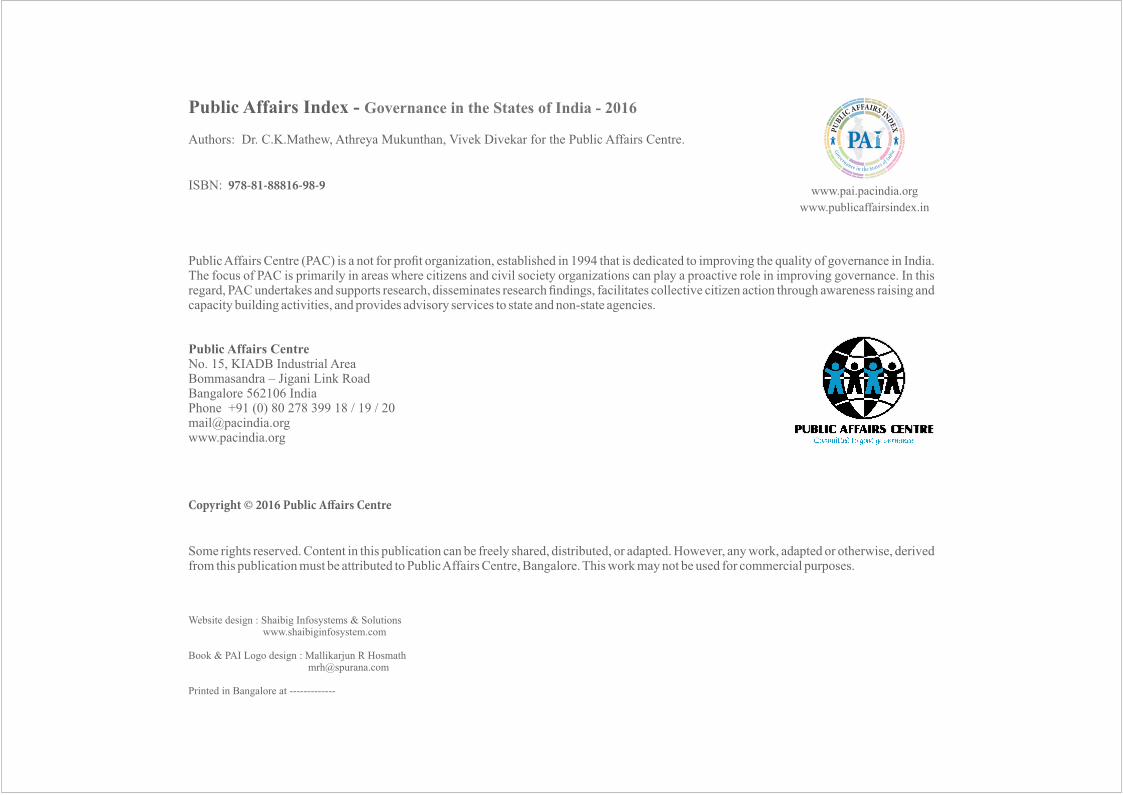
This report is dedicated to the memory of Dr. Samuel Paul.
AF IF RSA IC NI DLB EXUP
Public Affairs Index Measuring the quality of governance of Indian states
Although good governance has always been the objective of all governments across the world, it was from the early 1990's, that
many international institutions like the World Bank started emphasising that “Good Governance” is a necessary condition for
fast and inclusive development in any economy. Lately, there has been renewed focus in the country about governance
processes and institutions to evaluate the quality and levels of governance. In a federal country like India, where the
responsibilities and duties of the State Governments have been listed out clearly in the Constitution, the role of the States to
achieve high levels of governance gains more importance.
Can governance be measured in an objective manner using data available in the public domain so as to capture the essence of
this quality of governance? Can we identify the critical aspects of governance and use the same for comparison between the
States? Can we assign scores and ranks to the States based on the aggregation of the data in various key areas of governance?
These were the issues that attracted the curiosity of Public Affairs Centre and prompted it to undertake the study.
The Public Affairs Index (PAI) is an attempt to bring together the states of the country which are culturally, economically and
socially diverse, into a common data-driven framework, to facilitate an interstate comparison. A well-framed methodology
backed by statistical data from government sources, have been included in the study to provide insights into the subject.
www.pai.pacindia.org
www.publicaffairsindex.in

PUBLIC AFFAIRS INDEXGovernance in the States of India | 2016
10 Themes | 25 Focus Subjects | 68 Indicators
Dr. C.K.Mathew | Athreya Mukunthan | Vivek Divekar
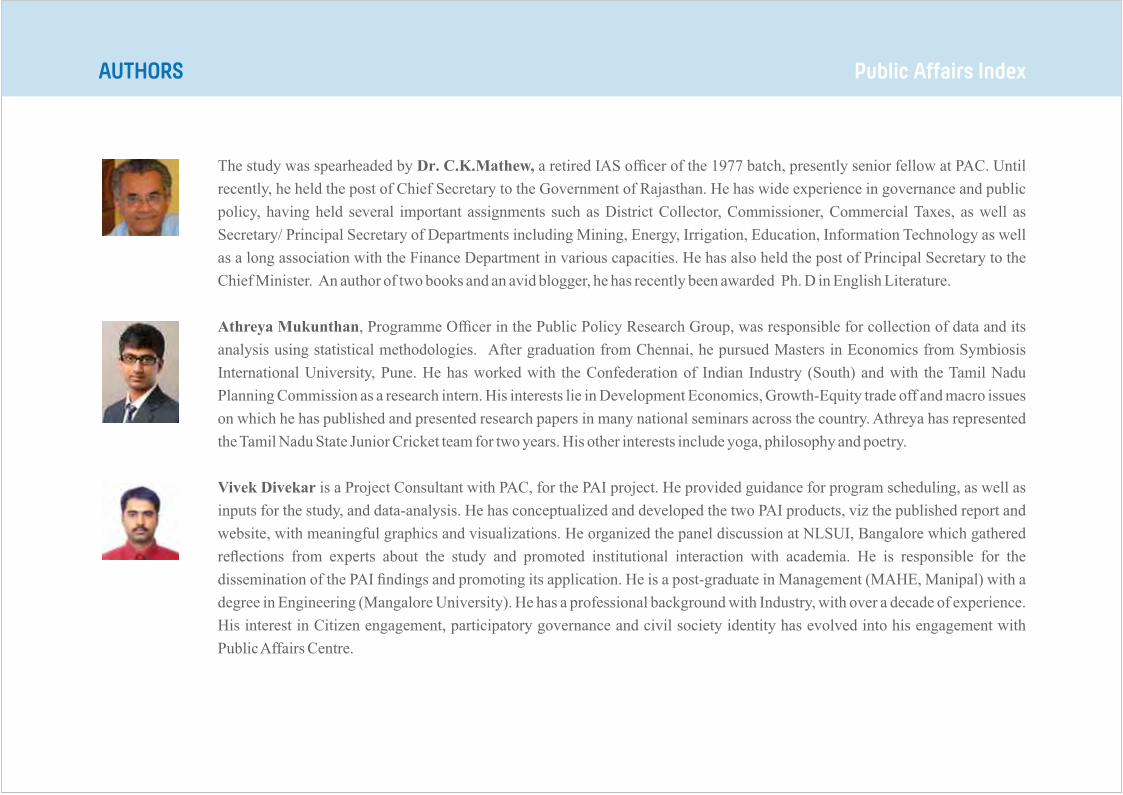
The study was spearheaded by Dr. C.K.Mathew, a retired IAS officer of the 1977 batch, presently senior fellow at PAC. Until
recently, he held the post of Chief Secretary to the Government of Rajasthan. He has wide experience in governance and public
policy, having held several important assignments such as District Collector, Commissioner, Commercial Taxes, as well as
Secretary/ Principal Secretary of Departments including Mining, Energy, Irrigation, Education, Information Technology as well
as a long association with the Finance Department in various capacities. He has also held the post of Principal Secretary to the
Chief Minister. An author of two books and an avid blogger, he has recently been awarded Ph. D in English Literature.
Athreya Mukunthan, Programme Officer in the Public Policy Research Group, was responsible for collection of data and its
analysis using statistical methodologies. After graduation from Chennai, he pursued Masters in Economics from Symbiosis
International University, Pune. He has worked with the Confederation of Indian Industry (South) and with the Tamil Nadu
Planning Commission as a research intern. His interests lie in Development Economics, Growth-Equity trade off and macro issues
on which he has published and presented research papers in many national seminars across the country. Athreya has represented
the Tamil Nadu State Junior Cricket team for two years. His other interests include yoga, philosophy and poetry.
Vivek Divekar is a Project Consultant with PAC, for the PAI project. He provided guidance for program scheduling, as well as
inputs for the study, and data-analysis. He has conceptualized and developed the two PAI products, viz the published report and
website, with meaningful graphics and visualizations. He organized the panel discussion at NLSUI, Bangalore which gathered
reflections from experts about the study and promoted institutional interaction with academia. He is responsible for the
dissemination of the PAI findings and promoting its application. He is a post-graduate in Management (MAHE, Manipal) with a
degree in Engineering (Mangalore University). He has a professional background with Industry, with over a decade of experience.
His interest in Citizen engagement, participatory governance and civil society identity has evolved into his engagement with
Public Affairs Centre.
AUTHORS Public Affairs Index

This report was made possible by the vision and guidance of the late Dr Samuel Paul, who nurtured the Public Affairs Centre during the last two
decades. The conceptualisation of the framework for evaluating the quality and levels of governance of the States of India was undertaken under his
tutelage. His passing away during the course of the writing of this report was a blow to us all. This report is dedicated to him.
This team received the unstinted support of interns responsible for collection and validation of data sets and the related number crunching. They are
Priyanka Agarwal, Udita Datta, (both from Symbiosis School of Economics) and Vrashali Khandelwal and Arghadeep (both from AzimPremji
University, Bangalore). In the initial stages, Nikhil John from Christ College assisted in the data collection. In addition, we have consulted with
experts and other informed groups extensively. Special mention must be made of Dr. Suraj Jacob from the faculty of the Azim Premji University, and
Prof Roudra from Alliance University who made incisive suggestions regarding the statistical methodology used in the study. Sentiment Analysis
report was contributed by CPC Pvt. Ltd. Distinguished panelists such as, Mr. D. Thangaraj, former Information Commissioner, Karnataka, Mr. Vivek
Kulkarni, CEO of Brickworks, and Mrs Nirmala Murthy, member of the Board of the Public Affairs Foundation provided critical comments on the
completed work. Thanks are also due to Babu Mathew from the National Law School for facilitating intensive discussion with the students of NLS in
the course of the preparation of this report.
ACKNOWLEDGEMENTS
FAIF RA S IC NIL DB EU XP

AF IF RSA IC NI DLB EXUP
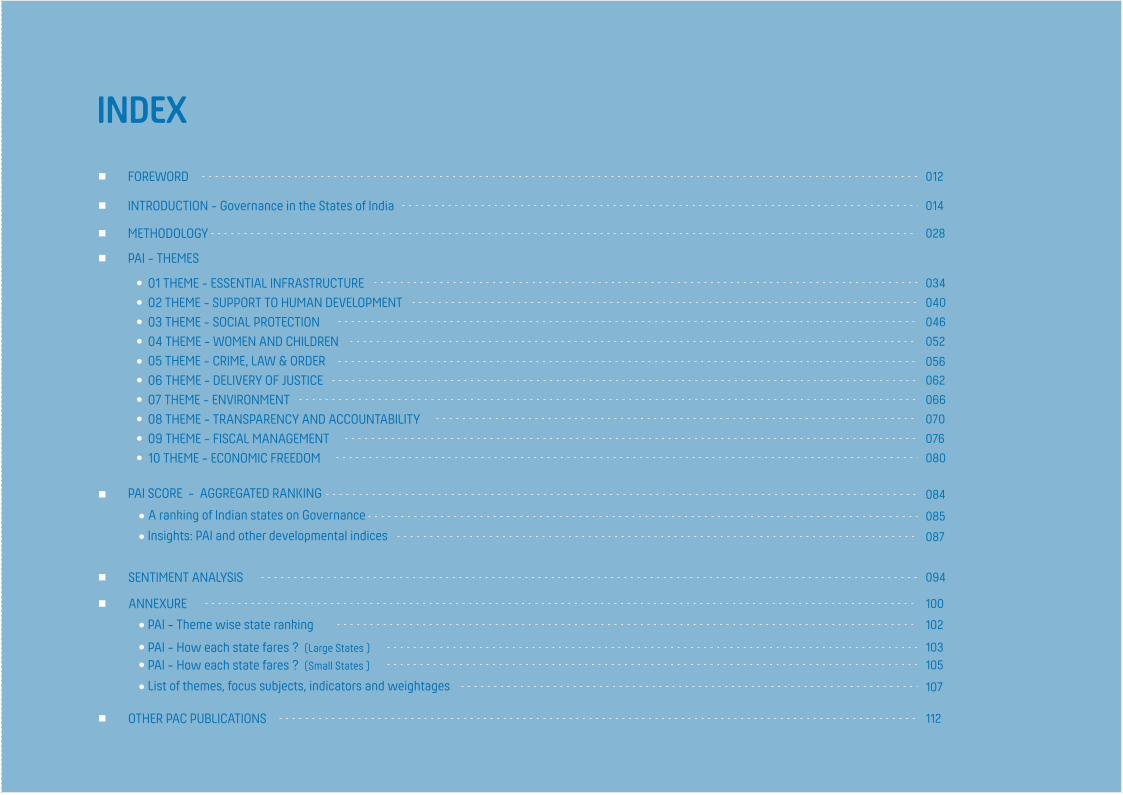
INDEX
FOREWORD
INTRODUCTION - Governance in the States of India
METHODOLOGY
PAI - THEMES
PAI SCORE - AGGREGATED RANKING
SENTIMENT ANALYSIS
OTHER PAC PUBLICATIONS
01 THEME - ESSENTIAL INFRASTRUCTURE02 THEME - SUPPORT TO HUMAN DEVELOPMENT03 THEME - SOCIAL PROTECTION04 THEME - WOMEN AND CHILDREN05 THEME - CRIME, LAW & ORDER06 THEME - DELIVERY OF JUSTICE07 THEME - ENVIRONMENT08 THEME - TRANSPARENCY AND ACCOUNTABILITY 09 THEME - FISCAL MANAGEMENT10 THEME - ECONOMIC FREEDOM
Insights: PAI and other developmental indices
A ranking of Indian states on Governance
ANNEXURE
PAI - Theme wise state ranking
PAI - How each state fares ? (Large States )
List of themes, focus subjects, indicators and weightages
012
014
028
034
040
046
052
056062
070
076
080
084
085
087
094
100
102
103
066
107
112
PAI - How each state fares ? (Small States ) 105

AF IF RSA IC NI DLB EXUP
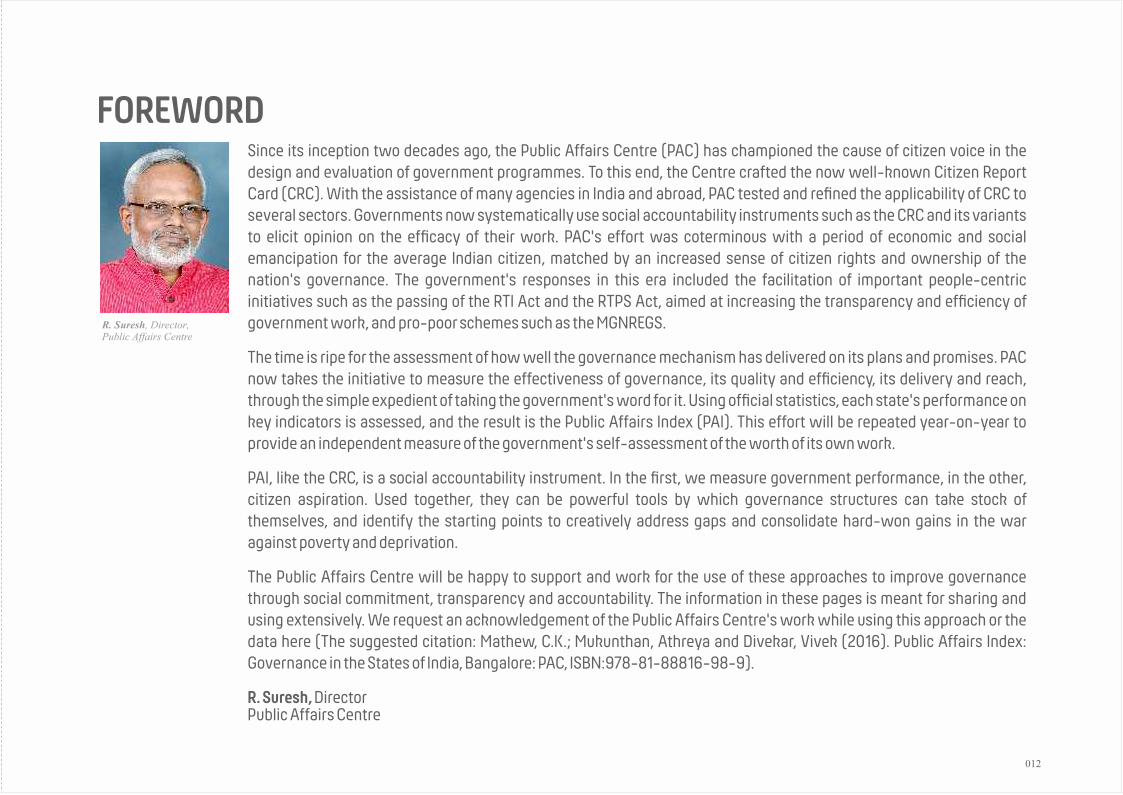
FOREWORDSince its inception two decades ago, the Public Affairs Centre (PAC) has championed the cause of citizen voice in the design and evaluation of government programmes. To this end, the Centre crafted the now well-known Citizen Report Card (CRC). With the assistance of many agencies in India and abroad, PAC tested and refined the applicability of CRC to several sectors. Governments now systematically use social accountability instruments such as the CRC and its variants to elicit opinion on the efficacy of their work. PAC's effort was coterminous with a period of economic and social emancipation for the average Indian citizen, matched by an increased sense of citizen rights and ownership of the nation's governance. The government's responses in this era included the facilitation of important people-centric initiatives such as the passing of the RTI Act and the RTPS Act, aimed at increasing the transparency and efficiency of government work, and pro-poor schemes such as the MGNREGS.
The time is ripe for the assessment of how well the governance mechanism has delivered on its plans and promises. PAC now takes the initiative to measure the effectiveness of governance, its quality and efficiency, its delivery and reach, through the simple expedient of taking the government's word for it. Using official statistics, each state's performance on key indicators is assessed, and the result is the Public Affairs Index (PAI). This effort will be repeated year-on-year to provide an independent measure of the government's self-assessment of the worth of its own work.
PAI, like the CRC, is a social accountability instrument. In the first, we measure government performance, in the other, citizen aspiration. Used together, they can be powerful tools by which governance structures can take stock of themselves, and identify the starting points to creatively address gaps and consolidate hard-won gains in the war against poverty and deprivation.
The Public Affairs Centre will be happy to support and work for the use of these approaches to improve governance through social commitment, transparency and accountability. The information in these pages is meant for sharing and using extensively. We request an acknowledgement of the Public Affairs Centre's work while using this approach or the data here (The suggested citation: Mathew, C.K.; Mukunthan, Athreya and Divekar, Vivek (2016). Public Affairs Index: Governance in the States of India, Bangalore: PAC, ISBN:978-81-88816-98-9).
R. Suresh, DirectorPublic Affairs Centre
012
R. Suresh, Director, Public Affairs Centre
AF IF RSA IC NI DLB EXUP

INTRODUCTION
Governance in the States of India
Since the late 1990s, a concern with governance as an
instrument to deliver the fruits of development and
human well-being has dominated international debate.
John Maynard Keynes once famously said: “The political
problem of mankind is to combine three things:
economic efficiency, social justice and individual
liberty.” Ever since, the ability of the State to deliver on all
three counts has been regarded as the touchstone for
good governance.
014

INTRODUCTION
Governance in the States of India
Since the late 1990s, a concern with governance as an instrument
to deliver the fruits of development and human well-being has
dominated international debate. John
Maynard Keynes once famously said:
“The political problem of mankind is to
combine three things: economic
efficiency, social justice and individual I
liberty.” Ever since, the ability of the
State to deliver on all three counts has
been regarded as the touchstone for good
governance.
In recent times though, a distinct ideological intervention has
increased the complexity of the debate. A major shift in focus
emerged after the 1989 World Bank
report on Sub-Saharan Africa which
examined why, despite the infusion of
resources into some of the poorest
countries of the world, there was no
commensurate improvement in the
levels of governance as well as quality ii
of the lives of the people.
Post 1991 and following the severe economic crisis India faced,
leading to new policies of deregulation and liberalisation, we too
became more sensitive to the international processes. Inevitably,
new doubts about the definition of governance were raised.
Derived from the neo-liberal thinking of structural adjustment,
and based strongly on the path-breaking World Bank
Development Report of 1997, the new intervention stressed that
governance cannot be restricted to only government, but it should
include within its ambit the private sector and civil society. “An
effective state is vital for the provision of goods and services –
and the rules and institutions – that allow markets to flourish and
people to live happier and healthier lives... Many said much the
same thing fifty years ago, but then they tended to mean that
development has to be state provided. The message of experience
since then is rather different, that the state is central to economic
and social development, not as a direct provider of growth but as a iii
partner, catalyst and facilitator.”
The United Nations Development Programme (UNDP) has also
taken a position that is not contradictory to the above. According
to it, “governance is defined as the
exercise of political, economic and
administrative authority to manage a
nation's affairs. It is the complex of
mechanisms, processes, relationships
and institutions through which citizens
articulate their interests, exercise their
rights and obligations and mediate their iv
differences.”
Changing thoughts on these processes, buttressed by the failure
of the great experiment of centralised state planning in many
countries of the World, not excluding India, as well as the collapse
of the Soviet Union and the Berlin Wall, was fast leading to the
drawing of a map where national boundaries were being blurred
and the integration of the international market was swiftly being
undertaken. This new perspective where the state, the private
sector and the civil society are seen as overlapping,
image source # 01
image source # 02
image source # 03
015

the dangers of the State disengaging itself from what
was hitherto considered its core functions, is the
possibility that these adjustments and reorientations
could adversely impact the lives of vulnerable people
who may slip through the cracks of the structural
adjustment programmes. We have seen examples of
this in the fierce implementation of economic policies
of Thatcher regime in UK and Reagan's in the US.
Other examples of nations reconstructing themselves
to achieve fast economic growth are also well-known.
The story of the four Asian Tigers, namely, Singapore,
Hong Kong, Taiwan and South Korea is also one such
example. The model of the European Union is yet
another example of collective growth over an entire
r e g i o n i n c l u d i n g 2 8
countries. There was much
debate in consequence
thereof, especially amongst
liberal and left-leaning
thinkers, who examined the
plight of the poor in the light
of the resultant emerging
s o c i a l a n d e c o n o m i c
equations.
In this context, it stands to the credit of India with its
large populations living below the poverty line that it
did not sell itself wholly to the idea of structural
adjustment; rather, it took several steps to provide the
necessary social security measures to insulate the
poorest from the possible impact of these cataclysmic
complementary and sometimes even competing
agencies of governance is a new vision that has
suffused all debate on governance and development
since the 1990s. The state creates the legal and political
environment, the private sector generates jobs and
income and the civil society facilitates political and
social interaction.
In these fast changing perspectives, it was inescapable
for the State to redefine its role. India's New Economic
Policy of 1991 is itself a good example of the country
reassessing its role and redefining what it can and
should do, and what it should not do. However, one of
FAIF RA S IC NIL DB EU XP
image source # 04
changes. Our Public Distribution System, our pension
schemes for the vulnerable, our Right to Education Act
providing free and compulsory education to the
children, our relatively inexpensive health care
systems, etc despite their often feeble delivery systems,
are examples of how the State has intervened to aid and
assist the vulnerable from the vagaries of the economy,
to effect redistributive justice and to provide some
quality of life to the poor.
image source # 05
‘Paradoxes abound have complicated the life of scholars grappling with the Indian situation... whatever inference, judgement or statement one may make about India, the exact opposite would be equally true as well. ... generalizations are extremely difficult.' - I.K. Gujral
016

INTRODUCTION
Governance and its dimensions.
Some of the identified pillars of good governance, as
emerging from the studies carried out by the World
Bank and the UNDP as well as other international
organisations are:
Ÿ The rule of law: incorporating stability ofgovernment, security of property, a reliablejudiciary and a relatively corruption-free system
Ÿ A benign policy environment: stable policy andlaw, strong macro-economic fundamentals,liberalisation of trade and investment, transparentpolicy making
Ÿ Fostering markets for growth and public services:Unfettered private sector in competition; Privatesector complementing the state in health, educationand infrastructure; creation of employment, etc
Ÿ Social sector responsibilities: protection of thevulnerable, inexpensive health and education,poverty reduction programmes leading to equitabledistribution, etc
Ÿ Accountability and Information: incorporatingsecond generation reforms such as transparency,accountability, focus on outcomes and not inputs,heeding the voice of the citizen and involving himin decision making and review, etc
While much has been said and written about
governance, it has not been easy to arrive at a
commonly shared meaning and definition of this term.
Experts and non-experts alike have given multiple
interpretations to the concept of public governance,
adding to the confusion about its nature and scope.
Some use the term interchangeably with government
and all the things it does. Others have focused more on
the processes of government. Some others interpret
governance as the exercise of public power, and hence
focus on public decision-making.
While, as we have seen, UNDP defines governance as
“the exercise of economic, political and administrative v
authority to manage a country's affairs at all levels” ,
the World Bank defines governance as “the way public
power is exercised through a country's economic, vi
political and social institutions” . According to the
Organisation for Economic Co-operation and
Development (OECD), governance encompasses “the
role of public authorities in establishing the
environment in which economic operators function in
determining the distribution of benefits as well as the vii
relationship between the ruler and the ruled” . Some
definitions go on to spell out the key features of good
governance, such as rule of law, transparency and
accountability. Some authors have widened the scope
of governance to include the state's interactions with
the private sector and civil society at large.
On a different plane, the inherent difficulties in
measuring economic progress and social development,
in terms other than growth and GDP, have always been
a concern for economists and political thinkers. The
report of the commission set up by the French viii
Government in 2008, chaired by Joseph Stiglitz, with
Amartya Sen and Jean-Paul Fitoussi as members,
recommends looking beyond statistics and data to
assess the governance of a country and its people's
well-being.
It is clear from these definitions and the difficulties
experienced in assessing the quality of life of a people,
that governance implies something that goes beyond
the formal structures of government. The mere
existence of a desired set of public institutions or
structural arrangements, however, is not enough. How
these institutions actually function is what the study of
governance should be about. A legislative body or a set
of social protection agencies may exist in a country.
The test of the country's governance, however, lies in
how well these institutions function and generate the
outcomes expected of them. A legislature that meets
rarely or fails to carry out its legislative programme
should rate low on governance. A social protection
agency that complies with laid down processes and
delivers the desired outcomes should rate high on
governance.
Admittedly, to achieve good governance, the structures
of government should be properly designed and put in
place. The necessary public institutions and the
resources they require for these structures to effectively
function should exist. But the quality of their
governance will be judged only by how well they
functioned and delivered the outcomes expected of
them.
The literature on corporate governance also reveals a
similar trend. The Cadbury Report in the UK (1992)
defined corporate governance as the “system by which ix
companies are directed and controlled” . The Owen
report (Australia, 2003) expands the concept as
follows: “Corporate governance refers to the legal and
017

FAIF RA S IC NIL DB EU XP
organizational framework within which, and the
principles and processes by which, corporations are
governed. It refers, in particular, to the powers,
accountability, and relationships of those who
participate in the direction and control of a company…
Understood in this way, the expression embraces not
only the models or systems themselves, but also the
practices by which that exercise and control of x
authority is in fact effected.” Thus, both public
governance and corporate governance signal the
importance of how the various dimensions of
governance actually function or perform.
Given the wide range of decisions and actions that
governments are required to take, a major challenge is
to identify those sectors and aspects of the work of the
government that are critical to an assessment of the
quality of governance. A degree of selectivity is clearly
called for as the scope of the study can become
unwieldy otherwise. Admittedly, in this process we are
bound to lose some information that might have given
us a more comprehensive understanding of the state of
governance. For instance, if interactions of the state
with civil society are considered a dimension of
governance worthy of study, detailed field surveys of
such interactions will be necessary to assess their
quality and outcomes. As this exercise can be costly
and time consuming, it needs to be excluded from the
scope of such studies in certain contexts. The rationale
for including or excluding certain dimensions needs to
be spelt out. Such choices are unavoidable as country
contexts and resource availability can vary across the
board. On the other hand, in democratic countries,
there is a fair degree of agreement on the importance of
certain essential dimensions or features of governance.
Transparency, accountability, public participation and
the absence of corruption are prominent among them.
To understand the wide scope of governance, we need
to comprehend and assess the quality of governance of
the numerous public institutions that constitute a State.
Millions of decisions and a variety of ways in which
public authority is exercised on a daily basis through
these institutions need to be understood and evaluated
before one can judge how well they are functioning.
This clearly is an impossible task, or at the very least,
time-consuming and cumbersome. The only pragmatic
approach under these circumstances is to identify and
assess certain key dimensions of governance, and hope
that they will shed light on the functioning of all
essential public institutions in an adequate fashion.
People may reasonably differ on the range of
institutions to be included or even on the key
dimensions of governance to be studied. This explains
why studies of governance have differed in their scope,
approaches and the dimensions selected for
comparisons within and across countries.
The approach of the present study is to focus on those
dimensions of governance that seem most relevant and
critical in the Indian context. The objectives and
priorities of the Indian state, the set of public
institutions that are most likely to affect the quality of
governance and the ease of access to the information
required to assess them are the main factors that guide
this choice. We know, for example, that the exercise of
power will be influenced greatly by the quality of
leaders in charge. If, however, it is difficult to get
credible information about this, it may have to be left
out of the scope of the study.
By now, it should be clear that a good understanding of
the rules, norms and standards that public institutions
are meant to adhere to, and their degree of compliance
with them, is critical. Where such standards are not
clearly laid down, the assessment will rely upon
generally accepted standards and norms that are
considered best practices internationally. It is also
necessary to assess the outcomes of these processes. If
compliance seems satisfactory in two countries or
states, but the outcomes are found to be better in the
first when compared to the second, the quality of
governance of the former will attain a higher rating
than the latter.
image source # 06
Sir Adrian Cadbury holding up the report ‘The financial aspects of corporate governance’
018

INTRODUCTION
Good governance: A societal value?
An important question is whether the quality of
governance is a means to achieve a higher level of
socio-economic development or an end in itself. There
are studies that have tried to establish whether good
governance leads to a higher economic growth rate or
other macro-economic outcomes. Definitive
conclusions on this score are difficult to reach as there
are widely varying country experiences. On the other
hand, there is a strong case for considering good
governance as a value or an end in itself. In democratic
societies, citizens expect their public institutions to
function with integrity and efficiency, and to comply
with established standards and codes of conduct. They
expect their governments to deliver corruption-free
services with responsiveness to the people. They may
attach high priority to social protection and openness in
government. These may or may not raise economic
growth rates or reduce poverty. For example,
transparency will keep citizens well informed and
aware of their rights and entitlements. They demand
this feature as it is a value they cherish, not necessarily
because it leads to better macroeconomic outcomes.
On the other hand, when a government's infrastructure
programmes function well, it is likely to lead to a higher
economic growth rate. In short, the different
dimensions of good governance will impact on
economic growth in different ways. Even if some do
not have a direct impact, the quality of governance will
be valued for its own sake, at least in democratic
societies.
It is in the light of these developments that 'Good
Governance', incorporating both economic growth and
social equity, has gained acceptance and credibility as a
measure of the manner in which elected governments
perform their duties. Indeed, there is growing
realisation that one single definition of good
governance cannot be applicable all over the world and
that there are nuanced differences arising out of
cultural dissimilarities and social variations.
Therefore, it is obvious that each nation, (and in a
country as diverse and variegated as India, each state),
must evolve for itself the singular policies and practices
that will constitute good governance in the context of
its own cultural and social backdrop and history.
Prophetic words:
“The nation is crucially dependent on the states for actual
achievement of the chief pragmatic objectives of the nation. The
arrangement works now because it is operating through a
historically-derived administrative system of real competence…,
extraordinary leadership, and an extraordinary dominance of an
effectively one party system… What of the future under more
ordinary leadership, division of control of states among different
parties, and a growing sentiment for autonomous status?”
- Paul Appleby, Consultant, Ford Foundation, 'Public
Administration in India' - Report of a Survey, 1953.
019
FAIF RA S IC NIL DB EU XP
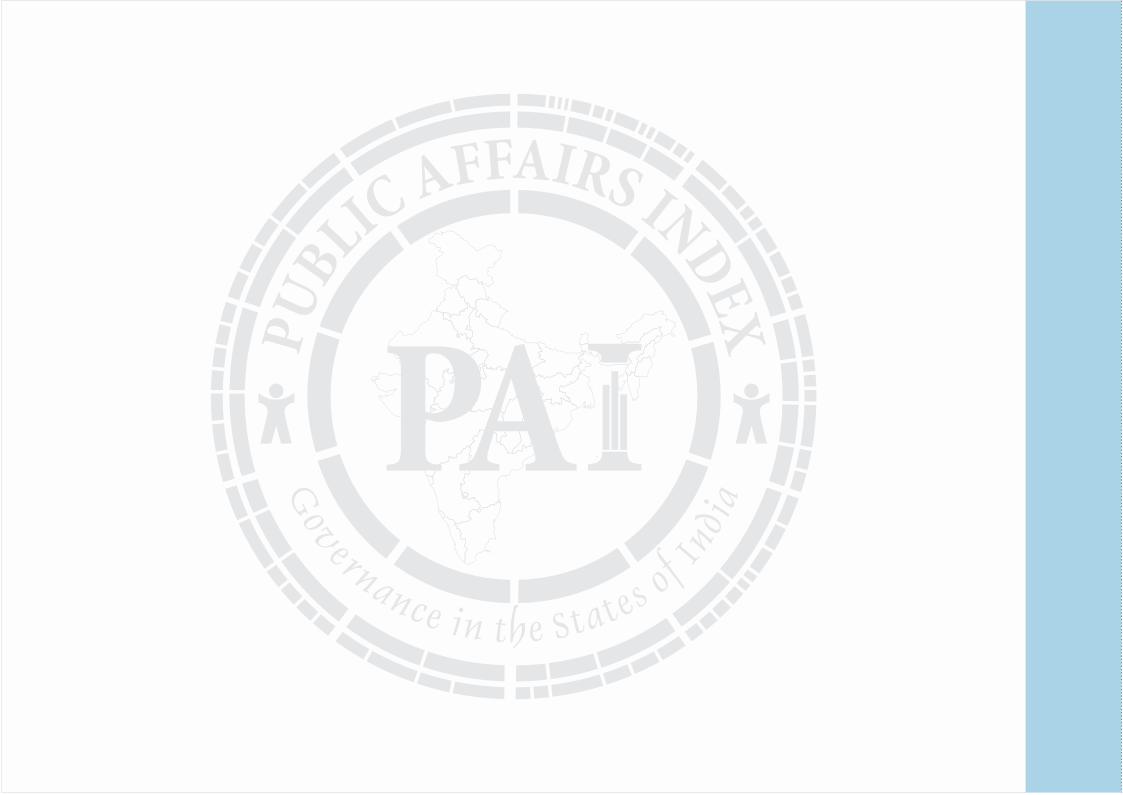
The Indian Context
The newly constituted NITI Aayog has also examined
these issues and has listed out the seven principles of
good governance for the nation.
"In essence, effective governance in India will rest on the following pillars:
a. Pro-people agenda that fulfils the aspirations of thesociety as well as individual
b. Pro-active in anticipating and responding to theirneeds
c. Participative, by involvement of citizens
d. Empowering women in all aspects
e. Inclusion of all groups, with special attention to theeconomically weak (garib), the SC, ST and OBCcommunities, the rural sector and farmers (gaonand kisan), youth and all categories of minorities
f. Equality of opportunity to our country's youth
g. Transparency through the use of technology toxi
make government visible and responsive”
To the extent possible, these concerns are being
reflected in our study.
Prime Minister Narendra Modi's election slogan,
“Minimum government, Maximum governance” put
the spotlight on public governance as a key issue in the
national elections of 2014. Perhaps for the first time, a
political party led a major campaign with a focus on
improving the quality of governance in the country. It
was a signal to the citizens that political leaders had
begun to recognize the importance of good governance
as a key factor in India's development.
Similarly, development literature too has begun to pay
increasing attention to issues of governance in recent
years. Time was when development theories preached
the pre-eminent role of investment as the key to
economic growth, to the exclusion of all other factors.
When it was found that investment of capital did not
fully explain the inter-country variations in growth and
development, technical progress was added as another
factor contributing to economic growth. Education
and knowledge were also added to the list of factors to
explain growth patterns in subsequent iterations.
Quality of public governance is now accepted as yet
another contributory factor and experts have begun to
identify and measure its role in development in recent
years.
The persistent question that raises its head is that the
market may bring prosperity to some sections of the
people, but is economic growth an equivalent to
development? A view has been held by many social
activists who argue that only that policy, law or
governance practice can be called 'good' which benefits
substantial sections of society which are the most poor xii
and vulnerable. Indeed, we know that economic
growth, as defined by GDP and macro-economic
stability, does not alone lead to distributive justice and
reduction of poverty.
020
INTRODUCTION
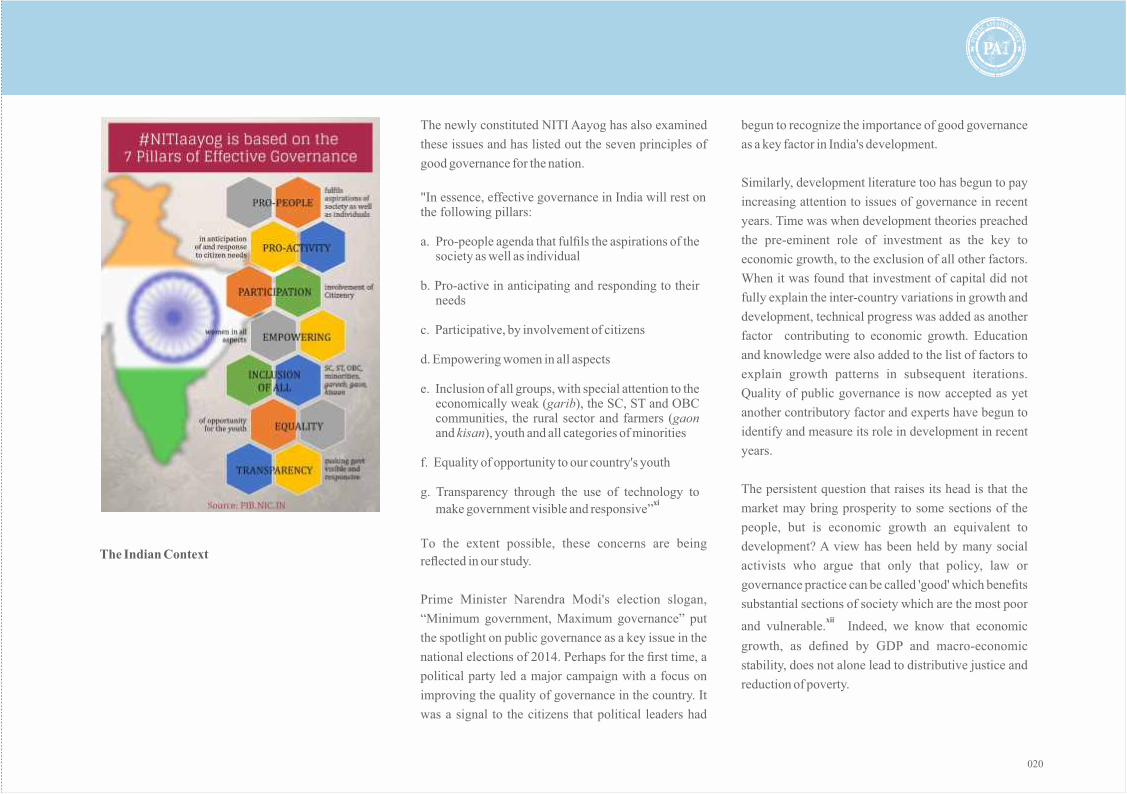
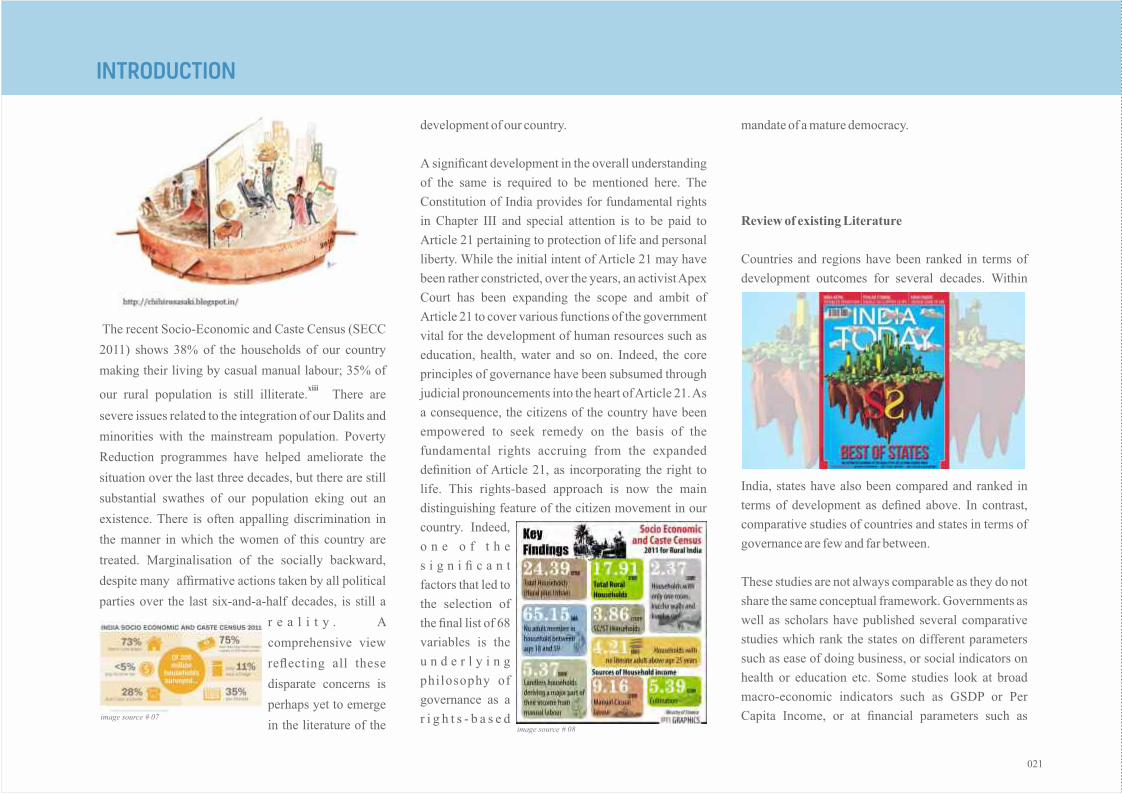
The recent Socio-Economic and Caste Census (SECC
2011) shows 38% of the households of our country
making their living by casual manual labour; 35% of xiii
our rural population is still illiterate. There are
severe issues related to the integration of our Dalits and
minorities with the mainstream population. Poverty
Reduction programmes have helped ameliorate the
situation over the last three decades, but there are still
substantial swathes of our population eking out an
existence. There is often appalling discrimination in
the manner in which the women of this country are
treated. Marginalisation of the socially backward,
despite many affirmative actions taken by all political
parties over the last six-and-a-half decades, is still a
r e a l i t y . A
comprehensive view
reflecting all these
disparate concerns is
perhaps yet to emerge
in the literature of the
development of our country.
A significant development in the overall understanding
of the same is required to be mentioned here. The
Constitution of India provides for fundamental rights
in Chapter III and special attention is to be paid to
Article 21 pertaining to protection of life and personal
liberty. While the initial intent of Article 21 may have
been rather constricted, over the years, an activist Apex
Court has been expanding the scope and ambit of
Article 21 to cover various functions of the government
vital for the development of human resources such as
education, health, water and so on. Indeed, the core
principles of governance have been subsumed through
judicial pronouncements into the heart of Article 21. As
a consequence, the citizens of the country have been
empowered to seek remedy on the basis of the
fundamental rights accruing from the expanded
definition of Article 21, as incorporating the right to
life. This rights-based approach is now the main
distinguishing feature of the citizen movement in our
country. Indeed,
o n e o f t h e
s i g n i fi c a n t
factors that led to
the selection of
the final list of 68
variables is the
u n d e r l y i n g
philosophy of
governance as a
r i g h t s - b a s e d
mandate of a mature democracy.
Review of existing Literature
Countries and regions have been ranked in terms of
development outcomes for several decades. Within
India, states have also been compared and ranked in
terms of development as defined above. In contrast,
comparative studies of countries and states in terms of
governance are few and far between.
These studies are not always comparable as they do not
share the same conceptual framework. Governments as
well as scholars have published several comparative
studies which rank the states on different parameters
such as ease of doing business, or social indicators on
health or education etc. Some studies look at broad
macro-economic indicators such as GSDP or Per
Capita Income, or at financial parameters such as image source # 07
image source # 08
021
FAIF RA S IC NIL DB EU XP
which look at aspects of the economy in the states as
well as matters related to investment and business. The
study sponsored by Cato on the comparative freedom
in the economy, authored by Bibek Debroy and xiv
Laveesh Bhandari is a prominent example as is the
xvrecent World Bank study on ease of doing business in
the states of India. The various Ministry websites give
periodic statements ranking the States according to the
programmes carried out through the Ministry
concerned.
The only comparative study of the governance of
xviIndian states is by Mundle, et.al. The governance
dimensions included in their study are infrastructure
delivery, social service delivery, fiscal performance,
law and order, judicial service delivery and the quality
of legislature. They used 17 indicators in all against
these dimensions. One of their findings was that there
was a high correlation between governance and
development. Their coverage was limited to 17 states,
and the final rankings did not vary despite application
of differing statistical methods.
There are two major international comparisons of
country-level governance. The earliest of these (2006) xvii
is by Kauffman, et.al, who produced ratings for 212
countries. The governance dimensions examined in
their work are political stability and absence of
violence, voice and accountability, government
effectiveness, regulatory quality, rule of law and
control of corruption. In all, they used 310 variables to
derive their country rankings. Their unduly large set of
indicators and the mixing of secondary data with field
survey results of doubtful reliability are debatable.
The opposite approach was used in the study by Besley xviii
and Persson (2011) who assessed only three
dimensions, viz, fiscal capacity,
legal capacity and peace.
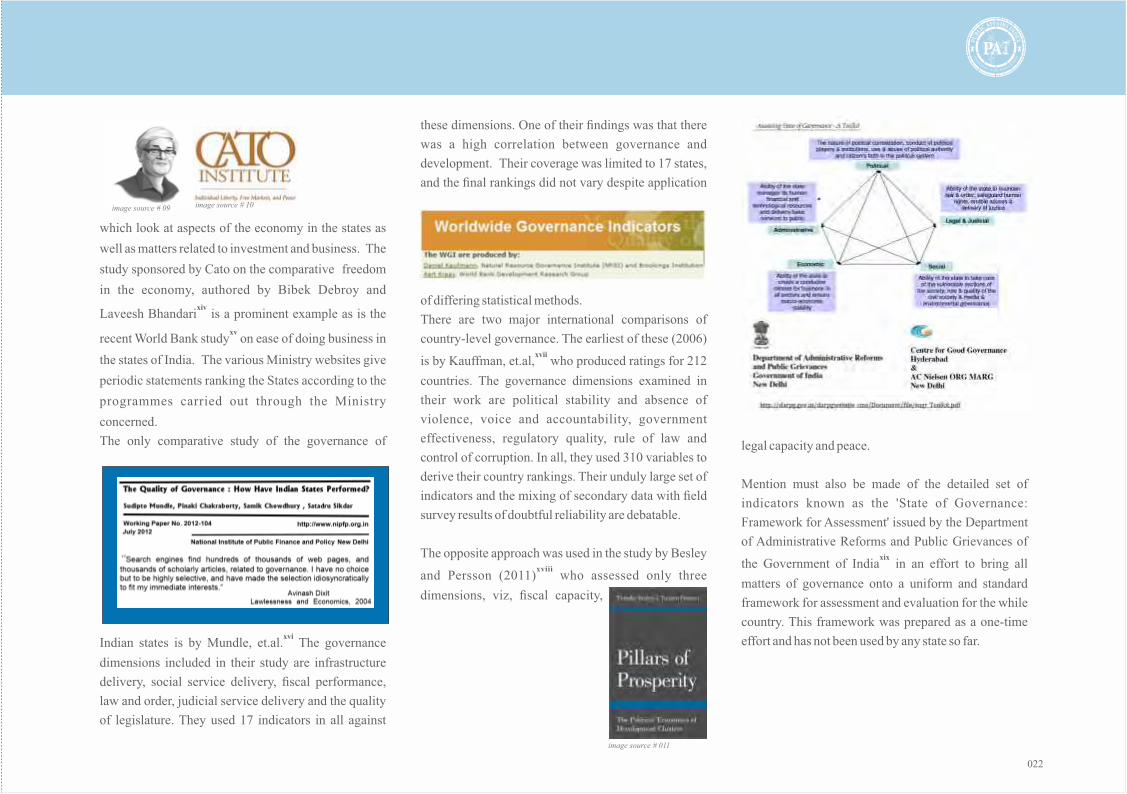
Mention must also be made of the detailed set of
indicators known as the 'State of Governance:
Framework for Assessment' issued by the Department
of Administrative Reforms and Public Grievances of xix
the Government of India in an effort to bring all
matters of governance onto a uniform and standard
framework for assessment and evaluation for the while
country. This framework was prepared as a one-time
effort and has not been used by any state so far.
image source # 09 image source # 10
image source # 011
022

INTRODUCTION
governance, therefore, can be considered a useful
exercise that could yield valuable insights into their
strong and weak areas of performance, and help
generate ideas for remedial action. The scope of the
study will, of necessity, be limited to the core
dimensions of governance appropriate to the Indian
context, and for which the required information is
available. The study will be based on the latest year(s)
for which information is available. The core
dimensions of governance and the outcomes of the
selected public institutions selected for study can give
us only a partial view of the functioning of the state.
Nevertheless, it is hoped that this assessment will be
adequate for us to judge the quality of governance in
the states of India.
Further, it has to be mentioned, at the risk of repetition,
that the diverse and plural nature of society makes the
task even more complex. Each State in the Indian
Union has its own social, linguistic and cultural
identity that constitutes inescapable factors in the
assessment of the quality of its governance. In our
federal structure, the assignment of duties and
responsibilities between the Union Government and
the State governments have been clearly spelt out in
List I, List II and List III arising out of Article 246 and
the Seventh Schedule. It would appear, therefore, that
States are fully responsible for the areas of
administration assigned to them in the Lists. There are,
however, issues relating to the administration of the
programmes and the finances assigned to them which
have led to different perspectives in the manner and
direction of the practical aspects of this cooperative
federalism as implemented in the States. The regional
and local aspirations of the people of each state will
also colour and mutate the definition of good
governance. The challenge, therefore, is to identify the
specific indicators that will assist in the assessment of
the levels and quality of governance in the states of the
country.
Further, we do know that there is sufficient evidence to
categorically state that there are fundamental
differences in the manner in which the North Indian
States have evolved as compared to the South Indian xx
States . Historical advantages that the Southern States
may enjoy out of a longer period of benevolent
monarchies and cultural integration may have led to
these differences. So also the North-Eastern states have
a culture and history of their own which makes them
unique when compared with the rest of the country.
Other states with predominant tribal populations will
demonstrate their own singularities when compared
with states that have a mixed population. It is
understood that the comparison of such a diverse
collection of States inhabiting different time zones and
cultural spaces is likely to result in situations where
comparisons may be difficult. Be that as it may, this
report is an attempt, notwithstanding the problems
involved, to make a comparative assessment of the
levels and quality of governance in the states of India,
based on critical aspects of governance as identified
after much discussion. In fact, this report will be a
governance score card for the States of India.
Public Affairs Index
The Public Affairs Centre (PAC) with its two-decades-
old experience in the study of governance models and
development of the Citizen's Report Card requires
special mention here. It is one of the pioneers of
evidence-based, citizen-centred research to study and
advocate the improvement of the services provided by
the Government. Indeed, the development of the
Public Affairs Index (PAI) as a tool for the
measurement of governance on a pan-national scale, is
a continuation of the yeoman efforts of PAC in
understanding and studying governance from the
perspective of the citizen. Focus on the processes and
outcomes of governance functions makes the PAI study
different for reasons mentioned in this section.
Moreover, it is our contention that the Public Affairs
Index (PAI) constructed on the basis of indicators
selected by us for our study on the governance
dimensions in the States of India is wider in scope and
more comprehensive. Apart from providing a single
interstate ranking, based on all identified indicators,
our study also provides theme-wise insights.
The present study will focus on governance at the state
level in India. Though India's states vary widely in size,
economic and social features, topography and other
characteristics, they are governed by the same
Constitution as well as national policies and laws. They
have similar public institutions and follow common
administrative practices for the most part. A
comparison of the states in terms of their quality of
023

FAIF RA S IC NIL DB EU XP
It is in this context that we look at the principal
elements that constitute good governance. This study
identifies 10 broad themes encompassing 25 focus
subjects spread over 68 specific indicators. All data
accessed are secondary data and those available largely
in the public domain. It is also a distinguishing feature
of this study, that wherever possible, and where the data
permitted it, we are looking at the movement of the
state across a three-year period with respect to the
progress, or otherwise, in the particular variable
concerned, rather than at a static point. The purpose of
adopting this strategy is to more accurately depict the
efforts made by the state in improving the quality and
levels of governance in the short term, perhaps thus
hoping to capture the tenor of the leadership of the
state.
The next section will discuss the data sources accessed
by this study and the methodology that has been
followed by us to arrive at our conclusions. These
themes, subjects and indicators cannot give a complete
picture of governance in the states of India, but, we
contend that they are enough to convey a
comprehensive and representative picture of the levels
and quality of governance in the States of India.
024

INTRODUCTION - FOOTNOTES
i JM Keynes, Essays in Persuasion 1931
ii World Bank Report: Sub-Saharan Africa: From Crisis to Sustainable Growth: A long term perspective Study. 1989.
iii World Development Report 1997, pg 1
iv Reconceptualising Governance, UNDP et al 1997
v United Nations Development Programme, Governance for sustainable human development, UNDP policy document, New York, 1997.
vi Introduction to the UN System Task Team on the post-2015 UN Development agenda: Governance and Development: Thematic Think piece by UNDESA, UNDP and UNESCO. http://www.un.org/millenniumgoals/pdf/Think%20Pieces/7_governance.pdf
vii OECD: Better policies for better life” Recommendation of the Council on Principles for Public Governance of Public Private Partnerships, May 2012. http://www.oecd.org/governance/budgeting/PPP-Recommendation.pdf
viii Mis-measuring our lives: Why GDP doesn't add up by Stiglitz, Joseph e, Sen, Amarta and Fitoussi, Jean-Paul. , New Press, New York, London, 2010.
ix Report of the Committee on the Financial Aspects of Corporate Governance, December 1992. It is popularly known as the Cadbury Report. http://www.ecgi.org/codes/documents/cadbury.pdf
x Summary report available at https://www.google.co.in/webhp?sourceid=chrome-instant&ion=1&espv=2&ie=UTF-8#q=Owens+report+Australia+2003
xi Press release dated 1.1.2015 from the Cabinet through Press information Bureau: http://pib.nic.in/newsite/PrintRelease.aspx?relid=114268
xii Harsh Mander: The Ripped Chest: Public Policy and the Poor in India. 2004
xiii Socio Economic and Caste Census 2011.
xiv http://object.cato.org/sites/cato.org/files/economic-freedom-india-2013/economic-freedom-states-of-india-chapter-1.pdf
xv http://indiainbusiness.nic.in/newdesign/upload/StateAssessmentReport_14September2015.pdf
xvi http://www.nipfp.org.in/media/medialibrary/2013/04/WP_2012_104%20_0.pdf
xvii http://papers.ssrn.com/sol3/papers.cfm?abstract_id=1682130.
xviii http://press.princeton.edu/titles/9624.html
xix http://indiainbusiness.nic.in/newdesign/upload/StateAssessmentReport_14September2015.pdf
xx Samuel Paul and Kala Seetharam Sridhar: The Paradox of India's North South Divide: Lessons from the States and the Regions.
xxi Chapter Foreword of book Revitalizing the State - A Menu of Options - by Pradip N Khandwalla. Published: Sage 1999 ISBN 81-7036-781-6 (India-HB)
IMAGE SOURCES
01 Time magazine: John Maynard Keynes http://img.timeinc.net/time/magazine/archive/covers/1965/1101651231_400.jpg
02 sub-saharan africa from crisis to sustainable growth source: ISBN-13: 978-0821313497 www.amazon.com/Sub-Saharan-Africa-Sustainable-Long-Term-Perspective/dp/0821313495/
03 World Development Report 1997: The State in a Changing World ISBN-13: 978-0195211146 www.amazon.com/World-Development-Report-1997-Changing/dp/0195211146
04 Will the Next Asian Tiger Please Stand Up? http://www.milkeninstitute.org/publications/view/660
05 RTE image - childern and globe http://www.apsabangalore.org/wp-content/uploads/2015/02/project-right-to-education-1170x455.jpg
06 Sir Adrian Cadbury, chairman of corporate governance, in 1992 http://www.birminghampost.co.uk/business/business-news/tributes-paid-after-sir-adrian-10002476
07 India-Socio-Economic Caste Census 2011 https://himachalwatcher.com/wp-content/uploads/2015/11/india-socio-economic-and-caste-census-2011.jpg
08 Socio Economic Pointers http://www.thehindu.com/multimedia/dynamic/02461/TN_graphics_2461589f.jpg
09 Bibek Debroy (@bibekdebroy) Twitter Profile Picture https://pbs.twimg.com/profile_images/601287291198275584/CU3WRNhm.jpg
10 CATO logo http://liberty.menu/wp-content/uploads/2015/02/1817_cato-logo-courtesy-c-span.org_.gif
11 Pillars of Prosperityhttp://press.princeton.edu/titles/9624.html
025
FAIF RA S IC NIL DB EU XP
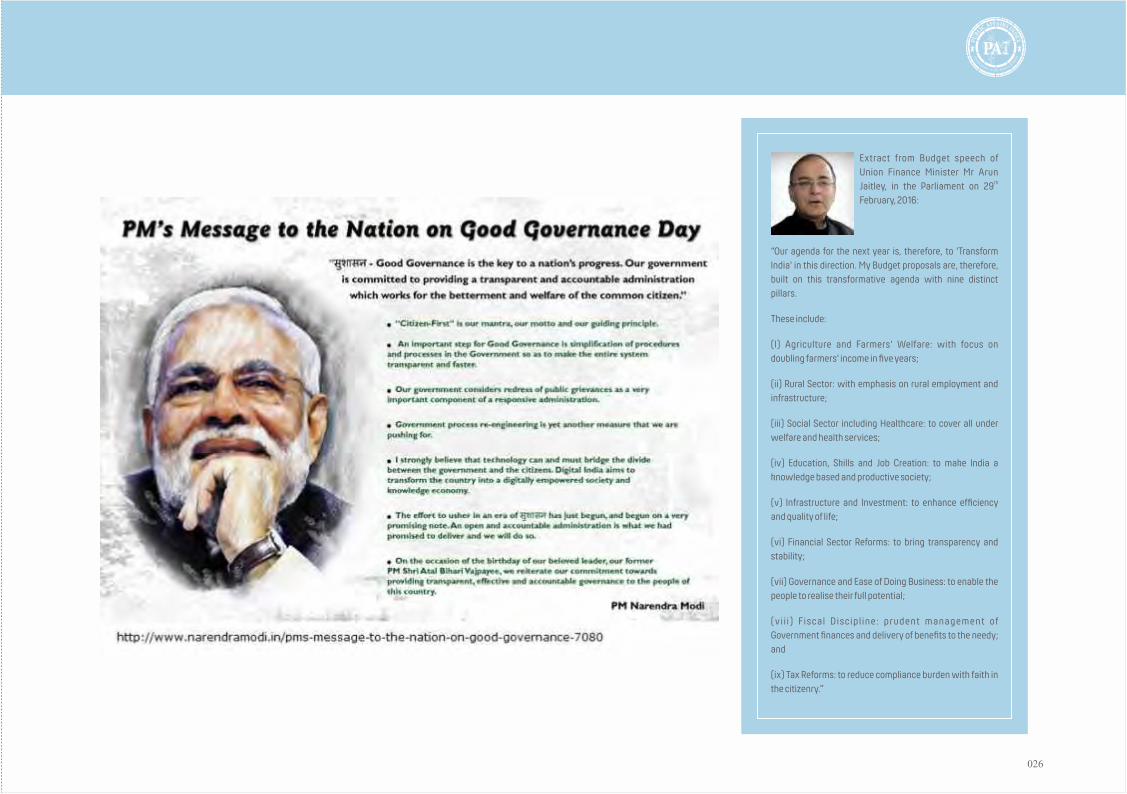
Extract from Budget speech of Union Finance Minister Mr Arun
thJaitley, in the Parliament on 29February, 2016:
“Our agenda for the next year is, therefore, to 'Transform India' in this direction. My Budget proposals are, therefore, built on this transformative agenda with nine distinct pillars.
These include:
(I) Agriculture and Farmers' Welfare: with focus on doubling farmers' income in five years;
(ii) Rural Sector: with emphasis on rural employment and infrastructure;
(iii) Social Sector including Healthcare: to cover all under welfare and health services;
(iv) Education, Skills and Job Creation: to make India a knowledge based and productive society;
(v) Infrastructure and Investment: to enhance efficiency and quality of life;
(vi) Financial Sector Reforms: to bring transparency and stability;
(vii) Governance and Ease of Doing Business: to enable the people to realise their full potential;
(vi i i) Fiscal Discipl ine: prudent management of Government finances and delivery of benefits to the needy; and
(ix) Tax Reforms: to reduce compliance burden with faith in the citizenry.”
026
AF IF RSA IC NI DLB EXUP
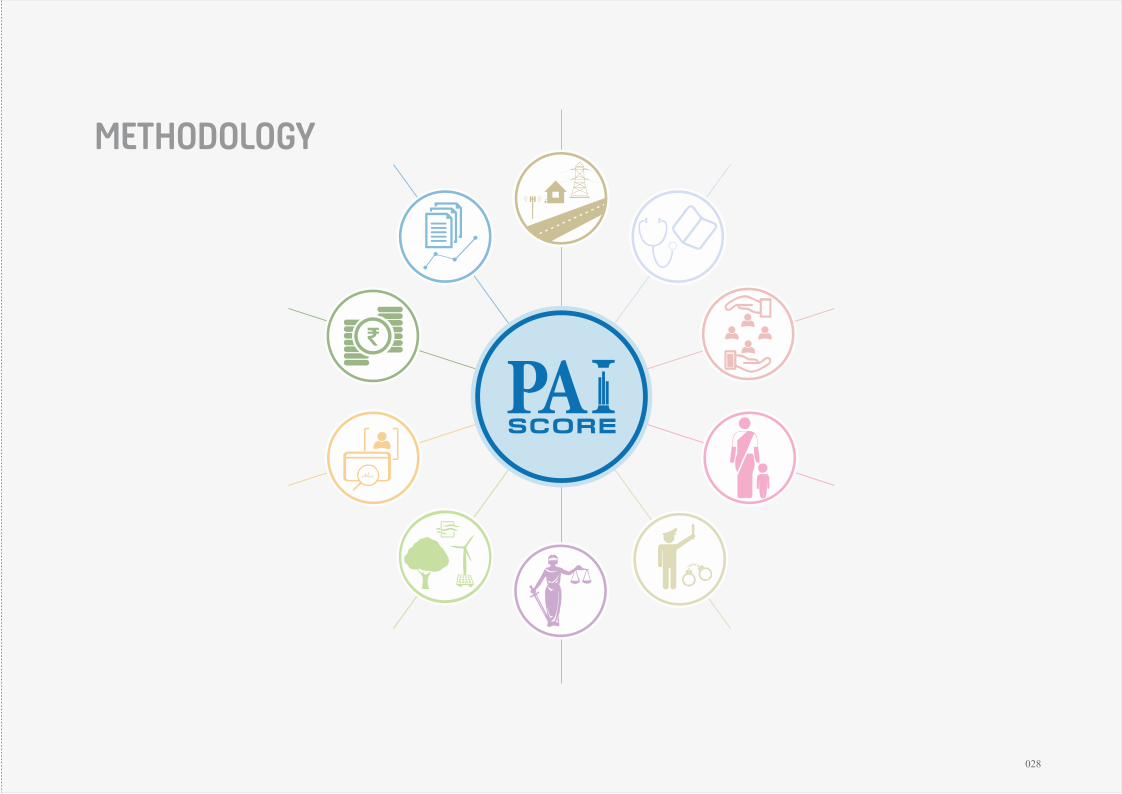
METHODOLOGY
SCORE
028
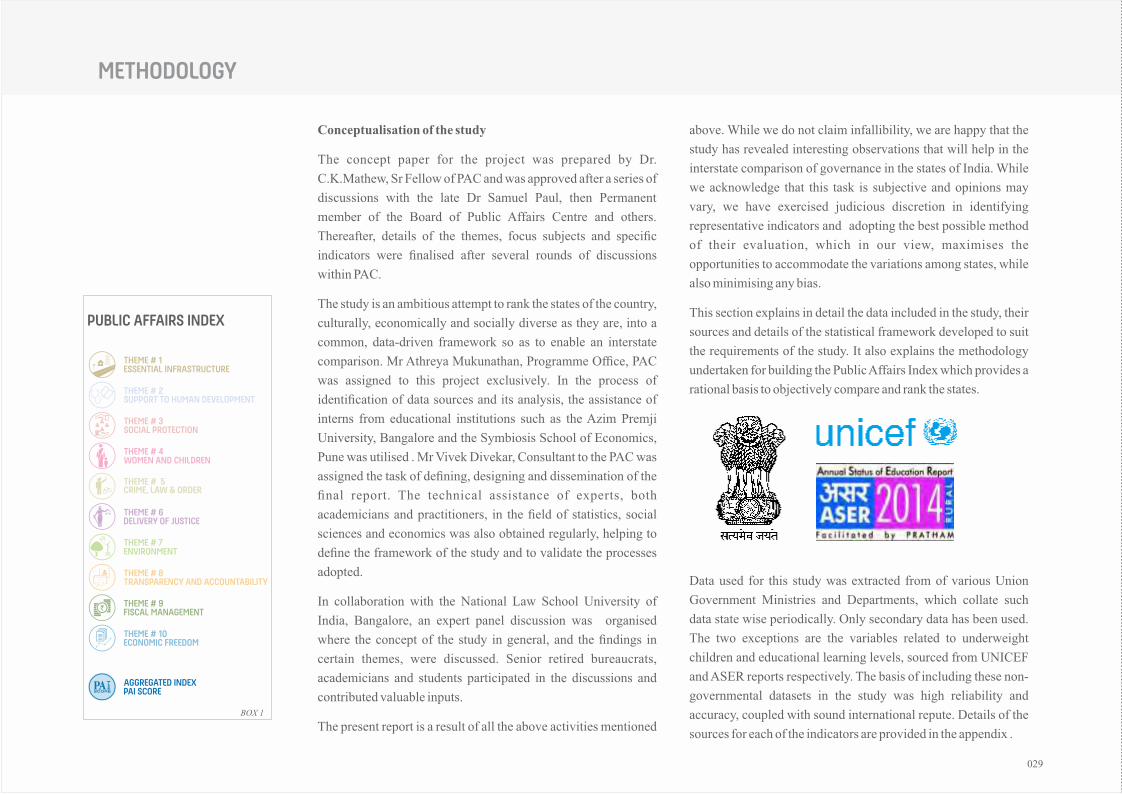
Conceptualisation of the study
The concept paper for the project was prepared by Dr.
C.K.Mathew, Sr Fellow of PAC and was approved after a series of
discussions with the late Dr Samuel Paul, then Permanent
member of the Board of Public Affairs Centre and others.
Thereafter, details of the themes, focus subjects and specific
indicators were finalised after several rounds of discussions
within PAC.
The study is an ambitious attempt to rank the states of the country,
culturally, economically and socially diverse as they are, into a
common, data-driven framework so as to enable an interstate
comparison. Mr Athreya Mukunathan, Programme Office, PAC
was assigned to this project exclusively. In the process of
identification of data sources and its analysis, the assistance of
interns from educational institutions such as the Azim Premji
University, Bangalore and the Symbiosis School of Economics,
Pune was utilised . Mr Vivek Divekar, Consultant to the PAC was
assigned the task of defining, designing and dissemination of the
final report. The technical assistance of experts, both
academicians and practitioners, in the field of statistics, social
sciences and economics was also obtained regularly, helping to
define the framework of the study and to validate the processes
adopted.
In collaboration with the National Law School University of
India, Bangalore, an expert panel discussion was organised
where the concept of the study in general, and the findings in
certain themes, were discussed. Senior retired bureaucrats,
academicians and students participated in the discussions and
contributed valuable inputs.
The present report is a result of all the above activities mentioned
above. While we do not claim infallibility, we are happy that the
study has revealed interesting observations that will help in the
interstate comparison of governance in the states of India. While
we acknowledge that this task is subjective and opinions may
vary, we have exercised judicious discretion in identifying
representative indicators and adopting the best possible method
of their evaluation, which in our view, maximises the
opportunities to accommodate the variations among states, while
also minimising any bias.
This section explains in detail the data included in the study, their
sources and details of the statistical framework developed to suit
the requirements of the study. It also explains the methodology
undertaken for building the Public Affairs Index which provides a
rational basis to objectively compare and rank the states.
Data used for this study was extracted from of various Union
Government Ministries and Departments, which collate such
data state wise periodically. Only secondary data has been used.
The two exceptions are the variables related to underweight
children and educational learning levels, sourced from UNICEF
and ASER reports respectively. The basis of including these non-
governmental datasets in the study was high reliability and
accuracy, coupled with sound international repute. Details of the
sources for each of the indicators are provided in the appendix .
METHODOLOGY
THEME # 1 ESSENTIAL INFRASTRUCTURE
THEME # 2 SUPPORT TO HUMAN DEVELOPMENT
THEME # 3 SOCIAL PROTECTION
THEME # 4 WOMEN AND CHILDREN
THEME # 6 DELIVERY OF JUSTICE
THEME # 8 TRANSPARENCY AND ACCOUNTABILITY
THEME # 10 ECONOMIC FREEDOM
THEME # 7 ENVIRONMENT
THEME # 9 FISCAL MANAGEMENT
THEME # 5 CRIME, LAW & ORDER
SCORE PAI SCOREAGGREGATED INDEX
PUBLIC AFFAIRS INDEX
BOX 1
029
FAIF RA S IC NIL DB EU XP
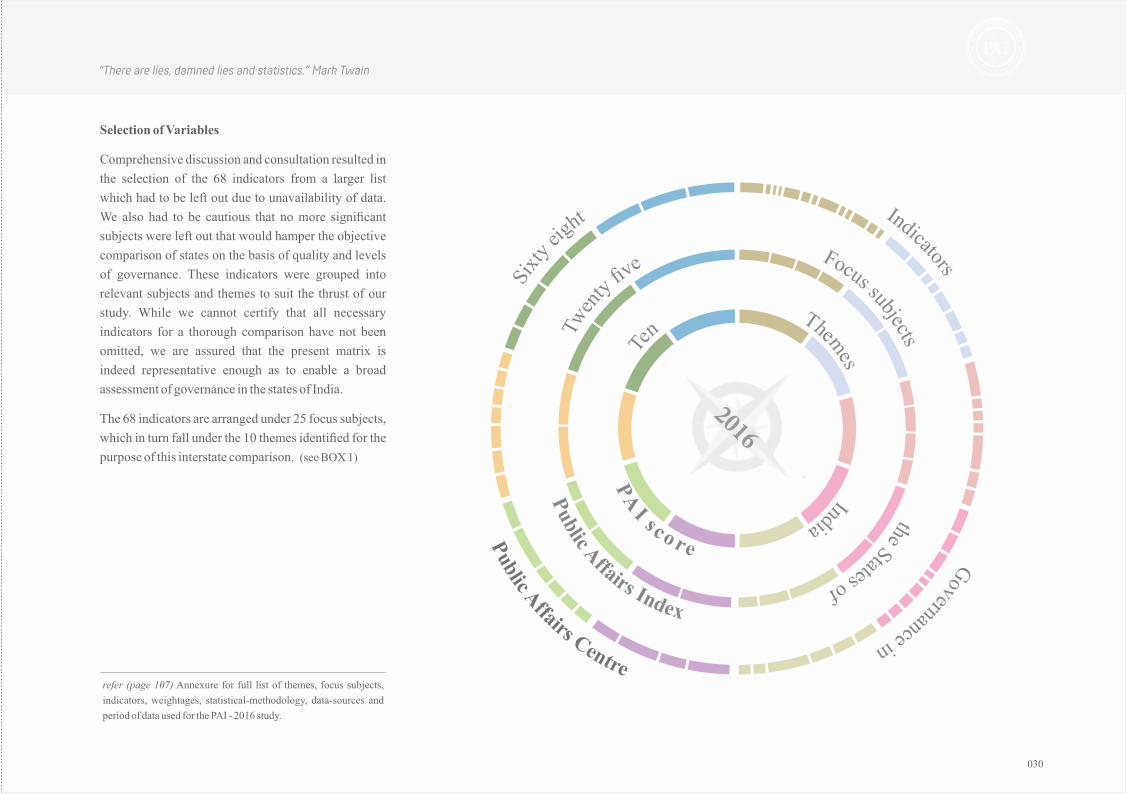
Selection of Variables
Comprehensive discussion and consultation resulted in
the selection of the 68 indicators from a larger list
which had to be left out due to unavailability of data.
We also had to be cautious that no more significant
subjects were left out that would hamper the objective
comparison of states on the basis of quality and levels
of governance. These indicators were grouped into
relevant subjects and themes to suit the thrust of our
study. While we cannot certify that all necessary
indicators for a thorough comparison have not been
omitted, we are assured that the present matrix is
indeed representative enough as to enable a broad
assessment of governance in the states of India.
The 68 indicators are arranged under 25 focus subjects,
which in turn fall under the 10 themes identified for the
purpose of this interstate comparison. (see BOX 1)
“There are lies, damned lies and statistics.” Mark Twain
Indicators
Focus subjects
Themes
thgie ytxiS
evfi ytnewT neT
Governance in
the States of
India
2016
refer (page 107) Annexure for full list of themes, focus subjects,
indicators, weightages, statistical-methodology, data-sources and
period of data used for the PAI - 2016 study.
030
Data Comparison
Standardisation of variables is a precursor to any
statistical cross section analysis. This is especially true
in a pan-Indian context where each state is
heterogeneous. Therefore, this study has adopted one
of the following two methods of standardising the
variables across states, where either of these two
methods was thought appropriate.
For one, population has been used to standardise the
variables. The absolute values of the variable are
divided by the respective state population to represent
the variable in terms of per unit of population.
Throughout the study the 2011 census population
figures have been used to convert the variable into per
population terms.
E.g.: If the murders reported in Kerala in 2013 were
372, it is divided by the population of the state which is
3.32 crores and is, therefore, expressed as 11.41
murders per ten lakh population
The second method employed to standardise variables
is representing them in a percentage form.
E.g.: Variables such as the revenue deficit or health
expenditure is represented as a percentage of the State
GDP. E.g.: The total health expenditure of Tamil Nadu
in 2013 was Rs. 6,398 crores and the State's GDP was
estimated at Rs 4,80,618 crores. Therefore, the
expenditure on health as a percentage of GDP stood at
1.33 percent.
Both these methods standardise the variables across
different states and make interstate comparisons
possible.
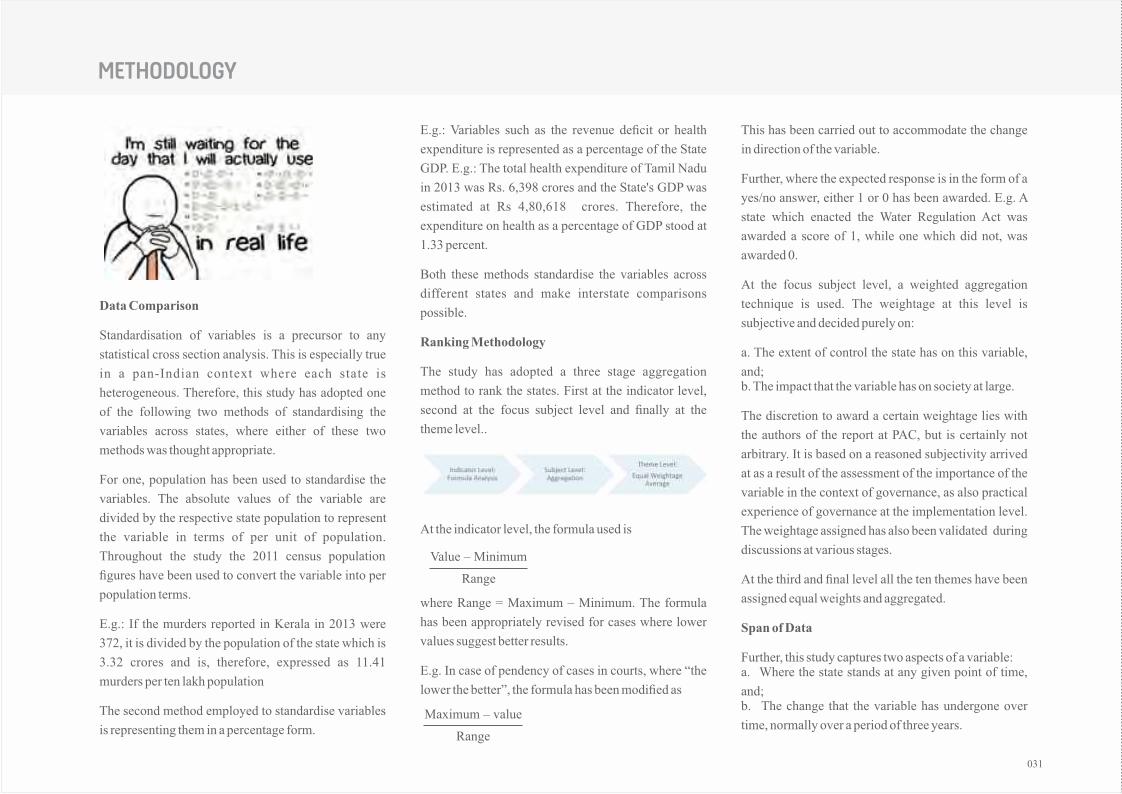
Ranking Methodology
The study has adopted a three stage aggregation
method to rank the states. First at the indicator level,
second at the focus subject level and finally at the
theme level..
At the indicator level, the formula used is
where Range = Maximum – Minimum. The formula
has been appropriately revised for cases where lower
values suggest better results.
E.g. In case of pendency of cases in courts, where “the
lower the better”, the formula has been modified as
This has been carried out to accommodate the change
in direction of the variable.
Further, where the expected response is in the form of a
yes/no answer, either 1 or 0 has been awarded. E.g. A
state which enacted the Water Regulation Act was
awarded a score of 1, while one which did not, was
awarded 0.
At the focus subject level, a weighted aggregation
technique is used. The weightage at this level is
subjective and decided purely on:
a. The extent of control the state has on this variable,
and;b. The impact that the variable has on society at large.
The discretion to award a certain weightage lies with
the authors of the report at PAC, but is certainly not
arbitrary. It is based on a reasoned subjectivity arrived
at as a result of the assessment of the importance of the
variable in the context of governance, as also practical
experience of governance at the implementation level.
The weightage assigned has also been validated during
discussions at various stages.
At the third and final level all the ten themes have been
assigned equal weights and aggregated.
Span of Data
Further, this study captures two aspects of a variable:a. Where the state stands at any given point of time,
and;b. The change that the variable has undergone over
time, normally over a period of three years.
METHODOLOGY
Value – Minimum
Range
Maximum – value
Range
031

FAIF RA S IC NIL DB EU XP
The three-year period taken for the indicators is not
uniform: this is again dictated by the availability of
data. The data available for the latest three-year period
has been adopted for this study.
An arithmetic mean or the latest data point is used for
the former aspect, while the growth rate or CAGR has
been used to capture the latter. Equal weightage has
been assigned in the analysis to both mean / latest data
point and CAGR to capture both these aspects of
development. However, in certain cases, only one of
the above has been used for practical and intuitive
reasons.
At this juncture two aspects of the methodology need
more elaboration and clarity. One pertains to the
appropriateness of combining and assigning equal
weights to the static variable (the latest data point or
average) and a dynamic variable (CAGR or Simple
Growth Rate). However, it is to be noted that the PAI
does not combine the absolute values of the variables
but passes them through a funnel of standardization
which individually reduces both the variables to a
relative index score (by assigning values between 1 and
0). After this, both the index values are combined to
arrive at a single value for each state, so that the ranking
of the states is thereby enabled.
The authors of this report were of the view that merely
taking any one of the two factors would not reflect the
import of the achievement of any particular state. A
high achiever state will not be able to depict growth rate
over a three-year period because they have already
reached a very high level by consistent efforts in the
past (e.g. Literacy rates in Kerala). For such states, the
average of the three-year period or the latest data point
would be a better indicator of the high levels achieved.
On the other hand, the best performance of those states,
with historically low or medium rates of achievement,
but who are putting in their best efforts now, can be
more accurately depicted by the CAGR or growth rate
of the variable over the said three-year period. A
combination of the two factors would thereby be ideal
for depiction of the varied and diverse performance of
the states of India in the various indicators, focus
subjects and themes taken up for examination in this
report.
In an attempt to minimize subjectivity, it was also
decided that rather than restricting the number of
indicators for applying the combined value of the
CAGR and Average factors, an effort was made to
identify all such indicators where data is available over
the three-year period, and where such combination of
factors is suitable and serves our purpose.
The second matter requiring clarification pertains to the
application of the formula
to assign 1 to the best performing state and 0 to the
worst performing state. A panel of experts expressed a
view that such a method could assign very high values
or very low ones to the outlier states, exceptionally high
performing states and exceptionally low performing
states, thereby skewing the results. An alternative
method to index variables by measuring the deviation
from the average was suggested. However, upon
running robustness checks with the suggested formula
it was observed that the rankings do not change at any
level, thereby providing a significant and robust
statistical framework to rank the states.
Categorisation of States
In the process of the ranking, the states have been
arranged in two lists, namely, the large states and the
small states. This differentiation has been done on the
basis of population, with two crores as the dividing
line. For the information of the reader it is clarified that
such a differentiation is used even by the Government
of India in some of its websites to avoid the difficulties
that may be experienced in comparing the very
populous states with much less populous ones. Despite
categorisation into large and small states, the index
permits comparison across all states for all the themes.
We have not included the Union territories in this
assessment. We have also taken for all purposes the
figures of undivided Andhra Pradesh, as the data
examined in most of the indicators pertains to the
periods prior to 2014-15 when the state was divided.Value – Minimum
Range
032

AF IF RSA IC NI DLB EXUP

THEME #1ESSENTIAL INFRASTRUCTURE
T & D Losses
Per Capita Consumption of Power
Households electrified as a % of total
% of Households with access to safe drinking water
Total Irrigated Area vs Total Agricultural Area
Existence of Water Regulatory Commision
Existence of Ground Water Regulation Act
Surface Roads as a % of total Roads
Road Density per 1000 sq. KM
% of households with access to Cellphone
No. of Pucca Houses as a % of total
Slum Population as a % of total Urban population
% of households with toilets inside premises
Power
Water
Housing
Roads & Communication
034
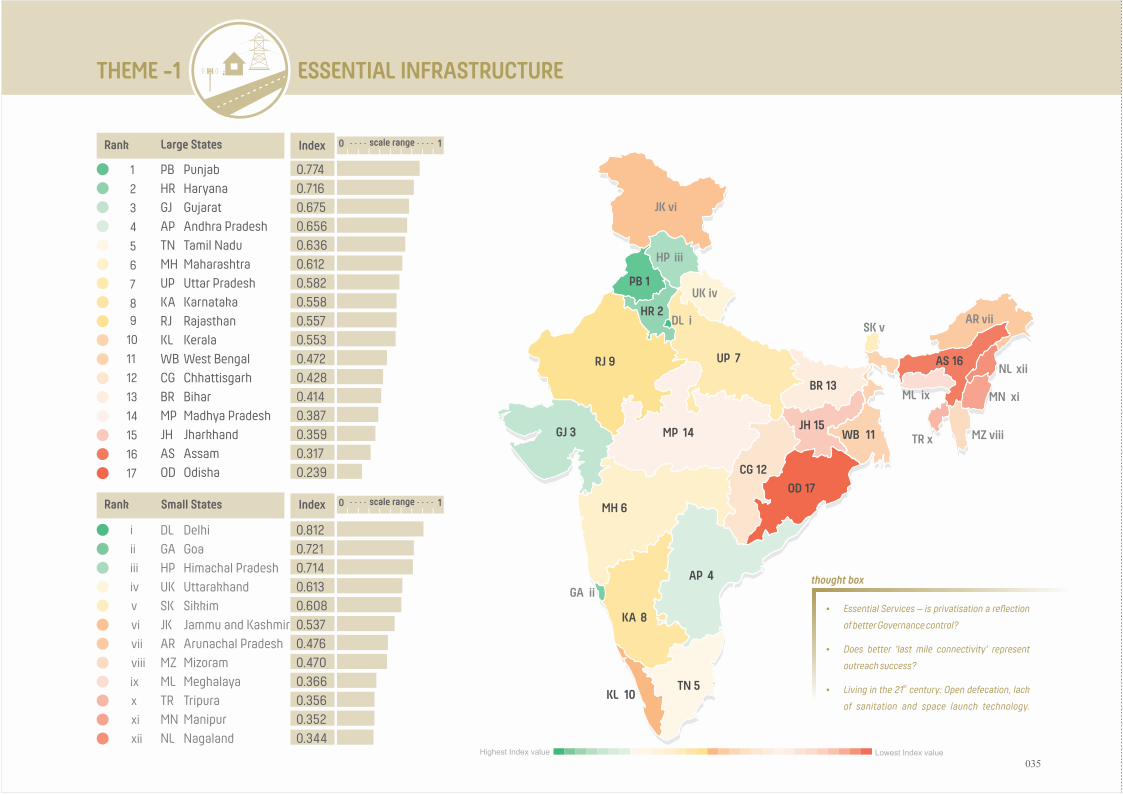
ESSENTIAL INFRASTRUCTURETHEME -1
PBHRGJAPTNMHUPKARJKLWBCGBRMPJHASOD
PunjabHaryanaGujaratAndhra PradeshTamil NaduMaharashtraUttar PradeshKarnatakaRajasthanKeralaWest BengalChhattisgarhBiharMadhya PradeshJharkhandAssamOdisha
0.7740.7160.6750.6560.6360.6120.5820.5580.5570.5530.4720.4280.4140.3870.3590.3170.239
1
2
3
4
5
6
7
89
10
11
12
13
14
15
16
17
Rank Large States Index
i
ii
iii
iv
v
vi
vii
viii
ix
x xi xii
DLGAHPUKSKJKARMZMLTRMNNL
DelhiGoaHimachal PradeshUttarakhandSikkimJammu and KashmirArunachal PradeshMizoramMeghalayaTripuraManipurNagaland
0.8120.7210.7140.6130.6080.5370.4760.4700.3660.3560.3520.344
Small StatesRank Index
AP 4
AS 16
BR 13
CG 12
GJ 3
HR 2
JH 15
KA 8
KL 10
MP 14
MH 6
OD 17
PB 1
RJ 9
TN 5
UP 7
WB 11
AR viiDL i
GA ii
HP iii
JK vi
MN xiML ix
MZ viii
NL xii
SK v
TR x
UK iv
Ÿ Essential Services – is privatisation a reflection
of better Governance control?
Ÿ Does better 'last mile connectivity' represent
outreach success?
stŸ Living in the 21 century: Open defecation, lack
of sanitation and space launch technology.
Highest Index value Lowest Index value
thought box
0 scale range 1
0 scale range 1
035
“The wars of the twenty first century will be fought over water.” Ismail Serageldin
The establishment of essential infrastructure has a lways been cons idered as a fundamenta l responsibility of the State, though this is in sharp contrast to a growing neo-liberal view that looks at this as a joint responsibility with the private sector, appointed after a due process of competitive price discovery. The toll-based roads are a successful example of the same. But in a country like India where the spectrum of economic and political ideology is large, the widely accepted emphasis is on the state to supply these basic infra requirements. The argument is that access to basic infrastructure falls within the fundamental rights of all citizens and is not a form of largesse by the State; thus it cannot be farmed out to the private sector or even certain forms of non-governmental organisations for this purpose.
In this study we are examining the comparative quality of governance with regard to four identified focus s u b j e c t s , n a m e l y p o w e r, w a t e r , r o a d s & communication and housing.
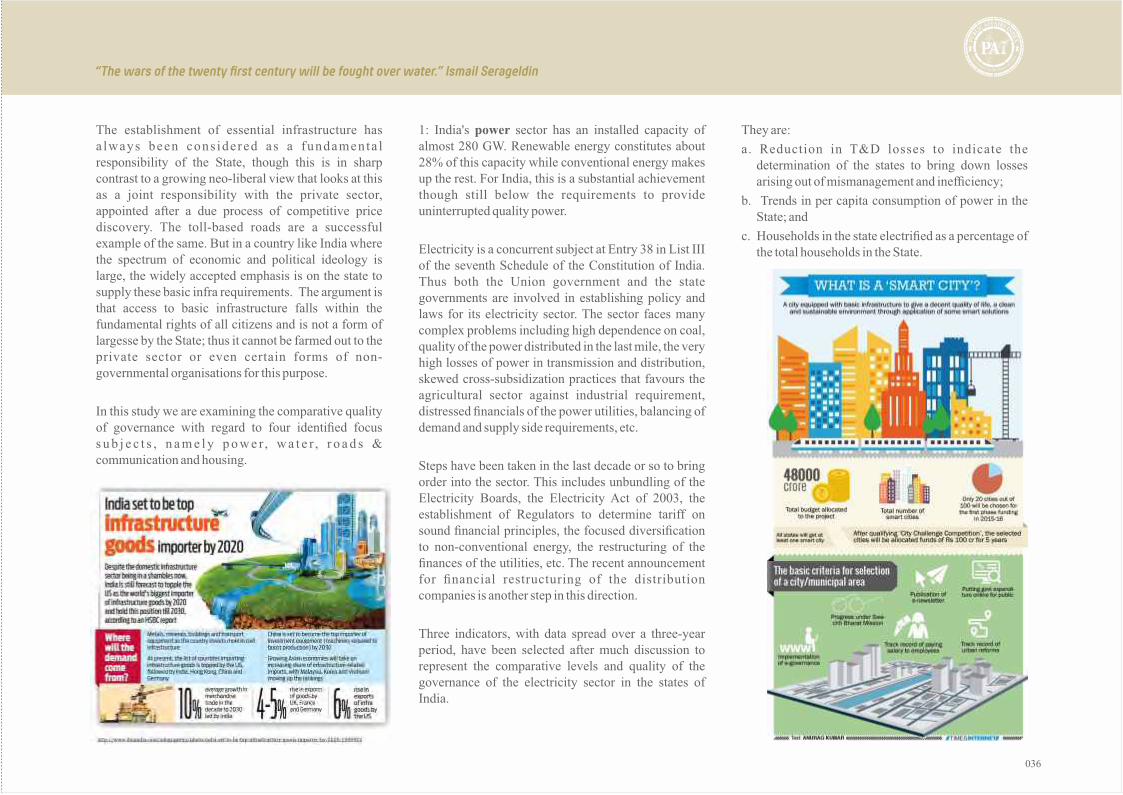
1: India's power sector has an installed capacity of almost 280 GW. Renewable energy constitutes about 28% of this capacity while conventional energy makes up the rest. For India, this is a substantial achievement though still below the requirements to provide uninterrupted quality power.
Electricity is a concurrent subject at Entry 38 in List III of the seventh Schedule of the Constitution of India. Thus both the Union government and the state governments are involved in establishing policy and laws for its electricity sector. The sector faces many complex problems including high dependence on coal, quality of the power distributed in the last mile, the very high losses of power in transmission and distribution, skewed cross-subsidization practices that favours the agricultural sector against industrial requirement, distressed financials of the power utilities, balancing of demand and supply side requirements, etc.
Steps have been taken in the last decade or so to bring order into the sector. This includes unbundling of the Electricity Boards, the Electricity Act of 2003, the establishment of Regulators to determine tariff on sound financial principles, the focused diversification to non-conventional energy, the restructuring of the finances of the utilities, etc. The recent announcement for financial restructuring of the distribution companies is another step in this direction.
Three indicators, with data spread over a three-year period, have been selected after much discussion to represent the comparative levels and quality of the governance of the electricity sector in the states of India.
They are:
a. Reduction in T&D losses to indicate thedetermination of the states to bring down lossesarising out of mismanagement and inefficiency;
b. Trends in per capita consumption of power in theState; and
c. Households in the state electrified as a percentage ofthe total households in the State.
FAIF RA S IC NIL DB EU XP
036
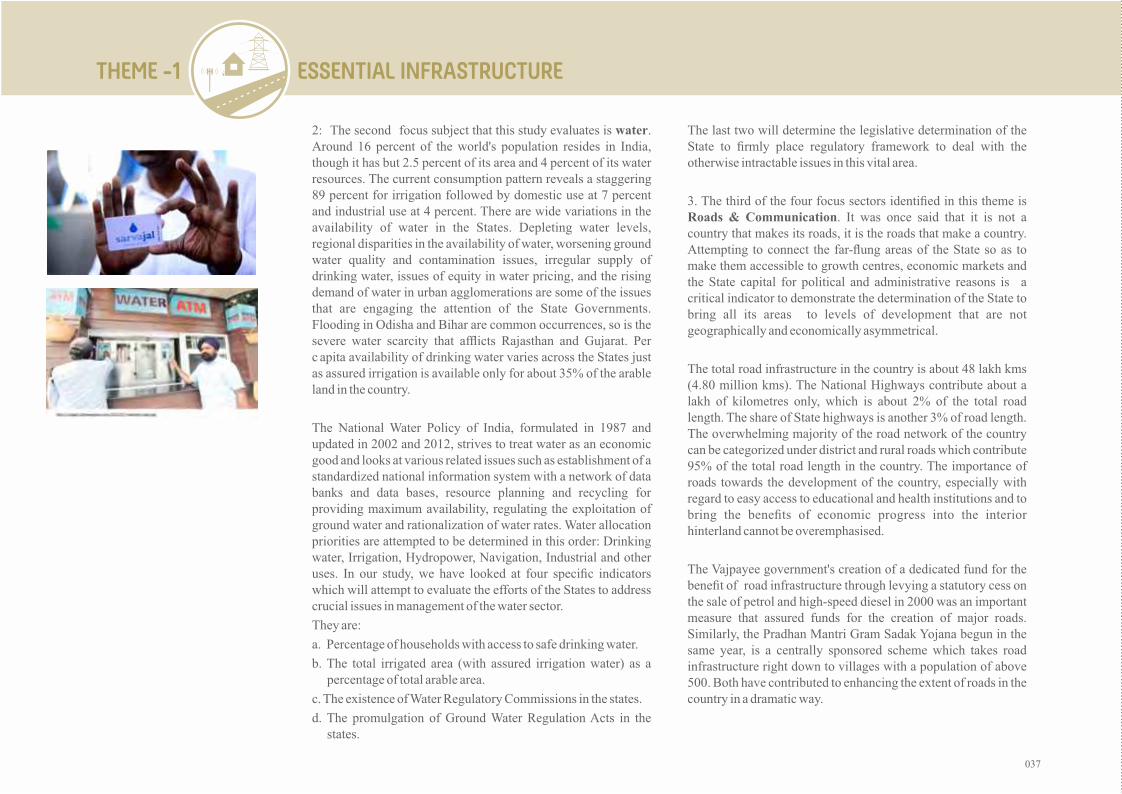
2: The second focus subject that this study evaluates is water. Around 16 percent of the world's population resides in India, though it has but 2.5 percent of its area and 4 percent of its water resources. The current consumption pattern reveals a staggering 89 percent for irrigation followed by domestic use at 7 percent and industrial use at 4 percent. There are wide variations in the availability of water in the States. Depleting water levels, regional disparities in the availability of water, worsening ground water quality and contamination issues, irregular supply of drinking water, issues of equity in water pricing, and the rising demand of water in urban agglomerations are some of the issues that are engaging the attention of the State Governments. Flooding in Odisha and Bihar are common occurrences, so is the severe water scarcity that afflicts Rajasthan and Gujarat. Per c apita availability of drinking water varies across the States just as assured irrigation is available only for about 35% of the arable land in the country.
The National Water Policy of India, formulated in 1987 and updated in 2002 and 2012, strives to treat water as an economic good and looks at various related issues such as establishment of a standardized national information system with a network of data banks and data bases, resource planning and recycling for providing maximum availability, regulating the exploitation of ground water and rationalization of water rates. Water allocation priorities are attempted to be determined in this order: Drinking water, Irrigation, Hydropower, Navigation, Industrial and other uses. In our study, we have looked at four specific indicators which will attempt to evaluate the efforts of the States to address crucial issues in management of the water sector.
They are:
a. Percentage of households with access to safe drinking water.
b. The total irrigated area (with assured irrigation water) as apercentage of total arable area.
c. The existence of Water Regulatory Commissions in the states.
d. The promulgation of Ground Water Regulation Acts in thestates.
The last two will determine the legislative determination of the State to firmly place regulatory framework to deal with the otherwise intractable issues in this vital area.
3. The third of the four focus sectors identified in this theme isRoads & Communication. It was once said that it is not acountry that makes its roads, it is the roads that make a country.Attempting to connect the far-flung areas of the State so as tomake them accessible to growth centres, economic markets andthe State capital for political and administrative reasons is acritical indicator to demonstrate the determination of the State tobring all its areas to levels of development that are notgeographically and economically asymmetrical.
The total road infrastructure in the country is about 48 lakh kms (4.80 million kms). The National Highways contribute about a lakh of kilometres only, which is about 2% of the total road length. The share of State highways is another 3% of road length. The overwhelming majority of the road network of the country can be categorized under district and rural roads which contribute 95% of the total road length in the country. The importance of roads towards the development of the country, especially with regard to easy access to educational and health institutions and to bring the benefits of economic progress into the interior hinterland cannot be overemphasised.
The Vajpayee government's creation of a dedicated fund for the benefit of road infrastructure through levying a statutory cess on the sale of petrol and high-speed diesel in 2000 was an important measure that assured funds for the creation of major roads. Similarly, the Pradhan Mantri Gram Sadak Yojana begun in the same year, is a centrally sponsored scheme which takes road infrastructure right down to villages with a population of above 500. Both have contributed to enhancing the extent of roads in thecountry in a dramatic way.
ESSENTIAL INFRASTRUCTURETHEME -1
037

In addition to roads, we are also looking at the density of mobile phone penetration in the country as a measure of connectivity of a different sort. Since the 1990s, the telecom industry went through rapid market liberalisation to become one of the world's most competitive and fastest growing markets. It has grown over 20 times in just 10 years with almost 100 crore users at present, with only China above it in terms of number of users. It would be incorrect to leave out the use of mobile phones in the States while making an assessment of connectivity through roads & communication as a focus subject.
The three indicators thus identified in the focus subject are:
a. Surfaced roads as a percentage of the total roads;
b. Road density per 1000 population.
c. Percentage of households with access to mobile phones.
FAIF RA S IC NIL DB EU XP
4. The final focus subject in this theme is housing. The PrimeMinister's Housing for All programme, to be achieved by 2022, isa major new urban initiative which attempts to plug a gap after theIndira Awas Yojana for rural housing for the BPL was startedseveral years ago. The challenges are daunting: it is expected thatthe annual growth of population in urban India will be about onecrore. One estimate indicates a requirement of about 11 crorehousing units by 2022. Of course, other schemes such as housingfor the Economically Weaker Sections (EWS) and subsidizedhousing loan schemes already exist in addition to loan schemesfrom commercial banks. The serious issues of expanding urbanareas, arising out of migratory populations and the aspirations ofthe burgeoning middle class, with attendant problems ofcleanliness and sanitation, have pushed the Government of Indiatowards the announcement of Swachh Bharat and the SmartCities missions, especially after the dismal picture that has comeout of the Socio-Economic Survey results brought out earlier withregard to habitation.
The specific indicators identified for this focus subject are:
a. Number of pucca houses as a percentage of population
b. Slum population as a percentage of urban population
c. Percentage of households with toilets inside premises.
Thus a total of 13 indicators spread over four focus subjects constitute the broad parameters for assessment and ranking of states in this theme of providing basic infrastructure. The results of our study reveal the following:
The results reveal that amongst the larger states Punjab stands at the top, followed closely by Haryana, Gujarat, Andhra Pradesh and Tamil Nadu. Jharkhand, Assam and Odisha stand at the bottom. Amongst the smaller states, it is Delhi and Goa at the top and Manipur and Nagaland at the bottom.
Note: The data and state wise rankings as shown in images and visualisation may not match PAI findings as period, indicators, methodology may differ.
038

AF IF RSA IC NI DLB EXUP
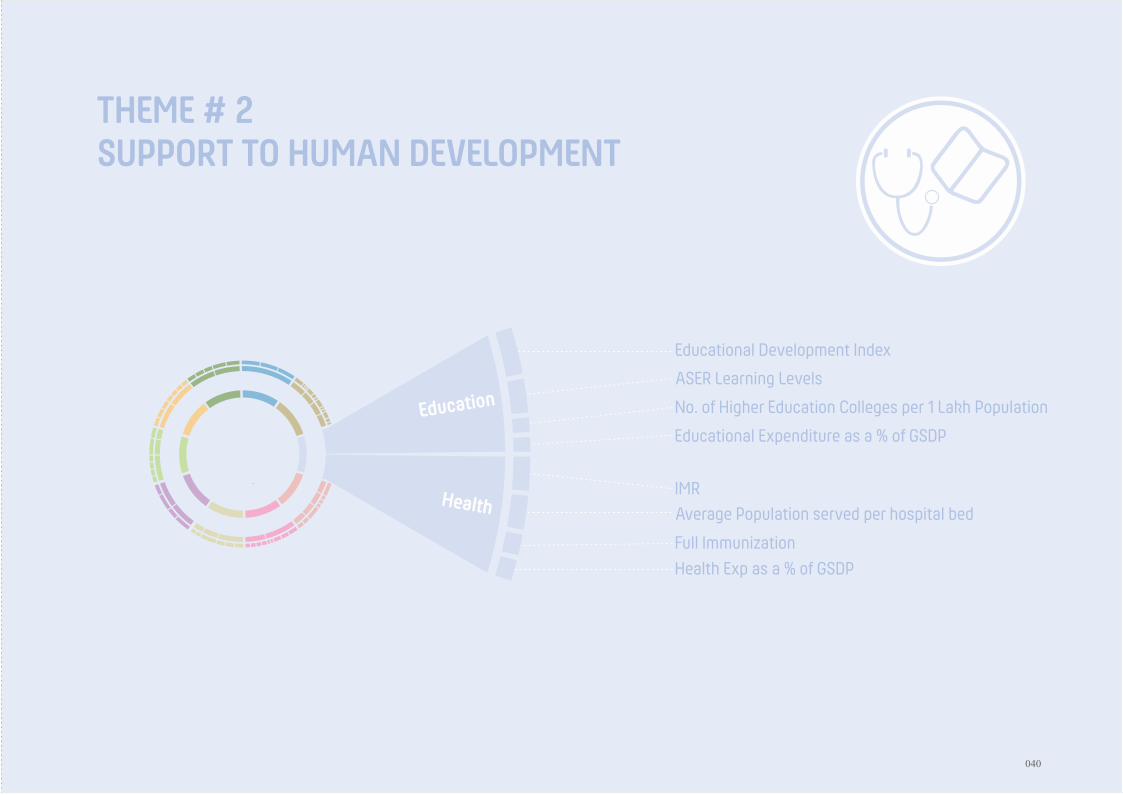
THEME # 2SUPPORT TO HUMAN DEVELOPMENT
Education
Health
Educational Development Index
ASER Learning Levels
No. of Higher Education Colleges per 1 Lakh Population
Educational Expenditure as a % of GSDP
IMRAverage Population served per hospital bed
Full ImmunizationHealth Exp as a % of GSDP
040

THEME # 2 SUPPORT TO HUMAN DEVELOPMENT
1
2
3
4
5
6
7
89
10
11
12
13
14
15
16
17
Rank Large States Index
KLPBKATNAPHRMHODRJGJWBASCGJHUPMPBR
KeralaPunjabKarnatakaTamil NaduAndhra PradeshHaryanaMaharashtraOdishaRajasthanGujaratWest BengalAssamChhattisgarhJharkhandUttar PradeshMadhya PradeshBihar
0.6920.6370.5800.5510.5490.5480.5100.4390.4390.4310.4200.4150.3910.2880.2840.2660.220
SKMNMZHPGANLUKMLTRDLJKAR
SikkimManipurMizoramHimachal PradeshGoaNagalandUttarakhandMeghalayaTripuraDelhiJammu and KashmirArunachal Pradesh
i
ii
iii
iv
v
vi
vii
viii
ix
x xi xii
Small StatesRank Index
0.7700.7460.7270.7240.6430.5910.5830.5730.5650.5390.5110.492
AP 5
AS 12
BR 17
CG 13
GJ 10
HR 6
JH 14
KA 3
KL 1
MP 16
MH 7
OD 8
PB 2
RJ 9
TN 4
UP 15
WB 11
AR xiiDL x
GA v
HP iv
JK xi
MN iiML viii
MZ iii
NL vi
SK i
TR ix
UK vii
Ÿ Healthcare Services: is there an independent
Regulator?
Ÿ Mid-day Meals: Is school-attendance being
driven by hunger - Does it guarantee access to
learning?
thought box
0 scale range 1
0 scale range 1
Highest Index value Lowest Index value
041

The second of the broad themes identified in the PAI is the quality and nature of the support being provided by the States for the education and health of the citizens. It cannot be denied that these two focus subjects contribute hugely to the development of the human capital. Two of the three indicators used in UNDP's Human Development Index pertain to health and education. It may be said that the future of any people depends to a great extent on the inputs provided by the State towards these two life-quality enhancing interventions.
Education is the first of the two focus subjects identified in this theme. India has made great strides in the field of education. In the 60s, the Kothari Commission had laid down the basic requirements for a progressive and extensive education structure in the
ndcountry. In 1976, as part of the 'infamous '42 amendment to the Constitution, promulgated at the height of the Emergency, the subject of education was placed in the Concurrent List. Later, almost four decades after Independence, with the passage of the Right of Children to Free and Compulsory Education Act in 2005 (RTE), elementary education became a right.
There are, however, serious issues in learning outcomes which remain deplorable despite heavy financial and human inputs in the education sector over the last few decades. Even today women's literacy rate for the country is just about 65%. We are nowhere near the recommended figure of 6% of GDP for expenditure on education. While the Sarva Shiksha Abhiyan made valuable contributions to improving educational infrastructure in the country, there is much to be said regarding the poor quality of education in the public schooling system. The ASER reports only emphasize this point year after year.
In order to capture the levels of governance in the states on a vast subject such as education, we have identified five indicators:
1a. Educational Development Index (EDI)
b. ASER learning levels.
c. Number of higher education colleges per unit ofpopulation
d. Educational expenditure as a percentage of SDP.
It is our expectation that these indicators will be representative enough to capture a broad view of the governance of the education sector across the various states of India.
“Education of the mind without educating the heart is no education at all.” Aristotle.
FAIF RA S IC NIL DB EU XP
1 The EDI comprises about 20 indicators covering different aspects of education such as access, infrastructure, teachers and outcomes. For further information please visit www.dise.in
042

THEME # 2 SUPPORT TO HUMAN DEVELOPMENT
The second focus subject is health. The Constitution places the responsibility of health directly on the States. However, there are strong interventions by the Central Government to assist the states in the task. The National Health Policy was endorsed by the Parliament of India in 1983 and updated in 2002. The National Health Mission, both for rural and urban areas, is an important thrust area for the country. There are severe disparities in the indicators used for assessing the health parameters between the States. These are reflected in standard indicators such as Infant Mortality Rate, Maternal Mortality Rate, Life expectancy, percentage of immunization, hospital beds and staff per unit of population, nutrition levels, etc. Issues related to safe drinking water, gender issues, nutrition levels, etc cannot be isolated from the discussions on health. The hierarchical network of medical institutions starting from sub-centres at the grass root level, the Primary Health Centres, Community Health Centres, the District hospitals providing secondary health care, as well as State and specialization hospitals at the tertiary level, all contribute to the efforts made by the country in this sector. By end 2014, there were 1,52,326 Sub Centres, 25,020 Primary Health Centres (PHCs) and 5,363 Community Health Centres (CHCs) functioning in the country.
In our study, we are assessing these health indicators for comparison amongst States:
a. IMR
b. Average Population served by a hospital bed
c. Full immunization
d. Expenditure on health as a percentage of state GDP.
We are conscious of the fact that the two focus subjects and the eight indicators may be limited in scope as to fully evaluate the nature and quality of governance in support given for human development; however, they will certainly serve in obtaining a reasonable assessment of the manner in which health and education are governed and managed in the States. Our results reveal the following:
Again, to no one's surprise, Kerala stands at the top of the category of large states, with Punjab Karnataka, Tamil Nadu and Andhra Pradesh following. Uttar Pradesh, Madhya Pradesh and Bihar are at the bottom. Amongst smaller states, Sikkim and Manipur lead the list while J&K and Arunachal Pradesh are at the bottom.
IMAGE
043
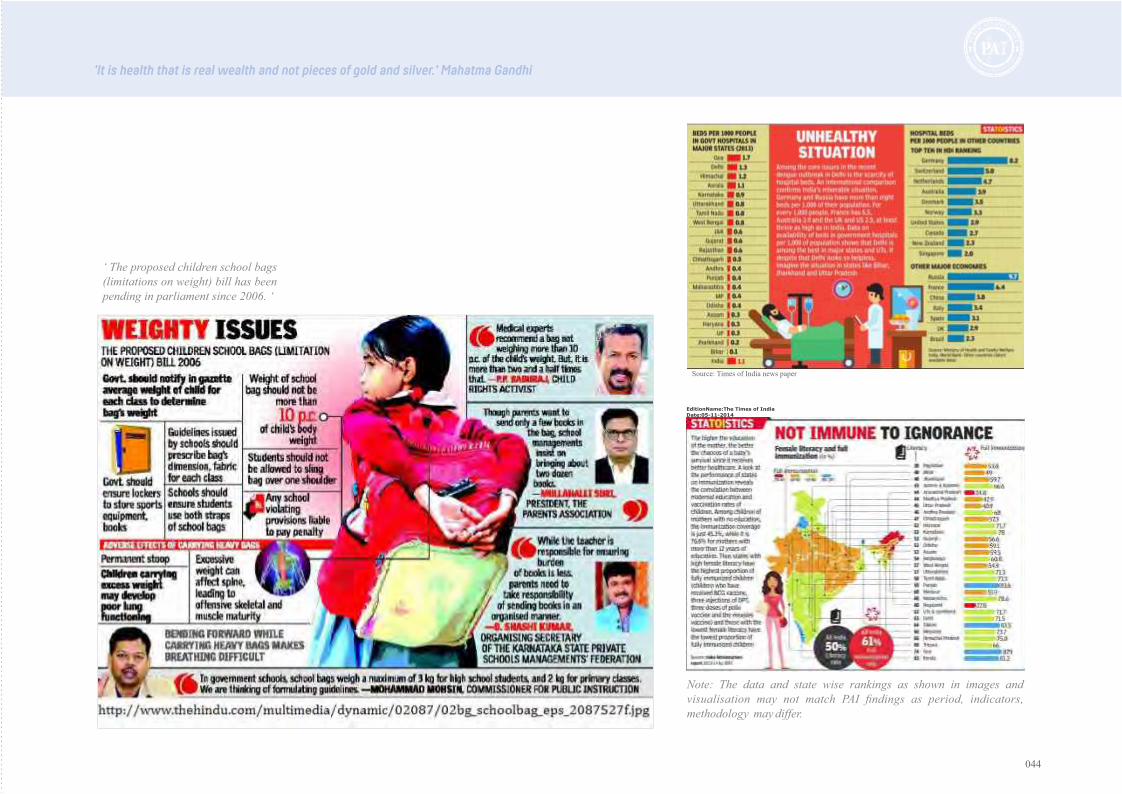
IMAGE
FAIF RA S IC NIL DB EU XP
‘ The proposed children school bags (limitations on weight) bill has been pending in parliament since 2006. ‘
IMAGE
Source: Times of India news paper
EditionName:The Times of IndiaDate:05-11-2014
Note: The data and state wise rankings as shown in images and visualisation may not match PAI findings as period, indicators, methodology may differ.
'It is health that is real wealth and not pieces of gold and silver.' Mahatma Gandhi
044

AF IF RSA IC NI DLB EXUP
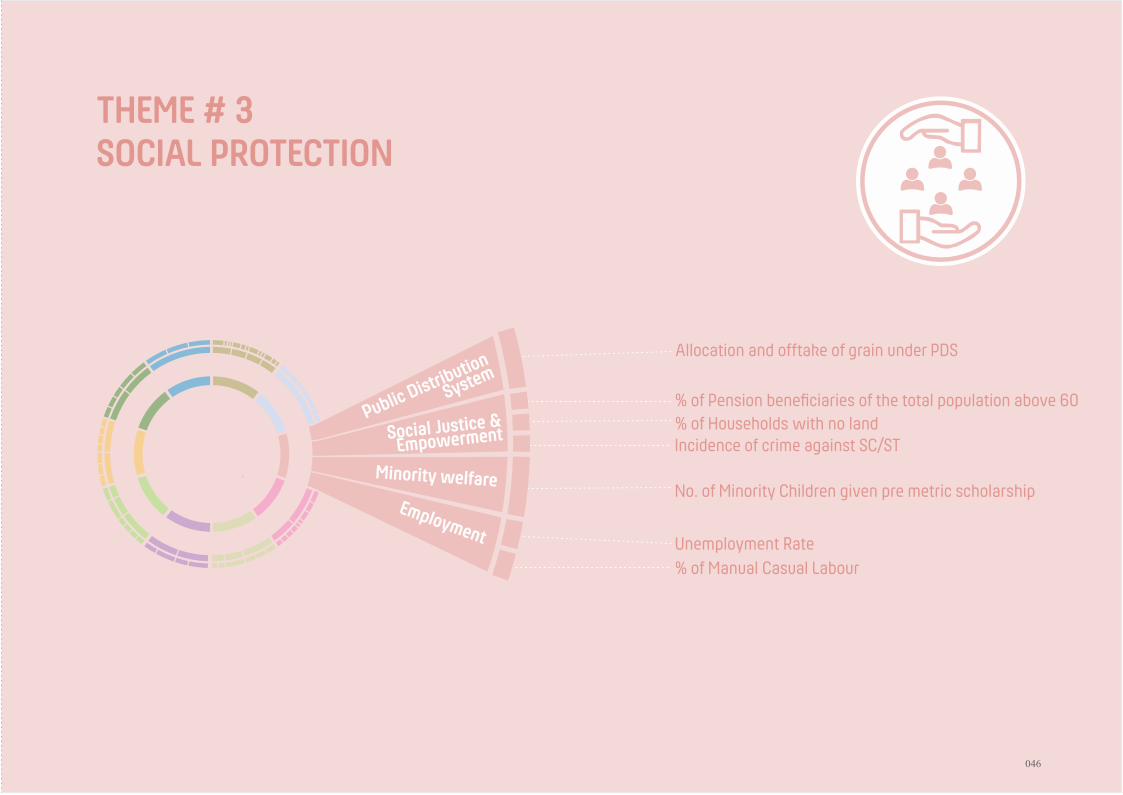
THEME # 3
Public Distribution
System
Social Justice &Empowerment
Minority welfareEmployment
Allocation and offtake of grain under PDS
% of Pension beneficiaries of the total population above 60% of Households with no landIncidence of crime against SC/ST
No. of Minority Children given pre metric scholarship
Unemployment Rate% of Manual Casual Labour
SOCIAL PROTECTION
046
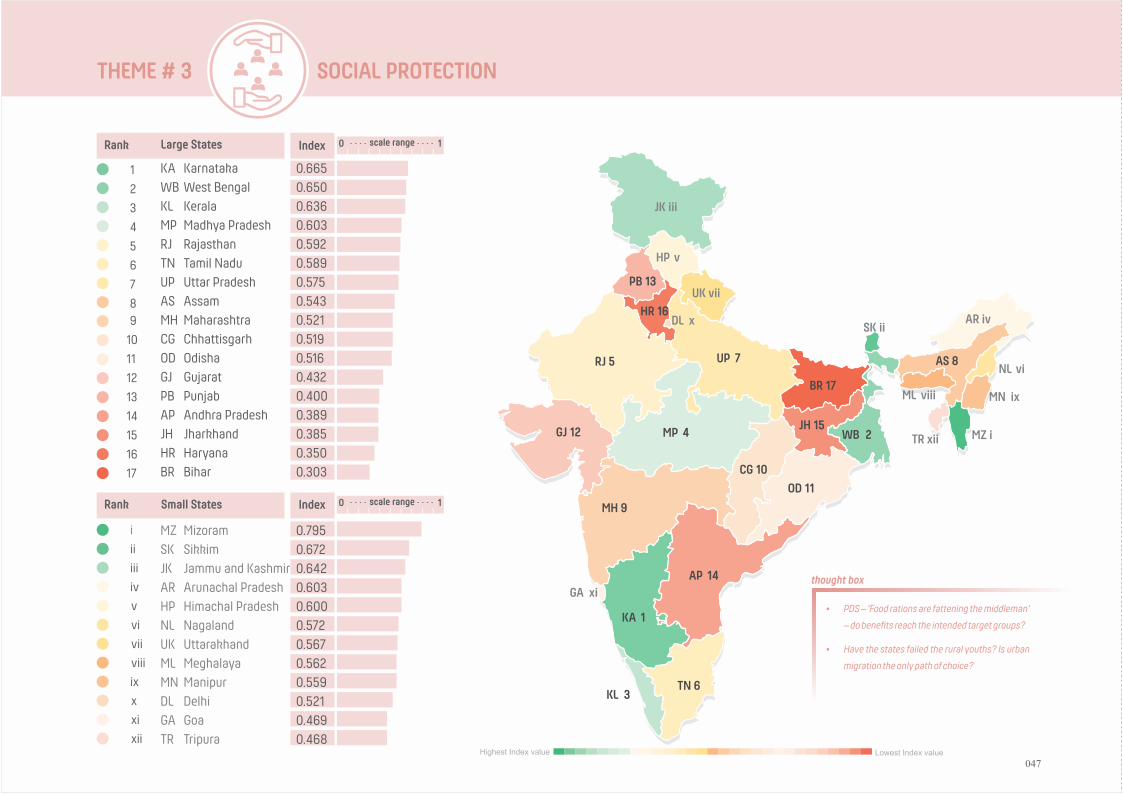
THEME # 3 SOCIAL PROTECTION
1
2
3
4
5
6
7
89
10
11
12
13
14
15
16
17
Rank Large States Index
KAWBKLMPRJTNUPASMHCGODGJPBAPJHHRBR
KarnatakaWest BengalKeralaMadhya PradeshRajasthanTamil NaduUttar PradeshAssamMaharashtraChhattisgarhOdishaGujaratPunjabAndhra PradeshJharkhandHaryanaBihar
0.6650.6500.6360.6030.5920.5890.5750.5430.5210.5190.5160.4320.4000.3890.3850.3500.303
i
ii
iii
iv
v
vi
vii
viii
ix
x xi xii
Small StatesRank Index
MZSKJKARHPNLUKMLMNDLGATR
MizoramSikkimJammu and KashmirArunachal PradeshHimachal PradeshNagalandUttarakhandMeghalayaManipurDelhiGoaTripura
0.7950.6720.6420.6030.6000.5720.5670.5620.5590.5210.4690.468
AP 14
AS 8
BR 17
CG 10
GJ 12
HR 16
JH 15
KA 1
KL 3
MP 4
MH 9
OD 11
PB 13
RJ 5
TN 6
UP 7
WB 2
AR ivDL x
GA xi
HP v
JK iii
MN ixML viii
MZ i
NL vi
SK ii
TR xii
UK vii
Ÿ PDS – 'Food rations are fattening the middleman'
– do benefits reach the intended target groups?
Ÿ Have the states failed the rural youths? Is urban
migration the only path of choice?
thought box
0 scale range 1
0 scale range 1
Highest Index value Lowest Index value
047
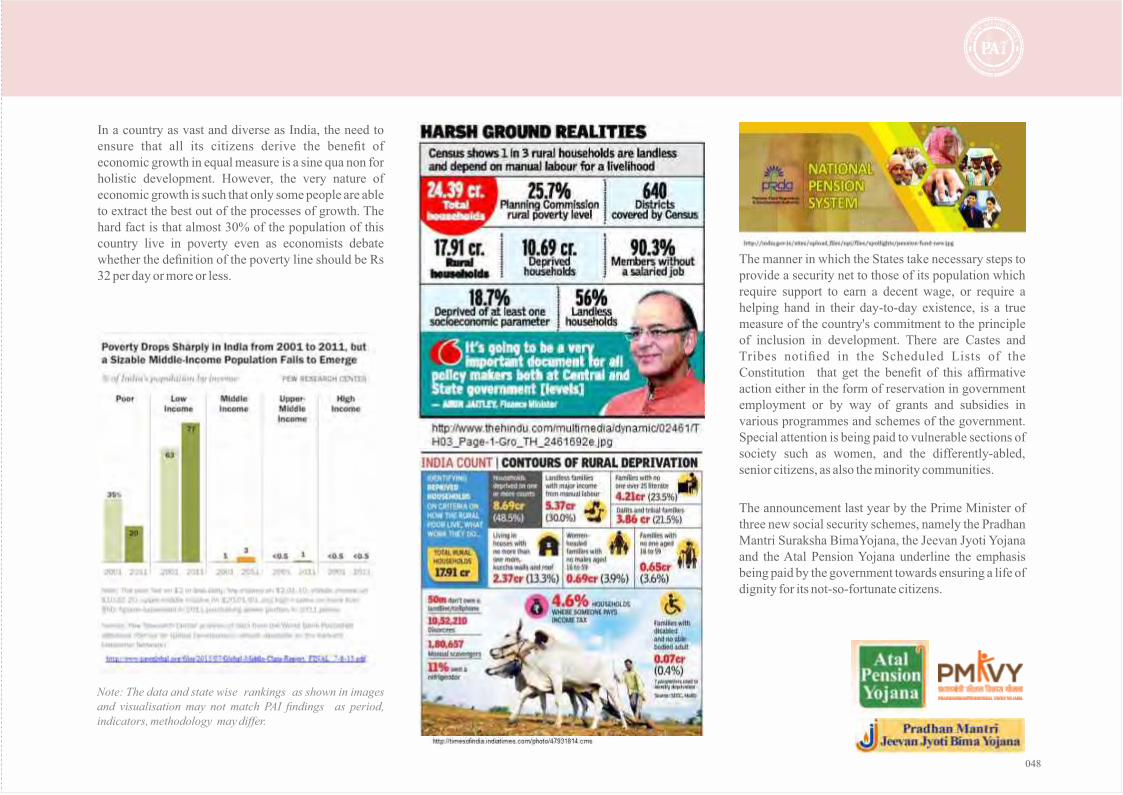
In a country as vast and diverse as India, the need to ensure that all its citizens derive the benefit of economic growth in equal measure is a sine qua non for holistic development. However, the very nature of economic growth is such that only some people are able to extract the best out of the processes of growth. The hard fact is that almost 30% of the population of this country live in poverty even as economists debate whether the definition of the poverty line should be Rs 32 per day or more or less.
The manner in which the States take necessary steps to provide a security net to those of its population which require support to earn a decent wage, or require a helping hand in their day-to-day existence, is a true measure of the country's commitment to the principle of inclusion in development. There are Castes and Tribes notified in the Scheduled Lists of the Constitution that get the benefit of this affirmative action either in the form of reservation in government employment or by way of grants and subsidies in various programmes and schemes of the government. Special attention is being paid to vulnerable sections of society such as women, and the differently-abled, senior citizens, as also the minority communities.
The announcement last year by the Prime Minister of three new social security schemes, namely the Pradhan Mantri Suraksha BimaYojana, the Jeevan Jyoti Yojana and the Atal Pension Yojana underline the emphasis being paid by the government towards ensuring a life of dignity for its not-so-fortunate citizens.
FAIF RA S IC NIL DB EU XP
Note: The data and state wise rankings as shown in images and visualisation may not match PAI findings as period, indicators, methodology may differ.
048

In fact, the Five Year Plans that were hitherto formulated under the aegis of the Planning Commission have tried to reflect this concern for social protection and empowerment in its vision
thstatements issued from time to time. The 11 Five Year Plan (2007-12) stated in its vision document that the Plan was,
“an opportunity to restructure policies to achieve a new vision
based on faster, more broad - based and inclusive growth. It is
designed to reduce poverty and focus on bridging the various
divides that continue to fragment our society.”
thSo also the current 12 Five year Plan (2012-2017) has as its
byline the phrase “faster, more inclusive and sustainable
growth.” These concerns are partly addressed by making
adequate provisions in the budgets of the relevant departments
that cater to the well-being of the poor and the deprived.
Typically, enhanced budgets for health, education, social sector
programmes for women, BPL families, children, the differently
enabled, the minorities etc reflect this national concern. Recently,
after the annual budget for the year 2015-16 was presented in the
Parliament, there was much criticism for reduced outlays in some
of these critical social sectors. Fortunately, we see an attempt to
make a correction in the new budget for the year 2016-17 which thwas presented in the Parliament on 29 February 2016. The role
of the Planning Commission in the past to address these issues
and focus national attention on these sectors deserves to be
applauded.
In our study of this broad theme, we are not examining the normal indicators of reservation in jobs as this is a growingly contentious issue and there is sufficient debate about the pros and cons of the same. Further, reliable data across states of affirmative action in employment through the constitutional device of reservation, is not available. Rather, we have identified four focus areas for assessment and evaluation, namely, the Public Distribution System, Social Justice and Empowerment (through a representative scheme of old age pensions), Employment and Minority welfare.
THEME # 3 SOCIAL PROTECTION
049
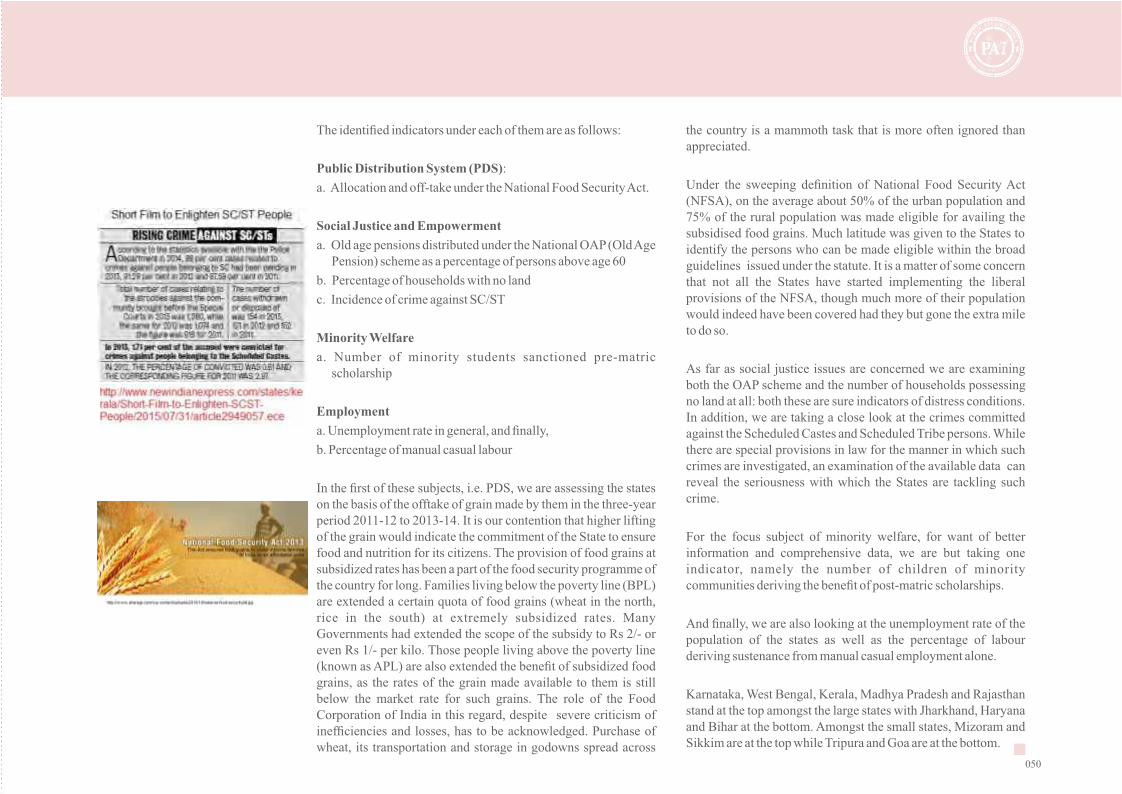
The identified indicators under each of them are as follows:
Public Distribution System (PDS):
a. Allocation and off-take under the National Food Security Act.
Social Justice and Empowerment
a. Old age pensions distributed under the National OAP (Old AgePension) scheme as a percentage of persons above age 60
b. Percentage of households with no land
c. Incidence of crime against SC/ST
Minority Welfare
a. Number of minority students sanctioned pre-matricscholarship
Employment
a. Unemployment rate in general, and finally,
b. Percentage of manual casual labour
In the first of these subjects, i.e. PDS, we are assessing the states on the basis of the offtake of grain made by them in the three-year period 2011-12 to 2013-14. It is our contention that higher lifting of the grain would indicate the commitment of the State to ensure food and nutrition for its citizens. The provision of food grains at subsidized rates has been a part of the food security programme of the country for long. Families living below the poverty line (BPL) are extended a certain quota of food grains (wheat in the north, rice in the south) at extremely subsidized rates. Many Governments had extended the scope of the subsidy to Rs 2/- or even Rs 1/- per kilo. Those people living above the poverty line (known as APL) are also extended the benefit of subsidized food grains, as the rates of the grain made available to them is still below the market rate for such grains. The role of the Food Corporation of India in this regard, despite severe criticism of inefficiencies and losses, has to be acknowledged. Purchase of wheat, its transportation and storage in godowns spread across
the country is a mammoth task that is more often ignored than appreciated.
Under the sweeping definition of National Food Security Act (NFSA), on the average about 50% of the urban population and 75% of the rural population was made eligible for availing the subsidised food grains. Much latitude was given to the States to identify the persons who can be made eligible within the broad guidelines issued under the statute. It is a matter of some concern that not all the States have started implementing the liberal provisions of the NFSA, though much more of their population would indeed have been covered had they but gone the extra mile to do so.
As far as social justice issues are concerned we are examining both the OAP scheme and the number of households possessing no land at all: both these are sure indicators of distress conditions. In addition, we are taking a close look at the crimes committed against the Scheduled Castes and Scheduled Tribe persons. While there are special provisions in law for the manner in which such crimes are investigated, an examination of the available data can reveal the seriousness with which the States are tackling such crime.
For the focus subject of minority welfare, for want of better information and comprehensive data, we are but taking one indicator, namely the number of children of minority communities deriving the benefit of post-matric scholarships.
And finally, we are also looking at the unemployment rate of the population of the states as well as the percentage of labour deriving sustenance from manual casual employment alone.
Karnataka, West Bengal, Kerala, Madhya Pradesh and Rajasthan stand at the top amongst the large states with Jharkhand, Haryana and Bihar at the bottom. Amongst the small states, Mizoram and Sikkim are at the top while Tripura and Goa are at the bottom.
FAIF RA S IC NIL DB EU XP
050
AF IF RSA IC NI DLB EXUP

THEME # 4WOMEN AND CHILDREN
Child
Women
Crime against Children
Percentage of Child Labour
% of Beneficiaries under ICDS
Child Sex Ratio
% of Malnourished children
Women Working Population ratio
Utilization of Janani Suraksha Yojna Funds
Male Female Literacy Gap
Institutional Delivery
052
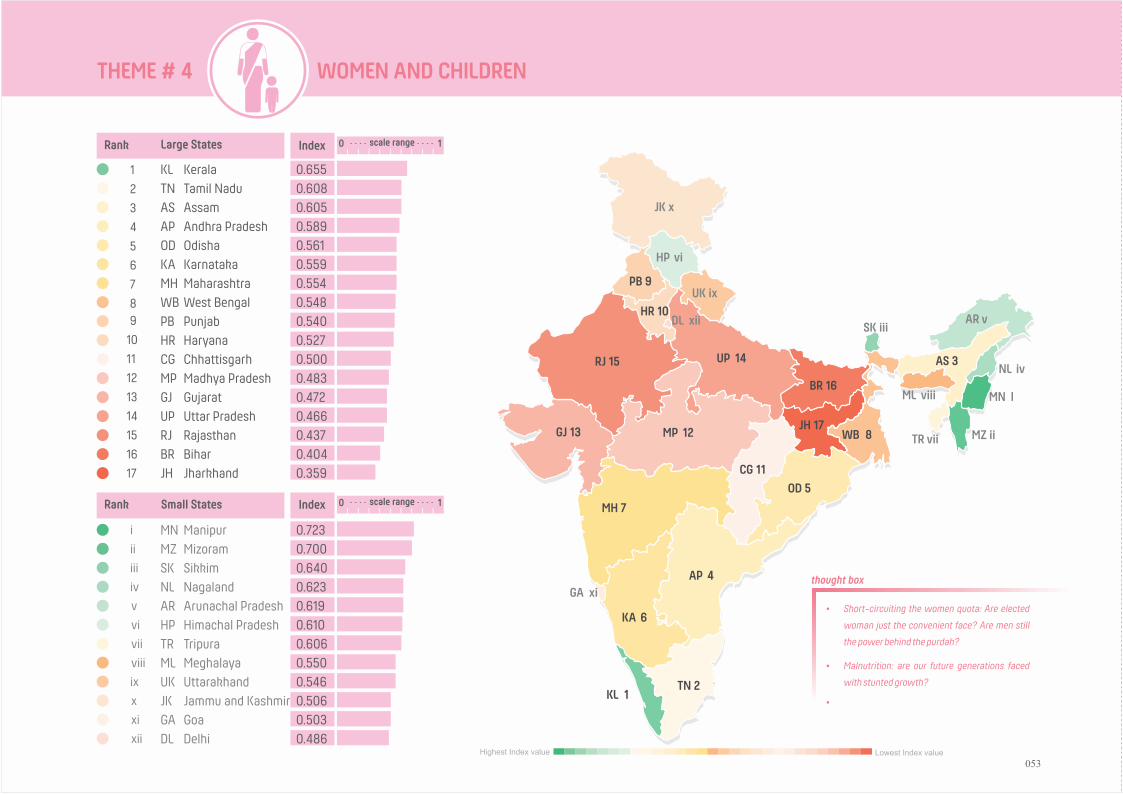
THEME # 4 WOMEN AND CHILDREN
1
2
3
4
5
6
7
89
10
11
12
13
14
15
16
17
Rank Large States Index
KLTNASAPODKAMHWBPBHRCGMPGJUPRJBRJH
KeralaTamil NaduAssamAndhra PradeshOdishaKarnatakaMaharashtraWest BengalPunjabHaryanaChhattisgarhMadhya PradeshGujaratUttar PradeshRajasthanBiharJharkhand
0.6550.6080.6050.5890.5610.5590.5540.5480.5400.5270.5000.4830.4720.4660.4370.4040.359
i
ii
iii
iv
v
vi
vii
viii
ix
x xi xii
Small StatesRank Index
MNMZSKNLARHPTRMLUKJKGADL
ManipurMizoramSikkimNagalandArunachal PradeshHimachal PradeshTripuraMeghalayaUttarakhandJammu and KashmirGoaDelhi
0.7230.7000.6400.6230.6190.6100.6060.5500.5460.5060.5030.486
AP 4
AS 3
BR 16
CG 11
GJ 13
HR 10
JH 17
KA 6
KL 1
MP 12
MH 7
OD 5
PB 9
RJ 15
TN 2
UP 14
WB 8
AR vDL xii
GA xi
HP vi
JK x
MN IML viii
MZ ii
NL iv
SK iii
TR vii
UK ix
Ÿ Short-circuiting the women quota: Are elected
woman just the convenient face? Are men still
the power behind the purdah?
Ÿ Malnutrition: are our future generations faced
with stunted growth?
Ÿ
thought box
0 scale range 1
0 scale range 1
Highest Index value Lowest Index value
053
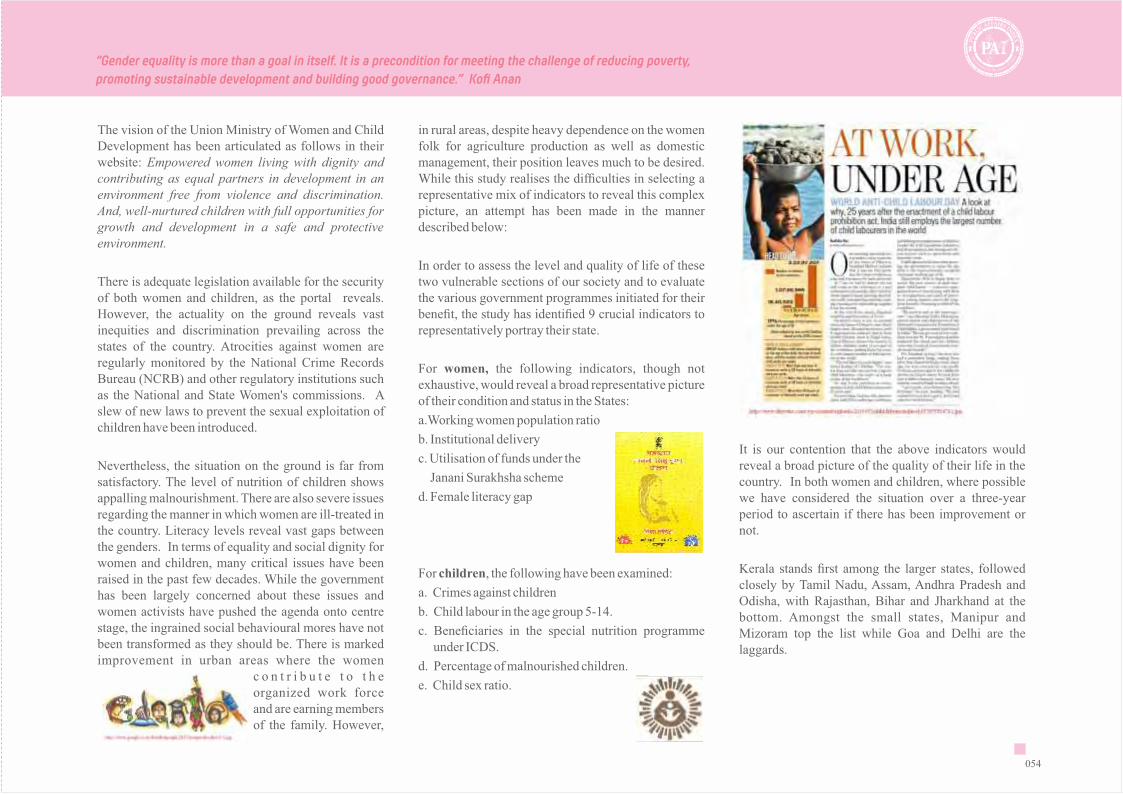
The vision of the Union Ministry of Women and Child Development has been articulated as follows in their website: Empowered women living with dignity and contributing as equal partners in development in an environment free from violence and discrimination. And, well-nurtured children with full opportunities for growth and development in a safe and protective environment.
There is adequate legislation available for the security of both women and children, as the portal reveals. However, the actuality on the ground reveals vast inequities and discrimination prevailing across the states of the country. Atrocities against women are regularly monitored by the National Crime Records Bureau (NCRB) and other regulatory institutions such as the National and State Women's commissions. A slew of new laws to prevent the sexual exploitation of children have been introduced.
Nevertheless, the situation on the ground is far from satisfactory. The level of nutrition of children shows appalling malnourishment. There are also severe issues regarding the manner in which women are ill-treated in the country. Literacy levels reveal vast gaps between the genders. In terms of equality and social dignity for women and children, many critical issues have been raised in the past few decades. While the government has been largely concerned about these issues and women activists have pushed the agenda onto centre stage, the ingrained social behavioural mores have not been transformed as they should be. There is marked improvement in urban areas where the women
c o n t r i b u t e t o t h e organized work force and are earning members of the family. However,
in rural areas, despite heavy dependence on the women folk for agriculture production as well as domestic management, their position leaves much to be desired. While this study realises the difficulties in selecting a representative mix of indicators to reveal this complex picture, an attempt has been made in the manner described below:
In order to assess the level and quality of life of these two vulnerable sections of our society and to evaluate the various government programmes initiated for their benefit, the study has identified 9 crucial indicators to representatively portray their state.
For women, the following indicators, though not exhaustive, would reveal a broad representative picture of their condition and status in the States:
a.Working women population ratio
b. Institutional delivery
c. Utilisation of funds under the
Janani Surakhsha scheme
d. Female literacy gap
For children, the following have been examined:
a. Crimes against children
b. Child labour in the age group 5-14.
c. Beneficiaries in the special nutrition programmeunder ICDS.
d. Percentage of malnourished children.
e. Child sex ratio.
It is our contention that the above indicators would reveal a broad picture of the quality of their life in the country. In both women and children, where possible we have considered the situation over a three-year period to ascertain if there has been improvement or not.
Kerala stands first among the larger states, followed closely by Tamil Nadu, Assam, Andhra Pradesh and Odisha, with Rajasthan, Bihar and Jharkhand at the bottom. Amongst the small states, Manipur and Mizoram top the list while Goa and Delhi are the laggards.
“Gender equality is more than a goal in itself. It is a precondition for meeting the challenge of reducing poverty, promoting sustainable development and building good governance.” Kofi Anan
FAIF RA S IC NIL DB EU XP
054
AF IF RSA IC NI DLB EXUP
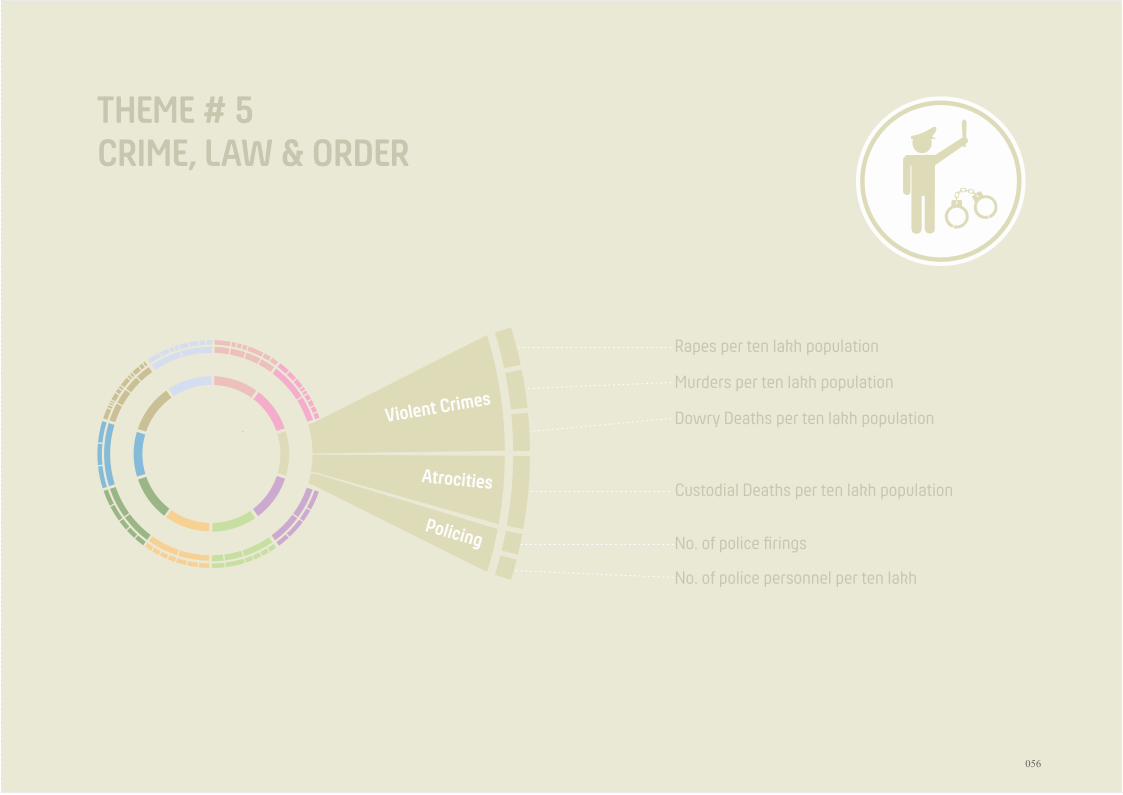
THEME # 5CRIME, LAW & ORDER
Violent Crimes
Atrocities
Policing
Rapes per ten lakh population
Murders per ten lakh population
Dowry Deaths per ten lakh population
Custodial Deaths per ten lakh population
No. of police firings
No. of police personnel per ten lakh
056

CRIME, LAW & ORDERTHEME # 5
1
2
3
4
5
6
7
89
10
11
12
13
14
15
16
17
Rank Large States Index
TNGJKLPBWBMHAPKACGBRRJODASMPJHUPHR
Tamil NaduGujaratKeralaPunjabWest BengalMaharashtraAndhra PradeshKarnatakaChhattisgarhBiharRajasthanOdishaAssamMadhya PradeshJharkhandUttar PradeshHaryana
0.7240.6700.6580.6500.6410.6220.6030.5970.5540.5370.5360.5100.5100.4990.4950.4410.406
i
ii
iii
iv
v
vi
vii
viii
ix
x xi xii
Small StatesRank Index
MNNLMZJKHPSKARUKGAMLTRDL
ManipurNagalandMizoramJammu and KashmirHimachal PradeshSikkimArunachal PradeshUttarakhandGoaMeghalayaTripuraDelhi
0.7950.6820.6740.6540.6530.6450.6350.6320.6140.5950.5540.415
AP 7
AS 13
BR 10
CG 9
GJ 2
HR 17
JH 15
KA 8
KL 3
MP 14
MH 6
OD 12
PB 4
RJ 11
TN 1
UP 16
WB 5
AR viiDL xii
GA ix
HP v
JK iv
MN IML x
MZ iii
NL ii
SK vi
TR xi
UK viii
Ÿ Are all Rapes being reported?
Ÿ Police atrocities: the dark side of khakhi: is it the
protector or the perpetrator?
Ÿ Prisons are overcrowded: two-thirds of prison
inmates are under trials.
thought box
0 scale range 1
0 scale range 1
Highest Index value Lowest Index value
057

Even before serious issues of economic and social development of the State are considered, there is the essential requirement for the State administration to ensure that crime is prevented and law and order maintained. Crime and Law & Order are two terms often mentioned in the same breath. They are, however, different and the responsibility of the State, towards these two imperative preconditions to development, has to be evaluated separately.
Crime is the action of individuals against the State or against other individuals. They may include economic offences (where the State may be the aggrieved party) or crimes committed for personal profit or passion (where the offended parties are other individuals or groups). The prevention of crime is a fundamental duty of the State; equally, where the crime has been committed despite the vigilance of the State, the detection of the crime and the criminals and bringing them to justice is a vital and essential role of the State.
Law and order pertains to public tranquillity and peace. In the event of social disturbances, public agitations by large sections of the society or caste/class-based uprising which threaten to disrupt the normal life in the State, it is for the State machinery to ensure that the aggrieved parties are brought to the negotiation table and matters negotiated, without causing any disruption to normal life in the State. Often, everyday economic activities are disturbed, public property is damaged and serious conflagrations take place, affecting the lives and properties of ordinary citizens. This can have serious repercussions calling to question the authority and efficacy of the State in maintaining peace and tranquillity. The situation may at times be so explosive that large parts of the country may be affected, such as the situation arising out of the assassination of Smt Indira Gandhi in 1984 or the destruction of Babri
Masjid in 1992 or the communal conflagration in Gujarat in 2002. The ability of the State to defuse a potentially dangerous law and order situation and resolve the issue with negotiation and discussion between the agitating parties is an indication of the high political and administrative skills of the State machinery.
As the website of the Ministry of Home Affairs categorically states:
“ 'Police' and 'Public Order' are State subjects under the
Seventh Schedule to the Constitution of India and
therefore, it is the primary duty of the State
Governments to prevent, detect, register and
investigate crime and prosecute the criminals. Central
Government, however, supplements the efforts of the
State Governments by providing them financial
assistance for modernization of their Police Forces in
terms of weaponry, communication, equipment,
mobility, training and other infrastructure under the
Scheme of Modernization of State Police Forces.
Further, intelligence inputs are regularly shared by the
Central Security and Intelligence Agencies with the
State Law Enforcement Agencies to prevent crime and
law and order related incidents.”
There are occasions when serious conflagrations of an
extreme nature, or those not restricted to one state
alone, have to be tackled by the deployment of central
para military forces or by the presence of the Army
itself, on the requisition of the State Government. In
such situations there is close coordination between the
state and the Union Government so as to restore
normalcy at the earliest. In some cases, such as the
heinous case of rape in Delhi some years ago, there can
be serious repercussions on the whole country,
bringing into question the very provisions and
processes of law mandated to protect the victim from
the predator. It may be recalled that the Justice JS
Verma Committee was able to make significant
changes in law to deliver justice more effectively. In the
same way, the states can take active measures to
improve and speed up the dispensation of justice.
The three focus subjects and the specific indicators identified in each of them are indicated below:
Violent crimes
a. Rape
b. Murder
c. Dowry deaths
Atrocities
a. Custodial deaths
b. Police firing in law and order situations
Policing
The ratio of police personnel per one unit of population, appointed in each of the states.
FAIF RA S IC NIL DB EU XP
“If people are good only because they fear punishment, and hope for reward, then we are a sorry lot indeed.” – Albert Einstein
058
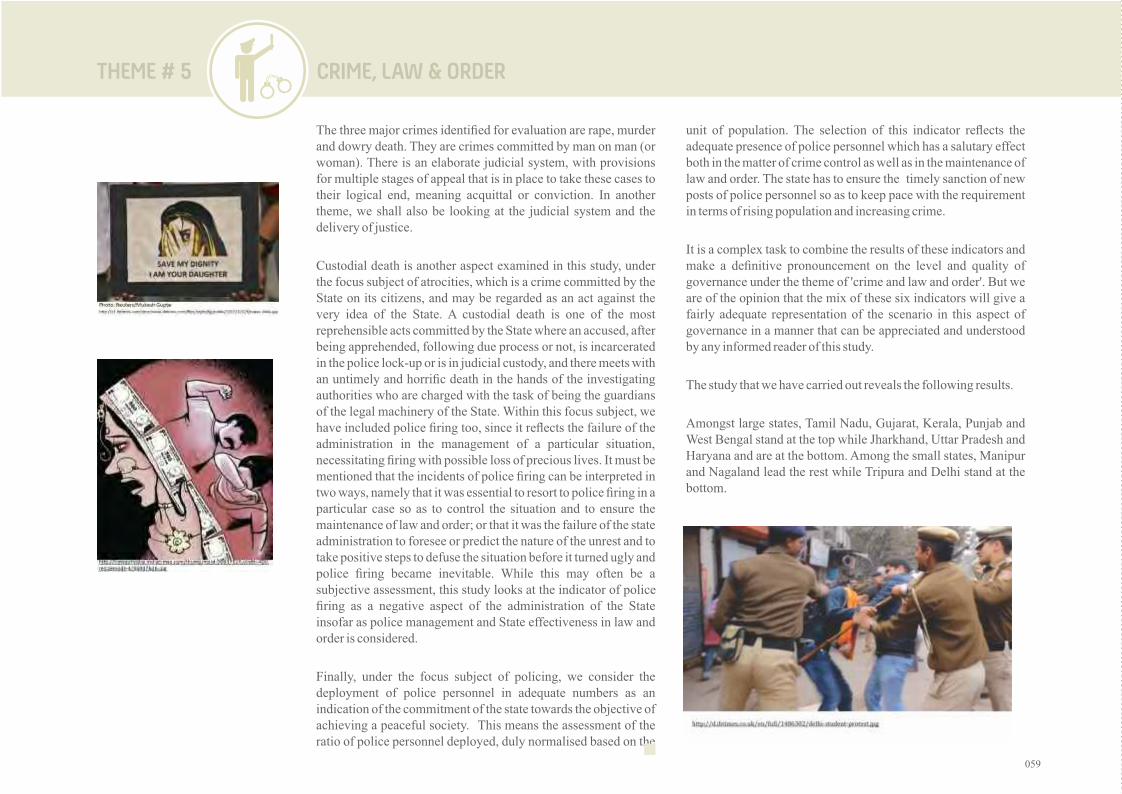
The three major crimes identified for evaluation are rape, murder and dowry death. They are crimes committed by man on man (or woman). There is an elaborate judicial system, with provisions for multiple stages of appeal that is in place to take these cases to their logical end, meaning acquittal or conviction. In another theme, we shall also be looking at the judicial system and the delivery of justice.
Custodial death is another aspect examined in this study, under the focus subject of atrocities, which is a crime committed by the State on its citizens, and may be regarded as an act against the very idea of the State. A custodial death is one of the most reprehensible acts committed by the State where an accused, after being apprehended, following due process or not, is incarcerated in the police lock-up or is in judicial custody, and there meets with an untimely and horrific death in the hands of the investigating authorities who are charged with the task of being the guardians of the legal machinery of the State. Within this focus subject, we have included police firing too, since it reflects the failure of the administration in the management of a particular situation, necessitating firing with possible loss of precious lives. It must be mentioned that the incidents of police firing can be interpreted in two ways, namely that it was essential to resort to police firing in a particular case so as to control the situation and to ensure the maintenance of law and order; or that it was the failure of the state administration to foresee or predict the nature of the unrest and to take positive steps to defuse the situation before it turned ugly and police firing became inevitable. While this may often be a subjective assessment, this study looks at the indicator of police firing as a negative aspect of the administration of the State insofar as police management and State effectiveness in law and order is considered.
Finally, under the focus subject of policing, we consider the deployment of police personnel in adequate numbers as an indication of the commitment of the state towards the objective of achieving a peaceful society. This means the assessment of the ratio of police personnel deployed, duly normalised based on the
unit of population. The selection of this indicator reflects the adequate presence of police personnel which has a salutary effect both in the matter of crime control as well as in the maintenance of law and order. The state has to ensure the timely sanction of new posts of police personnel so as to keep pace with the requirement in terms of rising population and increasing crime.
It is a complex task to combine the results of these indicators and make a definitive pronouncement on the level and quality of governance under the theme of 'crime and law and order'. But we are of the opinion that the mix of these six indicators will give a fairly adequate representation of the scenario in this aspect of governance in a manner that can be appreciated and understood by any informed reader of this study.
The study that we have carried out reveals the following results.
Amongst large states, Tamil Nadu, Gujarat, Kerala, Punjab and West Bengal stand at the top while Jharkhand, Uttar Pradesh and Haryana and are at the bottom. Among the small states, Manipur and Nagaland lead the rest while Tripura and Delhi stand at the bottom.
CRIME, LAW & ORDERTHEME # 5
059

unit of population. The selection of this indicator reflects the adequate presence of police personnel which has a salutary effect both in the matter of crime control as well as in the maintenance of law and order. The state has to ensure the timely sanction of new posts of police personnel so as to keep pace with the requirement in terms of rising population and increasing crime.
It is a complex task to combine the results of these indicators and make a definitive pronouncement on the level and quality of governance under the theme of 'crime and law and order'. But we are of the opinion that the mix of these six indicators will give a fairly adequate representation of the scenario in this aspect of governance in a manner that can be appreciated and understood by any informed reader of this study.
The study that we have carried out reveals the following results.
Amongst large states, Tamil Nadu, Gujarat, Kerala, Punjab and West Bengal stand at the top while Jharkhand, Uttar Pradesh and Haryana and are at the bottom. Among the small states, Manipur and Nagaland lead the rest while Tripura and Delhi stand at the bottom.
FAIF RA S IC NIL DB EU XP
‘ T h e s t a t e i s a r e m a r k a b l e invention of the human race. Other species have models of regulation. The state is much more than a system of dominance and coercion. Hobbes called it the Levianthan.’
‘Locke and Rousseau mention that the state arose by virtue of a social contract between the governance system and the people, in which 'free' people agree to restrict their freedom of action in exchange for collective security and collective good. ‘
Above quoted from: Revitalizing the
State - A Menu of Options - by Pradip N
Khandwalla. Published: Sage 1999
ISBN 81-7036-781-6 (India-HB)
Note: The data and information as shown in images and visualisation may not match PAI findings as period, indicators, methodology differ.
060

AF IF RSA IC NI DLB EXUP
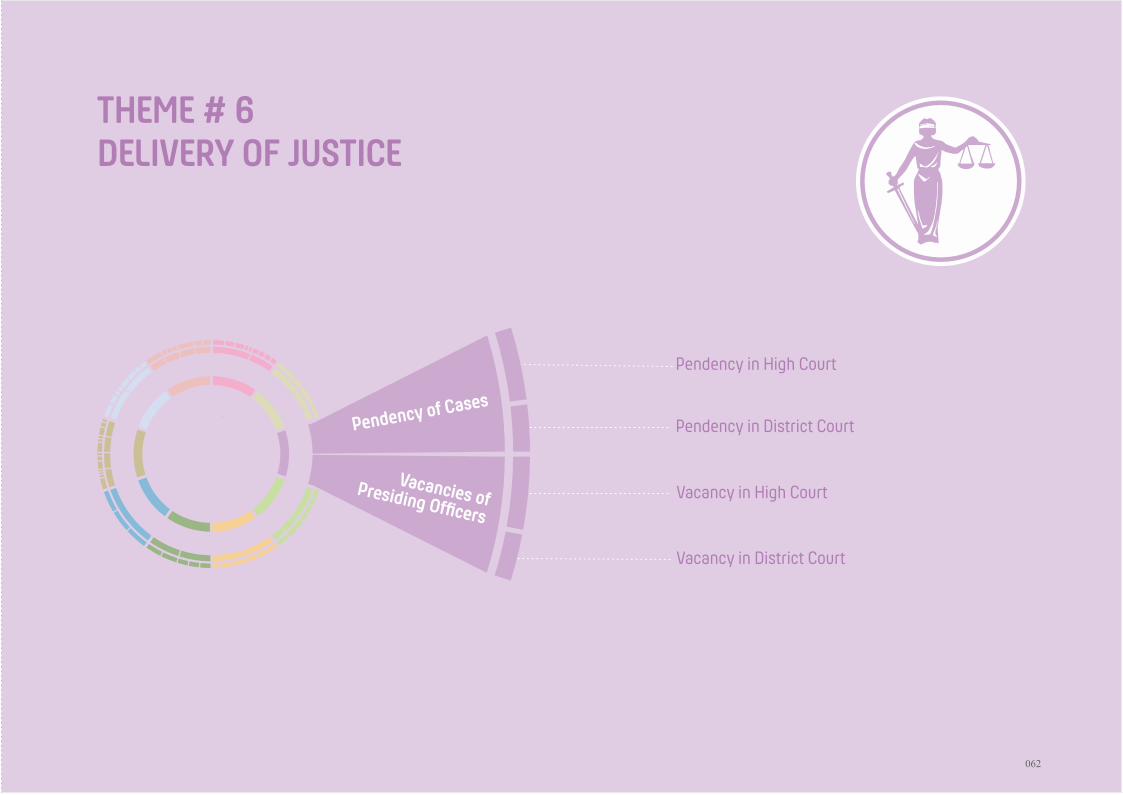
THEME # 6DELIVERY OF JUSTICE
Pendency in High Court
Pendency in District Court
Vacancy in High Court
Vacancy in District Court
Pendency of Cases
Vacancies of Presiding Officers
062

THEME # 6 DELIVERY OF JUSTICE
1
2
3
4
5
6
7
89
10
11
12
13
14
15
16
17
Rank Large States Index
KLTNCGHRMPWBMHODAPUPGJRJKAPBASBRJH
KeralaTamil NaduChhattisgarhHaryanaMadhya PradeshWest BengalMaharashtraOdishaAndhra PradeshUttar PradeshGujaratRajasthanKarnatakaPunjabAssamBiharJharkhand
0.5650.5290.4780.4640.4450.4450.4420.4330.4210.3930.3910.3880.3860.3760.3350.3270.244
i
ii
iii
iv
v
vi
vii
viii
ix
x xi xii
Small StatesRank Index
MLTRARDLJKUKMZNLGAHPMNSK
MeghalayaTripuraArunachal PradeshDelhiJammu and KashmirUttarakhandMizoramNagalandGoaHimachal PradeshManipurSikkim
0.7270.6250.5970.5510.5250.4970.4860.4770.4680.4590.4420.414
AP 9
AS 15
BR 16
CG 3
GJ 11
HR 4
JH 17
KA 13
KL 1
MP 5
MH 7
OD 8
PB 14
RJ 12
TN 2
UP 10
WB 6
AR iiiDL iv
GA ix
HP x
JK v
MN xiML i
MZ vii
NL viii
SK xii
TR ii
UK vi
Ÿ Need of the hour: Up-to-date Laws or time-
bound judgments?
thought box
0 scale range 1
0 scale range 1
Highest Index value Lowest Index value
063

While we have examined crime and law & order in a separate theme, it would be ideal to also assess the process involved in the delivery of justice in the States of India.
It is not the intention of this report to comment in any manner on the working of the courts, and hence we are restricting ourselves only to two focus subjects, namely the High Courts and the District Courts; here too we shall look at the data pertaining only to the pendency of cases and the vacancies in the posts of the presiding officers. It is well known that there are about three crore cases pending in the various courts of the country. According to data available with the apex court, the number of pending cases with the Supreme Court is about 60,000 as on February, 2015. The data available for the 24 High Courts and lower courts up to the year ending 2013 showed pendency of 44.5 lakhs and whopping 2.6 crores, respectively.
The argument that Indians are generally prone to litigation by nature may not be proven on the basis of hard facts. There may be many systemic reasons for the huge pendency including the manner in which the cases are disposed of so as to avoid mistrial and repeated litigation. However, it is generally understood that the vacancies in the posts of presiding officers in the courts is an important reason for such pendency.
However, this is not to say that measures are not being taken to reduce litigation, both in terms of numbers and pendency. Five states of the country have passed legislation to prevent unnecessary and vexatious litigation. These states include Maharashtra, Goa, Tamil Nadu, Madhya Pradesh and Rajasthan. For example, the Rajasthan Vexatious Litigation (Prevention) Bill, 2015, was passed recently in the State Vidhan Sabha, to cover both civil and criminal cases in the high court and subordinate courts. These measures will surely help in the reduction of litigation. From time to time State and National Law Commissions have done their best to reduce the number of statutes and legislations that have grown outdated with the passage of time. The Modi Government has taken a commendable step by the repealing of 125 obsolete central laws through two notifications in May 2015.
For our study, as already stated, we have identified just two indicators applied with equal weightage to both the High Courts and the district courts as may be seen below:
High court
a. Pendency of cases
b. Vacancies of presiding officers.
District Courts
c. Pendency of cases
d. Vacancies of presiding officers.
The data has been aggregated over a three-year period for all of these four indicators to assess whether the pendency and the vacancies of the presiding officers are rising or falling, both at the level of the district courts and the High Courts. Indeed, the Supreme Court
has been monitoring these matters very closely and brings out detailed data on these matters. The High Courts have also been pushing the district and lower courts to perform and dispose of the cases expeditiously. Nevertheless, the number of cases is increasing at a quick pace and the measures attempted to expedite process of delivery of justice are yielding results though slowly.
The position that then emerges is as follows:
Kerala, Tamil Nadu, Chattisgarh, Haryana and Madhya Pradesh are at the top amongst the large states, with Assam, Bihar and Jharkhand at the bottom. Amongst the small states, Meghalaya and Tripura are the toppers with Manipur and Sikkim at the bottom.
FAIF RA S IC NIL DB EU XP
“The time is always right to do right” – Nelson Mandela
064
AF IF RSA IC NI DLB EXUP

THEME # 7ENVIRONMENT
Pollution &
EnvironmentalViolations
Renewable Energy
Forest Cover
Suspended Particulate Matter
SO Emissions
NO Emissions
No. of Environmental Violations in the State (Per capita)
Increase / Decrease in Forest Cover
Renewable Energy as a % of total energy generated
2
2
066
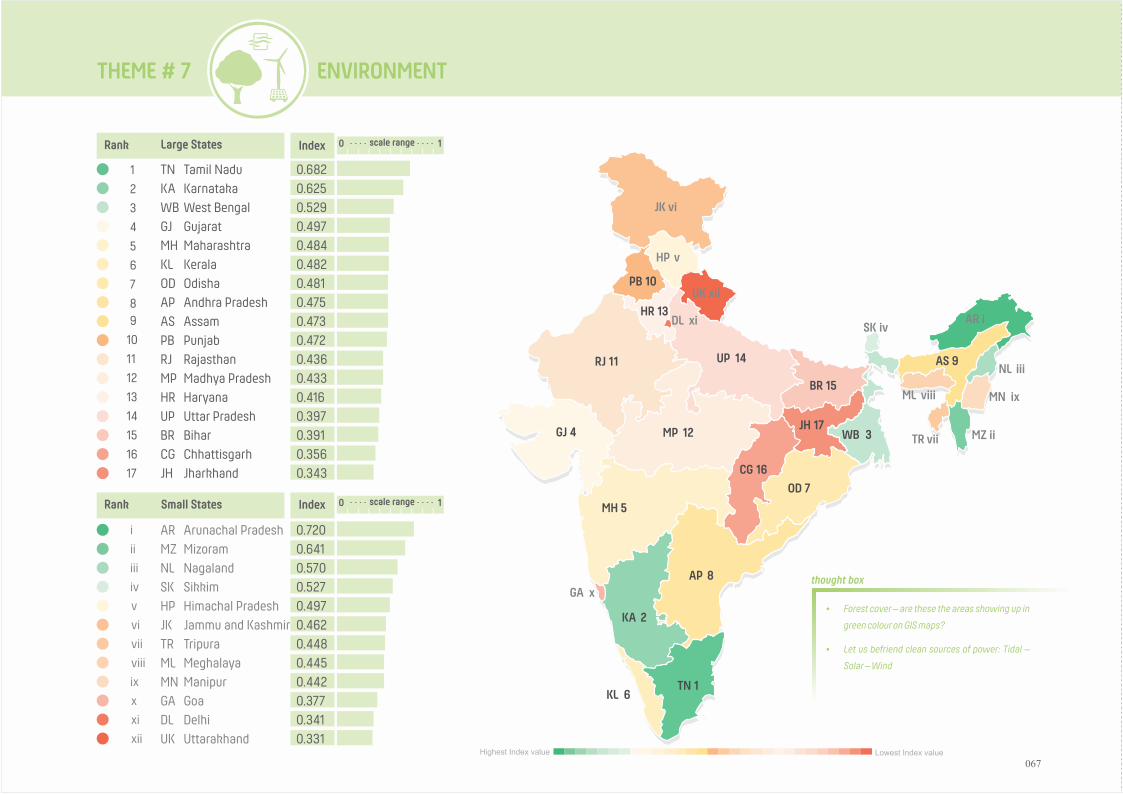
THEME # 7 ENVIRONMENT
1
2
3
4
5
6
7
89
10
11
12
13
14
15
16
17
Rank Large States Index
TNKAWBGJMHKLODAPASPBRJMPHRUPBRCGJH
Tamil NaduKarnatakaWest BengalGujaratMaharashtraKeralaOdishaAndhra PradeshAssamPunjabRajasthanMadhya PradeshHaryanaUttar PradeshBiharChhattisgarhJharkhand
0.6820.6250.5290.4970.4840.4820.4810.4750.4730.4720.4360.4330.4160.3970.3910.3560.343
i
ii
iii
iv
v
vi
vii
viii
ix
x xi xii
Small StatesRank Index
ARMZNLSKHPJKTRMLMNGADLUK
Arunachal PradeshMizoramNagalandSikkimHimachal PradeshJammu and KashmirTripuraMeghalayaManipurGoaDelhiUttarakhand
0.7200.6410.5700.5270.4970.4620.4480.4450.4420.3770.3410.331
AP 8
AS 9
BR 15
CG 16
GJ 4
HR 13
JH 17
KA 2
KL 6
MP 12
MH 5
OD 7
PB 10
RJ 11
TN 1
UP 14
WB 3
AR iDL xi
GA x
HP v
JK vi
MN ixML viii
MZ ii
NL iii
SK iv
TR vii
UK xii
Ÿ Forest cover – are these the areas showing up in
green colour on GIS maps?
Ÿ Let us befriend clean sources of power: Tidal –
Solar – Wind
thought box
0 scale range 1
0 scale range 1
Highest Index value Lowest Index value
067
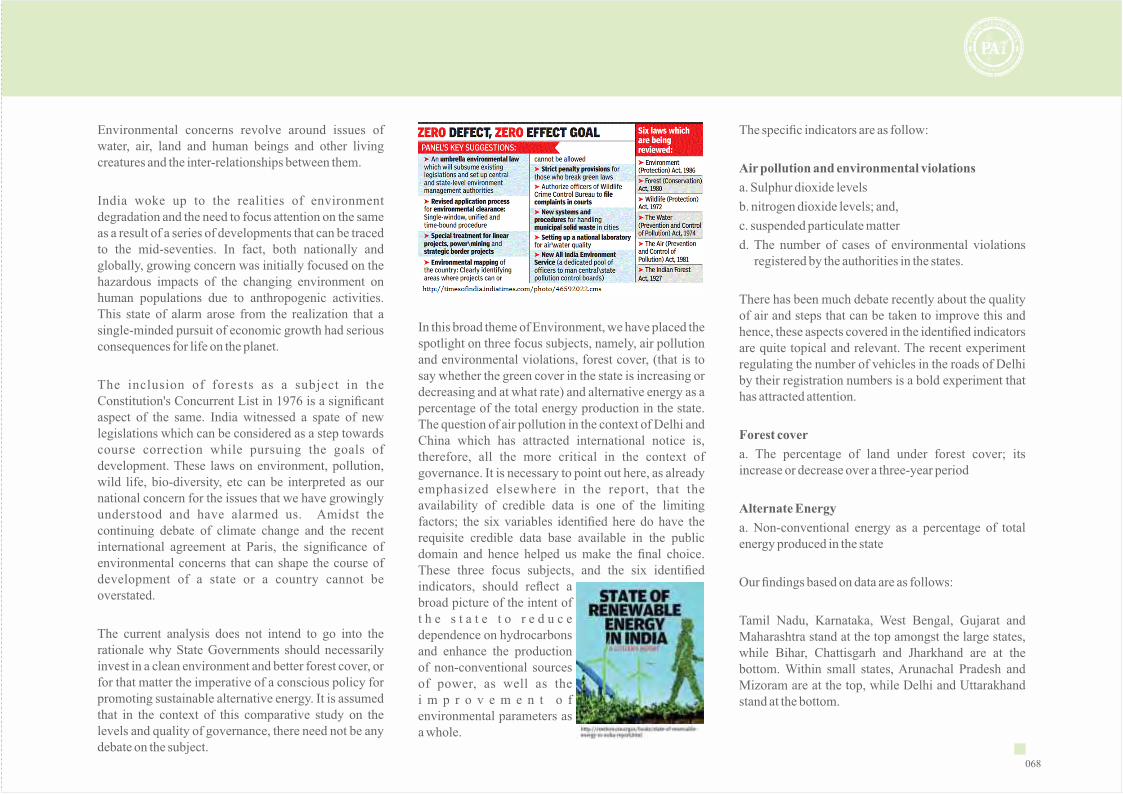
Environmental concerns revolve around issues of water, air, land and human beings and other living creatures and the inter-relationships between them.
India woke up to the realities of environment degradation and the need to focus attention on the same as a result of a series of developments that can be traced to the mid-seventies. In fact, both nationally and globally, growing concern was initially focused on the hazardous impacts of the changing environment on human populations due to anthropogenic activities. This state of alarm arose from the realization that a single-minded pursuit of economic growth had serious consequences for life on the planet.
The inclusion of forests as a subject in the Constitution's Concurrent List in 1976 is a significant aspect of the same. India witnessed a spate of new legislations which can be considered as a step towards course correction while pursuing the goals of development. These laws on environment, pollution, wild life, bio-diversity, etc can be interpreted as our national concern for the issues that we have growingly understood and have alarmed us. Amidst the continuing debate of climate change and the recent international agreement at Paris, the significance of environmental concerns that can shape the course of development of a state or a country cannot be overstated.
The current analysis does not intend to go into the rationale why State Governments should necessarily invest in a clean environment and better forest cover, or for that matter the imperative of a conscious policy for promoting sustainable alternative energy. It is assumed that in the context of this comparative study on the levels and quality of governance, there need not be any debate on the subject.
In this broad theme of Environment, we have placed the spotlight on three focus subjects, namely, air pollution and environmental violations, forest cover, (that is to say whether the green cover in the state is increasing or decreasing and at what rate) and alternative energy as a percentage of the total energy production in the state. The question of air pollution in the context of Delhi and China which has attracted international notice is, therefore, all the more critical in the context of governance. It is necessary to point out here, as already emphasized elsewhere in the report, that the availability of credible data is one of the limiting factors; the six variables identified here do have the requisite credible data base available in the public domain and hence helped us make the final choice. These three focus subjects, and the six identified indicators, should reflect a broad picture of the intent of t h e s t a t e t o r e d u c e dependence on hydrocarbons and enhance the production of non-conventional sources of power, as well as the i m p r o v e m e n t o f environmental parameters as a whole.
The specific indicators are as follow:
Air pollution and environmental violations
a. Sulphur dioxide levels
b. nitrogen dioxide levels; and,
c. suspended particulate matter
d. The number of cases of environmental violationsregistered by the authorities in the states.
There has been much debate recently about the quality of air and steps that can be taken to improve this and hence, these aspects covered in the identified indicators are quite topical and relevant. The recent experiment regulating the number of vehicles in the roads of Delhi by their registration numbers is a bold experiment that has attracted attention.
Forest cover
a. The percentage of land under forest cover; itsincrease or decrease over a three-year period
Alternate Energy
a. Non-conventional energy as a percentage of totalenergy produced in the state
Our findings based on data are as follows:
Tamil Nadu, Karnataka, West Bengal, Gujarat and Maharashtra stand at the top amongst the large states, while Bihar, Chattisgarh and Jharkhand are at the bottom. Within small states, Arunachal Pradesh and Mizoram are at the top, while Delhi and Uttarakhand stand at the bottom.
FAIF RA S IC NIL DB EU XP
068
AF IF RSA IC NI DLB EXUP

THEME # 8TRANSPARENCY AND ACCOUNTABILITY
Transparency
Accountability
Adherence to Section 4 RTI
RTPS act legislated or not
No. of Services provided under e-Governance plan
Lok Ayukt: Constituted / Bill Passed, Individual Web-sites and Chairpersons appointment
No. of ACB cases disposed as a % of total cases registered
Social Audit under NREGA: % of GP's covered
Panchayat Devolution Index Score
070
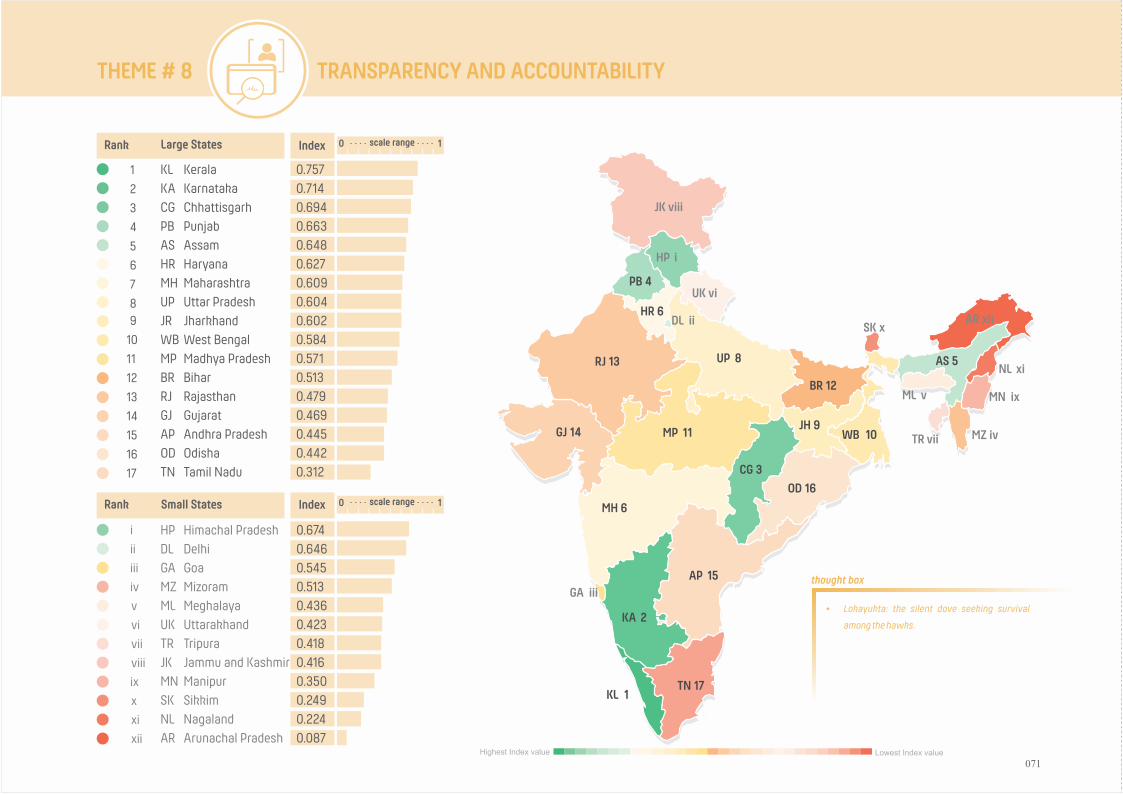
THEME # 8 TRANSPARENCY AND ACCOUNTABILITY
1
2
3
4
5
6
7
89
10
11
12
13
14
15
16
17
Rank Large States Index
KLKACGPBASHRMHUPJRWBMPBRRJGJAPODTN
KeralaKarnatakaChhattisgarhPunjabAssamHaryanaMaharashtraUttar PradeshJharkhandWest BengalMadhya PradeshBiharRajasthanGujaratAndhra PradeshOdishaTamil Nadu
0.7570.7140.6940.6630.6480.6270.6090.6040.6020.5840.5710.5130.4790.4690.4450.4420.312
i
ii
iii
iv
v
vi
vii
viii
ix
x xi xii
Small StatesRank Index
HPDLGAMZMLUKTRJKMNSKNLAR
Himachal PradeshDelhiGoaMizoramMeghalayaUttarakhandTripuraJammu and KashmirManipurSikkimNagalandArunachal Pradesh
0.6740.6460.5450.5130.4360.4230.4180.4160.3500.2490.2240.087
AP 15
AS 5
BR 12
CG 3
GJ 14
HR 6
JH 9
KA 2
KL 1
MP 11
MH 6
OD 16
PB 4
RJ 13
TN 17
UP 8
WB 10
AR xiiDL ii
GA iii
HP i
JK viii
MN ixML v
MZ iv
NL xi
SK x
TR vii
UK vi
Ÿ Lokayukta: the silent dove seeking survival
among the hawks.
thought box
0 scale range 1
0 scale range 1
Highest Index value Lowest Index value
071
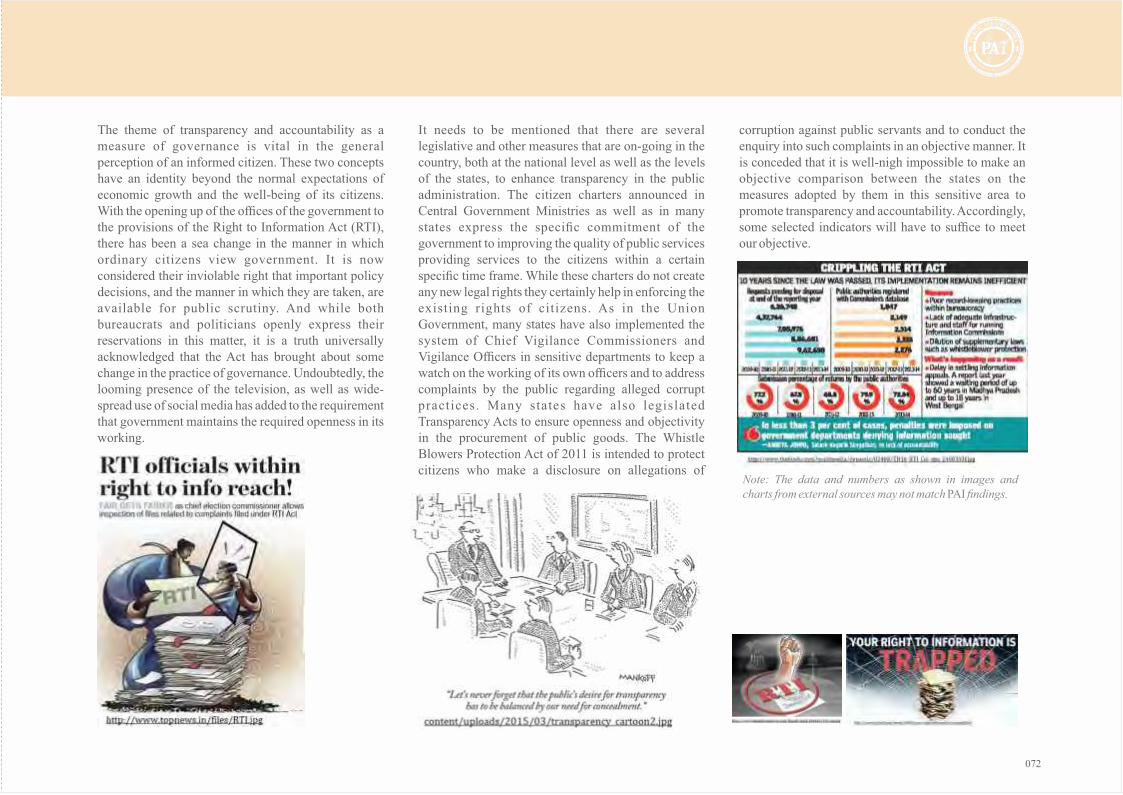
FAIF RA S IC NIL DB EU XP
The theme of transparency and accountability as a measure of governance is vital in the general perception of an informed citizen. These two concepts have an identity beyond the normal expectations of economic growth and the well-being of its citizens. With the opening up of the offices of the government to the provisions of the Right to Information Act (RTI), there has been a sea change in the manner in which ordinary citizens view government. It is now considered their inviolable right that important policy decisions, and the manner in which they are taken, are available for public scrutiny. And while both bureaucrats and politicians openly express their reservations in this matter, it is a truth universally acknowledged that the Act has brought about some change in the practice of governance. Undoubtedly, the looming presence of the television, as well as wide-spread use of social media has added to the requirement that government maintains the required openness in its working.
It needs to be mentioned that there are several legislative and other measures that are on-going in the country, both at the national level as well as the levels of the states, to enhance transparency in the public administration. The citizen charters announced in Central Government Ministries as well as in many states express the specific commitment of the government to improving the quality of public services providing services to the citizens within a certain specific time frame. While these charters do not create any new legal rights they certainly help in enforcing the existing rights of citizens. As in the Union Government, many states have also implemented the system of Chief Vigilance Commissioners and Vigilance Officers in sensitive departments to keep a watch on the working of its own officers and to address complaints by the public regarding alleged corrupt practices. Many states have also legislated Transparency Acts to ensure openness and objectivity in the procurement of public goods. The Whistle Blowers Protection Act of 2011 is intended to protect citizens who make a disclosure on allegations of
corruption against public servants and to conduct the enquiry into such complaints in an objective manner. It is conceded that it is well-nigh impossible to make an objective comparison between the states on the measures adopted by them in this sensitive area to promote transparency and accountability. Accordingly, some selected indicators will have to suffice to meet our objective.
FAIF RA S IC NIL DB EU XP
Note: The data and numbers as shown in images and charts from external sources may not match PAI findings.
072

The theme has two focus subjects, namely transparency and public accountability. Their indicators are follows:
Transparency includes
a. Adherence to Section 4 RTI
b. whether the Right to Public Services Act has been legislated ornot
c. The number of services provided in the States on a digitalplatform under the e-Governance plan.
Openness in the government is a much cherished attribute and a sure indicator of the quality and level of governance. The days of the Official Secrets Act are over. Conscious measures taken by the governments to dispel distrust are appreciated by the citizens. The RTI Act, though much questioned by government officers and political persons, has provided the right incentive to citizen groups to force open many matters that may have remained secret. The Act is a path-breaking step taken some years ago and is a game changer. Voluntary disclosure by the Ministries and the Departments under Section 4 of the Act reveal the commitment of these bodies to openness in the government. In the same fashion, many states have now implemented the Right to Public Services Act, which makes access to public services a right of the citizens and justifiable in court. The fact that the Government has placed many of its services in the public domain which can be accessed through the internet without human interface (read the absence of graft) is a step towards making citizens stake holders, in the actual sense, in the government.
THEME # 8 TRANSPARENCY AND ACCOUNTABILITY
073
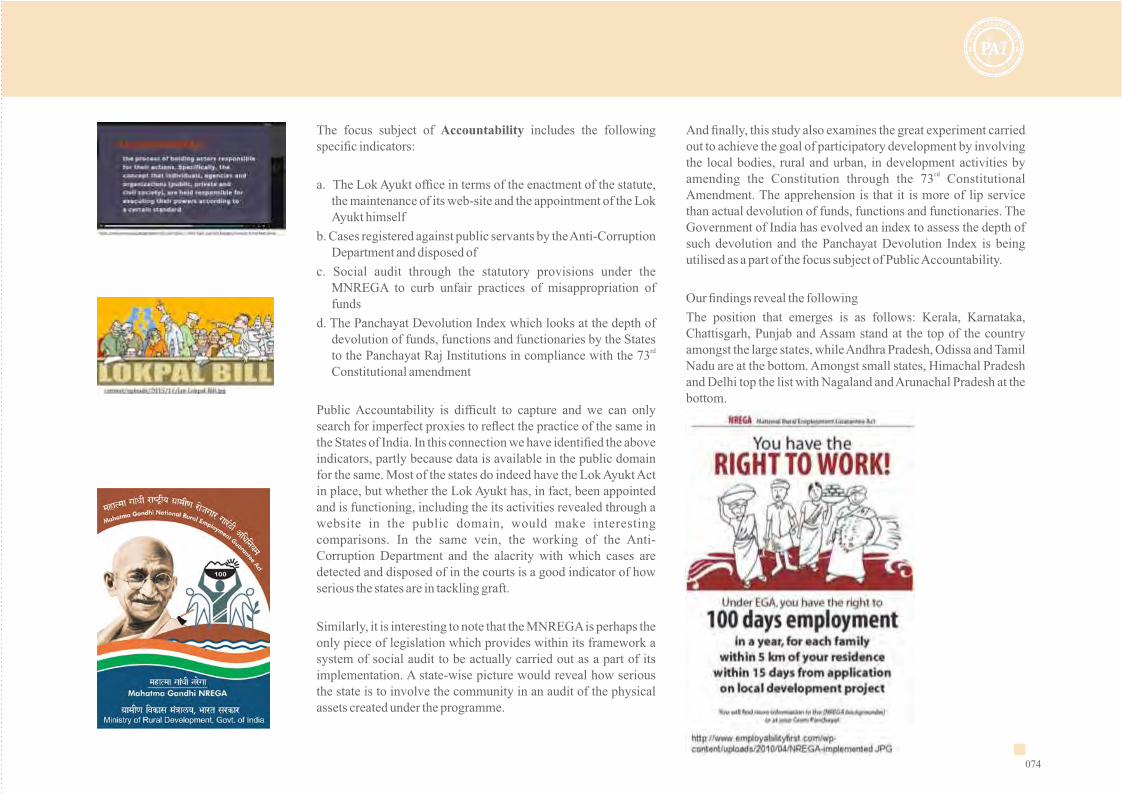
The focus subject of Accountability includes the following specific indicators:
a. The Lok Ayukt office in terms of the enactment of the statute,the maintenance of its web-site and the appointment of the LokAyukt himself
b. Cases registered against public servants by the Anti-CorruptionDepartment and disposed of
c. Social audit through the statutory provisions under theMNREGA to curb unfair practices of misappropriation offunds
d. The Panchayat Devolution Index which looks at the depth ofdevolution of funds, functions and functionaries by the States
rdto the Panchayat Raj Institutions in compliance with the 73Constitutional amendment
Public Accountability is difficult to capture and we can only search for imperfect proxies to reflect the practice of the same in the States of India. In this connection we have identified the above indicators, partly because data is available in the public domain for the same. Most of the states do indeed have the Lok Ayukt Act in place, but whether the Lok Ayukt has, in fact, been appointed and is functioning, including the its activities revealed through a website in the public domain, would make interesting comparisons. In the same vein, the working of the Anti-Corruption Department and the alacrity with which cases are detected and disposed of in the courts is a good indicator of how serious the states are in tackling graft.
Similarly, it is interesting to note that the MNREGA is perhaps the only piece of legislation which provides within its framework a system of social audit to be actually carried out as a part of its implementation. A state-wise picture would reveal how serious the state is to involve the community in an audit of the physical assets created under the programme.
And finally, this study also examines the great experiment carried out to achieve the goal of participatory development by involving the local bodies, rural and urban, in development activities by
rdamending the Constitution through the 73 Constitutional Amendment. The apprehension is that it is more of lip service than actual devolution of funds, functions and functionaries. The Government of India has evolved an index to assess the depth of such devolution and the Panchayat Devolution Index is being utilised as a part of the focus subject of Public Accountability.
Our findings reveal the following
The position that emerges is as follows: Kerala, Karnataka, Chattisgarh, Punjab and Assam stand at the top of the country amongst the large states, while Andhra Pradesh, Odissa and Tamil Nadu are at the bottom. Amongst small states, Himachal Pradesh and Delhi top the list with Nagaland and Arunachal Pradesh at the bottom.
FAIF RA S IC NIL DB EU XP
FAIF RA S IC NIL DB EU XP
074

AF IF RSA IC NI DLB EXUP

THEME # 9FISCAL MANAGEMENT
FRBM Indicators
Resource Generation & Development Expenditure
Revenue Surplus / Deficit (% of GSDP)
Fiscal Surplus / Deficit (% of GSDP)
Debt Burden (% of GSDP)
Per Capita Development Expenditure
States own tax revenue growth
076

FISCAL MANAGEMENTTHEME # 9
1
2
3
4
5
6
7
89
10
11
12
13
14
15
16
17
Rank Large States Index
UPASJHBRODCGPBMPRJKATNWBKLGJHRMHAP
Uttar PradeshAssamJharkhandBiharOdishaChhattisgarhPunjabMadhya PradeshRajasthanKarnatakaTamil NaduWest BengalKerala*Gujarat*HaryanaMaharashtraAndhra Pradesh
0.4940.4900.4830.4730.4690.4550.4540.4500.4330.4270.4260.4250.4250.4210.4100.3930.331
i
ii
iii
iv
v
vi
vii
viii
ix
x xi xii
Small StatesRank Index
DLMLMNAPSKGAJKTRUKNLMZHP
DelhiMeghalayaManipur*Arunachal PradeshSikkimGoa*Jammu and KashmirTripura*UttarakhandNagalandMizoram*Himachal Pradesh*
0.5670.5570.5540.5380.5170.5060.4720.4350.4230.4190.3470.248
Note: '*' sign indicates that GDP figures for 2014-15 are not available
AP 17
AS 2
BR 4
CG 6
GJ 14
HR 15
JH 3
KA 10
KL 13
MP 8
MH 16
OD 5
PB 7
RJ 9
TN 11
UP 1
WB 12
AR ivDL i
GA vi
HP xii
JK vii
MN iiiML ii
MZ xi
NL x
SK v
TR viii
UK ix
Ÿ GST is late in coming, or is it never going to
arrive: are States ready for a new structure.
Ÿ Have archaic accounting methods masked the
real economic situation?
thought box
0 scale range 1
0 scale range 1
Highest Index value Lowest Index value
077
This theme is of paramount importance in the achievement of the long term goals of development and strengthening of the economy. The severe financial crisis that the country faced in the pre-1991 days led to new policies and deregulation as well as opening up of the economy. Emphasis was thereafter placed on more efficient fiscal management at the Central government level and at the level of the States. Ultimately in 2003, legislation was brought in through the Fiscal Responsibility and Budget Management Act, 2003 (FRBMA) to institutionalise financial discipline, reduce India’s fiscal deficit, improve macroeconomic management and the overall management of the public fund. Elimination of revenue deficit and thereafter, building up revenue surpluses as well as the reduction of fiscal deficit to manageable 3% of the GDP, became objectives of the Act, along with phased reduction of debt burden.
There are two focus subjects in this overall theme of Fiscal Management; namely, the FRBM compliance and aspects related to mobilization of tax revenue and per capita development expenditure. In this study we are evaluating all these three basic FRBM Act indicators as being achieved by the States. Figures for the last three years have been accessed to delineate the path being adopted by each of the States to achieve the objectives of the FRBM Act. It is laudable that most of the States have adhered to the rigour of the FRBM Act and are in revenue surplus, whereas many of the states are well within the prescribed fiscal deficit limits. The burden of debt as a percentage of the GDP is also slowly being brought down over the years. The days of financial indiscipline and profligacy, it seems, are over..
The indicators described above are captured below:
FRBM compliance
a. Revenue deficit as a percentage of SGDP
b. Fiscal deficit as a percentage of SGDP
c. Debt burden as a percentage of SGDP
Tax and Development Expenditure
a. States own tax revenue growth. It may be recalledthat tax growth is a critical measurement to assessthe fiscal path that each state has adopted and is oftenused as a criterion to incentivize the States by theGovernment of India.
b. Per capital development expenditure as assessed bythe Plan expenditure of the State normalized by thepopulation of that State as in 2011
.
With better financial management imposed on the States through the operation of the Act, there is greater availability of resources to enable the states to carry out ambitious developmental plans. The size of the annual plans of the States, as approved by the Planning Commission in the last decade, gives a good indication about the same. Accordingly, the indicator of per capita developmental expenditure is a reasonably robust indicator to evaluate the path that the state has embarked upon to make the lives of its citizens better.
To the average citizen, the performance of the State in this theme may not be of much relevance except for the impact that it brings on the taxes he has to pay. However, as a stake holder in the overall development of the state, the manner in which the state machinery exercises financial discipline and mobilizes resources so as to achieve its developmental goals is certainly a matter for any concerned citizen to be interested in.
It is important to point out here that we are looking at not merely the classical parameters of financial
management as embodied in the FRBMA but are combining these with the expenditure made by each state for the welfare of its citizens. This is a unique study where weightage has been assigned not merely to the efficiency with which the management of its finances are being carried out, as also the benefits of that financial management in developmental expenditure depicted as per capita spending.
It is important to point out here that we are looking at not merely the classical parameters of financial management as embodied in the FRBMA but are combining these with the expenditure made by each state for the welfare of its citizens. This is a unique study where weightage has been assigned not merely to the efficiency with which the management of its finances are being carried out, as also the benefits of that financial management in developmental expenditure depicted as per capita spending.
Our findings are as follows:
The comparison of the larger states on fiscal management reveals Uttar Pradesh, Assam, Jharkhand, Bihar and Odisha at the top with Maharashtra and Andhra Pradesh at the bottom. It may raise some eyebrows as to how Uttar Pradesh stands at the top of the list of large states. It may also be surprising that Maharashtra and Andhra Pradesh are at the bottom of the list of large states. In this connection it may be recalled that we are looking at the performance of the states over a three-year period so as to measure improvement or decline. It is in the context of the efforts made by the State over this period that this position emerges.
Amongst smaller states, it is Delhi and Meghalaya at the top with Mizoram and Himachal Pradesh at the bottom.
“State tax should be such which should not prove to be a burden on the subject: the King should behave like those bees which collect honey without causing harm to the tree”. Chanakya.
FAIF RA S IC NIL DB EU XP
FAIF RA S IC NIL DB EU XP
“Foul cankering rust the hidden treasure frets, but gold that's put to use more gold begets”. William Shakespeare from 'Twelfth Night, or what you will'.
078
AF IF RSA IC NI DLB EXUP

THEME # 10ECONOMIC FREEDOM
Economic Freedom
No. of Industrial Entrepreneurs Memorandum filed
Ease of Doing Business
Value of MSME's assets (% of GSDP)
080

THEME # 10 ECONOMIC FREEDOM
1
2
3
4
5
6
7
89
10
11
12
13
14
15
16
17
Rank Large States Index
GJMHAPTNRJMPUPPBKAHRCGWBODJHKLASBR
GujaratMaharashtraAndhra PradeshTamil NaduRajasthanMadhya PradeshUttar PradeshPunjabKarnatakaHaryanaChhattisgarhWest BengalOdishaJharkhandKeralaAssamBihar
0.8900.6100.5320.4430.4360.3840.3750.3660.3580.3450.3450.3370.3310.3280.2520.1250.121
i
ii
iii
iv
v
vi
vii
viii
ix
x xi xii
Small StatesRank Index
GAHPDLUKJKARNLMZTRSKMNML
GoaHimachal PradeshDelhiUttarakhandJammu and KashmirArunachal PradeshNagalandMizoramTripuraSikkimManipurMeghalaya
0.2260.2100.2010.1720.1570.1110.0890.0750.0550.0340.0340.031
AP 3
AS 16
BR 17
CG 11
GJ 1
HR 10
JH 14
KA 9
KL 15
MP 6
MH 2
OD 13
PB 8
RJ 5
TN 4
UP 7
WB 12
AR viDL iii
GA i
HP ii
JK v
MN xiML xii
MZ viii
NL vii
SK x
TR ix
UK iv
Ÿ Fractured mandates: Restricting the freedom of
leaders to deliver promises.
thought box
0 scale range 1
0 scale range 1
Highest Index value Lowest Index value
081

This final theme has been selected to assess the vigour of the State in pushing the economic growth agenda. Admittedly, the particular circumstances of a State in this regard may depend on its local resources, its geographical situation and indeed the overall economic environment of the country as a whole. Nevertheless, there is much that a State can do to encourage investment, simplify laws, and generate a positive atmosphere to encourage potential investors. The argument has been held that there is a correlation between economic freedom and the well-being of the citizens. Admittedly, there are different kinds of freedom such as political freedom, the freedom of the individual and so on. But it is our contention that when economic freedom as a critical theme is included in the matrix of other themes, along with the interplay of specific variables, the overall picture should prove to be an interesting study, where comparisons and contrasts can be made about a particular state vis-à-vis the others.
The Cato study, exclusively looked at economic freedom and examined three aspects, namely the size of government with reference to expenditures, taxes and enterprises; the legal structure and security of property rights; and finally, the regulation of labour and business. In the PAI study, economic freedom is but one of the ten themes identified and hence we have sought to restrict ourselves to those variables which can serve to depict the nature of the freedom extended by the state towards businesses.
These are the three focus subjects identified for this purpose, with the same three also functioning as indicators:
a. The ease of doing business as demonstrated by therecent World Bank report that ranks the states in thisregard. We have just adopted their findings with nochanges at all.
b. The number of Industrial EntrepreneurshipMemoranda filed in the State has also been identified asthis indicates the serious intent of the industrialist tomake investment in the State concerned. This will be abetter indicator than MoUs signed for obvious reasons.
c. It is our contention that the promotion of SMSEs(small and medium scale enterprises) is a goodindicator of the economic environment in the States.The valuation of the fixed assets of SMSEs (dulystandardized as a percentage of the State GDP) iscritically relevant. The dependence of the state on verylarge or mega industries, though important, does notreveal the depth or spread of industrialization in theState. The SMSEs, however, are more dispersed overthe hinterland of the States while at the same time, alsoemploying larger number of persons, both from ruraland semi-urban backgrounds. High levels of technicalskill may not be as critical to the sector as in the heavyor large industrial sector.
The focus subjects themselves are the indicators in this theme. The results of our detailed examination are as follows:
The findings reveal, as expected, that the major industrial and manufacturing states of Gujarat, Maharashtra, Andhra Pradesh, Tamil Nadu and Rajasthan stand at the top of the list in that order. Kerala, Assam and Bihar are at the bottom. Amongst the small states, Goa and Himachal Pradesh are at the top while Manipur and Meghalaya are at the bottom.
“Pennies don't fall from heaven; they have to be earned here on earth.” Margaret Thatcher
FAIF RA S IC NIL DB EU XP
http://articles.economictimes.indiatimes.com/2015-01-17/news/58175336_1_prime-minister-narendra-modi-pm-modi-all-round-development
Note: The data and state wise rankings as shown in images and visualisation may not match PAI findings as period, indicators, methodology may differ.
Cato study reports. Economic Freedom of the States of India - by Bibek Debroy, et al.
082

AF IF RSA IC NI DLB EXUP
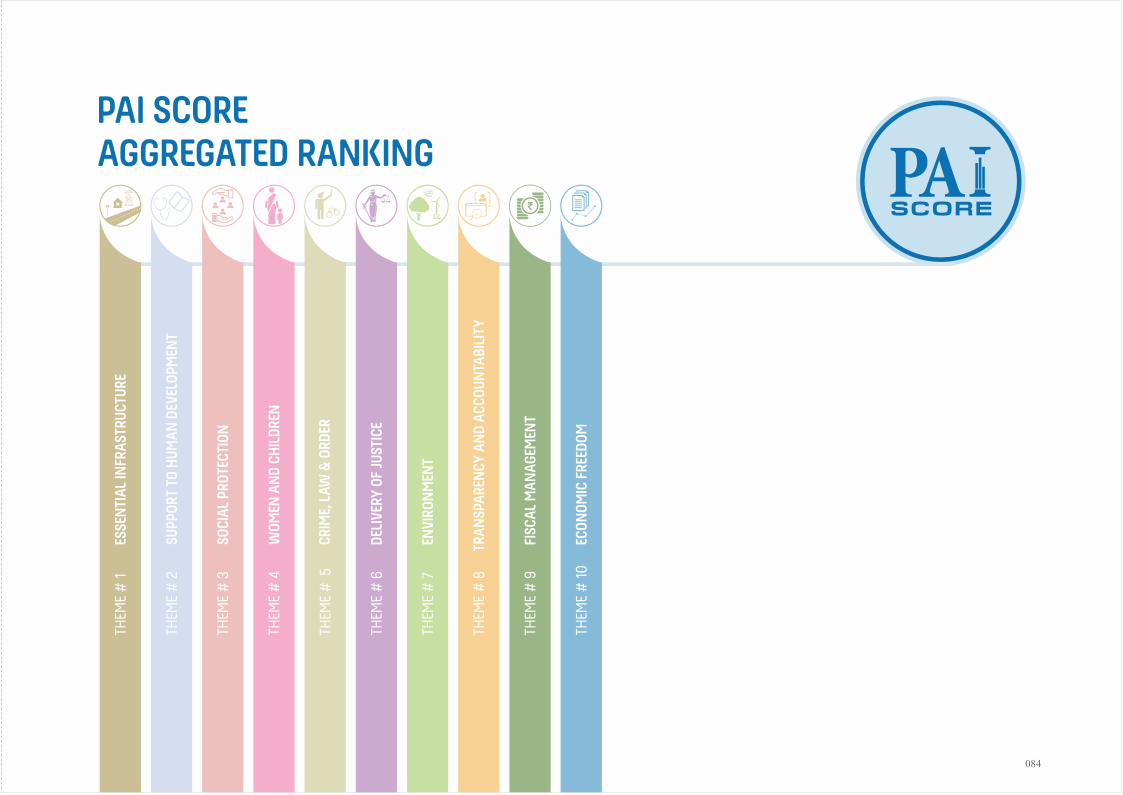
PAI SCOREAGGREGATED RANKING
SCORE
THEM
E #
1
E
SSEN
TIAL
INFR
ASTR
UCTU
RE
THEM
E #
2
THEM
E #
3 S
OCIA
L PR
OTEC
TION
THEM
E #
4
WOM
EN A
ND
CHIL
DREN
THEM
E #
5 C
RIM
E, L
AW &
ORD
ER
THEM
E #
6
DELI
VERY
OF
JUST
ICE
THEM
E #
7
ENVI
RON
MEN
T
THEM
E #
8
TRAN
SPAR
ENCY
AN
D AC
COUN
TABI
LITY
THEM
E #
9
FISC
AL M
ANAG
EMEN
T
THEM
E #
10
ECON
OMIC
FRE
EDOM
SUP
PORT
TO
HUM
AN D
EVEL
OPM
ENT
084

PAI SCORE AGGREGATED RANKINGSCORE
1
2
3
4
5
6
7
89
10
11
12
13
14
15
16
17
Rank Large States Index
KLTNKAMHGJPBWBAPHRRJCGUPMPASODJHBR
KeralaTamil NaduKarnatakaMaharashtraGujaratPunjabWest BengalAndhra PradeshHaryanaRajasthanChhattisgarhUttar PradeshMadhya PradeshAssamOdishaJharkhandBihar
0.56750.54980.54700.53560.53480.53320.50500.49910.48100.47330.47220.46100.45210.44590.44210.38860.3703
i
ii
iii
iv
v
vi
vii
viii
ix
x xi xii
Small StatesRank Index
MZHPDKSKGAMNJKARMLUKNLTR
MizoramHimachal PradeshDelhiSikkimGoaManipurJammu and KashmirArunachal PradeshMeghalayaUttarakhandNagalandTripura
0.54280.53890.50800.50750.50720.49980.48830.48770.48420.47860.45910.4531
AP 8
AS 14
BR 17
CG 11
GJ 5
HR 9
JH 16
KA 3
KL 1
MP 13
MH 4
OD 15
PB 6
RJ 10
TN 2
UP 12
WB 7
AR viiiDL iii
GA v
HP ii
JK vii
MN viML ix
MZ i
NL xi
SK iv
TR xii
UK x
0 scale range 1
0 scale range 1
085
thought box
Highest Index value Lowest Index value
Ÿ Do share your thoughts and comments about the
Public Affairs Index with us.
www.pai.pacindia.org
www.publicaffairsindex.in

FAIF RA S IC NIL DB EU XP
The PAI Index: Summation of the report
The aggregation of the ten themes comprising the 25 focus subjects and the 68 indicators should reveal a picture of the comparative levels and quality of governance in the States of India. It may be argued, and with much justification, that the choice of the indicators as well as the weightage assigned to them may distort the picture as it emerges: a small percentage change in any one of them may result in major variations in the subject-wise ranking as well as the final ranking of the States of India.
It is our contention that when arriving at the matrix we have decided upon, the element of subjectivity is limited to the identification of the indicators which themselves stood the test of scrutiny. The question asked at each stage of the identification of the indicators was: are they irrelevant or are they crucial to evaluate the levels and quality of governance. If they are indeed relevant, the comparative weightage assigned to them should not be completely whimsical or irrational, but should reflect the magnitude of importance of the variable in the evaluation of the levels and quality of governance in the theme identified.
The apprehension has also been raised that such a mix of various and diverse themes, focus subjects and indicators, when aggregated, may not reflect the true nature of governance in the states of India, but shall only function as a palette of discrete colours with no overarching or unifying concept to merge them into an integrated whole. While we see the sense in this argument, PAC is also of the view that from the perspective of the informed reader, depiction of all the elements into a unified matrix with suitably reasoned
weightages will portray a composite picture that will not be far from the truth. It will also assist the states themselves to go into the analysis of the ranking and raise arguments on why the methodology is erroneous. We welcome such criticism so as to help us further hone our report in successive years. Alternatively, the report shall function as an incentive for the states to further improve their performance where such improvement is possible.
It is now increasingly accepted that GDP or per capita income alone cannot reflect the well-being of the people. The indices to assess governance, or for that matter, the well-being of the citizens of the country or the States, will necessarily have to be a mix of many factors. Indeed, the larger the number of indicators, the more comprehensive would be the assessment. But in practical terms, PAC has identified these ten themes we have discussed in the preceding chapters and assigned the weightages to the focus subjects and the indicators in a manner we hope stands justified in the evaluation of the same. We gain strength in this approach from a perusal of the seminal report written by Joseph Stiglitz, Amartya Sen and Jean Paul Fitoussi, submitted to the French Government in 2010 (pl see box) where the authors attempted to comprehensively list out the factors contributing to well-being.
FAIF RA S IC NIL DB EU XP
Well-being is multidimensional
To d e fi n e w h a t w e l l - b e i n g m e a n s a multidimensional definition has to be used. Based on economic research and a number of concrete initiatives developed around the world.
…the following key dimensions [that] should be taken into account. At least in principle, these d i m e n s i o n s s h o u l d b e c o n s i d e r e d simultaneously.
i. Material living standards (income, consumption and wealth);
ii. Health;
iii. Education;
iv. Personal activities including work;
v. Political voice and governance;
vi. Social connections and relationships;
vii. Environment (present and future conditions);
viii. Insecurity, of an economic as well as physical nature
All these dimensions shape people's well-being, and yet , many of them are missed by conventional income measures.
(Mis-measuring our lives: Why GDP doesn't add up. The report by the Commission on the Measurement of Economic Performance and Social Progress. By Joseph Stiglitz, Amartya Sen and Jean-Paul Fitoussi.)
A ranking of the Indian states on Governance
086
PAI SCORE AGGREGATED RANKINGSCORE
The overall summation on the basis of the data we have collected and analyzed covering the ten broad themes reveals the following ranking of the States of India, segregated into big and small states.
Kerala stands at the top of the country, both amongst large and small states. The balancing of all the ten themes, including economic, social, infrastructure and other aspects of governance, has given an edge to this small coastal state. The social balance in the population in terms of religious groups and the high place that it has traditionally accorded to women, the huge advancements made in the areas of health and education, the accessibility of the State to influences from across the seas, the slant in political environment towards a leftist and socialistic economy, etc have all contributed to the special nature of the social and economic backdrop against which the people of the State have evolved. The Kerala model of development, as it is popularly known, has its own unique position in the polity of this country.
Tamil Nadu and Karnataka at ranks 2 and 3 respectively, have also received the advantage of the mix of variables selected for this study and thereby reinforce the idea of two India's with a North-South divide splitting the states into two clearly demarcated halves reflecting the quality of governance in the country. Maharashtra and Gujarat, with ranks at 4 and 5 respectively, follow: with economic strength and financial prowess, they have wrested for themselves positions among the top states of the country. Significantly, as opposed to the Kerala model of development, the contrasting model of development of Gujarat, while still significant in the ranking of the states, falls below the top states because of the comparatively lesser rank it holds in certain social indicators. The combination of the matrix of indicators
Insights: PAI and other developmental indices
The following section is a comparative analysis of the PAI with other globally accepted developmental indicators. This comparison is essential for two reasons: One, it is necessary to observe how PAI falls in line/differs from the generally accepted indicators of development. Secondly, this exercise will provide a much needed direction for enquiry into the linkage between governance and development in the future. Scatter diagrams have been plotted with PAI on the Horizontal (X) Axis and the other indices/variables on the Vertical (Y) Axis.
The purpose of such comparisons is not to validate the
PAI methodology. PAI has its own unique mix of
variables which capture key elements of governance in
measurable data available in the public domain.
However, this comparative exercise is simply to satisfy
an objective curiosity to compare PAI findings with
other internationally accepted indices. The findings
have been indicated herein: it is left to the reader to
interpret the same.
identified for such ranking, which gives high importance for social and human factors as well, has pushed Gujarat down from the topmost ranks amongst the states.
Amongst the small states, Mizoram, Himachal Pradesh, Delhi and Sikkim stand at the top. Over the years, Himachal Pradesh and Sikkim have shown their increasing capacity to perform well in crucial areas of governance, including education and health. A consistent approach to governance has yielded dividends to these states over time.
While the results indicated above, we hope, would be debated hotly, it would be relevant to see if we can identify certain emerging themes or patterns arising out of our study. One such emerging subject is the importance of the human and social factors that contribute to the well-being of the citizens. An inter-relationship between economic growth and social development also seems to have clearly emerged. It has been noted that states that do well in health also almost necessarily do well in education as well, as also in issues related to the well-being of women. For example, Kerala stands at the top of the large states when both health and education are concerned. So also, in the broad theme of the welfare of women and children, Kerala is at the top. The fact that in the aggregated summation of all ten themes too Kerala occupies the top position may be a pointer that in overall governance evaluation, human development, especially in health, education and women's issues, plays a big role in aiding the state concerned to achieve top ranking. Social empowerment has spin-off effects in the overall economy and this relationship should empower and motivate the states to strive for better achievement in other sectors as well.
087
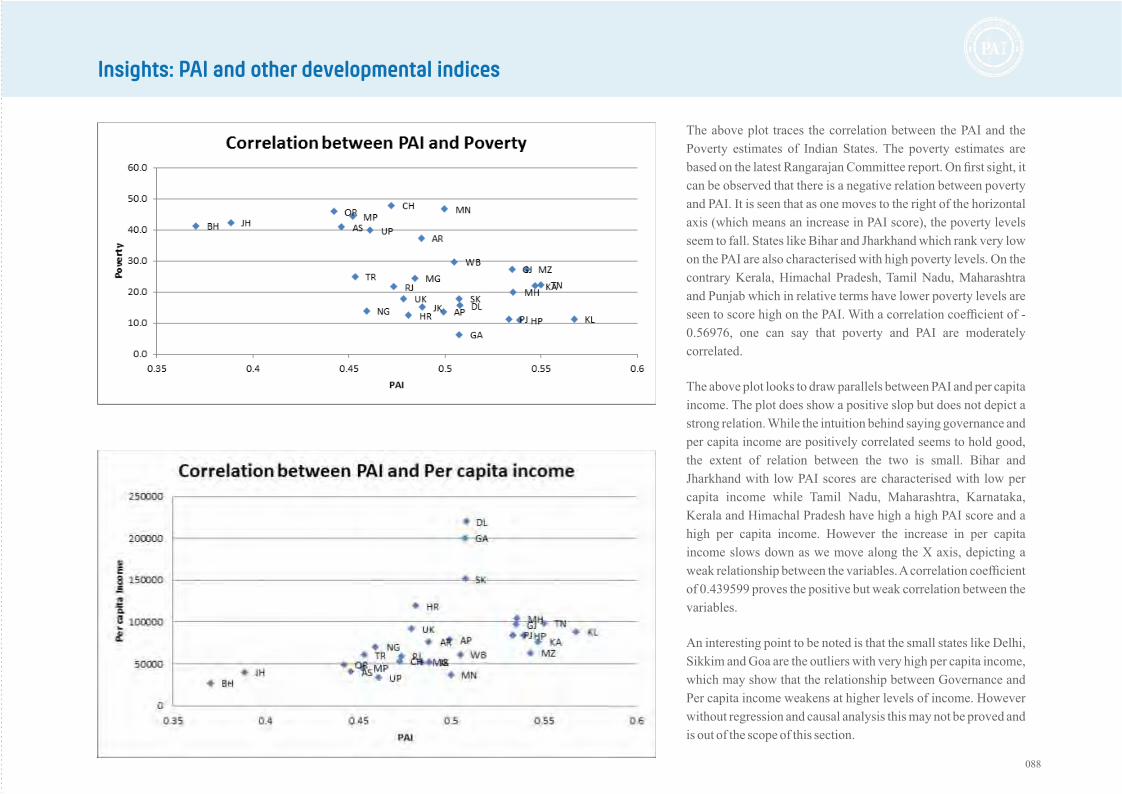
FAIF RA S IC NIL DB EU XP
FAIF RA S IC NIL DB EU XP
FAIF RA S IC NIL DB EU XP
FAIF RA S IC NIL DB EU XP
Insights: PAI and other developmental indices
The above plot traces the correlation between the PAI and the
Poverty estimates of Indian States. The poverty estimates are
based on the latest Rangarajan Committee report. On first sight, it
can be observed that there is a negative relation between poverty
and PAI. It is seen that as one moves to the right of the horizontal
axis (which means an increase in PAI score), the poverty levels
seem to fall. States like Bihar and Jharkhand which rank very low
on the PAI are also characterised with high poverty levels. On the
contrary Kerala, Himachal Pradesh, Tamil Nadu, Maharashtra
and Punjab which in relative terms have lower poverty levels are
seen to score high on the PAI. With a correlation coefficient of -
0.56976, one can say that poverty and PAI are moderately
correlated.
The above plot looks to draw parallels between PAI and per capita
income. The plot does show a positive slop but does not depict a
strong relation. While the intuition behind saying governance and
per capita income are positively correlated seems to hold good,
the extent of relation between the two is small. Bihar and
Jharkhand with low PAI scores are characterised with low per
capita income while Tamil Nadu, Maharashtra, Karnataka,
Kerala and Himachal Pradesh have high a high PAI score and a
high per capita income. However the increase in per capita
income slows down as we move along the X axis, depicting a
weak relationship between the variables. A correlation coefficient
of 0.439599 proves the positive but weak correlation between the
variables.
An interesting point to be noted is that the small states like Delhi,
Sikkim and Goa are the outliers with very high per capita income,
which may show that the relationship between Governance and
Per capita income weakens at higher levels of income. However
without regression and causal analysis this may not be proved and
is out of the scope of this section.
088

The third scatter plot which is depicted in the above figure
compares PAI to the Human Development Index. As you will be
aware the HDI pioneered by Prof. Amartya Sen and Prof.
Mehboob Haq has become a crucial element of the development
debate over the last two decades. The HDI which looks at
Education, Health and Income is said to be the most
comprehensive indicator of development. The scatter plot clearly
depicts a positive correlation between PAI and HDI. Bihar and
Jharkhand with low PAI scores are seen with low HDI's and
Kerala, Himachal Pradesh, Maharashtra and Tamil Nadu are on
the top right of the graph which depicts a high HDI and a high PAI
score. The scatter shows sign of an exponential (non-linear)
relationship, which means the HDI rises slowly with low levels of
governance, and rises at a faster rate at higher levels of
governance. With a correlation coefficient of 0.695736 one can
confidently say that HDI and PAI share a strong positive
correlation.
The last comparison of this section is between inequality (which
is measured by Gini Coefficient) and governance (which is
measured by PAI). For inequality the consumption based rural
Gini coefficient published by Planning Commission has been
considered. The scatter plot shows no clear pattern nor reveals
any interesting trend. Kerala which ranks at the top is PAI is
characterized with high inequality in the society. To the contrary
Bihar and Jharkhand have lower inequality in the society.
Therefore there is no significant correlation observed between
PAI and Inequality. This is supported by the poor correlation
coefficient of 0.192606. Without further in-depth investigation
into the matter it would be premature to dismiss the link between
governance and inequality as weak.
PAI SCORE AGGREGATED RANKINGSCORE
089
FAIF RA S IC NIL DB EU XP
FAIF RA S IC NIL DB EU XP
FAIF RA S IC NIL DB EU XP
FAIF RA S IC NIL DB EU XP
Insights: PAI and other developmental indices
There is a certain idea of India that has lingered through the
centuries, one that unifies disparate and distinct religions and
beliefs, societies and cultures, ethnic groups and political factions
into one integrated whole, all embracing and singular. And while
there may be voices that speak in different tongues, a single
undefinable thought holds us all together. We have encouraged
our diversity, embraced our differences, while at the same time
seeking to strengthen that which binds us all together. Our
cuisines vary every hundred miles: so do our dialects. We worship
gods in their many incarnations. Yet, we are proud to be Indians.
Indeed, there are things that we need to be concerned about the
manner in which we govern ourselves. But there are too,
magnificient achievements that we can be proud of. The very fact
that we have held ourselves together, against all odds, as a
sovereign nation, free from opposing ideologies that have split
the world into fragments, speaks volumes of the wise and mature
way we see the world. Our hoary philosophies sustain sanity and
peace across the globe. All the religions of the world, in large
measure, have found acceptance in the sub-continent. Our
economy is growing at a pace faster than even that of China. Our
youth have fashioned themselves into a powerful and skilled
force that provides technology to the most developed nations in
the world. We are proud to have our scientific prowess tha can
send a spacecraft to Mars at at fraction of the cost elsewhere.
Be that as it may, as a nation we need to get our act together. The
challenges of the last mile defy our combined attempts to deliver
governance. Old social and cultural prejudices still weigh us
down. There are differences that do not die away, but persist to
weaken our unity. Religion and caste divide us every day. The
manner in which we treat our women or the socially
disadvantaged requires a thorough correction. Parliament is
often stalled and constructive debate is missing. Policy at the
national level must give direction to the country, but should also
reflect the concerns and aspirations of the village. Our federal
structure, while giving strength to local aspirations, must also
seek to combine and consolidate ourselves into a mighty nation
that marches together towards a unified and integrated goal,
beyond the reach of divisive politics and disruptive religions.
Committed and dedicated leaders, local, regional and national
must dedicate themselves selflessly to the cause of taking this
great country forwards. Governance is not a destination, but a
journey and we need to travel that road every day of our collective
lives.
In the annexure we look at the individual states and assess their
performance in the ten identified themes. We are attempting a
state wise score card that will depict the position held by each of
our 29 states in the theme-wise ranking and index.
“It is already becoming clearer that a chapter
which has a western beginning will have to
have an Indian ending if it is not to end in the
self-destruction of the human race… At this
supremely dangerous moment in history, the
only way of salvation for mankind is the India
way.” Arnold Toynbee.
Note: The scatter plot is a simple method to
trace any specific pattern (correlation)
between two variables. It does not dwell into
causal links by any means.
Sources for scatter plots
1.
Poverty Levels - 2012
Rangarajan Committee Report 2013
2. Per Capita Income - 2013
Economic Survey of India 2014
3. Human Development Index - 2007
Human Development Report 2011
4. Gini Coefficient (Rural) - 2009
Planning Commission
090


AF IF RSA IC NI DLB EXUP


SENTIMENT ANALYSIS
The following section has been contributed by CPC Analytics, which
had been engaged by PAC for this study presenting a view in contrast
with the findings arising out of the Public Affairs Index. The
methodology has been explained in the notes below. Undoubtedly,
newspaper reports and tweets cannot be subjected to scientific
scrutiny required to arrive at incontrovertible facts and figures, or for
data interpretation in the traditional sense. Nevertheless, it may give a
sense of the prevailing perception about a state and about the five broad
themes identified for this sentiment analysis.
ARTICLES
TWEETS
094
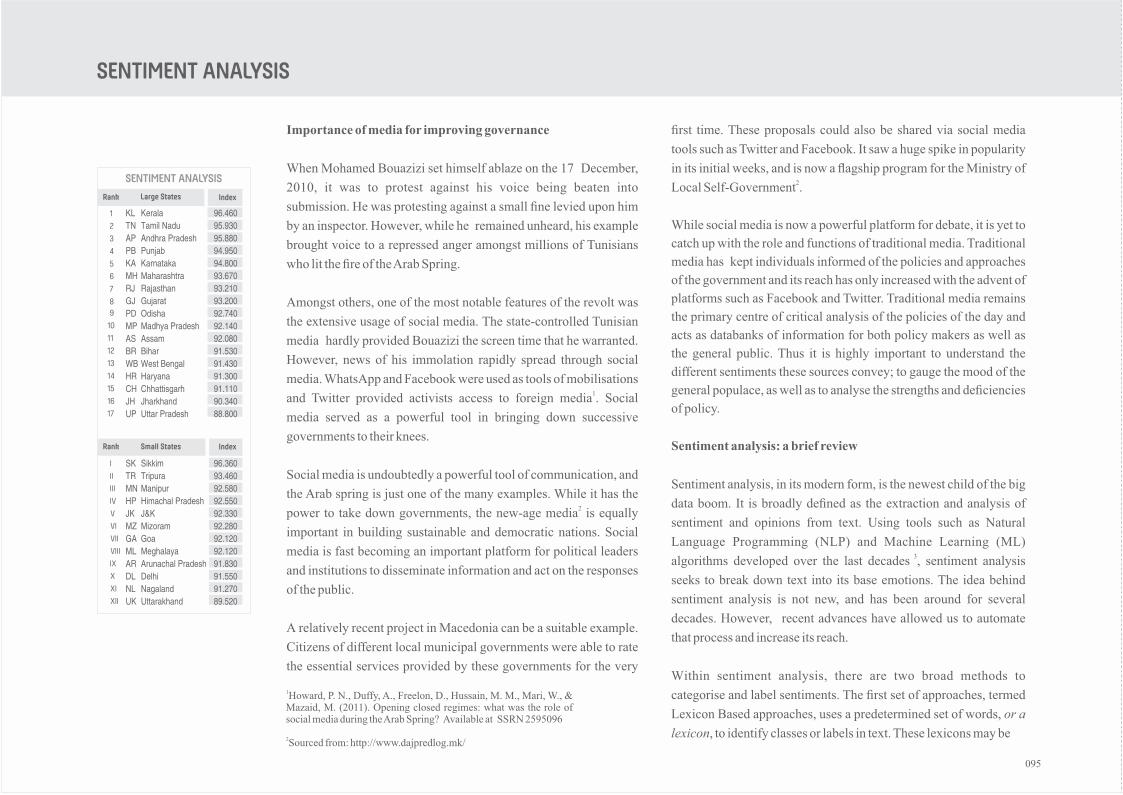
SENTIMENT ANALYSIS
Importance of media for improving governance
When Mohamed Bouazizi set himself ablaze on the 17 December,
2010, it was to protest against his voice being beaten into
submission. He was protesting against a small fine levied upon him
by an inspector. However, while he remained unheard, his example
brought voice to a repressed anger amongst millions of Tunisians
who lit the fire of the Arab Spring.
Amongst others, one of the most notable features of the revolt was
the extensive usage of social media. The state-controlled Tunisian
media hardly provided Bouazizi the screen time that he warranted.
However, news of his immolation rapidly spread through social
media. WhatsApp and Facebook were used as tools of mobilisations 1and Twitter provided activists access to foreign media . Social
media served as a powerful tool in bringing down successive
governments to their knees.
Social media is undoubtedly a powerful tool of communication, and
the Arab spring is just one of the many examples. While it has the 2power to take down governments, the new-age media is equally
important in building sustainable and democratic nations. Social
media is fast becoming an important platform for political leaders
and institutions to disseminate information and act on the responses
of the public.
A relatively recent project in Macedonia can be a suitable example.
Citizens of different local municipal governments were able to rate
the essential services provided by these governments for the very
first time. These proposals could also be shared via social media
tools such as Twitter and Facebook. It saw a huge spike in popularity
in its initial weeks, and is now a flagship program for the Ministry of 2Local Self-Government .
While social media is now a powerful platform for debate, it is yet to
catch up with the role and functions of traditional media. Traditional
media has kept individuals informed of the policies and approaches
of the government and its reach has only increased with the advent of
platforms such as Facebook and Twitter. Traditional media remains
the primary centre of critical analysis of the policies of the day and
acts as databanks of information for both policy makers as well as
the general public. Thus it is highly important to understand the
different sentiments these sources convey; to gauge the mood of the
general populace, as well as to analyse the strengths and deficiencies
of policy.
Sentiment analysis: a brief review
Sentiment analysis, in its modern form, is the newest child of the big
data boom. It is broadly defined as the extraction and analysis of
sentiment and opinions from text. Using tools such as Natural
Language Programming (NLP) and Machine Learning (ML) 3algorithms developed over the last decades , sentiment analysis
seeks to break down text into its base emotions. The idea behind
sentiment analysis is not new, and has been around for several
decades. However, recent advances have allowed us to automate
that process and increase its reach.
Within sentiment analysis, there are two broad methods to
categorise and label sentiments. The first set of approaches, termed
Lexicon Based approaches, uses a predetermined set of words, or a
lexicon, to identify classes or labels in text. These lexicons may be
1Howard, P. N., Duffy, A., Freelon, D., Hussain, M. M., Mari, W., & Mazaid, M. (2011). Opening closed regimes: what was the role of social media during the Arab Spring? Available at SSRN 2595096
2Sourced from: http://www.dajpredlog.mk/
KL
TN
AP
PB
KA
MH
RJ
GJ
PD
MP
AS
BR
WB
HR
CH
JH
UP
Kerala
Tamil Nadu
Andhra Pradesh
Punjab
Karnataka
Maharashtra
Rajasthan
Gujarat
Odisha
Madhya Pradesh
Assam
Bihar
West Bengal
Haryana
Chhattisgarh
Jharkhand
Uttar Pradesh
96.460
95.930
95.880
94.950
94.800
93.670
93.210
93.200
92.740
92.140
92.080
91.530
91.430
91.300
91.110
90.340
88.800
SK
TR
MN
HP
JK
MZ
GA
ML
AR
DL
NL
UK
Sikkim
Tripura
Manipur
Himachal Pradesh
J&K
Mizoram
Goa
Meghalaya
Arunachal Pradesh
Delhi
Nagaland
Uttarakhand
96.360
93.460
92.580
92.550
92.330
92.280
92.120
92.120
91.830
91.550
91.270
89.520
1
2
3
4
5
6
7
89
10
11
12
13
14
15
16
17
I
II
III
IV
V
VI
VII
VIII
IX
X
XI
XII
Rank Large States Index
Small StatesRank
Index
SENTIMENT ANALYSIS
095
FAIF RA S IC NIL DB EU XP
corruption, education, environment, growth and
health. The themes were chosen such that they
encompassed the major categories being explored by
Public Affairs Centre, and ensured compatibility with
the methodology followed. We also searched for over
270 cities in the 29 states to increase the availability of
data for analysis. Overall, we collected and classified
over 20,000 articles during the course of the study.
We also have access to historical Twitter archives. We
used this to gather tweets for the financial year 2014-15
which fit into our themes. Tweets which were
ambiguous in their theme, as well as the state that was
referred to, were ignored. We collected and analysed
nearly 300,000 unique tweets during the course of our
study.
For this study, as an adjunct to the construction of the
Public Affairs Index, (which is based entirely in
secondary data), we create a mixture of the two
approaches that allows us to increase our classification
speed while simultaneously improving our accuracy.
Our Data
Our primary data is sourced from our proprietary
software, Apollo. Apollo allows us to access news
articles of major Indian news publishing houses such as
The Times of India, The Hindu, The Financial Express,
Indian Express and the Economic Times, from 2001
onwards. For the purpose of this study, we also viewed
English regional papers such as The Shillong Times,
The Assam Tribune and The Sangai Express, where
necessary.
News articles were limited to the financial year 2014 -
2015. They were further limited to the five major
themes chosen at the start of the project, namely
4widely used sources , or custom built according to
specifications. Lexicon-based classifiers have a 5reputation of being speedy classifiers . These methods
have the added advantage of including domain and
context specific features that in turn improve the
accuracy of the model.
Machine learning approaches, in contrast, learn from
the data itself and do not require a pre-built dictionary.
The method requires a set of pre-labelled documents,
and seeks to find patterns in text that enables it to
classify the script into these labels. These approaches
are often probability-based, and determine the
likelihood of a text falling into a class. These
approaches are best suited for large volumes of text 6which allow for building of a rich feature set .
5Augustyniak, L., Kajdanowicz, T., Szymanski, P., Tuliglowicz, W., Kazienko, P., Alhajj, R., & Szymanski, B. (2014, August). Simpler is better? Lexicon-based ensemble sentiment classification beats supervised methods. In Advances in Social Networks Analysis and Mining (ASONAM), 2014 IEEE/ACM International Conference on (pp. 924-929). IEEE.
6 For more information on sentiment analysis; Medhat, W., Hassan, A., &Korashy, H. (2014). Sentiment analysis algorithms and applications: A survey. Ain Shams Engineering Journal, 5(4), 1093-1113
7 Articles which did not mention any of the 29 states were ignored
8 There is still a considerable research required on the proper sample size of tweets required to build a comprehensive classifier. However, there is a lot of literature on twitter analytics which use a similar amount of data, if not less. Pak and Paroubek (2010) conducted a experiment on using twitter as a corpus for data mining using around 300000 tweets. ( Look at; Pak, A., &Paroubek, P. (2010, May). Twitter as a Corpus for Sentiment Analysis and Opinion Mining.In LREC (Vol. 10, pp. 1320-1326).) Also lookatSaif, H., He, Y., &Alani, H. (2012). Alleviating data sparsity for twitter sentiment ana lys i s . CEUR Workshop Proceed ings (CEUR-WS. org).andAgarwal, A., Xie, B., Vovsha, I., Rambow, O., &Passonneau, R. (2011, June). Sentiment analysis of twitter data. In Proceedings of the Workshop on Languages in Social Media (pp. 30-38).Association for Computational Linguistics. who use around 60000 and 12000 tweets respectively.
3 Natural Language Programming stands at the intersection of computer programming, artificial intelligence and linguistics. The study focuses on making human texts machine readable, i.e. break down text in a manner that can be understood by machines. In contrast Machine Learning Algorithms build on these advances to gain insights from the text. Together they play a great role in advancing the role of textual analytics.
4 Amongst the most cited, Bing Liu Sentiment Lexicon contains over 6800 features labelled as per their polarity. Similarly the Harvard Inquirer contains over 3000 features according to their semantic orientation, and also breaks down the text according to their base emotions.
Our Approach
Articles
To classify the articles, we broadly follow the approach
laid out in Godbole et al . A rough illustration of the 9
methodology is laid out in figure 1, below. Thus we
start by creating a separate lexicon for each theme by
extracting the most frequently occurring parts of
sentences (PoS) from the news headlines. Nouns, such
as the name of the topic itself, were ignored to reduce
over-fitting and increase the accuracy of the algorithm.
Synonyms of the words were then extracted through
WordNet , on the basis of the semantic orientation 10
(positive versus negative), to increase the list of
features (words or group of words) available. These
features were then used to classify text, by providing
096

separate scores for the level of positivity and negativity
analysed in the articles.
We employed advanced linguistic tools to improve the
accuracy of our forecasts. Thus we controlled for the
presence of negative words; words such as “not” or
“neither” which invert the polarity of a sentence. We
also controlled for the tenses of the commonly
occurring words, which would otherwise not be
included. The algorithm was run on a random sample of
400 articles for each of the themes to ascertain
accuracy. Our classification accuracy stands between
88 ~ 90% depending on the theme at hand . 11
For each article, a ratio of the positive score to the
negative score was derived to obtain a ratio of the
polarity of an article. By using ratios instead of a
difference between the scores, we are able to better
control for the differences between the texts such as the
flair of the writer, different sizes of the text and
different publications. Using ratios also standardises
each article and allows comparison between the
different themes, which is otherwise difficult given the
divergent nature and length of the lexicons created for
each theme.
Once each article is adjudged, they are summarised
according to the theme and the states. They are further
standardised with the maximum obtained score in each
size group such that the score ranges from 0 to 100 for
each topic, with at least 1 state being awarded a 100 . 12
Finally, an arithmetic mean of the different scores is
taken to arrive at the total score for the state, which is
used to rank the states in the different size groups.
Tweets
There are two major differences in classifying tweets
when compared to analysing text. The first major
difference is that we could not use the lexicon that was
created for the different themes for our articles. This
was because, due to the character restriction in Twitter,
the words used in tweets were often fundamentally
different from the words used in articles. Words in
Twitter tend to be phonetic synonyms rather than literal
synonyms. Thus we created an entirely new lexicon
focusing on Twitter archives, through a base list of
nearly 100,000 tweets
Second, we created a single lexicon to classify tweets
across the themes, unlike articles, where we created a
separate lexicon for each theme. Building separate
lexicons severely reduced our classification accuracy,
when compared to a common lexicon. One possible
reason for this could be because of the inherent
similarity of tweets. Due to the limited character spaces
available, the differentiation in writing styles for
different themes is lesser in tweets than in articles.
9 Godbole, N., Srinivasaiah, M., &Skiena, S. (2007).Large-Scale Sentiment Analysis for News and Blogs.ICWSM, 7, 21. Also look at: Qiu, G., He, X., Zhang, F., Shi, Y., Bu, J., & Chen, C. (2010). DASA: dissatisfaction-oriented advertising based on sentiment analysis. Expert Systems with Applications, 37(9), 6182-6191.
10 WordNet is a large lexical database that groups and labels words according to their semantic proximity. It also acts as a thesaurus and a base for natural language processing tools. It is maintained by P r i n c e t o n U n i v e r s i t y a n d c a n b e a c c e s s e d a t [https://wordnet.princeton.edu/]
11 The awarded label (positive or negative article) was checked against the articles of the random sample to ensure our classification was accurate.
12 The standardisations were run separately for the two different groups of states, using the maximum score obtained in each group. Thus the scores are not inter-comparable across groups.
Figure 1: A representative workflow of the classifying algorithm
SENTIMENT ANALYSIS
097

Therefore, by separating the tweets according to the
different themes, and creating a separate lexicon for
each theme, we lose out features that might have
otherwise helped in classifying the text.
In our analysis for the tweets, we continued the use of
techniques such as controlling for the tense of a verb
and by controlling for negative words which invert
polarity. Further we also clean the noise from tweets
and remove references to links and other tweets where
possible. Overall, our classification accuracy stands at
~ 88% for tweets.
Our algorithm provided us with a positive and negative
score for each tweet. We take a ratio of the two scores to
obtain the ratio of polarity of a tweet, similar to our
approach in classifying articles. We summarise the
score over the tweets obtained for each state, and finally
standardise them such that the scores range from 0 to
100, with at least one state being awarded the 13maximum .
The final scores were obtained by a weighted average
of the scores obtained for articles and tweets separately.
We weighted the texts in a ratio of 7.5 : 1 to account for
the vast differences in the sample sizes of the two
groups.
Results
Traditional media ranked Kerala, first amongst the 17
states in the same grouping. This followed a strong
scoring in 4 of the 5 sub-themes of education,
environment, growth and health. Kerala was ranked
second in providing quality education facilities as well
as for its focus on health. However, the state lagged
behind in corruption, ranking 12th amongst the 17
states. Tamil Nadu was a close second, though it ranked
low in efforts on reducing corruption.
States of Chhattisgarh, Jharkhand and Uttar Pradesh
were ranked low by the traditional media. Uttar
Pradesh lagged behind in indicators of human
development such as health and education, ranking last
in both. It was also ranked behind in reducing and
containing corruption and environmental negligence, thand was ranked 17 amongst all.
Amongst the smaller states, the Seven Sisters showed
enormous potential, leading in quality of life indicators
of environment, education and health. Several states
also showed strong growth potential, with Arunachal
Pradesh and Sikkim coming 3rd and 4th respectively.
thUttarakhand was ranked 12 in combating corruption, thand 11 in preserving natural resources. It was also
thranked 11 in providing quality education to its
citizens, though the health facilities provided were
widely praised by the media.
The Twitterati were not far off in their ranking for the
states. Karnataka was the first amongst the equals for
the grouping, with Tamil Nadu finishing in second, and thOdhisa ranking 3rd. Chhattisgarh was ranked 17
amongst the larger states, with Uttar Pradesh gaining 3 thpositions to rank 15 . Amongst the smaller states,
Sikkim continued to rank first, followed by Himachal
Pradesh and Manipur. Uttarakhand was ranked in the th th11 position, with only Delhi ranking lower at 12 .
In the final ranking, amongst the smaller states, Sikkim
continued to hold its pole position, followed by Tripura
and Himachal Pradesh.
Amongst the big states, Kerala was rated the best
governed state, followed by Tamil Nadu and Andhra
Pradesh.
FAIF RA S IC NIL DB EU XP
www.cpc-analytics.com
3 Note: Since the ranks of the different states are displayed, the larger the rank, the worse the state performed.
1
13Figure 2: Rank positions of the states across different data sources displayed according to size groups
098
AF IF RSA IC NI DLB EXUP

ANNEXURE
PAI - THEME WISE STATE RANK
PAI - HOW EACH STATE FARES ?
LIST OF THEMES, FOCUS SUBJECTS, INDICATORS AND WEIGHTAGES
100
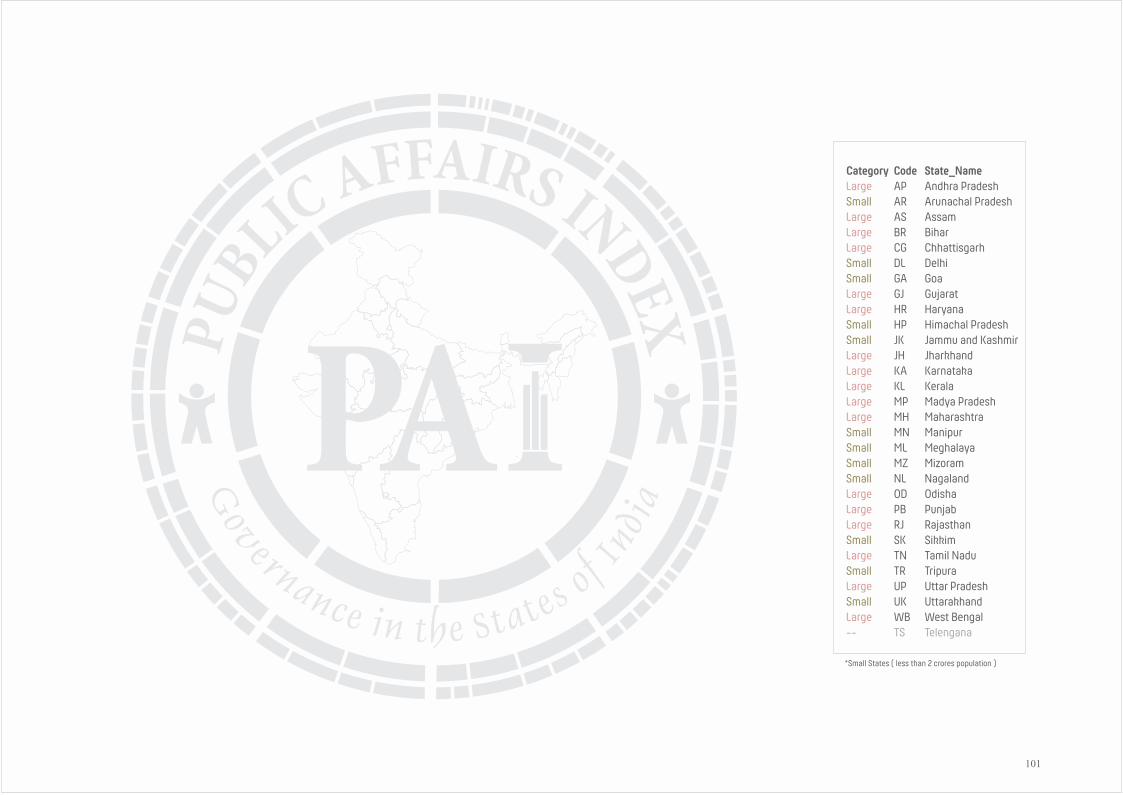
Category Code State_Name Large AP Andhra PradeshSmall AR Arunachal PradeshLarge AS AssamLarge BR BiharLarge CG ChhattisgarhSmall DL DelhiSmall GA GoaLarge GJ GujaratLarge HR HaryanaSmall HP Himachal PradeshSmall JK Jammu and KashmirLarge JH JharkhandLarge KA KarnatakaLarge KL KeralaLarge MP Madya PradeshLarge MH MaharashtraSmall MN ManipurSmall ML MeghalayaSmall MZ MizoramSmall NL NagalandLarge OD OdishaLarge PB PunjabLarge RJ RajasthanSmall SK SikkimLarge TN Tamil NaduSmall TR TripuraLarge UP Uttar PradeshSmall UK UttarakhandLarge WB West Bengal-- TS Telengana
AF IF RSA IC NI DLB EXUP
*Small States ( less than 2 crores population )
101

Rank1234567891011121314151617181920212223242526272829
KLTNKAMZHPMHGJPBDLSKGAWBMNAPJKARMLHRUKRJCGUPNLTRMPASODJHBR
0.5680.5500.5470.5430.5390.5360.5350.5330.5080.5080.5070.5050.5000.4990.4880.4880.4840.4810.4790.4730.4720.4610.4590.4530.4520.4460.4420.3890.370
SCORE
THEM
E #
1
ESS
ENTI
AL IN
FRAS
TRUC
TURE
DLPBGAHRHPGJAPTNUKMHSKUPKARJKLJKARWBMZCGBRMPMLJHTRMNNLASOD
0.8120.7740.7210.7160.7140.6750.6560.6360.6130.6120.6080.5820.5580.5570.5530.5370.4760.4720.4700.4280.4140.3870.3660.3590.3560.3520.3440.3170.239
THEM
E #
2
SUP
PORT
TO
HUM
AN D
EVEL
OPM
ENT
SKMNMZHPKLGAPBNLUKKAMLTRTNAPHRDLJKMHARODRJGJWBASCGJHUPMPBR
0.7700.7460.7270.7240.6920.6430.6370.5910.5830.5800.5730.5650.5510.5490.5480.5390.5110.5100.4920.4390.4390.4310.4200.4150.3910.2880.2840.2660.220
THEM
E #
3
SOC
IAL
PROT
ECTI
ON
MZSKKAWBJKKLMPARHPRJTNUPNLUKMLMNASMHDLCGODGATRGJPBAPJHHRBR
0.7950.6720.6650.6500.6420.6360.6030.6030.6000.5920.5890.5750.5720.5670.5620.5590.5430.5210.5210.5190.5160.4690.4680.4320.4000.3890.3850.3500.303
MNMZKLSKNLARHPTNTRASAPODKAMHMLWBUKPBHRJKGACGDLMPGJUPRJBRJH
THEM
E #
4
WOM
EN A
ND
CHIL
DREN
0.7230.7000.6550.6400.6230.6190.6100.6080.6060.6050.5890.5610.5590.5540.5500.5480.5460.5400.5270.5060.5030.5000.4860.4830.4720.4660.4370.4040.359
THEM
E #
5
CRI
ME,
LAW
& O
RDER
MNTNNLMZGJKLJKHPPBSKWBARUKMHGAAPKAMLCGTRBRRJODASMPJHUPDLHR
0.7950.7240.6820.6740.6700.6580.6540.6530.6500.6450.6410.6350.6320.6220.6140.6030.5970.5950.5540.5540.5370.5360.5100.5100.4990.4950.4410.4150.406
THEM
E #
6
DELI
VERY
OF
JUST
ICE
MLTRARKLDLTNJKUKMZCGNLGAHRHPMPWBMNMHODAPSKUPGJRJKAPBASBRJH
0.7270.6250.5970.5650.5510.5290.5250.4970.4860.4780.4770.4680.4640.4590.4450.4450.4420.4420.4330.4210.4140.3930.3910.3880.3860.3760.3350.3270.244
ECON
OMIC
FRE
EDOM
THEM
E #
10
WB
GJMHAPTNRJMPUPPBKAHRCG
ODJHKLGAHPDLUKJKASBRARNLMZTRSKMNML
0.8900.6100.5320.4430.4360.3840.3750.3660.3580.3450.3450.3370.3310.3280.2520.2260.2100.2010.1720.1570.1250.1210.1110.0890.0750.0550.0340.0340.031
AGGR
EGAT
ED IN
DEX
PAI S
CORE
FAIF RA S IC NIL DB EU XP
ANNEXURE : PAI - THEME WISE STATE RANKING
THEM
E #
7
ENVI
RON
MEN
T
0.7200.6820.6410.6250.5700.5290.5270.4970.4970.4840.4820.4810.4750.4730.4720.4620.4480.4450.4420.4360.4330.4160.3970.3910.3770.3560.3430.3410.331
ARTNMZKANLWBSKGJHPMHKLODAPASPBJKTRMLMNRJMPHRUPBRGACGJHDLUK
THEM
E #
8
TRAN
SPAR
ENCY
AN
D AC
COUN
TABI
LITY
0.7570.7140.6940.6740.6630.6480.6460.6270.6090.6040.6020.5840.5710.5450.5130.5130.4790.4690.4450.4420.4360.4230.4180.4160.3500.3120.2490.2240.087
MH
WB
MN
KLKACGHPPBASDLHR
UPJH
MPGABRMZRJGJAPODMLUKTRJK
TNSKNLAR
DLMLMNARSKGAUPASJHBRJKODCGPBMPTRRJKATNWBKLUKGJNLHRMHMZAPHP
THEM
E #
9
FISC
AL M
ANAG
EMEN
T
0.5670.5570.5540.5380.5170.5060.4940.4900.4830.4730.4720.4690.4550.4540.4500.4350.4330.4270.4260.4250.4250.4230.4210.4190.4100.3930.3470.3310.248
102

ANNEXURE : PAI - HOW EACH STATE FARES ?
3 ( 3 )
9 ( 9 )
10 ( 18 )
13 ( 25 )
8 ( 17 )
6 ( 13 )
1 ( 3 )
3 ( 10 )
8 ( 13 )4 ( 7 )
5 ( 14 )
14 ( 26 )
4 ( 11 )
7 ( 16 )
9 ( 20 )
17 ( 28 )
3 ( 3 )
8 ( 14 )
Rank
0.656
0.549
0.389
0.589
0.603
0.421
0.331
0.532
0.499
Index
SCORE
15 ( 24 )
14 ( 26 )
15 ( 27 )
17 ( 29 )
15 ( 26 )
17 ( 29 )
3 ( 9 )
14 ( 14 )
16 ( 28 )
0.359
0.288
0.385
0.359
0.495
0.244
0.483
0.328
0.389
2 ( 4 )
6 ( 15 )
16 ( 28 )
10 ( 19 )
17 ( 29 )
4 ( 13 )
15 ( 25 )
10 ( 10 )
9 ( 18 )
0.716
0.548
0.35
0.527
0.406
0.464
0.410
0.345
0.481
3 ( 6 )
10 ( 22 )
12 ( 24 )
13 ( 25 )
2 ( 5 )
11 ( 23 )
14 ( 23 )
1 ( 1 )
5 ( 7 )
0.675
0.431
0.432
0.472
0.670
0.391
0.421
0.89
0.535
12 ( 20 )
13 ( 25 )
10 ( 20 )
11 ( 22 )
9 ( 19 )
3 ( 10 )
6 ( 13 )
11 ( 11 )
11 ( 21 )
0.428
0.391
0.519
0.500
0.554
0.478
0.455
0.345
0.472
13 ( 21 )
17 ( 29 )
17 ( 29 )
16 ( 28 )
10 ( 21 )
16 ( 28 )
4 ( 10 )
17 ( 22 )
17 ( 29 )
0.414
0.220
0.303
0.404
0.537
0.327
0.473
0.121
0.37
16 ( 28 )
12 ( 24 )
8 ( 17 )
3 ( 10 )
13 ( 24 )
15 ( 27 )
2 ( 8 )
16 ( 21 )
14 ( 26 )
0.317
0.415
0.543
0.605
0.510
0.335
0.490
0.125
0.446
Rank Rank Rank Rank Rank Rank RankIndex Index Index Index Index Index Index
0.547
0.358
0.427
0.386
0.597
0.559
0.665
0.580
0.558
Assam Bihar Chhattisgarh Gujarat Haryana Jharkhand KarnatakaAndhra Pradesh
AP AS KAJH HR GJ CGBR
THEME # 1 ESSENTIAL INFRASTRUCTURE
THEME # 2 SUPPORT TO HUMAN DEVELOPMENT
THEME # 3 SOCIAL PROTECTION
THEME # 4 WOMEN AND CHILDREN
THEME # 5 CRIME, LAW & ORDER
#
# Ranking is for the state of Andhra Pradesh prior to bifurcation.* Note : and states have been ranked separately. Number in bracket indicates ranking amongst all twenty nine states.Small Large
2 ( 4 )8 ( 13 )0.475 17 ( 27 )0.34313 ( 22 )0.4164 ( 8 )0.49716 ( 26 )0.35615 ( 24 )0.3919 ( 14 )0.473 0.625
2 ( 2 )15 ( 19 )0.445 9 ( 11 )0.6026 ( 8 )0.62714 ( 18 )0.4693 ( 3 )0.69412 ( 15 )0.5135 ( 6 )0.648 0.714
103

Large States ( more than 2 crores population )
7 ( 12 )
12 ( 12 )
12 ( 20 )
6 ( 16 )
5 ( 11 )
8 ( 16 )
2 ( 4 )
11 ( 23 )
11 ( 18 )
0.505
0.337
0.425
0.445
0.641
0.548
0.65
0.420
0.472
12 ( 22 )
7 ( 7 )
1 ( 7 )
10 ( 22 )
16 ( 27 )
14 ( 26 )
7 ( 12 )
15 ( 27 )
7 ( 12 )
0.461
0.375
0.494
0.393
0.441
0.466
0.575
0.284
0.582
2 ( 2 )
4 ( 4 )
11 ( 19 )
2 ( 6 )
1 ( 2 )
2 ( 8 )
6 ( 11 )
4 ( 13 )
5 ( 8 )
0.55
0.443
0.426
0.529
0.724
0.608
0.589
0.551
0.636
10 ( 20 )
5 ( 5 )
9 ( 17 )
12 ( 24 )
11 ( 22 )
15 ( 27 )
5 ( 10 )
9 ( 21 )
9 ( 14 )
0.473
0.436
0.433
0.388
0.536
0.437
0.592
0.439
0.557
6 ( 8 )
8 ( 8 )
7 ( 14 )
14 ( 26 )
4 ( 9 )
9 ( 18 )
13 ( 25 )
2 ( 7 )
1 ( 2 )
0.533
0.366
0.454
0.376
0.650
0.540
0.400
0.637
0.774
15 ( 27 )
13 ( 13 )
5 ( 12 )
8 ( 19 )
12 ( 23 )
5 ( 12 )
11 ( 21 )
8 ( 20 )
17 ( 29 )
0.442
0.331
0.469
0.433
0.510
0.561
0.516
0.439
0.239
4 ( 6 )
2 ( 2 )
16 ( 26 )
7 ( 18 )
6 ( 14 )
7 ( 14 )
9 ( 18 )
7 ( 18 )
6 ( 10 )
0.536
0.610
0.393
0.442
0.622
0.554
0.521
0.51
0.612
13 ( 25 )
6 ( 6 )
8 ( 15 )
5 ( 15 )
14 ( 25 )
12 ( 24 )
4 ( 7 )
16 ( 28 )
14 ( 22 )
0.452
0.384
0.450
0.445
0.499
0.483
0.603
0.266
0.387
1 ( 1 )
15 ( 15 )
13 ( 21 )
1 ( 4 )
3 ( 6 )
1 ( 3 )
3 ( 6 )
1 ( 5 )
10 ( 15 )
0.568
0.252
0.425
0.565
0.658
0.655
0.636
0.692
0.553
RankIndex Rank Rank Rank Rank Rank Rank Rank RankIndex Index Index Index Index Index Index Index
Kerala Madhya Pradesh Maharashtra Odisha Punjab Rajasthan Tamil Nadu Uttar Pradesh West Bengal
FAIF RA S IC NIL DB EU XP
WB UPTN RJ PB OD MH MPKL
THEME # 6 DELIVERY OF JUSTICE
THEME # 7 ENVIRONMENT
THEME # 8 TRANSPARENCY AND ACCOUNTABILITY
THEME # 9 FISCAL MANAGEMENT
THEME # 10 ECONOMIC FREEDOM
AGGREGATED INDEX PAI SCORESCORE
3 ( 6 )0.52914 ( 23 )0.3971 ( 2 )0.68211 ( 20 )0.43610 ( 15 )0.4727 ( 12 )0.4815 ( 10 )0.48412 ( 21 )0.4336 ( 11 )0.482
10 ( 12 )0.5848 ( 10 )0.60417 ( 26 )0.31213 ( 17 )0.4794 ( 5 )0.66316 ( 20 )0.4427 ( 9 )0.60911 ( 13 )0.5711 ( 1 )0.757
104
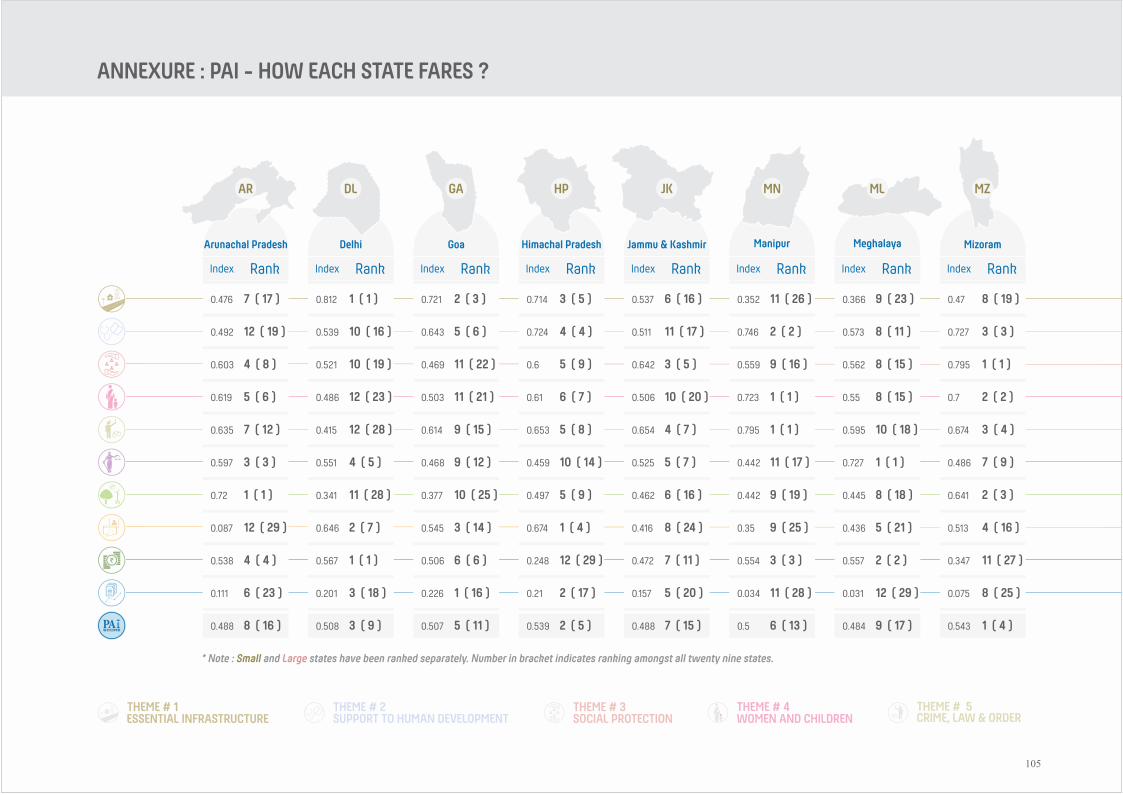
ANNEXURE : PAI - HOW EACH STATE FARES ?
* Note : and states have been ranked separately. Number in bracket indicates ranking amongst all twenty nine states.Small Large
RankIndex
SCORE
Rank Rank Rank Rank Rank Rank RankIndex Index Index Index Index Index Index
Delhi Goa Himachal Pradesh Jammu & Kashmir Manipur Meghalaya Mizoram
1 ( 4 )
8 ( 25 )
11 ( 27 )
7 ( 9 )
3 ( 4 )
2 ( 2 )
1 ( 1 )
3 ( 3 )
8 ( 19 )
0.543
0.075
0.347
0.486
0.674
0.7
0.795
0.727
0.47
9 ( 17 )
12 ( 29 )
2 ( 2 )
1 ( 1 )
10 ( 18 )
8 ( 15 )
8 ( 15 )
8 ( 11 )
9 ( 23 )
0.484
0.031
0.557
0.727
0.595
0.55
0.562
0.573
0.366
6 ( 13 )
11 ( 28 )
3 ( 3 )
11 ( 17 )
1 ( 1 )
1 ( 1 )
9 ( 16 )
2 ( 2 )
11 ( 26 )
0.5
0.034
0.554
0.442
0.795
0.723
0.559
0.746
0.352
7 ( 15 )
5 ( 20 )
7 ( 11 )
5 ( 7 )
4 ( 7 )
10 ( 20 )
3 ( 5 )
11 ( 17 )
6 ( 16 )
0.488
0.157
0.472
0.525
0.654
0.506
0.642
0.511
0.537
2 ( 5 )
2 ( 17 )
12 ( 29 )
10 ( 14 )
5 ( 8 )
6 ( 7 )
5 ( 9 )
4 ( 4 )
3 ( 5 )
0.539
0.21
0.248
0.459
0.653
0.61
0.6
0.724
0.714
5 ( 11 )
1 ( 16 )
6 ( 6 )
9 ( 12 )
9 ( 15 )
11 ( 21 )
11 ( 22 )
5 ( 6 )
2 ( 3 )
0.507
0.226
0.506
0.468
0.614
0.503
0.469
0.643
0.721
3 ( 9 )
3 ( 18 )
1 ( 1 )
4 ( 5 )
12 ( 28 )
12 ( 23 )
10 ( 19 )
10 ( 16 )
1 ( 1 )
0.508
0.201
0.567
0.551
0.415
0.486
0.521
0.539
0.812
8 ( 16 )
6 ( 23 )
4 ( 4 )
3 ( 3 )
7 ( 12 )
5 ( 6 )
4 ( 8 )
12 ( 19 )
7 ( 17 )
0.488
0.111
0.538
0.597
0.635
0.619
0.603
0.492
0.476
Arunachal Pradesh
MZ MLMN JK HPGADLAR
THEME # 1 ESSENTIAL INFRASTRUCTURE
THEME # 2 SUPPORT TO HUMAN DEVELOPMENT
THEME # 3 SOCIAL PROTECTION
THEME # 4 WOMEN AND CHILDREN
THEME # 5 CRIME, LAW & ORDER
2 ( 3 )0.6418 ( 18 )0.4459 ( 19 )0.4426 ( 16 )0.4625 ( 9 )0.49710 ( 25 )0.37711 ( 28 )0.3411 ( 1 )0.72
4 ( 16 )0.5135 ( 21 )0.4369 ( 25 )0.358 ( 24 )0.4161 ( 4 )0.6743 ( 14 )0.5452 ( 7 )0.64612 ( 29 )0.087
105
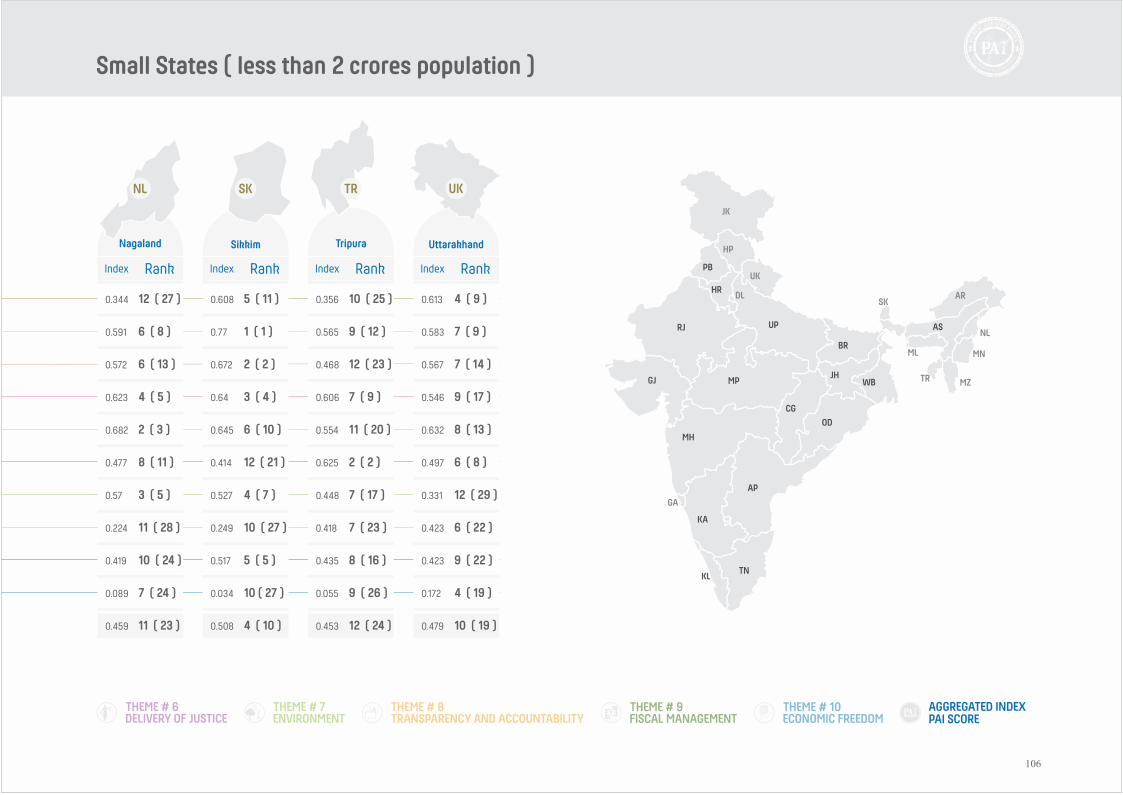
Small States ( less than 2 crores population )
FAIF RA S IC NIL DB EU XP
RankIndex Rank Rank RankIndex Index Index
Nagaland Sikkim Tripura Uttarakhand
10 ( 19 )
4 ( 19 )
9 ( 22 )
6 ( 8 )
8 ( 13 )
9 ( 17 )
7 ( 14 )
7 ( 9 )
4 ( 9 )
0.479
0.172
0.423
0.497
0.632
0.546
0.567
0.583
0.613
12 ( 24 )
9 ( 26 )
8 ( 16 )
2 ( 2 )
11 ( 20 )
7 ( 9 )
12 ( 23 )
9 ( 12 )
10 ( 25 )
0.453
0.055
0.435
0.625
0.554
0.606
0.468
0.565
0.356
4 ( 10 )
10 ( 27 )
5 ( 5 )
12 ( 21 )
6 ( 10 )
3 ( 4 )
2 ( 2 )
1 ( 1 )
5 ( 11 )
0.508
0.034
0.517
0.414
0.645
0.64
0.672
0.77
0.608
11 ( 23 )
7 ( 24 )
10 ( 24 )
8 ( 11 )
2 ( 3 )
4 ( 5 )
6 ( 13 )
6 ( 8 )
12 ( 27 )
0.459
0.089
0.419
0.477
0.682
0.623
0.572
0.591
0.344
TR UK SK NL
AP
AS
BR
CG
GJ
HR
JH
KA
KL
MP
MH
OD
PB
RJ
TN
UP
WB
AR DL
GA
HP
JK
MNML
MZ
NL
SK
TR
UK
THEME # 6 DELIVERY OF JUSTICE
THEME # 7 ENVIRONMENT
THEME # 8 TRANSPARENCY AND ACCOUNTABILITY
THEME # 9 FISCAL MANAGEMENT
THEME # 10 ECONOMIC FREEDOM
AGGREGATED INDEX PAI SCORESCORE
12 ( 29 )0.3317 ( 17 )0.4484 ( 7 )0.5273 ( 5 )0.57
6 ( 22 )0.4237 ( 23 )0.41810 ( 27 )0.24911 ( 28 )0.224
106

Focus Subjects( weightage )
Overall Weightage( of each indicator in PAI )
Power ( 25 )
Water ( 25 )
Roads and Communication ( 25 )
Housing ( 25 )
Education ( 50 )
Health ( 50 )
Public Distribution System ( 25 )
Social Justice and Empowerment ( 25 )
Minority welfare ( 25 )
Employment ( 25 )
Themes( equal weightage )
I Essential Infrastructure ( 10 )
II Support to Human Development ( 10 )
III Social Protection ( 10 )
IV Child and Women ( 10 ) Child ( 60 )
Women ( 40 )
Indicators( weightage )
1
2
3
4
5
6
7
8
9
10
11
12
13
14
15
16
17
18
19
20
21
22
23
24
25
26
27
28
29
30
31
32
33
34
35
36
37
T & D Losses ( 50 )
Per Capita Consumption of Power ( 20 )
Households electrified as a % of total ( 30 )
% of Households with access to safe drinking water ( 50 )
Total Irrigated Area vs Total Agricultural Area ( 20 )
Existence of Water Regulatory Commision ( 15 )
Existence of Ground Water Regulation Act ( 15 )
Surface Roads as a % total Roads ( 60 )
Road Density per 1000 sq. KM ( 20 )
% of households with access to Cellphone ( 20 )
No. of Pucca Houses as a % of total ( 50 )
Slum Population as a % of total Urban population ( 20 )
% of households with toilets inside premises ( 30 )
Educational Development Index ( 30 )
ASER Learning Levels ( 40 )
No. of Higher Education Colleges per 1 Lakh Population ( 15 )
Educational Expenditure as a % of GSDP ( 15 )
IMR ( 20 )
Average Population served per hospital bed ( 30 )
Full Immunization ( 30 )
Health Exp as a % of GSDP ( 20 )
Allocation and offtake of grain under PDS ( 100 )
% of Pension beneficiaries of the total population above 60 ( 33 )
% of Households with no land ( 33 )
Incidence of crime against SC/ST ( 33 )
No. of Minority Children given pre metric scholarship ( 100 )
Unemployment Rate ( 50 )
% of Manual Casual Labour ( 50 )
Crime against Children ( 10 )
Percentage of Child Labour ( 25 )
% of Beneficiaries under ICDS ( 30 )
Child Sex Ratio ( 10 )
% of Malnourished children ( 25 )
Women Working Population ratio ( 25 )
Utilization of Janani Suraksha Yojna Funds ( 25 )
Male Female Literacy Gap ( 25 )
Institutional Delivery ( 25 )
1.25%
0.50%
0.75%
1.25%
0.50%
0.38%
0.38%
1.50%
0.50%
0.50%
1.25%
0.50%
0.75%
1.50%
2.00%
0.75%
0.75%
1.00%
1.50%
1.50%
1.00%
2.50%
0.83%
0.83%
0.83%
2.50%
1.25%
1.25%
0.60%
1.50%
1.80%
0.60%
1.50%
1.00%
1.00%
1.00%
1.00%
ANNEXURE : LIST OF THEMES, FOCUS SUBJECTS, INDICATORS AND WEIGHTAGES
107

Methodology used( refer chapter two )
Latest Data point, CAGR
Latest Data Point
Latest Data Point
Latest Data Point
Latest Data Point
Latest Data PointLatest Data Point
Latest Data Point
Latest Data Point
Latest Data Point
Latest Data Point
Latest Data Point
Latest Data Point
Average, CAGR
Latest Data Point
Average
Latest Data Point
Average,CAGR
Latest Data Point
Latest Data Point
Average
Average
Latest Data Point
Latest Data Point
CAGR, Average
Average
Latest Data Point
Latest Data Point
Latest Data Point
Latest Data Point, Growth Rate
Latest Data Point
Latest Data Point, Growth Rate
Latest Data Point
Latest Data Point
Average
Latest Data Value
Latest Data Point
Source of data( secondary; mostly government, * except where noted )
The Working of State Power Utilities & Electricity Department - Planning Commission of India
Infrastructure Statistics - 2014 MOSPI
Census 2011
Household access to safe drinking water - Planning Commission Report
Land Use Statisics - Directorate of Economics & Statistics, Dept of Agriculture & Co-operation, Ministry of Agriculture
Respective State WebsitesInformation as available in the public domain *Infrastructure Statistics - 2014 MOSPI
Infrastructure Statistics - 2014 MOSPI
Socio-Economic Caste Census
Socio-Economic Caste Census
Health & Family Welfare Statistics 2013 - Ministry of Health & Family Welfare- GoI
Health & Family Welfare Statistics 2013 - Ministry of Health & Family Welfare- GoI
DISE Flash Statistics - MHRD - GoI
ASER Report - PRATHAM * All India Survey of Higher Education Report - MHRD - GoI
Analysis of Budgeted Expenditure on Education - MHRD - GoI
Report: “Analysis of Budgeted Expenditure on Education 2010-11 to 2012-13” (MHRD, Department of Higher Education,
National Health Profile 2013
Health & Family Welfare Statistics 2013 - Ministry of Health & Family Welfare- GoI
data.gov.in
PDS Data
NSAP Website
Socio-Economic Caste Census
National Crime Record Bureau Website
Minority Department Website
NSS 68th round
Socio-Economic Caste Census
National Crime Record Bureau Website
Census
ICDS Report
Census
UNICEF *Key indicators of Employment and Unemployment in India (NSS 68th Round)
Ministry of Health & Family Welfare Statistics
Census
Health & Family Welfare Statistics
Years
2010-11, 2011-12, 2012-13
2011-12
2011
2011
2011-12
Latest
As on 31st March 2012
As on 31st March 2012
2011
2011
2011
2011
2011-12, 2012-13, 2013-14
2014
2010-11, 2011-12, 2012-13
2012-13
2011, 2012, 2013
Reference years is different for states
2009
2011-12, 2012-13, 2013-14
2011-12, 2012-13, 2013-14
As on December 2015
2011
2012, 2013, 2014
2008-09 to 2014-15
2011-12
2011
2014
2001, 2011
2014
2001, 2011
2013-14
2011-12
2012-13, 2013-14, 2014-15
2001, 2011
2009
PAI study( theme icons)
FAIF RA S IC NIL DB EU XP
PUBLIC AFFAIRS INDEX
continued ...
Latest
108

PAI score
ANNEXURE : LIST OF THEMES, FOCUS SUBJECTS, INDICATORS AND WEIGHTAGES
100.00%
Focus Subjects( weightage )
Overall Weightage( of each indicator in PAI )
Indicators( weightage )
Themes( equal weightage )
Rapes per ten lakhs population ( 33.33 )
Murders per ten lakhs population ( 33.33 )
Dowry Deaths per ten lakhs population ( 33.33 )
Custodial Deaths per ten lakhs population ( 50 )
No. of police firings ( 50 )
No. of police personnel per ten lakhs ( 100 )
Pendancy in High Court ( 40 )
Pendancy in District Court ( 60 )
Vacancy in High Court ( 40 )
Vacancy in District Court ( 60 )
Suspended Particulate Matter ( 25 )
SO Emissions ( 25 )
NO Emissions ( 25 )
No. of Environmental Violations in the State (Per capita) ( 25 )
Increase/Decrease in Forest Cover ( 100 )
Renewable Energy as a % of total energy generated ( 100 )
Adherence to Section 4 RTI ( 33.33 )
RTPS act legislated or not ( 33.33 )
No. of Services provided under e-Governance plan ( 33.33 )
Lok Ayukt: Constituted / Bill passed, Individual Web-sites and Chairpersons appointment ( 25 )
No. of ACB cases disposed as a % of total cases registered ( 25 )
Social Audit under NREGA: % of GP's covered ( 25 )
Panchayat Devolution Index Score ( 25 )
Revenue Surplus / Deficit (% of GSDP) ( 33.33 )
Fiscal Surplus / Deficit (% of GSDP) ( 33.33 )
Debt Burden (% of GSDP) ( 33.33 )
Per Capita Development Expenditure ( 50 )
States own tax revenue growth ( 50 )
No. of Industrial Entrepreneurs Memorandum filed ( 33.33 )
Ease of Doing Business ( 33.33 )
Value of MSME's assets (% of GSDP) ( 33.33 )
38
39
40
41
42
43
44
45
46
47
48
49
50
51
52
53
54
55
56
57
58
59
60
61
62
63
64
65
66
67
68
Crime, Law & Order ( 10 )
Delivery of Justice ( 10 )
Environment ( 10 )
Transparency and Accountability ( 10 )
Fiscal Management ( 10 )
Economic Freedom ( 10 )
Violent Crimes ( 50 )
Atrocities ( 20 )
Policing ( 30 )
Pendency of Cases ( 50 )
Vacancies of Presiding Officers ( 50 )
Pollution & Environmental Violations ( 50 )
Forest Cover ( 20 )
Renewable Energy ( 30 )
Transparency ( 50 )
Public Accountability ( 50 )
FRBM Indicators ( 50 )
Resource Generation & Development Expenditure ( 50 )
Economic Freedom ( 100 )
V
VI
VII
VIII
IX
X
1.67%
1.67%
1.67%
1.00%
1.00%
3.00%
2.00%
3.00%
2.00%
3.00%
1.25%
1.25%
1.25%
1.25%
2.00%
3.00%
1.67%
1.67%
1.67%
1.25%
1.25%
1.25%
1.25%
1.67%
1.67%
1.67%
2.50%
2.50%
3.33%
3.33%
3.33%
Aggregated Ranking
2
2
109

FAIF RA S IC NIL DB EU XP
PUBLIC AFFAIRS INDEX
SCORE
Years PAI study( theme icons)
2012-13, 2013-14, 2014-15
2012-13, 2013-14, 2014-15
2012-13, 2013-14, 2014-15
2012-13, 2013-14, 2014-15
2012-13, 2013-14, 2014-15
2011-12, 2012-13, 2013-14
2012, 2013, 2014
2012, 2013, 2014
2012, 2013, 2014
2012, 2013, 2014
2010, 2012
2010, 2012
2010, 2012
2009, 2011, 2013
2015
2015
2015
2015
2011, 2012, 2013
2013-14
2015
2012-13, 2013-14, 2014-15
2012-13, 2013-14, 2014-15
2013, 2014, 2015
2012-13, 2013-14, 2014-15
2012-13, 2013-14, 2014-15
2011-12,2012-13,2013-14
2014-15
2013-14
2014 - 15
as on 30th march 2015
National Crime Record Bureau Website
National Crime Record Bureau Website
National Crime Record Bureau Website
National Crime Record Bureau Website
National Crime Record Bureau Website
National Crime Record Bureau Website
Court news, Supreme Court of India
Court news, Supreme Court of India
Court news, Supreme Court of India
Court news, Supreme Court of India
National Ambient Air Quality Status & Trends in India - Central Pollution Control Board - Ministry of Environment &
National Ambient Air Quality Status & Trends in India - Central Pollution Control Board - Ministry of Environment &
National Ambient Air Quality Status & Trends in India - Central Pollution Control Board - Ministry of Environment &
NCRB
India State of Forest Report - Forest Survey of India
Central Electricity Authority
Respective State Websites
Respective State Websites
National E-governance website
Respective State Websites
Crime in India Statistics - National Crime Records Bureau - Ministry of Home Affairs
Social Audit Report, Ministry of Rural Development
Report on devolution - Ministry of Panchayati Raj
A study of Budgets - Reserve Bank of India
A study of Budgets - Reserve Bank of India
A study of Budgets - Reserve Bank of India
A study of Budgets - Reserve Bank of India
A study of Budgets - Reserve Bank of India
2013-14 Annual Report of DIPP
Department of Industrial and Policy & Promotion Report on Ease of Doing Business
Annual Report 2013-14 Ministry of MSME
Average, CAGR
Average,CAGR
Average
Average
Average
Average,CAGR
CAGR, Latest Data Point
CAGR, Latest Data Point
CAGR, Latest Data Point
CAGR, Latest Data Point
Average,Growth Rate
Average,Growth Rate
Average,Growth Rate
Latest Data Point
CAGR
Latest Data Point
Latest Data Point
Latest Data Point
Latest Data Point
Latest Data Point
Average, CAGR
Latest Data Point
Latest Data Point
Average, Growth Rate
Average, Growth Rate
Average, CAGR
Average, CAGR
Average, CAGR
Average, CAGR
Latest Data Point
Latest Data Point
Source of data( secondary; mostly government, * except where noted )
Methodology used( refer chapter two )
110
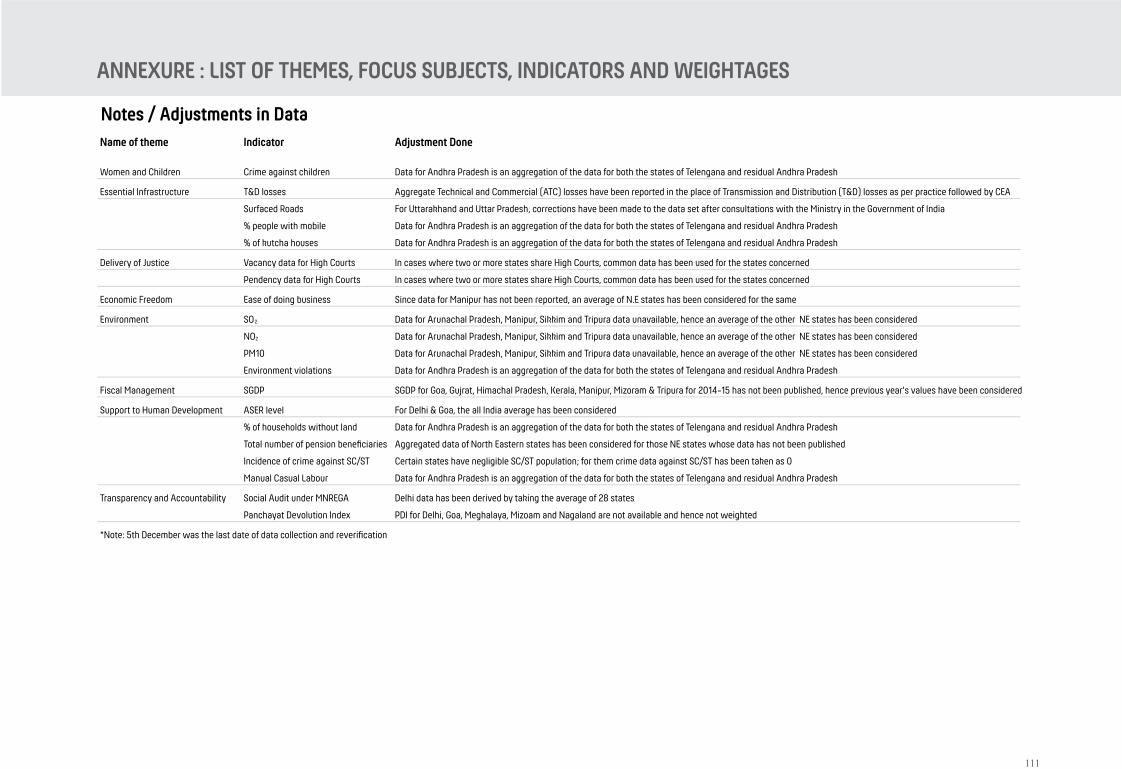
ANNEXURE : LIST OF THEMES, FOCUS SUBJECTS, INDICATORS AND WEIGHTAGES
Name of theme Indicator Adjustment Done
Women and Children Crime against children Data for Andhra Pradesh is an aggregation of the data for both the states of Telengana and residual Andhra Pradesh
Essential Infrastructure T&D losses Aggregate Technical and Commercial (ATC) losses have been reported in the place of Transmission and Distribution (T&D) losses as per practice followed by CEA
Surfaced Roads For Uttarakhand and Uttar Pradesh, corrections have been made to the data set after consultations with the Ministry in the Government of India
% people with mobile Data for Andhra Pradesh is an aggregation of the data for both the states of Telengana and residual Andhra Pradesh
% of kutcha houses Data for Andhra Pradesh is an aggregation of the data for both the states of Telengana and residual Andhra Pradesh
Delivery of Justice Vacancy data for High Courts In cases where two or more states share High Courts, common data has been used for the states concerned
Pendency data for High Courts In cases where two or more states share High Courts, common data has been used for the states concerned
Economic Freedom Ease of doing business Since data for Manipur has not been reported, an average of N.E states has been considered for the same
Environment SO Data for Arunachal Pradesh, Manipur, Sikkim and Tripura data unavailable, hence an average of the other NE states has been considered
NO Data for Arunachal Pradesh, Manipur, Sikkim and Tripura data unavailable, hence an average of the other NE states has been considered
PM10 Data for Arunachal Pradesh, Manipur, Sikkim and Tripura data unavailable, hence an average of the other NE states has been considered
Environment violations Data for Andhra Pradesh is an aggregation of the data for both the states of Telengana and residual Andhra Pradesh
Fiscal Management SGDP SGDP for Goa, Gujrat, Himachal Pradesh, Kerala, Manipur, Mizoram & Tripura for 2014-15 has not been published, hence previous year's values have been considered
Support to Human Development ASER level For Delhi & Goa, the all India average has been considered
% of households without land Data for Andhra Pradesh is an aggregation of the data for both the states of Telengana and residual Andhra Pradesh
Total number of pension beneficiaries Aggregated data of North Eastern states has been considered for those NE states whose data has not been published
Incidence of crime against SC/ST Certain states have negligible SC/ST population; for them crime data against SC/ST has been taken as 0
Manual Casual Labour Data for Andhra Pradesh is an aggregation of the data for both the states of Telengana and residual Andhra Pradesh
Transparency and Accountability Social Audit under MNREGA Delhi data has been derived by taking the average of 28 states
Panchayat Devolution Index PDI for Delhi, Goa, Meghalaya, Mizoam and Nagaland are not available and hence not weighted
*Note: 5th December was the last date of data collection and reverification
Notes / Adjustments in Data
2
2
111

PAC PUBLICATIONS
For further details visit
www.pacindia.org
, ,
112

1. State of the Art as Art of the State: Evaluating e-governance Initiatives through citizen feedback
(Ramesh Ramanathan, Suresh Balakrishnan), 2000.
2. Wanted: An Enabling Industrial Environment in Karnataka (Samuel Paul, Sheila Premkumar, Prasann Thatte), 2000.
3. Benchmarking Urban Services: The Second Report Card on Bangalore (Samuel Pual, Sita Sekhar), 2000.
4. Citizen’s Audit of Public Services in Rural Tamil Nadu (Catalyst Trust, Public Affairs Centre), 2001.
5. Civic Engagement for Better Public Governance (Manjunath Sadashiva, Suresh Balakrishnan), 2002.
6. New Media and People’s Empowerment: The Second Public Affairs Lecture (Dr. Mallika Sarabhai), 2002.
7. ABC… Of Voting: A Guide For Voting in Indian Elections (Public Affairs Centre), 2002.
8. Universal Elementary Education: A Way Forward for India. The Third Annual Public Affairs Lecture
(Azim Premji),2003.
9. A Report Card on Bhoomi Kiosks (Albert Lobo, Suresh Balakrishnan), 2004.
10. Towards User Report Cards on Irrigation Services (Suresh Balakrishnan, Albert Lobo), 2004.
11. BATF: A Partnership with Promise? The Fourth Annual Public Affairs Lecture (Nandan M. Nilekani),2004.
12. Public Affairs Centre: A Retrospective 1994 - 2000.
13. Holding a Mirror to the New Lok Sabha (Samuel Paul, M. Vivekananda), 2005.
14. Karnataka’s Citizens’ Charters: A Preliminary Assessment (Anuradha Rao), 2005.
15. Electoral Disclosure in Karnataka: A Reality Check (Samuel Paul, Poornima D.G., Anuradha Rao), 2005.
16. Spirituality & Universality: The Fifth Annual Public Affairs Lecture ( Sri Sri Ravi Shankar), 2005.
17. Benchmarking India’s Public Services: A comparison across the states (Samuel Paul, Suresh Balakrishnan, K.
Gopakumar, Sita Sekhar, M. Vivekananda), 2005.
18. Setting a Benchmark: Citizen Report Card on Public Services in Bhubaneswar (Public Affairs Centre,
Centre for Youth and Social Development), 2005.
19. Are They Being Served? Citizen Report Card on Public Services for the Poor in Peri-Urban Areas of Bangalore
(Sita Sekhar, Meena Nair, Venugopala Reddy), 2005.
20. Holding the State to Account: Lessons of Bangalore’s Citizen Report Cards (Samuel Paul), 2006.
21. Deepening Democracy: A Decade of Electoral Interventions by Civil Society Groups 1996-2006 (Public
Affairs Centre), 2006.
22. Benchmarking Bangalore’s Public Services: What the Third Citizen Report Card Reveals (Sita Sekhar, Manisha
Shah), 2006.
23. Citizenship and Good Governance: The Sixth Annual Public Affairs Lecture (Sheila Dikshit), 2006.
24. Public Services in Hubli-Dharwad: A Citizen Report Card (Sita Sekhar, Meena Nair, Venugopala Reddy),
2007.
25. Greater Bangalore Governance Options (S. Krishna Kumar), 2007.
26. Assessment of Citizen Centres in Tamil Nadu (Sita Sekhar, Meena Nair, A. Venugopala Reddy, K.
Prabhakar), 2007.
27. Public Services in Hubli-Dharwad: The Second Citizen Report Card (Sita Sekhar, Meena Nair, K. Prabhakar,
Prarthana Rao), 2008.
28. Decentralised Service Delivery in Panchayats: A Pilot Citizens’ Audit (Sita Sekhar, Meena Nair, A. Venugopala
Reddy), 2008.
29. Public Services Provided by Gram Panchayats in Chattisgarh: A Citizen Report Card (Sita Sekhar, Meena
Nair, K. Prabhakar), 2008.
30. Study of Sarva Shiksha Abhiyan Initiatives on Universalisation of Elementary Education in Karnataka with
Special Reference to Concerns of Gender and Equity (Sita Sekhar, Meena Nair, K. Prabhakar, Prarthana
Rao), 2009.
31. Services of Gram Panchayats in Koraput, Orissa: A Citizen Report Card (Sita Sekhar, Meena Nair, K.
Prabhakar, Prarthana Rao), 2009.
32. A Mirror to the Police: A Bottom-Up Assessment of the Karnataka Police (Meena Nair, K. Prabhakar,
Prarthana Rao), 2010.
33. Towards a Vibrant Knowledge Society: A Stakeholder Audit of the Karnataka Jnana Aayoga (Shweta Gaur,
Nivedita Kashyap, Meena Nair, R. Suresh), 2011.
34. A Life and Its Lessons: Memoirs (Samuel Paul), 2012.
35. Citizen Monitoring and Audit of PMGSY Roads: Pilot Phase II (Public Affairs Centre), 2012.
36. Improving Governance the Participatory Way: A pilot study of maternal health services for urban poor in
Bangalore (Meena Nair, K Prabhakar, Prarthana Rao, Poornima G. R.), 2012.
37. Case Studies from the Social Audit of Public Service Delivery in Karnataka (M. Vivekananda, S. Sreedharan,
Malavika Belavangala), 2012.
38. Changing the Urban Face of Karnataka: Evidence from three urban development programmes (Kala S Sridhar,
Venugopala Reddy, Pavan Srinath), 2012.
39. Citizen Voices in Environmental Governance – Proccedings of the Colloquium organised by the
Environmental Governance Group Bangalore – 23-24 August 2012.
40. Social Audit of Public Service Delivery in Karnataka (M. Vivekananda, Dr. S. Sreedharan, Malavika
Belavangala), 2012.
41. Transforming Karnataka into a Vibrant Knowledge Society (Satyajeet Nanda, Nivedita Kashyap, Meena
Nair, R. Suresh), 2013.
42. A Green Manifesto for Environmental Governance – A people-centred tool and approach (PAC Environmental
Governance Group), 2013.
43. India’s Mahatma Gandhi National Rural Employment Guarantee Scheme (MGNREGS): Has it impacted
poverty? (A working paper by Kala Seetharam Sridhar, A.Venugopala Reddy), 2013.
44. The Paradox of India’s North-South Divide – Lessons from the States and the Regions (Samuel Paul, Kala
Seetharam Sridhar), 2013.
45. Contribution of the Urban Poor: Pilot Studies from Chennai and Bengaluru, India (Kala Seetharam Sridhar
and A.Venugopala Reddy), 2014.
46. Holding the State to Account: Citizen Monitoring in Action (Samuel Paul), Books for Change: 2002.
47. Who Benefits from India’s Public Services? (Samuel Paul, Suresh Balakrishnan, K. Gopakumar, Sita
Sekhar, M. Vivekananda), Academic Foundation: 2006.
48. State of Urban Services in India’s Cities (Kala Seetharam Sridhar, A. Venugopala Reddy), Oxford
University Press India: 2010.
49. State of Our Cities: Evidence from Karnataka (Samuel Paul, Kala Seetharam Sridhar, A. Venugopala
Reddy, Pavan Srinath), Oxford University Press India: 2012.
For other titles email
113

Committed to good governancePUBLIC AFFAIRS CENTRE
No.15, KIADB Industrial Area, Jigani - Bommasandra Link Road, Bangalore 560105 IndiaPhone +91 (0) 80 278 399 18 / 19 / 20 | [email protected] | www.pacindia.org
Public Affairs Index Measuring the quality of governance of Indian states
Although good governance has always been the objective of all governments across the world, it was from the early 1990's, that many international institutions like the World Bank started emphasising that “Good Governance” is a necessary condition for fast and inclusive development in any economy. Lately, there has been renewed focus in the country about governance processes and institutions to evaluate the quality and levels of governance. In a federal country like India, where the responsibilities and duties of the State Governments have been listed out clearly in the Constitution, the role of the States to achieve high levels of governance gains more importance. Can governance be measured in an objective manner using data available in the public domain so as to capture the essence of this quality of governance? Can we identify the critical aspects of governance and use the same for comparison between the States? Can we assign scores and ranks to the States based on the aggregation of the data in various key areas of governance? These were the issues that attracted the curiosity of Public Affairs Centre and prompted it to undertake the study.
The Public Affairs Index (PAI) is an attempt to bring together the states of the country which are culturally, economically and socially diverse, into a common data-driven framework, to facilitate an interstate comparison. A well-framed methodology backed by statistical data from government sources, have been included in the study to provide insights into the subject.
ISBN 978-81-88816-98-9
Copyright © 2016 Public Affairs Centre
INR 350/-
www.pai.pacindia.org
www.publicaffairsindex.in