Publi20 Doctorat2018 CED
13
Doctors 2018 - Survey 2019-2020 Student Training and Post-Graduate Observatory (OFDE) 1 Age Average = 30 years Standard deviation = 6 N % Under 24 years 0 0% 24 to 29 years 112 62% 30 to 34 years 39 21% 35 to 39 years 15 8% 40 to 44 years 10 5% 45 years and over 6 3% Total 182 100% Promotion 2012/2013 Class of 2018 PhD Post-Graduate Information Number of PhD holders surveyed: Number of respondents: Response rate: 182 129 71% NOTE: The profile of respondents is similar to that of the PhD holders surveyed, with the exception of foreign doctors, who are under- represented among the respondents. 1 - Profile of respondents The situation of our doctors, and more specifically, their professional integration, was observed on December 1st 2017, one year after the date of their defense, and on December 1st 2019, three years after their defense. This study was carried out using a questionnaire designed by the Ministry of Higher Education, Research and Innovation (MESRI), which oversees all French universities. PhD Degree N % Female 73 40% Male 109 60% Total 182 100% Sex N % French 104 57% Foreign 78 43% Total 182 100% Nationality Contents 1 - Profile of respondents 2 - Studies before PhD program 3 - PhD program 4 - Situation of PhD holders on December 1st 2019 All PhD holders Responding PhD holders Age Répondants Average = 30 years Standard deviation = 6 N %. Under 24 years 0 0% 24 to 29 years 89 69% 30 to 34 years 25 19% 35 to 39 years 8 6% 40 to 44 years 5 4% 45 years and over 2 2% Total 129 100% Répondants N % Female 55 43% Male 74 57% Total 129 100% Sex Répondants N % French 86 67% Foreign 43 33% Total 129 100% Nationality Doctoral College
Transcript of Publi20 Doctorat2018 CED
Doctors 2018 - Survey 2019-2020
Student Training and Post-Graduate Observatory (OFDE)1
AgeAverage = 30 years Standard deviation = 6
N %
Under 24 years 0 0%
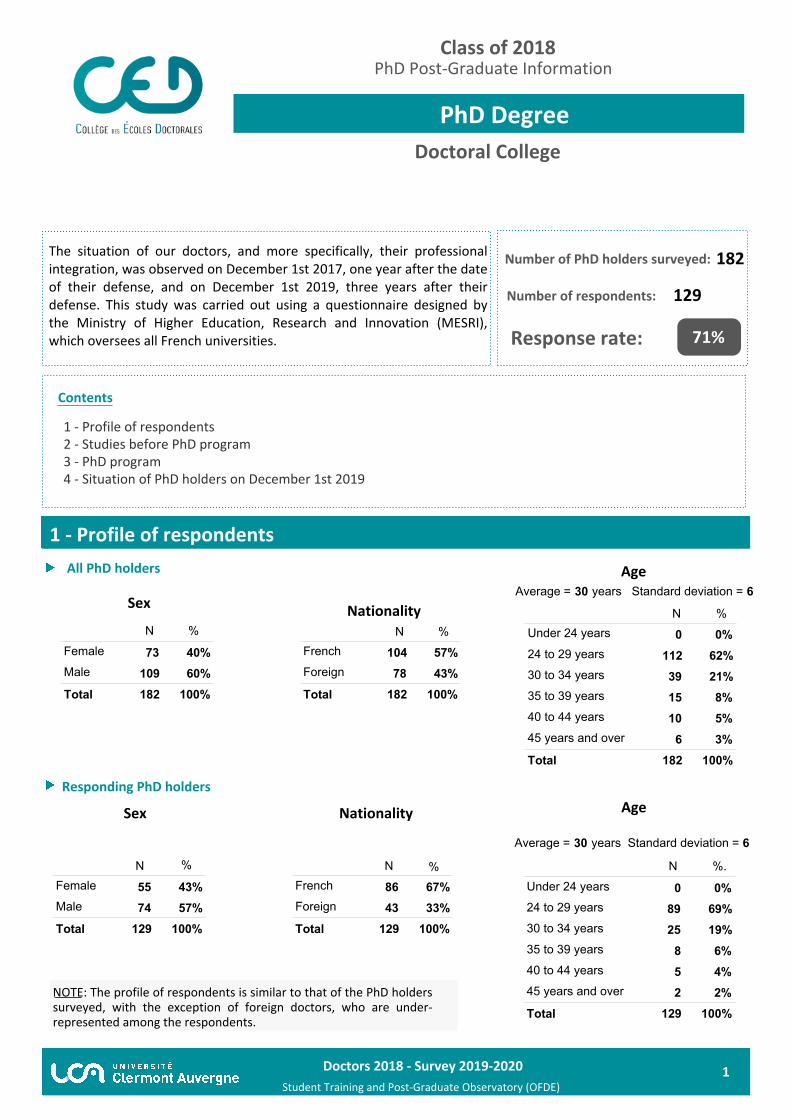
24 to 29 years 112 62%
30 to 34 years 39 21%
35 to 39 years 15 8%
40 to 44 years 10 5%
45 years and over 6 3%
Total 182 100%
Promotion2012/2013
Class of 2018PhD Post-Graduate Information
Number of PhD holders surveyed:
Number of respondents:
Response rate:
182
129
71%
NOTE: The profile of respondents is similar to that of the PhD holders surveyed, with the exception of foreign doctors, who are under- represented among the respondents.
1 - Profile of respondents
The situation of our doctors, and more specifically, their professional integration, was observed on December 1st 2017, one year after the date of their defense, and on December 1st 2019, three years after their defense. This study was carried out using a questionnaire designed by the Ministry of Higher Education, Research and Innovation (MESRI), which oversees all French universities.
PhD Degree
N %
Female 73 40%
Male 109 60%
Total 182 100%
Sex
N %
French 104 57%
Foreign 78 43%
Total 182 100%
Nationality
Contents
1 - Profile of respondents2 - Studies before PhD program3 - PhD program4 - Situation of PhD holders on December 1st 2019
All PhD holders
Responding PhD holdersAge
Répondants
Average = 30 years Standard deviation = 6
N %.
Under 24 years 0 0%
24 to 29 years 89 69%
30 to 34 years 25 19%
35 to 39 years 8 6%
40 to 44 years 5 4%
45 years and over 2 2%
Total 129 100%
Répondants
N %
Female 55 43%
Male 74 57%
Total 129 100%
Sex
Répondants
N %
French 86 67%
Foreign 43 33%
Total 129 100%
Nationality
Doctoral College
Doctors 2018 - Survey 2019-2020
Student Training and Post-Graduate Observatory (OFDE)2
En emploi 2019
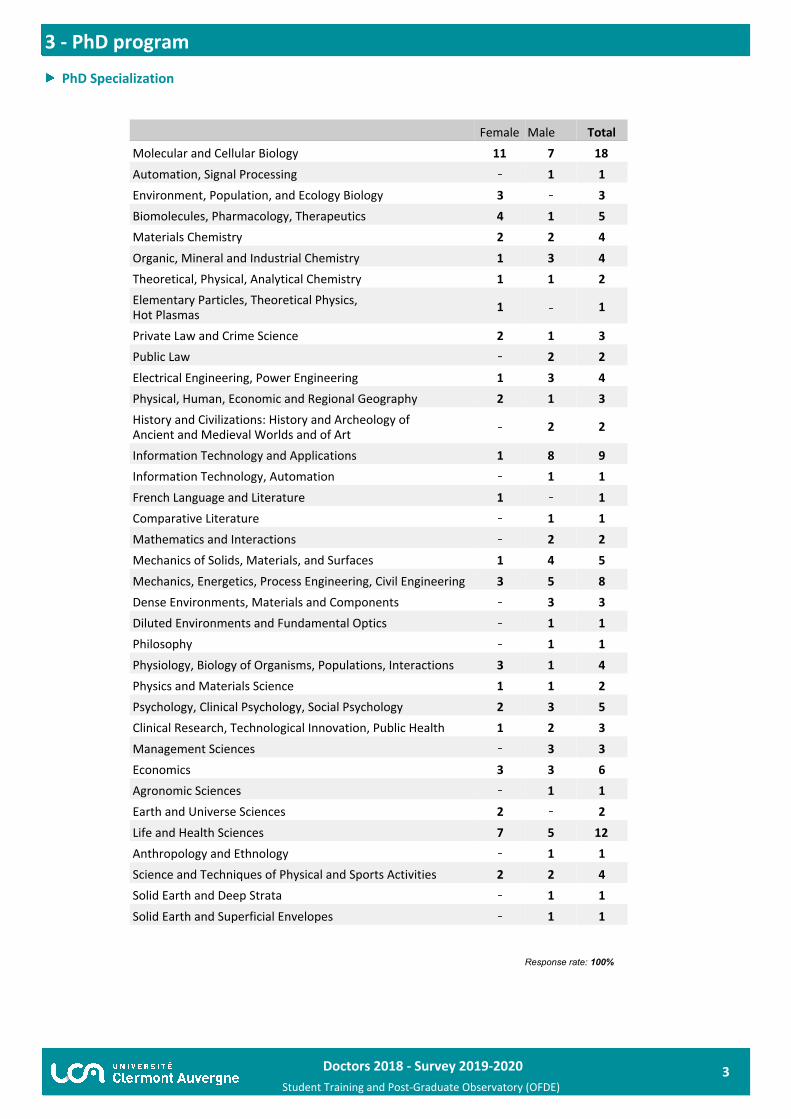
Response rate: 100%
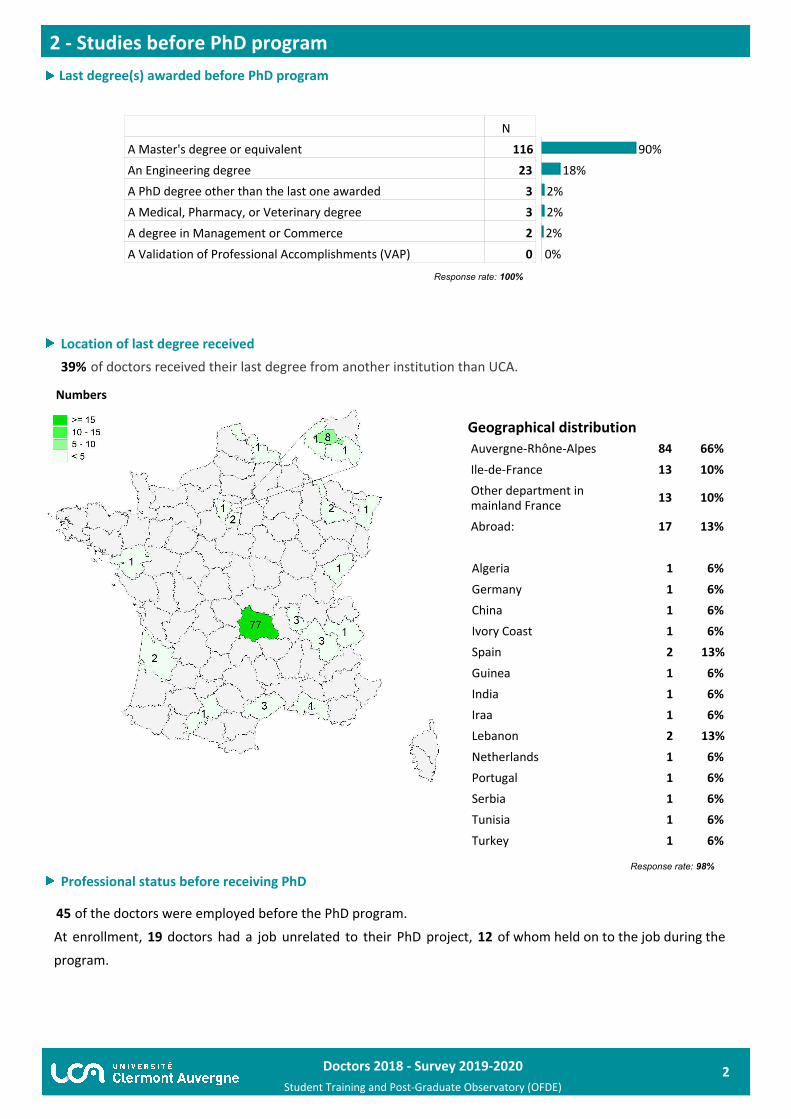
2 - Studies before PhD program
N
116
23
3
3
2
A Master's degree or equivalentAn Engineering degreeA PhD degree other than the last one awardedA Medical, Pharmacy, or Veterinary degreeA degree in Management or CommerceA Validation of Professional Accomplishments (VAP) 0
90%
18%
2%
2%
2%
0%
Professional status before receiving PhD
45 of the doctors were employed before the PhD program.
At enrollment, 19 doctors had a job unrelated to their PhD project, 12 of whom held on to the job during the
program.
RLast degree(s) awarded before PhD program
Répondants
Response rate: 98%
Auvergne-Rhône-Alpes 84 66%
Ile-de-France 13 10%
Other department in mainland France 13 10%
Abroad: 17 13%
Geographical distribution
Location of last degree received39% of doctors received their last degree from another institution than UCA.
Numbers
Répondants
Algeria 1 6%
Germany 1 6%
China 1 6%
Ivory Coast 1 6%
Spain 2 13%
Guinea 1 6%
India 1 6%
Iraa 1 6%
Lebanon 2 13%
Netherlands 1 6%
Portugal 1 6%
Serbia 1 6%
Tunisia 1 6%
Turkey 1 6%
Doctors 2018 - Survey 2019-2020
Student Training and Post-Graduate Observatory (OFDE)3
En emploi 2019
Response rate: 100%
3 - PhD program
Female Male Total
Molecular and Cellular BiologyAutomation, Signal ProcessingEnvironment, Population, and Ecology BiologyBiomolecules, Pharmacology, TherapeuticsMaterials ChemistryOrganic, Mineral and Industrial ChemistryTheoretical, Physical, Analytical ChemistryElementary Particles, Theoretical Physics, Hot PlasmasPrivate Law and Crime SciencePublic LawElectrical Engineering, Power EngineeringPhysical, Human, Economic and Regional GeographyHistory and Civilizations: History and Archeology of Ancient and Medieval Worlds and of ArtInformation Technology and ApplicationsInformation Technology, AutomationFrench Language and LiteratureComparative LiteratureMathematics and InteractionsMechanics of Solids, Materials, and SurfacesMechanics, Energetics, Process Engineering, Civil EngineeringDense Environments, Materials and ComponentsDiluted Environments and Fundamental OpticsPhilosophyPhysiology, Biology of Organisms, Populations, InteractionsPhysics and Materials SciencePsychology, Clinical Psychology, Social PsychologyClinical Research, Technological Innovation, Public HealthManagement SciencesEconomicsAgronomic SciencesEarth and Universe SciencesLife and Health SciencesAnthropology and EthnologyScience and Techniques of Physical and Sports ActivitiesSolid Earth and Deep StrataSolid Earth and Superficial Envelopes
11 7
1
3
4 1
2 2
1 3
1 1
1
2 1
2
1 3
2 1
2
1 8
1
1
1
2
1 4
3 5
3
1
1
3 1
1 1
2 3
1 2
3
3 3
1
2
7 5
1
2 2
1
1
18
1
3
5
4
4
2
1
3
2
4
3
2
9
1
1
1
2
5
8
3
1
1
4
2
5
3
3
6
1
2
12
1
4
1
1
Ré
PhD Specialization
Doctors 2018 - Survey 2019-2020
Student Training and Post-Graduate Observatory (OFDE)4
Répondants
Response rate: 76%
Répondants
Response rate: 97%
Répondants
Response rate: 80%
En emploi 2019
Response rate: 100%
Répondants
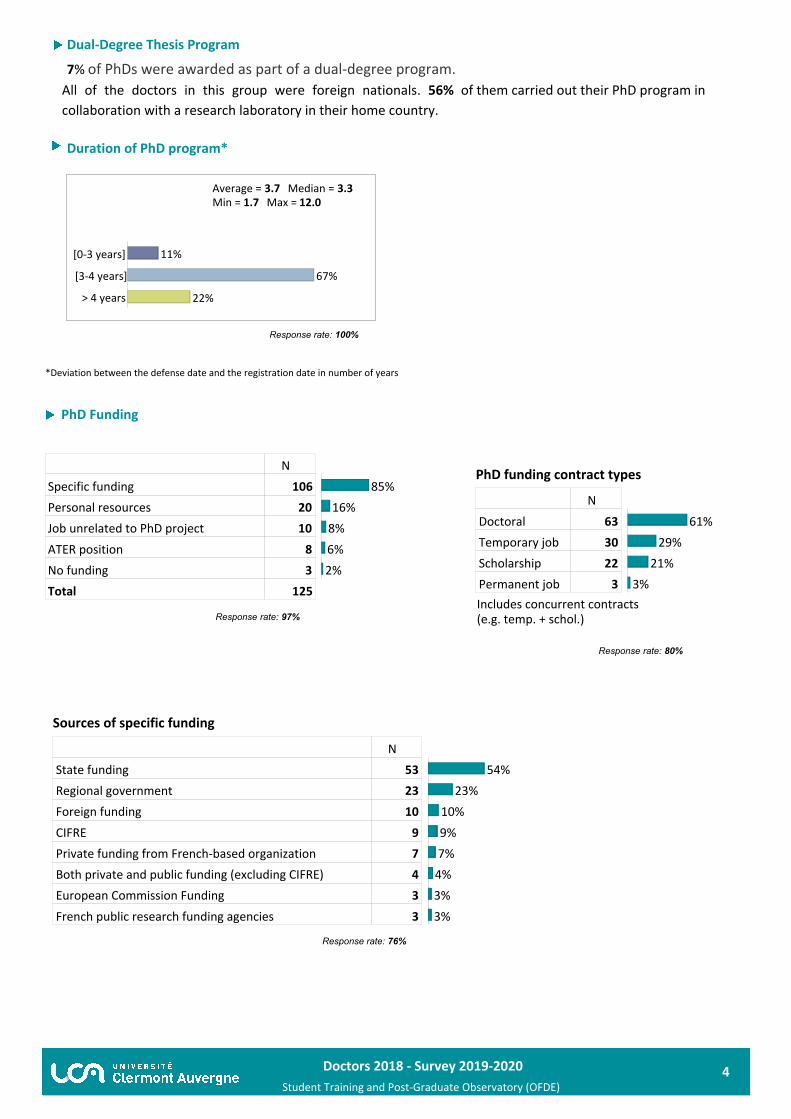
Average = 3.7 Median = 3.3 Min = 1.7 Max = 12.0
N
Specific funding 106
Personal resources 20
Job unrelated to PhD project 10
ATER position 8
No funding 3
Total 125
85%
16%
8%
6%
2%
Répondants
PhD funding contract types
N
Doctoral 63
Temporary job 30
Scholarship 22
Permanent job 3
61%
29%
21%
3%
Répondants
Sources of specific funding
N
State funding 53
Regional government 23
Foreign funding 10
CIFRE 9
Private funding from French-based organization 7
Both private and public funding (excluding CIFRE) 4
European Commission Funding 3
French public research funding agencies 3
54%
23%
10%
9%
7%
4%
3%
3%
Répondants
[0-3 years] 11%
[3-4 years] 67%
> 4 years 22%
*Deviation between the defense date and the registration date in number of years
PhD Funding
Répondants
Dual-Degree Thesis Program
7% of PhDs were awarded as part of a dual-degree program.All of the doctors in this group were foreign nationals. 56% of them carried out their PhD program in collaboration with a research laboratory in their home country.
Duration of PhD program*
Includes concurrent contracts (e.g. temp. + schol.)
Doctors 2018 - Survey 2019-2020
Student Training and Post-Graduate Observatory (OFDE)5
Répondants
Response rate: 97%
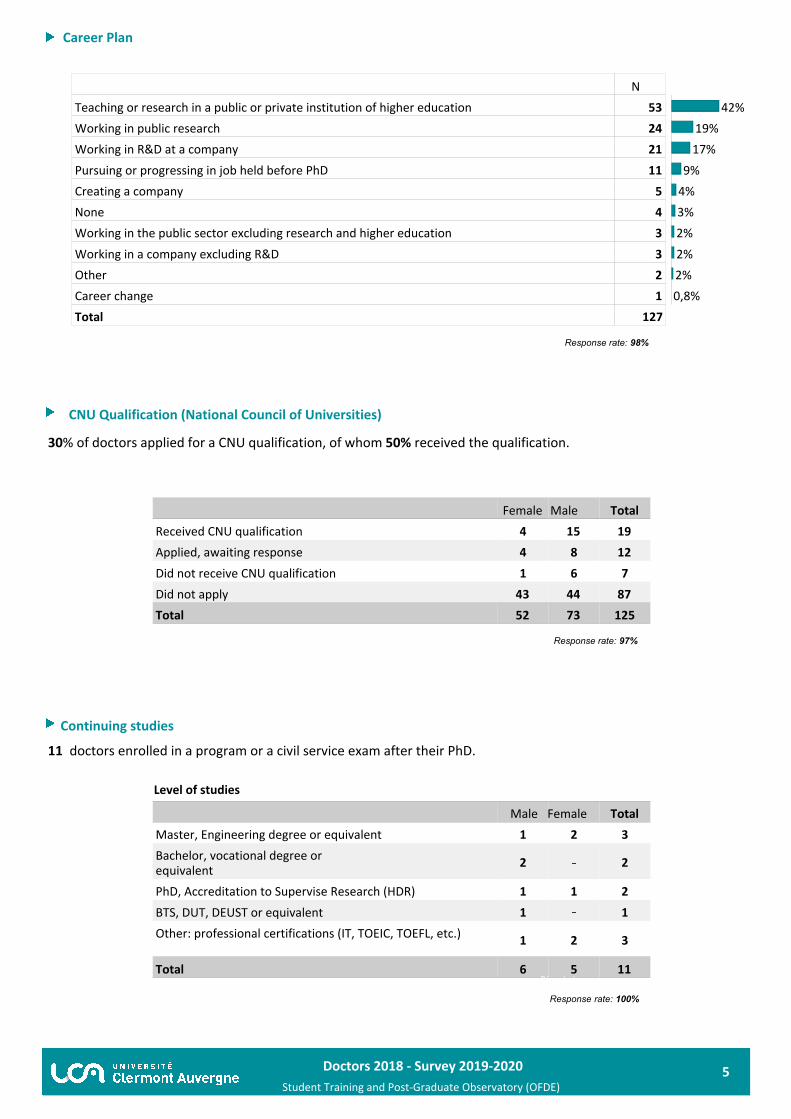
Career Plan
Répondants
Female Male Total
Received CNU qualificationApplied, awaiting responseDid not receive CNU qualificationDid not applyTotal
4 15
4 8
1 6
43 44
19
12
7
87
52 73 125
Répondants
Response rate: 98%
Continuing studies
11 doctors enrolled in a program or a civil service exam after their PhD. Répondants
Level of studies
Male Female Total
Master, Engineering degree or equivalentBachelor, vocational degree or equivalent
PhD, Accreditation to Supervise Research (HDR)BTS, DUT, DEUST or equivalentOther: professional certifications (IT, TOEIC, TOEFL, etc.)
Total
1 2
2
1 1
1
1 2
3
2
2
1
3
6 5 11Répondants
Response rate: 100%
Répondants
N
Teaching or research in a public or private institution of higher education 53
Working in public research 24
Working in R&D at a company 21
Pursuing or progressing in job held before PhD 11
Creating a company 5
None 4
Working in the public sector excluding research and higher education 3
Working in a company excluding R&D 3
Other 2
Career change 1
Total 127
42%
19%
17%
9%
4%
3%
2%
2%
2%
0,8%
CNU Qualification (National Council of Universities)
30% of doctors applied for a CNU qualification, of whom 50% received the qualification.
Doctors 2018 - Survey 2019-2020
Student Training and Post-Graduate Observatory (OFDE) 6
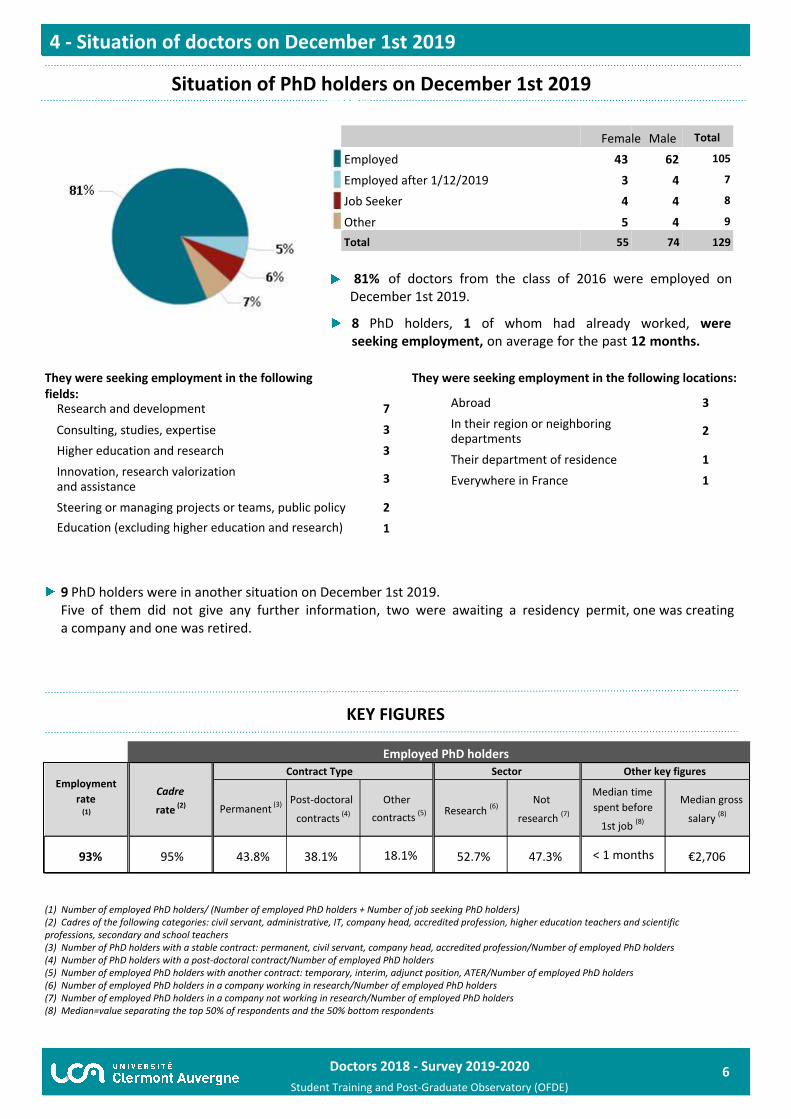
Abroad 3
In their region or neighboring departments 2
Their department of residence 1
Everywhere in France 1
KEY FIGURES
(1) Number of employed PhD holders/ (Number of employed PhD holders + Number of job seeking PhD holders)(2) Cadres of the following categories: civil servant, administrative, IT, company head, accredited profession, higher education teachers and scientific professions, secondary and school teachers (3) Number of PhD holders with a stable contract: permanent, civil servant, company head, accredited profession/Number of employed PhD holders (4) Number of PhD holders with a post-doctoral contract/Number of employed PhD holders(5) Number of employed PhD holders with another contract: temporary, interim, adjunct position, ATER/Number of employed PhD holders(6) Number of employed PhD holders in a company working in research/Number of employed PhD holders(7) Number of employed PhD holders in a company not working in research/Number of employed PhD holders(8) Median=value separating the top 50% of respondents and the 50% bottom respondents
4 - Situation of doctors on December 1st 2019
38.1%95%93% €2,70643.8%
Employed PhD holders
< 1 months52.7%18.1% 47.3%
NAT_interruption_etudes Parmi "\2 ; \3"
Répondants
INFOG9Valid_situation_dec_19
Female Male Total
EmployedEmployed after 1/12/2019Job SeekerOtherTotal
43 62
3 4
4 4
5 4
105
7
8
9
55 74 129
Situation of PhD holders on December 1st 2019Répondants
Research and development 7
Consulting, studies, expertise 3
Higher education and research 3
Innovation, research valorization and assistance 3
Steering or managing projects or teams, public policy 2
Education (excluding higher education and research) 1
They were seeking employment in the following locations:They were seeking employment in the following fields: En recherche d emploi 2019
9 PhD holders were in another situation on December 1st 2019.Five of them did not give any further information, two were awaiting a residency permit, one was creating a company and one was retired.
81% of doctors from the class of 2016 were employed on December 1st 2019.
8 PhD holders, 1 of whom had already worked, were seeking employment, on average for the past 12 months.
Permanent (3) Post-doctoral
contracts (4)
Othercontracts
(5) Research (6)
Not
research (7)
Median timespent before
1st job (8)
Median gross
salary (8)
Employmentrate
(1)
Cadre
rate (2)
Contract Type Sector Other key figures
Doctors 2018 - Survey 2019-2020
Student Training and Post-Graduate Observatory (OFDE)7
En emploi 2019
Response rate: 89%
loi 2019
Response rate: 80%
En emploi 2019
Response rate: 100%
Répondants
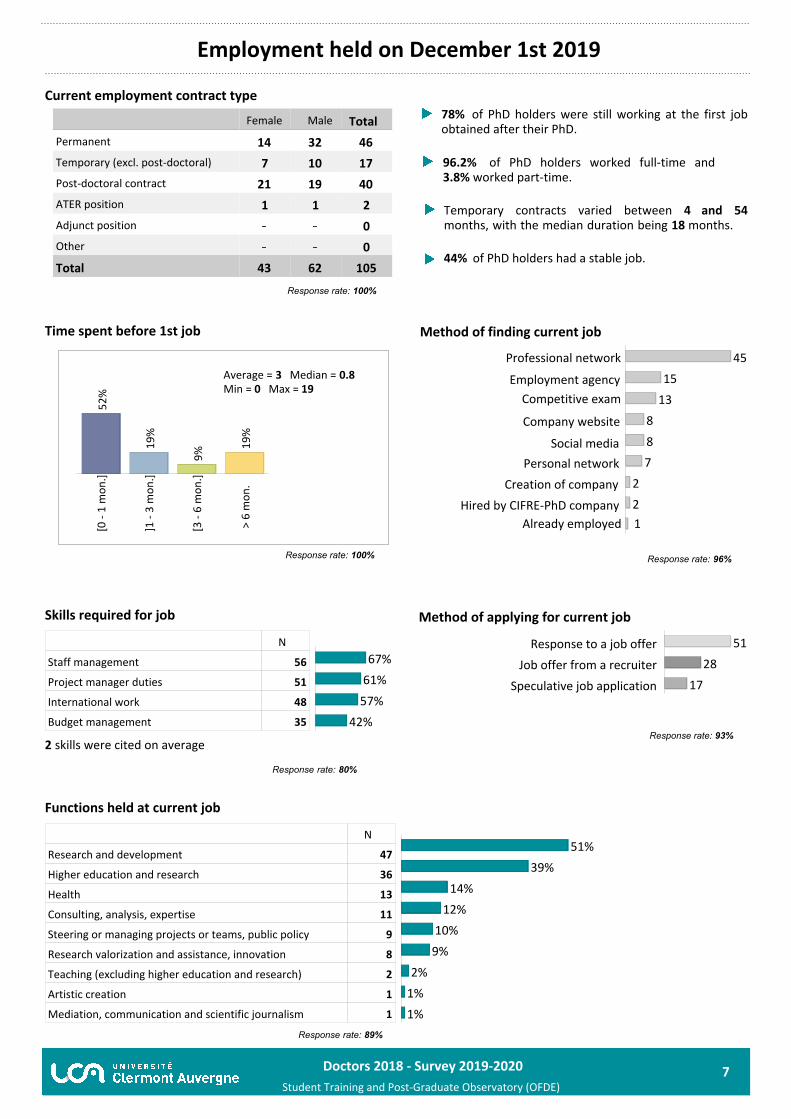
[0 -
1 m
on.]
52%
]1 -
3 m
on.]
19%
[3 -
6 m
on.]
9%
>6
mon
.1
9%
En emploi 2019
Response rate: 96%
En emploi 2019
Method of finding current job
45
15
13
8
8
7
2
2
Professional network
Employment agencyCompetitive exam
Company website
Social mediaPersonal network
Creation of companyHired by CIFRE-PhD company
Already employed 1
Rcal_type_contrat_emploi_actu
En emploi 2019
Response rate: 100%
En emploi 2019
Current employment contract type
Female Male Total
Permanent
Temporary (excl. post-doctoral)
Post-doctoral contract
ATER position
Adjunct position
Other
Total
14 32
7 10
21 19
1 1
46
17
40
2
0
0
43 62 105
Employment held on December 1st 2019
44% of PhD holders had a stable job.
Temporary contracts varied between 4 and 54 months, with the median duration being 18 months.
78% of PhD holders were still working at the first job obtained after their PhD.
En emploi 2019
Average = 3 Median = 0.8Min = 0 Max = 19
Time spent before 1st job
En emploi 2019 hors crea ent
Method of applying for current job
51
28
Response to a job offer Job offer from a recruiter
Speculative job application 17
En emploi 2019 hors crea ent
Response rate: 93%
Skills required for job
N
Staff management 56
Project manager duties 51
International work 48
Budget management 35
67%
61%
57%
42%
Functions held at current job
N
Research and development 47
Higher education and research 36
Health 13
Consulting, analysis, expertise 11
Steering or managing projects or teams, public policy 9
Research valorization and assistance, innovation 8
Teaching (excluding higher education and research) 2
Artistic creation 1
Mediation, communication and scientific journalism 1
51%
39%
14%
12%
10%
9%
2%
1%
1%
96.2% of PhD holders worked full-time and 3.8% worked part-time.
2 skills were cited on average
Doctors 2018 - Survey 2019-2020
Student Training and Post-Graduate Observatory (OFDE)8
En emploi 2019
Response rate: 100%
En emploi 2019
Response rate: 100%
loi 2019
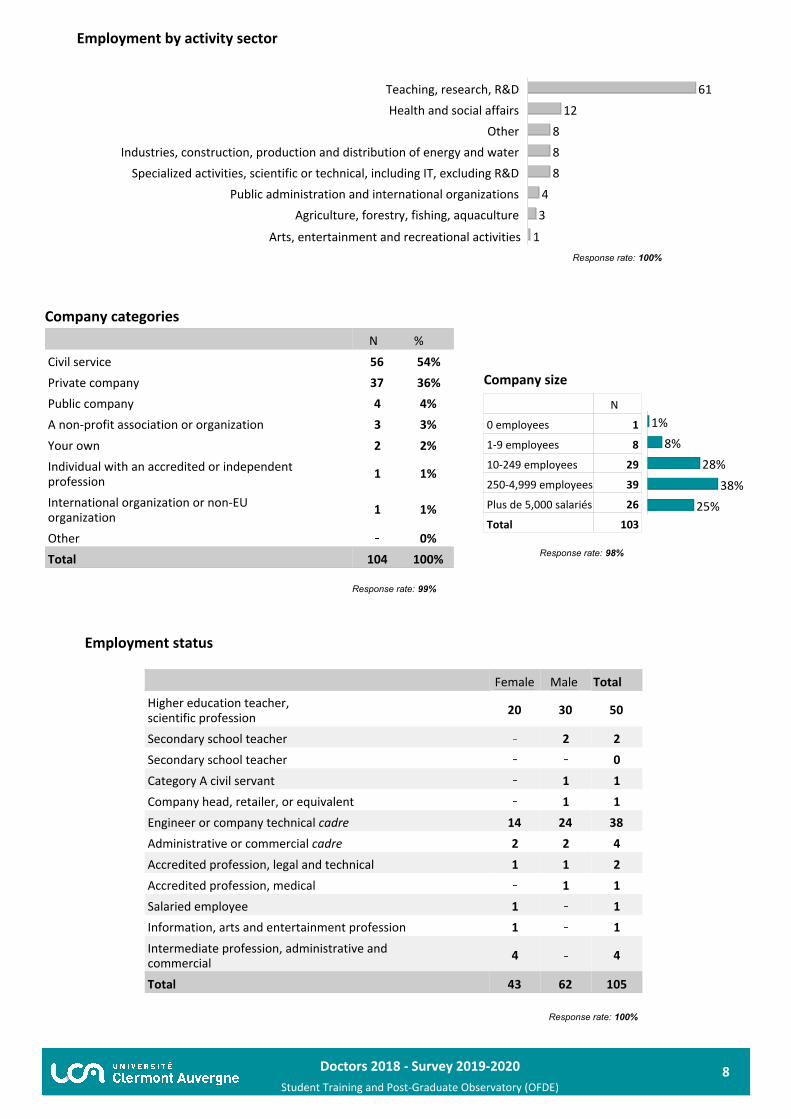
Female Male Total
Higher education teacher, scientific professionSecondary school teacherSecondary school teacherCategory A civil servantCompany head, retailer, or equivalentEngineer or company technical cadreAdministrative or commercial cadreAccredited profession, legal and technicalAccredited profession, medicalSalaried employeeInformation, arts and entertainment professionIntermediate profession, administrative and commercialTotal
20 30
2
1
1
14 24
2 2
1 1
1
1
1
4
50
2
0
1
1
38
4
2
1
1
1
4
43 62 105
En emploi 2019
Response rate: 99%
N %
Civil service 56 54%
Private company 37 36%
Public company 4 4%
A non-profit association or organization 3 3%
Your own 2 2%
Individual with an accredited or independent profession 1 1%
International organization or non-EU organization 1 1%
Other 0%
Total 104 100%
En emploi 2019
61
12
8
8
8
4
3
Teaching, research, R&DHealth and social affairs
OtherIndustries, construction, production and distribution of energy and water
Specialized activities, scientific or technical, including IT, excluding R&D Public administration and international organizations
Agriculture, forestry, fishing, aquaculture
Arts, entertainment and recreational activities 1
Employment by activity sector
Company categoriesEn
Employment status
En emploi 2019
Company size
N
1
8
29
39
26
0 employees
1-9 employees
10-249 employees
250-4,999 employees
Plus de 5,000 salariés
Total 103
1%
8%
28%
38%
25%
En emploi 2019
Response rate: 98%
Doctors 2018 - Survey 2019-2020
Student Training and Post-Graduate Observatory (OFDE)9
En emploi 2019 france
Taux de réponse : 86%
En emploi 2019 salaire
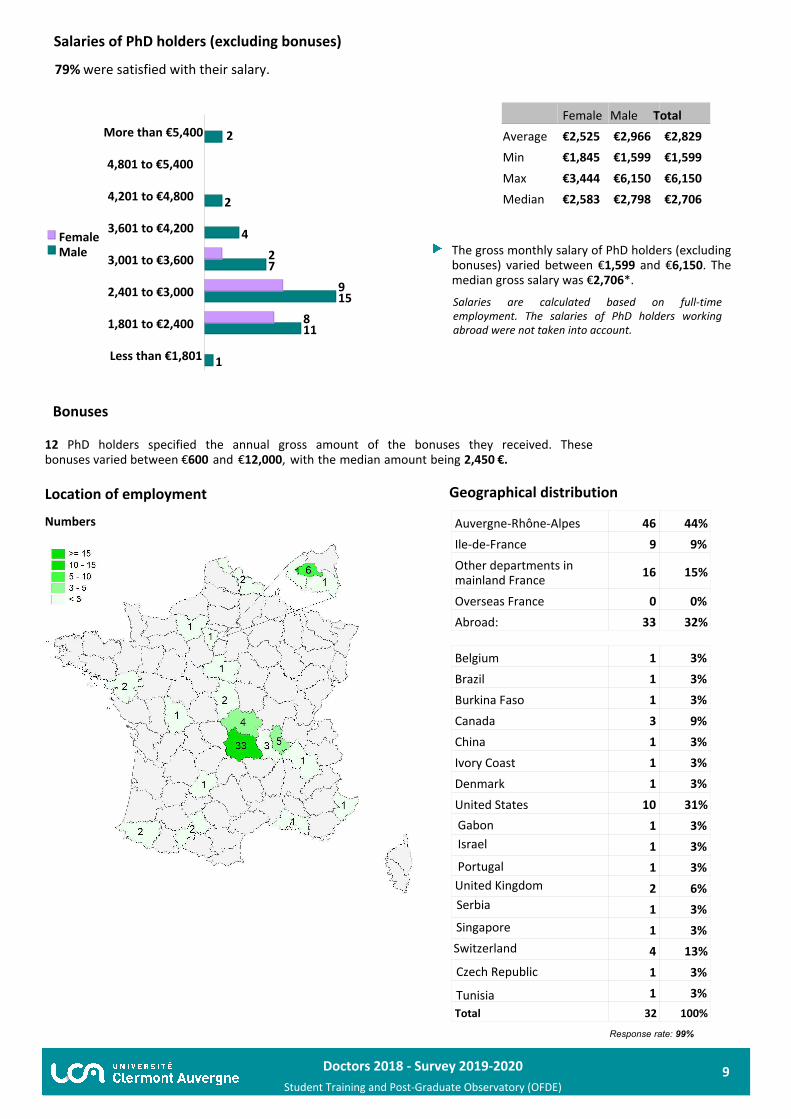
FemaleMale
More than €5,400
4,801 to €5,400 00
4,201 to €4,800 02
3,601 to €4,200 04
3,001 to €3,600 27
2,401 to €3,000 915
1,801 to €2,400 811
Less than €1,801 01
En emploi 2019
Response rate: 99%
Auvergne-Rhône-Alpes 46 44%
Ile-de-France 9 9%
Other departments in mainland France 16 15%
Overseas France 0 0%
Abroad: 33 32%
Geographical distribution Location of employment
Numbers
Bonuses
En emploi 2019 salaire
Rcal_salaire_brut_mensuel
AverageMin
Max
Median
Female Male Total
€2,525
€1,845
€3,444
€2,583
€2,966
€1,599
€6,150
€2,798
€2,829
€1,599
€6,150
€2,706
12 PhD holders specified the annual gross amount of the bonuses they received. These bonuses varied between €600 and €12,000, with the median amount being 2,450 €.
The gross monthly salary of PhD holders (excluding bonuses) varied between €1,599 and €6,150. The median gross salary was €2,706*.
Salaries are calculated based on full-time employment. The salaries of PhD holders working abroad were not taken into account.
En emploi 2019 étranger
1 3%
1 3%
1 3%
3 9%
1 3%
1 3%
1 3%
10 31%
1 3%
1 3%
1 3%
2 6%
1 3%
1 3%
4 13%
1 3%
Belgium BrazilBurkina Faso
Canada
ChinaIvory CoastDenmark United States
Israel
United Kingdom Serbia
Singapore Switzerland
Czech Republic
Tunisia 1 3%
Total 32 100%
Salaries of PhD holders (excluding bonuses)
79% were satisfied with their salary.
2
Portugal
Gabon
Doctors 2018 - Survey 2019-2020
Student Training and Post-Graduate Observatory (OFDE)10
En emploi 2019
Response rate: 100%
En emploi 2019
Femme Homme Total
Chercheur
Ingénieur de recherche
Enseignant chercheur
Ingénieur en recherche et développement
Chargé de recherche
ATER
Chargé d'études
Chargé de mission
Data scientist
Ingénieur hospitalier
PraCticien hospitalier
iste peintre
sistant de recherche
Biologiste méCadical
Chef de projet Fiabilité
Chef de projet industriel
Chef de projet préclinique
Consultant en psychologie
Developpeur informatique
Économiste
Ergonome
Geologist
Gestionnaire de projets
Ingénieur
Ingénieur d'études
Ingénieur en génie civil
Ingénieur géotechnicien
Ingénieur Informatique
Ingénieur robotique
Maître délégué auxiliaire
Notaire stagiaire
Professeur agrégé
Responsable de projet
Responsable pédagogique
Total
16 19
4 8
1 4
1 4
3 1
1 2
1 1
1 1
2
2
1 1
2
1
1
1
1
1
1
1
1
1
1
1
1
1
1
1
1
1
1
1
1
1
1
1
1
1
1
1
1
1
35
12
5
5
4
3
2
2
2
2
2
2
1
1
1
1
1
1
1
1
1
1
1
1
1
1
1
1
1
1
1
1
1
1
1
1
1
1
1
1
1
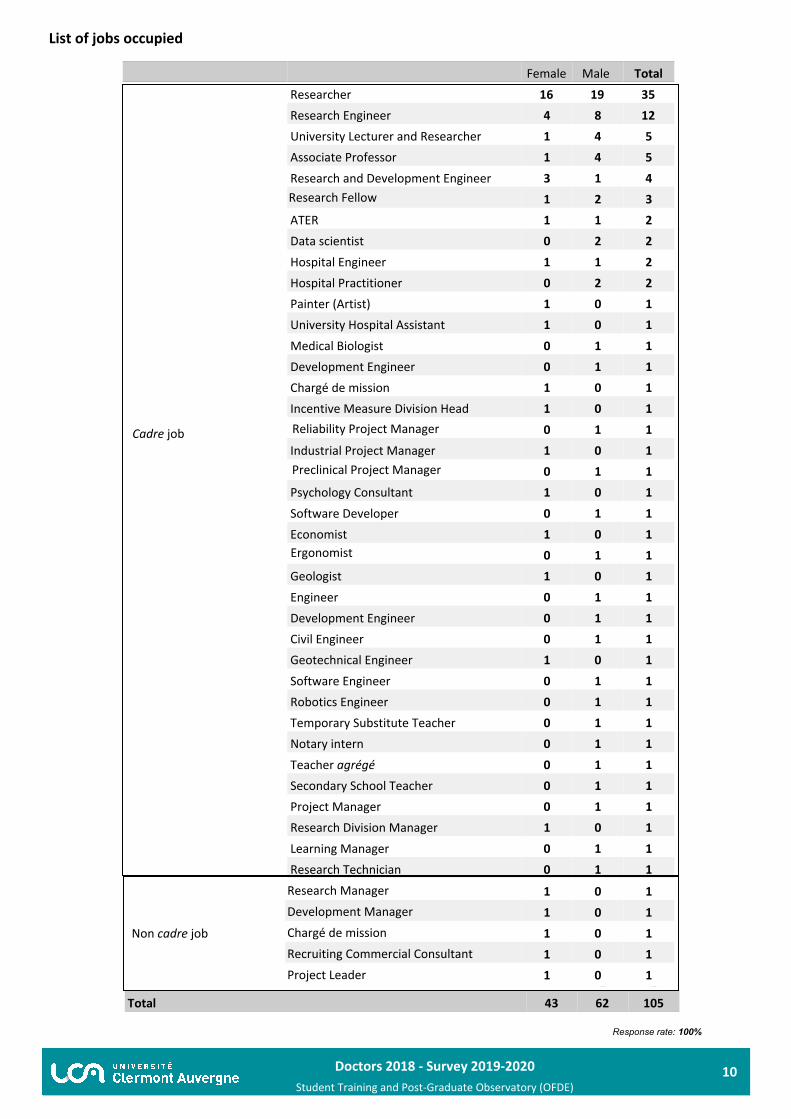
43 62 105
En emploi 2019
Femme Homme Total
Non cadre job
Research Manager Development ManagerChargé de mission
Recruiting Commercial Consultant Project Leader
1 0 1
1 0 1
1 0 1
1 0 1
1 0 1
En emploi 2019
Female Male Total
ResearcherResearch EngineerUniversity Lecturer and ResearcherAssociate ProfessorResearch and Development EngineerResearch Fellow
ATER
Data scientist
Hospital EngineerHospital PractitionerPainter (Artist)University Hospital AssistantMedical BiologistDevelopment EngineerChargé de mission
Incentive Measure Division HeadReliability Project Manager
Industrial Project ManagerPreclinical Project Manager
Psychology ConsultantSoftware DeveloperEconomistErgonomist
Geologist
EngineerDevelopment EngineerCivil EngineerGeotechnical EngineerSoftware EngineerRobotics EngineerTemporary Substitute TeacherNotary internTeacher agrégéSecondary School TeacherProject ManagerResearch Division ManagerLearning ManagerResearch Technician
16 19 35
4 8 12
1 4 5
1 4 5
3 1 4
1 2 3
1 1 2
0 2 2
1 1 2
0 2 2
1 0 1
1 0 1
0 1 1
0 1 1
1 0 1
1 0 1
0 1 1
1 0 1
0 1 1
1 0 1
0 1 1
1 0 1
0 1 1
1 0 1
0 1 1
0 1 1
0 1 1
1 0 1
0 1 1
0 1 1
0 1 1
0 1 1
0 1 1
0 1 1
0 1 1
1 0 1
0 1 1
0 1 1
List of jobs occupied
Cadre job
Doctors 2018 - Survey 2019-2020
Student Training and Post-Graduate Observatory (OFDE)11
En emploi 2019
Response rate: 100%
En emploi 2019
ED LSHSED
SVSAEED
SEJPGED SF ED SPI Total
Chercheur
Ingénieur de recherche
Enseignant chercheur
Maître de conférence des universités
Ingénieur en recherche et développement
Chargé de recherche
ATER
Chargé d'études
Chargé de mission
Data scientist
Ingénieur hospitalier
Praticien hospitalier
Artiste peintre
Assistant de recherche
Assistant hospitalo-universitaire
Biologiste médical
Chef de projet Fiabilité
Chef de projet industriel
Chef de projet préclinique
Consultant en psychologie
Developpeur informatique
Économiste
Ergonome
Geologist
Gestionnaire de projets
Ingénieur
Ingénieur d'études
Ingénieur en génie civil
Ingénieur géotechnicien
Ingénieur Informatique
Ingénieur robotique
Maître délégué auxiliaire
Notaire stagiaire
Professeur agrégé
Responsable de projet
Responsable pédagogique
Technicien en bureau d'étude
Total
4 16 1 8 6
1 4 2 5
1 4
2 1 1 1
2 2
1 1 1
1 1
1 1
2
2
2
2
1
1
1
1
1
1
1
1
1
1
1
1
1
1
1
1
1
1
1
1
1
1
1
1
1
1
1
1
1
35
12
5
5
4
3
2
2
2
2
2
2
1
1
1
1
1
1
1
1
1
1
1
1
1
1
1
1
1
1
1
1
1
1
1
1
1
1
1
1
1
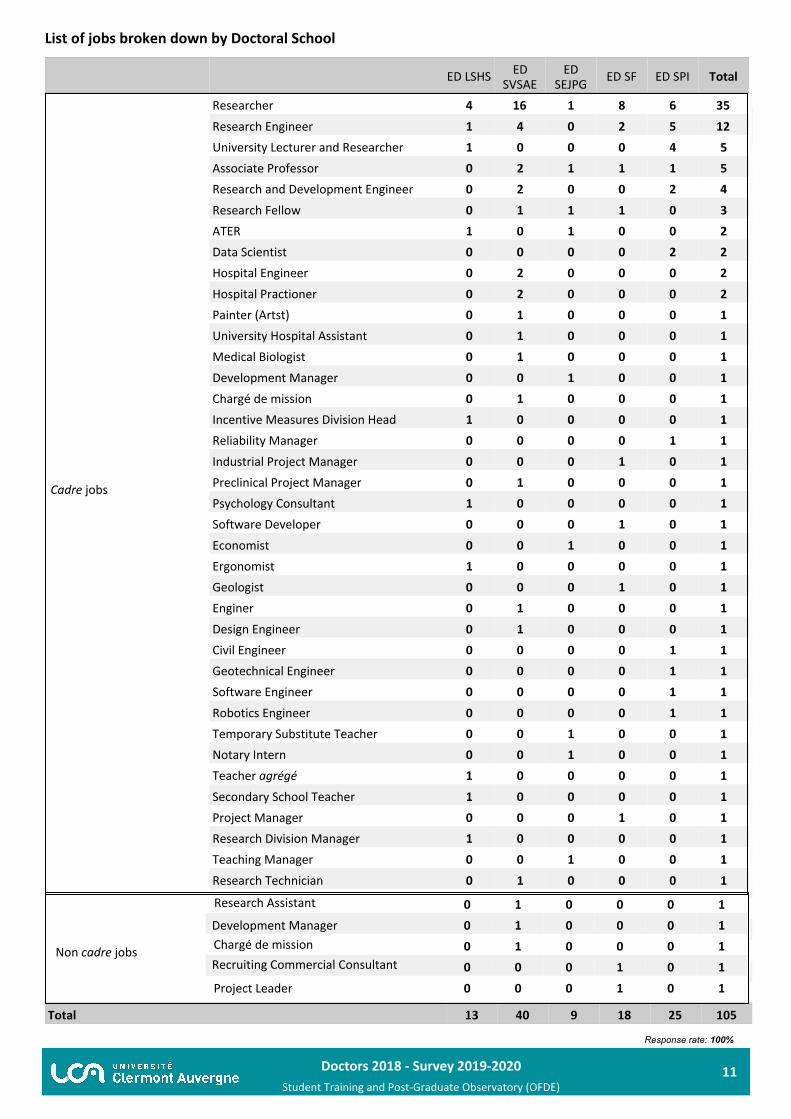
13 40 9 18 25 105
En emploi 2019
ED LSHSED
SVSAEED
SEJPGED SF ED SPI Total
Non cadre jobs
Professeur de l'enseigne
mentA
ssescisotnadnati dree
Research Assistant
Development ManagerR ôle r
Chargé de mission
Recruiting Commercial Consultant
Project Leader
0 1 0 0 0 1
0 1 0 0 0 1
0 1 0 0 0 1
0 0 0 1 0 1
0 0 0 1 0 1
ED LSHSED
SVSAEED
SEJPGED SF ED SPI Total
Cadre jobs
ResearcherResearch EngineerUniversity Lecturer and ResearcherAssociate Professor Research and Development EngineerResearch FellowATER
Data Scientist
Hospital EngineerHospital PractionerPainter (Artst)University Hospital AssistantMedical BiologistDevelopment ManagerChargé de mission
Incentive Measures Division HeadReliability ManagerIndustrial Project ManagerPreclinical Project ManagerPsychology ConsultantSoftware DeveloperEconomistErgonomistGeologist
EnginerDesign EngineerCivil EngineerGeotechnical EngineerSoftware EngineerRobotics EngineerTemporary Substitute TeacherNotary InternTeacher agrégéSecondary School TeacherProject ManagerResearch Division ManagerTeaching ManagerResearch Technician
4 16 1 8 6 35
1 4 0 2 5 12
1 0 0 0 4 5
0 2 1 1 1 5
0 2 0 0 2 4
0 1 1 1 0 3
1 0 1 0 0 2
0 0 0 0 2 2
0 2 0 0 0 2
0 2 0 0 0 2
0 1 0 0 0 1
0 1 0 0 0 1
0 1 0 0 0 1
0 0 1 0 0 1
0 1 0 0 0 1
1 0 0 0 0 1
0 0 0 0 1 1
0 0 0 1 0 1
0 1 0 0 0 1
1 0 0 0 0 1
0 0 0 1 0 1
0 0 1 0 0 1
1 0 0 0 0 1
0 0 0 1 0 1
0 1 0 0 0 1
0 1 0 0 0 1
0 0 0 0 1 1
0 0 0 0 1 1
0 0 0 0 1 1
0 0 0 0 1 1
0 0 1 0 0 1
0 0 1 0 0 1
1 0 0 0 0 1
1 0 0 0 0 1
0 0 0 1 0 1
1 0 0 0 0 1
0 0 1 0 0 1
0 1 0 0 0 1
List of jobs broken down by Doctoral School
Doctors 2018 - Survey 2019-2020
Student Training and Post-Graduate Observatory (OFDE)12
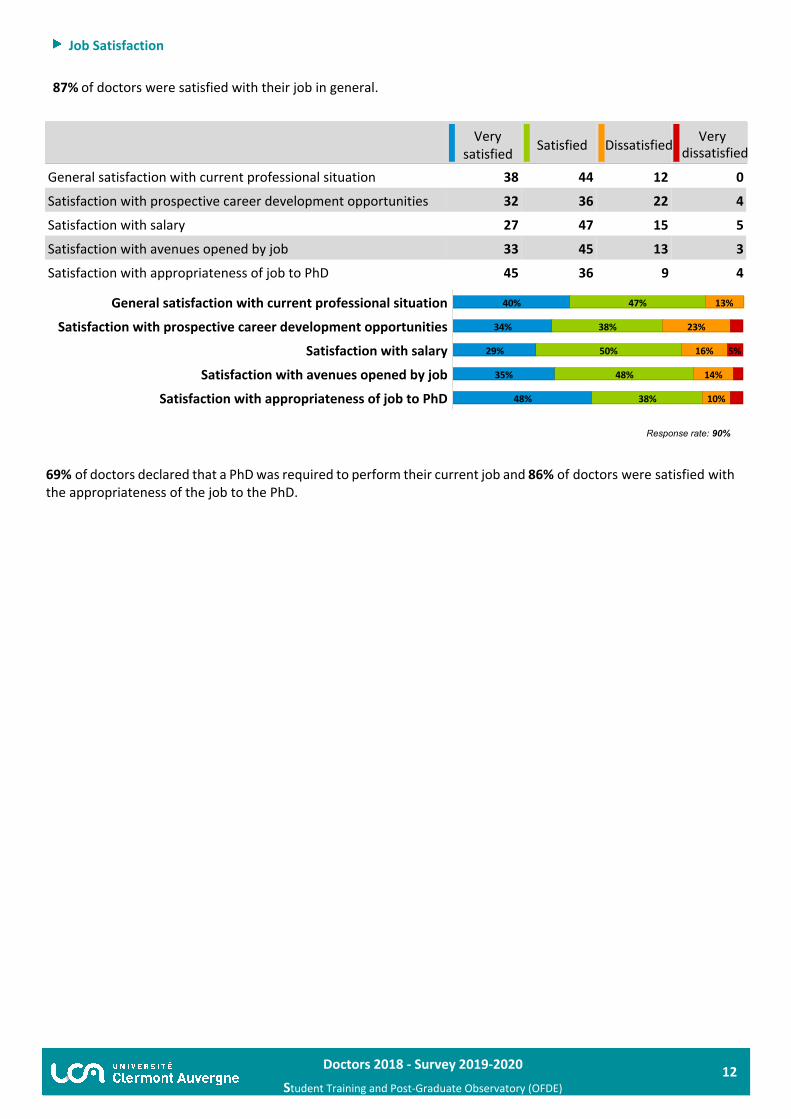
Job Satisfaction
69% of doctors declared that a PhD was required to perform their current job and 86% of doctors were satisfied with the appropriateness of the job to the PhD.
En emploi 2019
Response rate: 90%
87% of doctors were satisfied with their job in general. emploi19
Verysatisfied Satisfied Dissatisfied Very
dissatisfied
General satisfaction with current professional situation
Satisfaction with prospective career development opportunities
Satisfaction with salary
Satisfaction with avenues opened by job
Satisfaction with appropriateness of job to PhD
38 44 12 0
32 36 22 4
27 47 15 5
33 45 13 3
45 36 9 4
48% 38% 10%
35% 48% 14%
29% 50% 16% 5%
34% 38% 23%
40% 47% 13%General satisfaction with current professional situation
Satisfaction with prospective career development opportunities
Satisfaction with salary
Satisfaction with avenues opened by job
Satisfaction with appropriateness of job to PhD
Doctors 2018 - Survey 2019-2020
Student Training and Post-Graduate Observatory (OFDE)13
ATER: Attaché Temporaire d’Enseignement et de Recherche (Temporary teaching and research assistant)
CNU: National Council of Universities to become an associate or full professor
CIFRE: Work placement agreement placing a PhD student in a company Dual-Degree Thesis Program: A dual-degree thesis is a program to promote global engagement for PhD students and to develop scientific collaboration between foreign and French research teams.
Doctoral contract: The doctoral contract is the main type of funding granted to PhD students. The doctoral contract is open to all PhD students who have been enrolled for less than six months in their first year, with no age requirement.
Post-doctoral contract: A post-doctoral contract is a temporary work contract in the public and private research sphere, in France or abroad.
PhD degree: The PhD is the highest degree in higher education, training students for research by conducting research. In this respect, it is considered a professional research experience. It leads to the creation of new knowledge
ED: Doctoral school
ED LSHS: Doctoral School of LITERATURE, HUMAN AND SOCIAL SCIENCES
ED SVSAE: Doctoral School of LIFE, HEALTH, AGRONOMY, AND ENVIRONMENTAL SCIENCES
ED SEJPG: Doctoral School of ECONOMIC, LAW, POLITICAL AND MANAGEMENT SCIENCES
ED SF: Doctoral School of FUNDAMENTAL SCIENCES
ED SPI: Doctoral School of ENGINEERING SCIENCES
MCU: Maitre de Conférence Universitaire (Associate Professor)
GLOSSARY