PUBEX Distribution English - abm-investama.com · Condition 03.-9.5% Revenue 2015-19% Cost 2015 66%...
29
Public Expose PT ABM Investama Tbk
Transcript of PUBEX Distribution English - abm-investama.com · Condition 03.-9.5% Revenue 2015-19% Cost 2015 66%...

Public ExposePT ABM Investama Tbk

This presentation has been prepared by PT ABM Investama Tbk (“ABMM” or the"Company") solely for general information. This presentation is for informationalpurposes only and does not constitute and should not be construed as, an offerto sell or issue, or invitation to purchase or subscribe for or the solicitation of anoffer to buy, acquire or subscribe for, any securities of the Company or any of itssubsidiaries, joint ventures or affiliates in any jurisdiction or an inducement toenter into investment activity. You will be solely responsible for your ownassessment of the market and the market position of the Company and that youwill conduct your own analysis and be solely responsible for forming your ownview of the potential future performance of the Company’s business.
Disclaimer

Financial Data 01.
Operation Performance 02.Economic Condition 03.
-9.5% Revenue 2015
-19% Cost 2015
66% Net Income 2015
15% Coal Production 2015
28% Overburden Removal 2015
-26% Power production 2015
-26% Coal Price 2015
35.000 MW Government Projects
Highlights
2015
PUBEX 2016 - 3

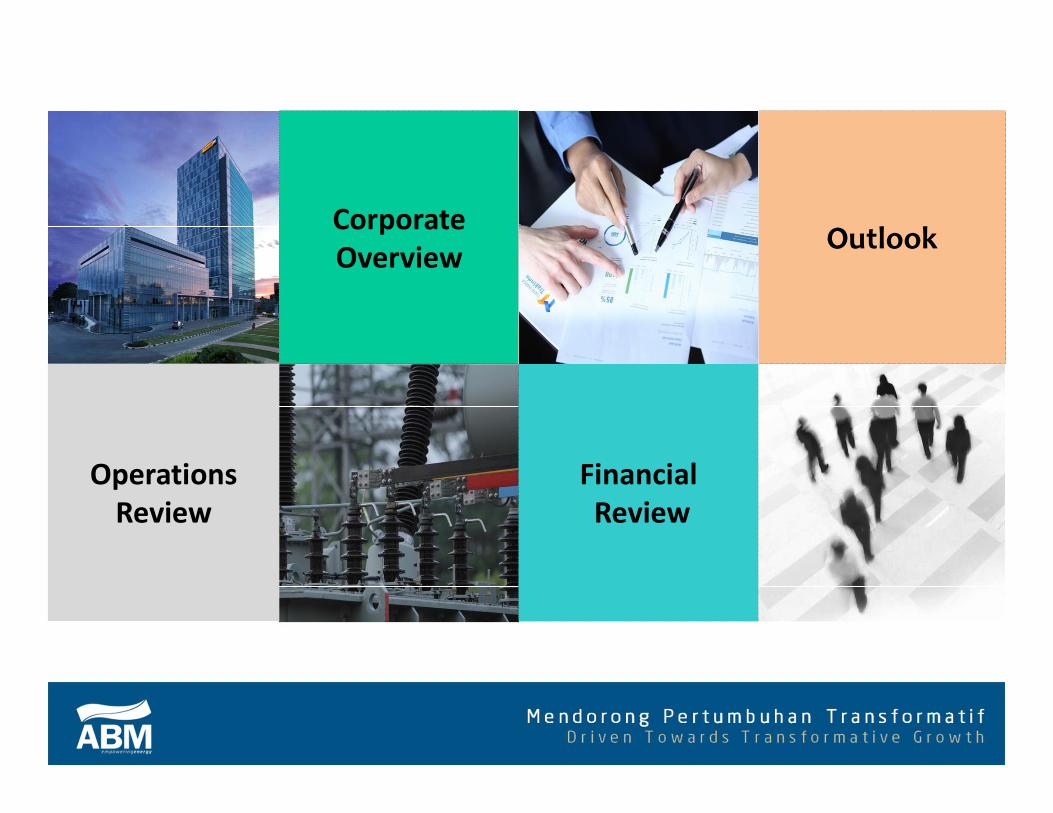
Corporate Overview Outlook
Operations Review
FinancialReview

COALMINING
ABM listed all of its issued shares on the Indonesian Stock Exchangeon December 6, 2011 with “ABMM” as its stock code
ABM currently has five business activities:
ABM at a Glance
PUBEX 2016 - 5
ENGINEERING SERVICES
INTEGRATED LOGISTICS
POWERSOLUTIONS
MININGCONTRACTOR

ABM at a Glance
7.334 number of employees3 branches 2 provinces
11 Mining Projects3 Construction Projects6 Provinces
44 branches 20 Provinces
6 branches
8 Provinces
90 Projects 22 Provinces
PUBEX 2016 - 6
27 Provinces

675heavy equipment
ABM at a Glance
PUBEX 2016 - 7
157 unitTruck
15 unitVessel
3 MineIUPs
1,157 MWelectricity capacity
41 mn KgDelivery of goods
131 mn BCMOverburden Removal
17,5 mntonnes
Coal Getting

Business partnerPT ABM Investama Tbk
PUBEX 2016 - 8

ABM at a Glance: Revenue contribution 2015
CK39%
SSB7%
SS15%
Reswara25%
CKB14%
Revenue Contribution2015
Revenue from coal segment
85%
Revenue from Power segment
15%

ABM Today

1. The world economy experienced a down turn due to low purchasing power in European countries, China and Japan.
2. Impact the decline of commodities including coal
Coal prices
PUBEX 2016 - 11
95.6
128.5
48.5
0.0
60.0
120.0
180.0
Q1'10 Q4'10 Q4'11 Q4'12 Q4'13 Q4'14 Q4'15
Coal (Newcastle)

Fact : 2005-2015China Economic Growth
0.0%
5.0%
10.0%
15.0%
China's GDP
1. China consumes nearly 50% of the coal worldwide.
2. The demand of imported coal in China dropped by almost a quarter in 2014, as China's economic growth declined
3. Coal is still being the energy-option, as the price is relatively low-cost.
PUBEX 2016 - 12

Corporate Overview
Outlook
Operations Review
FinancialReview

Revenue, EBITDA, Profit (Loss)2014 vs. 2015
723.6
654.6
0
150
300
450
600
750
2014 2015
RUPST 2016 - 14
Revenue(In USD mn)
107.5134.8
-10
40
90
140
2014 2015
EBITDA(In USD mn)
Profit (Loss)(In USD mn)
-112.9
-38.1-140-100-60-20
2014 2015

Assets, Liabilities and Equity2014 vs. 2015
1,132.7 1,189.8
-
150.0
300.0
450.0
600.0
750.0
900.0
1,050.0
1,200.0
2014 2015
203.5
173.6
150
180
210
2014 2015
929.2
1016.3
0
150
300
450
600
750
900
1050
1200
2014 2015
PUBEX 2016 - 15
Assets(In USD mn)
Liabilities(In USD mn)
Equity(In USD mn)

Cash flow2014 vs. 2015
111.9
189.9
0
20
40
60
80
100
120
140
160
180
200
2014 2015
91.4
131.2
0
20
40
60
80
100
120
140
2014 2015
4.3
45.2
0
20
40
60
2014 2015
PUBEX 2016 - 16
Cash Flow From Operating(In USD mn)
Cash Flow for Investing(In USD mn)
Cash Flow For Financing(In USD mn)
Corporate Overview Outlook
Operations Review
FinancialReview
OPERATIONAL REVIEW
Coal Mining

Coal Production Volumegroup Reswara(mn tonnes)
Coal Performance
5.9
6.8
0
1
2
3
4
5
6
7
2014 2015
Overburden Removal(mn BCM)
Coal Getting(mn tonnes)
100.0
118.0
130.0
89.2
102.5
131.1
-
20.0
40.0
60.0
80.0
100.0
120.0
140.0
2010 2011 2012 2013 2014 2015
8.3
10.6 11.9 12.4
15.2
17.5
-
2.0
4.0
6.0
8.0
10.0
12.0
14.0
16.0
18.0
20.0
2010 2011 2012 2013 2014 2015
PUBEX 2016 - 19

OPERATIONAL REVIEW
Power Solutions

Power Performance
Average Rental Price(IDR/kWh)
5,019
3,680
-
1,000
2,000
3,000
4,000
5,000
6,000
2014 2015
291
344
260
270
280
290
300
310
320
330
340
350
2014 2015
Electricity production(bn kWh)
PUBEX 2016 - 21

Corporate Overview Outlook
Operations Review
FinancialReview
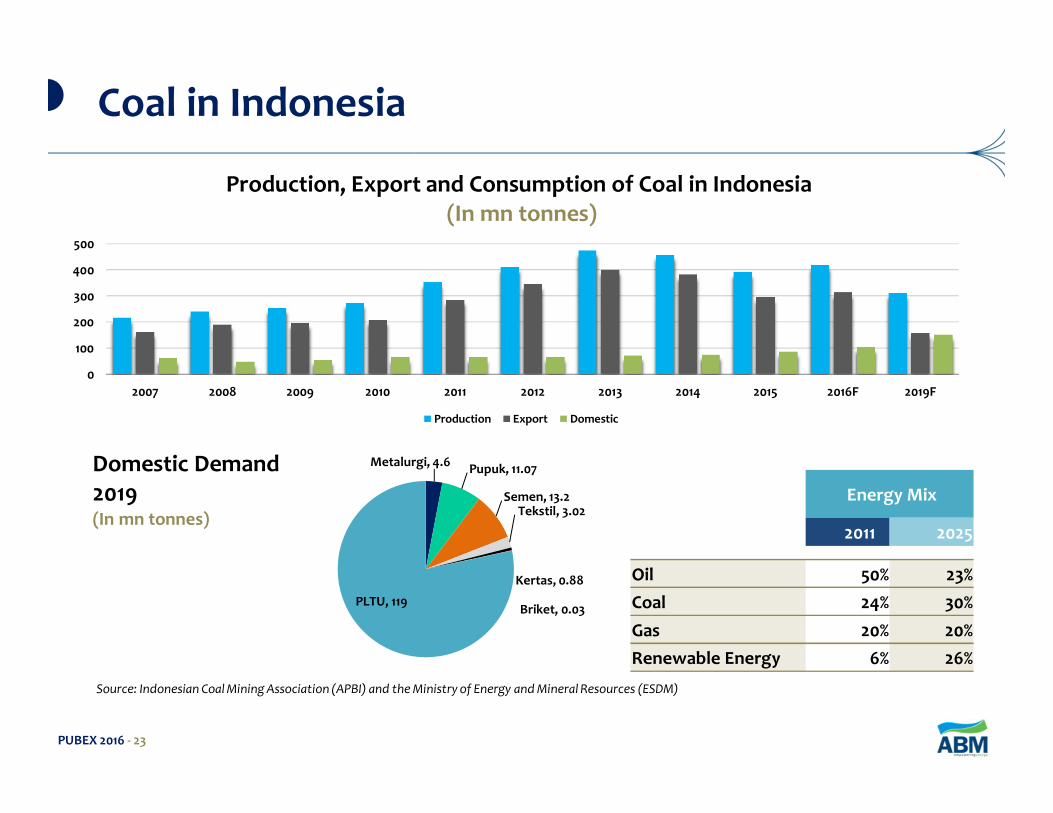
Energy Mix
2011 2025
Oil 50% 23%Coal 24% 30%Gas 20% 20%Renewable Energy 6% 26%
Metalurgi, 4.6 Pupuk, 11.07
Semen, 13.2Tekstil, 3.02
Kertas, 0.88
Briket, 0.03PLTU, 119
Domestic Demand 2019(In mn tonnes)
Coal in Indonesia
PUBEX 2016 - 23
Source: Indonesian Coal Mining Association (APBI) and the Ministry of Energy and Mineral Resources (ESDM)
0
100
200
300
400
500
2007 2008 2009 2010 2011 2012 2013 2014 2015 2016F 2019F
Production, Export and Consumption of Coal in Indonesia(In mn tonnes)
Production Export Domestic

Increase Demand for Coal
0
200
400
600
2015 2016 2017 2018 2019 2020 2021 2022 2023 2024
Other Diesel Gas Coal
Electricity generation by fuel source(in TWh)
Sumber: Rencana Usaha Penyediaan Tenaga Listrik (RUPTL) 2015
PUBEX 2016 - 24

Coal News
“Stok Batu Bara Tak Mencukupi PembangkitListrik 20 GW”Kejatuhan harga batu bara memaksa sebagian perusahaantambang memangkas produksinya
“Batubara Diprediksi Akan Habis 2033, Proyek35 GW Terancam”
PUBEX 2016 - 25
Coal& Minerals Asia Magazine
“Insecure Coal Supply for Power Plant Projects”
“Proyek listrik 35 GW akan meningkatkanpenyerapan batubara didalam negeri”

Pursue operational excellent and transforming into a leading energy Company that manages a diversified and balanced business portfolio for the long term value creation
ABM 2020 : Balanced Business Portfolio
PUBEX 2016 - 26
depan, dengan bertransformasi menjadi
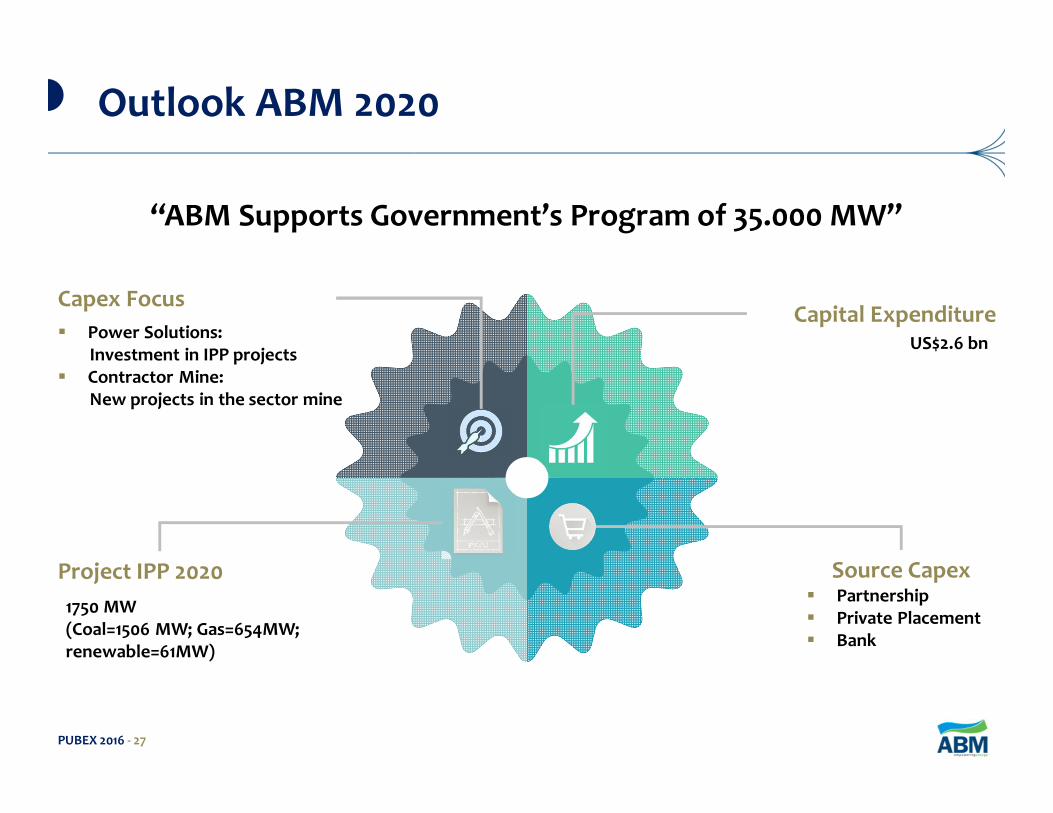
Outlook ABM 2020
Capital Expenditure
Source Capex§ Partnership§ Private Placement§ Bank
Capex Focus§ Power Solutions:
Investment in IPP projects§ Contractor Mine:
New projects in the sector mine
Project IPP 20201750 MW(Coal=1506 MW; Gas=654MW; renewable=61MW)
“ABM Supports Government’s Program of 35.000 MW”
US$2.6 bn
PUBEX 2016 - 27

Thank You

48.5
42.439.1
37.1
29.8
39.236.4
32.7
28.8
24.3
0.0
10.0
20.0
30.0
40.0
50.0
60.0
2011 2012 2013 2014 2015
TIA 2011 -2015
ASP
Cash Cost
TIA Operations
PUBEX 2016 - 29