Pt(II) complex of Schiff base derived from L-phenylalanine ...
17
Comptes Rendus Chimie Özlen Altun and Melike Özge Koçer Pt(II) complex of Schiff base derived from L-phenylalanine and furfuraldehyde in the presence of 8-hydroxyquinoline: Structural analysis, composition of complex and biological activity Volume 23, issue 2 (2020), p. 127-142. <https://doi.org/10.5802/crchim.9> © Académie des sciences, Paris and the authors, 2020. Some rights reserved. This article is licensed under the CREATIVE COMMONS ATTRIBUTION 4.0 I NTERNATIONAL LICENSE. http://creativecommons.org/licenses/by/4.0/ Les Comptes Rendus. Chimie sont membres du Centre Mersenne pour l’édition scientifique ouverte www.centre-mersenne.org
Transcript of Pt(II) complex of Schiff base derived from L-phenylalanine ...
Comptes Rendus
Chimie
Özlen Altun and Melike Özge KoçerPt(II) complex of Schiff base derived from L-phenylalanine andfurfuraldehyde in the presence of 8-hydroxyquinoline: Structuralanalysis, composition of complex and biological activityVolume 23, issue 2 (2020), p. 127-142.
<https://doi.org/10.5802/crchim.9>
© Académie des sciences, Paris and the authors, 2020.Some rights reserved.
This article is licensed under theCREATIVE COMMONS ATTRIBUTION 4.0 INTERNATIONAL LICENSE.http://creativecommons.org/licenses/by/4.0/
Les Comptes Rendus. Chimie sont membres duCentre Mersenne pour l’édition scientifique ouverte
www.centre-mersenne.org
Comptes RendusChimie2020, 23, n 2, p. 127-142https://doi.org/10.5802/crchim.9
Full paper / Mémoire
Pt(II) complex of Schiff base derived from
L-phenylalanine and furfuraldehyde in the
presence of 8-hydroxyquinoline: Structural
analysis, composition of complex and
biological activity
Özlen Altun∗, a andMelike Özge Koçera
a Trakya University, Department of General and Inorganic Chemistry,22030 Edirne/TURKEY.
E-mails: [email protected] (Ö. Altun), [email protected](M. O. Koçer).
Abstract. In the present study, we synthesized a Schiff base (L1) derived from L-phenylalaninewith furfuraldehyde and its Pt(II) complex ([Pt(L1)(L2)]: [Pt(N-(furfuralidene)phenylalanine)(8-hydroxyquinoline)]) in the presence of 8-hydroxyquinoline (L2). The chemical structures of the syn-thesized Schiff base and Pt(II) complex were characterized using ESI-MS, UV–Visible, FT-IR, 1H NMR,13C NMR, and powder-XRD spectroscopy. The surface morphologies and elemental compositionwere determined by SEM and EDX. Thermal analysis was performed with TG-DTA. Mole ratio ofMeyer and Job methods were used for the composition of complexes. According to these methods,the ratio [Pt2+] : [L1 +L2] was found to be 1 : 1. In addition, the antimicrobial activities of L1 and thecomplex showed that the compounds have significant antibacterial and antifungal properties. Theyalso show important cytotoxic effects against the growth of mouse embryo fibroblasts (MEF) andhuman prostate adenocarcinoma (Du145) cancer cells. L1, L2, and the Pt(II) complex also displayedeffective antioxidant activity.
Keywords. Synthesis, Spectral Characterization, Antimicrobial Activity, Cytotoxic Activity, AntioxidantActivity.
Manuscript received 3rd October 2019, revised 19th November 2019, accepted 22nd November 2019.
∗Corresponding author.
ISSN (electronic) : 1878-1543 https://comptes-rendus.academie-sciences.fr/chimie/
128 Özlen Altun and Melike Özge Koçer
1. Introduction
Schiff bases are an important class of ligandsthat help to elucidate the mechanisms of variousreactions in biological and chemical systems dueto the presence of an imine group in their struc-tures. Schiff bases have a significant role in coor-dination chemistry since they easily form stablecomplexes with most of the transition metal ions.Schiff bases containing nitrogen and oxygen donoratoms can be obtained by the condensation ofvarious aldehydes and amines. Due to their struc-tural and functional properties, Schiff bases derivedfrom aldehydes and amino acids with transitionmetal ions have various applications in chemical,biological, and medical fields [1–5]. These com-pounds also have antimicrobial and antifungal ac-tivities against certain bacteria and fungal strains,respectively [6–9].
Metal complexes of Schiff bases derived fromamino acids play a significant role in the inves-tigation of DNA-binding and bovine serum albu-min (BSA)-binding properties. DNA-binding metalcomplexes have been extensively investigated aspotential anticancer drugs, DNA-dependent elec-tron transfer, DNA structural and conformationalprobes [10]. Apart from DNA, many other proteinssuch as serum albumins, which are the most abun-dant proteins in the blood, are also extensively im-portant in the accumulation and transportation ofvarious drug molecules [11]. BSA is generally selectedas a target protein due to its low cost and similarity tohuman serum albumin (HSA) [12]. Previously, DNAand BSA-binding properties of metal-based Schiffbase complexes were investigated by Wei’s [13–15]and Guo’s groups [16–18]. For example, two hexa-coordinated octahedral nickel (II) complexes [14] ofSchiff bases derived from o-vanillin/salicylaldehydewith glutamine and an Ni(II) complex [15] of Schiffbase of o-vanillin and l-methionine in the presenceof 1,10-phenanthroline were synthesized and char-acterized. The DNA-binding properties of Ni(II) com-plexes and the interactions of the nickel (II) com-plexes with BSA were studied by using spectroscopicanalysis. In another study, vanadium complexes ofSchiff bases derived from o-vanillin/L-valine [17]and L-serine/2-hydroxy-1-naphthaldehyde in thepresence of 1,10-phenanthroline [18] were synthe-
sized and the binding properties studied. The resultsshowed that the complexes can intercalate into calfthymus DNA (CT-DNA) and quench the intrinsic flu-orescence of BSA in a static quenching process andcause conformational changes of BSA by binding tothe BSA.
There are many methods which characterizeSchiff bases derived from amino acids and aldehy-des in the presence of various metals [19–23]. ThePt(II) complexes were found to act as active homo-geneous catalysts in hydrogenation reactions [24],oxidative hydrolysis [25,26] of olefins, and activa-tion of alkanes [27]. Since the platinum ions havethe ability to form complexes, they bind to aminoacids. Although there are many reports of transi-tion metal complexes of Schiff bases derived fromamino acids, information about the correspondingplatinum(II) derivatives is still limited [28]. For thesereasons, in this study, a Pt(II) complex [Pt(L1)(L2)]was synthesized using a Schiff base (L1) derived fromL-phenylalanine with furfuraldehyde in the presenceof 8-hydroxyquinoline. The structure of the complexwas investigated by Electrospray ionization massspectrometry (ESI-MS), UV–Visible spectroscopy,Fourier transform infrared spectroscopy (FT-IR),1H nuclear magnetic resonance (NMR), 13C NMR,powder-X-ray diffraction (XRD), scanning electronmicroscopy (SEM), energy-dispersive X-Ray anal-ysis (EDX) and thermogravimetric and differentialthermal analysis (TG-DTA). As a result of physico-chemical, spectral, and thermal analyses, it wasfound that one molecule of L1 and one molecule ofL2 react with one Pt2+ ion. The Schiff base and thecomplex were examined for antibacterial activitiesagainst Escherichia coli ATCC 25922, Salmonellathyphimirium ATCC 14028, Listeria monocytogenesATCC19115, gram positive Staphylococcus aureusATCC 25923, Bacillus cereus ATTCC 11778 and an-tifungal activity against Candida albicans ATCC1023. These results are compared with the antibi-otic ampicillin and the antifungal amphotericin B.The Schiff base and the Pt(II) complex were alsoinvestigated for cytotoxic activity against mouse em-bryo fibroblasts (MEF ATCC®SCRC-1008™) and hu-man prostate adenocarcinoma (Du145 ATCC®HTB-81™) cells. In addition, antioxidant activitieswere determined for the obtained Schiff base andcomplex.
C. R. Chimie, 2020, 23, n 2, 127-142
Özlen Altun and Melike Özge Koçer 129
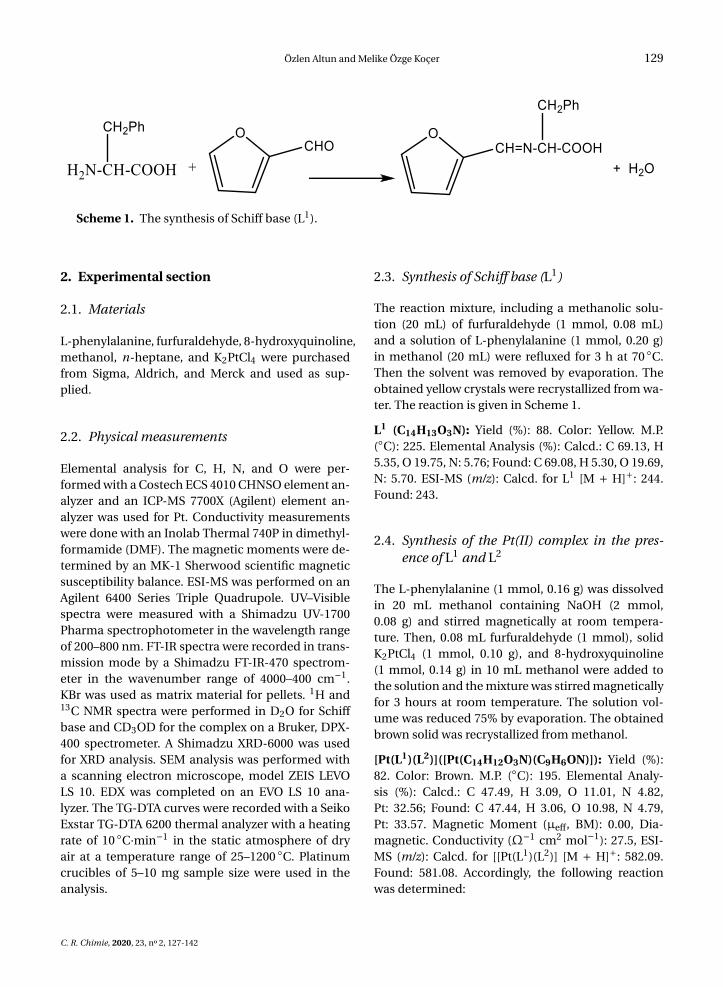
Scheme 1. The synthesis of Schiff base (L1).
2. Experimental section
2.1. Materials
L-phenylalanine, furfuraldehyde, 8-hydroxyquinoline,methanol, n-heptane, and K2PtCl4 were purchasedfrom Sigma, Aldrich, and Merck and used as sup-plied.
2.2. Physical measurements
Elemental analysis for C, H, N, and O were per-formed with a Costech ECS 4010 CHNSO element an-alyzer and an ICP-MS 7700X (Agilent) element an-alyzer was used for Pt. Conductivity measurementswere done with an Inolab Thermal 740P in dimethyl-formamide (DMF). The magnetic moments were de-termined by an MK-1 Sherwood scientific magneticsusceptibility balance. ESI-MS was performed on anAgilent 6400 Series Triple Quadrupole. UV–Visiblespectra were measured with a Shimadzu UV-1700Pharma spectrophotometer in the wavelength rangeof 200–800 nm. FT-IR spectra were recorded in trans-mission mode by a Shimadzu FT-IR-470 spectrom-eter in the wavenumber range of 4000–400 cm−1.KBr was used as matrix material for pellets. 1H and13C NMR spectra were performed in D2O for Schiffbase and CD3OD for the complex on a Bruker, DPX-400 spectrometer. A Shimadzu XRD-6000 was usedfor XRD analysis. SEM analysis was performed witha scanning electron microscope, model ZEIS LEVOLS 10. EDX was completed on an EVO LS 10 ana-lyzer. The TG-DTA curves were recorded with a SeikoExstar TG-DTA 6200 thermal analyzer with a heatingrate of 10 C·min−1 in the static atmosphere of dryair at a temperature range of 25–1200 C. Platinumcrucibles of 5–10 mg sample size were used in theanalysis.
2.3. Synthesis of Schiff base (L1)
The reaction mixture, including a methanolic solu-tion (20 mL) of furfuraldehyde (1 mmol, 0.08 mL)and a solution of L-phenylalanine (1 mmol, 0.20 g)in methanol (20 mL) were refluxed for 3 h at 70 C.Then the solvent was removed by evaporation. Theobtained yellow crystals were recrystallized from wa-ter. The reaction is given in Scheme 1.
L1 (C14H13O3N): Yield (%): 88. Color: Yellow. M.P.(C): 225. Elemental Analysis (%): Calcd.: C 69.13, H5.35, O 19.75, N: 5.76; Found: C 69.08, H 5.30, O 19.69,N: 5.70. ESI-MS (m/z): Calcd. for L1 [M + H]+: 244.Found: 243.
2.4. Synthesis of the Pt(II) complex in the pres-ence of L1 and L2
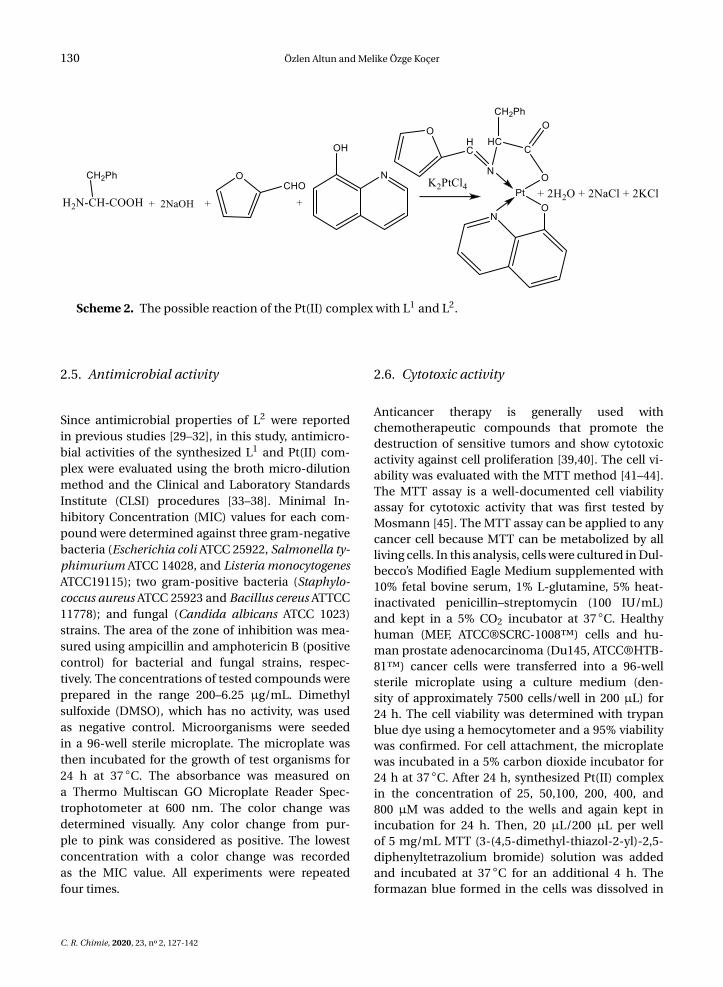
The L-phenylalanine (1 mmol, 0.16 g) was dissolvedin 20 mL methanol containing NaOH (2 mmol,0.08 g) and stirred magnetically at room tempera-ture. Then, 0.08 mL furfuraldehyde (1 mmol), solidK2PtCl4 (1 mmol, 0.10 g), and 8-hydroxyquinoline(1 mmol, 0.14 g) in 10 mL methanol were added tothe solution and the mixture was stirred magneticallyfor 3 hours at room temperature. The solution vol-ume was reduced 75% by evaporation. The obtainedbrown solid was recrystallized from methanol.
[Pt(L1)(L2)]([Pt(C14H12O3N)(C9H6ON)]): Yield (%):82. Color: Brown. M.P. (C): 195. Elemental Analy-sis (%): Calcd.: C 47.49, H 3.09, O 11.01, N 4.82,Pt: 32.56; Found: C 47.44, H 3.06, O 10.98, N 4.79,Pt: 33.57. Magnetic Moment (µeff, BM): 0.00, Dia-magnetic. Conductivity (Ω−1 cm2 mol−1): 27.5, ESI-MS (m/z): Calcd. for [[Pt(L1)(L2)] [M + H]+: 582.09.Found: 581.08. Accordingly, the following reactionwas determined:
C. R. Chimie, 2020, 23, n 2, 127-142
130 Özlen Altun and Melike Özge Koçer
Scheme 2. The possible reaction of the Pt(II) complex with L1 and L2.
2.5. Antimicrobial activity
Since antimicrobial properties of L2 were reportedin previous studies [29–32], in this study, antimicro-bial activities of the synthesized L1 and Pt(II) com-plex were evaluated using the broth micro-dilutionmethod and the Clinical and Laboratory StandardsInstitute (CLSI) procedures [33–38]. Minimal In-hibitory Concentration (MIC) values for each com-pound were determined against three gram-negativebacteria (Escherichia coli ATCC 25922, Salmonella ty-phimurium ATCC 14028, and Listeria monocytogenesATCC19115); two gram-positive bacteria (Staphylo-coccus aureus ATCC 25923 and Bacillus cereus ATTCC11778); and fungal (Candida albicans ATCC 1023)strains. The area of the zone of inhibition was mea-sured using ampicillin and amphotericin B (positivecontrol) for bacterial and fungal strains, respec-tively. The concentrations of tested compounds wereprepared in the range 200–6.25 µg/mL. Dimethylsulfoxide (DMSO), which has no activity, was usedas negative control. Microorganisms were seededin a 96-well sterile microplate. The microplate wasthen incubated for the growth of test organisms for24 h at 37 C. The absorbance was measured ona Thermo Multiscan GO Microplate Reader Spec-trophotometer at 600 nm. The color change wasdetermined visually. Any color change from pur-ple to pink was considered as positive. The lowestconcentration with a color change was recordedas the MIC value. All experiments were repeatedfour times.
2.6. Cytotoxic activity
Anticancer therapy is generally used withchemotherapeutic compounds that promote thedestruction of sensitive tumors and show cytotoxicactivity against cell proliferation [39,40]. The cell vi-ability was evaluated with the MTT method [41–44].The MTT assay is a well-documented cell viabilityassay for cytotoxic activity that was first tested byMosmann [45]. The MTT assay can be applied to anycancer cell because MTT can be metabolized by allliving cells. In this analysis, cells were cultured in Dul-becco’s Modified Eagle Medium supplemented with10% fetal bovine serum, 1% L-glutamine, 5% heat-inactivated penicillin–streptomycin (100 IU/mL)and kept in a 5% CO2 incubator at 37 C. Healthyhuman (MEF, ATCC®SCRC-1008™) cells and hu-man prostate adenocarcinoma (Du145, ATCC®HTB-81™) cancer cells were transferred into a 96-wellsterile microplate using a culture medium (den-sity of approximately 7500 cells/well in 200 µL) for24 h. The cell viability was determined with trypanblue dye using a hemocytometer and a 95% viabilitywas confirmed. For cell attachment, the microplatewas incubated in a 5% carbon dioxide incubator for24 h at 37 C. After 24 h, synthesized Pt(II) complexin the concentration of 25, 50,100, 200, 400, and800 µM was added to the wells and again kept inincubation for 24 h. Then, 20 µL/200 µL per wellof 5 mg/mL MTT (3-(4,5-dimethyl-thiazol-2-yl)-2,5-diphenyltetrazolium bromide) solution was addedand incubated at 37 C for an additional 4 h. Theformazan blue formed in the cells was dissolved in
C. R. Chimie, 2020, 23, n 2, 127-142
Özlen Altun and Melike Özge Koçer 131
DMF (200 µL/well). The optical density (OD) wasmeasured on a Thermo Multiscan GO MicroplateReader Spectrophotometer at 490 nm. The measuredabsorbance value for each concentration of the Pt(II)complex was compared to the DMF-treated control.The IC50 values were evaluated. All experiments wereperformed six times. Growth inhibition percentagewas calculated with the following formula [46]:
Growth inhibition % = OD control−OD treated sample
OD control×100
(1)
2.7. Antioxidant activity
The stable DPPH (2,2-Diphenyl-1-picrylhydrazyl)radical scavenging assay is a widely used method toevaluate antioxidant activities, as it is a simple andrapid method compared to others [47–52]. Differentconcentrations of the free ligands and Pt(II) complexwere dissolved by serial dilution in methanol to attainfinal concentrations ranging from 1 to 5 µg/mL. Theprepared solutions were added to a sterile 96-wellmicroplate. BHT (2,6-di-tert-butyl-4-methylphenol)was used at a concentration range of 1–5 µg/mL inmethanol as positive control. Methanol was chosenfor blanks. After 1 h of incubation in the dark, the ab-sorbance (A) was recorded against a blank at 517 nmon a Tecan-PC infinite M200 Pro Plate reader and IC50 (50% inhibition of DPPH color) values were calcu-lated. Experiments were duplicated. DPPH inhibitionpercentage (Antioxidant Activity %) was calculatedusing the following formula:
Antioxidant % = Ablank − Asample
Ablank×100, (2)
where Ablank is the absorbance of the blank andAsample is the absorbance of sample.
3. Results and discussion
Elemental analysis for C, H, N, and O is in accordancewith the proposed general formula of L1 and the Pt(II)complex. In order to determine the molar conduc-tivity, the complex was dissolved in DMF 10−3 M at25 C. The molar conductivity Λ of the complex wascalculated using the following formula:
Λm = K
C, (3)
where K is the measured conductivity (specific con-ductance) and C is the molar concentration of the
complex solution. The molar conductivity valuefor this complex was 27.5 Ω−1·cm2·mol−1. There-fore, this complex can be considered as a non-electrolyte [53,54]. The magnetic moment of thecomplex was determined to be µeff = 0.00 BM: thecomplex is diamagnetic, in a low-spin state and withsquare-planar geometry.
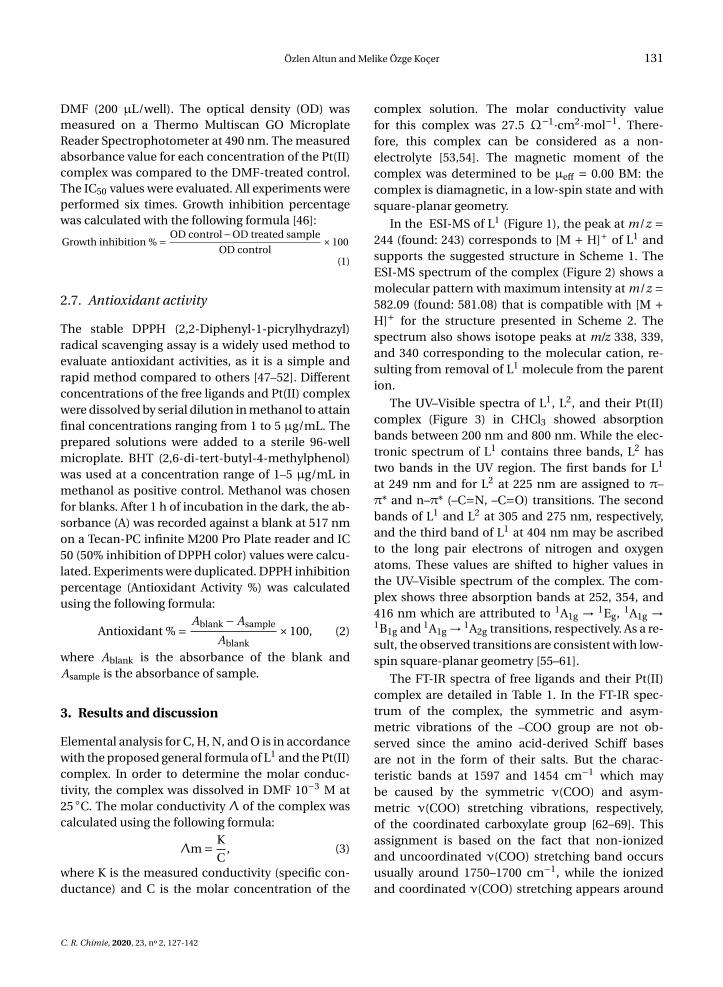
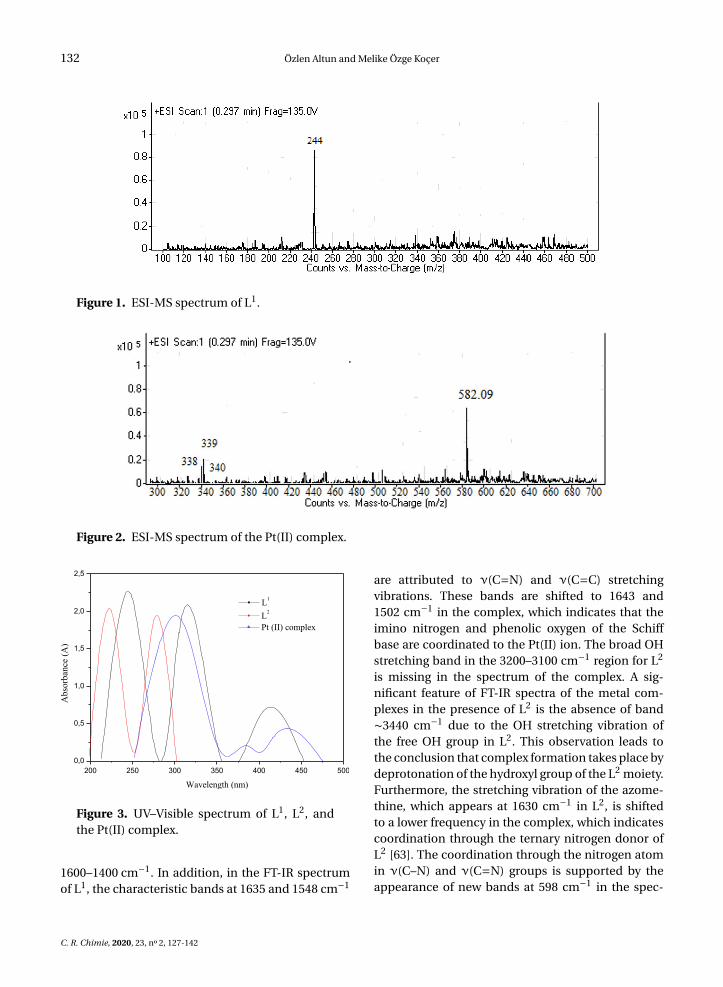
In the ESI-MS of L1 (Figure 1), the peak at m/z =244 (found: 243) corresponds to [M + H]+ of L1 andsupports the suggested structure in Scheme 1. TheESI-MS spectrum of the complex (Figure 2) shows amolecular pattern with maximum intensity at m/z =582.09 (found: 581.08) that is compatible with [M +H]+ for the structure presented in Scheme 2. Thespectrum also shows isotope peaks at m/z 338, 339,and 340 corresponding to the molecular cation, re-sulting from removal of L1 molecule from the parention.
The UV–Visible spectra of L1, L2, and their Pt(II)complex (Figure 3) in CHCl3 showed absorptionbands between 200 nm and 800 nm. While the elec-tronic spectrum of L1 contains three bands, L2 hastwo bands in the UV region. The first bands for L1
at 249 nm and for L2 at 225 nm are assigned to π–π* and n–π* (–C=N, –C=O) transitions. The secondbands of L1 and L2 at 305 and 275 nm, respectively,and the third band of L1 at 404 nm may be ascribedto the long pair electrons of nitrogen and oxygenatoms. These values are shifted to higher values inthe UV–Visible spectrum of the complex. The com-plex shows three absorption bands at 252, 354, and416 nm which are attributed to 1A1g → 1Eg, 1A1g →1B1g and 1A1g → 1A2g transitions, respectively. As a re-sult, the observed transitions are consistent with low-spin square-planar geometry [55–61].
The FT-IR spectra of free ligands and their Pt(II)complex are detailed in Table 1. In the FT-IR spec-trum of the complex, the symmetric and asym-metric vibrations of the –COO group are not ob-served since the amino acid-derived Schiff basesare not in the form of their salts. But the charac-teristic bands at 1597 and 1454 cm−1 which maybe caused by the symmetric ν(COO) and asym-metric ν(COO) stretching vibrations, respectively,of the coordinated carboxylate group [62–69]. Thisassignment is based on the fact that non-ionizedand uncoordinated ν(COO) stretching band occursusually around 1750–1700 cm−1, while the ionizedand coordinated ν(COO) stretching appears around
C. R. Chimie, 2020, 23, n 2, 127-142
132 Özlen Altun and Melike Özge Koçer
Figure 1. ESI-MS spectrum of L1.
Figure 2. ESI-MS spectrum of the Pt(II) complex.
Figure 3. UV–Visible spectrum of L1, L2, andthe Pt(II) complex.
1600–1400 cm−1. In addition, in the FT-IR spectrumof L1, the characteristic bands at 1635 and 1548 cm−1
are attributed to ν(C=N) and ν(C=C) stretchingvibrations. These bands are shifted to 1643 and1502 cm−1 in the complex, which indicates that theimino nitrogen and phenolic oxygen of the Schiffbase are coordinated to the Pt(II) ion. The broad OHstretching band in the 3200–3100 cm−1 region for L2
is missing in the spectrum of the complex. A sig-nificant feature of FT-IR spectra of the metal com-plexes in the presence of L2 is the absence of band∼3440 cm−1 due to the OH stretching vibration ofthe free OH group in L2. This observation leads tothe conclusion that complex formation takes place bydeprotonation of the hydroxyl group of the L2 moiety.Furthermore, the stretching vibration of the azome-thine, which appears at 1630 cm−1 in L2, is shiftedto a lower frequency in the complex, which indicatescoordination through the ternary nitrogen donor ofL2 [63]. The coordination through the nitrogen atomin ν(C–N) and ν(C=N) groups is supported by theappearance of new bands at 598 cm−1 in the spec-
C. R. Chimie, 2020, 23, n 2, 127-142
Özlen Altun and Melike Özge Koçer 133
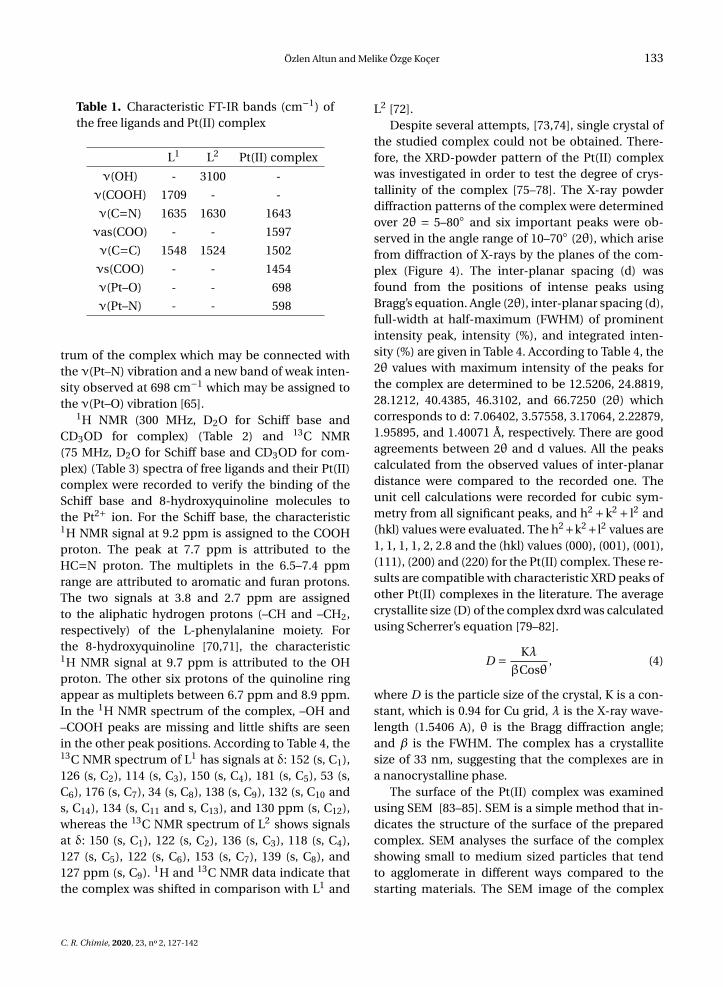
Table 1. Characteristic FT-IR bands (cm−1) ofthe free ligands and Pt(II) complex
L1 L2 Pt(II) complex
ν(OH) - 3100 -
ν(COOH) 1709 - -
ν(C=N) 1635 1630 1643
νas(COO) - - 1597
ν(C=C) 1548 1524 1502
νs(COO) - - 1454
ν(Pt–O) - - 698
ν(Pt–N) - - 598
trum of the complex which may be connected withthe ν(Pt–N) vibration and a new band of weak inten-sity observed at 698 cm−1 which may be assigned tothe ν(Pt–O) vibration [65].
1H NMR (300 MHz, D2O for Schiff base andCD3OD for complex) (Table 2) and 13C NMR(75 MHz, D2O for Schiff base and CD3OD for com-plex) (Table 3) spectra of free ligands and their Pt(II)complex were recorded to verify the binding of theSchiff base and 8-hydroxyquinoline molecules tothe Pt2+ ion. For the Schiff base, the characteristic1H NMR signal at 9.2 ppm is assigned to the COOHproton. The peak at 7.7 ppm is attributed to theHC=N proton. The multiplets in the 6.5–7.4 ppmrange are attributed to aromatic and furan protons.The two signals at 3.8 and 2.7 ppm are assignedto the aliphatic hydrogen protons (–CH and –CH2,respectively) of the L-phenylalanine moiety. Forthe 8-hydroxyquinoline [70,71], the characteristic1H NMR signal at 9.7 ppm is attributed to the OHproton. The other six protons of the quinoline ringappear as multiplets between 6.7 ppm and 8.9 ppm.In the 1H NMR spectrum of the complex, –OH and–COOH peaks are missing and little shifts are seenin the other peak positions. According to Table 4, the13C NMR spectrum of L1 has signals at δ: 152 (s, C1),126 (s, C2), 114 (s, C3), 150 (s, C4), 181 (s, C5), 53 (s,C6), 176 (s, C7), 34 (s, C8), 138 (s, C9), 132 (s, C10 ands, C14), 134 (s, C11 and s, C13), and 130 ppm (s, C12),whereas the 13C NMR spectrum of L2 shows signalsat δ: 150 (s, C1), 122 (s, C2), 136 (s, C3), 118 (s, C4),127 (s, C5), 122 (s, C6), 153 (s, C7), 139 (s, C8), and127 ppm (s, C9). 1H and 13C NMR data indicate thatthe complex was shifted in comparison with L1 and
L2 [72].Despite several attempts, [73,74], single crystal of
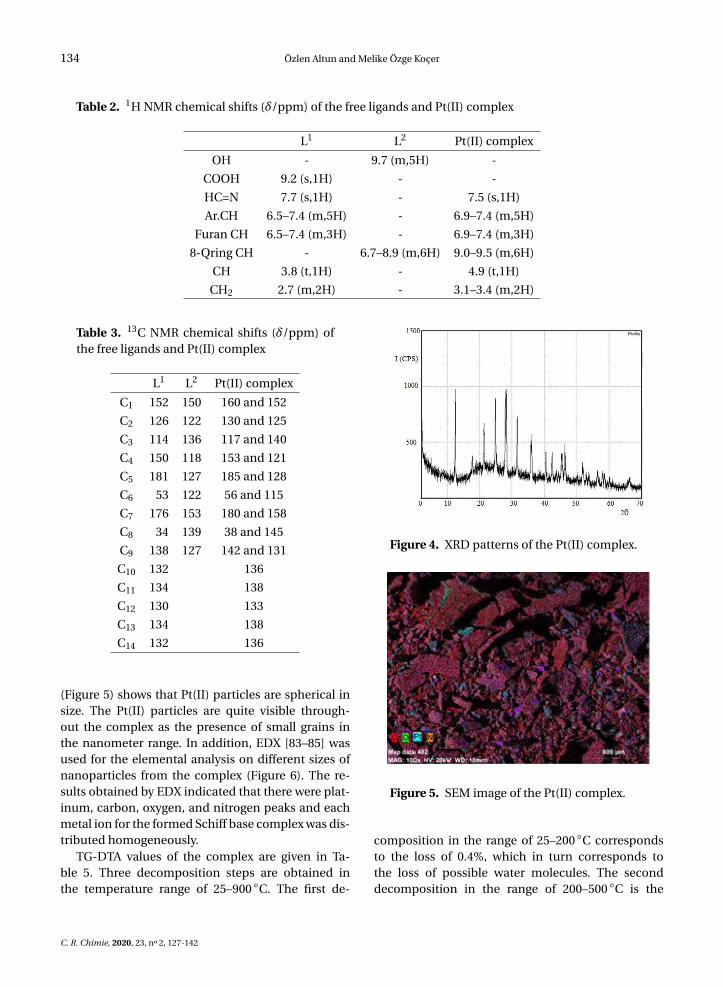
the studied complex could not be obtained. There-fore, the XRD-powder pattern of the Pt(II) complexwas investigated in order to test the degree of crys-tallinity of the complex [75–78]. The X-ray powderdiffraction patterns of the complex were determinedover 2θ = 5–80 and six important peaks were ob-served in the angle range of 10–70 (2θ), which arisefrom diffraction of X-rays by the planes of the com-plex (Figure 4). The inter-planar spacing (d) wasfound from the positions of intense peaks usingBragg’s equation. Angle (2θ), inter-planar spacing (d),full-width at half-maximum (FWHM) of prominentintensity peak, intensity (%), and integrated inten-sity (%) are given in Table 4. According to Table 4, the2θ values with maximum intensity of the peaks forthe complex are determined to be 12.5206, 24.8819,28.1212, 40.4385, 46.3102, and 66.7250 (2θ) whichcorresponds to d: 7.06402, 3.57558, 3.17064, 2.22879,1.95895, and 1.40071 Å, respectively. There are goodagreements between 2θ and d values. All the peakscalculated from the observed values of inter-planardistance were compared to the recorded one. Theunit cell calculations were recorded for cubic sym-metry from all significant peaks, and h2 +k2 + l2 and(hkl) values were evaluated. The h2+k2+l2 values are1, 1, 1, 1, 2, 2.8 and the (hkl) values (000), (001), (001),(111), (200) and (220) for the Pt(II) complex. These re-sults are compatible with characteristic XRD peaks ofother Pt(II) complexes in the literature. The averagecrystallite size (D) of the complex dxrd was calculatedusing Scherrer’s equation [79–82].
D = Kλ
βCosθ, (4)
where D is the particle size of the crystal, K is a con-stant, which is 0.94 for Cu grid, λ is the X-ray wave-length (1.5406 A), θ is the Bragg diffraction angle;and β is the FWHM. The complex has a crystallitesize of 33 nm, suggesting that the complexes are ina nanocrystalline phase.
The surface of the Pt(II) complex was examinedusing SEM [83–85]. SEM is a simple method that in-dicates the structure of the surface of the preparedcomplex. SEM analyses the surface of the complexshowing small to medium sized particles that tendto agglomerate in different ways compared to thestarting materials. The SEM image of the complex
C. R. Chimie, 2020, 23, n 2, 127-142
134 Özlen Altun and Melike Özge Koçer
Table 2. 1H NMR chemical shifts (δ/ppm) of the free ligands and Pt(II) complex
L1 L2 Pt(II) complex
OH - 9.7 (m,5H) -
COOH 9.2 (s,1H) - -
HC=N 7.7 (s,1H) - 7.5 (s,1H)
Ar.CH 6.5–7.4 (m,5H) - 6.9–7.4 (m,5H)
Furan CH 6.5–7.4 (m,3H) - 6.9–7.4 (m,3H)
8-Qring CH - 6.7–8.9 (m,6H) 9.0–9.5 (m,6H)
CH 3.8 (t,1H) - 4.9 (t,1H)
CH2 2.7 (m,2H) - 3.1–3.4 (m,2H)
Table 3. 13C NMR chemical shifts (δ/ppm) ofthe free ligands and Pt(II) complex
L1 L2 Pt(II) complex
C1 152 150 160 and 152
C2 126 122 130 and 125
C3 114 136 117 and 140
C4 150 118 153 and 121
C5 181 127 185 and 128
C6 53 122 56 and 115
C7 176 153 180 and 158
C8 34 139 38 and 145
C9 138 127 142 and 131
C10 132 136
C11 134 138
C12 130 133
C13 134 138
C14 132 136
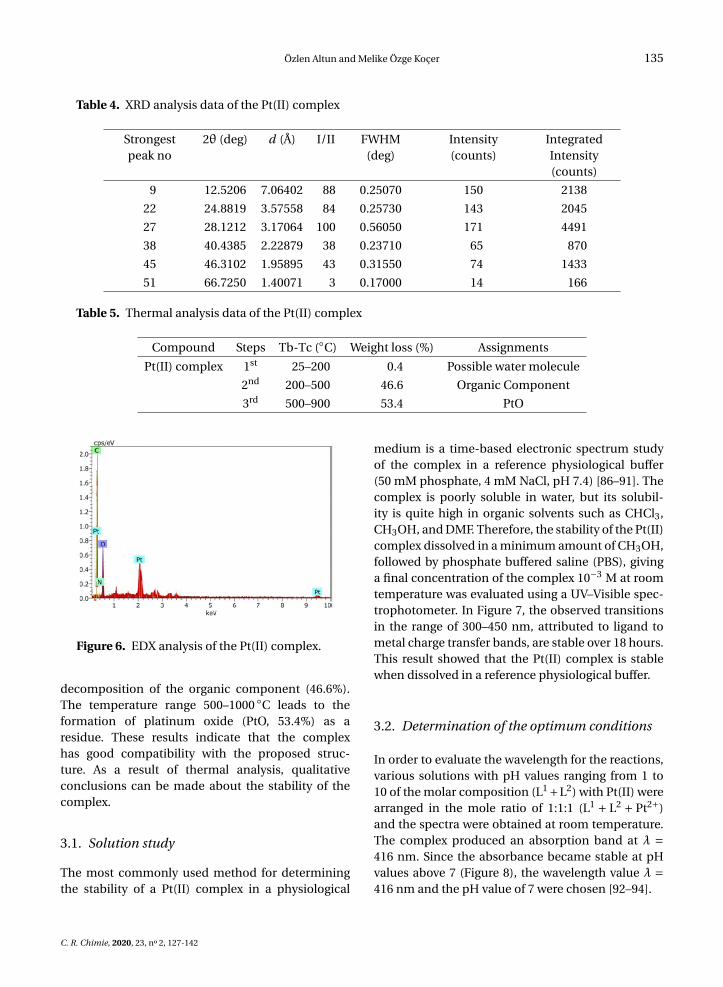
(Figure 5) shows that Pt(II) particles are spherical insize. The Pt(II) particles are quite visible through-out the complex as the presence of small grains inthe nanometer range. In addition, EDX [83–85] wasused for the elemental analysis on different sizes ofnanoparticles from the complex (Figure 6). The re-sults obtained by EDX indicated that there were plat-inum, carbon, oxygen, and nitrogen peaks and eachmetal ion for the formed Schiff base complex was dis-tributed homogeneously.
TG-DTA values of the complex are given in Ta-ble 5. Three decomposition steps are obtained inthe temperature range of 25–900 C. The first de-
Figure 4. XRD patterns of the Pt(II) complex.
Figure 5. SEM image of the Pt(II) complex.
composition in the range of 25–200 C correspondsto the loss of 0.4%, which in turn corresponds tothe loss of possible water molecules. The seconddecomposition in the range of 200–500 C is the
C. R. Chimie, 2020, 23, n 2, 127-142
Özlen Altun and Melike Özge Koçer 135
Table 4. XRD analysis data of the Pt(II) complex
Strongestpeak no
2θ (deg) d (Å) I/II FWHM(deg)
Intensity(counts)
IntegratedIntensity(counts)
9 12.5206 7.06402 88 0.25070 150 2138
22 24.8819 3.57558 84 0.25730 143 2045
27 28.1212 3.17064 100 0.56050 171 4491
38 40.4385 2.22879 38 0.23710 65 870
45 46.3102 1.95895 43 0.31550 74 1433
51 66.7250 1.40071 3 0.17000 14 166
Table 5. Thermal analysis data of the Pt(II) complex
Compound Steps Tb-Tc (C) Weight loss (%) Assignments
Pt(II) complex 1st 25–200 0.4 Possible water molecule
2nd 200–500 46.6 Organic Component
3rd 500–900 53.4 PtO
Figure 6. EDX analysis of the Pt(II) complex.
decomposition of the organic component (46.6%).The temperature range 500–1000 C leads to theformation of platinum oxide (PtO, 53.4%) as aresidue. These results indicate that the complexhas good compatibility with the proposed struc-ture. As a result of thermal analysis, qualitativeconclusions can be made about the stability of thecomplex.
3.1. Solution study
The most commonly used method for determiningthe stability of a Pt(II) complex in a physiological
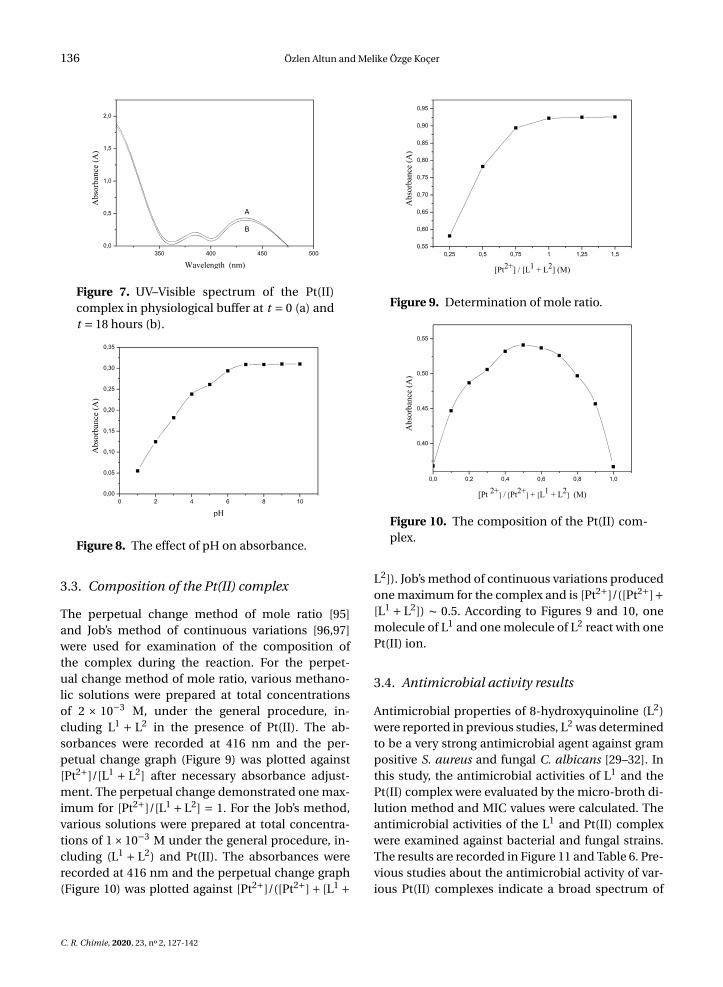
medium is a time-based electronic spectrum studyof the complex in a reference physiological buffer(50 mM phosphate, 4 mM NaCl, pH 7.4) [86–91]. Thecomplex is poorly soluble in water, but its solubil-ity is quite high in organic solvents such as CHCl3,CH3OH, and DMF. Therefore, the stability of the Pt(II)complex dissolved in a minimum amount of CH3OH,followed by phosphate buffered saline (PBS), givinga final concentration of the complex 10−3 M at roomtemperature was evaluated using a UV–Visible spec-trophotometer. In Figure 7, the observed transitionsin the range of 300–450 nm, attributed to ligand tometal charge transfer bands, are stable over 18 hours.This result showed that the Pt(II) complex is stablewhen dissolved in a reference physiological buffer.
3.2. Determination of the optimum conditions
In order to evaluate the wavelength for the reactions,various solutions with pH values ranging from 1 to10 of the molar composition (L1+L2) with Pt(II) werearranged in the mole ratio of 1:1:1 (L1 + L2 + Pt2+)and the spectra were obtained at room temperature.The complex produced an absorption band at λ =416 nm. Since the absorbance became stable at pHvalues above 7 (Figure 8), the wavelength value λ =416 nm and the pH value of 7 were chosen [92–94].
C. R. Chimie, 2020, 23, n 2, 127-142
136 Özlen Altun and Melike Özge Koçer
Figure 7. UV–Visible spectrum of the Pt(II)complex in physiological buffer at t = 0 (a) andt = 18 hours (b).
Figure 8. The effect of pH on absorbance.
3.3. Composition of the Pt(II) complex
The perpetual change method of mole ratio [95]and Job’s method of continuous variations [96,97]were used for examination of the composition ofthe complex during the reaction. For the perpet-ual change method of mole ratio, various methano-lic solutions were prepared at total concentrationsof 2 × 10⁻³ M, under the general procedure, in-cluding L1 + L2 in the presence of Pt(II). The ab-sorbances were recorded at 416 nm and the per-petual change graph (Figure 9) was plotted against[Pt2+]/[L1 + L2] after necessary absorbance adjust-ment. The perpetual change demonstrated one max-imum for [Pt2+]/[L1 + L2] = 1. For the Job’s method,various solutions were prepared at total concentra-tions of 1×10⁻³ M under the general procedure, in-cluding (L1 + L2) and Pt(II). The absorbances wererecorded at 416 nm and the perpetual change graph(Figure 10) was plotted against [Pt2+]/([Pt2+]+ [L1 +
Figure 9. Determination of mole ratio.
Figure 10. The composition of the Pt(II) com-plex.
L2]). Job’s method of continuous variations producedone maximum for the complex and is [Pt2+]/([Pt2+]+[L1 + L2]) ∼ 0.5. According to Figures 9 and 10, onemolecule of L1 and one molecule of L2 react with onePt(II) ion.
3.4. Antimicrobial activity results
Antimicrobial properties of 8-hydroxyquinoline (L2)were reported in previous studies, L2 was determinedto be a very strong antimicrobial agent against grampositive S. aureus and fungal C. albicans [29–32]. Inthis study, the antimicrobial activities of L1 and thePt(II) complex were evaluated by the micro-broth di-lution method and MIC values were calculated. Theantimicrobial activities of the L1 and Pt(II) complexwere examined against bacterial and fungal strains.The results are recorded in Figure 11 and Table 6. Pre-vious studies about the antimicrobial activity of var-ious Pt(II) complexes indicate a broad spectrum of
C. R. Chimie, 2020, 23, n 2, 127-142

Özlen Altun and Melike Özge Koçer 137
antibacterial and antifungal activity. Compared withantimicrobial activity data from previously reportedliterature [98–100], the Pt(II) complex have signifi-cant activity against S. aureus, L. monocytogenes, andC. albicans strains in our study. According to our an-timicrobial activity results, while the obtained com-plex was effective against S. aureus, L. monocyto-genes, and C. albicans at 6.25 µg/mL concentrations,L1 showed moderate antibacterial activity againstS. aureus, L. monocytogenes, and C. albicans at 12.5,12.5, and 6.25 µg/mL concentrations, respectively.As a result of antimicrobial experiments, the syn-thesized complex shows increased activity comparedwith L1 and L2. The high activity of the Pt(II) com-plex may be due to the effect of Pt+2 ion on the nor-mal cell membrane. The higher antibacterial activityof Pt(II) than L1 and L2 can be explained by chelationof L1 and L2 with Pt+2 since metal chelates displayboth polar and non-polar properties [101,102]. Theseproperties make them suitable for permeation intocells. The polarity of the metal ion is reduced due topartial sharing of the positive charge of the metal ionwith the donor groups, such as nitrogen and oxygenon L1 and L2. Chelation enhances the penetration ofcomplex into lipid membranes by increasing the de-localization ofπ-electrons over the entire chelate ring[103,104]. It also increases the lipophilic nature of thecentral metal ions, leading to liposolubility throughthe lipid layer of cell membranes. The lipophilicity,which controls the rate of entry of molecules into thecell, is modified by coordination. Therefore, the ob-tained Pt(II) complex can become more active thanthe free L1 and L2 [105] and may be preferable toother inorganic complexes of platinum(II) due to itshigh effectiveness in preventing infection.
3.5. Cytotoxicity results
The coordination complexes of Pt(II) show interest-ing cytotoxic and antitumor properties [106–112].Previously, many studies reported the cytotoxic prop-erties of (L2) 8-hydroxyquinoline [113,114]. Hence, inour study, the cytotoxic activities of L1 and the Pt(II)complex were determined for MEF cells and Du145cancer cells by an MTT assay. The results are pre-sented in Figures 12 and 13. The IC50 values withinthe nanomolar range (50% inhibition) were evalu-ated from the dose response curves. The IC50 valuesof L1 and Pt(II) complex for MEF were calculated as
Figure 11. The viability (%) values for L1 (a)and the Pt(II) complex (b) at different con-centrations (200–6.25 µg/mL) for E. coli,Salmonella thyphimirium, Staphylococcusaureus, Listeria monocytogenes, Bacillus cereus,and Candida albicans (n = 4) ± S.E.
>1000 µM and >1000 µM. For the Du145, the IC50
values of L1 and Pt(II) were determined as 77 µMand 41 µM, respectively. According to the analysis re-sults, no death was observed in MEF cells at any con-centration, whereas L1 was effective on Du145 can-cer cells at 100, 200, 400, and 800 µM concentrations.The complex showed significant effect on Du145 can-cer cells at 50, 100, 200, 400, and 800 µM concentra-tions over 24 h compared with their respective con-trol groups after 24 h. These results indicate that thepresence of L1 and L2 coordinated with a Pt(II) cen-ter leads to activation of cytotoxic properties. As a re-sult of the analysis, the cytotoxic activity of the Pt(II)complex is more active than L1 and L2. In a previousstudy, A. A. Yadav et al. [115] investigated molecularmechanisms of the biological activity of the elesclo-
C. R. Chimie, 2020, 23, n 2, 127-142

138 Özlen Altun and Melike Özge Koçer
Table 6. Antimicrobial activity data for the L1 and Pt(II) complex
Name of bacteria/fungus Inhibition %L1 (Complex)
Antibiotic MIC (µg/mL)L1 (Complex)
E. coli 4.9889 (8.8757) Ampicillin 6.25 (6.25)
S. typhimurium 9.6174 (19.6877) Ampicillin 6.25 (6.25)
S. aureus 50.9212 (63.7653) Ampicillin 12.5 (6.25)
L. monocytogenes 47.6417 (59.3048) Ampicillin 12.5 (6.25)
B. cereus 10.5767 (15.3787) Ampicillin 6.25 (6.25)
C. albicans 53.6662 (67.8547) Amphotericin B 6.25 (6.25)
Figure 12. The viability (%) values of L1 (a)and the Pt(II) complex (b) at different concen-trations (25–800 µM) for MEF. Values are pre-sented as the means (n = 6) ± S.E for 24 h.
mol and its complexes with Cu(II), Ni(II), and Pt(II).In their study, for the mechanism of biological activ-ity of metal–elesclomol complex, they proposed thatthe metal(II) was selectively transported to the mito-chondria and enzymatic or non-enzymatic reductionof the metal(II) deposited in the mitochondria would
Figure 13. The viability (%) values of L1 (a) andthe Pt(II) complex (b) at different concentra-tions (25–800 µM) for Du145. Values are pre-sented as the means (n = 6) ± S.E for 24 h.
yield metal. They also proposed that after reductionand dissociation of the complex, the elesclomol waseffluxed from the cell and continued to shuttle moremetal(II) into the cell [116]. The same result may besuggested for the mechanism of the cytotoxicity ac-tivity of our Pt(II) complex.
C. R. Chimie, 2020, 23, n 2, 127-142
Özlen Altun and Melike Özge Koçer 139
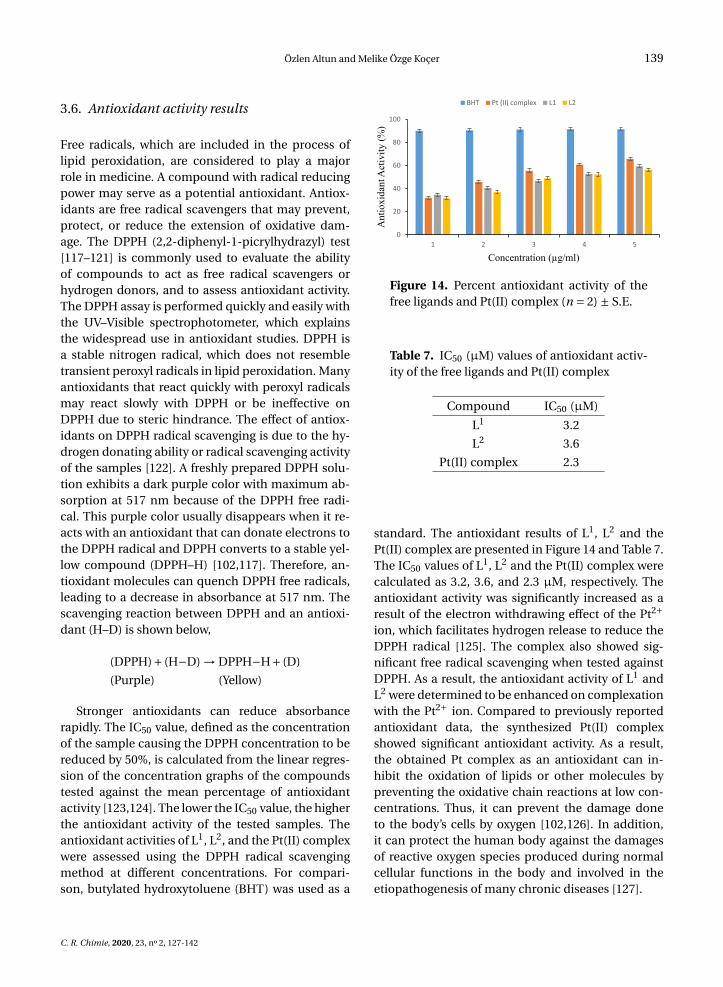
3.6. Antioxidant activity results
Free radicals, which are included in the process oflipid peroxidation, are considered to play a majorrole in medicine. A compound with radical reducingpower may serve as a potential antioxidant. Antiox-idants are free radical scavengers that may prevent,protect, or reduce the extension of oxidative dam-age. The DPPH (2,2-diphenyl-1-picrylhydrazyl) test[117–121] is commonly used to evaluate the abilityof compounds to act as free radical scavengers orhydrogen donors, and to assess antioxidant activity.The DPPH assay is performed quickly and easily withthe UV–Visible spectrophotometer, which explainsthe widespread use in antioxidant studies. DPPH isa stable nitrogen radical, which does not resembletransient peroxyl radicals in lipid peroxidation. Manyantioxidants that react quickly with peroxyl radicalsmay react slowly with DPPH or be ineffective onDPPH due to steric hindrance. The effect of antiox-idants on DPPH radical scavenging is due to the hy-drogen donating ability or radical scavenging activityof the samples [122]. A freshly prepared DPPH solu-tion exhibits a dark purple color with maximum ab-sorption at 517 nm because of the DPPH free radi-cal. This purple color usually disappears when it re-acts with an antioxidant that can donate electrons tothe DPPH radical and DPPH converts to a stable yel-low compound (DPPH–H) [102,117]. Therefore, an-tioxidant molecules can quench DPPH free radicals,leading to a decrease in absorbance at 517 nm. Thescavenging reaction between DPPH and an antioxi-dant (H–D) is shown below,
(DPPH)+ (H−D) → DPPH−H+ (D)
(Purple) (Yellow)
Stronger antioxidants can reduce absorbancerapidly. The IC50 value, defined as the concentrationof the sample causing the DPPH concentration to bereduced by 50%, is calculated from the linear regres-sion of the concentration graphs of the compoundstested against the mean percentage of antioxidantactivity [123,124]. The lower the IC50 value, the higherthe antioxidant activity of the tested samples. Theantioxidant activities of L1, L2, and the Pt(II) complexwere assessed using the DPPH radical scavengingmethod at different concentrations. For compari-son, butylated hydroxytoluene (BHT) was used as a
Figure 14. Percent antioxidant activity of thefree ligands and Pt(II) complex (n = 2) ± S.E.
Table 7. IC50 (µM) values of antioxidant activ-ity of the free ligands and Pt(II) complex
Compound IC50 (µM)
L1 3.2
L2 3.6
Pt(II) complex 2.3
standard. The antioxidant results of L1, L2 and thePt(II) complex are presented in Figure 14 and Table 7.The IC50 values of L1, L2 and the Pt(II) complex werecalculated as 3.2, 3.6, and 2.3 µM, respectively. Theantioxidant activity was significantly increased as aresult of the electron withdrawing effect of the Pt2+
ion, which facilitates hydrogen release to reduce theDPPH radical [125]. The complex also showed sig-nificant free radical scavenging when tested againstDPPH. As a result, the antioxidant activity of L1 andL2 were determined to be enhanced on complexationwith the Pt2+ ion. Compared to previously reportedantioxidant data, the synthesized Pt(II) complexshowed significant antioxidant activity. As a result,the obtained Pt complex as an antioxidant can in-hibit the oxidation of lipids or other molecules bypreventing the oxidative chain reactions at low con-centrations. Thus, it can prevent the damage doneto the body’s cells by oxygen [102,126]. In addition,it can protect the human body against the damagesof reactive oxygen species produced during normalcellular functions in the body and involved in theetiopathogenesis of many chronic diseases [127].
C. R. Chimie, 2020, 23, n 2, 127-142
140 Özlen Altun and Melike Özge Koçer
4. Conclusion
In this work, we studied the synthesis and spectralanalysis of a Pt(II) complex of a Schiff base (L1) de-rived from L-phenylalanine and furfuraldehyde inthe presence 8-hydroxyquinoline (L2). According tophysico-chemical, spectrophotometric, and thermalanalysis results, small shifts in spectral analysis areobserved in the Pt(II) complex and the reaction ofL1 and L2 in the presence of Pt(II) is a complex re-action. One molecule of L1 and one molecule of L2
react with one molecule of Pt(II) ion. The complex isactive against some of the chosen bacterial and fun-gal strains. According to the test results, the antimi-crobial activities of the complex increase comparedto the antimicrobial activities of the free ligands. L1
and the Pt(II) complex show strong cell-growth in-hibition against Du145 cancer cells with MTT assayimplying that they induce apoptosis in these can-cer cells. Whereas L1 is effective on Du145 cancercells at 100, 200, 400, and 800 µM concentrations,the complex shows significant effect on Du145 can-cer cells at 50, 100, 200, 400, and 800 µM concen-trations over 24 h compared to the respective con-trol groups after 24 h. The free ligands and Pt(II)complex also have significant antioxidant activity.Accordingly, the antioxidant activity results show thatthe complex is effective at preventing the formationof the DPPH radical. This activity is explained withchelation theory. Furthermore, the IC50 values ob-served in cytotoxicity and antioxidant activities indi-cate that the synthesized complex exhibits differen-tial and selective properties.
Acknowledgments
This study was financially supported by Trakya Uni-versity, Research Fund (TUBAP, project # 2016/250).We (Assoc Prof Özlen ALTUN and Research Stu-dent Melike Özge KOÇER) confirm that “Trakya Uni-versity” only provided financial support within thescope of the project for chemicals in the manu-script and we declare that the support received didnot lead to any conflict of interests regarding thepublication of this manuscript. There is no needfor Trakya University’s confirmation to publish thismanuscript.
Supplementary data
Supporting information for this article is available onthe journal’s website under article’s URL https://doi.org/10.5802/crchim.9 or from the author. The exper-imental details and randomization protocols are pro-vided.
References
[1] Z. Cimerman, S. Miljanic, N. Galic, Croat. Chem. Acta, 2000,73, 81-95.
[2] S. H. Rahaman, H. Chowdhury, D. Bose, R. Ghosh, C. H.Hung, B. K. Ghosh, Polyhedron, 2005, 24, 1755-1763.
[3] Z. H. Chohan, M. Arif, M. Sarfraz, Appl. Organomet. Chem.,2007, 21, 294-302.
[4] Y. Li, Z. Y. Yang, T. R. Li, Synthesis, Chem. Pharm. Bull., 2008,56, 1528-1534.
[5] I. Sakıyan, R. Özdemir, H. Ögütçü, Synth. React. Inorg. M.,2014, 44, 417-423.
[6] A. S. Gaballa, M. S. Asker, A. S. Barakat, S. M. Teleb, Spec-trochim. Acta part A, 2006, 67, 114-121.
[7] S. Kumar, D. N. Dhar, P. N. Saxena, J. Sci. Ind. Res. India, 2009,68, 181-187.
[8] M. S. Suresh, V. Prakash, J. Chem., 2011, 8, 1408-1416.[9] G. Nizami, R. Sayyed, IOSR J. Appl. Chem., 2017, 10, 40-51.
[10] M. R. Gill, J. A. Thomas, Chem. Soc. Rev., 2012, 41, 3179-3192.[11] D. C. Carter, J. X. Ho, Adv. Protein Chem., 1994, 45, 153-203.[12] X. M. He, D. C. Carter, Nature, 1992, 358, 209-215.[13] H. Liu, Q. Guo, J. Dong, Q. Wei, H. Zhang, X. Sun, C. Liu, L. Li,
J. Coord. Chem., 2015, 68, 1040-1053.[14] Q. Wei, J. Dong, P. Zhao, M. Li, F. Cheng, J. Kong, L. Li,
J. Photochem. Photobiol. B: Biol., 2016, 161, 355-367.[15] P. Zhao, Q. Wei, J. Dong, F. Ding, J. Li, L. Lia, J. Coord. Chem.,
2016, 69, 2437-2453.[16] H. Liu, L. Li, Q. Guo, J. Dong, J. Li, Trans. Met. Chem., 2013,
38, 441-448.[17] Q. Guo, L. Li, J. Dong, H. Liu, T. Xu, J. Li, Spectrochim. Acta A,
2013, 106, 155-162.[18] S. Zhai, Q. Guo, J. Dong, T. Xu, L. Li, Trans. Met. Chem., 2014,
39, 271-280.[19] D. R. Laurence, P. N. Bennett, M. J. Brown, Antibacterial
drugs, Clinical Pharmacology, 8th ed., Churchill Livingstone,Edinburgh, Scotland, 1997, 211 pages.
[20] Z. Guo, P. J. Sadler, Angew. Chem. Int. Ed., 1999, 38, 1512-1531.
[21] O. E. Offiong, E. Nfor, A. A. Ayi, S. Martelli, Trans. Met. Chem.,2000, 25, 369-373.
[22] I. Sakıyan, N. Gündüz, T. Gündüz, Synth. React. Inorg. M.,2001, 31, 1175-1187.
[23] I. Sakıyan, Trans. Met. Chem., 2007, 32, 131-135.[24] B. R. James, Adv. Organomet. Chem., 1979, 17, 319-405.[25] F. R. Hartley, Chem. Rev., 1969, 69, 799-844.[26] P. M. Henry, Palladium Oxidation of Hydrocarbons Cat-
alyzed, D. Reidel Publishing Campany, Dordrecht, Holland,1979, 41 pages.
[27] D. E. Webster, Adv. Organomet. Chem., 1977, 15, 147-188.
C. R. Chimie, 2020, 23, n 2, 127-142
Özlen Altun and Melike Özge Koçer 141
[28] C. Rimbu, R. Danac, A. Pui, Chem. Pharm. Bull., 2014, 62, 12-15.
[29] R. Mladenova, M. Ignatova, N. Manolova, T. Petrova,I. Rashkov, Eur. Poly. J., 2002, 38, 989-999.
[30] S. S. Patil, G. A. Thakur, M. M. Shaikh, Int. Sch. Res. Network,ISRN Pharmaceutics (2011) p. 1-6.
[31] V. Prachayasittikul, S. Prachayasittikul, S. Ruchirawat,V. Prachayasittikul, Drug Des. Dev. Ther., 2013, 7, 1157-1178.
[32] S. Srisung, T. Suksrichavalit, S. Prachayasittikul, S. Ruchi-rawat, V. Prachayasittikul, Int. J. Pharm., 2013, 9, 170-175.
[33] Clinical and Laboratory Standards Institute, ReferenceMethod for Broth Dilution Antifungal Susceptibility Testingof Yeasts: Approved Standard M27-A2, CLSI, Wayne, PA, 2002.
[34] I. Kobayashi, H. Muraoka, T. Saika, M. Nishida, T. Fujioka,M. Nasu, J. Med. Microbiol., 2004, 53, 403-406.
[35] I. Wiegand, K. Hilpert, R. E. W. Hancock, Nat. Protoc., 2008,3, 163-175.
[36] E. G. Kaya, H. Özbilge, S. Albayrak, ANKEM, 2009, 23, 110-114.
[37] Clinical and Laboratory Standards Institute, PerformanceStandards for Antimicrobial Susceptibility Testing, 15th In-formational Supplement. CLSI Document M100-S22, CLSI,PA, 2012.
[38] E. Kaya, H. Ozbilge, Turk. J. Med. Sci., 2012, 42, 325-328.[39] M. V. Blagosklonny, A. B. Pardee, Cancer Res., 2001, 61, 4301-
4305.[40] L. Giovagnini, L. Ronconi, D. Aldinucci, D. Lorenzon,
S. Sitran, D. Fregona, J. Med. Chem., 2005, 48, 1588-1595.[41] R. Kim, M. Emi, K. Tanabe, Cancer Chemoth. Pharm., 2006,
57, 545-553.[42] P. Z. Lu, C. Y. Lai, W. H. Chan, Int. J. Mol. Sci., 2008, 9, 698-718.[43] S. H. Liu, C. Chen, R. S. Yang, Y. P. Yen, Y. T. Yang, C. Tsai,
J. Orthop. Res., 2011, 29, 954-960.[44] O. Doganlar, Z. B. Doganlar, Biomed. Res., 2016, 27, 268-278.[45] T. Mossman, J. Immunol., 1983, 65, 55-63.[46] S. Sathiyaraj, R. J. Butcher, C. Jayabalakrishnan, J. Mol.
Struct., 2012, 1030, 95-103.[47] M. S. Blois, Nature, 1958, 181, 1199-1200.[48] K. Shimada, K. Fujikawa, K. Yahara, T. Nakamura, J. Agric.
Food Chem., 1992, 40, 945-948.[49] B. Tanti, A. K. Buragohain, L. Guring, D. Kakati, A. K. Das, S. P.
Borah, Indian J. Nat. Prod. Resour., 2010, 1, 17-21.[50] A. Choudhary, R. Sharma, M. Nagar, M. Mohsin, H. S. Meena,
J. Chil. Chem. Soc., 2011, 56, 911-917.[51] O. A. El-Gammal, M. M. Mostafa, Spectrochim. Acta Part A,
2014, 127, 530-542.[52] P. Kavitha, K. L. Reddy, Arab. J. Chem., 2016, 9, 640-648.[53] W. J. Geary, Coord. Chem. Rev., 1971, 7, 81-122.[54] S. F. A. Kettle, Coordination Compounds, Thomas Nelson,
London, 1975.[55] J. R. Dyer, Application of Absorption Spectroscopy of Organic
Compounds, Prentice-Hall, New Jersey, 1965.[56] O. Siimann, J. Fresco, J. Am. Chem. Soc., 1970, 92, 2652-2656.[57] A. B. P. Lever, Inorganic Electronic Spectroscopy, Elsevier,
New York, 1984.[58] R. K. Agarwal, S. Prasad, Turk. J. Chem., 2005, 29, 289-298.[59] S. S. Ezzat, Rafidain J. Sci., 2008, 19, 42-47.[60] J. G. Kang, D. H. Cho, C. Park, S. K. Kang, I. T. Kim, S. W. Lee,
H. H. Lee, Y. N. Lee, D. W. Lim, S. J. Lee, S. H. Kim, Y. J. Bae,Bull. Korean Chem. Soc., 2008, 29, 599-603.
[61] S. M. S. Jambi, S. S. Kandil, J. Mater. Environ. Sci., 2012, 3,591-604.
[62] K. Nakamato, V. Morimoto, A. E. Martelli, J. Am. Chem. Soc.,1961, 83, 4528-4532.
[63] J. B. Lambert, H. F. Shurwell, L. Verbit, R. G. Cooks, G. H.Stout, Organic Structural Analysis, Mac Millan, New York,1976.
[64] G. Socrates, Infrared Characterization Group Frequencies,John Wiley, New York, 1980.
[65] K. Nakamato, Infrared and Raman Spectra of Inorganic andCoordination Compounds, 4th ed., John Wiley and Sons,New York, 1986.
[66] M. S. Islam, M. S. Ahmed, S. C. Pal, Y. Reza, S. Jesmin, IndianJ. Chem., 1995, 34 A, 816-818.
[67] K. Nakamato, Infrared and Raman Spectra of Inorganic andCoordination Compounds, 5th ed., John Wiley, New York,1997.
[68] I. T. Ahmed, A. A. A. Boraei, J. Chem. Eng. Data, 1998, 43, 459-464.
[69] M. A. El-Gahami, Z. A. Khafagy, A. M. M. Ali, N. M. Ismail,J. Inorg, Organomet. Polym., 2004, 14, 117-129.
[70] S. Katayama, Y. Akahori, H. Mori, Chem. Pharm. Bull., 1973,21, 2622-2626.
[71] A. A. Fomichev, Y. S. Ryabokobylko, A. V. Kessenikh, A. Ataev,B. V. Parusnikov, I. A. Krasavin, V. M. Dziomko, Chem. Hete-rocycl. Com., 1977, 13, 996-997.
[72] L. Jin, I. Sakıyan, N. S. Gonzales, D. Lane, S. Cherala, Inorg.Chim. Acta Part A, 2014, 423, 72-78.
[73] P. G. Jones, Chemistry in Britain, 1981, 17, 222-225.[74] P. Van Der Sluis, A. M. F. Hezemans, J. Kroon, J. Appl. Crystal-
logr., 1989, 22, 340-344.[75] M. Zhang, Y. Li, Z. Yan, J. Jing, J. Xie, M. Chen, Electrochim.
Acta, 2015, 158, 81-88.[76] C. S. Dilip, V. Thangaraj, A. P. Raj, Arab. J. Chem., 2016, 9,
S731-S742.[77] M. D. Udayagiri, N. G. Yernale, B. H. M. Mruthyun-
jayaswamy, Int. J. Pharm. Pharm. Sci., 2016, 8, 344-351.[78] M. A. Salem, E. A. Bakr, H. G. El-Attar, Spectrochim. Acta
Part A, 2018, 188, 155-163.[79] B. E. Warren, X-ray Diffraction, 2nd ed., Dover, New York,
1990.[80] D. Arish, M. S. Nair, Arab. J. Chem., 2012, 5, 179-186.[81] A. H. Atta, A. I. El-Shenawy, M. S. Refat, K. M. Elsabawy,
J. Mol. Struct., 2013, 1039, 51-60.[82] S. P. Velammal, T. A. Devi1, T. P. Amaladhas, J. Nanostruct.
Chem., 2016, 6, 247-260.[83] F. A. Al-Saif, Int. J. Electrochem. Sci., 2014, 9, 398-417.[84] M. V. Lokhande, Int. J. Curr. Res. Chem. Pharm. Sci., 2015, 2,
89-98.[85] H. F. G. Barbosa, M. Attjioui, A. P. G. Ferreira, E. R. Dockal,
N. E. El Gueddari, B. M. Moerschbacher, E. T. G. Cavalheiro,Molecules, 2017, 22, 1-19.
[86] H. B. Pedersen, J. Josephsen, G. Kerszman, Chem. Biol. Inter-act., 1985, 54, 1-8.
[87] S. Carotti, A. Guerri, T. Mazzei, L. Messori, E. Mini, P. Orioli,Inorg. Chim. Acta, 1998, 281, 90-94.
C. R. Chimie, 2020, 23, n 2, 127-142
142 Özlen Altun and Melike Özge Koçer
[88] F. Abbate, P. Orioli, B. Bruni, G. Marcon, L. Messori, Inorg.Chim. Acta, 2000, 311, 1-5.
[89] A. Casini, M. C. Diawara, R. Scopelliti, S. M. Zakeeruddin,M. Gratzel, P. J. Dyson, Dalton Trans., 2010, 39, 2239-2245.
[90] V. Amani, A. Abedi, S. Ghabeshi, H. R. Khavasi, S. M. Hos-seini, N. Safari, Polyhedron, 2014, 79, 104-115.
[91] H. C. Chen, D. G. H. Hetterscheid, R. M. Williams, J. I. VanDer Vlugt, J. N. H. Reek, A. M. Brouwer, Energy Environ. Sci.,2015, 8, 975-982.
[92] O. Altun, H. Akbas, E. Dolen, Spectrochim. Acta Part A, 2007,66, 499-502.
[93] O. Altun, S. Bilcen, Spectrochim. Acta Part A, 2010, 75, 789-793.
[94] O. Altun, M. Suozer, J. Mol. Struct., 2017, 1149, 307-314.[95] A. S. Meyer, G. H. Ayres, J. Am. Chem. Soc., 1957, 79, 49-53.[96] P. Job, Ann. Chim., 1928, 9, 113-203.[97] P. Job, Ann. Chim., 1936, 6, 97-105.[98] N. R. Filipovic, I. Markovic, D. Mitic, N. Polovic, M. Milcic,
M. Dulovic, M. Jovanovic, M. Savic, M. Niksic, K. Andelkovic,T. Todorovic, J. Biochem. Mol. Toxicol., 2014, 28, 99-110.
[99] A. A. S. Al-Hamdani, A. M. Balkhı, A. Falah, S. A. Shaker,J. Chil. Chem. Soc., 2015, 60, 2774-2785.
[100] E. Pahontu, C. Paraschivescu, D. C. Ilies, D. Poirier,C. Oprean, V. Paunescu, A. Gulea, T. Rosu, O. Bratu,Molecules, 2016, 21, 674-1-18.
[101] R. S. Joseyphus, M. S. Nair, Mycobiology, 2008, 36, 93-98.[102] I. P. Ejidike, P. A. Ajibade, Molecules, 2015, 20, 9788-9802.[103] T. D. Thangadurai, K. Natarajan, Trans. Met. Chem., 2001, 26,
500-504.[104] M. A. Neelakantan, S. S. Marriappan, J. Dharmaraja,
T. Jeyakumar, K. Muthukumaran, Spectrochim. Acta A, 2008,71, 628-635.
[105] N. Farrell, Coord. Chem. Rev., 2007, 252, 1-31.[106] W. Hernandez, J. Paz, A. Vaisberg, E. Spodine, R. Richter,
L. Beyer, Bioinorg. Chem. Appl., 2008, 10, 1-9.[107] A. Bakalova, R. Buyukliev, G. Momekov, D. Ivanov, J. Chem.
Technol. Metall., 2013, 48, 631-636.[108] L. J. Li, C. Wang, C. Tian, X. Y. Yangi, X. X. Hua, J. L. Du, Res.
Chem. Intermediat., 2013, 39, 733-746.[109] V. Volarevic, J. M. Vujic, M. Milovanovic, T. Kanjevac,
A. Volarevic, S. R. Trifunovic, N. Arsenijevic, J. BUON, 2013,18, 131-137.
[110] J. Pranczk, D. Jacewicz, D. Wyrzykowski, L. Chmurzynski,Curr. Pharm. Anal., 2014, 10, 2-9.
[111] K. A. Abu-Safieh, A. S. Abu-Surrah, H. D. Tabba, H. A. Al-Masri, R. M. Bawadi, F. M. Boudjelal, L. H. Tahtamouni,J. Chem., 2016, 1-7.
[112] V. Simic, S. Kolarevic, I. Brceski, D. Jeremic, B. Vukovic-Gacic,Turk. J. Biol., 2016, 40, 661-669.
[113] A. Y. Shen, S. N. Wu, C. T. Chiu, J. Pharm. Pharmacol., 1999,51, 543-548.
[114] A. Y. Shen, C. P. Chen, S. Rofffler, Life Sci., 1999, 64, 813-825.[115] A. A. Yadav, D. Patel, X. Wu, B. B. Hasinoff, J. Inorg. Biochem.,
2013, 126, 1-6.[116] M. Nagai, N. H. Vo, L. S. Ogawa, D. Chimmanamada, T. In-
oue, J. Chu, B. C. Beaudette-Zlatanova, R. Lu, R. K. Blackman,J. Barsoum, K. Koya, Y. Wada, Free Radic. Biol. Med., 2012, 52,2142-2150.
[117] H. N. Elena, C. T. Miron, P. Gabriela, H. Mihaela, C. Titus, B. T.Alexandru, Int. J. Mol. Sci., 2006, 7, 130-143.
[118] S. Medhe, P. Bansal, M. M. Srivastava, Appl. Nanosci., 2014,4, 153-161.
[119] V. Sanna, N. Pala, G. Dessì, P. Manconi, A. Mariani, S. Dedola,M. Rassu, C. Crosio, C. Iaccarino, M. Sechi, Int. J. Nanomed.,2014, 9, 4935-4951.
[120] K. Saritha, U. Saraswathi, World J. Pharm. Sci., 2014, 2, 1545-1551.
[121] I. P. Ejidike, P. A. Ajibade, Bioinorg. Chem. Appl., 2015, 1-9.[122] P. Arulpriya, P. Lalitha, S. Hemalatha, Merr. Der Chem. Sin.,
2010, 1, 73-79.[123] V. Saritha, R. K. Anilakumar, F. Khanum, Int. J. Pharm. Biol.
Arch., 2010, 1, 376-384.[124] N. Neelofar, N. Ali, A. Khan, S. Amir, N. A. Khan, M. Bilal, Bull.
Chem. Soc. Ethiopia, 2017, 31, 445-456.[125] S. Tetteh, D. K. Dodoo, R. Appiah-Opong, I. Tuffour, J. Inorg.
Chem., 2014, 1-7.[126] S. Tachakittirungrod, S. Okonogi, S. Chowwanapoon-pohn,
Food Chem., 2007, 103, 381-388.[127] D. L. Madhavi, S. S. Deshpande, D. K. Salunkhe, Food Antiox-
idants: Technological, Toxicological, Health Perspective, Mar-cel Dekker, New York, 1996.
C. R. Chimie, 2020, 23, n 2, 127-142