![A multiphase nickel iron sulfide hybrid electrode for ...sites [24]. For instance, NiFe selenide [25], Ni 3 S 2 [26], NiFeS 2 [27] derived oxyhydroxide catalysts show over- potentials](https://static.fdocuments.in/doc/165x107/5fe6f6423505540d59173c69/a-multiphase-nickel-iron-sulfide-hybrid-electrode-for-sites-24-for-instance.jpg)
Pt Nanophase supported catalysts and electrode systems for ...
423
Pt Nanophase supported catalysts and electrode systems for water electrolysis Leslie Felicia Petrik A thesis submitted in fulfilment of the requirements for the degree of Doctorate in Chemistry in the Department of Chemistry, University of the Western Cape. Supervisor: Professor Emmanuel I. Iwuoha May 2008
Transcript of Pt Nanophase supported catalysts and electrode systems for ...

Pt Nanophase supported catalysts and electrode systems
for water electrolysis
Leslie Felicia Petrik
A thesis submitted in fulfilment of the requirements for the degree of
Doctorate in Chemistry
in the
Department of Chemistry,
University of the Western Cape.
Supervisor: Professor Emmanuel I. Iwuoha May 2008

ii
KEYWORDS
Mesoporous support
Catalyst dispersion
Nanophase electro catalyst
Cathode
Anode
Electrolysis
Proton conductivity
Membrane Electrode Assembly
Hydrogen production
Solid Polymer Electrolyte Electrolyzer

iii
ABSTRACT
____________________________________________________________________
Pt Nanophase supported catalysts and electrode systems for water electrolysis
L.F. Petrik
PhD Thesis
Department of Chemistry
University of the Western Cape
In this study novel composite electrodes were developed, in which the catalytic
components were deposited in nanoparticulate form. The efficiency of the nanophase
catalysts and membrane electrodes were tested in an important electrocatalytic
process, namely hydrogen production by water electrolysis, for renewable energy
systems. The activity of electrocatalytic nanostructured electrodes for hydrogen
production by water electrolysis were compared with that of more conventional
electrodes. Development of the methodology of preparing nanophase materials in a
rapid, efficient and simple manner was investigated for potential application at
industrial scale. Comparisons with industry standards were performed and electrodes
with incorporated nanophases were characterized and evaluated for activity and
durability.
A CVD technique using LPG as a carbon source, pyrolized upon a mesoporous Si
matrix, HMS, produced nanostructured ordered mesoporous carbon (OMC) with
graphitic character after removing the Si matrix. This OMC is useful as a conductive
three dimensional porous support for catalytic nanophase Pt metals. Processes to
incorporate active nanophase Pt metal electro catalysts into microporous FAU, and
mesoporous HMS or MCM-41 supports were developed. The influence of the nature
and porosity of the catalyst support upon activity for hydrogen production by water
electrolysis was demonstrated with Pt FAU< PtHMS=PtMCM-41.

iv
Methods for preparing active nanophase Pt electro catalysts on CNT or CNT paper
substrates were developed. Deposition of Pt on CNT paper by a simple galvanic
displacement technique formed a new, highly conductive and active Pt containing gas
diffusion electrode, eliminating the extensive processing required to prepare
composite gas diffusion electrodes (GDE). It was found that the reduction potential
of the sacrificial anode (Al, Fe, Pb foils) did not correlate with Pt deposition rate but
bimetallic systems were controlled by deposition time. The new electro catalysts were
compared to an industry standard commercial Pt catalyst stabilized on Vulcan carbon
black for electro activity and the overpotential of hydrogen evolution occurred at
similar or lower overpotential than the commercial electrocatalyst.
The sequential deposition method was developed to incorporate 3-dimensional
supported nanophase catalytic materials, Pt-FAU, Au–HMS, Pt- HMS and Pt MCM-
41 into composite GDE, and it was shown that such electrodes could achieve current
densities of ~650mA cm-2 at 60 °C and an applied potential of -2 V in an alkaline
electrolyzer and electrodes were durable. It was found that nanophase Sb/SnO, a non
noble metal oxide nano particulate could also be applied as electrocatalyst for
hydrogen production.
Optimization of the catalyst-containing ink formulation and ink deposition by
screenprinting produced homogeneous and well dispersed layers of 0.001 - 0.0015 g
cm-2 of electrocatalyst per unit area of substrate. The morphology of the
screenprinted film was strongly affected by the ink formulation. Reversible
viscoelastic behaviour of inks correlated with good print quality, which also was
affected by the polarity and viscosity of the solvent, the printed layer thickness, and
the nature as well as the surface energy of the substrate. Hence, no matter how active
the electrocatalyst, if the catalyst containing film on the GDE substrate is
substandard, resistance will be high and electroactivity low.
A paper substrate method was developed to evaluate the electronic characteristics of
catalyst containing films separately from the GDL substrate using Variable Field Hall

v
measurements. It was found that improving the film morphology reduced the positive
Sheet Hall Coefficient significantly and promoted n-type rather than p-type carriers.
On the contrary, n-type carrier CNT paper with low resistance and high carrier
density switched to a p-type carrier upon deposition of Pt by galvanic displacement.
Technological improvement of membrane electrode assemblies applicable in a solid
polymer electrolyte electrolyzer showed that Bekinit Titanium fibre substrate was the
most promising anodic GDL catalyst support, and hydrophilic Lydall carbon cloth
(6100-300 and 6100-200) was suitable as cathode GDL. A cathode loading of 1 mg
cm-2 Pt/C and anode loading of 6 mg cm-2 IrO2 was found to be the optimum catalyst
loading using commercial catalysts. The Nafion®115 membrane proved to be the best
ionomer membrane. High output (current density of 1.33 A cm-2 at 97 oC and -1.7 V)
was realized when system parameters such as operational temperature, water flow
rate, moisturization time, current collector clamping pressure, insulation and low
resistance electrical leads were optimized.
May, 2008

vi
DECLARATION
____________________________________________________________________
“ I declare that “Pt Nanophase supported catalysts and electrode systems for water
electrolysis” is my own work, that it has not been submitted for any degree or
examination in any other university and that all the sources I have used or quoted
have been indicated and acknowledged by means of complete references”.
Full name _____________________ Date ______________
Signed:

vii
ACKNOWLEDGEMENTS
___________________________________________________
My deepest gratitude goes to God for carrying me through this time and to my family
for supporting me in my studies. I would like to thank the NRF and ESKOM for
financial support and for promoting this research direction. I would like to sincerely
thank my supervisor, Prof. E.I Iwuoha, for his assistance and guidance of my research
as well as the SensorLab post docs and students, especially Tesfayo Taddesse Waryo
and Amir Al-Ahmed. I would like to thank Prof. Margit Härting, Prof. David Britton
and Girma Goro Gonfa of the Physics Department at the University of Cape Town for
their useful advice on electrode materials and Hall measurements; Dr Veruscha Fester
of the Flow Process Centre at CPUT for advice in Rheological measurements; Prof
Dirk Knoesen, Basil Julies and Adrian Josephs of the Physics Department at
University of the Western Cape for advice and assistance with EDS, HRTEM and
SEM micrographs; Miranda Waldron and Mohammed Jafta at UCT for assistance
with TEM micrographs; Dr Remi Bucher at the XRD facilities and Dr Carlos Pineda
for assistance with PIXE analysis at iThembaLABS. My heartfelt thanks particularly
to Thotyelwa Zondani, Japhet Ali, Ziboneni Godongwane, Tankiso Thamahane,
Mario Williams and Qiling Ying for the assistance they gave me with many different
tasks in the laboratory. Many thanks also to Dr Alexander Nechaev for his advice and
support. I gratefully acknowledge the Chemistry Department at the University of the
Western Cape for their support during my PhD programme and the technical staff of
the Chemistry Department who assisted with instrumental analysis, especially to
Timmy Lesch for technical expertise and Andile Mantyi for assisting with providing
necessary equipment and supplies. I acknowledge the South African Institute for
Advanced Materials Chemistry for support and Cedric Achilles, Vincent Starkey and
the secondary works technical and electronic workshop staff for their assistance in
manufacturing various reactors, devices and repairing instruments.

viii
TABLE OF CONTENTS
___________________________________________________
Title page i
Keywords ii
Abstract iii
Declaration vi
Acknowledgements vii
Table of contents viii
List of Tables xii
List of Figures xiv
Abbreviations xx
List of symbols xxiii
1. INTRODUCTION AND OVERVIEW ........................................................................... 1 1.1 Dissertation Topic And Main Perspective ..................................................................... 1 1.2. Rationale And Motivation ............................................................................................ 3 1.3. Research Approach ....................................................................................................... 6 1.4. Scope Of Study ............................................................................................................. 7 1.5. Delimitation Of Study .................................................................................................. 8 1.6. Research Design And Refinement Of Approach .......................................................... 9 1.7. Research Hypothesis ................................................................................................... 11 1.8. Main Perspective From Which The Topic Was Researched ...................................... 12 1.9. Methodology ............................................................................................................... 12 1.10. Structure Of Thesis ................................................................................................... 14 2. LITERATURE REVIEW .............................................................................................. 17 2.1 Background .................................................................................................................. 17 2.2 Global Perspective ....................................................................................................... 19 2.3 South African Perspective ........................................................................................... 22 2.4 The Hydrogen Economy .............................................................................................. 25 2.5 Nanotechnology ........................................................................................................... 33 2.6 Hydrogen Production ................................................................................................... 36 2.7 Water Electrolysis ........................................................................................................ 40 3 NANOPHASE SUBSTRATES AND SUPPORTS FOR ELECTRO-CATALYSTS ... 52 3.1 Introduction ................................................................................................................. 52 3.2 Overview Of Support Substrates ................................................................................. 52 3.2.1 Microporous Supports: Zeolites ............................................................................... 53

ix
3.2.2 Mesoporous Materials .............................................................................................. 56 3.3 Experimental ............................................................................................................... 59 3.3.1 Preparation Of The Microporous Zeolite Support ................................................... 59 3.3.2 Preparation Of The Mesoporous Silica Template .................................................... 59 3.3.3 Preparation Of The Ordered Mesoporous Carbon (OMC) ...................................... 60 3.3.4 Preparation Of The Carbon Nanotubes .................................................................... 61 3.3.5 Characterization ....................................................................................................... 61 3.4 Results And Discussion .............................................................................................. 65 3.4.1 Characteristics Of Zeolite FAU ............................................................................... 65 3.4.2 Characteristics Of Mesoporous Substrates .............................................................. 70 3.5 Conclusions ................................................................................................................. 82 4 PREPARATION AND CHARACTERIZATION OF ELECTRO CATALYSTS
SUPPORTED ON CNT .............................................................................................. 84 4.1 Overview Of Catalyst Preparation Conditions ........................................................... 84 4.2 Characterization Of Electro Catalysts ......................................................................... 89 4.3 Electrochemistry Background ..................................................................................... 90 4.4 Experimental ............................................................................................................... 95 4.4.1. Materials ................................................................................................................. 95 4.4.1.1 Benchmark Catalyst .............................................................................................. 96 4.4.1.2 Carbon Nanotubes ................................................................................................. 96 4.4.1.3 CNT-Supported Pt Electro Catalysts .................................................................... 96 4.4.2. Characterization ...................................................................................................... 99 4.5 Results ....................................................................................................................... 102 4.5.1 Characterization Of Electro Catalysts .................................................................... 102 4.5.1.1 CNT Paper .......................................................................................................... 102 4.5.1.2 Characterization Of Pt Electro Catalysts ............................................................ 103 4.5.1.3 Characteristics Of Electro Catalysts: Galvanic Displacement Technique .......... 109 4.5.1.4 Catalytic Activity Of Prepared and Commercial Materials…………………….115 4.6 Conclusions ............................................................................................................... 130 5 NANOPHASE COMPOSITE ELECTRODES ........................................................... 131 5.1 Introduction ............................................................................................................... 131 5.2 Background ............................................................................................................... 133 5.3 Composite Electrode Fabrication Methods ............................................................... 137 5.4 Approach In Formation Of Composite Electrodes ................................................... 144 5.5 Characterization Of Composite Electrodes ............................................................... 145 5.6 Experimental: Materials And Methods ..................................................................... 147 5.6.1 Materials ................................................................................................................ 147 5.6.2 Methods .................................................................................................................. 151 5.6.3 Supporting Procedure ............................................................................................. 153 5.6.4. Electrochemical Testing ........................................................................................ 158 5.7 Results And Discussion ............................................................................................ 160 5.7.1 Electro Activity Of Composite Electrodes: Baseline Studies ................................ 162 5.7.2 Electro Activity of composite electrodes: Effect of Supporting Procedures ......... 167 5.8 Conclusions ............................................................................................................... 183

x
6. DEVELOPMENT OF GAS DIFFUSION ELECTRODES BY SCREEN PRINTING OF CATALYTIC INKS ............................................................................................ 187
6.1 Introduction ............................................................................................................... 187 6.2 Overview ................................................................................................................... 189 6.2.1 Approaches To Preparing Gas Diffusion Electrodes .............................................. 191 6.2.2 Differences Between Fuel Cells And Electrolyzers ............................................... 194 6.2.3 Requirements Of Gas Diffusion Electrodes ........................................................... 195 6.2.4 Screenprinting ......................................................................................................... 198 6.2.5 Other Applications Of Screenprinted Electrodes ................................................... 201 6.2.6 Ink Formulations ..................................................................................................... 202 6.2.7 Surface Tension, Viscosity And Rheology ............................................................. 204 6.2.8 Characterization: Hall Measurements .................................................................... 207 6.2.9 Resistivity And Hall Effects ................................................................................... 209 6.3 Materials And Methods ............................................................................................. 211 6.3.1 Ink Preparation ....................................................................................................... 211 6.3.2 Screen Printing Experimental ................................................................................. 213 6.3.3 Hall Measurement Experimental ............................................................................ 214 6.3.4 Experimental: Rheology Of Inks ............................................................................ 217 6.4 Screen Printing Results .............................................................................................. 217 6.5 Electronic Characteristics Of Films ........................................................................... 233 6.5.1 Results And Discussion: Resistivity Characteristics .............................................. 233 6.5.2 Results And Discussion: IV Curve Measurement ................................................. 241 6.5.3 Results And Discussion: Variable Field Measurements ......................................... 250 6.6 Rheological Characteristics Of Inks .......................................................................... 269 6.7 Conclusions ............................................................................................................... 275 7. MEMBRANE ELECTRODE ASSEMBLIES FOR SPE ELECTROLYZERS.......... 279 7.1 Introduction ............................................................................................................... 279 7.2 Overview Of SPE Electrolyzer Systems ................................................................... 280 7.2.1 Electro Catalysts ..................................................................................................... 282 7.2.2 Choice Of Gas Diffusion Layers ............................................................................ 288 7.2.3 Ionomer Content In Electrodes ............................................................................... 290 7.2.4 Choice Of Solid Polymer Electrolyte Membrane ................................................... 291 7.2.5 Assembly Of The Membrane Electrode Assembly ................................................ 294 7.2.5 Challenges In The Enhancement Of MEA Output ................................................. 296 7.2.6 The Working Cell ................................................................................................... 299 7.3 Experimental: Membrane Electrode Assemblies For SPE Systems .......................... 300 7.3.1 Chemicals ............................................................................................................... 300 7.3.2 Components ............................................................................................................ 300 7.3.3 Methods .................................................................................................................. 302 7.4 Results And Discussions ........................................................................................... 310 7.4.1 Characterization Of Components ........................................................................... 310 7.4.2 Characteristics Of Macroporous Conductive Supports .......................................... 313 7.4.3 Characteristics Of Ink Formulations ....................................................................... 315 7.4.4 Characteristics Of Electrodes ................................................................................. 316 7.4.5 Characterization Of Homogeneity And Reproducibility Of Electrodes ................. 319 7.4.6 Conclusions On Characterization Of Electrodes .................................................... 324

xi
7.5 Optimization Of SPE Electrolyzer ............................................................................ 325 7.5.1 Components, Design And Configuration ............................................................... 326 7.6 Conclusions ............................................................................................................... 359 8. OVERALL CONCLUSIONS ..................................................................................... 362 8.1 Summary Of Findings ............................................................................................... 362 8.2 Conclusions ............................................................................................................... 366 8.3 Summary Of Contributions ....................................................................................... 367 8.4 Recommendations And Future Research .................................................................. 370 8. 5 Citations ................................................................................................................... 372 9. REFERENCES ........................................................................................................... 373

xii
LIST OF TABLES
____________________________________________________________________
Table 2.1 Summary of patents 50 Table 3.1 FTIR spectra for Silicate assignment 68 Table 3.2 Resistance measurements of CNT paper 69 Table 4.1 Details of redox couple samples prepared using CNT and different foils 98 Table 4.2 Composition of paste electrodes 101 Table 4.3. Comparison of hydrogen evolution over different electro catalysts 125 Table 5.1 Approximate exchange current density (i0) for the hydrogen oxidation
reaction on different metals at 25 ºC 141
Table 5.2 Types of binder or conductive phase 147 Table 5.3 Types of support substrates 148 Table 5.4 Ink formulations using JM Pt40/C catalyst 163 Table 5.5. Mass % increase of dip coated and sponge coated substrates 167 Table 5.6. Casting method using ink with 10% Polystyrene binder (B) + 90%
Carbon black in 10 mL of toluene as solvent on various supports 170
Table 5.7 Casting method using ink with 50% Polystyrene binder (B) + 25% Carbon Black + 25% SbSnO with solvent toluene (20 mL)
170
Table 5.8 Hot pressing method with 50% PTFE binder (C) + 50% Carbon Black as conductive phase upon a ceramic based (e) support
171
Table 5.9 Hot pressing method with 50% PTFE (C) binder + 50% Carbon Black as conductive phase upon a Teflon based (g) support
172
Table 5.10 Hot pressing at elevated temperature with 50% PTFE (C) + 50% Carbon Black as conductive phase upon a Teflon support (g)
172
Table 5.11 Hot pressing at elevated temperature with 50% PTFE, 25% C/ black and 25% Sb/SnO nanophase catalyst on a Teflon support (g)
172
Table 5.12 Spraycoating method with 60% Nafion® (5% in water) binder (N)+ 40% Carbon Black on various supports
174
Table 5.13 Spraycoating with 60% Nafion® (5% in water) binder (N) + 20% Carbon Black + 20% SbSnO on various supports
175
Table 5.14 Spraycoating with 60% Nafion® (5% in water) binder (N) + 20% Carbon Black + 20% Pt –FAU zeolite on various supports
176
Table 5.15. Spraycoating method with 60% Nafion® (5% in water) binder (N) + 20% Carbon Black + 20% Ni-gamma – alumina on various supports.
176
Table 5.16. Spraycoating with 50% Polystyrene binder (B) + 25% Carbon Black and 25% Pt-FAU in toluene
179
Table 5.17 Ink formulation for preparation of thin films containing electro catalysts 180 Table 6.1 Ink compositions 212 Table 6.2 Molar ratio of dispersants H20: 1,2 Propandiol 213 Table 6.3 Liquid to solid ratio and solvent to water ratios of ink formulations 217 Table 6.4 Mass % increase of substrate before and after printing 218 Table 6.5 Resistance of screenprinted samples 234 Table 6.6 Resistance as a function of loading of electro catalyst upon substrates 236

xiii
Table 6.7 Average Sheet Hall Coefficient (cm² C-1) 260 Table 6.8 Viscoelastic crossover points (G' vs G'') and viscosity of ink formulatons 274 Table 7.1 Ink formulations 304 Table 7.2 Recommended commercial hotpressing conditions 305 Table 7.3 Summary of different membrane electrode assembly (MEA) components 325 Table 7.4 Ink formulation for MEA series 2,3 and 4 329 Table 7.5 Ink formulation for MEA series 5 and 6 329 Table 7.6 Catalyst loading on on 5 cm2 for MEA 6 , 7 and 8 330 Table 7.7 Ink formulation used for MEA 13 to 17 334 Table 7.8 Ink formulation used for MEA 9 336 Table 7.9 Current density over time for MEA 9 with IrO2 anode at different
temperatures 337
Table 7.10 Ink formulation for MEA 28 and 29 338 Table 7.11 Ink formulation for MEA 42 341 Table 7.12 Ink Composition for MEA 26 342 Table 7.13 Ink Composition for MEA 25 344 Table 7.14 Ink formulation for MEA 51 348 Table 7.15 Ink formulation for MEA55 350 Table 7.16 Ink formulation for MEA 63, 64 and 65 353 Table 7.17 Nafion® 117 compared with Nafion®115 at -1.7 V; Flow 4.2 mLs-1 357

xiv
LIST OF FIGURES ____________________________________________________________________ Figure 1.1 Schematic overview of scope of dissertation 10 Figure 2.1 Schematic of Hydrogen Economy infrastructure (Kato et al., 2005). 18 Figure 3.1 Schematic of unit cell structure of zeolite FAU (IZA_online, 2008). 54 Figure 3.2 HRTEM of zeolite FAU and general crystal structure (Inset SAED) 65 Figure 3.3 HRTEM image of FAU with pore orientation 66 Figure 3.4 Analysis of pore size of zeolite FAU 66 Figure 3.5 X-Ray analysis (EDS) of composition of zeolite FAU 67 Figure 3.6 XRD of commercial FAU (CBV400) 67 Figure 3.7 Thermal analysis of zeolite FAU 68 Figure 3.8 FTIR spectrum of FAU 69 Figure 3.9 STEM/ESB and HRTEM images of mesoporous substrates 71 Figure 3.10 XRD of HMS, HMS in-filled with carbon and OMC analogue 72 Figure 3.11 Low angle XRD of HMS and OMC analogue (inset SAED of OMC) 73 Figure 3.12 The N2 adsorption/desorption at -196 ºC of the HMS, HMS in-filled with
carbon and the OMC 75
Figure 3.13 Nitrogen adsorption-desorption isotherm of MCM-41 76 Figure 3.14 Pore distribution of MCM-41 77 Figure 3.15 XRD spectra of CNT samples prepared using toluene or benzene 78 Figure 3.16 HRTEM images of acid washed CNT prepared by ferrocene-toluene
method 79
Figure 3.17 X-ray analysis (EDS) of CNT 80 Figure 3.18 Thermal analysis of CNT 80 Figure 3.19 SEM of CNT processed into a CNT paper 81 Figure 4.1 Schematic illustration of metal nanoparticle deposition on carbon
nanotubes 89
Figure 4.2 SEM micrograph of CNT paper gas diffusion layer 103 Figure 4.3 SEM micrograph of Carbon cloth gas diffusion layer 103 Figure 4.4 Comparison of XRD spectra of Carbon black (Vulcan XC-72) with JM
Pt40/C 104
Figure 4.5 XRD spectra of Pt/CNT (propanol) 105 Figure 4.6. Transmission electron micrographs of (a) carbon black (Vulcan XC-72) and (b)JM Pt40/C
106
Figure 4.7 ESB image of JM Pt40/C with EDS analysis (inset) 107 Figure 4.8. ESB image of Pt/CNT (propanol) 108 Figure 4.9. STEM imaging of Pt/CNT (propanol) 109 Figure 4.10 Galvanic displacement deposition of Pt (8 h) using stainless steel 110 Figure 4.11: Mass % increase of CNT paper after Pt deposition over 10 and 20min 111 Figure 4.12: Atom % increase of CNT paper after Pt deposition over 10 and 20min 111 Figure 4.13 Atom % of bimetallic deposits on CNT 112 Figure 4.14. SEM micrographs of CNT paper with Pt deposition 113 Figure 4.15 Cyclic voltammogram of commercial JM Pt40/C catalyst 116 Figure 4.16 CV of ultrapure graphite diluent (scan rate between 10-50 mV s-1) 117 Figure 4.17 CV of impure graphite diluent (scan rate 10 mV s-1) 118

xv
Figure 4.18 JM Pt40/C scanned between 50 and 5 mV s-1; 118 Figure 4.19 CV of JM Pt40/C scanned between 50 (JM01-2) and 500 mV s-1 (JM01-
10); 120
Figure 4.20 Square wave voltammetry of JM Pt40/C commercial catalyst 121 Figure 4.21 Comparison between Graphite, Graphite/CNT blend and Graphite
Pt/CNT (propanol) 122
Figure 4.22 Comparison of JM Pt40/C with Pt/CNT (propanol) electro catalysts . 123 Figure 4.23 Cyclic voltametry of Pt/CNT (propanol) 124 Figure 4.24 Pt/CNT Samples prepared for 10 min using Al, Pb or Fe foils 126 Figure 4.25 Pt/CNT Samples prepared for 20 min using Al, Pb or Fe foils 127 Figure 4.26 Cyclic voltammetry of Pt/CNT_BP series of electro catalysts 128 Figure 5.1 Block diagram of the sequential deposition procedure 151 Figure 5.2 Water electrolysis in a high electrolyte environment 159 Figure 5.3 TEM micrograph of Sb/SnO commercial nanoparticles 161 Figure 5.4 TEM micrograph of Pt HMS LPG carbonized 161 Figure 5.5 TEM micrograph of Pt MCM-41 LPG carbonized 161 Figure 5.6 TEM micrograph of Au HMS 161 Figure 5.7 Baseline study of composite electrodes prepared with commercial JM
Pt40/C catalyst 164
Figure 5.8 Electrochemical activity of blank supports b-g 165 Figure 5.9 Electrochemical activity of various types of Ni metal foam 165 Figure 5.10. Composite electrodes prepared by dipcoating 165 Figure 5.11. Composite electrodes prepared by sponge coating 168 Figure 5.12 Composites cast with 50% Polystyrene binder, 50 % carbon black in
toluene 170
Figure 5.13 Composites cast with 50% Polystyrene binder, 25% Sb/SnO 25% carbon black in toluene
170
Figure 5.14 Comparison of electrochemical activity by hot pressing PTFE, carbon black and Sb/SnO on support (g)*
173
Figure 5.15 Electrochemical activity of composites formed with Nafion® binder and carbon black spraycoated on supports a-f, without additional catalyst
174
Figure 5.16 Composite electrodes spraycoated with Nafion® binder, carbon black and either nanophase Sb/SnO, Ni-alumina or Pt-FAU upon on carbon based support (a)
177
Figure 5.17 Composite electrodes spraycoated with Nafion® binder, carbon black, and either Nanophase Sb/SnO, Ni-alumina or Pt-FAU on carbon cloth support
177
Figure 5.18 Composite electrodes spraycoated with Nafion® binder, carbon black, and Nanophase Sb/SnO, Ni-alumina or Pt-FAU on carbon cloth
177
Figure 5.19 Composite electrodes spraycoated with Nafion® binder, carbon black, and Nanophase Sb/SnO, Ni-alumina or Pt-FAU on ZrO2/SS support
177
Figure 5.20 Comparison of activity of nanophase composites spraycoated with Nafion® binder and carbon black and Sb/SnO, Ni-alumina or Pt-FAU upon on ceramic support
178
Figure 5.21 Comparison of activity of nanophase composites spraycoated with Nafion® binder and carbon black and Sb/SnO, Ni-alumina or Pt-FAU upon on ceramic support
178

xvi
Figure 5.22 Composites spraycoated with 50% Polystyrene binder, 25% Pt FAU and 25% carbon black in toluene
179
Figure 5.23 Composite electrodes spraycoated with Nafion® binder, carbon black, and either Au-HMS, Pt MCM or Pt HMS supported nanophases on carbon cloth support
180
Figure 5.24 Electroactivity of Pt on HMS 181 Figure 5.25 Electroactivity of Nanophase SnO 181 Figure 5.26 Replication study of Pt HMS containing composite electrodes 182 Figure 6.1 General form of the flow curve (or rheogram) - linear axes 205 Figure 6.2 General form of the flow curve (or rheogram) - logarithmic axes 206 Figure 6.3 General form of the viscosity diagram for the rheological models on
logarithmic axes 206
Figure 6.4 Hall effect in a thin flat conductor 210 Figure 6.5 Electrode preparation for sample mounting 215 Figure 6.6 Lakeshore 7704 HMS Matrix Hall measurement system 216 Figure 6.7 Mass (g) increase of the substrate after each successive overlayer for
print series LP04 and LP05. 219
Figure 6.8 Mass % increase of electrodes for electrodes after each successive deposition over 4 cm-2
219
Figure 6.9 Series LP01 print run-1 219 Figure 6.10 Optical microscopy of LP01 series 221 Figure 6.11 Replicability of overprinting 222 Figure 6.12 Optical microscopy of series LP02 224 Figure 6.13 Optical microscopy images of LP03 series 225 Figure 6.14 Optical microscopy images of LP04 series 227 Figure 6.15 LP04-3 SEM image at 3K 228 Figure 6.16 Optical microscopy images of Series LP05 229 Figure 6.17 LP05-3: SEM image at 2K of Series LP05 230 Figure 6.18 Optical microscopy images of Series LP06 231 Figure 6.19 LP06-2 SEM image at 3K 232 Figure 6.20 “Fullerenes” as supplied by Aldrich 232 Figure 6.21 LP07-1 Electrode screen printed on silver contact 232 Figure 6.22 Averaged resistance as a function of number of layers of ink for each
series printed on paper 235
Figure 6.23 Correlation between resistance and grams loaded for LP05 series 236 Figure 6.24 Average resistance of samples prepared with Nafion® as substrate 239 Figure 6.25 IV curves of series LP02 242 Figure 6.26 IV curves of series LP03 242 Figure 6.27 IV curves for series LP04 243 Figure 6.28 IV curves for series LP05 printed on paper 244 Figure 6.29 IV curves for LP05-Nafion 244 Figure 6.30 IV curves for LP06 series 245 Figure 6.31 Comparison of IV curves for film samples prepared upon paper
substrate. 246
Figure 6.32 IV curves for samples prepared on a Nafion substrate 247 Figure 6.33 IV curves for samples prepared by spraycoating on a carbon cloth
substrate 248

xvii
Figure 6.34 IV curves for the CNT paper and CNT paper + Pt 248 Figure 6.35 Equivalent circuit of printed electrode 249 Figure 6.36 Sheet resistivity of LP02-4 (3 runs) compared to blank substrates 250 Figure 6.37 Sheet Resistivity of series LP03 251 Figure 6.38 Sheet Resistivity of series LP04 252 Figure 6.39 Sheet resistivity of series LP05 252 Figure 6.40 Sheet resistivity of series LP06 253 Figure 6.41 Sheet resistivity of sample prepared on carbon cloth (Lydall 6100-300) 253 Figure 6.42 Sheet resistivity of CNT paper compared to CNT paper + Pt 254 Figure 6.43 Sheet carrier density of LP02-4 (3 runs) 255 Figure 6.44 Sheet Carrier Density of Series LP03 255 Figure 6.45 Sheet Carrier Density of Series LP04 256 Figure 6.46 Sheet Carrier Density of Series LP05 257 Figure 6.47 Sheet Carrier Density for Series LP06 257 Figure 6.48 Sheet carrier density of sample prepared using carbon cloth as substrate 258 Figure 6.49 Sheet carrier density for CNT paper and CNT paper + Pt 258 Figure 6.50 The decreasing trend in p-type carriers for LP04 series 261 Figure 6.51 The Sheet Hall Coefficients of samples with n-type carriers 261 Figure 6.52 Hall mobility of LP02-4 (3 runs) 263 Figure 6.53 Hall Mobility of Series LP03 263 Figure 6.54 Hall Mobility of Series LP04 264 Figure 6.55 Hall Mobility of Series LP05 264 Figure 6.56 Hall Mobility of Series LP06 265 Figure 6.57 Hall mobility of samples screenprinted on Nafion® substrate compared 266 Figure 6.58 Sheet resistivity of samples screenprinted on Nafion® substrate
compared 266
Figure 6.59 Sheet carrier density of samples screenprinted on Nafion® substrate compared
267
Figure 6.60 Hall mobility of Carbon cloth based samples 268 Figure 6.61 Hall mobility of CNT based samples 268 Figure 6.62 Viscosity of screenprinting formulations compared to a standard Pt ink 270 Figure 6.63 Comparison of the shear stress (τ) vs shear rate (γ) curves of ink samples 271 Figure 6.64 Viscoelastic behaviour of inks: elastic modulus (G') as a function of
shear stress (τ) 272
Figure 6.65 Storage modulus (G') plotted vs strain for ink samples LP0 1 and LP0 11 273 Figure 7.1 Schematic of membrane electrode assembly for the SPE electrolyzer 281 Figure 7.2 Schematic representation of PEM water electrolyzer and a fuel cell 282 Figure 7.3 General structure of a Nafion® membrane 293 Figure 7.4 Schematic assembly of the SPE electrolyzer 306 Figure 7.5 Laboratory scale set up and SPE testing module 307 Figure 7.6 Schematic process flow diagram for assembling and testing the MEA 308 Figure 7.7 SEM micrographs of Iridium catalysts 310 Figure 7.8 XRD spectrum of (a) commercial JM IrO2 (b) HM IrO2 pyrolysed at
450 ºC and annealed at 550 ºC 311
Figure 7.9 TGA of HM IrO2 312 Figure 7.10 Types of carbon cloth support taken at 300 magnifications, by Scanning
Electron Microscope (SEM) 313

xviii
Figure 7.11 SEM micrographs of GDL substrates 314 Figure 7.12 Particle size distribution for the typical JM Pt40/C ink formulation 315 Figure 7.13 SEM of Ir Black on carbon cloth anode 317 Figure 7.14 SEM of IrO2 on carbon cloth anode 317 Figure 7.15 Optical microscopy of typical composite electrode JM Pt40/C on carbon
cloth 317
Figure 7.16 Ink coated by brushing Pt ink on cathode MEA 59 on GDL Lydall Carbon Cloth 6100-300
317
Figure 7.17 Anode based upon Bekinit St Ti 20 300 66; ink brush coated (IrO2 MEA 59)
318
Figure 7.18 Anode based upon Bekinit St Ti 20 300 66; ink spraycoated (with 6 mg IrO2)
318
Figure 7.19 Pt cathode based on GDL Lydall Carbon 318 Figure 7.20 Pt cathode on GDL Lydall Carbon Cloth 6100-300; ink spray coated
with higher loading of catalyst 318
Figure 7.21 Elemental distribution map of Pt (A) and Ir (B) on carbon cloth electrodes calculated by Dynamic Analysis method of mapping from micro-PIXE data
320
Figure 7.22 PIXE spectra of (a) Pt cathode and (b) Ir anode 320 Figure 7.23 SECM Imaging of activity of Pt40/C electrode towards HER in 5 mM
H2SO4 electrolyte solution 322
Figure 7.24 JM Pt40/C on carbon cloth 322 Figure 7.25 Pt HMS (carbonized) on Bekinit substrate 322 Figure 7.26 Elemental distribution map of Pt (a) and Ti (b) in titanium substrate
GDL electrodes containing a film of supported Pt HMS (carbonized) catalyst
323
Figure 7.27 PIXE spectra of HMS/Pt/LPG catalyst on titanium substrate 324 Figure 7.28 Chrono amperometry cycle used to test MEA activity for H2 production 328 Figure 7.29 MEA output using Toray PTFE or Lydall 6100-200 carbon paper at 25
ºC over 5 cm -2 331
Figure 7.30 Effect of MEA moisturization time upon overall cell resistance 332 Figure 7.31 Effect of catalyst loading on current density 333 Figure 7.32 Replication study of steady state current density output at -1.7 V of
MEA 13 to 17 335
Figure 7.33: Current density trend over time after 24 h (-1.8 V) and after 48 h (-1.75 V) for MEA 13
335
Figure 7.34 Output of MEA 9 with HM IrO2 anode catalyst at different temperatures
337
Figure 7.35 Comparison of current density (mA cm-2) of JM IrO2 with JM Ir Black (MEA28 and MEA 29) at 40ºC
339
Figure 7.36 Replication study of current density (mA cm-2) using Ir black as anode catalyst at -1.7V
339
Figure 7.37 Current density (mA cm-2) for MEA 38 prepared with Chinese ionomer membrane GEFC-11N type GEFC-112
340
Figure 7.38 The current density (mA cm-2) of MEA 42 using GEFC-11N type GEFC 117 ionomer
342
Figure 7.39 The effect of the water flow rate on current density (mA cm-2) at 23 ºC 344

xix
for MEA 25 Figure 7.40 Positive correlation between flow rate and current density (mA cm-2) at
applied voltages between -1.6 and -1.8 V 344
Figure 7.41 The effect of increasing temperature at a potential of -1.7 V on current density (mA cm-2) for MEA 25
345
Figure 7.42 Comparison of current density (mA cm-2) of MEA 25 with MEA 28 and 29 at -1.7 V
345
Figure 7.43 Comparison of current densities (mA cm-2) obtained for MEA 31, 32 and 33 using Etek GDL
348
Figure 7.44 Comparison of current densities (mA cm-2) obtained for Etek materials with MEA 25 at low temperatures
348
Figure 7.45 Chrono amperometry of MEA51 at different temperatures; flowrate of water 3.34 mL s-1
349
Figure 7.46 Comparison of current density (mA cm-2) of MEA 51 with replicate MEA52 at 80 ºC
349
Figure 7.47 Inverse correlation between temperature and cell resistance 349 Figure 7.48 Current density (mA cm-2) of MEA 55 with Ti fibre anode and Lydall
6100-300 cathode GDL 349
Figure 7.49 Durability study of HM IrO2 catalyst applied in MEA 55 at -1.7 V 351 Figure 7.50 Replication study of MEA durability at 60 °C and -1.7 V at atmospheric
pressure and water flowrate of 3.17 mL s-1. 351
Figure 7.51 Current density (mA cm-2) of MEA 63 at atmospheric pressure; flow rate 4.2 mL s-1
354
Figure 7.52 Replicate of MEA 63 tested at atmospheric pressure; flow rate 4.2 mL s-
1 354
Figure 7.53: Effect of flow rate on current density for MEA 63 at 1.7 V and 80 °C 355 Figure 7.54 Effect of moisturization time on cell resistance at 80 °C and 1.8 V 356 Figure 7.55 Comparison of current density (mA cm-2) obtained using Nafion 115
(MEA63) instead of Nafion 117 (MEA 64) 357
Figure 7.56 Comparison of overall cell resistance (mΩ) at different temperatures using either Nafion 117 or Nafion 115 as ionomer
357
Figure 7.57 Cell performance using MEA 65 made with Nafion 115 and tested with low and high resistance leads
358

xx
LIST OF ABBREVIATIONS
ABB ABB company, Switzerland Ltd. High Power Rectifiers
AMTS Advanced Materials Technology Strategy
BET Brunauer-Emmett-Teller
BJH Barrett-Joyner-Halenda
BSE Back scattered electrons
CA Carbon Analogue
CNF nanofibers (s)
CNM Carbon nanostructured materials
CNT carbon nanotubes (s)
CV Cyclic Voltammetry
Cute Clean Urban Transport for Europe
DMFC Direct Methanol Fuel Cell
DOE Department of Energy (USA)
DSA Dimensionally stable anodes
DST Department of Science and Technology
DTI Department of Trade and Industry
ESB Electron Spectral Beam
ESKOM Electricity supply commission (SA)
EBSD Electon Back Scattered Diffraction
EDS Energy dispersive spectroscopy
FP6 Framework Programme 6, European Union
Fed-Ex Federal express courier services

xxi
FTIR Fourier Transform Infrared spectroscopy
G Conductance
GDE Gas Diffusion Electrode
GDL Gas Diffusion Layer
GM General Motors
HER Hydrogen Evolution Reaction
HMS Hexagonal Mesoporous Silica
HPPS High-Performance Particle Sizing
HOPG Highly Oriented Pyrolytic Graphite
HRSEM High-Resolution Scanning Electron Microscopy
HUPD Hydrogen Underpotential Deposition
I Current
IJP Inkjet printing
IPHE International Partnership for the Hydrogen Economy
JM Pt/C Commercial Johnson Matthey™ Carbon Black-Supported
Nanophase Platinum
LPG Liquid Petroleum Gas
LPI Lines-per-inch
LSV Linear-Sweep Voltammetry
micro-PIXE Micro-particle induced x-ray emission spectroscopy
MOR Methanol Oxidation Reaction
MEA Membrane electrode assembly
MSI Metal-support interactions
MSE Mercury Sulphate Electrode
MW Molecular weight

xxii
NACI National Advisory Council on Innovation
NASA National Aeronautics and Space Agency (USA)
NH Carrier concentration
NIBS Non-Invasive Beam Scattering
NMP Nuclear microprobe
OER Oxygen Evolution Reaction
OMC Ordered mesoporous carbon
ORR Oxygen Reduction Reaction
PIXE Proton-Induced X-ray Emission Spectroscopy
PEMFC Polymer electrolyte fuel cell
PGM’s Platinum group metals
PSA Pressure swing adsorption
PTFE Polytetrafluoroethylene
Pt/C Carbon Black-Supported Nanophase Platinum
Pt/CNT Carbon Nanotube-Supported Nanophase Platinum
PtRu/C Carbon Black-Supported Nanophase Platinum-Ruthenium
R Resistance (Ω)
RDE Rotating-Disk Electrode
RRDE Rotating Ring Disc Electrode
SAED Selected-Area Electron Diffraction
Sb/SnO Antimony tin oxide
SCE Saturated Calomel Electrode
SECM Scanning Electrochemical Microscopy
SEM Scanning Electron Microscopy

xxiii
SHE Standard Hydrogen Electrode
SOFC Solid Oxide Fuel Cell
SPE Solid polymer electrolyte
SPE-electrolyser Solid-Polymer Electrolyte Electrolyser
SOT Solar thermal energy conversion systems
STPP Solar thermal power plants
STEM Scanning Transmission Electron Microscopy
TEM Transmission Electron Microscopy
TGA Thermogravimetric Analysis
TPR Temperature-Programmed Reduction
UME Ultra-Micro Electrode
URFC Unitized regenerative fuel cell (s)
UPS United Postal Services
V Voltage (Volts)
WE-NET World Energy Network
XRD X-ray Diffractometry

xxiv
LIST OF SYMBOLS
________________________________________________________________
C Charge
B Magnetic field
d Sample thickness
ΔG Change in Gibbs free energy
E potential
E0 Standard potential for the half cell reaction
Eanode Half cell potential for anode reaction
Ecatthode Half cell potential for cathode reaction
F Faraday constant
ρH Hall resistivity
I current
j current density
n Number of mole gas produced
n flow behaviour index
ne number of electrons used per molecule gas
P Pressure
ρH Hall resistivity
Q thermodynamic reaction quotient
R Gas constant
s second
τy yield stress
T Temperature
V Volume
dhkl Inter-planar Spacing
a0 Lattice Parameter
SAPt/C Platinum Metal Surface Area
VH Hall voltage iPA Anodic Peak Current

xxv
iPC Cathodic Peak Current
jPA Anodic Peak Current Density
jPC Cathodic Peak Current Density
EPA Anodic Peak Potential
EPC Cathodic Peak Potential
ΔEP Peak Separation
E0´ Formal Potential
QH+ Charge Associated with a Hydride Monolayer
q Elementary charge (1.602 x 10⁻¹⁹ C)
n Bulk carrier density
µ Hall Mobility
ns Sheet carrier density
RS Film resistance
CHAPTER 1 ____________________________________________________________________
1
1. Introduction and overview
The dissertation addresses supported nanophase electrocatalysts and electrode
systems for the process of water electrolysis. South Africa, the main supplier of PGM
metal, stands to benefit from diversification of Pt containing materials and developed
capabilities in the emerging hydrogen economy. When hydrogen production cost can
be reduced and the output increased, a viable hydrogen economy may be realized.
The purpose of this study was the development of nanophase PGM electrocatalysts
based on high surface area supports and their application in composite gas diffusion
electrodes, for improving the efficiency of hydrogen generation by water electrolysis
through reduction of the overvoltage of electrolyzer systems.
This chapter introduces the dissertation topic and specifies the main perspective, from
which the topic was researched, and the rationale and motivation of the study. The
main research questions and problem statements are set out and the research
framework and the refinement of research are presented. The research approach and
design and the methodology that was used is then described. The scope and
delimitations of the research are presented. The dissertation outline is finally given in
this chapter with an overview of the structure of the dissertation showing how the
dissertation will unfold and describing the main topics of each chapter of the
dissertation. The citations list presented in Chapter 8 gives details of the publications
resulting from this study.
1.1. DISSERTATION TOPIC AND MAIN PERSPECTIVE
Global energy consumption is expected to increase very significantly in the next
decades, driven by rising standards of living and a growing population worldwide.
The increased need for energy will require vast growth in energy generation capacity,
secure and diversified energy sources, and a successful strategy to reduce greenhouse

CHAPTER 1 ____________________________________________________________________
2
gas emissions. Various alternative energy strategies are being considered, and
building an energy infrastructure that uses hydrogen - the third most abundant
element on the earth’s surface - as the primary carrier may enable a secure and clean
energy future (WE-NET report, 1998).
Hydrogen is an attractive energy carrier for its high energy/weight ratio. Hydrogen
can be produced from most energy sources such as thermo chemical processing of
primary energy sources such as coal, natural gas or oil; from renewables such as
methanol or biomass; or by generation via water electrolysis. Electricity can also be
derived from renewable sources such as wind power, or photovoltaic systems, or by
using off peak electricity. Hydrogen as fuel promotes diversification of energy
supply thus ensuring energy security, sustainability, flexibility and efficiency. Energy
supply systems of the future could combine the production of electricity, heat and
hydrogen as a transport fuel with high efficiency. Such systems should be robust,
affordable and environmentally benign (Parfit, 2005).
When hydrogen is generated using renewable energy sources and then used as fuel in
a fuel cell, the energy released during the oxidation of hydrogen can be captured in
the form of electrical energy. Since water is the only reaction product in a fuel cell,
the environmental impact of the energy generating device using hydrogen as fuel is
minimal. This approach to generating electricity, which is part of the hydrogen
economy, is already accepted as a key element in the future demand for electrical
energy, and will be essential for many countries that need to increase or maintain
economic growth but simultaneously need to minimize environmental pollution
(Sørenson et al., 2004).
Water electrolysis as an approach to generating hydrogen for power forms the topic
of this dissertation. Hydrogen production using water electrolysis is still expensive
compared to the other routes mentioned, but as the oil price rises and research
progressively increases the output and reduces the cost of hydrogen production, the
realization of an economically feasible hydrogen economy may be within reach. The

CHAPTER 1 ____________________________________________________________________
3
ultimate aim is a hydrogen-based economy driven by renewable and carbon-neutral
energy sources.
However, cost effective hydrogen production from water remains difficult and
technologies for generating hydrogen from biomass, such as enzymatic
decomposition of sugars, steam-reforming of bio-oils and gasification, suffer from
low hydrogen production rates or complex processing requirements as well as
engender significant environmental costs (Nordstrom, 2002). For instance, in a recent
press release (Stoltenberg, 2008), it was revealed that Secunda, the largest H2
producer via coal gasification in South Africa, is also the largest single point source
CO2 emitter in the southern hemisphere.
In order for South Africa to be internationally competitive in the energy arena, it
needs to be in touch with the emerging technology of the developed countries. For
South Africa to participate as a partner in the new US and worldwide hydrogen
economy development and not become an economic hostage, capability is essential in
the following aspects of a hydrogen economy: hydrogen production; purification and
storage; control systems; infrastructure and delivery; conversion of hydrogen into
useful energy; end use applications; codes and standards; manpower development and
scarce skills; environmental compliance etc..
The topic of the dissertation is focussed exclusively upon hydrogen production by
water electrolysis. The other aspects of the hydrogen economy as mentioned above,
fall outside the scope of this study. This dissertation specifically addresses the
optimization of hydrogen production by water electrolysis using nanophase materials,
as one approach to reduce the cost of hydrogen. The emphasis of the dissertation is on
preparing and incorporating nanophase materials into electrodes for electrolyzer
systems applied in hydrogen production.
1.2. RATIONALE AND MOTIVATION

CHAPTER 1 ____________________________________________________________________
4
Despite significant advancements and commitment of resources by technology
providers, end-users and international governments, projections are that extensive use
of hydrogen as fuel for fuel cell vehicles is ten years away at best. Hydrogen is a high
cost fuel and the price should be reduced for successful commercialization to be
achieved. Most major countries have investment and commercialization strategies
aimed at enabling the development of relevant technologies that will advance the
move to a hydrogen economy.
In the light of huge international R & D spending in the hydrogen economy and also
nanotechnology, the Department of Science and Technology (DST) of South Africa
has recently investigated the necessity of strategic planning and funding in these
areas. The author of this dissertation was closely involved with and co-authored the
development of appropriate strategies for South Africa in these key areas and in
preparing the government commissioned baseline studies (Benson et al., 2005).
It is in this regard that this topic is addressed in the dissertation. The goal of this
effort is a contribution to catalyze the development of South Africa’s capabilities and
roles in this emerging hydrogen economy. Reducing our dependency on imported
hydrocarbon fuels by moving to a fuel such as hydrogen may be of significant
advantage to the South African economy, if hydrogen is prepared from water.
In relation to the key areas specified above, the dissertation specifically addresses the
issue of the development, or application and integration of nanophase electrocatalysts
in electrochemical systems for the production of hydrogen via water electrolysis.
Nanotechnology can be used to reduce noble metal content and thus capital costs, and
also improve efficiency of hydrogen generation systems such as alkaline flow cells as
well as solid state polymer electrolyte membrane (PEM) electrolyzers. This is
possible by, for instance, the development of novel nanophase containing electrode
materials that replace the existing commercially available electrodes or
electrocatalysts which are required for such hydrogen production systems. In the case

CHAPTER 1 ____________________________________________________________________
5
where noble metals and non-noble metal oxides are used as electrocatalysts for
cathodes and anodes, the development of efficient nanosized catalysts are of great
industrial interest. However, many challenges remain before nanomaterials are fully
integrated into viable applications and processes. The relevant fundamental chemistry
for their synthesis and manipulation is still limiting in order to develop technically
feasible materials and devices.
Although nanostructured catalytic materials have received attention from both
theoretical and experimental standpoints, the greatest challenge at present is to find
effective low cost synthesis procedures for specific applications. Simple and reliable
methods for exploration and characterization of the physical-chemical, mechanical
and electrical properties of nanosized particles are required and dependable
evaluation methods of their application in catalysis and zero-emission technologies. It
is important to gain an understanding of the influence of size and microstructure on
the physical, chemical and mechanical properties of nanoparticulates so that new
types of nanosized materials can be developed that will possess enhanced properties.
Furthermore design of the working laboratory modules incorporating nanomaterials
that can be scaled up to industrial applications is necessary. Considering diverse
aspects of assembly for integration into workable units is essential so that it becomes
possible to evaluate requirements for large-scale applications. Comparison with
existing technologies is important for viable applications of nanophase materials in
energy generation, and fuel production. Currently the challenge is to develop
hydrogen generation systems that overcome current price constraints, due to low cell
efficiencies and high cost of components.
All these different aspects should be explored prior to expecting successful
commercialization, and the dissertation addressed aspects of these challenges.

CHAPTER 1 ____________________________________________________________________
6
1.3. RESEARCH APPROACH
Electrochemical hydrogen generation systems include aqueous alkaline flow cells as
well as solid state electrolyzers that are based on reverse fuel cell systems called
Proton Exchange Membrane (PEM) electrolysis units (otherwise known as solid
polymer electrolyte (SPE) electrolyzers), making possible clean hydrogen production
by low conductivity water electrolysis. The main requirements in efficient hydrogen
generation on a large scale are the supporting electrolyte, low cost, stable, large
surface area electrodes, high current densities and product separation from the
electrolyte.
The electrical cost involved in the hydrogen production process is mainly a function
of the cell potential. It is therefore important that research should be focused on
minimization of the required cell potential. This is mainly determined by the
electrode material and the current density. The cell resistance (R) depends on cell
design and on the temperature, type and concentration of the electrolyte. For a
conventional alkaline electrolysis cell the optimum (=minimum) resistance is 0.2 to
0.4 Ohm and cannot be decreased any further unless a solid electrolyte system is
adopted. Electrode development for such systems should optimize the charge transfer
resistance of both anode and cathode which could be achieved by application of
advanced nanophase materials. The electrodes must eventually be integrated with the
nanophase electrocatalyst in such a system. The catalyst may be located on the
electrodes where it is exposed to the electrolyte containing environment or presented
as modified composite nanostructured electrodes in solid polymer electrolyte (SPE)
systems.
In recent years electro membrane reactors such as solid polymer electrolyte (SPE)
based electrolyzer technologies have been developed where composite membranes
are used as supports for nanophase catalytic electrodes. In these reactors the
membrane plays several parts, namely being an electrode, a dosing device and a
separation device. The membrane electrodes possess significant advantages compared

CHAPTER 1 ____________________________________________________________________
7
to conventional electrosynthesis systems namely higher catalytic activity thus lower
overpotential and improved selectivity. However, SPE based electrolyzer
technologies suffer from the high cost of the electrocatalysts and membranes and
non-SPE based electrolyzer technologies have the problem of low efficiency and
disposal of alkaline electrolytes that could cause health hazards. Moreover, the cost
involved in the maintenance and handling of such technologies is considered to be
higher than the SPE-based electrolyzer technologies.
Composite electrodes with multiple layers of different electrolyte materials may
aggravate issues such as high resistivity, insulating interphases, suppression of
interphase reactivity, as each new material introduced into such a composite may
introduce its own set of interface problems. However, use of nano-phase composite
catalytic electrodes in SPE systems may circumvent such disadvantages. Moreover,
novel high surface area nano structured catalytic electrodes may find application for
electrosynthesis. Issues such as the cell design and electrochemical reactions, catalyst
lifetime, reaction kinetics, mass transfer processes, and heat transfer are important in
order to optimize cell performance.
Basic research that leads to innovative design of electrode materials and process
optimization is the only way to overcome the challenges to achieve the hydrogen
economy.
1.4. SCOPE OF STUDY
In this study novel composite electrodes were developed, in which the catalytic
components was deposited in nanoparticulate form. The efficiency of the nanophase
catalysts and membrane electrodes were tested in an important electrocatalytic
process such as hydrogen production by water electrolysis for renewable energy
systems. The activity of electrocatalytic nanostructured electrodes for hydrogen
production by water electrolysis were compared with that of more conventional
electrodes. Development of the methodology of preparing nanophase materials in a

CHAPTER 1 ____________________________________________________________________
8
rapid, efficient and simple manner was investigated for potential future application at
industrial scale. Comparisons with industry standards were performed and electrodes
with incorporated nanophases were evaluated for activity and durability.
The overall aim was the production according to commercially viable techniques of
electrodes incorporating supported nano materials capable of high current densities
with high hydrogen production capacity in comparison to existing technology, with
optimized process applications in suitable reactors.
The scope of the dissertation was thus to develop new routes to prepare nanophase
electrocatalysts and apply nanophase electrocatalysts in composite electrode materials
for electrolyzer systems to achieve high energy efficiency combined with a high
production capacity at a low loading of noble metal catalyst. Methods were
investigated for preparation nanophase electrocatalysts that can be easily upgraded to
industrial conditions for electrocatalytic processes. Nanophase materials were then
incorporated by various means into composite electrodes which were evaluated in
hydrogen production by water electrolysis for stability and durability. Both aqueous
and solid polymer electrolyte environments were evaluated, to obtain an
understanding of the relative contribution of each variable upon the functionality of
the system.
1.5. DELIMITATION OF STUDY
The study was limited to the following activities: Develop and characterize
nanophase electrocatalysts; Improve catalytic ink formulations and methods for their
deposition; Improve and characterize composite catalytic electrodes incorporating
such nanophase electrocatalysts; Demonstrate stability of nanophase composite
electrodes; Apply improved electrodes in electrosynthesis using hydrogen production
as probe reaction; Optimize operational conditions for hydrogen production.
Subsidiary activities aimed to: Improve the three phase interface between catalyst,

CHAPTER 1 ____________________________________________________________________
9
proton conductor and electron conductor; Improve gas diffusion layers; Improve
membrane electrode assemblies.
1.6. RESEARCH DESIGN AND REFINEMENT OF APPROACH
The detailed approach in this study was to:
(1) Develop or apply primary nanophase electrocatalytic materials for the H2
evolution cathode and the O2 evolution anode used in water electrolysis based upon:
(a) nanophase noble metals, (b) nanophase metal oxides.
(2) Find supporting methods to stabilize such nanophases by use of: (a) micro and
mesoporous materials (b) colloidal dispersions (c) physical admixtures with
conductive binders. Various supports suitable as substrates for stabilizing
nanoparticles were explored, including zeolites, conductive mesoporous carbons,
carbon nanotubes, and Vulcan carbon black.
(3) Explore methods for incorporating such nanophase materials into composite
membrane electrodes, including (a) incorporation into catalytic inks (b) incorporation
into gas diffusion layers or onto proton conducting membranes. Different ink
compositions incorporating various nanophase materials, proton and electron
conductive phases, binders and solvents were investigated for suitability for
composite formation on a variety of conductive substrates. Printing technologies such
as screen printing were applied for achieving homogeneous and highly dispersed
nanophases in stable thin films.
(4) Develop composite nanophase electrodes that are (a) active in aqueous or solid
polymer electrolyte systems; (b) that are durable and easily scaled up to industrial
conditions (c) screen materials for activity and durability in high electrolyte systems.
(5) Apply materials containing nanophases in membrane electrode assemblies that are
(a) suitable for operation in prototype electrolyzers at bench scale installations; that
will be tested for (b) for hydrogen production by water electrolysis.
(6) Develop replacement gas diffusion layers applicable to membrane electrode
assemblies.

CHAPTER 1 ____________________________________________________________________
10
(7) Optimize operational parameters in a solid polymer electrolyte (SPE) electrolyzer
or reverse fuel cell.
Outputs envisaged included: developed novel nanostructured electrocatalytic
materials and procedures for their manufacture; characterization of fabricated
materials; optimized processing conditions when such materials are applied in high
efficiency nanophase composite membrane electrodes; optimized electrocatalytic
process conditions for hydrogen production.
Figure 1.1 Schematic overview of scope of dissertation

CHAPTER 1 ____________________________________________________________________
11
1.7. RESEARCH HYPOTHESIS
High dispersal of nanophase Pt metals in three dimensional substrates will enhance
the process of water electrolysis. Nanoscale highly dispersed active components will
reduce the overvoltage of electrocatalytic reactions. Composite gas diffusion
electrode surfaces containing nanophases will result in high activity for hydrogen
production. Nanophase electrocatalytic materials can be incorporated into composite
gas diffusion electrodes and maintain high catalytic activity for hydrogen production
and high electro- and proton conductivity.
Research questions included:
i) Can nanophase electrocatalytic Pt particulates be stabilized on micro, meso
and macroporous supports?
ii) Does the porous or high surface area support substrate improve the dispersion
of Pt nanophase electrocatalytic particulates?
iii) Can nanostructured electrocatalytic materials be prepared using simple
synthesis methods?
iv) Which are the most suitable matrices to be used as supports for nanostructured
electrocatalytic materials?
v) Can the nanophase electrocatalysts be processed into composite electrodes
without agglomeration and with high dispersion?
vi) Can nanophase catalysts be processed into the form of catalytic membranes
and membrane electrodes?
vii) Can the characteristics of the electrocatalysts and the composite electrodes be
determined in terms of their activity?
viii) How should the electrocatalytic membrane reactor be operated in order to
achieve optimum performance of nanostructured catalytic electrodes?
ix) Which analytical methods can be used for evaluation of characteristics of
nanostructured catalysts and electrodes?
x) How will nanostructured catalysts in electrodes perform in electrosynthesis
reactions, and particularly for hydrogen production?
CHAPTER 1 ____________________________________________________________________
12
1.8. MAIN PERSPECTIVE FROM WHICH THE TOPIC WAS
RESEARCHED
Nanofabrication methods, which are simple and have high potential for upscaling to
industrial volume output were selected for preparation of high surface area nanophase
electrodes. These materials should be applicable in:
1) Nanophase composite electrode materials for alkaline electrolyzers
2) Nanophase composite electrode materials for SPE electrolyzers
The goal was to optimize the following properties iteratively: (1) High catalytic
activity due to high dispersion of the active components as nanophases; (2) Increased
activity due to tailor made porous matrices impregnated with catalytic nanoclusters;
(3) Low overpotential because nanoscale dispersed active components may reduce
the overpotential of electrocatalytic reactions resulting in overall increase in energy
efficiency of the process; (4) Intensification of external kinetics. The specially
designed geometry of the electrode surface should result in enhanced transport of
reagents and products. (5) Commercially viable procedures for materials preparation.
The newly developed composite, nanophase electrocatalytic materials were tested in
small prototype electrolyzers for hydrogen production. Thus the development of
electrocatalysts, properties of electrodes containing the electrocatalysts and their
application as electrodes for hydrogen evolution was investigated in this study.
1.9. METHODOLOGY
Micro and mesoporous support materials were characterized to determine the phases
present, the phase purity, the composition, the pore volume and the morphology.
Supported catalytic nanoparticles were prepared on these substrates and
characterized, then incorporated in composite electrodes. Fabricated electrodes
containing nanophases were characterized in terms of homogeneity, dispersion of the

CHAPTER 1 ____________________________________________________________________
13
active metal and activity, and were tested in electrolysis of water. Each of these
aspects is presented in different chapters.
Various techniques are useful for the characterization/identification of nanophase
materials as well as prepared composite membranes which may include the following
methods (Petrik 2002; Williams et al. 2008). The methods used for characterization
are described in Section 3.3.5 and in each specific chapter as necessary. Particle size,
particle size distribution, metal surface area, and metal dispersion/agglomeration can
be established by scanning and transmission electron microscopy (SEM/TEM).
Surface micro- and macrostructure, and degree of agglomeration can be determined
by High-Resolution Scanning Electron Microscopy (HRSEM). Fourier transform
Infra red (FTIR) gives information of structural configuration. X-ray diffractometry
(XRD) gives information about crystal/atomic structure and phase identity and purity.
Qualitative crystallinity and crystal symmetry can be determined by Selected Area
Electron Diffraction (SAED). Volatile and template content as well as thermal
stability is determined with Thermogravimetry (TGA) and surface oxidized or
reducible species (metal chemical state) can be analyzed using Temperature-
Programmed Reduction (TPR). Composition can be quantitatively determined by
elemental analysis using atomic adsorption spectroscopy (AAS), Ion Coupled Plasma
(ICP), X-ray Fluorescence spectroscopy (XRF) or qualitatively by using energy
dispersive analysis (EDS). Aggregate size and aggregate size distribution can be
determined by Non-Invasive Beam Scattering (NIBS). Total surface area, pore size
distribution and porosity can be determined by N2 adsorption/desorption at -196 ºC
(77 K) (N2BET). Electrochemical properties can be determined using cyclic
voltammetry or square wave voltammetry using a potentiostat/galvanostat. Elemental
mapping was determined by proton Induced X-ray emission (PIXE). Electrical
characteristics of samples were determined by Hall measurements, which will be
fully described in Chapter 6.

CHAPTER 1 ____________________________________________________________________
14
1.10. STRUCTURE OF THESIS
Each chapter opens with an overview of the literature related to the specific topic
covered in that chapter, followed by an experimental section, results and discussion
section and a concluding section. The unfolding sequence of the dissertation in
separate chapters hereafter is as follows: Background overview of the hydrogen
economy; Catalyst support types (micro- and mesoporous silica vs carbon substrates);
Preparation of nanophase electrocatalysts; Methods for fabrication of composite
electrodes; Optimization of electrodes including finding suitable gas diffusion layers
(GDL) and stability testing; Screenprinitng and testing of catalytic layers on
substrates; Optimizing membrane electrode assemblies (MEA) and an SPE
electrolyzer cell.
CHAPTER 1
This Chapter has introduced the dissertation topic.
CHAPTER 2
In Chapter 2 an overview of the hydrogen economy and background information is
presented.
CHAPTER 3
In Chapter 3 after an overview of the substrate support types, the preparation and
characterization of nanostructured porous template matrices that were used as
supports or sacrificial templates with precise parameters is described. The details of
preparation and characterization of micro, meso and macro porous supports are then
described. High silica micro and mesoporous matrixes were used as supports or as
sacrificial templates for preparation of carbon analogues. This included preparation of
zeolites and mesoporous materials with angstrom or nanosized pores respectively as
supports for electrocatalysts. Deposition of carbon into the pore volume of such
sacrificial matrixes was followed by pyrolysis of the carbonaceous materials and
subsequent dissolution of the silica matrix resulting in an ordered mesoporous carbon

CHAPTER 1 ____________________________________________________________________
15
(OMC) analogue. Alternatively the carbonization of the electrocatalyst could be
achieved by sputter coating or pyrolysis of LPG.
CHAPTER 4
Chapter 4 details the stabilization of nanophases of Pt on macroporous supports
(CNT). A review of various approaches is firstly presented. Various routes of Pt
deposition on CNT and CNT paper including a galvanic displacement technique
using Al, Pb and Fe foils are developed. Characterization of the electrochemical
activity of the most promising CNT supported nanophase electrocatalysts was
performed with cyclic voltammetry. A state of the art, highly active, commercial
carbon black supported Pt catalyst with a 40% loading of Pt, that was purchased from
a well-known company was characterized and used in subsequent chapters as
baseline comparison.
CHAPTER 5
In Chapter 5 the development, characterization and application of noble metal
nanophase electrocatalysts supported on microporous (FAU), mesoporous (HMS,
MCM-41) is described. Various nanoparticle fabrication techniques for nanometal
deposition and reduction on these Si based porous supports are developed. The
catalysts are processed into composite nanophase containing electrode materials
suitable to aqueous alkaline electrolyzer systems. A review of the methods used to
prepare such electrodes is presented. The characteristics of composite electrodes
manufactured via brush coating, casting, hot pressing, and spray coating are evaluated
for durability and stability in an aqueous alkaline environment.
CHAPTER 6
In Chapter 6 ink formulations containing the benchmark commercial electrocatalyst
were developed and used to prepare composite electrodes suitable for SPE
electrolyzers. The characteristics of the catalyst containing film or layer on composite
electrodes manufactured via screen printing are evaluated. Homogeneity and
reproducibility are key issues in preparing larger scale composite electrodes

CHAPTER 1 ____________________________________________________________________
16
supporting a catalytic layer, and various preparation techniques may produce
materials with different surface dispersion that may have an effect upon properties
such as stability, lifetime and activity. Characterization of composite nanophase
materials was performed by Scanning Electrochemical Microscopy and Proton
induced X-Ray emission spectroscopy (PIXE) for elemental mapping to ascertain the
ability to obtain the required composition, dispersion, homogeneity, and also the
details such as defects, concentration gradients, etc, in composite materials.
Resistivity, IV characteristics, Hall sheet carrier density, Hall mobility of electrodes
was performed using a Hall measurement system.
CHAPTER 7
Chapter 7 describes the optimization of a Membrane Electrode Assembly (MEA) for
the SPE system using benchmark commercial Pt and Ir electrocatalysts. A review of
components and conditions of assembly for these systems is presented. Optimization
included selection of the most suitable prototype designs, electrodes, diaphragms or
membrane materials, catalysts, backing layers for cathode and anode, MEA assembly
conditions and bench scale prototype development. The MEA with the most
successful performance (Pt-C cathode and IrO2 anode) was reproduced and subjected
to long term polarization tests whereby the output current was a measure of the
electrode stability. Many variables that may influence the observed activity for
hydrogen production were optimized.
CHAPTER 8
Finally, in Chapter 8, the overall conclusions are presented and the recommendations
for future studies are made. The citations list of the outputs from this study appears in
Chapter 8. The last chapter is followed by all the references for each Chapter that
have been consolidated into one alphabetical list.

CHAPTER 2 ___________________________________________
17
2. LITERATURE REVIEW
The literature review presented in this chapter informed and defined the thesis topic
and main perspective, rationale and motivation, research approach and scope of study
as well as the delimitation of the study, as was presented in Chapter 1. The research
design and refinement of approach and research hypothesis as well as the
delimitations of the research and the main perspective from which the topic was
researched were also developed from the perspective gained from the literature
review.
2.1 BACKGROUND
Worldwide, large investments are being made into the hydrogen economy because of
the likelihood that the world oil supply will decline within the next 10 to 15 years,
and that a gap will develop between the demand and supply, which will lead to cost
increases and possible shortages of oil. The energy security of oil importing
countries that are increasingly dependent on imports is becoming an issue.
Fluctuating fossil fuel prices may further compound the issue of energy security.
South Africa currently imports about 65 % of its liquid fuel needs and the United
States of America about 55 %. These figures are likely to increase. There is also
growing concern about air pollution in especially the highly populated cities of the
world, and about the effect of greenhouse gas emissions on global warming. Policies
such as the Kyoto protocol are being implemented widely. South Africa is a signatory
and will in future have to abide by these regulations to mitigate global warming.
Depletion of natural resources is a further concern. Moreover it is difficult to store
energy from renewable resources. Hydrogen together with fuel cell technology are
one of only a few comprehensive long-term, sustainable solutions to the reduction of
the greenhouse gas emissions and pollution from the transportation and fossil fuel
based industrial sector. There are significant economic benefits for countries and
companies that succeed in the field of hydrogen and fuel cell technology. Currently
there is already a market demand for high end users and niche applications such as

CHAPTER 2 ___________________________________________
18
space and military applications of hydrogen as fuel. Hydrogen as fuel source can
contribute to solving the potable water crises as hydrogen production requires less
water than is used in the production of hydrocarbon based fuels, resulting in
significantly fewer negative environmental impacts on water systems, and its use as
fuel to drive a polymer electrolyte membrane (PEM) fuel cell system for energy
production produces clean water as a product (Benson et al., 2004).
Figure 2.1 Schematic of Hydrogen Economy infrastructure (Kato et al., 2005).
The potential market for fuel cells and their related products is enormous with the
global demand projected to reach $46 billion by 2011 and the potential for 2021
could exceed $2.6 trillion. In the hydrogen economy fitness of fuel cell technology
and the supporting / peripheral (balance of plant) technologies will require
development of innovative systems for competitiveness. Chief amongst these are
innovation in fuel cells, hydrogen production and storage. Future product
development would require techno-economic studies, techno-transfer, scale up, pilot
studies and other issues such as venture capital and commercial partnerships. All
these different aspects should be explored prior to expecting successful
commercialization of hydrogen driven fuel cells (Benson et al., 2004).

CHAPTER 2 ___________________________________________
19
It should be kept in mind that hydrogen is not truly a source of energy because it is
mainly bonded in the form of water and requires more energy to liberate than it
provides. Therefore to be non-polluting, the energy used to liberate or produce
hydrogen should not be carbon based, thus should be derived from renewable sources
such as wind or solar energy (Parfit, 2005).
2.2 GLOBAL PERSPECTIVE
It is estimated that the world currently uses 320 billion kilowatt-hours of energy a day
and with development and growth this figure is projected to rise three-fold within the
next century. Maturing global efforts for a wholesale conversion to hydrogen as fuel
reflect a growing awareness of the many efficient, environmentally sound, and lower
cost methods available today to produce and store hydrogen. Hydrogen is seen
worldwide as the clean fuel of the future. Most of the major countries of the world
have initiated coordinated investment and commercialisation strategies in the field of
hydrogen and fuel cells, e.g. The United States of America, Canada, Japan, The
European Union and Australia (Parfit, 2005).
In a July 8, 2005 memo entitled, "FY 2007” of the USA Administration Research and
Development Budget Priorities Office of Science and Technology, from Policy
Director, John Marburger and Office of Management and Budget Director, Joshua
Bolten provided six pages of guidance to the heads of executive departments and
agencies describing six "Interagency R&D Priorities"; and also "General R&D
Program Guidance" and "R&D Investment Criteria." (Marburger et al., 2007). The
following extract is noteworthy:
"In support of the President's Hydrogen Fuel Initiative, agency efforts should address
the critical technology barriers of on-board hydrogen storage density, hydrogen
production cost, and fuel cell cost, as well as distributed production and delivery
systems. R&D should focus on novel materials for fuel cells and hydrogen storage
(including nanostructured materials), durable and inexpensive catalysts, and hydrogen
production from renewable energy, …and electrochemical processes…"

CHAPTER 2 ___________________________________________
20
In addition to nationally coordinated plans, the United States of America has taken
the lead to organize and implement international collaboration by forming the
International Partnership for the Hydrogen Economy (IPHE). The terms of reference
of the IPHE was signed by senior representatives of 16 countries on 20 November
2003. These countries are: The United States of America, Australia, Brazil, Canada,
China, the European Commission, France, Germany, Iceland, India, Italy, Japan,
Norway, Korea, the Russian Federation and the United Kingdom.
Internationally, the hydrogen economy, together with fuel cell technology, is
receiving significant support and global investments are estimated to be in the region
of US$3 billion per year. For instance, government funding in Japan totals about
US$400 million, in the USA about US$500 million, in the EU about US$800 million,
in Brazil a part of US$200 million, in Canada about US$50 million and in South
Korea about US$50 million. In addition to this, there are substantial private sector
investments. In the EU a consortium of 30 participants is working on the Cute (Clean
Urban Transport for Europe) demonstration project to put into service a fleet of 27
clean and silent hydrogen buses on public transport networks in nine EU cities. Test
buses are already operating in Porto, Madrid, Stockholm, Stuttgart and London. It is
envisaged that eventually decentralized hydrogen production would make possible
the fuelling of a car before it leaves the garage of a residential unit. Hycom projects,
supported by the FP6, aimed at the development of a number of “hydrogen villages”
demonstrating the concept are being planned. Moreover, two electrolysis pilot plants
supplied by wind power are currently at the testing stage, in Greece and the Canary
Islands, as part of an European project to demonstrate a reliable capacity for
hydrogen production (HyWeb Gazette, 2008).
Recently, hydrogen production technologies have seen important improvements
(Manitoba Hydrogen Steering Committee and Working Group, 2003). International
research has mainly focused upon replacement technology for petroleum and the
internal combustion engine in motor vehicles. Hydrogen fed fuel cells were already

CHAPTER 2 ___________________________________________
21
used in the 1960`s in the Gemini aerospace program of NASA (United States).
Although hydrogen fed fuel cells were used since the 1960`s for aerospace and
military applications, the cost was a strong impediment for broader applications. With
advances in the field, there are now several hydrogen vehicles in production,
including those manufactured by the Hydrogen Car Company and Stuart Energy, and
automobile manufacturers such as Mercedes, BMW, GM, and Ford. Moreover, fleet
owners in the USA, are currently test driving hydrogen fuel cell vehicles and plan to
replace some medium-duty vehicles in the short term and their entire fleets by 2014
(Benson et al., 2004).
It is important to identify the most promising hydrogen production methods that
incorporate other forms of renewable energy. The USA DOE Hydrogen Program FY
2005 in its progress report on a low-cost, high-pressure hydrogen generator had as a
target the development of a 1,500 kg per day hydrogen refueling station by 2010.
Their intent was to develop and demonstrate a low-cost, high-pressure water
electrolyzer system for hydrogen production and eliminate the need for mechanical
hydrogen compression while increasing electrolyzer hydrogen discharge pressure to
5,000 psig. The goal of the DOE project was to reduce the cost of the stack and
system to provide a cost-efficient reliable system for generating high-pressure
hydrogen. To increase the hydrogen production pressure alternative materials and
designs were evaluated for end-plates, internal cell components that support the
membrane, and cell frames that provide sealing. To reduce cost, replacements for the
expensive cell supports/current collectors were developed. Advances in materials and
fabrication allowed the parts in electrolyzer cells to be decreased. Improving
electrolyzer electrochemical performance reduced costs by decreasing the number of
cells required to produce a given quantity of hydrogen, while maintaining efficiency.
Performance was improved through use of thinner, less resistive membranes and
advanced lower-cost catalysts and electrode structures. The operating life of thin
membranes was a concern, particularly at the high differential pressures of operation
but it was found that Nafion 115 membrane performance was stable over 2280 h. The

CHAPTER 2 ___________________________________________
22
DOE project did not focus specifically upon the development of nanophase electrodes
for achieving higher efficiencies (Norman and Schmitt, 2004).
Internationally, the recent escalation of gas prices and global instability has had the
result that support of an alternative energy source such as hydrogen has increased,
even though that may cost more initially. Europe and Asia have been pursuing
environmentally friendly energy alternatives for years, whereas the USA has
consistently moved toward higher energy consumption, for instance, by preferring
larger vehicles that have high fuel consumption. The dependence of the United States
on imported oil is today much higher than in the late 1970s (about 53% vs. 45%).
The growing dependence on imported oil of the USA, has a direct effect on the
economic stability of the rest of the world. This trend may finally be changing as
negative aspects such as dependency on foreign oil, global warming, urban pollution,
and acid rain become more apparent (Benson et al., 2004).
2.3 SOUTH AFRICAN PERSPECTIVE
In South Africa there is a strong need for distributed (off-grid) power supply and for
load levelling and energy storage of excess off peak electricity. Moving electricity for
long distances in South Africa requires balancing the energy system and there is a
loss of energy when supplied over long distances. Energy levels have to be modulated
according to use and it is necessary to create a range of options for supplying
electricity to any one point of use. South Africa's high altitude, heat and tendency for
lightening and fires provide further challenges. It is costly, wasteful and technically
problematic to keep the system at full capacity constantly because demand for
electricity fluctuates during the course of the day and over the seasons of the year.
Different types of generation are necessary such as a base load, a mid-range that is
provided at certain times and then short-lived spikes of high demand. Base load
demand has risen significantly over the last few years in South Africa and peak
demand capacity is lacking. Diversification of energy sources is necessary in future
in order to make the necessary contribution to the reduction of greenhouse gases,

CHAPTER 2 ___________________________________________
23
increasing costs. The current low price of electricity in South Africa and the low price
increases up to date were due to past investment and are now at an end. Cost should
be carried within the electricity system as it is in effect an investment in its future
effectiveness (Erwin, 2006).
Internationally there is no strong research development of stand alone power
generation for off grid electricity supply, since power supply to remote locations is
very much a problem for developing nations such as South Africa that do not yet
have installed capacity for all regions. This problem could be addressed in the
medium term by on site solar or wind powered generation and use of hydrogen as
fuel for fuel cells powering mini- grids, neighbourhoods or households (Benson et al.,
2004).
SA representative Tony Surridge of the Department of Minerals and Energy (DME)
was invited as observer to the International Partnership for the Hydrogen Economy
(IPHE) that was launched at an USA- EU summit and it was recommended that South
Africa join the IPHE. As a result of these and other networking interactions a
stakeholder group was formed in SA called the South African Fuel Cell Initiative
(SAFCI) which developed a hydrogen economy strategy that was published in 2006
by the Department of Science and Technology (DST) in order to position South
Africa as a player in the field. The hydrogen economy as such is not currently part of
the SA integrated energy plan. It would however fit in under the drive towards
renewable energy sources (Benson et al., 2004). The access to a cheap and clean fuel
such as hydrogen is essential for a country that needs to increase or maintain
economic growth but simultaneously needs to minimize environmental pollution.
Currently, South African direct investment into the local hydrogen economy and fuel
cell technology developments amounts to only about R5 million per year (only about
0.03% of the global investment) but this is growing. For South Africa to participate
as a partner in the new US and worldwide H2 economy development and not become
an economic hostage, capability is essential in the following key areas: H2 production

CHAPTER 2 ___________________________________________
24
and storage, Pt/PGM beneficiation and application as nanophase catalysts in systems
such as fuel cells and solid state electrolyzers, novel inorganic proton conductors
based on nanophase metal oxides, manpower and scarce skills development,
environmental compliance, regulatory requirements, infrastructural developments and
governmental support in all these areas. Future product development requires techno-
economic studies, techno-transfer, scale up, pilot studies and other issues such as
venture capital and commercial partnerships (Benson et al, 2004).
SA industry has a continuous need to stay competitive by reducing costs, increasing
market share and developing new products. Especially in the area of high technology,
international competition is strong. Should SA companies license international
technology it comes at a high price. South Africa’s rich platinum reserves could assist
to make it a key player in future energy technologies. Anglo Platinum, South Africa’s
largest platinum producer, has plans to start investing in the development of hydrogen
technology, and has significant holdings in Johnson Matthey (UK), one of the leading
researchers in the platinum market and international suppliers of electrocatalysts
(Bruce, 1996).
South Africa’s main supplier of electricity, the parastatal ESKOM, has expressed its
commitment to embracing renewable energy sources such as wind turbines, fuel cells
and photo-voltaics as a part of its complete energy generation portfolio. There is also
a direct need for hydrogen within ESKOM as cooling gas for the generators/ reactors
of the power stations. Besides using hydrogen as cooling gas ESKOM should be in a
position to take an active role in the energy supply of the future, locally and
internationally. Moreover, ESKOM has a significant need for distributed (off-grid)
power supply and for load leveling and energy storage, which can be addressed by
the production of hydrogen as fuel. Therefore ESKOM has an interest in the
hydrogen economy including hydrogen generation, distribution, storage, conversion
to energy using fuel cells, and applications of energy devices fueled by hydrogen. It
is the direct availability of hydrogen for energy storage that will affect the decision of
companies at which stage to switch their power requirements to fuel cell sources and

CHAPTER 2 ___________________________________________
25
ESKOM would benefit immensely from offering a complete approach to renewable
energy generation and distribution (G.Gericke, Eskom representative, personal
communication).
Many inhabitants of South Africa do not have direct access to electrical power. One
of the priorities of the Department of Trade and Industry (DTI) is to drastically
reduce this number. ESKOM has indicated that small scale, local generation of
electrical energy is the only answer to this commitment of the DTI. The technology
competing with fuel cells in this segment of the market are solar cells and wind
mills/turbines. Even though these alternative energy generation devices are low
maintenance solutions, energy storage using conventional lead acid batteries is a
weak link. The production of hydrogen using excess energy that cannot otherwise be
stored can be used to ensure continued power supply and will eventually be a more
economic solution (Yumurtaci & Bilgen, 2004).
It should be noted that if hydrogen production is much cheaper when alternative
routes such as nuclear power is used or if the steam reforming process is widely
adopted then those processes will be used for hydrogen production. However, for
some situations the economic picture of the production of hydrogen is different. First
of all, electrolysis of water is a much simpler technology than steam reforming (or
nuclear power) which makes water electrolysis more competitive on the small scale.
Secondly, renewable energy sources like wind and solar energy are available almost
everywhere in South Africa unlike natural gas or coal. Harnessing these resources for
small communities’ power needs would make a big difference to the quality of life of
many people in this country. Thirdly, electrolysis can be strongly recommended as
an integrated technology in existing power stations for hydrogen production during
off peak hours, when electricity is cheap (Barbir, 2005).
2.4 THE HYDROGEN ECONOMY

CHAPTER 2 ___________________________________________
26
Hydrogen is one of the most important feed stock gases with an annual global
demand of more than 1,6 trillion m3 (SHEC-labs press release, 2006). Hydrogen is
considered as an industrial commodity in the energy using sectors. It is widely
consumed by industries involved in ammonia production, refining and petrochemicals
production, methanol synthesis, chemical production, paper, textiles and steel
manufacturing, fat and oil hydration units, manufacturing of vegetable oils, float glass
producers, electronics, and metal treatments. Apart from the conventional uses,
hydrogen as a fuel can be utilized as liquid hydrogen at fuelling stations for vehicles
or as compressed hydrogen for onboard storage in vehicles. Hybrid electric vehicles
where hydrogen is injected along with the conventional fuels to the internal
combustion engines is seen as a relatively immediate route to diminishing emissions
and an intermediate option prior to fully integrated hydrogen powered vehicles.
Moreover, hydrogen as fuel would be suitable for distributed power applications for
producing power on demand, or uninterrupted power supplies. It is also possible to
utilize hydrogen as fuel for fuel cell energy for mobile applications replacing lap top
batteries, mobile phone batteries and other battery powered electronic devices.
Hydrogen has already been used as fuel for a variety of military applications (Benson
et al, 2004).
The amount of energy released during the reaction of hydrogen on a mass basis is
approximately 2.5 times the heat of combustion of hydrocarbon fuels. Hydrogen is
also an attractive energy carrier for its high energy/weight ratio. The energy produced
by hydrogen per unit weight of fuel is approximately three times the amount of
energy contained in the equivalent weight of hydrocarbon based fuel. The advantages
of hydrogen in the pure form make hydrogen a potential alternative fuel with higher
efficiency than that of known fuels (Frost and Sullivan, 2003; 2004).
Its further value as an energy carrier, rather than as a direct fuel, is because excess
energy can be stored in the form of hydrogen. Subsequently the stored energy is
released during the oxidation of hydrogen in the form of electrical energy by using
hydrogen as fuel for a fuel cell. A fuel cell is an electrochemical system, which

CHAPTER 2 ___________________________________________
27
converts chemical energy to electrical energy. A fuel cell differs from a battery in that
fuels are continuously supplied and also the products, mainly water, are continuously
removed. Hydrogen will be a major factor in successful fuel cell commercialization.
The high efficiency of fuel cells makes hydrogen a cost effective, energy efficient,
and environmentally friendly alternative to current fuels when considering the full
lifecycle (Thomas et al., 1998).
The benefit of the hydrogen production- storage- transport chain forms the basis of
the hydrogen economy. The pure “hydrogen economy” is the ideal situation.
Barriers to implementing the hydrogen economy include the need to improve the
performance of hydrogen and hydrogen related technologies in order to advance an
economically viable hydrogen economy (Thomas et al., 1998).
Hydrogen is looked upon as one of the best alternatives to fossil fuels. Burning
hydrogen as a fuel in vehicles will reduce nitrogen oxide emissions. The combustion
of hydrogen does not produce pollutants such as particulate matter or sulfur
emissions. When burnt as a fuel or converted to electricity, the only by product is
water. If hydrogen is produced using non-fossil fuels, then it is possible to reduce
carbon dioxide and carbon monoxide emissions in the transportation sector. With no
CO2, CO, NOx or SOx emissions from hydrogen fueled devices there will be a much
lower release of greenhouse gases, thus there would be a negligible impact on global
warming. Studies of the impact of hydrogen use would have on air pollution and the
climate showed that if vehicles were powered entirely by hydrogen fuel cell
technology, anthropogenic emissions of the ozone precursors nitrogen oxide and
carbon monoxide could be reduced by up to 50%, but this would depend on the
technology used to generate the hydrogen (Frost and Sullivan, 2003; 2004). Thus, the
concept of a hydrogen-based energy and transportation system offers energy resource
flexibility and the potential for energy independence, as well as the elimination of net
carbon dioxide emissions. Use of hydrogen as a fuel offers the opportunity to shift
the energy requirements for, for instance transportation, from imported oil to diverse,
domestically available resources. Hydrogen powered fuel cell vehicles are an

CHAPTER 2 ___________________________________________
28
attractive alternative to gasoline and diesel powered automobiles as they emit only
water with essentially no criteria pollutants.
However, progress in implementation is hampered until a system of hydrogen
production, storage, distribution and utilization is put into place with appropriate
standards and the correct legislative environment. Despite significant advances and
commitment of resources by technology providers, end-users and international
governments, experts project that extensive use of hydrogen as fuel for fuel cell
vehicles is at least ten years away. This problem could be addressed in the medium
term by on site solar or wind-powered generation and use of hydrogen as fuel for fuel
cells powering mini- grids, neighbourhoods or households (Benson et al, 2004).
Barriers to the hydrogen economy include the lack of infrastructure for distribution
and storage of hydrogen (Nielsen et al., 2004). Moreover there are significant
challenges in meeting the present price of conventional fuels because of the cost and
inefficiencies of current hydrogen production and storage technologies. A further
issue is the matter of consumer perception relating to safety risks. Codes of practice
and the correct legislation as well as standardization and government policies would
need to be considered as well.
Hydrogen could be generated by water electrolysis using renewable energy and the
generated hydrogen stored and later used as an input for fuel cells to generate
electricity. Hydrogen and electricity would be generated as long as it is required by
the applications. Large-scale stationary fuel cells fed by hydrogen would be able to
meet the demand of delocalized industrial, agricultural, tertiary or residential users.
Other scenarios that have been envisaged for the implementation of hydrogen as fuel
for fuel cells include a home hydrogen refueling unit that consists of a small-scale
electrolyzer powered by mains electricity that converts water from the domestic
supply into a slow stream of hydrogen (Ivy, 2004). The only local emission is
oxygen. The technology offers the prospect of car users parking at the end of the day
and connecting their vehicles to home refueling units for a hydrogen refill overnight.
Shell Hydrogen is exploring the potential of home hydrogen refueling as part of a

CHAPTER 2 ___________________________________________
29
global hydrogen refueling infrastructure, and is participating in demonstration
projects of hydrogen refueling stations, for instance, in Reykjavik, Iceland. Jeremy
Bentham, chief executive officer of Shell Hydrogen said that ultimately customers
would decide how they wanted to receive hydrogen. He noted that for widespread
acceptance, refueling infrastructure should resemble existing infrastructure and
foresaw that new and innovative solutions, such as home refueling, may prove
successful with consumers. His opinion was that home refueling may be a solution
for remote locations or regions with limited hydrogen demand. Technical problems
such as hydrogen storage should still however, be resolved (Bentham, 2005).
Hydrogen is a high cost fuel and the price should be reduced for successful
commercialization to be achieved. Options of generating hydrogen that are being
explored include hydrocarbon based onboard reformers for use with fuel cells, but
because of associated costs this is not yet feasible. However, the requirement to
reduce green house emissions in automobiles would in future prevent hydrogen
generation using reforming technologies. Hydrogen gas may be formed by water
electrolysis and this process may ultimately be used as the cleanest way of supplying
or generating fuel in a fuel processor for fuel cell utilization, provided that the
electricity used is generated from renewable sources such as wind and solar
(Sørensen et al., 2004). Water electrolysis as means of hydrogen production is a
suitable alternative for the existing reforming technologies because of its
environmental friendliness, and because of fluctuations in the price of natural gas or
other conventional hydrocarbons.
Emission during electrolysis when renewable energy is used to split water to
hydrogen is virtually zero. Hydrogen is produced via electrolysis by passing
electricity through two electrodes in water. The water molecule is split and produces
oxygen at the anode and hydrogen at the cathode. The only requirement is that
hydrogen should be produced in a controlled environment to minimize hazards and
then can be used anywhere as fuel without leaving a trace of pollution (Janssen et al.,
2004).

CHAPTER 2 ___________________________________________
30
Price and performance determine the market success of hydrogen. In order for
hydrogen from water electrolysis to achieve significant market penetration and
widespread acceptance, it must be more efficient, equally convenient, and cheaper
than other routes to prepare hydrogen, or cheaper than other sources of fuel such as
petroleum, or have significant environmental or logistical benefits. Off peak
electricity prices are one way by which electrolytic hydrogen production can become
more economical. This approach is especially important for large territory developing
countries, like South Africa (Benson et al., 2004).
Hydrogen as fuel does however, present significant challenges to commercial
production, storage and transportation. Although hydrogen has the highest energy
density of known fuel, it should be stored as a compressed gas or as cryogenic liquid
if not generated on site and used directly. Compressors have to be deployed in order
to step up the pressure of hydrogen as hydrogen is produced at low pressure. Storing
hydrogen in compressed gas or cryogenic liquid form requires special handling
techniques and high safety standards. Hydrogen must be liquefied at -253 º C in order
to store a useful amount of hydrogen particularly for vehicles, but liquefaction is
time-consuming and energy-intensive. Using current compression or liquefaction
technology, about 30 % to 40 % of the energy content in the hydrogen could be lost
in the process. Compressed hydrogen would require huge tanks for storage, which
create space problems for onboard storage and require adequate safety standards. It is
estimated that a hydrogen gas tank would be 3000 times bigger than a conventional
fuel tank, to store the same energy equivalents (Frost and Sullivan, 2004).
Hydrogen generation is fundamentally important for renewable power generation
applications. Grid stability and intermittency issues limit the market for use of
renewables such as wind and solar in the electricity market, according to US DOE’s
National Renewable Energy Laboratory; but the addition of hydrogen could help. The
combination of renewable technologies with hydrogen production and storage, would
enable intermittent renewables such as wind and solar to contribute to a larger share

CHAPTER 2 ___________________________________________
31
of the power production market without major upgrades to the existing grid. Because
most sources of renewable energy are intermittent in nature (i.e. when the sun does
not shine, or the wind does not blow, electricity from solar panels and wind turbines,
respectively, cannot be generated), their practical use is limited unless the user is also
connected to the electricity grid or installs large, heavy and relatively expensive
battery backup systems. For non- grid-connected electricity supply, renewables such
as wind and solar generation cannot produce electricity in response to demand. These
technologies only produce when the source of energy (wind or solar) is available.
This increases the system costs, as extra storage is necessary if renewables are the
only source of energy (Sørensen et al., 2004).
The use of water electrolysis for hydrogen generation addresses this limitation by
enabling the production and storage of hydrogen to occur during times of excess
electricity generation and allowing for the later generation of electricity. The
hydrogen produced can be utilized at any given moment in a fuel cell to generate
electrical energy or as a fuel for heating or cooking appliances. According to the IEA
Renewable Energy paper (2002), renewable sources of power that can be applied as
energy source for hydrogen production include hydro, geothermal, solar thermal,
solar photovoltaics, tide, wind, renewable municipal solid waste, solid biomass and
gases from biomass. Key issues are reliability and durability of hydrogen production
systems and their integration with subsequent storage systems and delivery to power
generation units such as fuel cells.
Renewable energy sources by themselves do supply energy without being coupled to
hydrogen generation systems, but have various drawbacks. Wind energy generation
in good wind areas, is comparable to fossil fuels when economic or environmental
costs are factored in, but is still not entirely satisfactory because of the unsightliness
and large footprint of wind arrays for bulk power generation as well as the
unreliability and intermittent nature of wind. Wind generators can be immobile for
days or suddenly produce an excess of power. Wind energy which, in fact, is also
solar energy in the form of the movement of sun- warmed air, is becoming more

CHAPTER 2 ___________________________________________
32
competitive. In the EU the equivalent of 35 large coal power plants of installed wind
generator capacity already provides about 35000 megawatts of power. Wind and solar
systems require a way to store excess capacity and this is where hydrogen generation
fits in. Conversion of wind energy to hydrogen demonstrates the value of hydrogen as
an energy storage medium for excess wind power, and is a feasible example of what
is possible in future (Parfit, 2005).
Renewable energy from the sun can be captured using photo-voltaics in for instance,
thin film solar cells. According to the IEA Renewable Energy paper (2000) the costs
of solar based energy systems including photo-voltaics have decreased very
significantly over the years and are now considered cost competitive for a number of
grid-connected, building-integrated uses as well as for off-grid applications. The
drawback is energy storage requirements, since the peak electricity demand is not
usually during the daytime in summer. Moreover, many areas of the world do not
receive significant solar flux during certain seasons. Solar photovoltaic arrays
demand a large area of land which cannot always be accommodated economically.
Solar thermal technologies are being installed widely for heating and hot water for
residential, commercial and industrial end uses and are relatively competitive. Large
scale solar thermal systems are not yet economically competitive for providing heat
to produce steam for power generation.
Renewable energy from the sun can be captured by using solar thermal (SOT) energy
conversion systems. SOT collects direct solar radiation via parabolic trough mirrors
which are then focussed on heat exchanger systems allowing the heat to be
transferred to steam which is passed though a turbine to generate electricity. At this
stage of development however, the costs are still considerably higher than fossil fuel
based energy (Parfit, 2005). Geothermal systems are used for power generation and
space heating applications where hot water or steam resources are available at a high
temperature and near the earth’s surface. Ocean energy systems based upon tidal
forces, ocean currents, wave power or thermal gradients are being explored to
produce electricity. Hydrogen, generated from excess capacity derived from

CHAPTER 2 ___________________________________________
33
renewable power, is seen as a major potential contributor to the sustainability of the
energy sector. In the longer term, if costs can be dramatically reduced, hydrogen can
act as the crucial storage medium and carrier of energy produced from renewables
(IEA Renewable Energy paper, 2000).
2.5 NANOTECHNOLOGY
Material properties change dramatically when constructed from particles that are less
than 100nm in size, that is, when materials are structured at the nanoscale. Large,
highly active catalyst surface areas with the minimal catalyst expenditure are
obtainable using such nanophase materials. In recent years, nanostructured electrode
materials suitable for energy devices have attracted great interests since they show
better rate capabilities than conventional electrodes composed of the same materials.
The high specific surface area of these materials also has significant implications with
respect to energy storage devices based on electrochemically active sites (batteries,
supercapacitors) and energy conversion devices (fuel cells and thermoelectric
devices). In electrolyzer technologies significant improvements are possible using
nanophase materials as the cost of the currently used bulk phase Pt containing
electrocatalysts are very high(Li, et al., 2000 a&b; Spahr et al., 1999; Shen et al.,
2003; Zhou et al., 2003).
Nanotechnology has been identified as a lead project in the National Advanced
Manufacturing and Logistics Technology Strategy developed by the National
Advisory Council on Innovation (NACI) as well as in the Advanced Materials
Technology Strategy (AMTS) for the Department of Science and Technology (DST)
in South Africa. In the light of huge international R & D spending in the Hydrogen
Economy and also in Nanotechnology development, the DST has recently
investigated the necessity of strategic planning and funding in the area of both
nanotechnology and the hydrogen economy. The author of this thesis was closely
involved with the development of appropriate government commissioned strategies
for South Africa in Nanotechnology (Scriba et al., 2003) and the hydrogen economy

CHAPTER 2 ___________________________________________
34
(Benson et al., 2004) and in the associated commissioned baseline studies and the
thesis is designed specifically to address some of the components relating to
integration of Nanotechnology in the hydrogen economy.
Nanotechnology will be an integral part of manufactured goods relating to energy
systems in future and SA will have to be a player. Already South Africa has to pay
substantial annual technology licence fees to manufacture goods, pharmaceuticals,
chemicals and many other products and services. Unless South Africa develops
applications of nanotechnology in appropriate processes and products, specifically
relating to the energy sector, future technological benefits in this field could only be
enjoyed at great cost to our nation. Furthermore nanotechnology is an emerging
technology and real industrial applications might only be commercialised in SA in a
few years time, giving South Africa a window of opportunity to become a player.
Additionally, the natural resource base of platinum (Pt) and platinum group metals
(PGMs) such as ruthenium, palladium, and iridium, which might give South Africa a
strategic advantage relating to energy production, are currently being exported
without full beneficiation. South Africa's known reserve base of PGMs represented
87,7 per cent of the world total (Kendal, 2006). Other countries are importing bulk
PGM’s, precisely for beneficiation by development into electrocatalysts applicable in
energy systems such as fuel cells. Development of PGM containing electrocatalysts
for energy systems such as fuel cells and PEM electrolyzers is a key area where
South Africa has a significant strategic advantage if beneficiation is done locally
(Scriba et al., 2003).
There is a major potential for the generation of new knowledge and successful
commercial products in the application of nanotechnology in energy systems, which
will impact upon the strategic advantage of South Africa. Advances in fabrication and
processing of nano-sized materials have the potential to reduce the costs and increase
the efficiency of existing energy generation technology such as water electrolyzers
and fuel cells. The renewable power generation sector in particular stands to benefit
from appropriate implementation of novel nanoscale materials in integrated energy

CHAPTER 2 ___________________________________________
35
generation systems. The economic windfall for the applications of nanotechnology
based research in energy generation is expected to have a huge commercial potential.
Moreover, expertise in integration of nanotechnology in energy systems should be
developed and a product base established in South Africa in this fast developing
technology focus area. The development of home grown technology based on
nanotechnology will benefit South Africa in the long run by assisting to prevent
marginalization, and saving foreign currency and will contribute to the bridging of
the technological divide in line with national strategy (Scriba et al., 2003).
Nanotechnology can be used to reduce noble metal content of electrodes and thus
capital costs, and also improve efficiency of hydrogen generation systems such as
alkaline flow cells as well as solid state PEM electrolyzers. This is possible by, for
instance, the development of novel nanophase electrode materials that replace the
existing electrodes or electrocatalysts respectively required, for such hydrogen
production systems. In the case where noble metals and non-noble metal oxides are
used as electrocatalysts for cathodes and anodes, development of efficient nanosized
catalysts is of great industrial interest. Large, highly active catalyst surface areas with
the minimal catalyst expenditure are obtainable using such nano structured materials.
In recent years, nanostructured electrode materials have attracted great interests since
the nanostructured electrodes show better rate capabilities than conventional
electrodes composed of the same materials. The surface area of the nanostructured
electrode is much larger. The high specific surface area of these materials also has
significant implications with respect to energy storage devices based on
electrochemically active sites (batteries, supercapacitors) and energy conversion
devices depending on catalytic site of defect structure (fuel cells and thermoelectric
devices) (Li, et al., 2000 a&b; Spahr et al., 1999; Shen et al., 2003; Zhou et al., 2003).
In the surface coverage of a substrate with catalysts, the relatively low amount of
active sites obtainable per unit area in a two dimensional plane has to date not
resulted in sufficiently high catalytic activity for overcoming the barrier to producing
cost competitive catalytic electrodes for hydrogen production or fuel cell

CHAPTER 2 ___________________________________________
36
applications. The potential application of three dimensional catalytic supports for
maximum dispersion of nanophase electrocatalysts for hydrogen production in a solid
state electrolyzer is being explored in this thesis. In this approach, the highest
number of active sites per unit volume may be obtainable in close contact with the
solid electrolyte, Nafion®.
2.6 HYDROGEN PRODUCTION
A range of renewable and non-renewable hydrogen production options and
technologies exist and include ethanol reformation and partial oxidation, nuclear,
biomass fermentation and photosynthesis, electrolysis via wind, hydro, solar,
thermochemical cycles, biomass and coal gasification and sequestration. Production,
storage and transport of hydrogen is, however, still problematic and costly.
Specifically, hydrogen production technologies that reduce environmental impacts
are required for an energy system that will in future be based on renewable and
carbon-neutral hydrogen production. This approach should also promote economic
development and energy independence and security for countries such as South
Africa (Nordstrom, 2002).
Hydrogen is conventionally produced by three methods, namely thermochemically,
by electrolysis, and by photochemical reactions, depending on the feedstock used to
generate hydrogen. Competing fuels are biofuels, methanol and natural gas. It is
estimated that 48% of hydrogen is produced from natural gas, 30 % from oil, 18 %
from coal, and the remaining 4% through water electrolysis. Thermochemical
technologies for hydrogen production use heat and chemical reactions to convert
hydrocarbon feedstocks to hydrogen. Some of the thermochemical processes used for
producing hydrogen are steam methane reforming, partial oxidation of methane, and
biomass gasification. A reformer is used to separate the hydrogen from methanol,
natural gas, or other light hydrocarbons. In the steam reforming process, hydrogen is
produced by mixing either natural gas, liquid petroleum gas (LPG) or naptha with
steam. The reformer has to extract as much hydrogen as possible with low emission

CHAPTER 2 ___________________________________________
37
of pollutants such as carbon monoxide. The hydrocarbon feedstock is reacted with
water vapour to liberate hydrogen and carbon monoxide. The water vapour reacts
with carbon monoxide to form carbon dioxide and hydrogen. Crude hydrogen is
generated when this mixture is heated in the presence of a catalyst. The crude
hydrogen is then purified up to 99.99 % by using pressure swing adsorption (PSA).
Electrolysis is a proven and easy method to generate hydrogen on a large scale for
conventional industrial markets. In electrolysis, electrical energy is used to break the
bond between the hydrogen and oxygen in water. Hydrogen and oxygen are liberated
as elemental gases in the electrolysis process.
Other possible routes for hydrogen production are for instance, by photo
electrochemical methods, biological methods, and biomass reforming. Apart from
direct solar electrolysis, biomass fermentation is a further method for producing
hydrogen. These methods still have to overcome challenges such as efficiency (for
instance, to convert sunlight, via bacterial interaction to hydrogen), and the
availability of the resources for the generation of hydrogen. Biomass reforming, using
enzymatic decomposition of sugars, or steam-reforming of bio-oils and gasification,
suffers from low hydrogen production rates, impure effluent streams causing complex
processing requirements as well as significant environmental costs. Such
technologies may generally suitable for large-scale production but are associated with
costly purification operations (Frost & Sullivan, 2004).
Dissociation of water is a reaction that is not favoured thermodynamically, requiring
extremely high temperatures (> 2200 ºC) for obtaining a significant degree of
dissociation. However, solar thermal power plants (STPP) may be a viable option to
fulfil the world’s enormous expectation of clean electrical energy. The World Bank
expects very significant investment in STPPs over the next 20 to 30 years. It is
widely accepted that electricity produced by such solar thermal concentrating systems
is the cheapest solar generated electricity available today (Goswami, 1998).

CHAPTER 2 ___________________________________________
38
Thermal splitting of water by high temperature solar energy is possible using
metal/oxide cycles, based on materials that can act as effective redox catalysts via
two-step water splitting process at lower temperatures. A metal oxide is reduced
delivering some of its lattice oxygen; during the second step the reduced catalyst is
oxidized by taking oxygen from water and producing hydrogen. The synthesis of
oxide-based redox catalysts with high defect concentration and their incorporation
upon ceramic thin-wall multichannelled monolithic honeycomb reactors as supports
where the catalyst particles are coated upon the inner walls of the honeycomb
structure, act as collectors of solar heat and achieve temperatures in excess of 1100ºC,
due to their high absorbance and thermal conductivity. A 10 MW solar thermal power
plant was scheduled to produce electricity in 2002 in Spain and plans for additional
plants are in progress (Frost and Sullivan, 2003; 2004).
Another method to produce hydrogen using solar energy is by using photo catalytic
cells in series. Solar power is used to break the water molecule in the electrolyte over
a thin film of photo catalyst for direct conversion of solar energy and can convert
more than 8 per cent of solar energy to hydrogen fuel. The catalyst comprises nano
crystalline metal oxide films for the absorption of solar energy. This system is
marketed by Hydrogen Solar Ltd and was developed in collaboration with Ecole
Polytechnique Federale de Lausanne (EPFL), Switzerland and the University of
Geneva (Frost and Sullivan, 2004).
A high-temperature solar reactor has been developed by Laboratoire Procédés,
Matériaux, et Energie Solaire (Processes, Materials, and Solar Energy Laboratory),
France that can be used to produce hydrogen, based on natural gas de-carbonization.
The solar reactor co-produces hydrogen-rich gas and high-grade carbon black (CB)
from concentrated solar energy via a single-step thermal pyrolysis of methane
without using catalysts. The maximum chemical conversion of methane to hydrogen
and CB was found to be 95 % and the typical conversion was in the range of 30 % to
90 % (Frost and Sullivan, 2004).

CHAPTER 2 ___________________________________________
39
US Patent 6,726,893 by Lee et al., (2004) describes a method for hydrogen
production by high-temperature water splitting using electron-conducting
membranes. In the photoelectrochemical method of hydrogen production, the
development of novel photo anode materials, which utilizes maximum solar energy is
essential. The hydrogen storage material should have 6.5 wt % of reversible hydrogen
storage capacity which are limitations.
Millennium Cell, Inc. (MCEL) Hydrogen on Demand (HOD™) produces a system
that generates pure hydrogen from environment friendly raw materials. The hydrogen
is stored at ambient conditions in an aqueous solution of sodium borohydride
(NaBH4).
Microbes allow the production of hydrogen from carbohydrates for instance by using
naturally occurring, hardy and non-recombinant Thermotoga neapolitana organisms.
14 L of culture can produce at least 8 L of hydrogen at STP. This process does not
require sunlight or open ponds and produces very little sulfur dioxide so there is no
danger of poisoning the fuel cell. The process was developed by National Energy
Technology Laboratory and Brookhaven National Laboratory. The Institute of
Chemistry, Chinese Academy of Sciences, Beijing, generated hydrogen with
anaerobic mixed bacteria on a large scale using residues containing sucrose. 99 % of
the product gas is composed of hydrogen and carbon dioxide without methane.
Generally it has been found necessary to increase the bioactivity of hydrogen-
producing bacteria for these processes (Frost and Sullivan, 2004).
US Patent 6,737,184 by Rusta-Sellehy and Frank (2004) describes a chemical hydride
hydrogen generation system as a way to produce hydrogen by using sodium
borohydride which is reacted with steam in the gas phase to liberate hydrogen and
claims that under certain conditions the reaction can liberate essentially 100 % of the
hydrogen from the hydrides using steam.

CHAPTER 2 ___________________________________________
40
Hydrogen production is possible by water electrolysis. Hydrogen can be produced via
electrolysis using zero emission technologies to produce carbon-dioxide –free energy.
However, this would require a vast expansion of renewable energy capability to allow
sufficient capacity for hydrogen to be a contender to fossil fuel derived energy.
2.7 WATER ELECTROLYSIS
Hydrogen can be produced either at small or large scale at any location by
implementation of water electrolysis. Hydrogen production by electrolysis and
subsequent storage is one option for conversion and storage of energy. This process is
fundamentally important for renewable power generation applications. Renewable
sources of energy such as hydropower, ocean thermal energy conversion, tidal power,
solar, wind, geothermal or biomass can be used as energy source for driving
electrolysis systems for hydrogen production but only small decentralized electrolysis
systems can be coupled to these renewable energy sources without need for
significant additional infrastructure (R.Wurster and J. Schindler in Vielstich et al.,
2003: 64). Systems should be compatible with the fluctuating power supply that is
typical for renewable energy supplies.
In hydrogen production by electrolysis of water it is important to consider the
geographical location of energy generation, availability of water resources and
requirements for transport of energy in relation to the energy user. Electricity
provided to an electrolysis system should be available according to the system
requirements of power and voltage, thus usually needing rectifiers and inverters.
Other issues are requirements for small-scale versus large scale generators.
Furthermore, the benefits of distributed versus centralized production, requirements
for purification, and conversion technologies for liquefaction of hydrogen or gas
compression and storage should also be kept in mind. It will also be important to
evaluate the technical and economic feasibility of obtaining hydrogen from scattered
renewable sources within any particular region and transporting it to market. Life-

CHAPTER 2 ___________________________________________
41
cycle costs must be established to supply hydrogen to the end user via various options
such as either liquid or gas form; transportation with pipeline or tanker truck; storage
in metal hydrides or ethanol, etc. High-pressure electrolysis is feasible for
distributed, on-site hydrogen production without the need for additional compression
(usually to 5000 psi) and production of hydrogen by electrolysis would become much
more competitive by eliminating the need for a compression step. High pressure
generation would not only improve efficiency but also reduce the cost and
maintenance of compressors. High pressure electrolysis would make hydrogen
storage and transport in pipelines more feasible. Moreover, the use of hydrogen as
fuel in fuel cells to provide heat, power and cooling in homes, businesses and other
institutions is envisaged to become a practical option (Nordstrom, 2002).
Hydrogen generation by electrolysis include alkaline flow cells as well as solid state
electrolyzers that are based on reverse fuel cell systems called Proton Exchange
Membrane (PEM) electrolysis units (Ivy, 2004). Two types of electrolyzers are used,
based on the electrolyte, namely electrolyzers that typically use caustic electrolytes
(KOH or NaOH), and PEM based electolyzers that use solid polymer electrolytes
(SPE) and thus are also known as SPE electrolyzers. In electrolyzers it is possible to
separately generate the H2 in high purity but at relatively low pressures. The
electricity passed through the electrolyte solution splits water in to hydrogen and
oxygen. These gases are generated separately in chambers separated by a gas
impermeable membrane. Various other types of electrolytes can also be applied such
as acidic electrolytes to optimize conductivity. After purification from residual
oxygen the hydrogen can be compressed for storage. Unfortunately compression is
expensive. Companies that produce such systems are Norsk Hydro, Norway and
Stuart Energy, Canada, Shell etc. High pressure electrolyzers have been developed
for producing smaller volumes of hydrogen in the range of 10 to 65 Nm3 h-1. The
electrolyzer discharges the hydrogen at a pressure of 15 bar, which eliminates the
need for compressors. Atmospheric electrolyzers can produce hydrogen volumes
from 60 Nm3 h-1 or more (Barbir, 2005).

CHAPTER 2 ___________________________________________
42
PEM electrolyzers typically use a solid polymer electrolyte membrane such as Nafion
in the place of a fluid alkaline or acidic electrolyte. The electrolyzers have the ability
to electrochemically generate hydrogen at pressures of more than 2000 psi,
eliminating the need for mechanical compression. The benefits of PEM vs alkaline
electrolyzers are that the solid electrolyte should last for the lifetime of the
electrolyzer whereas the alkali electrolyte requires replenishing and disposal of
corrosive wastes. Moreover, the purity of H2 is significantly greater in a PEM system
and the hazards of explosive gas mixtures are eliminated. PEM electrolyzer
technologies have been commercially developed for hydrogen generation by
companies such as Ballard Power Systems or Hydrogenics Corporation, Canada and
Proton Energy Systems, United States. Automobile companies such as General
Motors are also involved to produce onboard systems. In vehicles, the liberated
hydrogen fuel prepared in an onboard system is stored in a metal hydride storage
module, prior to being fed to a fuel cell to produce electricity (Turner, 2004).
PEM electrolyzers can also be used in a format called a regenerative fuel cell system,
which uses renewable electricity to produce hydrogen by electrolysis and then by
reversing the process uses the hydrogen in turn, to produce electricity for power
applications. This system is suited for back up power systems that could be powered
by grid, renewable energy sources or hydroelectric sources (Lee et al., 2004).
Electrolyzers are available as pressurized units typically between 1 and 3 MPa.
Various types of industrial electrolysis units are commercialy produced. Some
involve an aqueous electrolyte solution of potassium hydroxide (usually 30 % v/v
KOH), which is used because of its high conductivity, and these units are referred to
as alkaline electrolyzers. These units can be either unipolar or bipolar (Ivy, 2004).
The unipolar electrolyzer resembles a tank and has electrodes connected in parallel. A
membrane is placed between the cathode and anode, which separates the hydrogen
and oxygen gases that are produced, but allows the transfer of ions. The bipolar
design resembles a filter press. Electrolysis cells are connected in series, and
hydrogen is produced on one side of the cell, oxygen on the other. Again, a

CHAPTER 2 ___________________________________________
43
membrane separates the electrodes. SPE or PEM electrolyzers may be applicable for
the home or as small neighbourhood systems (Ivy, 2004).
The high capital costs of SPE or PEM units limit their current viability in the large
hydrogen production market, while alkaline units, with their lower capital costs, can
produce hydrogen across a range of capacities. In the SPE unit the electrolyte is a
solid ion conducting membrane as opposed to the aqueous solution in the alkaline
electrolyzers. The membrane allows the H+ ion to transfer from the anode side of the
membrane to the cathode side, where it forms hydrogen. The SPE membrane also
serves to separate the hydrogen and oxygen gases, as oxygen is produced at the anode
on one side of the membrane and hydrogen is produced on the opposite side of the
membrane, at the cathode (Ivy, 2004).
The electrochemical dissociation of water includes:
Reduction of water : 4H2O + 4e- H2 + 2OH-
Oxidation of water : 2H2O - 4e- O2 + 4H+ + 4e-
The cathodic evolution of hydrogen from acidic solutions is due to a discharge of
hydroxonium ions:
H3O+ + e = ½H2 + H2O.
In alkaline and neutral solutions, hydrogen evolution is associated with a discharge
(ionization) of water molecules:
H2O + e = ½H2 + OH.
The cathodic evolution of hydrogen occurs at potentials that are more negative than
that of the equilibrium hydrogen electrode. A shift in the potential under the action of
an electric current, ϕi, from its equilibrium value, ϕτ, which is necessary to initiate the

CHAPTER 2 ___________________________________________
44
cathodic evolution of hydrogen on a given electrode at a given rate of j is termed as
the overvoltage of hydrogen evolution, ηH2.
The magnitude of the hydrogen overvoltage is a measure of the irreversibility of the
cathodic evolution process of hydrogen, and it is dependent upon the current density,
j, as well as the type of electrode, temperature, and electrolyte composition.
Depending on these factors, ηH2 might vary from a few millivolts to 1.5 V and more.
In the case of moderate or high values of the hydrogen overvoltage, its dependence
versus the current density is described by the Tafels equation (Tafel, 1905):
ηН2 = a + b lg j, (2.1)
where a and b are coefficients, which may be determined according to a linear sector
of the semi-logarithmic dependence ηН2 – lg j, or ϕj – lg j.
An analysis of both coefficients of the Tafels equation and the dependencies reached
provides a means to study the mechanism, the kinetics and the limiting stage of the
cathodic evolution of hydrogen. This dependence makes it possible also to obtain the
value of the exchange current density, lg jo, which characterizes the exchange kinetics
of the charged species between the electrode and solution at the equilibrium potential
ϕτ.
In a SPE system the reactions at the electrodes are:
Hydrogen Production at the Cathode: 2 H+ + 2e-→ H2
Oxygen Production at the Anode: H2O → ½ O2 + 2 H+ + 2e-
In an alkaline system the reaction at each electrode is:

CHAPTER 2 ___________________________________________
45
Alkaline Hydrogen Production at the Cathode: 2 H2O + 2e-→ H2 + 2OH-
Alkaline Oxygen Production at the Anode: 2OH-→ ½ O2 + 2 H2O + 2e-
The conversion efficiency of water to hydrogen is high, ranging from 80-95%.
Energy efficiency is defined as the higher heating value of hydrogen divided by the
energy consumed by the electrolysis system per kilogram of hydrogen produced. The
amount of energy currently needed to create hydrogen from water using electrolysis
is 39 kWh/kg. In order to determine the efficiency of the electrolysis process, the
theoretical amount of energy needed, 39 kWh/kg of hydrogen, needs to be divided by
the actual amount of energy used by the electrolysis unit to create hydrogen. The
energy efficiency of the electrolysis process ranges from 56-73% based upon the
higher heating value (HHV) of hydrogen. The PEM process currently has the lowest
efficiency at 56 % and bipolar alkaline efficiencies are the highest at 73 % (Ivy,
2004).
An electrolyzer producing 1 kg H2 working at a cell potential of 2 V uses 54 kWh. At
current electrolyzer efficiencies, in order to produce hydrogen at lower than $3.00 per
kg, electricity costs must be lower than 4 and 5.5 cents per kWh. For an ideal system
operating at 100 % efficiency, electricity costs must be less than 7.5 cents per kWh to
produce hydrogen at lower than $3.00 per kg (Ivy, 2004). Ivy (2004) determined that
for a small neighbourhood case (~20 kg H2/day), the capital costs become the major
cost factor, but electricity costs are still significant. This analysis demonstrated that
for all systems electricity price is a major contributor to hydrogen price.
The main requirements in efficient hydrogen generation on a large scale by water
electrolysis are the supporting electrolyte, low-cost, stable, large surface area
electrodes, high current densities and product separation from the electrolyte. For low
cost hydrogen production by water electrolysis, low cost high efficiency electrode
materials need to be developed.

CHAPTER 2 ___________________________________________
46
Water electrolysis with a solid polymer electrolyte (SPE)-cell possesses certain
advantages compared with the classical alkaline process such as increased energy
efficiency and specific production capacity and a simple system with a solid
electrolyte at a low temperature. The development of processes for catalyst
production and application on electrode membrane assemblies (MEAs) for solid
polymer electrolyte (SPE)-cells is of significance. The first electrolyzers using
polymer membranes as electrolyte were developed by General Electric Co. in 1966
for space applications. Extensive research and development on SPE electrolyzers has
been performed within the Japanese World Energy Network (WE-NET) program. A
cell voltage of 1.68 V at 1 A cm-2 was obtained on a single cell of 50 cm2 at 80 °C.
Kondoh et al. (2000) tested two cell stacks of 0.25 m2 X 10 for 2500 h at 1 A cm-2
with an average cell voltage of 1.74 V at 1 A cm-2 and 1.9 V at 2 A cm-2,
respectively. The Swiss company ABB developed the commercial MEMBREL™
process membrane electrolyzer in the period 1976/1989. Two units of 100 kW were
tested over the longer term with an average voltage 1.75 V at 1 A cm-2 and 80 °C.
The oxygen electrode is the main source of overpotential in this system. In contact
with the acidic Nafion membrane non-noble catalytic metals like Ni and Co will
corrode and Pt will be covered by a low conducting oxide film.
Conducting oxide materials have attracted considerable interest as activated cathodes
for electrocatalysis of H2 evolution (Patil et al., 2003). The oxygen electrode is the
main source of overpotential in the SPE electrolyzer system and IrO2 is one of several
oxides chosen as the active catalyst for the electrocatalytic process. The performance
of IrO2 as anode electrocatalyst has been found to be much superior to that of pure
platinum for oxygen evolution. (Blouion et al, 1997). The various methods used for
preparing Ir-oxide films include anodic oxidation (Beni et al., 1982), reactive
sputtering (Hackwood et al., 1982), electrodeposition (Yamanaka et al., 1989), sol–
gel (Takasu et al., 1994) and spray pyrolysis techniques (SPT) with variable thickness
(Patil et al., 2003). On the hydrogen evolution side (cathode) of an electrolyzer
metallic Pt is commonly used (Millet et al., 1993; Ioroi et al., 2000), but dissolves on
the anode side (Tafel, 1905). Pt can also be co-deposited on an oxide such as TiO2

CHAPTER 2 ___________________________________________
47
(Sato et al., 1980). Nanocrystalline electrodeposited Ni–Mo–C cathodes have recently
been developed for hydrogen production (Hashimoto et al., 2004)
Nanostructured materials can be applied as electroconductive and catalytic membrane
electrodes. Promising composite electrodes and nanophase electrocatalysts are much
more active for hydrogen generation than current commercial materials applied in
alkaline systems. Cost effective methods to prepare catalytically active, nanophase
inorganic membrane electrodes show significant promise to overcome current
obstacles to implementing large scale use of such materials. The incorporation of
nanophases into composite electrodes as electrocatalysts involve developing catalytic
inks, membrane electrode assemblies, gas diffusion layers, and cell design with
prototyping. Process development and optimization of electrochemical catalytic
systems are required for demonstration and cost evaluation of such systems.
The rate of the cathodic evolution of hydrogen depends upon the overvoltage, ηH2,
which depends in turn upon the nature of the electrode potential, its surface state, and
the conditions under which the electrolysis process is carried out. These conditions
are as follows: both concentration and temperature of the electrolyte solution, stirring
of the electrolyte solution, density of the polarizing current, and other factors that
may be difficult to control, need be taken into account, for example, the presence of a
reducing agent in a solution etc. To make a rational choice of electrode based upon
prediction of its performance, it is necessary to establish interdependence between the
ηH2 value of the metal of choice and any other relevant property. As has been
established for a number of metals (Petrii and Tsirlina, 1994), the exchange current
density, j0, (inversely dependent upon ηH2) increases as the energy of the
metal/hydrogen bond, GM-H, rises. This has been explained by the fact that an
increase in the bond energy results in a decrease of the activation energy of the
discharge stage of H3O+ ions or water molecules and an increase in activation energy
of the recombination process of atomic hydrogen.

CHAPTER 2 ___________________________________________
48
Use of the quantum-mechanical theory of electrode reactions adopted by Prisyazhyi
et al., (2000) to explain the reaction of hydrogen evolution on metals elucidates the
experimentally observed dependence of the exchange current density, j0, versus
adsorption of hydrogen atoms for different metallic electrodes. This characteristic
feature holds true for most metals. Therefore, the lowest values in the overvoltage of
hydrogen evolution are characteristic for those metals having the highest energy
values for the metal/hydrogen bond. The same metals possess a high degree of
adsorptivity of atomic hydrogen, show a trend to form hydrides, and are distinguished
by low desorption of hydrogen from their surfaces. Depending on the overvoltage
value of hydrogen evolution, the metals used to prepare cathodes are subdivided into
two main groups (Prisyazhyi et al., 2000) : those showing a low overvoltage, such as
Pt, Pd, Au, Rh, Re, Ir, Ni, Co, and Fe (here the high GM-H and j0 values are
characteristic), and those showing a high overvoltage, namely Sn, Bi, Zn, Pb, Ti, Ln,
Hg etc. (here the aforementioned values are low). As seen from this list, the first
group of metals mainly consists of precious metals - an essential drawback of which
is their high cost. Ni, Fe and Co belong to this group but as cathodic materials, the
widest use is made of Ni and Fe.
The activity of the cathodic catalyst depends not only upon the nature of the metal but
also upon its structure formed during the electrode molding process. Of the non-
platinum catalysts applied for hydrogen electrodes in alkaline solutions, skeletal
catalysts, mainly nickel based (Yusti, et al., 1962), are assumed to be the most
promising. Except for nickel, such skeletal catalysts may comprise other metals of
variable valence. A number of authors have revealed that the addition of such
elements as cobalt (Kudryashov et al., 1970a; Kudryashov et al., 1970b), tungsten,
chromium, titanium, zirconium etc. (Jaksis 1984) into the composition mixture
increased the activity of the catalysts. Electrodes with a current supply made of
stainless steel are of practical interest. The active coating might be applied onto an
iron support by plasma spraying of powders available for industrial use. As Sklyarov
et al., (1991) have shown, mixtures of the powdered alloyed stainless steel with
powdered aluminium and the nickel/aluminium alloy powder are promising as

CHAPTER 2 ___________________________________________
49
material for an active cathode coating. The stainless steel may contain between 6 to
10% of Co, Mo, Cr, Ni, and W in a mixture with aluminium powder. This may be
followed by leaching of the nickel skeletal catalyst, i.e., an alloy of nickel with
aluminium and other additives. Thermal treatment of the above mixtures provided a
means to obtain cathodes characterized by a low overvoltage (300 mV in 30wt %
KOH solution at a current density of 0.4 A cm-2 and a temperature of 90ºC). Such
cathodes were found to be stable with respect to contamination by iron and
maintained their characteristics during long-term operation. Various patents make
claims for Ni, Co and Fe or alloy electrodes as summarized in Table 2.1.

CHAPTER 2 ___________________________________________
50
Table 2.1 Summary of patents
No Patent No year Coating method Substrate Electrolyte Temp Over potential(mV)
Curr.dens.(mA/cm2)
Time(h)
Cell potential(V) / (A/cm2)
1 5,084,154 1990 Ni-Ti-Zr, plasma spraypower
Ni 45% NaOH 100 170195
400400
1800 (cathode)
2 4,839,015 Ni-Cr-Ti3 4,605,484 Ni-Cr4 4,586,998 1986 Pt electroplated Ni 35% NaOH 80
100300300
13000 cathode
5 4,567,374 1985 Co-Ni cosputteriing +post treatment
Ni, Co oralloys
17% NaOH 80 288310360295340410
100200500100200500
111460046004600 (anode)
6 4,498,962 Co-Ni surface enlarged+ Rh Ir: melt coating
Ni, Co oralloys
15% KOH 110 250 70 1.91 Cellpotential
7 4,447,302 Ni-Ti: hot pressed Ni 35% KOH 80 75>260
150200
(Cathode)1000h (Anode)
8 4,363,707 1982 NiS electroplated
plasma blown
Ni enlargedsurfacwe
33% KOH 160
160
1000100010001000
1 (cell)200 (cell)1 (cell)200 (cell)
1.8 / 10001.85 / 10001.68 / 10001.7 / 1000
9 4,361,602 1982 Ni-Rh electrolessplating
Surfaceenlarged Ni
40% KOH 100 200500
1.6 /2001.8 /500
10 4,251,344 Porous Ni sintering
Mild Fe
Fe 12% NaOH +16% NaCl
96 1.111.121.131.35
70145290155
CathodepotentialsCathodepotentials
11 4,100,049 Pd + Zr Ni, Co, Fe

CHAPTER 2 ___________________________________________
51
So far, only Pt or Pt alloys can efficiency keep the stability of the oxygen-electrode
catalyst activity in fuel cells. Previously pure Pt black was used as catalyst and the
dosage was 4mg cm-2. In recent years, the dosage of carbon-supported black Pt
catalyst is 0.5mg cm-2. Using relative larger surface area supported material is an
effective method in which it is possible to achieve highly dispersed Pt crystallite and
reduce the ratio of catalyst applied. The requirements of a support for an active
electrocatalyst are that it must provide a structural, conductive, and durable support
for the active metal particles. By far the most common support materials used in
PEMFCs are carbon blacks. As expected, increasing the surface area of the carbon
leads to greater Pt dispersion at a given loading. Uchida et al. (1996) showed that Pt
crystallite size decreased from 3.7 to 1.0 nm when the carbon surface area increased
from 58 to 1500 m2 g-1 for a series of 23 to 24nm wt% Pt catalysts. Similarly,
Tokumisu et al. (1999) reported that increasing the carbon surface from 60 m2 g-1 to
over 1300 m2 g-1 leads to a reduction in Pt particle size from 2.5 to 1.5nm for 10 wt%
catalyst. However, despite the increase in Pt surface area achieved by higher-area
carbon support, both these studies showed little effect of carbon support on activity. It
was suggested that both the Pt particle size effect and the interaction of the ionomer
with the carbon support played important roles in determining activity.
In conclusion, the literature review presented in Chapter 2 was used to develop the
thesis topic and the main perspective, rationale and motivation, research approach
and scope of study as well as the delimitation of the study, as was presented in
Chapter 1. The research design, refinement of approach and research hypothesis as
well as the delimitations of the research and the main perspective from which the
topic was researched were also developed from the perspective gained from the
literature review and were set out in Chapter 1. More detailed and specific review of
the applicable literature will be presented in the introductory sections presented in
Chapters 3-7.

CHAPTER 3 ___________________________________________
52
3 NANOPHASE SUBSTRATES AND SUPPORTS FOR ELECTRO-CATALYSTS
3.1 INTRODUCTION
The approach in this aspect of the study was to explore the use of three dimensional
porous substrates as supports for high dispersion of active nanophase Pt
electrocatalysts for hydrogen production in a solid state electrolyzer. Because two
dimensional electrode surfaces do not provide sufficiently high catalytic activity for
hydrogen production or fuel cell applications, the highest number of active sites per
unit volume may be obtainable using three dimensional materials as supports for the
electrocatalysts. New routes to form nanophase electrocatalysts on such supports are
necessary because current techniques are costly, laborious, and require sophisticated
fabrication facilities, thus are not industrially or economically viable in the local
South African environment.
This section will focus on microporous, and mesoporous support substrates and their
characteristics. Methods to achieve dispersion of the metal nanophase upon these
supports will be detailed in Chapters 4 and 5.
3.2 OVERVIEW OF SUPPORT SUBSTRATES
Various support substrates have previously been considered for preparation of three
dimensional porous substrates as supports for high dispersion of active nanophase Pt
electrocatalysts. Typically in gas phase catalysis of hydrocarbons, Pt supported
zeolites (Ho et al., 1998) are used as bifunctional heterogeneous catalysts. More
recent efforts have included the use of mesoporous materials and high surface area
carbon substrates such as carbon black, carbon nanotubes and mesoporous carbons,

CHAPTER 3 ___________________________________________
53
the purpose being to form a three dimensional array of pores with interconnected
channels, so that metal catalysts can be highly dispersed without agglomeration and
that the two way flow of liquid reactants and gaseous products may not be impeded
(Xie et al., 2008).
3.2.1 Microporous supports: Zeolites
Zeolites are crystalline aluminosilicate materials with regular uniform, Angstrom
sized pore systems. Zeolites have the following unique properties (Moscou, 1991;
Maxwell and Stork, 2001): Microporous character with uniform pore dimensions;
Ion-exchange properties; Ability to possess acidity; High thermal and hydrothermal
stability. The framework oxide structures are associated with certain unique features,
among which the strictly uniform two – or three dimensional pores of characteristic
diameters and widths, give rise to a pronounced “sieving action”, on the molecular
scale (Meier, 1968). According to the IUPAC classification, micropores have a
diameter (dp) smaller than 20 Å (Weitkamp, 2000). Hence zeolites are structured
nanophase materials.
Zeolites offer extremely large specific surface areas because of their high micro
porosity with pores typically in the Ångstrom range. The surface areas of fully
crystalline zeolites are typically in the order of 400-600 m2g-1, of which
approximately 66-85 % is internal, in the microporous channel. Zeolites are stable to
well over 1000 °C, allowing thermal regeneration of these catalysts, and are resistant
to attrition posing few handling problems. Surface properties can be either
hydrophilic or hydrophobic based on the desired degree of incorporation of Al into
the lattice framework. A highly siliceous zeolite repels water. On the other hand Al
rich zeolites attract water. The relative affinity of various hydrocarbon compounds for
the zeolite surface and the zeolite pore size may allow separations of mixtures of

CHAPTER 3 ___________________________________________
54
hydrocarbons. There are more than 200 unique zeolitic structures that have been
identified in nature or synthesized (Szostak, 1992)
Figure 3.1 Schematic of unit cell structure of zeolite FAU (IZA_online, 2008).
Unit cell formulae differ for each unique zeolite structure, depending on the
configuration of the framework and its composition. The empirical unit cell formula
of a zeolite is of the type: M2/nO • Al2O3 • xSiO2 • yH2O, where M is any alkali or
alkaline earth atom, n is the charge on that atom, x is a number from 2 to 10, and y is
a number from 2 to 7. For example, for FAU (alternatively known as zeolite Y or
faujasite) the formula is (Na58)(Al58Si134O384)•240H2O. Atoms within the second set
of parentheses are structural atoms, because with oxygen they make up the rigid
lattice framework of the structure. Those within the first set of parentheses are known
as exchangeable ions, because they can be replaced (exchanged) more or less easily
with other cations in aqueous solution, without affecting the aluminosilicate
framework (Szostak, 1992; Feijen et al., in Ertl and Knozinger, 1997).

CHAPTER 3 ___________________________________________
55
Natural zeolite mineral phases may originate from volcanic ash. The chemical
reaction of glassy volcanic ash (source of aluminosilicate) with pervading pore water
changes the glass fraction into various crystalline mineral zeolite phases over
geological time scales under certain conditions. Many pure zeolite types can also be
prepared more rapidly via various hydrothermal synthetic routes (Ginter 1989; Petrik
et al., 1995; Petrik et al., 2008). The hydrothermal synthesis of aluminosilicate
zeolites corresponds to the conversion of a mixture of silicon and aluminium
compounds, alkali metal cations, organic molecules in some cases and water via an
alkaline supersaturated solution into a microporous crystalline aluminosilicate.
Synthetic zeolites play a major role on industrial scale, in terms of catalysis,
molecular sieving and environmental protection (Ertl and Knozinger, 1997).
The negative charge of the zeolite lattice framework is caused by the substitution of
Si4+ with Al3+. The residing excess negative charge requires the introduction of
charge compensating cations to stabilize the structure. These charge compensating
cations are not incorporated into the lattice framework or covalently bound to the
zeolite structure, but have considerable freedom of movement and can readily be
substituted with a host of other cations. The charge balancing cation associated with
the framework acid site is usually a Group I element such as Na or K (Barrer, 1981;
1982). Group II elements such as Mg and Ca are also used to change pore diameters,
exchange- or catalytic properties. For acid catalysis the charge balancing cation is
exchanged with NH4+ and then calcined at 500 °C to activate and generate the acidic,
H-form of the zeolite catalyst (Ertl and Knozinger, 1997). Various other metals such
as Pt and Pd can also be exchanged into the zeolite, to form bi-functional catalysts.
The Si/Al ratio usually determines the amount of exchangeable cations that may be
present within the pores of a zeolite and this, as well as the relative accessibility of
the cation, will define to what extent the cations may be exchanged. The lowest Si/Al
ratio is 1:1, due to the next nearest neighbour (NNN) exclusion principle, thus T-O-T
linkages may not accommodate two adjacent Al atoms. The highest Si/Al ratio is

CHAPTER 3 ___________________________________________
56
unlimited, but depends on whether a completely siliceous composition is stable for a
particular structure (Breck, 1973).
Among the active sites on the zeolite surface, some have a fixed charge and thus
represent the effective negative charge of the zeolite; as such they may be referred to
as permanently active charged sites or Brönsted acid sites. Thus, the bridged ≡Al-O-
Si≡ functional groups represent Brönsted acid sites which can be used for potential
ion exchange, acid catalysis or complex formation (Ikhsan et al., 1999; Tamura,
2004). Catalytic activity is determined by the relative amount of bridging hydroxyl
groups and this in turn is typically determined by the amount of Al incorporated in
the framework.
The strength of the acid site is a function of its isolation. Typically weak acid sites
occur in material with a Si/Al ratio of <12, in other words Al rich materials, and
strong acid sites above this ratio (Ginter et al., 1989). A basic catalyst is prepared by
substituting a metal such as Titanium for the Al in the lattice framework. In many
cases it is necessary to incorporate a metal centre in the zeolite to prepare a
bifunctional and active catalyst and this is the case in the preparation of
electrocatalysts as is envisaged in this study. As zeolites are well known to stabilize
metal centres, these materials were considered to be suitable to prepare
electrocatalysts and were found to provide a stable, constraining environment for
dispersion of the nanophase metal (Rolison et al.,1992; Bessel et al., 1992; Petrik,
2002)
3.2.2 Mesoporous materials
Mesoporous materials are defined as having pores with diameters between 2 – 50 nm.
Ordered mesoporous materials are used extensively in separation science, catalysis,
and various ‘host-guest’ chemistry applications (Langley and Hulliger, 1999;
Hartmann, 2005; Li et al., 2008). Initially these materials consisted of various

CHAPTER 3 ___________________________________________
57
inorganic materials either silica or alumina based (Pauly and Pinnavaia, 2001; Tanev
and Pinnavaia, 1995). More recently a range of other elements have been
incorporated into these materials (Shan et al., 2002; Liu et al., 2006; Li et al., 2007).
With the advent of carbon based mesoporous materials (Kim et al.,2003; Lee et al.,
2006; Fuertes et al., 2003), the range of potential applications for mesoporous
materials has been extended to include separation science, catalysis, non-hydrocarbon
based energy systems, and biomedical applications.
Carbon nanostructured materials (CNM) have gathered research momentum in recent
years. The various forms of CNMs include, but is not limited too, ordered
mesoporous carbon (OMC) materials (Lee et al., 2006; Kim et al., 2003; Fuertes et
al., 2003), carbon nanotubes (CNTs) (Baughman et al., 2002; Popov, 2004) and
nanofibers (CNFs) (De Jong et al., 2000; Che et al., 1998), carbon nanoballs (Liu et
al., 2002), and carbon nanowalls (Wu et al., 2002). When examining the volume of
literature available on the different CNMs, in terms of potential applications OMCs,
CNTs, and CNFs have proven to be the most practical forms of carbon
nanostructured materials.
CNTs can be defined as mesoporous materials since they have pores in this range
(Lee et al., 2006). Typical sizes for CNT’s are an inner diameter of 1-3 nm and an
outer diameter of approximately 10 nm. Their length can vary considerably
depending on the method of preparation. Extensive research in synthesis methods are
reported online and in the scientific literature since early reports were made of this
new material (W. Krätschmer 1990; Benning, 1993; Iijima, 1991; 1993). The most
common methods for preparing CNT’s include arc discharge, chemical vapour
deposition (CVD) and laser ablation (Nanotube Synthesis, 2008). Laser ablation
produces a small amount of clean nanotubes whereas arc discharge methods generally
produce impure materials. CVD synthesis is achieved by subjecting a gas phase
carbon source such as methane, carbon monoxide, benzene and acetylene to pyrolysis
by thermal energy at about 700 °C. The gaseous carbon source is brought into contact
with a catalyst such as Ni, Fe or Co where it will bind to form the CNT. A method to

CHAPTER 3 ___________________________________________
58
prepare CNTs using nebulized spray pyrolysis and other vapour phase techniques
have recently been reported (Vivekchand et al., 2004; Govindaraj 2007). It is
proposed that CNT mechanism of growth involves a nucleation process where growth
of the CNT occurs on the catalyst surface through atoms of the gas phase carbon
source being captured. Purifying CNTs using acid treatments can cause loss of
structure and disorders the walls (Strong et al., 2003). It has been reported that Pt can
be deposited electrochemically upon the exterior walls of CNTs (Adora, 2004) or by
in situ deposition (Wang et al., 2006). CNTs can form bundles of tubules, which are
organized structures held together by weak van der Waals’ forces (Popov, 2004).
In contrast, OMC are an intricately connected network of covalently bonded carbon
material with periodic pores in the mesoporous size regime in the nanometer range
(Lee et al., 2006; Kim et al., 2003; Fuertes et al., 2003; Li et al., 2008). The desired
mesoporous ordering can be derived from a silica based mesoporous precursor that
provides control over the final OMC. One of the most facile methods for the
synthesis of OMCs is the template method. The choice of template determines the
pore size, arrangement of the pores and thus the overall structure of the resulting
OMC. In order to synthesize OMCs, silica templates with an ordered and
interconnected pore structure need to be used to produce a structurally stable OMC.
Such ordered mesoporous silica templates can be synthesized with the desired
mesoporous ordering, which in turn provides control over the final OMC. In general,
OMCs can be synthesized by first impregnating the Si template with a suitable carbon
precursor, followed by a separate carbonization step. Alternatively, the carbon
precursor can impregnate the template and undergo decomposition to carbon at the
same time using a chemical vapour deposition (CVD) process. In both methods the
silica based mesoporous template has to be removed in a separate step (Lee et al.,
2006; Kim et al., 2003; Fuertes et al., 2003; Langley and Hulliger, 1999; Hartmann,
2005).

CHAPTER 3 ___________________________________________
59
CVD is a relatively easy method to implement and the added simplicity of infiltration
and decomposition in one continuous process is a key reason this method was
explored to produce the OMC materials.
3.3 EXPERIMENTAL
3.3.1 Preparation of the microporous zeolite support
Commercial FAU zeolite was obtained from Zeolyst company and characterized prior
to using this material as support for metals. The specifications for Zeolite H-FAU
(CBV780 Lot. No 78001N00257; Zeolyst International) is a dealuminated faujasite
with a given analysis of: Si/Al 80; wt% Na 0.03; BET surface area of 780 m2 g-1.
3.3.2 Preparation of the Mesoporous Silica Template
The HMS silica based mesoporous precursor was synthesized by adapting methods
from Zhang et al., (1997). Initially 4.0 g of the surfactant 1-hexadecylamine (Aldrich)
was added to 350.0 mL of an ethanol/water mixture (35/70, v/v). The mixture was
stirred in an open vessel for 24 h. 50.0 mL of tetraethoxysilane (TEOS, Aldrich) was
then added drop-wise to the mixture (1-hexadecylamine in ethanol/water) whilst
continuously stirring the solution. After adding the TEOS, the mixture was left to stir
under ambient conditions for 24 h. For HMS assembly where water:ethanol ratio was
25/10, the molar compositions of the reaction mixture was 16 TEOS: 0.066
surfactant: 10 EtOH: 25 H2O. The solid product was then filtered (Whatman, 545
grade filter paper) and washed with distilled water. 150.0 mL of 100.0 % ethanol
(Kimix, South Africa) was mixed with the solid product and then refluxed under air
at 120 °C for 2.0 h. The resulting suspension was then filtered and dried at 100 °C in
a muffle furnace. Calcination of the dry solid product was done in a muffle furnace
using a heating rate of 1 °C min-1, a final temperature of 550 °C, and holding the
CHAPTER 3 ___________________________________________
60
furnace at 550 °C for 8.0 h. The final yield of the HMS silica template was
approximately 2.0 g when using the specified amounts of starting materials.
MCM-41 was synthesized at room temperature. Cetytrimethylammonium bromide
(CTAB) was used as template in order to control the pore size of the resulting
mesoporous silica. A typical preparation was as follow: CTAB (4.0 g) was dissolved
in 250 mL of HCl solution. The mixture was stirred at room temperature for 1 h, then
TEOS (20 mL) was added to the above solution. The mixture was vigorously stirred
in a sealed flask under ambient conditions for 20 h. The resulting white precipitate
was filtered, washed by water and dried at room temperature. Template removal was
achieved either by calcination at 550 °C for 4 h.
3.3.3 Preparation of the ordered mesoporous carbon (OMC)
1.0 g of HMS was loaded in to a ceramic sample boat; this was then placed inside a
quartz tube located in a horizontally aligned tube furnace. Once appropriately sealed,
an LPG flow was initiated at 50.0 mL min-1, and the furnace was ramped to
temperatures between 600-800 °C using a heating rate of 1.67 °C min-1. After 90 min,
the LPG flow was terminated and the furnace was cooled to ambient. The resulting
mesoporous silica/carbon composite was refluxed with 50.0 mL of 1.0 M NaOH
(Kimix, South Africa) at 75 °C for 3.0 h, and the mixture was continuously stirred to
aid in dissolving the silica template. The product was rinsed with ultra pure water
over a nylon membrane filter (0.45 μm pores, Whatman), until the pH was between 7
and 8 as determined by pH paper. Finally the product was dried at 100 °C in an oven
for 60 minutes.
3.3.4 Preparation of the Carbon Nanotubes

CHAPTER 3 ___________________________________________
61
CNTs were prepared according to Vivekchand et al., (2003) by pyrolysis of a
ferrocene-toluene (20.00 g L-1) solution which mixture was fed into a quartz tube
reactor at 900 ºC in the form of a fine nebulised spray generated by ultrasound. Ar
was used as the carrier gas at a flow of 500 cm-3 min-1. The nebuliser frequency was
1.6 MHz and the total reaction time was 45 min (Pinault et al, 2005). A further
sample of CNT was synthesized under the same conditions, by the nebulised spray
pyrolysis of a solution of ferrocene in benzene. The prepared CNTs were collected
and about 0.2 g of CNTs were weighed out and placed into a round bottomed flask
fitted with a thermostat and thermometer, where after 100 mL mixture of a sulphuric
acid-nitric acid (2:3 ratio by volume of concentrated sulphuric acid (98 %) and
concentrated nitric acid (55 %), was carefully added into the flask. The CNTs were
heated under reflux for three hours in this solution, where after the mixture was
cooled down and filtered using a Buchner apparatus. Acid treatment of CNTs was
used to break up bundles, to reduce their length and remove metal impurities present
from the catalyst used during synthesis. The CNTs were recovered upon a filter
paper, washed until the rinse water had a pH of between 6 and 7 as determined by
indicator paper and then dried at 100 °C overnight.
3.3.5 Characterization
The methods described below provide a fairly comprehensive overview of the
analyses and measurements that were undertaken during this study. However, it
should be noted that not all measurements and analyses were done on every sample.
Many experiments were undertaken to investigate the effect of an altered parameter
on only one or two variables (e.g. crystallinity, activity, etc.). Full analysis of all
samples would therefore be unnecessary and costly. The various analytical techniques
and are described in more detail in each chapter where applicable. Crystal/atomic
structure and metal particle size was determined by X-ray Diffractometry (XRD,
Bruker AXS D8 Advance, Cu Kα (λ = 1.5418), 0.05 degrees min-1). Qualitative
crystallinity and crystal symmetry was determined by Selected Area Electron
Diffraction (SAED, Hitachi H-800 EM, 200 kV, 20 μA). Surface micro- and

CHAPTER 3 ___________________________________________
62
macrostructure, and degree of agglomeration were determined by High-Resolution
Scanning Electron Microscopy (HRSEM, Zeiss Ultra 55 Field Emission – In-lens
detection, 30 kV, 80 μA). Aggregate particle size and distribution was determined by
Non-Invasive Beam Scattering (NIBS, Malvern HPPS, ethanol/water dispersant, 0.1
mg L-1, 25 °C). Metal particle size, particle size distribution, metal surface area, and
metal dispersion/agglomeration were established by Transmission Electron
Microscopy (TEM, Hitachi H-800 EM, 200 kV, 20 μA) and total surface area and
porosity by N2-adsorption at -196 ºC (77 K) (Micromeritics ASAP 2010, 20 mg
sample). Topography and surface elemental distribution of electrocatalyst cast-films
was studied using Particle-Induced X-ray Emission Spectroscopy (micro-PIXE,
Oxford, 3 MeV). Topography and surface activity of electrocatalyst cast-films was
studied with Scanning Electrochemical Microscopy (SECM, Uniscan Instruments
SECM 270, 0.005M H2SO4 electrolyte, separation - 5μm, raster speed - 5μm s-1).
Thermal stability was determined with Thermogravimetry (TGA, Rheometric
Scientific STA 1500, N2 - 50 mL min-1, 25 – 850 °C, 15 °C min-1). Surface oxidized
species (metal chemical state) were analyzed using Temperature-Programmed
Reduction (TPR, Micromeritics Autochem 2910, 25 mg sample, -80 – 900 °C, 15 °C
min-1, H2/Ar - 50 mL min-1). Electro catalytic activity was compared using Chrono
Voltammetry or Cyclic Voltammetry (CV), using the Autolab PGSTAT 30, or BAS
100 electro-analytical systems). Rheology of inks was determined using an Anton
Paar Physica MCR 300 system. Hall mobility and resistivity was measured using a
Lakeshore 775 HMS Matrix Hall measurement system. Further details of
experimental set-ups will be specified where applicable in each chapter.
Operating parameters utilized during the characterization of materials prepared in this
study were as follows: The X-ray diffraction spectra were obtained using a Phillips
X-ray diffractometer fitted with a copper tube of Kα radiation of wavelength λ = 1.54
Å. Operating parameters of the XRD were: Scanning range 4-47 °2θ; Step size 0.1
°2θ; Time constant 1 s; Preset 1000 counts s-1; Voltage 40 kV; Current 25mA; Anti-
scatter slit 1°.

CHAPTER 3 ___________________________________________
63
Scanning calorimmetry, namely specific heat capacity, phase transitions and heat of
reaction (endothermic and exothermic) as well as thermo gravimmetry including
thermal decomposition and volatile content was performed using a thermal analyser
(STA thermal analyzer TGA/DTA/STA (gravimetric/calorimetric) by Rheometrix).
Approximately 50 mg of as-synthesised, washed and dried sample was equilibrated at
40 °C for one hour in flowing N2 (30 mL min-1) in the thermal analyser. Thereafter it
was heated to the specified temperature at 10 °C min-1 in flowing N2 (30 mL min-1)
and held at this temperature for the required time.
The composition and % metal loading was determined using EDS. The 40 kV Hitachi
X650 SEM that was used for obtaining micrographs, was equipped with a Phillips
EDAX Energy Dispersive System utilizing a detector with a super ultra thin window
offering a resolution of 139 eV. Another instrument, the LEO S440 Analytical SEM,
fitted with a KEVEX detector was used to confirm analysis. This instrument was
fitted with a berylium window and the operational conditions were an accelerating
voltage of 20 kV, and a working distance of 25 mm. Analysis was performed upon
carbon coated samples mounted upon aluminium stubs using colloidal glue mixed
with conductive carbon.
Scanning electron micrographs (SEM's) were obtained using a 40 kV Hitachi X650
SEM capable of a 10 nm resolution. This instrument was used to determine the
approximate particle size, morphology and elemental composition (using energy
dispersive spectroscopy (EDS)) of the zeolite crystals. The samples were mounted on
aluminium stubs, that had been covered with a mixture of water based glue and
colloidal carbon. Thereafter, the samples were coated with a thin layer of Au (carbon
samples OMC and CNT were not coated). Operating parameters of the SEM were:
Accelerating Voltage 15 keV; Aperture 30; Tilt Angle 30°; Resolution 9; Working
Distance 10 to 20 mm. High-Resolution Scanning Electron Microscopy (HRSEM)
was performed using the Zeiss Ultra 55 Field Emission with In-lens detection, at 30
kV and 80 μA.

CHAPTER 3 ___________________________________________
64
The Transmission electron microscope (TEM) was used to determine the structure,
size or morphology of materials. All prepared samples were viewed and
photographed at 200 kV in a Joel 200CX microscope, after immobilization in resin
followed by microtomy to prepared ultra thin sections that were mounted upon
copper grids. High resolution transmission electron micrographs (HRTEM) were
taken using a Tecnai G2 F20 X-Twin (FEI company, Eindhoven, the Netherlands).
Fourier Transform Infrared spectroscopy (FTIR) has been extensively used to
characterise zeolites before and after post synthesis modifications. This method of
characterization is very useful for identifying the different functional groups as well
as to characterize acid sites. The spectral analysis from FTIR spectroscopy can be
used to identify specific molecular groups that occur within the solid or crystal that
has being formed e.g. Si-O bond stretching are found to be in the range 700 to 1100
cm-1. Mid-IR spectra of zeolites in the range 1400-200 cm-1 are generally used for the
investigation of the framework properties of zeolites. Dried zeolite samples were
prepared for scanning by mixing about 0.08 g of dried sample with KBr in a ratio of
1:100. This mixture was finely ground, dried at 100 °C and then pressed into a disc.
Nitrogen porosimetry using a Micromeritics ASAP2000, was used to determine pore
size distribution and surface area of selected samples. Approximately 0.5 g sample
was dried at 120 -200 °C until a vacuum of 5mm mercury could be obtained.
Thereafter the nitrogen adsorption experiment was commenced. The amount of
nitrogen adsorbed at LN2 temperatures, saturation pressure of N2 (local atmospheric
pressure), the partial pressure of N2 over the sample (30% local atmosphere) and
sample weight were used to calculate total surface area, by the Brunauer, Emmett,
and Teller (BET) method. The mesopore surface areas were determined from the BJH
desorption curves and represent the intracrystalline mesopores between 20-500 Å.
The TPR analysis was performed by flowing an analysis gas (hydrogen in an inert
carrier gas such as nitrogen or argon) through ~0.5 g sample, at ambient temperature.
While the gas is flowing, the temperature of the sample was increased linearly with

CHAPTER 3 ___________________________________________
65
time and the consumption of hydrogen by adsorption/reaction was monitored.
Changes in the concentration of the gas mixture downstream from the reaction cell
were determined. This information yielded the volume of hydrogen uptake.
3.4 RESULTS AND DISCUSSION
3.4.1 Characteristics of zeolite FAU
The micropore structure and pore size of commercial zeolite FAU (CBV400) was
confirmed with HRTEM as shown in Figure 3.2 and 3.3.
Figure 3.2 HRTEM of zeolite FAU and general crystal structure (Inset SAED)
10 nm10 nm

CHAPTER 3 ___________________________________________
66
Figure 3.3 HRTEM image of FAU with pore orientation
The best crystal orientation observed in the HRTEM images is [110], where the pores
are lying in line (Figure 3.3). Analysis of the grey scale of the marked area in Figure
3.3 along one axis is presented in Figure 3.4, which shows the intensity of the
grayscale tone on the y-axis. The dimension of this intensity fluctuation gives another
means of probing the pore size which is analyzed to be 0.77 nm.
Figure 3.4 Analysis of pore size of zeolite FAU
The HRTEM of zeolite FAU (Figure 3.2) showing the regular angstrom sized pore
array and ordered crystalline structure, highlights the potential to use the three
dimensional surface area as a substrate to disperse and stabilize the metal
electrocatalyst. The measurement of the enlarged image (Figure 3.3) confirms the

CHAPTER 3 ___________________________________________
67
pore size is roughly 0.77 nm which is further substantiated by the analysis of the pore
size (Figure 3.4). X-ray analysis by EDS (Figure 3.5) shows the composition of FAU
is Si, O, Al, with high Si/Al ratio (this sample was dealuminated). The trace of carbon
possibly comes from the supporting film underneath.
Figure 3.5 X-Ray analysis (EDS) of composition of zeolite FAU
0
5 0 0
1 0 0 0
1 5 0 0
2 0 0 0
0 1 0 2 0 3 0 4 0 5 0 6 0 7 0 8 0
A n g le 2 T h e ta
coun
ts/s
Figure 3.6 XRD of commercial FAU (CBV400)
The XRD of the commercial zeolite FAU shows the typical peak at a low angle of 6
°2θ that defines the pore width of 7.7 Å as was confirmed by the HRTEM images and
measurements. Other peaks define the complex geometry of the unit cell lattice
Energy (keV)
Cou
nts
151050
1000
800
600
400
200
0
O
Si
C
Al CuCu

CHAPTER 3 ___________________________________________
68
framework as was graphically shown in Figure 3.1 and confirmed by Eva software
(JCPDS library supplied with instrument).
Figure 3.7 Thermal analysis of zeolite FAU
Thermal analysis (Figure 3.7) shows the thermal stability of the zeolite framework
and the high capability of the zeolite to adsorb moisture, with about 26 % mass loss
up to 600 ºC due to the high moisture content of this hydrophilic zeolite type. The
high adsorption capacity for moisture as was observed from thermal analysis as well
as the regular porosity visible in the HRTEM images show the high void space in the
host zeolite pores, which space is available for the incorporation of metal species.

CHAPTER 3 ___________________________________________
69
Figure 3.8 FTIR spectrum of FAU
The FTIR spectrum (Figure 3.8) shows the framework structural bands typical of
FAU in the region below 600 cm-1 as well as the silicate ring structures typical of
zeolites between 1000 and 1200 cm-1. Mid-IR spectra of zeolites in the range 1400-
200 cm-1 are generally used for the investigation of the framework properties of
zeolites. The vibrational frequencies of zeolite framework are mostly found to be
between 300 cm-1 and 1200 cm-1 for the crystalline zeolite structure. Various bands
visible in the spectrum can be assigned to the following species according to Bass and
Turner (1997)
Table 3.1 FTIR spectra for Silicate assignment (after Bass and Turner, 1997) Wavenumber (cm-1) Assignment 900-850 monomeric silicate species 885 small SiO- 985 (Monomer +trimer,dimer and tetramer) = Q1 950-910 Monomer dimer. 1000-1010 Mainly linear molecules 1050-1020 SiO-1 cyclic anions 1070-1030 Q2 (3R) rings 1120-1050 Q3 (3R) , Q2 (4R) and linear Q2 1300-1100 Polymer 975,920,850 Monomer alkaline silicates 900-650 Water band

CHAPTER 3 ___________________________________________
70
Zeolites are well known as ion-exchange materials (Somerset et al., 2005) and acid
catalysts (Petrik et al., 1995) and their acid sites promote the stabilization of metals. It
has also been demonstrated that zeolites can be hydrothermally grown directly onto
carbon substrates (Smith et al., 1995; Petrik, 2003) which would facilitate their
incorporation onto a conductive substrate such as a carbon fibre gas diffusion
electrode. Therefore these zeolite materials may be suitable high surface area, three
dimensional substrates for preparing dispersed Pt electrocatalysts as is further
described in Chapters 4 and 5.
3.4.2 Characteristics of mesoporous substrates
3.4.2.1 Ordered mesoporous silica and carbon
Carbonization of the parent silica substrate, HMS by pyrolysis with LPG using a
CVD technique was performed (Petrik et al., 2008). The CVD technique was applied
to infiltrate the mesoporous pores with carbon and thus use HMS as sacrificial matrix
for preparing a mesoporous carbon. Figure 3.9 shows the STEM/ESB micrographs of
parent HMS silica template before (Figure 3.9 (a)) and after carbon infiltration using
CVD (Figure 3.9 (b)), and the new ordered mesoporous carbon (OMC) material
(Figure 3.9 (c)) obtained after removal of the silica based template with NaOH
etching. It was first established that the Si matrix can readily be dissolved by use of
1M NaOH. The sample after LPG carbonization contained between 78 % and 89 %
carbon by EDS analysis for carbonization times ranging from 15 min to 90 mins
respectively, thus the pores were readily filled with carbon as can be seen in Figure
3.9 (b) showing a HMS sample carbonized for 90 minutes. The structural matrix of
the HMS with pores occluded by carbon in-filling, is visible in the micrograph.
Although LPG infiltrated the template HMS and began to decompose to carbon
species at 600 ºC and 700 ºC there was no formation of the graphitic OMC at these
temperatures, whereas a temperature of 800 °C and 90 minutes exposure to the LPG
flow was successful to produce OMC. Shorter times allowed carbonization of the

CHAPTER 3 ___________________________________________
71
substrate surfaces. The ordered mesoporous carbon (OMC) obtained after dissolution
of the Si matrix (Figure 3.9 (c)) had a significantly smaller particle size than the
parent HMS as the carbon deposited by CVD occupied the pore voids of the HMS.
The ordered wormhole porous nature of the OMC analogous to HMS is visible in the
HRTEM image presented in Figure 3.9(d).
(a) HMS silica template (b) HMS infiltrated with carbon
(c) OMC analogue after removal of silica template
(d) HRTEM of OMC showing wormhole pore structures analogous to HMS
Figure 3.9 STEM/ESB and HRTEM images of mesoporous substrates
XRD spectra of the sacrificial template HMS, the carbon infiltrated HMS, and the
OMC analogue recovered after removal of silica template are shown in Figure 3.10.

CHAPTER 3 ___________________________________________
72
Figure 3.10 XRD of HMS, HMS in-filled with carbon and OMC analogue
The XRD of the HMS template is devoid of any characteristic sharp peaks at
relatively high angles, which is typical for this material (Figure 3.10) (Pauli and
Pinnavaia, 2001). The OMC had well defined peaks at 2 θ values of 7.39°, 25.3° and
43.5°. The 2 θ values of peaks appearing at 25.3° and 43.5° are ascribed to the (002)
and (101) diffraction peaks of graphitic carbon in the OMC pore walls. The d002
spacing obtained from the (002) peak is 3.38 Å, which is very close to the d spacing
of ideal graphite (with d002 = 3.35 Å). The peak at 12.64° has not been observed
previously for the periodic structures of OMC’s. This peak is attributed to C(004).
This peak at an angle of 12.64° is a further indication of an ordered graphitic carbon
framework appearing at periodic intervals.
Figure 3.11 shows the low angle XRD between 0 and 8 º2θ of the OMC analogue
after removal of silica template with an inset of the SAED of the OMC, showing its
graphitic crystalline nature. Peaks between 0º - 5º 2 θ were observed during low angle
XRD scans (Figure 3.11) done between 2θ values of 0.50° and 9.9° 2 θ at a step size
of 0.0330° for both HMS and OMC. These peaks are indicative of regular
mesoperiodicity which is a feature of mesoporous materials with pores in the
nanometer region. The low angle XRD peak (Figure 3.11), for the silica HMS
template was at 2.4 ° 2 θ with a d-space centred at 3.6Å and that of the OMC at 1.83°
2 θ with a d-space at 4.8Å. The XRD pattern of the OMC thus shows the typical low

CHAPTER 3 ___________________________________________
73
angle XRD peak indicative of the average pore–pore correlation distance for a
mesoporous material.
Figure 3.11 Low angle XRD of HMS and OMC analogue (inset SAED of OMC)
OMC
HMS
Degrees 2 theta
Degrees 2 theta
Intensity

CHAPTER 3 ___________________________________________
74
Hence, this OMC material has XRD definable periodic pores and pore walls
containing graphitic carbon. The XRD peaks indicate that the OMC pore wall formed
by carbon deposition in the pores of the parent Si template during infiltration of LPG
in the CVD treatment at 800 °C. The infiltrated carbon was successfully converted
thermally to graphitic carbon. The presence of graphitic peaks was also observed in
the XRD pattern upon infiltration of HMS by carbon (Figure 3.10). The low angle
XRD peaks (Figure 3.11), for the silica template and the OMC, confirm the existence
of pores in the nanometer region. The OMC pore organization is suggested to be an
inverse analogue of HMS which has a wormhole structure with average framework
pore sizes in the range 2.9 to 4.1 nm with a porewall thickness of 1 nm (Pauli and
Pinnavaia, 2001). Because the pore walls of OMC were created by carbon deposition
in the pores of HMS, the pore-pore distances reflect similar dimensions as the HMS
template pore wall. The graphitic structure of the OMC was confirmed by Selective
Area Diffraction (see inset Figure 3.11 (b)). Clear and sharp rings that indicate a
crystalline material were observed in the SAED micrographs obtained on the OMC.
The XRD and SAED illustrate that the LPG infiltrated the HMS template during
CVD, and was thermally decomposed to a crystalline, graphitic form of carbon,
which formed an independent and structurally robust mesoporous material after
removal of the silica template.
The porosity of the OMC and parent HMS as well as MCM-41 was further confirmed
by N2 adsorption/desorption at -196 ºC using an Accelerated Surface Area and
Porosity apparatus (ASAP 2010, Micromeritics). N2-adsorption-desorption isotherms
of zeolites, MCM-41, and HMS are typically of the type IV isotherm. Thus an
increase in N2 adsorption (within the P/P0 range between 0.2 to 0.4) corresponds to
capillary condensation within uniform pores. The sharpness and the height of this
step reflects the uniformity of the pore size and the pore volume respectively (Grün et
al., 1999). Prior to analysis, 0.2 g of powder was degassed at 200 ºC and 200 mmHg
for 12 h. The adsorption isotherms of nitrogen were collected at -196 ºC using
approximately 20 values of relative pressure ranging from 0.05 to 0.99. (Figure 3.12).

CHAPTER 3 ___________________________________________
75
Figure 3.12 The N2 adsorption/desorption at -196 ºC of the HMS, HMS in-filled with carbon and the OMC
The N2 adsorption/desorption at -196 ºC showing the sorption isotherm plots of the
HMS, HMS in-filled with carbon and the OMC are shown in Figure 3.12. Since the
surface area of HMS infilled with carbon is still quite substantial, the degree of
infiltration of LPG into the pores may have been limited, because a measureable pore
size exists in the carbon in-filled template HMS. After removal of the silica template
to produce the OMC the increase in surface area, to values similar to that of the
parent mesoporous material is unambiguous proof that the HMS Si template was
mainly removed and an ordered mesoporous carbon structure analogous to HMS was
produced.
EDS analysis on the HMS silica template before and after carbon infiltration using
CVD, and after removal of the silica template, showed a progressive decrease in the
Si and O peaks, and an increase in the carbon peak. EDS characterization verified the
successful removal of the silica template; however, the final OMC did contain traces
of silica thus the removal of the silica template was not 100% complete and the
porosity of the OMC was lower than the HMS. This is probably due to a degree of
silica occlusion within small areas that are inaccessible during the NaOH dissolution
denoting some structural collapse of the OMC or amorphous regions present in the
parent HMS material.

CHAPTER 3 ___________________________________________
76
The use of a silica based mesoporous template HMS in the CVD system thus resulted
in the successful penetration of the precursor LPG into the HMS template. Thermal
decomposition of the precursor LPG produced a structurally stable and well ordered
mesoporous carbon in a single step. An additional advantage to this method is that the
OMC produced is mainly graphitic, thus there is no need for any additional
graphitization steps.
The silica based MCM-41 mesoporous material was also characterized by nitrogen
adsorption at -196 ºC. Figure 3.13 shows the N2 adsorption–desorption isotherms at -
196 ºC of the MCM-41 which exhibits type IV isotherms with narrow hysteresis
loops, which is characteristic of mesoporous materials with pore diameter in the
range 2.0–4.0 nm. There is no sharp rise in N2 uptake as the pressure reaches
saturation (P/P0 is near1), which indicates that no macroporosity exist in the material.
Figure 3.13 Nitrogen adsorption-desorption isotherm of MCM-41
The BET surface area of MCM-41 was 1108.9 m2g-1. The material has a narrow
mesoporous distribution (Figure 3.14). The pore distribution is in the range of 1~4
nm, centred at 1.5 nm.

CHAPTER 3 ___________________________________________
77
Figure 3.14 Pore distribution of MCM-41 (From incremental BJH desorption data)
The new graphitic mesoporous OMC material as well as HMS and MCM-41 can thus
be considered as suitable high surface area, three dimensional, substrates for
stabilizing the nanophase Pt electrocatalysts. The OMC material has the advantage of
being conductive and this material was further characterized and applied to support Pt
and tested as electrocatalyst as is specified in Godongwana (2006) and Petrik et al.
(2008). HMS and MCM-41 were applied as supports for nanophase Pt and Au to
form composite nanophase electrodes by sequential deposition, as is further detailed
in Chapter 5.
3.4.2.2 Characteristics of Carbon nanotubes
The aim of preparing the CNTs and treating them by acid washing was to investigate
the feasibility of using carbon nanotubes as supports for platinum as electrocatalyst in
electrochemical processes. Chapter 4 details a method for dispersing metals such as
platinum upon the CNT. Two samples of CNTs synthesized under the same
conditions by the nebulised spray pyrolysis of a solution of ferrocene in toluene or
benzene were used. Sample 1 was obtained from the ferrocene-toluene mixture while
sample 2 was obtained by using a ferrocene-benzene solution.
Both samples were characterized by TGA and XRD. The XRD results (Figure 3.15)
showed the possible presence of small quantities of amorphous carbon (indicated by a

CHAPTER 3 ___________________________________________
78
broad low intensity peak at 15 º2θ) in the case of CNT Sample 1 while CNT Sample
2 showed no such peak, thus the use of benzene as carbon source in the synthesis of
CNTs may have resulted in a more fully crystalline material.
0
100200
300400
500
600700
800900
1000
0 20 40 60 80 100
° 2 Theta
Arb
itrar
y U
nits
Sample 1Sample 2
Figure 3.15 XRD spectra of CNT samples prepared using toluene or benzene
XRD shows typical and highly crystalline graphitic carbon peaks at values of 25.6
º2θ (d-spacing of 0.336 nm) and 43.7 °2θ with miller indices (002) and (101)
respectively, indicating the presence of a significant graphitic phase (Figure 3.15).
These peaks are much more intense than the similar peaks observed for the
mesoporous carbon analogues. The slight shift in peak positions of the one sample
relative to the other could be due to an artifact caused by sample holder packing since
it was difficult to press the CNT flat. The peak centred at 14.5 °2θ visible in CNT
Sample 1 could also be indicative of structural ordering at planar spacings at around
3-5 Å that may relate to the internal pore diameter or pore wall thickness for CNT
Sample 1 whereas CNT Sample 2 did not have a distinct peak in this area and may
thus not have an internal pore. Based upon this premise, CNT Sample 1 (prepared
with toluene) was further characterized and used as support. Other peaks visible
above 50 °2θ may be due to the ferrocene catalysts used to prepare the CNT.
TEM micrographs (not shown) of un-treated carbon nanotubes, and acid treated
carbon nanotubes indicated that the CNTs prepared by spray pyrolysis were not
uniform in dimensionality. However, this should not be a problem in the application

CHAPTER 3 ___________________________________________
79
of these materials as catalyst support, since uniformity of the support is not a critical
requirement. The HR TEM images (Figure 3.16) show that the CNTs prepared by
nebulized spray pyrolysis using ferrocene-toluene were multi-walled CNTs. The acid
treatment was sufficient to remove the metal ferrocene catalyst to a significant degree
but not completely.
a) Multiwalled CNT with imperfect pore walls
b) Fe impurity in CNT
Figure 3.16 HRTEM images of acid washed CNT prepared by ferrocene-toluene method
The acid washing may have damaged the CNT pore wall to a degree as can be seen in
the HR TEM images Figure 3.16(a). HR TEM (Figure 3.16 (b)) and EDS X-ray
analysis (Figure 3.17) showed that traces of Fe catalyst remained in the ferrocene-
toluene CNT, hence the acid washing technique used was not sufficient to remove all
the metal catalyst impurity.
5 nm5 nm 5 nm5 nm

CHAPTER 3 ___________________________________________
80
Figure 3.17 X-ray analysis (EDS) of CNT
Figure 3.18 Thermal analysis of CNT
The TGA of the CNT sample (Figure 3.18) shows the typical thermal degradation of
graphitic carbon above 500°C. No mass loss was observed below this temperature
indicating that this material was pure and had no amorphous carbon intermixed with
the graphitic CNT. The CNT were processed into a mat or felt as is shown in Figure
3.19 by means of filtering the CNT in solution (Section 3.3.4), which material is
termed “CNT paper” in the rest of the study.
Energy (keV)
Cou
nts
20151050
600
400
200
0
Fe
Fe
FeFe
Cu
Cu
Cu

CHAPTER 3 ___________________________________________
81
Figure 3.19 SEM of CNT processed into a CNT paper
The SEM of CNT processed into CNT paper (Figure 3.19) shows that the void spaces
or “pores” between the matted CNT fibres are in the order of microns, which void
spaces thus form macropores, through which pores gas diffusion could take place.
The CNTs in turn have an internal mesopore structure which was evident in the
HRTEM (Figure 3.16). Hence this processed CNT material contains mesoporosity
but is simultaneously a suitable macroporous conductive support once it is converted
into a CNT paper. The electrical conductivity as well as the resistance of the carbon
nanotube sample processed into the form of CNT paper was initially investigated by a
4 point resistivity technique using a Hall measurement system (Ecopia HMS 3000,
Korea).
Table 3.2 Resistance measurements of CNT paper Buckey Paper
Current (mA) V1(mV) V2(mV) V3(mV) R1(Ω) R2(Ω ) R3(Ω ) 1.000 0.03 0.033 0.033 0.0300 0.0330 0.03302.000 0.06 0.066 0.066 0.0300 0.0330 0.03303.000 0.089 0.099 0.099 0.0297 0.0330 0.03304.000 0.118 0.132 0.132 0.0295 0.0330 0.03305.000 0.15 0.164 0.164 0.0300 0.0328 0.03286.000 0.197 0.197 0.197 0.0328 0.0328 0.0328
The CNT paper had a low resistivity of approximately 0.033 Ω which was not as low
as the typical graphite resistivity that ranges from 9 to 40 µΩm, thus these CNT may
CHAPTER 3 ___________________________________________
82
not be fully graphitic. The potentials ranged between and 0.03 and 0.197 mV at an
applied current between 1 and 6 mA respectively showing the high conductivity of
the paper prepared from CNTs. This CNT paper material was used to stabilize Pt
nanophases and bimetallic nanophases as is described in Chapter 4 and CNT paper as
well as CNT paper with Pt incorporated is further characterized using the Hall system
as is described in Chapter 6.
3.5 CONCLUSIONS
Zeolite FAU obtained from a commercial source was characterized by HRTEM,
FTIR, XRD, and TGA and shown to have high porosity on the Angstrom scale, with
pore sizes in the region of 7 Å, and high crystallinity and thus should be a suitable
substrate for the high dispersion of the active Pt metal phase to prepare nanophase
electrocatalysts.
LPG was used as a carbon source in the successful pyrolytic synthesis of
nanostructured ordered mesoporous carbon materials with graphitic character. The
use of a CVD system resulted in the successful penetration of the carbon precursor
into the silica based template and subsequent thermal decomposition of the carbon led
to a well ordered carbon mesoporous structure that was recovered after dissolution of
the silica template. An advantage to this method is that the carbon produced was
graphitic, thus there is no need for any additional graphitization steps. The low angle
XRD peak, observed for the HMS silica precursor and also the resulting OMC
analogue of HMS, is a typical feature of mesoporous materials with pores in the
region of 2-3 nm, and the porosity of the OMC was confirmed by N2 adsorption.
Selected area diffraction established that a crystalline graphitic material was formed
in agreement with XRD results. Thus the LPG infiltrated the pores of the HMS silica
template, and thermally decomposed mainly to a crystalline form of carbon, which, as
a result of the MHS porous template morphology, formed an independent and
structurally robust ordered mesoporous carbon material analogous to HMS upon

CHAPTER 3 ___________________________________________
83
removal of the silica template. The ordered mesoporous carbon analogue of HMS
could thus be suitable as an electro-conductive, high surface area substrate for
deposition and stabilization of metal nano-particles of electro-catalysts.
The CNT produced by use of a ferrocene-toluene combination were utilized to
prepare a felt or CNT paper with micron sized macropores which could be a suitable
high porosity conductive electrode material to be used as a gas diffusion layer in a
membrane electrode assembly or as a macroporous catalyst support.
These 3 dimensional substrate materials were applied to support Pt and the resulting
electrocatalysts were worked up into composite thin film electrode materials as is
further specified in Chapters 4, 5 and 6.

CHAPTER 4 _____________________________________________
84
4 PREPARATION AND CHARACTERIZATION OF ELECTROCATALYSTS SUPPORTED ON CNT
This chapter, Chapter 4, focuses mainly on improvement of the catalyst / support
interaction by high dispersion of the catalyst on the carbon nanotube (CNT) supports
described in Chapter 3. Characterization of the benchmark commercial Johnson
Matthey Pt40/C catalyst is also presented in Chapter 4.
For water electrolysis, more conductive and more durable gas diffusion layers are
required with a higher surface area and a finer fibre size that will form smaller
macropores. The usual carbon cloth gas diffusion layers can possibly be substituted
by use of CNT. The CNT fibres are much finer than the typical carbon cloth fibre and
if processed into a mat or paper of interwoven fibres could be utilized as a
macroporous support substrate for direct deposition of Pt nanoparticles, thus
eliminating one intermediate step in processing. In other words, instead of supporting
Pt on carbon black which must then be supported on carbon cloth using binders (as is
detailed in Chapter 5), in this chapter it is detailed on the one hand how to support Pt
on CNT and on the other to utilize a galvanic displacement reaction as deposition
technique to deposit Pt directly on CNT which have already been processed into a
paper that is suitable as a gas diffusion support substrate and characterize the new
material.
4.1 OVERVIEW OF CATALYST PREPARATION CONDITIONS
Platinum Group Metal (PGM) nanophase catalysts play vital roles in fuel cell and
electrolyzer technologies. To enhance catalytic performance and reduce operational
costs of fuel cell PGM electrocatalysts particle sizes are decreased to the nanometre
scale to increase the overall active surface area. As a result, physical and chemical

CHAPTER 4 _____________________________________________
85
properties of the electro catalytic materials are altered compared to the original
properties of the associated bulk materials. As particle sizes approach the atomic or
Angstrom (Å) domain deviations in behaviour arise as the number of surface atoms
becomes comparable to that of the interior of the particle. With decreasing particle
size larger numbers of surface atoms can be found. The increase in the surface-to-
volume ratio is associated with an increase in the interfacial region and thus
characteristics are different from interior atoms due to higher instability and reactivity
of surface atoms that dictate the surface energy and the chemical behaviour of
nanomaterials. Nanophase catalysts are applied in surface-sensitive reactions, where
catalytic reactivity is a function of the exposed surface of the catalyst and the
interface between the reactant and the catalyst. With the shift of PGM catalyst
particle size into the nanometre domain the characteristics of altered electro catalytic
properties (e.g. surface reactivity) gains significance because most nanophase PGM
catalysts have a functionality based on their structural physico-chemistry (Marković
et al, 2003). In electro catalysis, the greater the surface area of the material the greater
is the decrease in the activation energy threshold and the greater is the catalytic
activity. Geometry and electronic structure are strongly affected by decreasing the
particle size. Other changes in properties induced by size reduction to the nanoscale
may include electrical resistance/conductivity, specific heat capacity, thermal
expansion, magnetism, and lower thermal conductivity. Physical properties that may
change upon reducing the particle size to the nanoscale include melting point,
hardness, and tensile strength due to a change in the atomic environment of the
material.
Carbon supports are used to stabilize electrocatalysts that may be applied in PEM
systems because the surface area of the catalyst is increased, and because it allows
highly uniform and dispersed catalyst even at high loadings (<30 %) and provides
sufficient electronic conductivity and chemical stability (Vielstich et al, 2003).
Increase of catalyst stability to prevent agglomeration of small particles. For good
catalyst stability it is necessary to achieve high utilization of precious metal by
deposition of nanosized particles with high surface area to bulk ratio. Metals need to

CHAPTER 4 _____________________________________________
86
adhere to surface of support for long lifetimes and the method of production should
be economical and reproducible. The specific surface chemistry of the carbon support
affects the chemistry of the metal ion/ atom fixation upon the surface of carbon black
and the surface area of Pt can be increased with an increased surface area of the
carbon support. Precipitation of the metal catalyst upon a support via a chemical route
is common using aqueous solution of precious metals where the metal ions are
precipitated by hydrolyzing and transformed to the metallic state using chemical
reducing agents. Metal salts are common precursors. The Pt catalyst can be prepared
from the chloride solution onto the conductive support at pH 7-9 using a strong
reducing agent like formaldehyde. Other routes could be used such as metal sulphite
oxidation with H2O2 to precipitate chloride free catalysts in a pH range of 8 or above.
Powder catalyst materials should be designed specifically for the membrane electrode
assembly process, which requires nano particle sizes that are well dispersed in inks,
for adhesion, and tailoring of hydrophilic/hydrophobic properties, as well as cost
reduction (M. Hampden et al., in Vielstich 2003). Standards are necessary for mass
manufacturing, including scalability, reproducibility and quality.
The size of nanophase PGM electrocatalysts raises significant challenges in
stabilization. Transition and noble metals typically have high surface free energies,
and therefore, small particles or crystallites tend to agglomerate to reduce their
surface area. Stabilization of nanosize metal particles therefore requires deposition on
the surface of supports providing favorable metal-support interactions. The smaller
the particle the more its physical properties and morphology can be affected by these
interactions (Allen et al., 2001). Therefore, the nature of the support material for a
given metal also critically influences the catalytic properties of the metal particle.
Supported metals are in a non-equilibrium state and therefore still tend to
agglomerate at sufficiently high temperatures in reducing atmospheres. Solid
supported catalysts are complex assemblies, the preparation of which is a challenging
task. It is necessary to develop a fine conductive support matrix for nanoparticles
deposition. The requirements of a support for an active electrocatalyst are rigorous. It

CHAPTER 4 _____________________________________________
87
must provide structural, conductive, and durable support for the active metal
particles.
The nanoparticles should be well dispersed over a conductive and high surface area
support. Metal nanoparticles are thermodynamically unstable and readily agglomerate
through the attachment of particles at crystal edges or corners which promotes mass-
conservation and which increases the particle size distribution, decreasing the particle
surface area available for chemical reaction. Aggregation is a result of van der Waals
attractions existing between particles of similar composition. Aggregation alters the
volume, particle size, particle size distribution, porosity and surface area of materials.
Changes in surface area and volume by agglomeration or aggregation may influence
the chemical reactivity of nanophase electrocatalysts (Simonov et al., 2003). Metal
particle size is influenced by the preparation method and nature of the support
material. High metal dispersion on the support material and decreased metal particle
size generally result in increased catalytic activity whereas a broad metal particle size
distribution may lead to inefficient metal utilization. Metal particle size distribution is
largely influenced by the metal-support interaction and electrical charging of the
particles has a significant effect on the predicted agglomeration rates (Allen et al.,
2001).
By far the most common support materials used in PEM fuel cells are carbon blacks.
As can be expected, increasing the surface area of the carbon leads to greater Pt
dispersion at a given loading. Uchida et al. (1996) showed that Pt crystallite size
decreased from 3.7 to 1.0 nm when the carbon surface area increased from 58 to 1500
m2 g-1 for a series of 23 to 24 wt% Pt catalysts. Similarly, Tokumisu et al. (1999)
reported that increasing the carbon surface from 60 m2 g-1 to over 1300 m2 g-1 resulted
in the reduction of Pt particle size from 2.5 to 1.5 nm for 10 wt% catalyst. Various
literature sources state that carbon black with particle sizes of 30-75 nm corresponded
to a surface area of 250-300 m2 g-1 (Li et al, 2004; Prabhuram et al, 2004; Jordan et
al, 2000). However, despite the increase in Pt surface area achieved by higher-area
carbon support, the cited studies showed little effect of carbon support on catalytic

CHAPTER 4 _____________________________________________
88
activity. It was suggested that both the Pt particle size effect and the interaction of the
ionomer with the carbon support played important roles in determining activity.
Carbon nanotubes are composed of cylinders in a helical hexagonal arrangement,
closed at both ends by hemispherical endcaps. The continuous sp2 hybridization
structure provides unique electronic characteristics. The structure of these cylinders
can produce a special interplay between support and metal and could promote the
activity of the electrocatalyst (Vogel, 1977). The unique electro-structure of CNTs
has a better electronic conductivity than Vulcan XC-72. The electronic conductivity
of Vulcan XC-72 on its own is 4.0 S cm-1 while that for CNT is 1250 S cm-1 (Li et al,
2003).
Commercially, carbon black is typically used as a support for Pt nanoparticles (Pozio
et al, 2002). In the case of water electrolysis or fuel cells, after Pt is deposited on the
carbon black, this composite Pt/C electrocatalyst still has to be deposited upon a
substrate used as gas diffusion layer (GDL) that is typically made of carbon cloth.
The GDL support should allow ingress of the reactant, water and egress of the
product, air or H2 (Vielstich et al, 2003). The carbon cloth was found to be
problematic as support (as is further described in Chapter 7) as it showed poor
durability and disintegrated over time during the flow of water through the
electrolysis cell, hence more durable GDL are necessary.
Nanostructured carbon materials with graphitic structure, such as carbon nanotubes
(CNTs) and carbon fibers were utilized as catalyst supports and platinum–ruthenium
(Pt–Ru) nanoparticles were successfully deposited on the surface of SnO2 nanowires
grown directly on E-TEK carbon paper (Pt–Ru/SnO2 NWs/carbon paper) by a
potentiostatic electrodeposition method and applied for electrocatalytic oxidation of
methanol (Saha et al., 2007).
Qu and Dai (2005) reported a substrate enhanced electroless deposition (SEED)
procedure of metal nanoparticles on carbon nanotubes. This procedure is a simple

CHAPTER 4 _____________________________________________
89
galvanic displacement reaction and could facilitate the large scale production of
nanoparticle coated carbon nanotubes. In the electroless deposition procedure only
metal ions that have a reduction potential higher than the carbon nanotube can be
reduced onto the carbon nanotube. According to Choi et al (2002) a single wall
nanotube has a reduction potential of +0.5 V vs SHE (standard hydrogen electrode)
and these authors were able to successfully deposit Pt (+0.775 V vs SHE) as
nanoparticles through spontaneous reduction of the metal ions by the nanotubes. In
the SEED procedure of Qu and Dai (2005) it is shown that metal ions even with a
lower reduction potential than that of a conducting carbon nanotube can be reduced
onto the support (Figure 4.1) without an additional reducing agent. In this reaction the
nanotube acts as cathode for reducing the metal ion in solution whereas a chosen
metal substrate (Cu) acts as anode where the metal substrate’s atoms are oxidized and
displaced into solution (Wen and Yang, 2002).
Figure 4.1 Schematic illustration of metal nanoparticle deposition on carbon nanotubes via the SEED process (after Qu and Dai, 2005)
4.2 CHARACTERIZATION OF ELECTROCATALYSTS
The size of nanophase PGM electrocatalysts raises significant challenges in
determining the physico-chemical properties of these electrocatalysts. The analytical
techniques (Section 3.3.5) that can be used to characterize the minimum set of
physico-chemical properties of nanophases facilitates comparison between different
electrocatalysts (Williams et al, 2008).
substrate
nanotube
e- e- Sub 0 Sub n+
M n+
From solution M0 M n+

CHAPTER 4 _____________________________________________
90
Because it is not always feasible or practical to perform an exhaustive analysis of the
materials, it is important to identify the minimum set of properties which have an
influence on the catalytic behaviour of nanophase electrocatalysts. The most
important information regarding nanophase electrocatalysts is gathered in an
electrochemical characterization study incorporating voltammetry. Nanophase PGM
electrocatalyst producers, such as Johnson Matthey, rely on measurements of XRD
particle size, lattice parameters, and metal surface area as a minimum set of
properties required for characterization (Johnson Matthey, 2008).
Scanning Electrochemical Microscopy (SECM) feedback mode and substrate
generation-tip collection mode coupled with a chronoamperometric approach could
be used to investigate H2 oxidation and hydrogen evolution reaction (HER) at a
polyaniline coated highly oriented pyrolytic graphite (HOPG) electrode. Using the
former mode, the heterogeneous electron transfer kinetics for H2 oxidation could be
studied, while the latter mode allowed mapping of the distribution of local [H2] at the
nanoparticulate/aqueous interface, followed by monitoring of the transients at the tip.
These studies demonstrated that SECM was useful in evaluating the activity of
nanophase electrocatalysts. The resolution of this technique is limited by the diameter
of the scanning tip. If nanometer-sized tips or hydrodynamic microjet electrodes were
employed where the mass transfer rate was high, it should be possible to investigate
the ET kinetics more accurately (Ahmed et al., 2004). However, Williams et al.,
(2008) found that this technique was merely qualitative and did not allow
comparisons to be made between the activities of different electrocatalysts.
4.3 ELECTROCHEMISTRY BACKGROUND
Cyclic voltammetry (CV) can be used to investigate the electro catalytic activity of
fabricated electrocatalysts and plays an integral role in a comprehensive
characterization of nanophase electrocatalysts (Steigerwalt et al, 2001; Jarvi et al,
1998). Cyclic voltammetry is used for studying the reversibility of electrode

CHAPTER 4 _____________________________________________
91
processes and for kinetic observations, and sometimes for analytical purposes. It
gives information on the redox behaviour of electrochemically active species and on
the kinetics of the electrode reactions as well as offering the possibility of identifying
reactive intermediates. It is based on recording the current during a linear change of a
voltage at a stationary working electrode. The working electrode serves as the
surface where the electron transfer of redox reaction occurs. The redox reaction
occurs within the potential range defined by two chosen potential values and the
potentials at which reduction or oxidation takes place provide qualitative information
about the analyte of interest. The application of an electrical applied potential to the
working electrode makes the surface electrochemically act to oxidize or reduce,
depending on the applied potential. As the applied potential becomes more negative,
the electrode becomes a better reducing agent. As the applied potential becomes
more positive, the electrode becomes a better oxidising agent (Williams et al, 2008).
Generally the heterogeneous reaction rate taking place at the electrodes surface is
described in units of mol per unit area per second by equation (4.1)
nFJ
nFAi
cmsmolRate ==⎥
⎦
⎤⎢⎣⎡
2. (4.1)
Where:
i: current (amperes, A); F: Faradays constant, 96485.3 C; A : electrode surface area
(cm2); n : number of electron transfer; j : current density (A cm-2)
CV can be used in the determination of the electrochemically-active surface area of
carbon-supported nanophase Pt electrocatalysts. The method requires the hydrogen
underpotential deposition (Hupd) region in the electrolysis of dilute acid on Pt. The
Hupd region corresponds to Pt-hydride monolayer formation and removal near the
reversible H2 potential (0.0 VSHE). The Hupd region consists of cathodic hydride
adsorption and anodic hydride desorption surface reactions, which can generally be
given as follows:
CHAPTER 4 _____________________________________________
92
Hydride Adsorption: Pt + H+ + ē → Pt-Had
Hydride Desorption: Pt-Had + H2O → Pt + H3O+(aq) + ē
The hydride desorption peaks can be integrated to yield a charge (QH+), which is used
to calculate the electrochemically-active surface area (Nart et al., 2003). This
approach is based on the assumption that a complete monolayer corresponds to a
surface charge of 210 µC cm-2. Voltammetric charge density, q* (mC cm-2) can also
be determined by the mechanical integration of voltammograms (Hrussanova et al.,
2004). Therefore, voltammetric charge, q*, is the mean charge between the anodic
and the cathodic branches. The charge measures the amount of protons exchanged by
the oxide surface with the solution during the potential scan thus q* can be regarded
as proportional to the active surface area of a catalyst.
Several authors have compared electrochemical active surface area Pt/C catalysts by
cyclic voltammetry. A review is given by Pozio et al., (2002). These authors note that
the active surface areas (EAS) determined by cyclic voltammetric for the same
commercial Pt/C catalyst in various studies were not similar. Various EAS values
were obtained depending upon changes in the Pt loading (mg cm-2). The variation
observed was also ascribed to the method of preparation of the catalyst layer in the
gas diffusion electrode, where the binder Nafion or PTFE may occlude the catalyst;
or to different catalyst loadings that may be obtained; or to variations in the Pt/C to
Nafion ratios applied. The coulombic charge for hydrogen desorption was used by
these authors to calculate the active Pt surface of the electrode. It was also observed
that if the catalytic layer in the electrode became too thick the Pt utilization was
limited as an increasing fraction of the Pt surface was occluded by the binder and
carbon. Pt loading on the powder catalyst was determined from the Pt/C wt%.
Amongst the recommendations made by these authors was that the catalysts should
be tested preferentially without binders that could decrease the catalyst utilization
values, that careful control of the Pt loading should be observed, and that a simple
half cell, three electrode configuration using a geometric 1cm2 working electrode be
used instead of a full cell configuration with a membrane electrode assembly. It is

CHAPTER 4 _____________________________________________
93
time consuming and expensive to evaluate electrocatalysts applied in gas diffusion
electrodes in working fuel cells or PEM electrolyzers and as Chapter 7 highlights it is
not possible to decouple the activity of the electrocatalyst from numerous other
parameters that influence the current density obtained. Pozio et al. (2002) noted that
the presence of the inert gas flowing on the back of the electrode in a full cell
configuration affected the hydrogen adsorption/desorption process during the CV
measurements.
Voltammetry can be used to determine thermodynamics and kinetic parameters of
electron transfer across the electrode/film interface (Rusling et al., 2003). Using a
sufficiently slow scan rate the polymer film can be exhaustively oxidized and the
depletion layer extends to the film/solution interface where finite diffusion becomes
important. In the ideal case the dynamics of heterogeneous electron transfer across
the electrode/film interface are fast enough not to influence the observed response.
For surface confined species the peaks are Gaussian at slow scan rates and the
separation of the oxidation and reduction peaks is ideally zero. The formal potential
E0/ shows how readily the redox centres are oxidized within the polymer film.
However it is important to distinguish between specific ion effects and changes in E0/
brought about by changing the electrolyte concentration. It is of importance to
determine the rate of charge transport through the layer that affects the degree of
oxidation or reduction of the metal centres (Rusling et al., 2003).
Mass transfer is related to the movement of ions in solutions and in the quiescent
electrolytes used in cyclic voltammetric experiments, is due to diffusion. Diffusion
describes the mass transfer due to the random motion of ions and results from a
gradient in the electrochemical potential (Bard and Faulkner, 2001). The diffusion
coefficient can be described as a proportionality constant which relates the flux of
ions to a concentration gradient and can be related to the availability of a reagent
species to the surface reaction (International Union of Pure and Applied Chemistry,
1997).

CHAPTER 4 _____________________________________________
94
The Randles-Sevçik equation (Bard and Faulkner, 2001) may be used to determine
the effective diffusion coefficient (DCT) corresponding to diffusion of electrons at
relatively high scan rates.
Ip=(2.69 X 10⁵)n3/2ADCT1/2 Cv1/2 (4.2)
Where C is the concentration of electro active sites in the film; v is the scan rate; n is
the number of electrons transferred.
The Randles-Sevcik equation can be used in determining the diffusion coefficient (D)
of an analyte on an electrode surface and predicts that measured peak currents are
proportional to the square root of the sweep rate applied. The peak currents from a
series of voltammograms are usually recorded at increasing sweep rates. A plot of
peak current versus the square root of the sweep rate is then prepared and a linear
least squares analysis of the data performed to determine the slope. The slope and the
Randles-Sevçik equation are then used to estimate the diffusion coefficient.
The integrated charge required to form or remove the film can be measured using the
potential interval ΔE, which is the difference between anodic and cathodic peak
voltage,
∫Δ=
EidtQ (4.3)
Where Q is the charge (C); i is the current (A), and t is time (s). This gives the
determination of the coverage of a film or determination of a true surface area of a
roughened electrode (Plambeck, 1982; Riley and Thompson 1987)
In some cases, where the oxidizing scan is switched before reduced sites at the films
outer boundary are oxidized the voltammetric wave can show tailing characteristics
that indicate semi-infinite linear diffusion (Rusling et al., 2003).
Formal potentials (E0´) of catalysts are related to the potentials of electrochemical cell
reactions and are simply the average between the anodic (EPA) and cathodic peak

CHAPTER 4 _____________________________________________
95
potentials (EPC). The equation for the calculation of formal potentials is given as
(IUPAC, 1997; 2005):
E0´ = (EPA + EPC)/2 (4.4)
Iwuoha et al., (2006) showed that the electrochemical behaviour of polymer
composites could be evaluated at high potential scan rates. Electrode transfer
reactions at the electrode and accompanying physical or chemical processes that have
rate constants comparable to the scan rates employed are discernible in the
voltammograms. These authors identified quasi reversible electrochemistry as well as
electron transfer reactions at the electrode coupled to a diffusion process where the
anodic currents were higher than the cathodic currents and E0/ values shifted
anodically with scan rate. Diffusion processes that may have been detected were
charge transfer within the polymer or intra molecular charge transfer along the
polymer backbone. Conductance is given by C=ΔIv/ΔEv where ΔIv is Ip(highest scan rate
mVs-1
) – Ip(lowest scan rate mV s-1
) and ΔEv = Ep(highest scan ratemVs-1
) – Ep(lowest scan rate mV s-1
)
according to these authors. The average value for all the redox states is the
conductance of the material.
In this chapter, Pt/C (commercial) was characterized and compared to several
different home made Pt catalysts supported on CNT prepared by a galvanic
displacement reaction. These electrocatalysts were evaluated for electrocatalytic
activity using cyclic voltammetry after a minimum set of properties were established
by HRTEM or SEM and in selected cases by some of the abovementioned methods.
4.4 EXPERIMENTAL
4.4.1. Materials
CHAPTER 4 _____________________________________________
96
4.4.1.1 Benchmark catalyst
The benchmark commercial catalyst used in this study was Pt catalyst HiSpec™
4000, 40% on carbon black with 39.74% Pt, 1.33% moisture, 3.54nm crystalline size,
supplied by Alfa Aesar, a Johnson Matthey Company. (Stock #42204; Lot # J26P18
or F01Q12). This catalyst will be referred to as JM Pt40/C. Commercial carbon-
supported platinum (JM Pt40/C) fuel cell electrocatalysts containing 40% Pt served as
a standardized, well-characterized model material of known properties. Its structural
and chemical properties served as benchmark against which fabricated materials
could be compared. Home made Pt/CNT catalysts were prepared as is further
specified.
4.4.1.2Carbon nanotubes (CNT)
Carbon nanotubes (CNT) were prepared by nebulised spray pyrolysis as is described
in Section 3.3.4. After acid washing a portion of the CNT were processed into a dense
felt or “CNT paper” by vacuum filtration of a CNT suspension in deionized water
onto a 45 µm cellulose acetate filter and in situ drying upon the filter in an adaptation
of the method described by Vohrer et al., (2004). CNT and CNT paper were used as
substrates where specified, to support Pt upon the exterior of the CNT.
4.4.1.3 CNT-supported Pt electrocatalysts
The CNT-supported Pt electrocatalyst was prepared, using as substrate the CNT made
by nebulized spray pyrolysis, which was then treated to Pt impregnation-reduction (Li
et al, 2004; Zhou, 2003) by two different routes.
In the first case, the pre-treated CNT were suspended in 1-propanol, H2PtCl6.6H2O,
and treated with H2SO4. Pt was reduced by formaldehyde (Ying, 2005). Typically
20.0 mL distilled water was added to 80 mL 1-propanol and made up to 100 mL in a
volumetric flask as solvent. The volumetric ratio of distilled H2O: 1-propanol was
1:4. Thereafter, 600 mg of pre-treated carbon nanotubes were placed in a 50 mL
beaker to which 50 mL prepared 1-propanol solution was added and stirred
magnetically for 0.5 h and ultrasonically for a further 15 min. 0.30g H2PtCl6·6H2O

CHAPTER 4 _____________________________________________
97
was weighed out separately and dissolved in a portion of the prepared 1-propanol
solvent solution. After the solute was efficiently dissolved, the Pt containing solution
was transferred to a 50 mL flask and made up to the mark. The concentration of the
solution was 20 mg mL-1. The 50 mL carbon nanotube containing flux was gradually
dropped into the flask using a dropper. After mixing thoroughly, the solution was
stirred for a further 12 h. The stirred H2PtCl6·6H2O solution was titrated with 1M
NaOH, until the pH reached 12, and stirred for 1 h. An excess of 40 % formaldehyde
(10 mL) was added to the solution in the flask and the flask was kept at 80 ºC for 0.5
h to optimize the reduction reaction. Thereafter, the pH of the solution was readjusted
to 2.5 using 1.5 M H2SO4. Throughout these steps the solution was protected with
inert N2 gas while stirring continuously. Finally the solution was left at room
temperature for 1 h before being filtered. The solid residue recovered after filtration
was washed with distilled water and dried under vacuum at 70 ºC for 10 h. The solid
Pt/CNT (propanol) sample was ground into a powder using a mortar and pestle.
These CNT-supported nanophase Pt electrocatalysts (denoted Pt/CNT(propanol) were
compared to JM Pt40/C and to a new series of Pt CNT electrocatalysts prepared using
a galvanic displacement technique (Table 4.1).
In the second case a series of nanophase Pt electrocatalysts were made using a
modified galvanic displacement technique based upon the approach described by Qu
and Dai (2005). This approach aims to rapidly and very simply deposit the Pt
electrocatalyst directly onto the gas diffusion layer (GDL) substrate CNT paper
fabricated from the CNT prepared by nebulized spray pyrolysis. The method to
directly deposit Pt onto preformed CNT buckey paper as GDL eliminated many steps
in the processing of the electrocatalysts into composite form.
The galvanic displacement series of catalysts (Table 4.1) were prepared in the
following way.
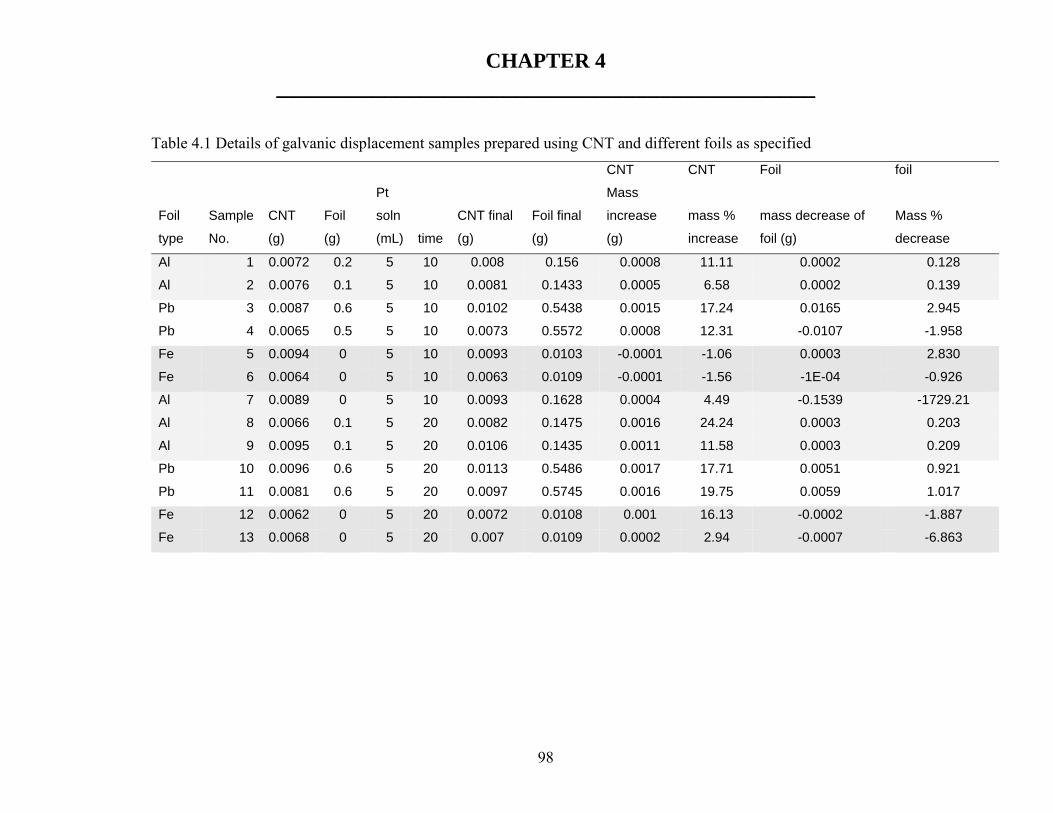
CHAPTER 4 _____________________________________________
98
Table 4.1 Details of galvanic displacement samples prepared using CNT and different foils as specified CNT CNT Foil foil
Foil
type
Sample
No.
CNT
(g)
Foil
(g)
Pt
soln
(mL) time
CNT final
(g)
Foil final
(g)
Mass
increase
(g)
mass %
increase
mass decrease of
foil (g)
Mass %
decrease
Al 1 0.0072 0.2 5 10 0.008 0.156 0.0008 11.11 0.0002 0.128
Al 2 0.0076 0.1 5 10 0.0081 0.1433 0.0005 6.58 0.0002 0.139
Pb 3 0.0087 0.6 5 10 0.0102 0.5438 0.0015 17.24 0.0165 2.945
Pb 4 0.0065 0.5 5 10 0.0073 0.5572 0.0008 12.31 -0.0107 -1.958
Fe 5 0.0094 0 5 10 0.0093 0.0103 -0.0001 -1.06 0.0003 2.830
Fe 6 0.0064 0 5 10 0.0063 0.0109 -0.0001 -1.56 -1E-04 -0.926
Al 7 0.0089 0 5 10 0.0093 0.1628 0.0004 4.49 -0.1539 -1729.21
Al 8 0.0066 0.1 5 20 0.0082 0.1475 0.0016 24.24 0.0003 0.203
Al 9 0.0095 0.1 5 20 0.0106 0.1435 0.0011 11.58 0.0003 0.209
Pb 10 0.0096 0.6 5 20 0.0113 0.5486 0.0017 17.71 0.0051 0.921
Pb 11 0.0081 0.6 5 20 0.0097 0.5745 0.0016 19.75 0.0059 1.017
Fe 12 0.0062 0 5 20 0.0072 0.0108 0.001 16.13 -0.0002 -1.887
Fe 13 0.0068 0 5 20 0.007 0.0109 0.0002 2.94 -0.0007 -6.863

CHAPTER 4 _____________________________________________
99
A specific size and weight of foil (Lead, Iron and Aluminium foil respectively) as
specified in Table 4.1 was clipped tightly with a plastic covered paper clip to a pre-
weighed piece of CNT paper. The CNT paper was suspended into a chloroplatinic
solution with specific molar concentration of 0.01 M (0.5216 g in 100 mL), for either
10 or 20 min. All samples were made in replicate. Different times of deposition were
followed for each foil so that there were two variables that were altered for each
system- time of deposition and type of metal foil. The foils were selected on the basis
of their reducing ability based upon the respective E ø (volts):
Al: E ø = -1.66 (highest)
Fe: E ø = -0.44 (intermediate)
Pb: E ø = -0.13 (lowest)
The progress of Pt deposition could not be followed electrochemically in a two
electrode configuration as it was not possible to configure the system so as to acquire
a current whilst not applying a potential.
4.4.2. Characterization
The analytical techniques applied for characterization included various of the
following techniques. Crystal/atomic structure and metal particle size was determined
by X-ray Diffractometry (XRD, Bruker AXS D8 Advance, Cu Kα (λ = 1.5418), 0.05
º2θ min-1). Crystallite size determination could be performed by measuring the
broadening of a particular peak in a diffraction pattern associated with a particular
planar reflection from within the crystal unit cell. Particle size is inversely related to
the half-width at half maximum of an individual peak and the narrower the peak, the
larger the crystallite size. This is due to the periodicity of the individual crystallite
domains, in phase, reinforcing the diffraction of the X-Ray beam, resulting in a tall
narrow peak. The breadth of the diffraction peak is related to the size of the crystals
by the Scherrer equation as given below:

CHAPTER 4 _____________________________________________
100
d = 0.9 λk / (B cosθmax) (4.5)
where λk: wavelength (Cu-Kα, λ = 1.5406 Å); θmax: half the angle of diffraction
(2θ); B: radians. Typically the half-width at half-height of the diffraction peak is
used for B which can be estimated as half the peak width on the diffraction spectrum.
The size of a crystallite, d, giving rise to diffraction is inversely proportional to the
width of the peak (Roe, 2000). Furthermore, the lattice parameter (α) can be
calculated by the equation (4.6):
αfcc = 21/2 λk / sinθmax (4.6)
In addition, the metal Pt dispersion (D) (Jordan et al, 2003) was calculated from
d = 1.08 / D (nm) (4.7)
Where, d: average Pt particle size obtained from XRD results.
Surface micro- and macrostructure, and degree of agglomeration were determined by
High-Resolution Scanning Electron Microscopy (HRSEM, Zeiss Ultra 55 Field
Emission – In-lens detection, 30 kV, 80 μA). Metal particle size, particle size
distribution, metal surface area, and metal dispersion/agglomeration were established
by Transmission Electron Microscopy (TEM, Hitachi H-800 EM, 200 kV, 20 μA)
and total surface area and porosity by N2-physisorption (Micromeritics ASAP 2010,
20 mg sample).
Electro catalytic activity was compared using Cyclic Voltammetry (CV, Autolab
PGSTAT 30, working - glassy carbon (0.07 cm2), reference – saturated calomel,
counter – platinum wire basket. This method was used to initially characterize JM
Pt40/C. Preparing thin cast films of Pt/CNT catalysts upon glassy carbon was not
possible because of the difficulty of dispersion of CNT based materials for
electrochemical testing. Therefore a testing technique using a paste electrode was
developed. Comparisons of the commercial catalyst with the CNT-supported

CHAPTER 4 _____________________________________________
101
nanophase Pt electrocatalyst (denoted Pt/CNT(propanol)) and the catalysts prepared
using the galvanic displacement method were performed using the BAZ 100
electrochemical workstation in a three electrode sytem using a Ag/AgCl reference
electrode and a Pt wire as counter electrode with an argon purged ClLiO4 electrolyte
with conditions as set out hereunder and at each CV in the result section. The series
of Pt/CNT-BP catalysts were compared to the Pt/CNT (propanol) and the JM Pt40/C
catalysts using this method.
An impure synthetic graphite powder (Sigma Aldrich;1-2 µm; # 282863) or Ultrapure
graphite powder (Alpha Aesar; -200 mesh; 99.9995% pure, synthetic conducting
grade Stock #40797; Lot J02R042) were used to prepare paste electrodes. Ultrapure
graphite was used in the series of CNT paper supported Pt/CNT catalysts.
Table 4.2 Composition of paste electrodes Graphite (g) Mineral oil (g) GRmix 0.0438 0.0040 Sample GR mix (g) Pt catalyst (g) JM Pt40/C 0.0280 0.0030 Pt/CNT(propanol) 0.0357 0.0025 Pt/CNT-BP Sample 2 GR02 series
0.0245 0.0020
Pt/CNT-BP Sample 3 GR03 series
0.0143 0.0014
Pt/CNT-BP Sample 5 GR05 series
0.0173 0.0016
Pt/CNT-BP Sample 8 GR8 series
0.0106 0.0017
Pt/CNT-BP Sample 10 GR10 series
0.0438 0.004
Pt/CNT-BP Sample 12 GR12 series
0.0124 0.0011
A stock mixture (denoted GRmix) of ultra pure graphite and mineral oil was blended
to a paste in a ratio of 10:1 in an agate mortar and pestle. There after the CNT
supported catalyst was added to an aliquot of the paste in a 1:10 ratio, and thoroughly
blended together by grinding in an agate mortar and pestle. The paste electrode void
was loaded with the catalyst/paste blend. The paste electrode surface was polished to

CHAPTER 4 _____________________________________________
102
a smooth finish. A three electrode system was used in 5 mL of a 0.1 M Lithium
Perchlorate (ClLiO4) solution. The working electrode was the paste electrode, the
counter electrode was a platinum wire, with a Ag/AgCl reference electrode. The
system was purged with argon for 15 min prior to commencement of cyclic
voltammetry and square wave voltammetry and the electrolyte surface was purged
with argon subsequent to the start of experiments.
4.5 RESULTS
4.5.1 Characterization of electrocatalysts
4.5.1.1 CNT paper
Characterization of CNT was presented in Chapter 3. After purification and surface
chemical modification by acid treatment, the impurities in CNTs were removed and
little remaining Fe from the ferrocene catalyst could be detected by energy dispersive
analysis (EDS). XRD analysis of pre-treated CNT showed that after acid washing the
XRD pattern for CNT contained the four characteristic diffraction peaks for
crystalline graphite, which are at 26.5, 42.4, 54.7 and 77.4° 2 theta, namely of (220),
(100), (004) and (110) respectively. The acid washed CNT had a N2 BET surface area
of 49 m2 g-1 of which only 4 m2 g-1 reported to the microporous internal area of the
CNT’s as the surface area of CNTs are made up of inter-tubular pores and intra-tube
pores. These acid washed CNT were processed into CNT paper (Figure 4.2).

CHAPTER 4 _____________________________________________
103
Figure 4.2 SEM micrograph of CNT paper gas diffusion layer made from acid washed CNT
Figure 4.3 SEM micrograph of Carbon cloth gas diffusion layer
From SEM micrographs (Figure 4.2) it is visible that in the case of the prepared CNT
paper the overall macroporosity of the gas diffusion layer is very significantly
reduced and the external surface area of the gas diffusion layer is significantly
increased because the CNT fibres are an order of magnitude finer than the carbon
cloth (Figure 4.3) and the voids in between fibres much smaller. The use of the CNT
paper as support substrate for Pt should promote an increase of the dispersion of the
Pt electrocatalyst because of the much higher effective surface area that is available
to support the catalyst. Moreover the contacts between phases necessary to develop
the three phase boundary should be highly improved.
4.5.1.2 Characterization of Pt electrocatalysts
A comparison of the XRD spectra of Carbon black (Vulcan XC-72) with JM Pt40/C is
shown in Figure 4.4.

CHAPTER 4 _____________________________________________
104
0
20
40
60
80
100
120
0 10 20 30 40 50 60 70 80 90 100
2 Theta (Degrees)
Rel
ativ
e In
tens
ity (I
/Io)
Vulcan XC-72 Pt(40)/C
Carbon Black(002)
(111)
(200)
(220)(311)
(222)
Figure 4.4 Comparison of XRD spectra of Carbon black (Vulcan XC-72) with JM Pt40/C
The XRD spectrum of carbon black (Vulcan XC-72) shows the typical peaks of
graphitic carbon with major peak at 26.5° 2 theta, and less prominent peaks at 42.4,
54.7 and 77.4 ° 2 theta, namely of (220), (100), (004) and (110) of face characteristic
centred crystalline graphite. The broad peaks below 20 °2θ are due to an instrumental
artifact and should be ignored. The XRD spectrum of JM Pt40/C shows remnants of
the carbon peaks as well as peaks visible at 39, 46, 68, 82° 2 θ, namely Pt (111),
(200), (220) and (311), indicating that the Pt structure was face-centred cubic (FCC)
with interplanar spacing (Å) of 2.40 (111), 2.14 (200), 1.66 (220). From XRD the
Bravais Lattice is face-centered cubic. According to literature the atomic radii (Å) of
Pt is 1.38, the space-filling efficiency is 74 % (CCP), and the particle shape is a
Cubo-octahedron with number of atoms 2300 – 2700 (Williams et al., 2008).
After Pt deposition upon the CNT via the propanol/formaldehyde route, thermal
analysis showed that Pt/CNT (propanol) had high thermal stability with the only
weight loss between 400 °C and 520 °C corresponding to the oxidation of carbon
nanotubes. It was calculated by difference from TGA that the Pt deposited upon the

CHAPTER 4 _____________________________________________
105
catalyst was 28.3 wt%. Apart from the graphitic peaks that were visible in the XRD
spectrum of Pt/CNT (propanol) (Figure 4.5) at 26.5, 42.4, 54.7 and 77.4 °2θ, namely
of (220), (100), (004) and (110) indicating face characteristic centred crystalline
graphite, the characteristic but broadened Pt diffraction peaks were visible at 39, 46,
68, 82 °2θ, namely Pt (111), (200), (220) and (311), indicating that the Pt structure
was face-centred cubic (FCC) (Q.Ying, 2005). The XRD results can be compared
with that of JM Pt40/C (Figure 4.4). Generally, the broad Pt diffraction peaks
observed from the diffractogram was due to the presence of nano particles of Pt
dispersed upon the CNT.
Figure 4.5 XRD spectra of Pt/CNT (propanol)
Through calculation using the Scherrer equation, the XRD Pt particle sizes of the
Pt/CNT (propanol) catalyst were found to be on average 2.6nm compared to 4.23 nm
for JM Pt40/C. The values obtained for JM Pt40/C compared well to the manufacturers
specification of 4.5 nm. Slight inconsistencies in particle sizing data was due to the
Scherrer equation being developed for spherical particles, whereas many metal
nanoparticles are cubo-octahedral in shape. XRD was thus used to obtain information
regarding crystallinity, and particle size, and perform accurate analyses in the
20 40 60 80
Pt (311) Graphite (110)
Pt (220)
Graphite (004)
Pt (200)
Graphite (100)
Pt (111)
Graphite (002)
Intensity
(a.u)
2θ degree

CHAPTER 4 _____________________________________________
106
nanometre size domain. However, since XRD is a bulk technique it does not does not
provide information on agglomeration of individual Pt nanocrystallites. Therefore,
the morphology of Pt electrocatalysts on CNT was further determined by electron
microscopy.
TEM (Figure 4.6) was utilized in the direct examination of metal nanoparticle size;
nanoparticle size distribution; homogeneity of dispersion; and agglomeration of the
metal phase in of JM Pt40/C supported nanophase electrocatalysts.
(a)
(b)
Figure 4.6. Transmission electron micrographs of (a) carbon black (Vulcan XC-72) and (b)JM Pt40/C
The TEM of carbon black (Vulcan XC-72) shows the average carbon particle size to
be about 60nm (Figure 4.6 (a)). By TEM, Pt nanoparticles in JM Pt40/C appeared
well-dispersed on the carbon support (Figure 4.6 (b)). However, large Pt
agglomerates were also observed in certain portions of the sample (Figure 4.7). Pt
nanoparticles generally ranged between 2-7 nm in size and were dispersed on carbon
particles which were generally 50-60 nm in size. The average Pt particle size was 4.2
nm, representing a metal surface area of 66.7 m2 g-1 (Prabhuram et al, 2004).
Experimental values corresponded with the values determined by the manufacturer -
4.5 nm and 62.3 m2 g-1 (Johnson Matthey, 2008). The particle sizes also agreed well
with those determined in literature (Zhang, 2004; Guo et al, 2005; Cabot, 2008).
100 nm

CHAPTER 4 _____________________________________________
107
Commercial Johnson Matthey JM Pt40/C and the home made Pt/CNT (propanol)
sample were further characterized using the VEECO ZEISS Ultra 55 Gemini FE
SEM with Energy Selective Backscattered detectors (ESB). Conventional SEM could
not clearly resolve metal nanoparticles from the carbon nanotube support materials.
The ESB allows clear compositional contrast and high resolution BSE imaging
revealed previously unseen image details. Morphological characteristics of the CNT-
supported nanophase Pt electrocatalyst (denoted Pt/CNT(propanol)) were compared
with the JM Pt40/C commercial electrocatalyst. The ESB image of the commercial JM
Pt40/C, which is the benchmark electrocatalyst and the industry standard, showed
significant agglomeration of Pt clusters (bright areas) upon carbon support (grey
areas) in Figure 4.7.
Figure 4.7 ESB image of JM Pt40/C with EDS analysis (inset)
The degree of agglomeration (Figure 4.7) was not apparent from the XRD analysis or
from the TEM images. The image also showed the high loading of Pt but uneven

CHAPTER 4 _____________________________________________
108
dispersion of Pt particles. The Pt loading was determined by energy dispersive
spectroscopy (EDS) and showed the loading of Pt to be 39.7 % (Inset in Figure 4.7),
which corresponds to the manufacturer’s specifications.
Using ultrahigh-vacuum HRSEM, and high resolution BSE, the Pt particles were
visible on the carbon nanotube support materials denoted Pt/CNT (propanol), and can
be quantitatively sized at ~8 nm (Figure 4.8). The ESB image (Figure 4.9) of
Pt/CNT(propanol) shows some agglomeration and variation in particle size of Pt but
high dispersion and much reduced cluster formation compared to the commercial
sample. The multi walled nature of the CNT is also evident in the STEM image
which revealed CNT structure and uneven dispersion of ultrafine particles of Pt
supported on CNT, for sample Pt/CNT (propanol), but agglomeration was less than
on the commercial catalyst.
Figure 4.8. ESB image of Pt/CNT (propanol)

CHAPTER 4 _____________________________________________
109
Figure 4.9. STEM imaging of Pt/CNT (propanol)
The HRSEM was thus able to successfully resolve and quantify Pt particle sizes in
the nanometer domain upon CNT.
4.5.1.3 Characteristics of electrocatalysts: galvanic displacement technique
The method for deposition of Pt used to prepare the series of Pt/CNT catalysts was
adapted from Qu and Dai (2005). In the initial adaptation, a piece of CNT paper
(approximate dimensions 0.5 cm x 0.5 cm) was attached to a piece of stainless steel
wire mesh using a stainless steel paper clip. The entire assembly was then placed in a
1.0 mM H2PtCl6 solution (+0.1 M HCl) for over 8.0 h. There after the assembly was
removed from the solution and taken apart, and the nanotube paper was rinsed with
copious amounts of water, then acetone, over filter paper on a standard vacuum
filtration setup. An SEM micrograph of the resulting Pt plated CNT is shown in
Figure 4.10.

CHAPTER 4 _____________________________________________
110
Figure 4.10 Galvanic displacement deposition of Pt (8 h) using stainless steel
Excessive deposition of Pt upon the carbon nanotube paper was observed (Figure
4.10) because of the length of time (8 h) initially used during the galvanic
displacement reaction. Moreover significant co-deposition of various components
derived from the stainless steel used as sacrificial anode was detected by EDS.
Because of the impurities observed when using stainless steel mesh as sacrificial
electrode, the use of ultra pure foils was implemented thereafter to promote the
galvanic displacements, in order to produce pure bimetallic catalyst systems (as
described in Section 4.4.1.2). Much shorter times were applied to minimize the
degree of wastage of Pt in the bulk, and directly form nano sized metal deposits on
the CNT paper.
After Pt deposition, using the rapid and simple galvanic displacement technique with
99.99% pure Al, Pb or Fe foils respectively, the CNT paper GDL increased in mass
(Figure 4.11 and Table 4.1). The replication was poor mainly due to incomplete
recovery of the CNT paper from the solution in some cases. However, the mass
increase did not follow the trend of Eø (volts) of the Al (-1.66), Fe (-0.44) or Pb (-
0.13) foils. Generally the shorter time caused less metal to deposit in the case of Al
and Fe foils as was expected. The mass % increase in the case of Al doubled as the
time was doubled. In the case of Fe no measureable increase in mass of the CNT

CHAPTER 4 _____________________________________________
111
substrate occurred during the first 10min deposition time, possibly indicating a slow
galvanic displacement reaction for this system, which is consistent with the low E ø
value for this metal. However, this was not true of the Pb foil where both times
applied allowed a similar increase in mass of the CNT substrate.
0
24
68
10
1214
1618
20
Al Pb Fe
mas
s %
incr
ease
10 min
20 min
Figure 4.11: Mass % increase of CNT paper after Pt deposition over 10 and 20 min
It was not certain that the mass % increase observed was due only to Pt deposition.
EDS was performed after SEM images were obtained to determine the atom % Pt and
establish whether any other metal had been co-deposited during the galvanic
displacement reaction. The atom % Pt deposited on CNT paper for various foil types
used in the galvanic displacement is shown in Figure 4.12.
0
0.5
1
1.5
2
2.5
Al foil 10 Al foil 20 Pb foil 10 Pb foil 20 Fe foil 10 Fe foil 20
Ato
m %
Pt
Figure 4.12: Pt Atom % increase of CNT paper after Pt deposition over 10 and 20 min for different foils
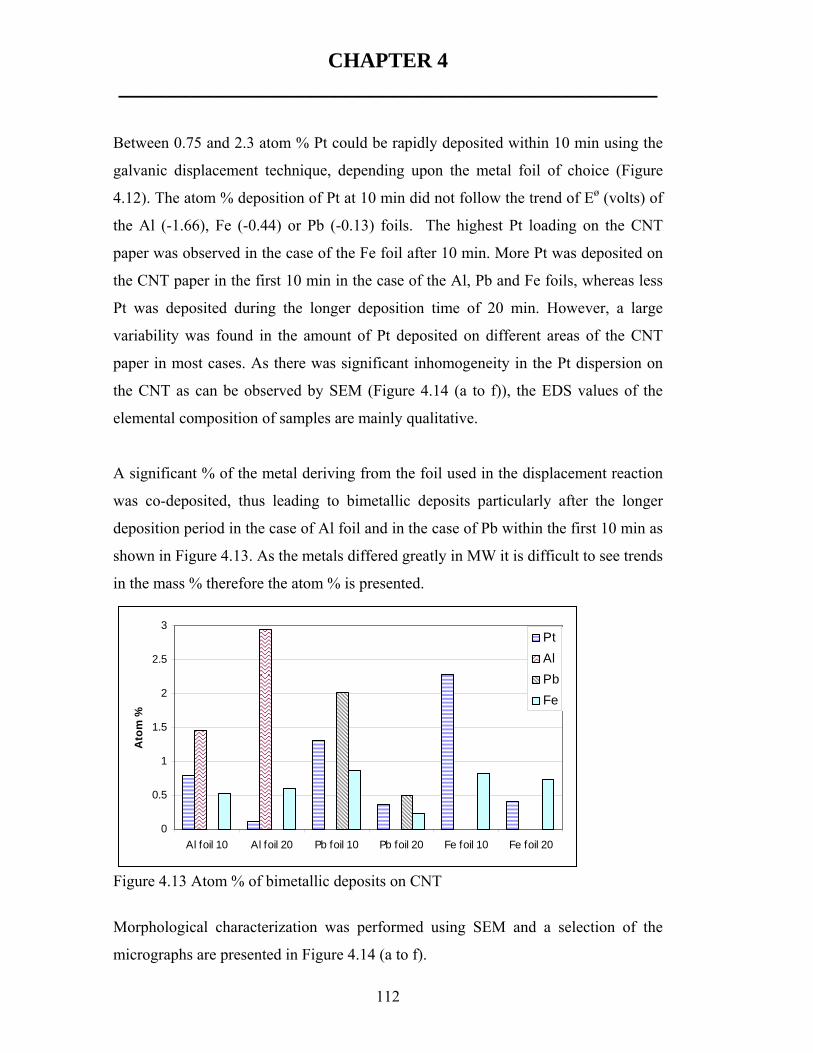
CHAPTER 4 _____________________________________________
112
Between 0.75 and 2.3 atom % Pt could be rapidly deposited within 10 min using the
galvanic displacement technique, depending upon the metal foil of choice (Figure
4.12). The atom % deposition of Pt at 10 min did not follow the trend of Eø (volts) of
the Al (-1.66), Fe (-0.44) or Pb (-0.13) foils. The highest Pt loading on the CNT
paper was observed in the case of the Fe foil after 10 min. More Pt was deposited on
the CNT paper in the first 10 min in the case of the Al, Pb and Fe foils, whereas less
Pt was deposited during the longer deposition time of 20 min. However, a large
variability was found in the amount of Pt deposited on different areas of the CNT
paper in most cases. As there was significant inhomogeneity in the Pt dispersion on
the CNT as can be observed by SEM (Figure 4.14 (a to f)), the EDS values of the
elemental composition of samples are mainly qualitative.
A significant % of the metal deriving from the foil used in the displacement reaction
was co-deposited, thus leading to bimetallic deposits particularly after the longer
deposition period in the case of Al foil and in the case of Pb within the first 10 min as
shown in Figure 4.13. As the metals differed greatly in MW it is difficult to see trends
in the mass % therefore the atom % is presented.
0
0.5
1
1.5
2
2.5
3
Al foil 10 Al foil 20 Pb foil 10 Pb foil 20 Fe foil 10 Fe foil 20
Ato
m %
PtAlPbFe
Figure 4.13 Atom % of bimetallic deposits on CNT
Morphological characterization was performed using SEM and a selection of the
micrographs are presented in Figure 4.14 (a to f).

CHAPTER 4 _____________________________________________
113
Al foil and 10 min deposition (Sample 1)
(a)
Al foil 20 min deposition (Sample 8)
(b) Pb foil 10 min deposition (Sample 3)
(c)
Pb foil and 20 min deposition (Sample 10)
(d) Fe foil 10 min deposition (Sample 5)
(e)
Fe foil 20 min deposition (Sample 12)
(f)
Figure 4.14. SEM micrographs of CNT paper with Pt deposition using (a,b) Al, (c,d) Fe and (e,f) Pb foils
From the EDS results (Figure 4.13) of the elemental composition of the samples
prepared using Al foil the degree of co-deposition of Al ranged from 1.5 to nearly 3
atom % depending on the deposition time of 10 and 20 min respectively and a small

CHAPTER 4 _____________________________________________
114
Fe contaminant of between 0.24 to 0.86 atom % was also observed which was
unexpected as the metal foils used as sacrificial electrodes were 99.99% pure. The Fe
content observed in the various samples may be due to the residual Fe catalyst
remaining in the CNT after acid washing and CNT paper formation as was shown in
Chapter 3.
In the case of the Fe foil, about 0.8 atom % Fe was co-deposited with the Pt. In the
case of Pb foil 2 atom % of Pb was co-deposited with the Pt and more was apparently
co-deposited at the shorter deposition time of 10 min than at the longer time of 20
min. This variability in elemental composition determined by EDS may be due to the
inhomogeneity of the metal deposition upon the CNT that was observed by SEM
(Figure 4.14) and these results should be treated with caution as they are based upon
the analysis of very small areas. These are general trends only as there was a large
variability in EDS results since this method probes only a very small portion of the
sample. From the SEM results it appears that during the galvanic displacement
reaction in a Pt solution the use of the Pb foil resulted in relatively consistent and
homogeneous Pt deposition and few large Pb containing Pt clusters were formed. In
the case of the Pb foil it was also apparent that the deposition time used did not make
a large difference in the results obtained and the deposition was also more evenly
dispersed. These results highlight that the compositional analysis by EDS is merely
qualitative.
In the galvanic displacement the substrate metal acts as a sacrificial anode and
donates an electron to the CNT and in the process is oxidized and displaced into
solution (Qu and Dai, 2005). However, from the results presented in this chapter it
can be seen that the displaced metal ions then compete with the Pt ions in solution,
being reduced by the CNT as well, and thus are co-deposited upon the CNT with the
Pt after a period of time when sufficient metal ion has been displaced into solution.
This is obviously a result of the increasing concentration of the metal ions in solution
over time. It appears from the data that the longer the contact time, the more the
subsidiary metal predominates in the co-reduction and deposition reaction,

CHAPTER 4 _____________________________________________
115
particularly in the case of Al (Eø -1.66), whereas for the metals with lower Eø such as
Fe (-0.44) or Pb (-0.13) this trend was not so significant in the time of the reaction.
These results show that it is in principle possible to directly deposit Pt and a second
metal on CNT to form a bimetallic electrocatalyst that is directly incorporated into
the CNT paper GDL. This procedure would thus eliminate a large amount of
processing and illustrates a route to easily form a series of nanophase Pt containing
electrocatalysts by use of the galvanic displacement deposition technique. This
approach aims to rapidly and very simply deposit the Pt electrocatalyst directly onto
the gas diffusion layer (GDL) substrate, CNT paper. This method to directly deposit
Pt onto preformed CNT paper as GDL would eliminate many steps in the processing
of the electrocatalysts into composite form. This was a proof of concept study and
would require optimization to establish the precise conditions for homogeneous
deposition of Pt containing bimetallic particles upon CNT paper.
4.5.1.4 Catalytic activity of prepared and commercial materials
Cyclic voltammetry (CV) was used to investigate the electroactivity of the
electrocatalysts which were compared to the commercial JM Pt40/C. A typical cyclic
voltammogram for JM Pt40/C is presented in Figure 4.15. The electrodes were formed
by mixing 0.1073 g of catalyst; 0.25 cm3 H2O and 1.25 g of Nafion and depositing
this ink on a glassy carbon electrode. The electrode performance was measured in a
electrochemical cell equipped with the glassy carbon working electrode, a platinum
wire counter electrode and a Mercury Sulphate Electrode (MSE) as the reference
electrode. The geometric surface area of the working electrode was 0.08 cm2. The
electrolyte used in the cell was 0.50 M H2SO4 and no redox active species were
introduced in the electrolyte. The temperature of the electrolyte as kept at 29 ºC.
Since a MSE was used as a reference electrode for this experiment, the following
parameters were applied in the potentiostat: Start potential (V):-0.7; First Vertex
potential (V):0.8; Second Vertex potential (V):-0.8; Step potential (V):0.00518; Scan

CHAPTER 4 _____________________________________________
116
rate (V s-1): 0.05. The reference potential of HgSO4 was approximately 0.68 V hence
the redox couple showing electrochemistry in the voltammogram obtained was lower
in potential by 0.68 V compared to those of the literature where the reference
electrode typically is a reversible hydrogen electrode (RHE) with 0.00 V potential.
Figure 4.15 Cyclic voltammogram of commercial JM Pt/C 40 catalyst
For the catalyst JM Pt40/C the only current that flows between -0.25 V and 0.125 V
is that required to charge the electrolytic double layer. Above 0.125 V oxide
chemisorption begins with the process
Pt + OH- → Pt⎯OH + e-
And above 0.8 V,
Pt⎯OH + OH- → Pt⎯O + H2O + e-
As the potential scan is reversed cathodically, oxygen gas present in the
neighbourhood of the electrode is reduced together with the chemisorbed oxide layer.
At lower potentials there is a small double-layer region followed by the deposition of
hydride as
Pt + H2O + e- → Pt⎯H + OH-
Finally close to the thermodynamic potential for the HgSO4 electrode (MSE) i.e. -0.68
V, there is strong evolution of hydrogen (hydrogen evolution reaction), where after
the Pt can be re-oxidised once the potential direction is again reversed (Bradley et al.,
1989).

CHAPTER 4 _____________________________________________
117
In all the subsequent CV experiments the electrolyte system was changed to a ClLiO4
solution and the reference electrode was a Ag/AgCl electrode as set out in Section
4.4.2. The best voltammetric curves were obtained with the following set-up
conditions: Start potential (V):-1.1; First Vertex potential (V):1.1; Second Vertex
potential (V):-1.1; sensitivity of 100 µA V-1. The scan rate (V s-1) was varied. The
reference potential of Ag/AgCl is approximately 0.205 V hence redox couples
showing electrochemistry in the voltammograms obtained were higher in potential by
0.205 V compared to those of the literature where the reference electrode typically is
a reversible hydrogen electrode (RHE) with 0.00 V potential.
Initial cyclic voltammetry (CV) of the paste made from the ultrapure graphite diluent
and mineral oil was performed only to ascertain its relative contribution to the HER.
The CV of the ultrapure graphite diluent is presented in Figure 4.16.
Figure 4.16 CV of ultrapure graphite diluent (scan rate between 10-50 mV s-1 between -500 to 1200 V; sensitivity of 100 µA V-1)

CHAPTER 4 _____________________________________________
118
Figure 4.17 CV of impure graphite diluent (scan rate 10 mV s-1 between -1.500 to 1.300 V; sensitivity of 100 µA V-1)
Cyclic voltammetry of the ultrapure graphite diluent (99.9995% pure) between -500
to 1200 V and at a scan rate between 10-50 mV s-1 and sensitivity of 100 µA V-1
(Figure 4.16) shows low activity and few peaks for the hydrogen evolution reaction
(HER), a low current output signal in the µAmp region, a low current at the peak
potential and little noise. On the other hand a less pure graphite diluent (graphite
powder; 1-2 µm synthetic (Sigma Aldrich) that was initially used as diluent showed
more significant electro activity (Figure 4.17) for HER most likely due to metal
impurities. Therefore the mainly electrochemically inactive ultrapure graphite was
used as diluent during the preparation of paste electrodes, except in the
electrochemical comparison presented in Figure 4.21 where the impure graphite was
used as blank diluent to compare the relative contribution of the diluents’
electroactivity.
Cyclic voltammetry of JM Pt40/C is presented in Figure 4.18 and Figure 4.19 at scan
ranges from 5-50 V and 50-300 V respectively in a ClLiO4 solution and the reference
electrode was Ag/AgCl.

CHAPTER 4 _____________________________________________
119
Figure 4.18 JM Pt40/C scanned between 50 and 5 mV s-1; 100 µA V-1 sensitivity and scan range between -1100-1000 V (JM01-2=50 mV s-1; JM01-6=5 mV s-1)
It can be observed in Figure 4.18 that, in contrast to the H2SO4 (SCE) system
presented in Figure 4.16 for the commercial standard JM Pt40/C catalyst, in the case
of the ClLiO4 (Ag/AgCl) system shown in Figure 4.17, the hydrogen evolution
reaction (HER) occurs on the anodic sweep at approximately -0.77 V at 50 mV s-1
(and not at -0.68 V as in the H2SO4(SCE) system) (Bradley et al., 1989). The slower
the scan rate the more negative the voltage of HER peaks observed. At 5 mV s-1 it
occurred at -0.84 V. In the anodic scan (Figure 4.18) from negative to positive, after
the onset of H2 evolution the hydride deposition occurs at about -0.27 V at 50 mV s-1.
In the cathodic scan from positive to negative, the oxide chemisorption occurs at
about -0.41 V and PtO forms at about 0.35 V at 50 mV s-1. The one electron transfer
is shown by the approximately 0.5 V difference between the hydride formation and
the hydrogen evolution.

CHAPTER 4 _____________________________________________
120
Figure 4.19 CV of JM Pt40/C scanned between 50 (JM01-2) and 500 mV s-1 (JM01-10); 100 µA V-1 sensitivity and scan range -1100-1100 V
Figure 4.19 shows that as the scan speed is increased in the case of JM Pt40/C scanned
in the ClLiO4 (Ag/AgCl) system between 50 (JM01-2) and 500 mV s-1 (JM01-10) at
100 µA V-1 sensitivity and a scan range between -1100-1100 V, the hydride peak
becomes more prominent and the onset of hydrogen evolution occurs at lower
overpotentials. As the scan rate was increased to 500 mV s-1 the offset of
overpotential for the HER decreased to -0.31 V (ClLiO4 (Ag/AgCl) system).
Therefore all further samples were compared for cyclic voltammetry at identical scan
rate.
Figure 4.20 shows the forward square wave voltammetry of JM Pt40/C commercial
catalyst scanned between 5-50 Hz in the ClLiO4 (Ag/AgCl) system at 100 µA V-1
sensitivity and a scan range between -1100-1100 V. Square wave voltammetry was
performed at different frequencies in the case of the commercial electrocatalyst to
discern the different rates of the various reactions.
50 500

CHAPTER 4 _____________________________________________
121
Figure 4.20 Square wave voltammetry of JM Pt40/C commercial catalyst
Figure 4.20 (A-E) shows that the evolution of H2 at -0.77 V is a fast process detected
mainly at frequencies of 30 and 50 Hz. On the other hand H- formation (-27 V) is an
intermediate rate process observed clearly at 15 Hz and at 10Hz. PtO formation and
chemisorption is also an intermediate process occurring at +0.341 V.
C=15 Hz D= 10 Hz
E= 5 Hz
A =30 Hz B= 50 Hz

CHAPTER 4 _____________________________________________
122
Figure 4.21 Comparison between Graphite diluent (green) vs Graphite/CNT blend (brown) vs Graphite Pt/CNT (propanol) blend (blue) at 10 mV s-1, 100 µA V-1 sensitivity and scan range -1300-1300 V
Figure 4.21 shows a voltammetric comparison of activity for the HER in the ClLiO4
(Ag/AgCl) system made between paste electrodes prepared with the graphite diluent
(green) by itself; graphite that was blended with as made bare CNT (brown) prior to
Pt deposition; and graphite that was blended with the electrocatalyst Pt/CNT
(propanol) (blue). Scans were taken at 10 mV s-1, and 100µA V-1 sensitivity, with a
scan range from-1300 to 1300. Neither of the graphite diluents used in the preparation
of the paste electrodes showed distinct peaks indicating activity for HER under the
conditions applied (also compare Figures 4.16 and 4.17). In Figure 4.21 two distinct
reduction peaks relating to H2 evolution and hydride deposition are observed on the
anodic sweep below zero (10 mV s-1, 100 µA V-1 sensitivity) in the case of the Pt
CNT (propanol) sample, which peaks were somewhat reversible. Such peaks are
orders of magnitude less intense or absent in the case of the blank sweeps of graphite
as well as the graphite CNT blend that had no Pt catalyst content. Thus it was
possible to clearly discern the different electro activity for HER of the graphite

CHAPTER 4 _____________________________________________
123
diluents or the CNT support or the Pt containing electrocatalysts. The following
results for cyclic voltammetry were thus obtained by use of paste electrodes
comprising the ultrapure graphite diluent, and various CNT supported Pt
electrocatalysts in the ClLiO4 (Ag/AgCl) system. Comparison of the voltammetric
scans of JM Pt40/C and Pt /CNT propanol at 50 mV s-1 between -1100 and 1100 and
sensitivity of 100 µA V-1 using paste electrodes (Table 4.2) in ClLiO4 (Ag/AgCl) are
shown in Figure 4.22.
JM Pt40/C
Pt/CNT propanediol
Figure 4.22 Comparison of JM Pt40/C (brown) with Pt/CNT (propanol) (blue) electrocatalysts at 50 mV s-1 between -1100 and 1100; sensitivity of 100 µA V-1.
The onset of hydrogen evolution during cyclic voltammetry (Figure 4.22) of a paste
electrode containing the Pt electrocatalyst prepared with the impregnation-reduction
method (Pt/CNT (propanol)), as was detailed in Section 4.4.1.3, occurred at a lower
overpotential (-0.66V) than the commercial JM Pt40/C catalyst (-0.77 V) under the
same conditions in the ClLiO4 (Ag/AgCl) system.

CHAPTER 4 _____________________________________________
124
Figure 4.23 Cyclic voltametry of Pt/CNT (propanol) between -1100 - 1100V and scan rate varied between 10 - 50 mV s-1 at a sensitivity of 100 µA V-1
Figure 4.23 shows the electro activity of the Pt/CNT (propanol) sample in the ClLiO4
(Ag/AgCl) system scanned at different rates between 10 and 50 mV s-1. This Pt/CNT
(propanol) catalyst comprising carbon nanotubes and supported Pt was used as the
benchmark CNT supported catalyst for comparison with the electrochemistry of the
galvanic displacement sample series prepared as described in Table 4.1 and 4.2 which
samples will be denoted Pt/CNT_BP hereafter.
The samples prepared via the galvanic displacement technique (Pt/CNT_BP series)
were prepared as paste electrodes (Table 4.2) using the ultrapure graphite as diluent.
Cyclic voltammetry was performed in an argon purged ClLiO4 (Ag/AgCl) system
between -1100 and 1100 at 50 mV s-1 and a sensitivity of 100 µA V-1 for Pt/CNT
(propanol) and the Pt/CNT _BP samples prepared using the galvanic displacement
10
20
50
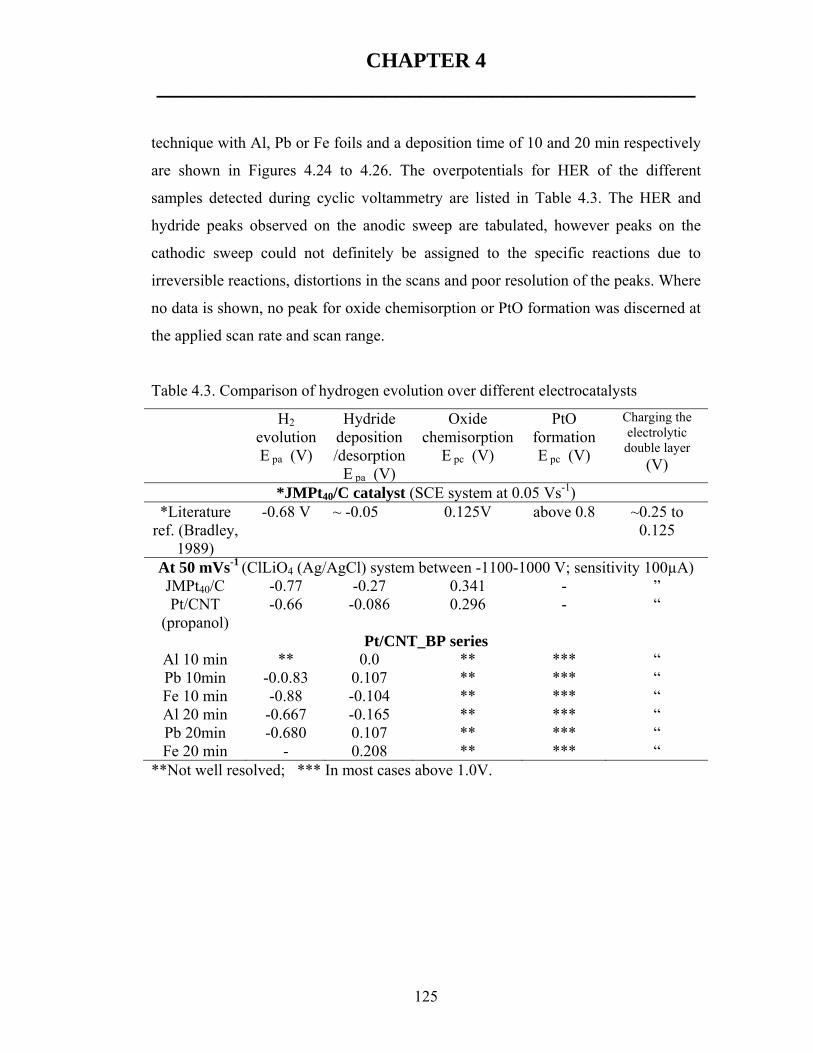
CHAPTER 4 _____________________________________________
125
technique with Al, Pb or Fe foils and a deposition time of 10 and 20 min respectively
are shown in Figures 4.24 to 4.26. The overpotentials for HER of the different
samples detected during cyclic voltammetry are listed in Table 4.3. The HER and
hydride peaks observed on the anodic sweep are tabulated, however peaks on the
cathodic sweep could not definitely be assigned to the specific reactions due to
irreversible reactions, distortions in the scans and poor resolution of the peaks. Where
no data is shown, no peak for oxide chemisorption or PtO formation was discerned at
the applied scan rate and scan range.
Table 4.3. Comparison of hydrogen evolution over different electrocatalysts
H2 evolution E pa (V)
Hydride deposition /desorption
E pa (V)
Oxide chemisorption
E pc (V)
PtO formation E pc (V)
Charging the electrolytic double layer
(V)
*JMPt40/C catalyst (SCE system at 0.05 Vs-1) *Literature
ref. (Bradley, 1989)
-0.68 V ~ -0.05 0.125V above 0.8 ~0.25 to 0.125
At 50 mVs-1 (ClLiO4 (Ag/AgCl) system between -1100-1000 V; sensitivity 100µA) JMPt40/C -0.77 -0.27 0.341 - ” Pt/CNT
(propanol) -0.66 -0.086 0.296 - “
Pt/CNT_BP seriesAl 10 min ** 0.0 ** *** “ Pb 10min -0.0.83 0.107 ** *** “ Fe 10 min -0.88 -0.104 ** *** “ Al 20 min -0.667 -0.165 ** *** “ Pb 20min -0.680 0.107 ** *** “ Fe 20 min - 0.208 ** *** “
**Not well resolved; *** In most cases above 1.0V.

CHAPTER 4 _____________________________________________
126
Figure 4.24 CV of Pt/CNT_BP samples prepared for 10 min using Al, Pb or Fe foils compared with Pt/CNT (propanol) in ClLiO4 (Ag/AgCl) between -1100 and 1100 at 50mV s-1; sensitivity of 100µA V-1
CV of the Pt/CNT_BP sample prepared with the galvanic displacement method using
Pb as foil and 10 min deposition time, shows quite distinct peaks on both the anodic
and cathodic sweeps with a large hydride deposition peak at -0.29 V and a minimal
peak for H2 evolution at a scan rate of 50 mV whereas the Al and Fe foils samples
reacted for 10 min did not show a significant electro activity for hydrogen evolution
under the conditions tested. The Pt/CNT_BP sample prepared with Fe foil had the
highest Pt content of the galvanic displacement samples (Figure 4.12) yet showed
dissimilar and low HER activity compared to the Pt/CNT(propanol) sample, showing
the effect of the preparation conditions used for making the CNT based
electrocatalyst upon the catalytic activity for HER. The very large hydride adsorption
peak observed during the anodic sweep in the case of the Pt/CNT_BP sample
prepared with Pb foil for 10 min is of interest and may indicate a high hydride
adsorption capacity for this bimetallic sample.
Pt/CNT (propanol)
Al
Pb
Fe

CHAPTER 4 _____________________________________________
127
Figure 4.25 shows the CVs of Pt/CNT (propanol), in comparison to Pt/CNT_BP
samples prepared via the galvanic displacement reaction for 20 min using Al, Pb or
Fe foils.
Figure 4.25 CV of Pt/CNT samples prepared for 20 min using Al, Pb or Fe foils compared with Pt/CNT (propanol) scanned in ClLiO4 (Ag/AgCl) between -1100 and 1100 at 50mV s-1; sensitivity of 100µA V-1
In general from Figure 4.24 and 4.25 it was not evident that the electrocatalyst
samples prepared using Al, Pb and Fe foils for either 10 min and 20 min using the
galvanic displacement reaction had significant electroactivity compared to the
commercial JMPt40/CNT electrocatalyst (Figure 4.18), during CV scanned at a rate of
50 mV s-1 (Table 4.3). The CV scans cycled between -1100 and 1100 V at 50 mV s-1
and sensitivity of 100 µA V-1 of these bimetallic Pt/CNT_BP series of
electrocatalysts are shown individually in Figure 4.26 (a-f). The CVs show that 10
min samples were also significantly different in electroactivity characteristics to 20
min samples, which may be due to the varying ratios of different metals in the
bimetallic system observed for the different deposition times. Moreover, the
hydrogen evolution peak was only observed clearly on the anodic sweep in the case
of the Pt/CNT_BP sample prepared with Pb foil for 20 min (Figure 4.26d), but with
very little current flow.
Fe
Al
Pb
Pt/CNT (propanol)
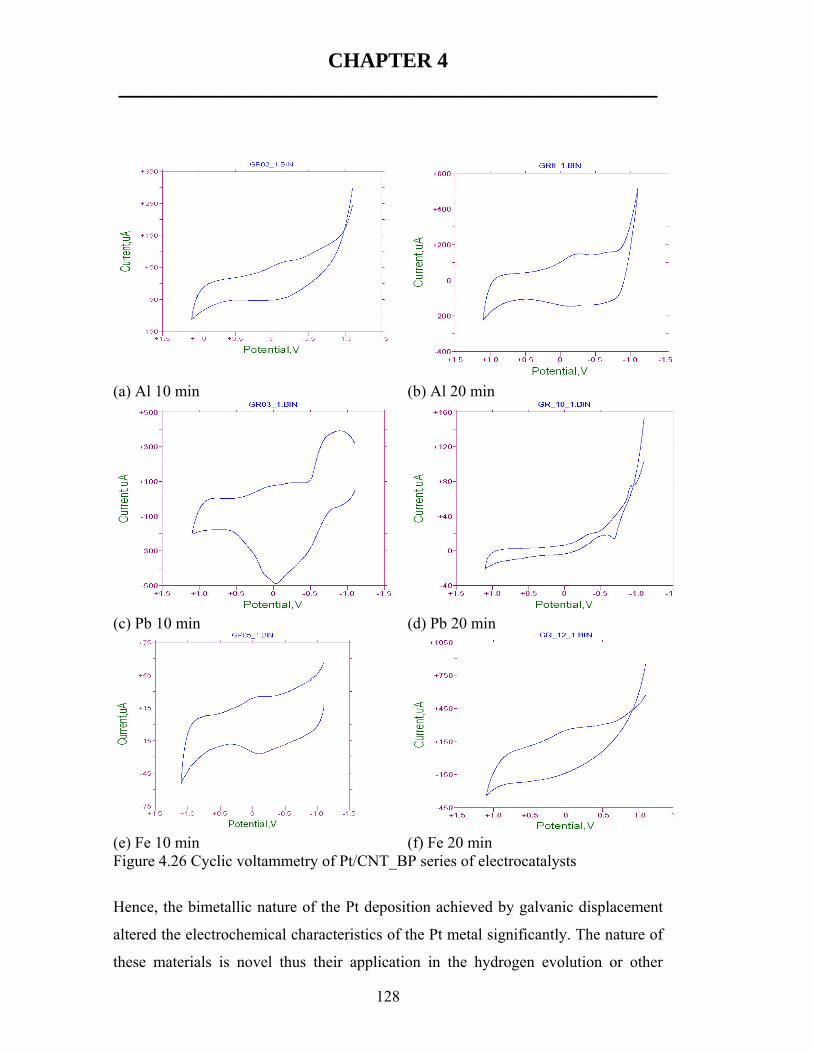
CHAPTER 4 _____________________________________________
128
(a) Al 10 min (b) Al 20 min
(c) Pb 10 min (d) Pb 20 min
(e) Fe 10 min (f) Fe 20 min Figure 4.26 Cyclic voltammetry of Pt/CNT_BP series of electrocatalysts
Hence, the bimetallic nature of the Pt deposition achieved by galvanic displacement
altered the electrochemical characteristics of the Pt metal significantly. The nature of
these materials is novel thus their application in the hydrogen evolution or other

CHAPTER 4 _____________________________________________
129
reactions would require further investigation to establish whether these CNT
supported materials could be beneficially applied. However, in the case of the Pb foil
(20 min) sample it is interesting to note (Table 4.3) that the overpotential of hydrogen
evolution (-0.68) is lower than the commercial JM Pt40/C sample (-0.77 V) and
similar to the case observed in the Pt/CNT (propanol) sample (-0.66).
As the HER peaks of interest were not observed in all cases in the new series of
electrocatalysts prepared with the galvanic displacement technique (see Table 4.3) at
a sweep rate of 50 mV s-1, therefore different sweep rates were examined for each
separate sample. Very large distortions of the voltammetric curves were observed in
some cases. This may arise as a consequence of large uncompensated ohmic drops
(Gaudet et al., 2005) thus the electro catalytic activity of the various catalysts may be
best compared by following the current density at constant electrode potential.
Because the determination of the voltammetric charge is complicated by the presence
of distorted voltammetric curves, the electrochemical properties of the bimetallic
catalysts were not considered further.
4.6 CONCLUSIONS
Methods for preparing active nanophase Pt electrocatalysts on CNT substrates were
explored. The CNT made according to a ferrocene-toluene spray pyrolysis synthesis
procedure were utilized as a suitable conductive substrate for the preparation of an
active Pt electrocatalyst Pt/CNT (propanol). A CNT paper substrate was used as
substrate to deposit Pt via a galvanic displacement technique and prepare a nanophase
Pt-containing gas diffusion electrode in one simple step, to eliminate the extensive
processing that is required for stabilization of nanophases in porous matrixes or in
thin film format with binders on support substrates to prepare composite electrodes.
Deposition of Pt on CNT paper by a simple galvanic displacement technique formed
a new, active Pt containing gas diffusion electrode.

CHAPTER 4 _____________________________________________
130
The new electrocatalysts were compared to an industry standard commercial Pt
catalyst stabilized on Vulcan carbon black for electro activity. The use of CNT as
support substrate and the Pt deposition techniques applied are shown to result in
electrocatalysts that could reduce the energy requirements of the hydrogen evolution
reaction, particularly in the case of Pt electrocatalyst Pt/CNT (propanol). In the case
of the electrocatalyst sample Pt/CNT_BP (Pb foil (20 min)) the overpotential of the
anodic hydrogen evolution peak (-0.68 V) is similar to the case observed in the
Pt/CNT (propanol) sample (-0.66 V) and both occur at lower overpotentials than the
commercial JM Pt40/C sample (-0.77 V) when cycled between -1100 and 1100 V at
50 mV s-1 at sensitivity of 100 µA V-1 in a ClLiO4 (Ag/AgCl) system.
Because of limitations in processing CNT, due to agglomeration of CNT, which need
to be overcome and which fell outside the scope of this study, the Pt/CNT (propanol)
materials were not further integrated into composite electrode format. Initial
electronic characteristics of the Pt/CNT_BP supported on CNT paper are presented in
Chapter 6.
In Chapter 5 the development of Si based micro and mesoporous substrates as
supports for Pt electrocatalysts will be presented as well as their incorporation into
composite electrode format and activity testing for water electrolysis.

CHAPTER 5 ____________________________________________
131
5 NANOPHASE COMPOSITE ELECTRODES
5.1 INTRODUCTION
The topic of this chapter is the development and optimization of composite
nanophase containing electrodes, utilizing nanophase electrocatalysts. Preparation of
nanophase composite electrode materials for potential application in alkaline or solid
polymer electrolyte electrolyzers is challenging and requires consideration of the
many factors involved in their formation. In the preparation of composite electrodes,
the type and ratio of catalyst, of binder and/or proton conductor, the additional
electroconductive phase, and solvent type and amount should be optimized in order to
achieve maximum activity, stability and durability whilst maintaining access for gas
or liquid, and pathways for electrons and protons. It is necessary to achieve the
optimum balance between macropores and micropores required for gas access or
removal, for liquid access, and pathways for electron and proton conduction at the
nanophase electrocatalyst in the composite material. The gas / liquid / solid boundary
is known as the three phase boundary and bringing all these three phases into close
contact reproducibly poses a particular challenge for fabrication of composite
electrodes. Components of the electrodes must be selected to ensure stability in the
presence of a corrosive electrolyte as well as gaseous and liquid reactants.
For cost efficient operation of electro catalytic installations for hydrogen production
the development of highly active, selective and stable working nanophase catalysts
incorporated in electrodes may offer benefit. Large surface area electrodes may be
achieved by the application of supported metal clusters of nanosized catalysts
supported in three dimensional substrates. These materials must then be attached to
the electrode surfaces. Because of their large active surface areas these nanophase
containing electrodes could significantly reduce the overpotential of the electrolyzer
cell.

CHAPTER 5 ____________________________________________
132
Generally, a bulk metal such as Ni is used as the active electrode component in
alkaline electrolyzers, because of cost considerations (Imariso et al., 1980). Use of
nanosized electrocatalysts would allow highly active but costly precious metals such
as Pt to be applied most economically and could minimize their wastage and
maximize their active catalytic surface area. Formation of composite nanophase
electrodes by sequential deposition has been identified in the thesis as being a
possible method for simple fabrication of electrodes. The first step in the process of
sequential deposition is the preparation of the catalyst support (see Chapter 3 and
Chapter 4) and the subsequent stabilization of the active nanophase electrocatalysts
on the support to prevent agglomeration of the nanophase metal centres (also see
Chapter 4). The preparation of supports was detailed in Chapter 3 and routes to
stabilize Pt nanophase electrocatalysts upon CNT supports was detailed in Chapter 4.
The sequential stabilization of heterogeneous nanophase materials upon a variety of
Si based porous substrates, followed by stabilizing these materials on electro
conductive supports to prepare composite electrodes and then applying the electrodes
in high electrolyte environments for water electrolysis forms the focus of this chapter.
The type of nanophase electrocatalyst, and ratio of catalyst to binder, was
investigated in different combinations with various porous and non porous conductive
and non-conductive substrates. In most cases the same proton and electro-conductive
phase was added, but in varying amounts. The stability, activity and durability of
nanophase composite electrodes prepared by sequential deposition was also examined
by a rapid testing protocol as specified in this chapter. This protocol was applied for
screening composite nanophase electrode materials using hydrogen production at
relatively high applied potentials in a high electrolyte environment. Hydrogen
production in the alkaline electrolyte was used as a simple and relatively rapid
qualitative measure of the electro catalytic activity of the nanophase electrocatalyst in
this composite format. Poor catalytic performance for hydrogen production was taken
as a simple measure of the occlusion of catalytic sites by binders and / or gaseous

CHAPTER 5 ____________________________________________
133
layers or the lack of adequate conductive pathways and was used as rapid indicator
for optimization of formulations of micro-emulsions or inks. The expected high gas
evolution under the applied conditions was used as an accelerated aging test of the
stability and durability of the composite electrode components. Delamination of the
catalytic component during high gas evolution was used as a simple measure of
inadequate stabilization of the electrocatalyst containing film upon the substrate.
Composite electrodes prepared by sequential deposition in this study are composed of
a electrocatalyst containing film comprised of stable and catalytically active
particulate or heterogenous nanophase material, stabilized with a binder, that is
supported upon a conductive substrate. By their nature these composite electrodes are
mainly gas diffusion electrodes (GDE) that can be used in fuel cells, gas sensors,
some types of batteries and electrolyzers. In this chapter the focus is on hydrogen
production by water electrolysis as a simple reaction used as measure to optimize and
understand the nature of the electrodes.
5.2 BACKGROUND
Water electrolysis is the process of dissociation of water (H2O) under the influence of
an electrical current. Electrolysis of H2O leads to formation of H2, O2, H+ and OH-.
Only H2 and O2 involve a change of oxidation state. Hydrogen in H2 has a lower
oxidation state (0) than hydrogen in H2O (+1), whereas oxygen in O2 has a higher
oxidation state (0) than oxygen in H2O (-2). Therefore water can be reduced to H2 or
oxidized to O2.
Solutions to increasing catalytic and current efficiency, obtaining high current
densities, minimizing power consumption and lowering the cost of hydrogen
production by water electrolysis are constantly sought. Because of the high cost of
electrical power it is desirable to reduce the voltage at which a solution is
electrolyzed to as low a value as possible. In the electrolysis of water there is
considerable scope for achieving a reduction in electrolyzing voltage by reducing the

CHAPTER 5 ____________________________________________
134
hydrogen overpotential at the cathode. There have been many attempts to achieve a
reduction in hydrogen overpotential. For example, it is well known that the hydrogen
overpotential at a cathode may be reduced by increasing the surface roughness and
thus the surface area of the cathode. Other methods of producing low hydrogen
overpotential cathodes which have been described involve coating the surface of a
cathode with an electrocatalytically active material (Wood, 1986).
Physical and chemical variables that can have an impact on energy loss in these
systems include the supporting electrolyte type and concentration, temperature,
pressure, gas to liquid ratio, distance between working electrodes, cell geometry, flow
velocity, gas evolution and product separation from the electrolyte (Imariso et al.,
1983).
Two different diffusion processes take place in GDE electrodes namely, gas diffusion
and the liquid or vapour diffusion. During the phase transition of gas/liquid in an
electrochemical reaction, diffusion limitation may occur because of the difference in
density and mobility, and thus the time scale. Material characteristics that are
important for the liquid transport include the wetting angle of the catalyst, and the
respective catalyst support. The wettability affects the electrolyte uptake and the
osmotic flow. Liquid transport can change from a diffusion to an osmotic mode
depending upon the characteristics of the composite (Kinoshita,1988).
The process of hydrogen generation during water electrolysis is often impeded by the
formation of a “locking” gas layer on the cathode surface. As a result, the potential
drop between two electrodes rises sharply and both process efficiency and economics
suffer. The specific resistance of the electrolyte between the two opposite electrodes
during alkaline water electrolysis will be increased by the presence of gas bubbles,
decreasing the energy efficiency of the electrolysis process (Sillen et al., 1980). These
authors investigated the role of bubble density, average bubble radius, and the gas
volume fraction at the electrode surface at various current densities, flow velocities,
electrolyte concentrations and temperatures. Ohmic potential drop occurs in the

CHAPTER 5 ____________________________________________
135
electrolyte space between the electrodes and the separating diaphragm which is filled
by the gas produced (Appleby and Crepy, 1978).
Although introduction of porous electrode structures and net or mesh configurations
lower the negative effect of the surface gas layer, more drastic changes to catalyst
morphology is needed in order to bring about potential drop values close to
economically justifiable values. The formation of electrocatalytic structures on the
surface of mesh or porous electrodes has been reported as electrode materials in
liquid phase alkaline electrolyzers (Divisek and Schmitz, 1984).
Not only the electrochemical reactions, but also adsorption-desorption processes at
the electrode surface as well as transport processes such as the molecular transport of
hydrogen and the thermal behavior of gas diffusion electrodes need to be considered.
Sunde (2000) reviewed approaches to models and computer simulations of
conductivity, polarization resistance, and impedance of composite electrodes that
could be used to model the highly disordered structure of composite electrodes
typically used in solid oxide fuel cells (SOFC). Approaches included a thin film
model, Monte Carlo calculations, or a macroscopic porous-electrode model. The
macroscopic porous-electrode theory was modified to include non-linear kinetics and
gas-phase diffusion. Sunde found that most of the electrochemical reaction occurred
in a region closer than 10 μm to the bulk electrolyte. The current-collector potential at
a given current was found to be nearly independent of thickness above 10 μm. These
authors report that the rate balance was controlled by porosity, volume fraction of
catalyst and particle size, which could be varied within the limitations relating to the
requirement of percolation in the gas phase and the conductive networks.
Kaisheva (2004) studied the activity and the transport hindrances in air gas-diffusion
electrodes. The structure of the electrode in their study was a double-layer electrode
comprising a porous hydrophobic gas diffusion layer, and a catalytic layer where the
electrochemical reduction of oxygen took place. They found that the air gas-diffusion
electrode had a complicated porous structure in which several electrochemical and

CHAPTER 5 ____________________________________________
136
transport processes were occurring simultaneously and performance was influenced
not only by the activity of the catalyst, but also by all transport processes occurring in
its porous structure. In addition the transport hindrances in the electrode were also a
function of the pore structure and the surface properties of the catalyst. The
hindrances in the transport of molecular oxygen were higher in the electrodes with
thicker gas layers. It was theoretically predicted and experimentally proven that the
existence of a network of hydrophobic pores in the carbon-catalyst grains played an
important role for the effective operation and stability of the electrodes.
In bi-polar electrolyzer units the application of a cell potential of 1.8 to 2 volts (V)
resulted in a relatively low current density of 200 to 300 mA cm-2. The efficiency of
such cells was therefore poor, calculated on the reaction enthalpy. For achievement of
a 100 % yield at economically feasible current densities the total cell potential should
be of the order of 1.5 V (Divisek and Schmitz, 1984).
These earlier studies highlight the various aspects that can affect the performance of
the electrodes and more recent studies show attempts to address the challenges
inherent in the alkaline electrolyzer system, based on obtaining an understanding and
optimization of the physical structure of the electrode.
The current density (j) and cell voltage (I-V) relationship is the most important
characteristic of any electrochemical cell. Because the I-V relationship changes with
different loads and operating conditions it can be used to determine the performance
of the system. Electrochemical reactions differ from other heterogeneous reactions as
their rate constants depend on the potential difference, (V) at the metal-solution
interface (Ebbing, 1993). During the water electrolysis process electrical current
flows through the electrolyte when the external voltage is applied, thus the flow of
current depends on the applied potential. Current density is described as a measure of
the rate of electron transfer at equilibrium, for example if the potential is increased,
current density also increases and hydrogen bubbles are produced rapidly. Therefore
the current of an electrochemical cell will depend on the kinetics of the electrode

CHAPTER 5 ____________________________________________
137
reactions as well as the energy required for the electrode to provide a given amount of
current (Shukla et al., 2002).
5.3 COMPOSITE ELECTRODE FABRICATION METHODS
Nanophase composite gas diffusion electrodes (GDE) as defined in this study
comprise an assembly of (1) a supported or unsupported nanophase electrocatalyst,
that is dispersed upon (2) a suitable porous conductive substrate in the form of (3) a
catalyst containing film in which the three phase boundary between gas, liquid and
solid is achieved. The film is prepared by use of a micro emulsion or ink constituted
with the catalyst, a suitable binder, a solvent, and a proton- and electro-conducting
phase.
Gas diffusion electrodes (GDEs) typically are constructed of high-surface area
supports for metal catalysts, as well as solid inert materials with high gas
permeability. Typical composite GDEs consist of carbon black and a binder such as
polytetrafluoroethylene (PTFE) in close contact with a porous current collector
through which the gas can pass. The hydrophobic PTFE inhibits aqueous solutions
from completely penetrating the porous structure but the carbon black support is
capable of being wetted by the electrolyte. The solution layer may act as a thin
meniscus that can support high gas flux rates. Limitations caused by lack of gas
solubility in the electrolyte is offset by the very thin diffusion layer formed with the
wetted electrode surface. The additional three-dimensional surface area incorporating
a gas-liquid-solid interface into the electrode element that is inherent in most GDEs
can significantly amplify the current compared to that obtained on an equivalent
simple two dimensional geometric area (De Castro, 1996).
Many thin film deposition methods have been developed and commercialized. Thin
films are usually considered to be less than 10 µm thick. Schuegraf (1988) reviews
thin-film deposition techniques. Of these technologies, chemical vapour deposition,
spray deposition and thermal spraying deposition are the techniques most relevant,

CHAPTER 5 ____________________________________________
138
and are encompassed in the overall methodic of the sequential deposition technique
developed in this chapter, Chapter 5.
Ahn et al. (1997) reported the fabrication of fibre composite gas diffusion electrode
(GDE) structures and their performance for oxygen reduction in an alkaline
electrolyte. The electrode structure was formed with 2 μm diameter activated carbon
fibres interlocked within a network of 2 μm sinter-bonded metal fibres to form the
composite which was stable, highly conductive and had a void fraction exceeding 95
%.
Franco et al. (1998) studied the electric properties of polymer electrolyte / carbon
black composites, but these materials were not based on thin films. These authors
prepared composites based on the solvent casting technique. The polymer complexes,
appropriate solvent and the required amount of highly conductive carbon black or
polymer electrolyte were blended. The concentration of conductive carbon black
particles used was close to the percolation threshold value, which was found in their
case to be in the range of 15 to 20 wt % of carbon black. After removal of the solvent
the electrode samples were prepared by pressing the ground components at 4 ton cm-2
followed by thermal treatment (80 ºC, 24 h) to homogenize the material.
In a study by Legagneur et al. (1999), composite electrodes were prepared and
deposited as a thick film or pressed against a Pt disk using 10 % by mass of carbon
black with addition of the catalytic component (85 % by mass) and 5 % of an organic
binder.
Low cost electrode fabrication techniques were investigated by Pham et al. (1999)
including methods such as dip coating, spin coating, slurry painting, and
electrophoretic deposition. Films were required to be 10 µm or less and repeated
processing was applied to achieve thicker films for stable long term operation of
electrodes. These electrodes were suitable for application in a SOFC fuel cell
operating at 1000 °C. Delamination was prevented by spraying a colloidal solution on

CHAPTER 5 ____________________________________________
139
a heated substrate to remove the solvent during deposition. The authors found that the
abrupt interface between components of the electrode was suppressed.
Furuya (2001) reported the production of a gas diffusion electrode where electrode
materials were dispersed in aqueous solution with a surfactant. The dispersion was
flocculated, filtered, dried and subjected to a sheeting process to form the electrode
sheet, the surfactant was removed, and it was hot-pressed at 380 °C and 4.9 MPa for
1 min with copper mesh that was integrated in the gas-supply layer and used as a
current collector. The gas diffusion electrode was made using a dispersion with
PTFE, carbon blacks and a catalyst. The loading of catalyst was 0.3 – 0.001 mg cm-2.
The potential of the gas diffusion electrode was measured in 32 wt% sodium
hydroxide solution at 80 °C for applied current densities.
The patent literature has many descriptions of ways to prepare gas diffusion
electrodes. Some of the most relevant patents are briefly summarized here. United
States Patent (USP) 6838408 (Bulan et al., 2005) describes a method for producing
gas diffusion electrodes, for use in electrolysis cells, by preparing a sheet-like
structure by rolling a powder mixture containing a catalyst or a catalyst mixture and a
binder, and then the sheet-like structure is connected to an electrically conductive
catalyst support by rolling. USP 6881511 by Tosco et al., (2005) describes gas
diffusion electrodes containing modified carbon products with attached organic
groups that were used as part of the active layer and/or the blocking layer to extend
the service life of electrodes. USP 6361666 (Lipinski and Leuschner, 2002) describes
the preparation of thin, flat, porous gas diffusion electrodes made of carbon, which
have a smooth surface with regulated porosity obtained by pyrolysis of a composite
of an organic polymer and a reinforcing skeleton formed partially using organic
material. USP 5733430 (Ashida et al., 1998) describes a gas diffusion electrode that
can be applied as an oxygen cathode for sodium chloride electrolysis, which is
formed of a porous layer containing a super-fine particle catalyst and a fluorine-
containing material on a substrate that is connected to a gas-liquid permeable
collector. USP 5618392 (Furuya, 1997) describes a gas diffusion electrode

CHAPTER 5 ____________________________________________
140
comprising a reaction layer and a gas diffusion layer attached to each other. The
electrode has apertures through the electrode to facilitate the flowing of an electrolyte
and a gas even though the interelectrode distance is small.
Cox et al. (2005) in United States Patent 6911411 describe catalyst agglomerates for
membrane electrode assemblies. This patent indicates the different formulations of
ink required on either the anode or the cathode and recommends that the amount of
polymer solution added as binder should contain a weight of polymer from 6 to 15 %
of the catalyst for the anode side electrode and 7.5 to 15 % of the catalyst for the
cathode side electrode. The optimum level of polymers depended on the type of
polymers, the operating conditions including aspects such as temperature, gas
humidification level, and passive or active transport of reactants to the electrode
surface. The catalyst composition could be applied onto the polymer membrane by
using techniques such as sputtering, painting, electro-deposition, spraying, decal
transferring, filtering and filtering transfer, tape casting, and screen printing. The
coated layer was either hot or cold pressed or calendered. Another approach given
was that the catalyst agglomerates could be applied onto a backing layer to be
indirectly transferred to the membrane surface. In this patent a dilute Nafion®
ionomer solution was prepared by mixing 3.584 g of 5 % ionomer, 1.792 g of water,
and 1.792 g of isopropanol (isopropanol:water=1:1) using a sonication bath for 10
min or by mixing 8.823 g of 5 % Nafion® ionomer and 26.47 g of water (3 times the
amount of 5 % ionomer).
As these various studies and patents show, various aspects need to be considered in
the preparation of composite electrodes. The support substrate type as well as the
components and the composition of the micro emulsion or ink used to form the
electrocatalyst containing film upon the support requires optimization. The variables
that can be explored include different support substrates, different binders, different
supported or unsupported nano scale electrocatalyst, and various solvents. The
relative amounts of each component of the ink should be considered in terms of the

CHAPTER 5 ____________________________________________
141
final concentration of electrocatalyst desired per unit area in the thin film deposited
on the substrate.
Pt containing gas diffusion electrodes are described by various authors. Pt is
considered to be the best metal for the reduction of hydrogen ions. The rate of
hydrogen evolution from different metal surfaces can vary greatly (Tafel, 1905). The
value for the exchange current density of hydrogen evolution on platinum is
approximately 10-2 A cm-2 whereas on Ni it is 10-7 A cm-2, which is five orders of
magnitude lower than Pt for the rate of hydrogen evolution. The exchange current
density is defined as the rate of oxidation or reduction of the metal electrode at
equilibrium expressed in terms of current and represents the rates of oxidation and
reduction of a given single electrode at equilibrium, when no loss or gain is
experience by the electrode material. The magnitude of exchange current density is a
function of metal composition, surface roughness, concentration of both the reactants
and products involved in the reaction, and surface impurities (Corrosion Source,
2008). This source reveals that a higher exchange current density exists for the H+/H2
system equilibrium on platinized platinum (10-2 A cm-2) with a high surface area
compared to bright platinum (10-3 A cm-2), but is markedly reduced in the same
system by the presence of trace impurities such as sulfur. The approximate exchange
current density for the reduction of hydrogen ions on a range of materials is shown in
Table 5.1.
Table 5.1 Approximate exchange current density (j0) for the hydrogen oxidation reaction on different metals at 25 ºC (Corrosion Doctors, 2008).
Metal Log10 j0 (A cm-2) Pb -13 Zn -11 Sn -10 Ni -7 Fe -6 Pd -4 Pt -2
It requires an overvoltage of about 0.2 V to liberate hydrogen gas from a polished
platinum surface and the factors that determine the overvoltage of an electrode at any

CHAPTER 5 ____________________________________________
142
one pressure is the size of the gaseous nuclei that can cling to it, the surface tension,
and the pressure (Macinnes and Adler, 1919; Macinnes and Contieri, 1919). The
potential windows of Pt, Ni and carbon electrodes differ in aqueous solution and it is
necessary to consider the electrode's hydrogen overvoltage, oxygen overvoltage and
dissolution as well as the electrolyte pH. For instance, Pt has a potential window
between about -1.1 and 1.2 V at pH 14 whereas the window changes to between -0.9
and 0.9 V at pH 7 and about -0.3 and 1.25 V at pH 0, and Ni metal dissolves in acidic
solution.
Nørskov et al. (2005) studied the bond energies of various transition and noble metals
to understand the trends in the exchange current for the hydrogen evolution reaction
(HER) and they found a relationship between the exchange currents and the
calculated hydrogen adsorption energies. Calvo and Balbuena (2007) on the other
hand studied the oxygen reduction reaction (ORR) over Pt and Pt-Pd alloys and found
that none of the alloys tested provided better sites than those of pure Pt both for O2
dissociation and for the reduction of oxygen and OH to water. The kinetics of the
HER in 6 M KOH electrolyte have been studied (Elumalai et al., 2002) on electrodes
made from the pressed powders of submicron size Co, Ni and Co–Ni alloy powders.
Morimoto et al. (2000) describe gas diffusion electrodes made of electroconductive
porous PTFE sheets supporting Pt catalysts that were used as the oxygen reduction
cathodes for chlor-alkali electrolysis. These authors found that the activity of the
cathode deteriorated because of loss of Pt catalyst due to the oxidative corrosion of
the carbon substrate.
Hayashi and Furuya (2004) describe the preparation of gas diffusion electrodes by
precipitates deposited from carbon-polytetrafluoroethylene dispersions using an
electrophoretic deposition technique. These electrodes were applied in a fuel cell
using Pt as a catalyst in alkaline solution to promote oxygen reduction and the ability
of the gas diffusion electrode for hydrogen oxidation was reportedly high.

CHAPTER 5 ____________________________________________
143
A bifunctional electrode structure for a unitized proton exchange membrane
regenerative fuel cell was developed by Shao et al. (1999). The electrode comprised a
thin catalyst layer with a loading of 0.4 mg cm-2, which minimized mass transport and
ohmic limitations. In that study platinum black was used as bifunctional hydrogen
catalyst, and platinum black and iridium oxide was used as the bifunctional oxygen
catalyst. The combination of 50 wt% Pt and 50 wt% IrO2 was reported to be a good
bifunctional catalyst for the oxygen electrode. The electrode support layer used was a
sheet of carbon paper that was soaked in a PTFE emulsion and the support thus
contained about 30 wt% PTFE. The thin film fabrication approach is most similar to
that described in this chapter.
Some studies use alloys of metals and various combinations of base metals for
electrode formation which may be useful for the HER. The purpose of using mixed
oxides is to modify the electrochemical properties of the active metal by modifying
its composition. In United States Patent 4586998 (Wood, 1986) cathodes were
produced by electro-depositing an outer layer of Pt group metal on a nickel or nickel
alloy substrate. In United States Patent 4273624 (Laitinen and Thornton, 1981) a thin
platinum film was electrodeposited on a conductive tin oxide surface. This patent
indicated that tin oxide electrodes are less active compared with platinum because of
high overpotentials, which result in very high power losses in commercial processes.
Pure tin oxide (SnO2) has a relatively high electrical resistance in comparison to other
metals and observed current densities were about 10-4 A cm-2 for a polished tin oxide
substrate. The electrical stability and conductivity may be improved through the
introduction of a dopant, such as antimony. Electrodes, such as Ti/SnO2 electrodes
possess relatively high oxygen evolution reaction (OER) potential to produce a high
concentration of OH radicals and are typically used for the oxidation of organic
pollutants (Ding et al., 2007). SnO2 particles as Pt support have been used for
PEMFCs and DMFCs, and have revealed high catalytic activities toward methanol
oxidation (Jiang et al., 2005). Three dimensional Ti/Co/SnO2-Sb2O5 electrodes
combined with activated carbon are described by Wang et al. (2007) for the
electrochemical treatment of wastewater. Mixed-oxide electrode coatings based on

CHAPTER 5 ____________________________________________
144
IrO2, RuO2 and SnO2, for the oxygen evolution reaction (OER) were prepared using a
thermal decomposition method (Vazquez-Gomez et al., 2006). SnO2-RuO2 oxides
were prepared by mechanical alloying using high-energy ball milling of various
proportions of pure SnO2 and RuO2 powders (Gaudet et al., 2005). The electrodes
were made with slurries containing the oxide material, water, and 10 wt. % Teflon
which was then painted on both sides of pretreated Ti platelets.
Giz et al. (2003) describe Ni-Cu-Fe electrodes obtained with an acetate bath for the
electrochemical codeposition of Ni-Cu-Fe at low pH. These electrodes showed low
overpotentials for the HER, around 0.150 V at 80ºC, in brine solution (160 g L-1 NaCl
and 150 g L-1 NaOH), and good stability under continuous long-term operation for
260 h was reported. The overpotential under the same conditions for the Ni-Cu-Fe
electrode was 249 mV lower than that of mild steel (404 mV), used in commercial
unipolar electrolyzers. Poor intrinsic catalytic activity of the Ni-Cu-Fe electrodes was
compensated by an improvement due to the larger electrode surface area obtained by
this technique of preparation.
This route of enhancement of surface areas of non-noble metals as electrode materials
is one route to overcoming the low activity of these materials, and was the approach
followed in this chapter where certain of these non-noble metals (SnO2, Ni) were
applied as stabilized nano particles.
5.4 APPROACH IN FORMATION OF COMPOSITE ELECTRODES
This chapter further explores the effect of varying components upon the activity of
the composite electrodes. The type of catalyst and ratio of catalyst to Nafion®, as
binder and proton conductor and any additional electroconductive phase, as well as
the necessary solvents and dispersant medium may be varied in order to optimize the
composition of the catalytic ink. The formation of nanophase containing composite
electrodes is described in the following sections.

CHAPTER 5 ____________________________________________
145
Composite nanophase electrodes were formed by sequential deposition through firstly
preparing the mesoporous and microporous supported catalysts described in section
5.6.1.5 of this chapter where after admixtures of the powder nanophase
electrocatalysts were made with a conductive phase (carbon black), and various
binder types, or a proton conductive phase (Nafion® LIQUION 1100). Solvents that
were used included ultra pure water, acetone, and toluene.
The micro emulsions or inks formed by these admixtures were coated upon a variety
of conductive substrates by various deposition techniques (spray coating, dip coating,
casting, or hot-pressing with polytetraflouroethylene). The catalytic inks contained
various binders or proton conductive phases in ratios of solids that took consideration
of the percolation threshold. Different ratios of catalyst to binder and conductive
phase were explored. In some cases the electrocatalytic material was substituted with
commercial nanomaterials such as nanophase antimony tin oxide.
Various methods were investigated for deposition of the micro emulsion or ink,
which included spray coating, dip coating, sponge coating, casting, as well as heat
and pressure fusion. Moreover the method for mixing of the ink was evaluated and it
was found that ultrasonication of the ink was necessary for good dispersion but that
excessive ultrasonication could damage the catalytic particles. Since this method of
mixing is established practice, the dispersion by stirring and ultrasonication was not
further varied.
5.5 CHARACTERIZATION OF COMPOSITE ELECTRODES
Cyclic voltammetry and chronoamperometry analysis were chosen as the most
suitable methods to determine the activity of newly developed electrode materials
after controlling the accuracy and reproducibility of the technique under the chosen
experimental conditions. In chronoamperometry the current, which is recorded
continuously, is measured versus time at a defined potential and variations over time
are then integrated numerically. Measurements may be done under galvanostatic

CHAPTER 5 ____________________________________________
146
control of the current, or potentiostatic control of the voltage and in this study were
obtained potentiostatically using the Autolab galvanostat and potentiostat and
General Purpose Electrochemical system software (GPES by Ecochemie,
Netherlands). The Autolab galvanostat, potentiostat and GPES provided a computer
controlled electrochemical measurement system which can be used for cyclic and
linear sweep voltammetry, including techniques such as galvanostatic cyclic
voltammetry, and chrono methods.
In voltammetry the current density (mA cm-2) of the materials as a function of the
applied potential are taken as a measurement of the activity for water electrolysis
under conditions that caused polarization of the working electrode. All variables that
may influence concentration polarization and thus the over-potential and therefore the
electrode response were kept constant as far as possible. By this means, competing
equilibria of dissociation, association and complex formation were avoided as far as
possible or at least were present to an equivalent degree. In particular the geometric
electrode area and shape in the case of membrane electrodes were carefully
controlled. Moreover, in high electrolyte studies, an excess of inactive supporting
electrolyte was used and electrolyte concentration, temperature and stirring rate were
also identical in all cases to maintain similar conditions of species diffusion,
migration and convection. Samples were purged with a flow of nitrogen to minimize
residual currents due to small amounts of dissolved oxygen.
Cyclic voltammetry and chrono amperometric experiments were performed over
electrodes that had not been exposed to an oxidizing cycle. The oxidation and
reduction wave, onset of hydrogen evolution and increasing over potentials over a
number of cycles were evaluated for some samples in order to optimize the testing
conditions. Selected samples were exposed to aging in 40 % KOH and retested for
reproducibility. Furthermore, some samples were exposed to extended cycling or high
voltages during voltammetry in order to accelerate aging and test composite layer
stability.

CHAPTER 5 ____________________________________________
147
Initially the relative electro activity of various electrocatalysts was determined
qualitatively in liquid alkaline electrolyte systems at low temperatures (0-5 ºC) to
reduce the effect of nuisance variables such as temperature changes during testing
and in order to screen prospective candidate nanophase electrocatalyst and optimize
ink formulations. Selected electrode materials were characterized by optical
microscopy and SEM and tested at higher temperatures.
5.6 EXPERIMENTAL: MATERIALS AND METHODS
5.6.1 Materials
5.6.1.1Binders
The different binders or conductive phases that were used in the processing of the
composite electrodes, and their designated codes are listed in Table 5.2.
Table 5.2 Types of binder or conductive phase
Code NAME SUPPLIER Stock and Lot no.
A Polyvinyl acetate Industrial Analytical (Pty) Ltd. A12732; D9795C
B Polystyrene Industrial Analytical (Pty) Ltd. A11170; C5600
C Polytetraflouroethylene Industrial Analytical (Pty) Ltd. A12613; B5544C
N Nafion® LIQUION 1100 Ion Power Co., Glasgow 5 wt% EW
solution in water
CB Hydrophilic carbon black
Source: Cabot Botlek BV grade: m Vulcan x
C72; sample no.:
GP3784
Nafion® perfluorinated ion exchange resin solution 5 wt% is presented as a lower
aliphatic alcohol and water 85 % ethanol and 15 % methanol mixture, Aldrich
catalogue no. 527084. Nafion® polymer solution is a dispersion of perfluorosulfonic

CHAPTER 5 ____________________________________________
148
acid and polytetrafluoroethylene copolymer, and is a product of E. I. du Pont de
Nemours Company.
5.6.1.2 Supports
The different support substrates that were investigated and their designated codes,
used as descriptor in graphics, are specified in Table 5.3.
Table 5.3 Types of support substrates
Code Support Type
a Carbon black on carbon cloth (code 6100-200 CB) supplier Lydall
b Carbon cloth (code: 6100-300) supplier Lydall
c Activated carbon on carbon cloth (6100-200 AC) supplier Lydall
d ZrO2 backed with stainless steel mesh, (Product number: Z240S lot Hy Te
010806/01/05 (17), Ω 0.7, 240 nm pore size) supplier Creavis Gesellschaft für
Technologie und Innovation mbH D-45764 Marl
e Lydall Technical Ceramic paper: Sample: 3000LF
f Lydall Ceramic paper 40% glass: Grade IP-397-2
g Teflon (PTFE) sheet
h Stainless steel mesh
5.6.1.3 Solvents
The following solvents were varied in the preparation of nanophase composite
electrodes:
Ultra pure water, acetone, toluene.
5.6.1.4 Commercial Electrode Materials
For comparative purposes, the following commercial Ni foil materials were tested
under identical conditions to the nanophase composite electrodes:
i) Flat Ni foil – 0.787 mm thick, 99.5 % metals basis. Alpha Aesar stock #
14193; Lot # J22J09.

CHAPTER 5 ____________________________________________
149
ii) Ni Foam manufactured by Recemat International B.V., P.O.B. 88 2920 AB
Krimpen A/D IJSSEL.
Type A –. RCM-Ni-4852-01.6
Type B – RCM-Ni-2733.3
Type C – RCM NC-4852.01.6
5.6.1.5 Nanophase Electrocatalysts
In those cases where an electro active nanophase catalyst was included in ink
formulations, the following particulate or micro and mesoporous supported
nanophase materials were evaluated for electro catalytic activity in a high electrolyte
environment.
i. Nanotek Antimony Tin Oxide (designated SbSnO in this study), 99.5 % pure
consisting of a ratio of Sb2O5 : SnO2 of 10: 90 obtained from Nanophase
Technologies Corporation. (Part #: ATO- 2400-000-025; batch # AT00831 –
05X; product code 2400). Particle size ranging between 11-29 nm; a surface
area of 30-80 m2 g-1 (BET) with density of 6.8 g cm-3.
ii. Platinum, nominally 40 % on carbon black (supplied by Alpha Aesar a
division Johnson Matthey) denoted JM Pt40/C in this study and characterized
in Chapter 4.
iii. Zeolite H-FAU (CBV780 Lot. No 78001N00257; Zeolyst International;
dealuminated faujasite with a given analysis of: Si/Al 80; wt% Na 0.03; BET
surface area of 780 m2g-1, was impregnated with 1 mL 0.1545 M H2PtCl6
soln, and Pt reduction was achieved with sodium hypophosphite as follows. A
solution of 0.48 g of sodium hypophosphite was made in 10 mL H2O. 2.5 mL
of this solution was added to 1.0 g of Pt zeolite samples that had been
impregnated by the incipient wetness technique. Samples were shaken in
solution and then placed in a hot air oven at 50 °C for 4.5 h. The oven
temperature was increased to 100 °C overnight in sealed containers.
Thereafter the samples were thoroughly rinsed and dried at 80 °C. Nanosized

CHAPTER 5 ____________________________________________
150
particles of Pt were supported upon the zeolite as observed by Transmission
Electron Microscopy, with Pt cluster sizes ranging between 5-10 nm.
iv. Ni plated gamma alumina: Pre-dried gamma alumina (Condea) was plated
with Ni according to the following Ni electroless plating technique. About 2 g
of gamma-Al2O3 was contacted with 20 mL 0.01 M PdCl2 for 1 h under
stirring, then filtered, rinsed and dried in a vacuum oven overnight.
Thereafter the modified alumina was contacted with 10 mL NaH2PO2 for 1 h
under stirring and subsequently filtered, rinsed and dried in a vacuum oven.
The sample was then exposed to 15 mL of a Ni plating solution for 1 min at
80 °C under stirring, where after it was filtered, rinsed thoroughly and dried
overnight in a vacuum oven at 80 °C. The plating solution was composed of
31 g L-1 NiSO4, 54 g L-1 NaH2PO2, 50 g L-1 lactic acid and 38 g L-1 acetic
acid, which was adjusted to a pH of 4.5 prior to use.
v. Au HMS: The deposition and reduction method (methanol / formaldehyde
reduction method) was as follows. 1.0 mL of 0.3004 M Na[AuCl4] + 0.60 mL
of ultra pure water + 0.80 mL of methanol +1.60 mL formaldehyde were
mixed. 1.0061 g of HMS (prepared as specified by Zang et al., 1997) was
mixed thoroughly with 1.0 mL of reduction solution and followed by drying
the sample in an oven at 100 ºC for 1 h to initiate primary seeding of Au. The
sample was allowed to cool down and the rest of the 3.0 mL of the reduction
solution was added. It was then kept at room temperature for 24 h. The colour
of the sample was yellow at this stage. It was then subjected to heat again at
100 ºC for 2-3 h, but no colour change was observed. Then it was heated at
350 ºC in a furnace for 4 h. The sample turned reddish pink in colour.
vi. Pt HMS carbonized and Pt MCM-41 carbonized: The mesoporous substate
was prepared as is specified in Chapter 3. The Pt containing electrocatalyst
denoted Pt HMS carbonized and Pt MCM-41 carbonized were prepared by an
incipient wetness impregnation procedure as follows: A solution of 0.1545 M
H2PtCl6 was prepared using 1.00 g H2PtCl2/12.5 mL H2O to give a 0.1545 M
solution. 1 mL of this solution was impregnated into 1.0031 g HMS zeolite as
well as 1.0054 g MCM-41 zeolite. The slurry formed was stirred at 80 ºC until

CHAPTER 5 ____________________________________________
151
dry. Pt reduction was achieved as follows: 1.0081 g of MCM-41 and 1.0005 g
of HMS impregnated with the Pt solution were reduced as follows: 0.8 mL
methanol and 1.6 mL formaldehyde (37-41 % solution) were mixed. The
above masses of the zeolites were submerged in 1.0 mL plating solution each
for 1 h to initiate platinum seeding (this was done at room temperature). The
samples were then dried at 100 ºC for 1 h. The samples were kept at room
temperature for one day and then heated to 100 ºC for 1 h. The samples were
then cooled, thoroughly rinsed and then dried at 80 ºC.
5.6.2 METHODS
The materials mentioned above were utilized to make electrodes in the manner
explained below. The block diagram (Figure 5.1) schematically shows the sequential
deposition procedure for fabricating the composite nanophase electrodes including
characterization and the activity testing.
Figure 5.1 Block diagram of the sequential deposition procedure
1. Preparation of nanophase electrocatalyst (supported or unsupported)
2. Support preparation
3. Ink preparation
4. Supporting procedures (a, b, c, etc.)
2
4b
4a
4c
5
6
1
3

CHAPTER 5 ____________________________________________
152
5. Characterization
6. Electrochemical testing
Each of the steps in the process of sequential deposition for fabricating the composite
nanophase electrodes including characterization and the activity testing is described
in the results section below.
5.6.2.1 Preparation Of Nanophase Electrocatalysts
Unsupported nanosized SbSnO2 and Pt on carbon based electro commercial catalysts
as listed in Section 5.6.1.5 were purchased. Supported Au, Pt and Ni-Pd nano
particles were prepared as specified in section 5.6.1.5. A summarized supporting
procedure was generally: The metal solutions of interest (e.g. Au, Pt) were
impregnated into various micro or mesoporous zeolitic supports (FAU, HMS, MCM-
41) and reduction was performed by thermal reduction, methanol formaldehyde or by
a sodium hypophosphite method (Petrik, 2003). These materials were not extensively
characterized, except by TEM. In some cases, where specified, the supported
nanophase catalyst was thereafter carbonized by carbon sputtercoating or by CVD
using LPG (Petrik et al, 2008) in order to ensure good conductivity and connectivity
between the Si matrix and the carbon black used as conductive phase in the ink
formulations (Section 5.6.2.3).
5.6.2.2 Support Preparation
Different electrode substrates (Table 5.2) were used as the electrocatalyst containing
film support, and cut into appropriate size before use. The weights of these substrates
were recorded before and after deposition of the ink. The substrate by itself or the
formed composite electrode was connected to the power source via electrical leads
and clips and tested electrochemically.
5.6.2.3 Ink Preparation
The ink was typically prepared by mixing Nafion® ionomer solution, carbon black
and the nanophase catalyst in a solvent or solvent/water to make an ink. The mixture

CHAPTER 5 ____________________________________________
153
was placed in an ultra sonic bath for 5 min - 1 h and then magnetically stirred
overnight. The ink formulations were optimized with reference to catalyst type,
catalyst loading, proton and electron conductive phases, binder type, and solvents. All
inks with or without catalysts were prepared in the following manner.
The amount of carbon black (conductive phase Carbon black Cabot Botlek BV;
grade: n Vulcan x C72; sample no.: GP3784) usually 40 % of the total mass without
catalyst (or 20 % of total mass in the case where a catalyst was added) was weighed
out. Thereafter the catalyst (usually 20 % of the mass of solids) was weighed and
added to the carbon black and mixed by grinding. The appropriate amount of solvent
was added. In many cases this was ultra-pure water. Thereafter the binder solution
(usually 60 % of total mass of ink formulation) was added, which was Nafion® (5 %
solution) in some cases. Then the mixture was placed in an ultrasonic bath for 30 – 60
min to disperse the particles and form a homogenous ink. The ink was magnetic
stirred until use to prevent precipitating of the particles. The compositions of the
different micro-emulsions or inks used in this study are presented in various tables in
the result section in conjunction with the results for electro activity testing.
5.6.3 Supporting Procedure
The different supporting procedures that were used to prepare composite electrodes,
namely casting, dip and sponge coating, hotpressing, and spray coating, are described
in this section. Nanoparticles of Sb/SnO were used, as an example of processing non-
supported nanophase particulates in electrocatalyst containing film format. Pt-FAU,
Au –HMS, Pt- HMS and Pt MCM-41 were applied as examples of processing
supported nanophase materials in electrocatalyst containing film format.
5.6.3.1 Casting method
A casting procedure was investigated using the following ink mixtures:
i) Polyvinylacetate was dissolved in acetone with carbon black
ii) Polystyrene was dissolved in toluene with carbon black and Sb/SnO
iii) Nafion® and carbon black

CHAPTER 5 ____________________________________________
154
i) Casting method using Polyvinylacetate and acetone with carbon black
1 g of Polyvinylacetate was dissolved in 25 mL of acetone. 0.5 g of carbon black
conductive phase (Source: Cabot Botlek BV; grade: m Vulcan x C72; sample no.
GP3784) was mixed into 10 mL of this solution. The mixture was placed in the ultra
sonic bath for 30 min, and then magnetically stirred until used.
ii) Casting method using Polystyrene and toluene with Carbon black and Sb/SnO
Carbon black:
1 g Polystyrene was mixed into 20 mL toluene [C6H5CH3: FW 92.14] and stirred for
1 h to dissolve. 0.5 g Sb/SnO and 0.5 g Carbon black (Source: Cabot Botlek BV;
grade: m Vulcan x C72; sample no.: GP3784) were mixed into 10 mL of this solution
and placed in an ultrasonic bath for 30 min and the mixture was then stirred
magnetically until used.
Carbon black and Sb/SnO
0.5003 g of commercial antimony tin oxide (Sb/SnO) and 0.5007g of Carbon black
were weighed and mixed with 20 mL of polystyrene solution (20 mL of toluene and
1.0141 g of polystyrene). The mixture was placed in an ultra sonic bath for 30 min,
and then magnetically stirred for 3 h.
iii) Casting method using 50% of Nafion® and 50% Carbon black
0.5464 g of Nafion® (Liquion 1100 5wt % Nafion® 1100 EW solution), and 0.5071
g of hydrophilic carbon black (Source: Cabot Botlek BV; grade: m Vulcan x C72;
sample no.: GP3784) was weighed respectively and mixed with 10 mL of ultra-pure
water. The mixture was placed in the ultrasonic bath for 30 min, and then
magnetically stirred until used.
The following casting procedure was used with the prepared ink mixtures. A stainless
steel template was manufactured that had exactly sized wells into which exactly sized
(2 cm2) portions of the different support substrates were placed. A precision standard

CHAPTER 5 ____________________________________________
155
weighing balance was used to weigh the same amount of ink onto all of the
substrates, about 0.55 g of ink was cast onto all of the substrates by using a pasteur
pipette. The electrodes were placed in the oven for 30 min at 100 °C to cure the
electrode and remove solvents or water.
5.6.3.2 Dip coating and sponge coating
The six different substrates (a-f) listed in Table 5.2 were dip coated with the
appropriate ink mixture or the ink was sponged upon each respective substrate. The
following procedure was followed for the preparation of ink for dip coating or
sponging on various substrates. 2.1126 g of Carbon black (Company: Cabot
Botlek;Grade: Vulcan xc 72, Sample No: GP 3789 [http://wl.cabot-
corp.com/index.jsp]), 5.9460 g of 15 % Nafion® (15 wt% ; 1100 EW solution) and
10.2398 g of water were mixed together. The above mixture was put in an ultrasonic
bath for 40 min and then stirred magnetically overnight. The mixture was then
divided in two; to one half 2.1375 g Sb/SnO catalyst was added to the mass of the
carbon black (denoted N/CB/SnO). (The other half portion without catalyst was
denoted N/CB). A further 30 g of water was added to each of the mixtures as the ink
initially formed too viscous a slurry. The various substrates were dipped into the
appropriate mixture or the inks were sponged upon each respective substrate then
dried at room temperature and further dried in an oven at 80 °C overnight. The
electrodes were then weighed to determine the increase in mass.
5.6.3.3 Hot pressing preparation technique
Polytetrafluoroethylene (PTFE) was used as binder in the hot pressing technique as
PTFE is chemically resistant, incombustible and insoluble in all known solvents,
being attacked only by molten alkali metals and by fluorine at high temperatures.
PTFE may be used up to 260 ºC. It may be shaped by compression and sintering
where its chemical stability and non-wettability make it suitable for use in extreme
circumstances. Therefore PTFE particles were used as a binder by mixing them with
carbon black and grinding the mixture to its finest state, applying the finely ground
mixture onto the substrate and then hotpressing using an Adendorff pneumatic press

CHAPTER 5 ____________________________________________
156
with built in heating stage. Various combinations of conductive phase, binder and
catalyst were hot pressed onto two different support types (e and g). In particular, 50
% PTFE binder (C) was pressed in an area of 1 cm2 with 50 % Carbon Black as
conductive phase and in some cases with additional Sb/SnO catalyst. Conditions of
hot pressing that were investigated, varied between 150-160 °C, for 2-10 min at 0-20
bars upon a ceramic based support (e). Upon support g (a Teflon membrane),
conditions were varied between 130 and 180 °C for 2 to 3 min at 20 to 41 bar
pressure with and without Sb/SnO nanophase catalyst.
5.6.3.4 Spray Coating
Spray coating (with Badger air-brush 150TM) was used to coat the chosen substrates
with the catalytic ink. In order to spray the same amount of ink upon all the
substrates, a pipette was used to measure the amount of ink to be sprayed upon each
of the substrates (about 1 mL of ink) into the well of the airbrush. The electrodes
were dried at room temperature or with a jet of hot air and weighed to determine the
increase in mass.
In general, a polymeric resin binder was mixed with either 10 mL of toluene or in the
case of Nafion®, water, and stirred until dissolved. Thereafter, a portion of this
solution was added to a mixture of hydrophilic carbon black (Source: Cabot Botlek
BV; grade: m Vulcan x C72; sample no.: GP3784) and a nanophase particulate or
supported catalyst (when used). A slurry was thus formed, which was mixed to
uniformity in an ultrasonic bath for 10 to 30 min. The slurry was spray coated onto
various support substrates chosen from Table 5.2 above using an airbrush with N2 as
carrier. The spray coated samples were dried at 90 °C for 4 hr and the thus formed
composite electrodes were then applied in electrochemical tests. The different inks
prepared and sprayed included:
i. 60 % Nafion® and 40 % Carbon black
ii. 60 % Nafion®, 20 % Carbon black and 20 % Antimony tin oxide (Sb SnO)
iii. 60 % Nafion®, 20 % Carbon black and 20 % Pt zeolite
iv. 60 % Nafion®, 20 % Carbon black and 20 % Ni-gamma alumina

CHAPTER 5 ____________________________________________
157
v. 10 % Polystyrene + 90 % Carbon black mixed in 10 mL of toluene.
vi. 50 % Polystyrene, 25 % Carbon black and 25 % Pt zeolite
Details of different preparation conditions of composites prepared by sequential
deposition are summarized below and listed in Tables 5.4 to 5.8
i) Ink preparation using a mixture of 60 % Nafion® and 40 % Carbon black
0.6473 g of Nafion® solution and 0.4040 g of hydrophilic carbon black (Source:
Cabot Botlek BV; grade: m Vulcan x C72; sample no.: GP3784) were weighed and
mixed in 10 mL of ultra-pure water to prepare the ink. The mixture was placed in the
ultrasonic bath for 1 h and then magnetically stirred overnight. Spray coating with an
airbrush was used to coat the substrates. In order to spray the same amount of ink
upon all of the substrates, a pipette was used to measure the amount of ink to be
sprayed upon each of the substrates (about 1 mL of ink). A electrocatalyst containing
layer of ink was sprayed, air dried and weighed. This was repeated until the required
mass increase was obtained. The electrodes were dried at a room temperature
overnight. Thereafter the electrodes were tested for hydrogen production.
ii) Ink preparation of 60 % Nafion®, 20 % Carbon black and 20 % Antimony tin
oxide (Sb/SnO)
0.6270 g Nafion® solution, 0.2163 g carbon black and 0.2158 g of Sb/SnO were
mixed with 10 mL of ultra-pure water. The ink preparation and spraycoating
procedures were the same as in the case of 60 % Nafion® and 40 % carbon black.
iii) Ink preparation for 60 % Nafion®, 20 % Carbon black and 20 % Pt zeolite
0.6048 g Nafion®, 0.2164 g carbon black and 0.2031 g of Pt zeolite were mixed with
10 mL of ultra-pure water. The ink preparation procedure was the same as the above
for 60 % Nafion®, 20 % carbon black and 20 % SnO. The procedure of preparing
the ink with nickel supported on gamma alumina was the same as that used with the
platinum zeolite and Nafion®. The mass of Nafion® used was 0.6133 g, the mass of
Ni gamma alumina was 0.2059 g, and the mass of Carbon black was 0.2029 g.

CHAPTER 5 ____________________________________________
158
iv) 10 % Polystyrene + 90 % Carbon black mixed in 10 ml of toluene - as in (i).
v) Ink preparation for 50 % Polystyrene solution, 25 % Carbon black and 25 % Pt
zeolite
0.5051 g of polystyrene was mixed with 20 mL of toluene to make a solution.
Typically 0.25 g of carbon black and 0.25 g of Pt zeolite (or other catalyst) were
added into the polystyrene solution to make the ink, which was used for coating the
substrates. The ink was placed in an ultrasonic bath for 1 h and then magnetically
stirred overnight. Spray coating was used to coat the substrate. About 1 mL of ink
was used to spray each of the substrates to make electrodes. A layer of ink was
sprayed, air dried and weighed. This was repeated until the required mass increase
was obtained. The electrodes were dried at room temperature overnight. Thereafter
the electrodes were tested for hydrogen generation.
5.6.3.5 Characterization
Micro and mesoporous electrocatalysts presented in this chapter were characterized
mainly by TEM as these materials were prepared using techniques that are well
known in gas phase catalysis to result in monodispersed or nanoparticles of Pt or Au.
Their application as electrocatalysts is novel. Physical-chemical and structural studies
of gas diffusion electrode materials were performed in selected cases using
techniques such as optical microscopy, PIXE, and SECM as is described in Chapters
3, 6 and 7. This chapter mainly focuses on characterization of the electrode
electrochemical characteristics tested in water electrolysis.
5.6.4. Electrochemical Testing
The electrolysis reaction in an alkaline environment is schematically shown in Figure
5.2 (a) and a schematic of two electrode cell setup for hydrogen production is shown
in Figure 5.2 (b).

CHAPTER 5 ____________________________________________
159
Auto Lab electrochemical work
station
Pt – basket counter electrode
Electrolyte (40 % KOH)
Working electrode with catalyst
Auto Lab electrochemical work
station
Pt – basket counter electrode
Electrolyte (40 % KOH)
Working electrode with catalyst
Figure 5.2 Water electrolysis in a high electrolyte environment
The activity of the electrodes was tested using a two electrode electrolytic system.
Each substrate or composite electrode prepared in the manner specified above, was
cut into an approximately 2 cm2-sized electrode. Stainless steel, corrosive free
electrode clips were attached to the electrode and the electrode was masked with
vinyl adhesive tape in order to limit the geometric surface area tested to an exactly
sized 1 cm2 of high surface area composite electrode for comparative purposes. The
electrode was suspended in 40 % potassium hydroxide (KOH). This working
electrode was then clamped with the high surface area of the electrode 1 cm away
from and facing toward the counter electrode. A large surface area circular basket Pt
AnodeCathode
4H2O
2H2 + 4OH-
4e-
2H2O
O2 + 4H+
4e-
V
AnodeAnodeCathodeCathodeCathodeCathode
4H2O4H2O
2H2 + 4OH-
4e-4e-
2H2O2H2O
O2 + 4H+
4e-4e-
VV
(b) schematic of two electrode cell setup for hydrogen production
(a) electrolysis reaction in an alkaline environment

CHAPTER 5 ____________________________________________
160
counter electrode was used. All the experiments were performed at 0 to 5 oC while
stirring magnetically after purging with N2. The temperature was controlled by
placing the cell in an ice bath and controlling the temperature with a thermometer. In
order to determine the prepared electrode’s activity for hydrogen production by water
electrolysis, electrochemical analyses was performed on each sample by use of
chrono amperometry. Each high surface area sample was subjected to an applied
potential in steps from -1 to -6 V over 60 s in which the potential was increased in
preset steps at the end of each time interval, at which time the average current was
sampled in order to determine the response of the electrodes over time. A qualitative
comparison of activity for water electrolysis was made between the electrodes. Figure
5.3 shows a schematic of the two electrode cell setup for hydrogen production. The
setup is connected to the Auto lab electro chemical station.
5.7 RESULTS AND DISCUSSION
Composite electrode preparation procedures were used and details of the outcomes of
sequential deposition and the results of characterization of electrocatalysts, electrodes
and electro-activity testing are presented in this section.
SEM micrographs of the electrocatalysts applied in this Chapter are shown in Figure
5.6 (a to e).

CHAPTER 5 ____________________________________________
161
Figure 5.3 TEM micrograph of Sb/SnO commercial nanoparticles
Figure 5.4 TEM micrograph of Pt HMS LPG carbonized
Figure 5.5 TEM micrograph of Pt MCM-41 LPG carbonized
Figure 5.6 TEM micrograph of Au HMS
Nanoparticles of Sb/SnO were used in preparation of films, as an example of
processing non-supported nanophase particulates in film format. Pt FAU, Au HMS,
Pt HMS and Pt MCM-41 were applied as examples of processing supported 3-
dimensional nanophase materials, with high surface areas and high porosity, into
electrocatalyst containing films. In the case of commercial Sb/SnO nanoparticles
(Figure 5.6 (a)) an average particle size of 27 nm was observed by TEM. For Pt HMS
(Figure 5.6 (b)) very small and well dispersed sub- nanometer Pt particles were
obtained. Well dispersed Pt nanoparticles were also obtained in the case of Pt-MCM-
41 (Figure 5.6 (c)), however, some cluster formation was visible. The difference
100nm

CHAPTER 5 ____________________________________________
162
observed could be due to the pore structure of the mesoporous matrix which differs.
HMS has a wormhole structure with pore sizes in the 2-3 nm range (Zhang, 1997)
whereas MCM-41 has a pore size between 2 and 5 nm (Grün et al., 1999; Mastalir et
al., 2008). The agglomeration of supported nanophase was more pronounced in the
case of AuHMS reduced thermaly that resulted in bimodal distribution of gold nano
particles of sizes about 5 nm (well dispersed) and 50-100 nm (large agglomerated
particles) in Figure 5.6(d). This agglomeration may be caused due to the reduction
temperature used. Average particle sizes for the Pt in Pt HMS and Pt MCM-41 were
calculated by XRD line broadening using the Scherrer equation and found to range
from 3.5 to 3.7 nm respectively.
5.7.1 Electro activity of composite electrodes: Baseline studies
The electro activity results obtained in this section represent a comparison of the
electrochemical response of the composite materials that was determined by the
current density (A cm-2) obtained at each applied potential (V) in water electrolysis
for hydrogen production, mainly in 40 % KOH electrolyte, at 0 ºC unless stated
otherwise.
Because of the three dimensional nature of the prepared composite electrodes, it is
necessary to remember that activity data presented in the results section have not
been normalized for active surface area, but are based on a geometric 1 cm2 of
composite electrode unless otherwise stated, therefore the results of rapid screening in
the high electrolyte environment are qualitative.
It is again emphasized that hydrogen production by water electrolysis in an alkaline
electrolyte environment was used as a simple and relatively rapid qualitative measure
of the electro catalytic activity of the nanophase electrocatalysts in this composite
format. Poor catalytic performance for hydrogen production was taken as a measure
of the possible occlusion of catalytic sites by binders or the lack of adequate
conductive pathways and was used as rapid indicator for optimization of formulations

CHAPTER 5 ____________________________________________
163
of micro-emulsions or inks. The expected high gas evolution under the applied
conditions was used as an accelerated aging test of the stability and durability of the
composite electrode components. Delamination of the catalytic component during
high gas evolution at the high applied potential was used as a measure of inadequate
stabilization of the electrocatalyst containing film upon the substrate.
In baseline studies, the commercial JM Pt40/C, as well as the different substrates
listed in Table 5.3 and various Ni materials were tested in the high electrolyte
environment. In the case of the commercial JM Pt40/C, ink formulations were
prepared as specified in Table 5.4.
Table 5.4 Ink formulations using JM Pt40/C catalyst
Sample name Carbon black Nafion (5%) JM Pt40/C
Sample H 0.1012 0.0305
Sample H1 0.0945 0.0346
Sample I 0.0578 0.0330
Sample I1 0.059 0.0349
Sample J 0.0135 0.0906 0.0331
In these formulations prepared in duplicate, the ink firstly consisted of only JM Pt40/C
and Nafion® (5 % ionomer soln) at different concentrations (Samples I, I1 and H, H1
respectively). In the second case Nafion® (5 % ionomer soln) and JM Pt40/C were
mixed with carbon black (sample J).
These mixtures were spraycoated on a carbon cloth substrate (b) as specified in Table
5.3 and dried. Excessive catalyst loading in a film may have the effect of lowering of
the conductive particle volume fraction below the percolatory threshold. However, as
the commercial Pt catalyst is supported on carbon it is unlikely that this would be the
case. Nevertheless, the carbon black was added in the ink applied in Sample J to
verify if it would make a contribution to the electro activity of the electrocatalyst
containing film.

CHAPTER 5 ____________________________________________
164
0
0.1
0.2
0.3
0.4
0.5
0.6
0.7
0.8
0.5 1 1.5 2 2.5 3
Poterntial (V)
Cur
rent
den
sity
(A/c
m2)
Sample H1
Sample I1
Sample H
Sample J
Blank substrate, at room temp
Sample H1 70degC
Figure 5.7 Baseline study of composite electrodes prepared with commercial JM Pt40/C catalyst*
*40% KOH electrolyte environment at RT or 70ºC and applied potential between -1 and -3V
PLEASE NOTE that although negative potentials were applied, the results are
presented on a positive axis for ease of reference in most figures presented in this
chapter.
Fairly good and reproducible current densities of over 0.5 A cm-2 were obtained at -3
V at room temperature with the electrocatalyst containing film composite electrodes
prepared with the commercial catalyst, compared to the blank substrate (Figure 5.7).
Activation was observed below an applied potential of -2 V. Increasing the
temperature (70 ºC) gave a higher current density as expected for composite sample
H1 to 0.7 A cm-1 at -3 V. The electronic conduction may have been assisted by the
other components in the composite electrode such as the carbon support, but the
effect of the Nafion® binder and carbon black conductive additive was apparently
minimal, even though the binder content was nearly halved in the formulation used
for samples I and I1, and a significant amount of carbon black was added to the
formulation used in Sample J.
Prior to deposition of electrocatalyst containing films of ink composed of binder,
conductive phase and electrocatalyst, the various substrates (Table 5.3) that were
used as gas diffusion electrode support substrates were tested for their

CHAPTER 5 ____________________________________________
165
electrochemical response during chronovoltammetry of an applied voltage between -1
and -6 V for water electrolysis in a 40 % KOH high electrolyte environment at 0 ºC
(Figures 5.8). The lower temperature was applied in the following experiments
because of the high outputs anticipated and because of the limitation of the
electrochemical workstation of 1 A output, as well as to avoid any fluctuations in
room temperature that could affect results and because of the difficulty of
maintaining the electrolyte concentration at raised temperatures. Results at the lower
temperature of 0 ºC are thus expected to be lower than in the baseline study with
commercial JMPt40/C which was obtained at room temperature or 70 ºC. The baseline
testing was performed to understand the suitability of various commercial substrates.
It was taken into account that electrochemically active substrates could cause
delamination of the catalytic ink in film form, because of gas evolution on the
underlying substrate, hence high electrochemical response was an indicator of
potential unsuitability of that substrate as film support.
Commercial Ni metal foil and several commercial Ni foam samples were also tested
under identical conditions as the selected substrates between an applied potential of -
1 and -6 V in order to provide a comparison of activity of commercial substrates with
the selected support substrates and composite electrode materials to be tested.
Comparison of electrochemical activity of various types of Ni materials used is
shown in Figure 5.9.
Figure 5.8 Electrochemical activity of blank supports b-g *
Figure 5.9 Electrochemical activity of various types of Ni metal foam*
*40% KOH electrolyte environment at 0ºC and applied potential between -1 and -6 V
-0 .2
0
0.2
0 .4
0 .6
0 .8
1
1.2
1 .4
1 2 3 4 5 6Po te n t ia l (V )
Cu
rre
nt
de
ns
ity
(A/c
m2)
Ni f o il
Ni ty pe A
Ni ty pe B
NI ty pe C
-0 .1
0 .1
0 .3
0 .5
0 .7
0 .9
1 .1
1 .3
1 2 3 4 5 6
P o te n t ia l (V )
Cu
rre
nt
de
ns
ity
(A/c
m2)
b
c
d
e
g

CHAPTER 5 ____________________________________________
166
The results determined above a current density of 1 A are inaccurate due to
limitations of the electrochemical workstation. None of the substrates that were tested
showed activation below an applied potential of -2 V (Figure 5.8). The slight
electrochemical response observed for non-conductive substrates e and g, ceramic
paper and Teflon (PTFE) respectively, gives an approximate measure of the electrical
contribution of electrode contacts and metallic clips for lead attachments in contact
with the electrolyte. Since this was a negligible amount even at high current densities
this contribution was not further taken into account. Substrate d (Creavis; ZrO2 on
stainless steel mesh) showed a strong electrochemical response (Figure 5.8) above an
applied potential of -2 V, increasing to a current density of more than 1A cm-2 at -5
V, similar to Ni foil and two of the three Ni foams (Racemat) that were tested (Figure
5.9), and was thus likely to be unsuitable as substrate for supporting a stable thin film
because of its intrinsic high activity for the hydrogen evolution reaction (HER) at
higher applied potential.
The substrates (Figure 5.8) and different Ni metal samples (Figure 5.9) themselves
showed no activation below an applied potential of -2 V but some of the Ni metal
foam samples were generally capable of high current densities at an applied potential
of -5 to -6 V. Although Ni foam samples have highly enhanced surface areas, the
surface integrity of the metal foam bubbles prevented access of the electrolyte to the
interior surfaces of the foam structure, thus these materials proved not to be much
more active than Ni foil by itself under the applied conditions.
The rate at which hydrogen ions are transformed into hydrogen gas is a function of
the rate of electron transfer from a metal to hydrogen ions and as there is a wide
variability in this transfer rate of electrons by various metals, the rate of hydrogen
evolution from different metal surfaces can vary greatly (Tafel, 1905). In the case of
the Ni electrodes, it should be considered that the exchange current density (j0) of Ni
is orders of magnitude higher than that of Pt. As there was no reference electrode

CHAPTER 5 ____________________________________________
167
used relative to the NHE in this rapid screening system, it is thus not possible to
directly compare the activity towards HER of different metals and substrate types.
Studies by Kuch et al. (1993) showed that water adsorbs without dissociation upon a
pure Ni single crystal surface whereas when oxygen is present above about 0.33
monolayers, NiO islands are formed which grow laterally into a closed epitaxial NiO-
layer. When the oxygen coverage is large enough for NiO islands to be formed, a part
of the water adsorbs dissociatively (OH+H). With the growth of NiO-islands, the
amount of dissociated water increases (Kuch et al. 1993; 1994). The differences
observed in the activity of the Ni substrates could thus be due to differences in the
oxide coverage on the Ni Type A substrate surface compared to the other Ni electrode
samples affecting the rate of dissociation of water.
5.7.2 Electro activity of composite electrodes: Effect of Supporting Procedures
5.7.2.1 Dip coating and sponge coating
The six different substrates (a-f) were dip coated with the ink mixture or the ink was
sponged upon each respective substrate. The samples were then weighed to obtain the
total mass % increase as is shown in Table 5.5.
Table 5.5. Mass % increase of dip coated and sponge coated substrates
Support type
Dip coated (N/ CB)
Sponge coated (N/CB)
Dip coated (N/CB/SnO)
Sponge coated (N/CB/SnO)
a 42.0 % 35.99 % 69.23 % 60.60 % b 28.26 % 14.36 % 54 % 59.4 % c 33.55 % 34.55 % 67.52 % 70.33 % d 2.55 % 1.66 % 6.64 % 7.22 % e 2.75 % 0.3 % 6.43 % 5.79 % f 13.43 % 9.06 % 30.08 % 22.88 %

CHAPTER 5 ____________________________________________
168
As the variable mass % increase results tabulated above show, neither dip coating nor
sponge coating allowed for reproducible preparation of uniform composites, although
the effect of the support surface interaction with the ink is apparent in the % loading
obtained. Support e (Ceramic paper: Lydall Technical Papers: Sample: 3000LF) was
least prone to accept deposition of an electrocatalyst containing film whereas the
different carbon cloths (a, b and c) allowed relatively high loadings of ink to be
obtained. The substrate f (Ceramic paper 40 % glass) showed an intermediate uptake.
Significantly higher loadings were obtained in all cases where the particulate
nanophase Sb/SnO was added, showing the significant effect of the viscosity of the
ink, due to a higher percentage of solid particulates, on the degree of loading
obtainable by these two methods.
The different electrodes made using various substrates were tested for activity for
hydrogen production and results for dip coating and sponge coating are shown in
Figures 5.10 and 5.11 respectively.
Figure 5.10. Composite electrodes prepared by dipcoating various substrates in Nafion®/CB or Nafion®/CB/SbSnO mixtures*.
Figure 5.11. Composite electrodes prepared by sponge coating various substrates in Nafion®/CB or Nafion®/CB/SbSnO mixtures*.
*40% KOH electrolyte environment at 0ºC and applied potential between -1 and -6 V
Almost all these combinations showed some activation below -2 V. Relatively high
current densities were obtained for several combinations of support, binder, catalyst
and conductive phase using dip coating and sponge coating as ink deposition method,
and a current density of <0.2 mA cm-2 was also observed below -2 V for most of
these combinations, unlike in the case of the Ni foils and substrates, where no current
0
0.2
0.4
0.6
0.8
1
1.2
1.4
1 2 3 4 5 6Potential (V)
Cur
rent
den
sity
(A/c
m2)
d/N/CB
d/N/CB &SnO
b/N/CB&SnO
b/N/CB
c/N/CB
c/N/CB&SnO
0
0.2
0.4
0.6
0.8
1
1 2 3 4 5 6Po te n t ial (V )
Cu
rre
nt
de
ns
ity
(A/c
m2)
c /N/CB & SnO f /N//CBc /N/CB b/N/CB a/N/CB a/N/CB & SnO b/N/CB&SnO e/N/CB&SnO

CHAPTER 5 ____________________________________________
169
output was observed below -2 V. In some cases the additional electrocatalyst
containing film reduced the activity of the substrate itself at high potentials (e.g.
substrate d). Results for electrochemical activity were combination specific and
showed that addition of the commercial nanophase Sb/SnO may have enhanced the
observed activity in some combinations (c/N/CB&SnO and a/N/CB & SnO) or
increased the current density at lower voltages (d/N/CB &SnO). Moreover, the
conductive substrates (b, c and d) used as supports had a considerable effect upon the
activity observed. Although low loadings were deposited by spongecoating on
substrate d, combination d/N/CB & SnO showed the highest current density at -2 V.
It was interesting that activity could be enhanced in several cases by merely
enhancing the substrate surface area with the application of conductive carbon
suspended in a binder even in the case where the substrate was non-conductive
(f/N/CB). The fact that electrodes were able to withstand the very high degree of gas
evolution at the applied potential of -6 V showed that even under these aggressively
accelerated testing conditions the inks made with Nafion® as binder were stable and
relatively durable. Neither dip coating nor sponge coating was pursued as suitable
ink deposition method because of the lack of reproducibility. Although these results
are merely qualitative, they indicated that the observed activity for water electrolysis
of such composites electrodes could be affected by the presence of the additional
conductive phase such as carbon, the additional nanophase, the degree of loading and
by the substrate used.
5.7.2.2 Casting method
A casting procedure was used. The materials are tabulated in Tables 5.6 and 5.7 and a
summarized outcome of the integrity of the composite made by each preparation
method is added as a comment where necessary, in tabular form.

CHAPTER 5 ____________________________________________
170
Table 5.6. Casting method using ink with 10 % Polystyrene binder (B) + 90 % Carbon black in 10 mL of toluene as solvent on various supports. Sample no.
Support type
Support mass
Binder B mass (g)
Carbon Black (g) Comments
a/B/CB a 0.0226 0.1064 0.9084 Composite samples were completely cracked when dried thus were not tested.
b/B/CB b 0.0333 0.1064 0.9084 c/B/CB c 0.0212 0.1064 0.9084 d/B/CB d 0.1005 0.1064 0.9084 e/B/CB e 0.1038 0.1064 0.9084 f/B/CB f 0.0857 0.1064 0.9084 Table 5.7 Casting method using ink with 50% Polystyrene binder (B) + 25% Carbon Black + 25% SbSnO with solvent toluene (20 mL) on various supports.
Sample no. Support type
Support mass
Binder B (g)
Carbon Black (g)
Sb/SnO (g) Comments
a/B/CB &SnO a 0.0234 1.0141 0.5007 0.5003 Ink deposited smoothly b/B/CB &SnO b 0.0359 1.0141 0.5007 0.5003 Ink deposited smoothly c/B/CB &SnO c 0.0207 1.0141 0.5007 0.5003 Ink deposited smoothly d/B/CB &SnO d 0.0965 1.0141 0.5007 0.5003 Ink cracked when dry e/B/CB &SnO e 0.1081 1.0141 0.5007 0.5003 Ink deposited smoothly f/B/CB &SnO f 0.0887 1.0141 0.5007 0.5003 Ink cracked when dry
Electrodes prepared by the casting technique were evaluated for electrochemical
activity in water electrolysis in the two electrode set up at 0-5 ºC in 40% KOH and
results of the current densities achieved at the applied voltages between -1 and -6 V
are shown in Figures 5.12 and 5.13.
0
0.2
0.4
0.6
0.8
1
1 2 3 4 5 6Po te n t ia l (V )
Cu
rre
nt
de
ns
ity
(A/c
m2)
a/B/CB
b/B/CB
c /B/CB
d/B/ CB
e/B/CB
-0.01
0.01
0.03
0.05
0.07
0.09
0.11
0.13
0.15
1 2 3 4 5 6Pote ntia l (V )
Cur
rent
den
sity
(A/c
m2) a/B/CB&SnO
c /B/CB &SnO
e/B/CB &SnO
Figure 5.12 Composites cast with 50 % Polystyrene binder, 50 % carbon black in toluene upon different support types*
Figure 5.13 Composites cast with 50 % Polystyrene binder, 25 % Sb/SnO 25 % carbon black in toluene: supports a,c&e*
*40% KOH electrolyte environment at 0ºC and applied potential between -1 and -6 V
Composites cast with 50 % Polyvinylacetate binder and 50 % carbon black in acetone
on three support types were also prepared (results not shown) and showed

CHAPTER 5 ____________________________________________
171
intermediate activity compared to that of the polystyrene binder and carbon black
combination. The effect of the conductive substrate could be distinguished in the
activity observed at higher applied voltages. None of these electrodes showed
activation below -2 V. Higher current densities were observed at high applied
potential particularly for cast electrodes prepared using substrate a, (Carbon black on
carbon cloth (code 6100-200 CB) supplier Lydall) with polystyrene as binder and
carbon black as conductive phase without additional catalyst. Low current density
was observed for cast electrodes prepared with inks, in cases where additional
Sb/SnO catalyst was added, indicating high resistance with excessive loading of the
particulate oxide and the probable lowering of the conductive particle volume
fraction below the percolatory threshold. The layers deposited upon the electrodes by
casting were stable at high applied potentials. Crack formation was observed when
the electrodes prepared by casting were completely dry. It was concluded that crack
formation could be caused by the different coefficients of expansion between the
layers of the catalyst/binder and support resulting because too thick a film was
deposited upon the substrate and excessive shrinkage occurred during drying when
using the casting method, therefore hot pressing and spray coating methods were
investigated.
5.7.2.3 Hot pressing preparation technique
A hot pressing method was used to hot press various combinations of conductive
phase, binder and catalyst onto two different support types (e and g). Details of
preparation procedures and outcomes are tabulated in Tables 5.8, 5.9 and 5.10.
Table 5.8 Hot pressing method with 50 % PTFE binder (C) + 50 % Carbon Black as conductive phase upon a ceramic based (e) support.
Substrate Temp (°C)
Pressure (bars)
Time (min)
Carbon black
Binder C Comments
(e) 150-160 5 5 50 % 50 % Mixture adhered/support broke 150-160 0 6 50 % 50 % Mixture adhered/support broke 150-160 0 10 50 % 50 % Mixture adhered/support broke 150-160 20 2 50 % 50 % Support broke completely 150-160 10 2 50 % 50 % Support broke completely 150-160 5 2 50 % 50 % Mixture adhered/support broke

CHAPTER 5 ____________________________________________
172
Table 5.9 Hot pressing method with 50 % PTFE (C) binder + 50 % Carbon Black as conductive phase upon a Teflon based (g) support
Substrate Temp (°C)
Pressure (bars)
Time (min)
Carbon black
Binder C Comments
Teflon (g) 130 10 2 100 % - Carbon black adhered to support 130 10 2 50 % 50 % Mixture adhered to support 150 12.5 2 100 % - Carbon black adhered to support 150 12.5 2 50 % 50 % Mixture adhered to support
Table 5.10 Hot pressing at elevated temperature with 50 % PTFE (C) + 50% Carbon Black as conductive phase upon a Teflon support (g)
Substrate Temp °C
Pressure (bars)
Time (mins)
Carbon black
Binder C Comments
Teflon (g) 165-170 20 2 50 % 50 % Mixture adhered to the support in all cases
175-180 21 2 50 % 50 % 175-180 30 2 50 % 50 % 175-180 40 3 50 % 50 %
Table 5.11 Hot pressing at elevated temperature with 50 % PTFE, 25 % C/ black and 25 % Sb/SnO nanophase catalyst on a Teflon support (g).
Substrate Temp (°C) Pressure (bars) Time
Conductive phase Binder Catalyst Comments
Teflon (g) 170-180 40 3 Carbon Black PTFE Sb/SnO
Mixture adhered to the support in all cases 180-185 41 3
Carbon Black PTFE Sb/SnO
The current density obtained in water electrolysis for these composite materials
hotpressed with PTFE is shown in Figure 5.14.

CHAPTER 5 ____________________________________________
173
0
0 .0 2
0 .0 4
0 .0 6
0 .0 8
0 .1
1 2 3 4 5 6P o t e n t ia l ( V )
Cu
rre
nt
de
ns
ity
(A/c
m2)
g /C/CB & S n O a t 1 7 5 - 1 8 0 °C,4 0 b a r , 3 m in
g /C /CB & S n O , 1 7 0 - 1 8 0 °C, 4 0 b a r ,3 min
g /C /CB & S n O a t 1 7 5 - 1 8 0 °C,4 0 b a r , 3 m in
g /C /CB
g /C/CB & S n O 1 7 5 °C, 4 0 b a r , 3 m in
g /C /CB 1 7 5 °C, 2 1 b a r , 2 m in
g /C /CB 1 3 0 °C, 1 0 b a r , 2 m in
g /C /CB 1 3 0 °C, 1 0 b a r , 2 m in
Figure 5.14 Comparison of electrochemical activity by hot pressing PTFE, carbon black and Sb/SnO on support (g)* *40% KOH electrolyte environment at 0ºC and applied potential between -1 and -6 V
Adhesion of powdered PTFE to support e was poor, probably due to mutual repulsion
between the materials used. Adhesion of admixtures containing PTFE on support g
(Teflon sheet) was successful by the hot pressing technique. Current densities of
materials prepared by the hot pressing technique were very low (mainly due to the
non-conducting nature of the Teflon support and PTFE binder). However, the effect
of various pressing techniques and different combinations of composite ingredients
could be discerned (Figure 5.14). Moreover, activation below -2 V became apparent
for combinations containing Sb/SnO nanoparticles. Problems such as insulating
interphases, and suppression of interphase reactivity may have arisen, as each new
material introduced into a composite may introduce its own set of interface problems.
Hot pressing was not a suitable technique for application on the other supports (a-c
and f) investigated as these materials lost their integrity during hot pressing. Further
development of the hot pressing technique upon more appropriate supports with
optimized pressures and temperatures may yet prove to result in highly stable, easily
prepared composite electrodes.

CHAPTER 5 ____________________________________________
174
5.7.2.4 Spraycoating method
A spraycoating method with Nafion® (5 % in water) used as binder with conductive
phase of carbon black was spraycoated on various supports (Table 5.12).
Table 5.12 Spraycoating method with 60 % Nafion® (5 % in water) binder (N)+ 40 % Carbon Black on various supports.
Sample no. Support
Binder N
Carbon black
Mass of support (g) (before )
Mass after spraying (g)
Mass % increase
Loading (g cm-2)
J-26 a 60 % 40 % 0.0236 0.0371 36.4 0.0135 J-27 b 60 % 40 % 0.0347 0.0455 23.7 0.0108 J-28 c 60 % 40 % 0.0213 0.0331 35.6 0.0118 J-29 d 60 % 40 % 0.1015 0.1054 3.7 0.0039 J-30 e 60 % 40 % 0.0631 0.0690 8.5 0.0059 J-31 f 60 % 40 % 0.0856 0.0943 8.4 0.0087
A noticeable difference in loading was obtained between the electrodes prepared
using Lydall carbon cloth substrates (a-c) and the other substrates tested, with the
lowest loading obtained on substrate d, which also resulted in the most active
composite electrodes (Figure 5.15). In all cases it was however difficult to get exactly
similar, reproducible loadings.
0
0.2
0.4
0.6
0.8
1
1.2
1.4
1 2 3 4 5 6Potential (V)
Cur
rent
den
sity
(A/c
m2)
J26
J27
J28
J29
J30
J31
Figure 5.15 Electrochemical activity of composites formed with Nafion® binder and carbon black spraycoated on supports a-f, without additional catalyst
*40% KOH electrolyte environment at 0ºC and applied potential between -1 and -6 V

CHAPTER 5 ____________________________________________
175
The composite electrodes formed with Nafion® binder and carbon black spraycoated
on supports a-f, without additional catalyst showed relatively high current densities
for the applied potential and the activity observed was highly substrate dependant. It
was noticeable that sample J-29 made using substrate d, the ZrO2 backed with
stainless steel substrate from Creavis was highly active and even so maintained the
integrity of the film containing carbon black well during high applied potentials. The
size of the evolving H2 gas bubbles was significantly different between the different
substrate samples, with the finest bubbles being observed on this substrate (d). The
effective discharge of such minute gas bubbles from the ZrO2 coated electrode
surfaces probably resulted from lower surface adhesion/tension between electrode
surfaces and the smallest bubbles. This may have also contributed significantly to the
observed high activity of this substrate and the electrodes made with it. The ceramic
paper based composite electrodes (e and f) performed very poorly overall, whereas
the samples prepared on carbon cloth substrates (J-26, J-27 and J-28) showed an
intermediate performance slightly better than the substrates only (Figure 5.8).
Various electrodes were then prepared by spraycoating inks containing different
components, namely: (i) 60 % Nafion® (5 % in water) binder with 20 % Carbon
Black and 20 % SbSnO (ii) 60 % Nafion® (5 % in water) binder with 20 % Carbon
Black and 20 % Pt –FAU zeolite, and (iii) 60 % Nafion® (5 % in water) binder with
20 % Carbon Black and 20 % Ni-gamma – alumina on various supports (Table 5.13,
5.14 and 5.15).
Table 5.13 Spraycoating with 60 % Nafion® (5 % in water) binder (N) + 20 % Carbon Black + 20 % SbSnO on various supports.
Sample no. Support Binder NCarbon
black
Active catalyst Sb/SnO
Mass of support (g)
Mass after spraying (g)
Mass % increase
Loading (g cm-2)
J-32 a 60 % 20 % 20 % 0.0241 0.0445 45.8 0.0204 J-33 b 60 % 20 % 20 % 0.0336 0.0462 27.3 0.0126 J-34 c 60 % 20 % 20 % 0.0218 0.0357 38.9 0.0139 J-35 d 60 % 20 % 20 % 0.0976 0.1016 3.9 0.0040 J-36 e 60 % 20 % 20 % 0.0633 0.0689 8.13 0.0056 J-37 f 60 % 20 % 20 % 0.0841 0.0901 6.66 0.0060

CHAPTER 5 ____________________________________________
176
Table 5.14 Spraycoating with 60 % Nafion® (5 % in water) binder (N) + 20 % Carbon Black + 20 % Pt –FAU zeolite on various supports.
Sample no. Support Binder
N Carbon black
Active catalyst Pt –FAU zeolite
Mass of support (g)
Mass after spraying (g)
Mass % increase
Loading (g cm-2)
J-38 a 60 % 20 % 20 % 0.0234 0.0452 48.2 0.0218 J-39 b 60 % 20 % 20 % 0.0338 0.0633 46.6 0.0295 J-40 c 60 % 20 % 20 % 0.0214 0.0397 46.1 0.0183 J-41 d 60 % 20 % 20 % 0.1005 0.1050 4.3 0.0045 J-42 e 60 % 20 % 20 % 0.0637 0.0704 9.5 0.0067 J-43 f 60 % 20 % 20 % 0.0859 0.1026 16.3 0.0167 Table 5.15. Spraycoating method with 60 % Nafion® (5 % in water) binder (N) + 20 % Carbon Black + 20 % Ni-gamma – alumina on various supports.
Sample no. Support Binder
N Carbon black
Active catalyst Ni -alumina
Mass of support (g)
Mass after spraying (g)
Mass % increase
Loading (g cm-2)
JA-50 a 60 % 20 % 20 % 0.0235 0.0379 38 0.0144 JA-51 b 60 % 20 % 20 % 0.0351 0.0518 32.2 0.0167 JA-52 c 60 % 20 % 20 % 0.0203 0.0406 50 0.0203 JA-53 d 60 % 20 % 20 % 0.0981 0.1003 2.2 0.0022 JA-54 e 60 % 20 % 20 % 0.1089 0.1160 6.12 0.0071 JA-55 f 60 % 20 % 20 % 0.0849 0.1010 15.9 0.0161
It was once again noticeable that variable and non-reproducible loadings were
obtained that were related to the substrate type used, with substrate d always taking
up the least, and the carbon cloths the most catalytic ink. The current densities
obtained in electrochemical activity for water electrolysis in the case of the various
electrodes prepared by the spray coating technique using combinations tabulated in
Tables 5.13, 5.14 and 5.15 are shown in the following figures (Figures 5.16-5.21),
where electrodes prepared using the same substrate but with different ink
compositions containing various supported or particulate electrocatalyst, namely Pt
FAU, Ni-Alumina or SbSnO, are compared with the composites composed of
substrate, carbon black and binder only, as detailed in Table 5.12 above. Once again
the current density obtained was highly substrate dependent with support d
composites being most active at high applied potentials.

CHAPTER 5 ____________________________________________
177
The films were mostly stable at the applied potentials and high H2 evolution
conditions, thus Nafion® solution acts as a suitable binder. Samples supported on
carbon cloth substrates showed activation at <-2 V. Of these composite electrodes,
the highest current density of over 1 A at a potential of -5 V was obtained in the case
of an electrode sample (J-41) prepared with nanophase Pt-FAU spraycoated with
Nafion® and carbon black upon support type d (Figure 5.19). The electrocatalyst
containing film samples containing Pt-FAU or nanophase SbSnO generally
performed better than the Ni-alumina containing samples. In several cases, relatively
high current densities were obtained with enhanced surface area electrodes prepared
by spraycoating with only binder and carbon black conductive phase on various
substrates as was previously noted.
0
0.2
0.4
0.6
0.8
1
1 2 3 4 5 6Potential (V)
Cu
rre
nt
de
ns
ity
(A/c
m2)
J26 no catalyst
J32 SnO
J38 Pt-FAU
J50 Ni-alumina
0
0.2
0.4
0.6
0.8
1
1 2 3 4 5 6Potential (V)
Cur
rent
den
sity
(A/c
m2)
J27 no catalyst
J33 SnO
J39 Pt-FAU
J51 Ni-alumina
Figure 5.16 Composite electrodes spraycoated with Nafion® binder, carbon black and either nanophase Sb/SnO, Ni-alumina or Pt-FAU upon on carbon based support (a).
Figure 5.17 Composite electrodes spraycoated with Nafion® binder, carbon black, and either Nanophase Sb/SnO, Ni-alumina or Pt-FAU on carbon cloth support (b).
0
0.2
0.4
0.6
0.8
1
1 2 3 4 5 6Potential (V)
Cur
rent
den
sity
(A/c
m2)
J28 no catalyst
J34 SnO
J49 Pt-FAU
J52 Ni-alumina
-0.2
0
0.2
0.4
0.6
0.8
1
1.2
1.4
1 2 3 4 5 6
Potential (V)
Cur
rent
den
sity
(A/c
m2)
J29 no catalyst
J35 SnO
J41 Pt-FAU
J53 Ni-alumina
Figure 5.18 Composite electrodes spraycoated with Nafion® binder, carbon black, and Nanophase Sb/SnO, Ni-alumina or Pt-FAU on carbon cloth support (c).
Figure 5.19 Composite electrodes spraycoated with Nafion® binder, carbon black, and Nanophase Sb/SnO, Ni-alumina or Pt-FAU on ZrO2/SS support (d).

CHAPTER 5 ____________________________________________
178
0
0.0005
0.001
0.0015
0.002
0.0025
1 2 3 4 5 6Potential (V)
Cur
rent
den
sity
(A/c
m2)
J30 no catalyst
J36 SnO
J42 Pt-FAU
J54 Ni-alumina
0
0.05
0.1
0.15
0.2
0.25
0.3
1 2 3 4 5 6Potential (V)
Cur
rent
den
sity
(A/c
m2)
J 31 no catalyst
J37 SnO
J43 Pt-FAU
J55 Ni-alumina
Figure 5.20 Comparison of activity of nanophase composites spraycoated with Nafion® binder and carbon black and Sb/SnO, Ni-alumina or Pt-FAU upon on ceramic support (e).
Figure 5.21 Comparison of activity of nanophase composites spraycoated with Nafion® binder and carbon black and Sb/SnO, Ni-alumina or Pt-FAU upon on ceramic support (f).
*40% KOH electrolyte environment at 0ºC and applied potential between -1 and -6 V
Delamination of some electrodes was observed as can be seen in the case of sample
JA 32 in Figure 5.16 that was supported on substrate a. However, most electrodes
were stable at the very high potential applied in these accelerated aging tests
performed at 0 ºC in 40 % KOH. The electrochemical workstation used had a current
maximum of 1.2 Amp thus the curve flattening observed is an artifact of the
measuring system.
It was not possible to accurately characterize the film containing the electrocatalyst
by itself in this system because of the extraneous variables that complicated the
accurate measurements of the activity of the electrocatalyst containing film and
distinct trends for the different electrocatalyst were not clearly discernable, except
that Sb/SnO containing films performed generally better than Ni-alumina containing
composites regardless of substrate type in this series. A system to accurately
characterize only the electrocatalyst containing films is required and this will form
the topic of Chapter 6.
Composite electrodes were also prepared by spraycoating various substrates with an
ink formulation containing 50 % Polystyrene binder, 25 % Carbon Black and 25 %
Pt-FAU in toluene as solvent (Table 5.16).

CHAPTER 5 ____________________________________________
179
Table 5.16. Spraycoating with 50 % Polystyrene binder (B) + 25 % Carbon Black and 25 % Pt-FAU in toluene on various supports.
Sample no. Support Binder
B Carbon black
Active catalyst Pt –FAU zeolite
Mass of support(g)
Mass after spraying (g)
Mass % increase
Loading (g cm-2)
JA-44 a 50 % 25 % 25 % 0.0223 0.1390 84 0.1167 JA-45 b 50 % 25 % 25 % 0.0331 0.1052 68.5 0.0721 JA-46 c 50 % 25 % 25 % 0.0222 0.0848 73.8 0.0626 JA-47 d 50 % 25 % 25 % 0.1034 0.1321 21.7 0.0287 JA-48 e 50 % 25 % 25 % 0.0711 0.1548 54 0.0837 JA-49 f 50 % 25 % 25 % 0.0934 0.1442 35.2 0.0508
The current density obtained for composite electrodes using Polystyrene as binder in
toluene with Carbon Black and Pt-FAU on various supports is shown in Figure 5.22.
0
0.05
0.1
0.15
0.2
0.25
0.3
1 2 3 4 5 6Potential (V)
Cur
rent
den
sity
(A/c
m2)
J44 (a)
J45 (b)
J46 (c )
J 47(d)
J48 (e)
J49 (f)
Figure 5.22 Composites spraycoated with 50 % Polystyrene binder, 25 % Pt FAU and 25 % carbon black in toluene on different supports
*40% KOH electrolyte environment at 0ºC and applied potential between -1 and -6 V
Use of the polystyrene binder reduced the electro activity of composite electrodes
significantly and these results show the effect of an insulating binder replacing the
proton conducting Nafion® binder. Nevertheless, the carbon cloth based composite
electrodes performed overall better than the other substrates when polystyrene was
used as binder. The substrate d was remarkably deactivated by the polystyrene
containing film deposited. The effect could be due to excessive passivation of the
catalytic components on the electrode surface by too high a ratio of the binder phase
used.
5.7.2.5 Pt and Au supported on mesoporous HMS and MCM 41 materials

CHAPTER 5 ____________________________________________
180
Finally a comparison was made of the activity of various nanophase catalysts
supported on mesoporous substrates (HMS and MCM 41). The nanophase catalyst
was supported on Carbon cloth, (Thickness: 500mm, 6100-300 (support b)).
Conditions were the same as for previous chronovoltametric tests at 0 ºC in 40 %
KOH and each sample was subjected to potential steps between -1.0 to -6.0 V over 60
s. The ink formulations (approx. 60% Nafion, 20 % Carbon black & 20 % nanophase
catalyst) for preparation of films containing electrocatalyst (Pt and Au supported on
mesoporous HMS and MCM 41 materials) on Carbon cloth, Thickness: 500mm,
6100-300 (support b) are presented in Table 5.17 and results of electrochemical
testing in Figure 5.23.
Table 5.17 Ink formulation for preparation of films containing electrocatalyst (Pt and Au supported on mesoporous HMS and MCM 41 materials) Sample no. Nafion 5 % (g) Carbon black (g) Catalyst (g) Nafion and carbon black 0.6473 0.4040 nil Pt HMS carbonized 0.1127 0.0309 0.0306 Pt MCM carbonized 0.1110 0.0306 0.0301 Au HMS 0.1224 0.0325 0.0351
Figure 5.23 shows the electro activity of composite electrodes spraycoated with
Nafion® binder, carbon black, and either Au-HMS, Pt MCM or Pt HMS supported
nanophases on carbon cloth support (b).
0
0.2
0.4
0.6
0.8
1
1.2
1.4
1 2 3 4 5 6
Potential (V)
Cur
rent
den
sity
(A/c
m2)
Au HMS
Pt MCM carbonized
Pt HMS carbonized
Nafion Carbon black
Blank carbon cloth
Figure 5.23 Composite electrodes spraycoated with Nafion® binder, carbon black, and either Au-HMS, Pt MCM or Pt HMS supported nanophases on carbon cloth support (b)*
*40% KOH electrolyte environment at 0ºC and applied potential between -1 and -6 V

CHAPTER 5 ____________________________________________
181
The composite electrode prepared with HMS Au containing gold nanoparticles as
catalyst showed a high current density of nearly 1.2 A at -6 V (and >0.3 A at -3 V) at
0 ºC and generally the nanophase electrocatalyst enhanced the current density
compared to the combinations tested without catalyst under the same conditions.
These results at 0 ºC show the positive effect that addition of a nanophase metal had
upon the electrochemical activity of the composite electrode even when the
electroactive metal was supported on an insulating Si mesoporous matrix. Since these
composite electrodes were tested at 0 ºC they are thus considerably more active than
the composites prepared using the commercial JM Pt40/C presented in the baseline
study, which were tested at room temperature (25 ºC).
A higher temperature (60 ºC) was finally applied in the high electrolyte environment
for water electrolysis and the inks containing the best performing particulate
nanophases (Sb/SnO) or nanophases supported on mesoporous materials (Pt HMS)
were applied directly to a fine stainless steel mesh as substrate and tested for their
electro activity at low applied potentials as are shown in Figures 5.24 and 5.25. In this
case the actual negative axis is presented in the figures.
Figure 5.24 Electroactivity of Pt on HMS (Conditions: 60 °C; 40 % KOH)
Figure 5.25 Electroactivity of Nanophase Sb/SnO2 (Conditions: 60 °C; 40 % KOH)
Under the applied conditions of 60 °C, the composite nanophase coated electrodes
were stable and gave a high current density of between 550 and 750 mA at -2 V,
whereas the JM Pt40/C produced only 320 mA at -2 V and 70 ºC. The films
Pt Counter electrode
0
0.1
0.2
0.3
0.4
0.5
0.6
0.7
0.8
-2 -1.9 -1.8 -1.7 -1.6 -1.5Potential (V)
Cur
rent
den
sity
(A
/cm
2)
NanoSnOSS Blank supportSS Blank+CB+Nafion
Ni SS counter electrode
0
0.1
0.2
0.3
0.4
0.5
0.6
-2 -1.9 -1.8 -1.7 -1.6 -1.5Potential (V)
Cur
rent
den
sity
(A
/cm
2)
Pt HMS MFSS Blank+CB+Nafion SS Blank support

CHAPTER 5 ____________________________________________
182
containing the Pt HMS nanophase or Sb/SnO particulates significantly enhanced the
current density and thus the hydrogen production rate.
This result was further confirmed using several differently reduced (methanol
formaldehyde, or sodium hypophosphite) and carbonized Pt HMS electrocatalyst
samples as is shown in Figure 5.25. The results are compared with the output
achieved in the baseline study with the commercial HiSpec JM Pt40/C catalyst at -2 V
and 70 ºC in 40 % KOH.
0
0.1
0.2
0.3
0.4
0.5
0.6
0.7
1.5 1.6 1.7 1.8 1.9 2
Applie d Potential (V)
Cu
rren
t den
sity
(A/c
m2 HMS Pt, carbonized
HMS Pt, Methanol formaldehyde reduct ion/carbonizedHMS Pt, Na-hypophosphate reduction/carbonizedJM Pt/C
Figure 5.26 Replication study of Pt HMS containing composite electrodes
Nanophase electro active metals (Pt, Au) supported upon mesoporous supports HMS
and MCM-41 generally showed higher electro activity for H2 production than when
supported upon microporous Si support zeolite FAU (see also Petrik, 2003). Use of
different zeolite types to immobilize and support monodisperse Pt or nanoparticulate
Pt clusters is well known prior “art”. The nature of the zeolite, namely its framework
structure, shape selectivity resulting from size exclusion, acidity and pore size has
been previously shown (Petrik, 2003) to affect the electro activity of supported Pt
clusters in zeolites, with pores in the Ångstrom dimensions (FAU has pores of 7.5 Å).
The more open pore of the mesoporous materials HMS and MCM-41 with pores
between 2-4 nm, thus could have promoted the ingress of the reactant water and the
product H2 leading to the enhancement of electrocatalytic activity observed in this
CHAPTER 5 ____________________________________________
183
study. However, the nature of the composite electrodes and the contribution from
binders and conductive phases make it difficult to exactly characterize the
contribution of the electrocatalyst itself and these supported nanophase electro
catalytic materials should be further investigated for their electro activity under more
controlled conditions.
5.8 CONCLUSIONS
This study has identified commercially viable methods for preparing highly active
nanophase Pt, and Au electrocatalyst supported upon mesoporous HMS and MCM-
41, and also methods for preparing nanophase composite electrode materials stable in
high electrolyte environments for hydrogen production, that are active, cheap to
prepare and easy to upscale. Far less of the PGM was utilized than in bulk electrodes.
Sequential deposition was found to be an effective method to stabilize nanophase
electrocatalyst on mesoporous support matrices and thereafter to incorporate them
into composite membrane electrode format. Different combinations of nanophase
electrocatalyst and various binders, supports, and conductive phases were evaluated
in this study. This method to form nanophase containing composite membrane
electrodes was found to be a promising low cost method for preparing larger scale
composite membrane electrodes that could be applied for H2 production by water
electrolysis in high electrolyte media and could be useful as electrodes for other
electro-driven reactions.
The electrochemical response of nanophase composite membrane electrodes formed
by sequential deposition was combination specific and high current densities were
obtained by nanophase composite electrodes in water electrolysis in a high electrolyte
environment. In general it could be stated that addition of particulate nanophase
Sb/SnO and supported Pt in the form of Pt FAU, Pt HMS or Pt MCM-41 increased
the catalytic activity of composite materials prepared by several techniques with

CHAPTER 5 ____________________________________________
184
Nafion® or Polystyrene as binder, especially on a zirconium based support (type d),
which is also a highly electro-active substrate without additional deposited layers.
Polystyrene was prone to inertize composite surfaces when used in spray coating, but
proved effective as binder in the casting method where only carbon black was used
on support a. Hot pressed composites prepared with PTFE were stable but had low
activity. The various Ni foils that were used for comparison purposes were active but
less active than some of the composites prepared by sequential deposition or support
d by itself. The nanophase catalysts investigated showed an ability to enhance electro
catalytic activity of electrode surfaces.
Au and Pt nanoparticles supported on mesoporous MCM-41 or HMS were more
active than Ni on Alumina or Pt nanoparticles supported on microporous FAU.
Electro activity of supported electrocatalysts (Pt, Au) was found to be a complex
function of metal concentration, metal type, host matrix, zeolite typology, porosity,
and acidity as well as supported metal nanocluster size. The isolating nature of the
inorganic porous zeolite framework matrix did not inhibit the activity of nanophase
electrocatalyst, but in fact promoted water electrolysis. The optimum supported
nanoscale metal cluster size resulting in significant electro activity was about 5 nm.
Relatively high activity was also observed for commercial Sb/SnO nanoparticles
processed into electrodes, which was comparable to the Pt containing electrode
samples. The nanophase metal type, and reduction procedures, as well as pore size of
inorganic matrix support are shown to play a role in the electro activity of
electrocatalysts processed in composite membrane electrode form. Regardless of the
reduction technique (methanol formaldehyde, sodium hypophosphite), the Pt and Au
electrocatalysts supported upon mesopore materials (HMS, MCM-41) showed the
best activity. Thus pore size of host matrix support is a significant parameter in
preparing zeolite supported electrocatalysts.
Sequential deposition was found to be an effective method to firstly stabilize
nanophase electrocatalysts on mesoporous support matrices and thereafter to

CHAPTER 5 ____________________________________________
185
incorporate them into composite membrane electrode format upon conductive
substrates by application in the form of catalytic inks. The electrocatalyst containing
film composite nanophase gas diffusion electrodes were formed by deposition of
catalytic inks on supports that could act as gas diffusion layers. This method to form
nanophase composite gas diffusion electrodes was found to be a promising low cost
method for preparing larger scale electrodes that could be applied for H2 production
by water electrolysis in high electrolyte environments. Cost could be reduced through
minimizing the PGM utilized.
Homogeneous distribution and loadings of nanophases was dependent upon
deposition method, substrate type as well as ink formulation. Reproducible
production of standard electrode materials containing nanophase electrocatalyst
would require careful control of the processing techniques, which could not be
achieved by hand. Incorporating supported nanophase electrocatalysts in composite
gas diffusion electrodes resulted in production of electrodes capable of current
densities of between 550 and 750 mA cm-2 at 60 °C at an applied potential of -2 V.
The fact that the electrodes were able to withstand the very high degree of H2 gas
evolution at an applied potential of -6 V showed that even under these aggressively
accelerated testing conditions the nanophase containing inks were stable and durable.
Nanophase electro catalytic materials could thus successfully be incorporated into
composite gas diffusion electrodes and resulted in significant catalytic activity for
hydrogen production.
Aspects that require attention were identified; these were quantification of the amount
of electrocatalyst per unit area of electrode sample and quantitative catalytic activity.
Although the electroactivity for water electrolysis was used as semi quantitative
method to characterize the composite electrodes, the substrate used as support for the
catalytic layer on the electrode influenced the results obtained significantly therefore
it was not possible to accurately determine the I/V characteristics of the
electrocatalyst containing film deposited.

CHAPTER 5 ____________________________________________
186
Some of these aspects are addressed in Chapter 6 which will focus on screenprinting
as a processing method to deposit uniform and reproducible catalytic films of known
structure and characterize such films. The means to obtain specific and well dispersed
metals loading in the electrocatalyst containing film over the surface of the electrode
is also addressed. Chapter 6 also presents a new technique to characterize the
electronic properties of the catalyst layer supported on the substrate using the Hall
measurement system.

CHAPTER 6 _____________________________________________
187
6. DEVELOPMENT OF GAS DIFFUSION ELECTRODES BY SCREEN PRINTING OF CATALYTIC INKS
6.1 INTRODUCTION
Development of suitable high activity electrocatalysts (as described in Chapter 4)
needs to be coupled with the methodology to incorporate such catalytically active
materials into composite gas diffusion electrodes (GDE) for various applications,
including water electrolysis or fuel cells. Prerequisites for such systems are complex.
It is not suitable to utilize these particulate materials in powder form in electro driven
reactions, therefore the composite electrocatalyst would need to be stabilized upon a
suitable conductive substrate in film format using binders in order to prepare a stable
and durable composite gas diffusion electrode whilst retaining sufficient electro
activity.
Preparation of a film containing active metal components upon a suitable conductive
substrate is complex. The emulsions used as catalytic ink typically contain the electro
active component, and electro conductive phases as well as a proton conducting
phase which may or may not act as a binder, and if necessary, dispersants or solvents.
The most immediate problem in the preparation of an emulsion or ink of the correct
formulation is to prevent aggregation of the nanophase particles, which should be
highly dispersed. Moreover, the film should be highly proton conductive.
Furthermore, an electro conductive phase should be present in the film formulation
that takes into account the percolation threshold, which can be significantly improved
by the application of nanophases. Each active catalytic site should have sufficient
access to the three phase boundary (gas, liquid, solid). Thereafter a further challenge
arises in that the relative electron and proton conductivity of the system should be
maintained whilst still allowing ingress of reactant and egress of gaseous product,
requiring either hydrophilic surfaces in the case of water electrolysis or hydrophobic

CHAPTER 6 _____________________________________________
188
surfaces in the case of, for instance, direct methanol fuel cells. In addition, the
application of a film upon a suitable conductive substrate requires that suitable
binders are utilized that will neither hinder proton conductivity, nor cause the
occlusion of catalytically active sites by the binder. Thereafter, the application of the
ink to form the film upon a substrate requires selection of the most suitable substrate
for the application and a methodology of deposition, which can be achieved by, for
instance, spray coating or by various printing procedures (Vielstich et al., 2003).
Once all these requirements are optimized, it is still necessary to tailor the surface and
interfacial tension of the liquid phase and surface free energy of the solid phase to
ensure that highly homogeneous and un-agglomerated films will form upon removal
of the solvent in the ink during the drying process. Support substrates and films being
deposited should have the same coefficient of expansion so that adhesion is good and
crack formation is minimized in order to prepare a stable and durable composite gas
diffusion electrode (Wang et al., 1998; Chen and Tsao, 2006). Composite gas
diffusion electrode surfaces containing catalytic nano phases should result in high
activity because of optimized geometry, electro and proton conductivity, high surface
area, and enhanced porosity and transport of reagents and products.
Typical preparations of a PEM electrode for a fuel cell are well described in the
literature and the membrane electrode assembly (MEA) structure and components are
reviewed in Chapter 7 (see also Figure 7.1 and 7.2). This chapter describes efforts to
address some of the above challenges in understanding the role of variables affecting
the successful preparation of gas diffusion electrodes suitable for polymer electrolyte
membrane (PEM) electrolyzer systems. Of the methods that are suited to processing
particulate catalytic materials into films on suitable substrates, screenprinting was
selected and is described in this chapter. The goal was to prepare a stable, well
dispersed and homogeneous film containing active metal components upon a suitable
substrate by use of emulsions containing an electro active component, and electro as
well as a proton conducting phase, binder, and solvents and understand some of the

CHAPTER 6 _____________________________________________
189
properties of the film in isolation from the other components of the electrolyzer
system.
6.2 OVERVIEW
Intensive development of fuel cells, especially based on proton exchange membranes
(PEM), has stimulated the development of PEM electrolyzers to produce hydrogen,
as fuel for application in hydrogen energy and technology. Hydrogen production
technology for water electrolysis by the solid polymer electrolyte membrane (PEM)
method, has advantages in terms of high efficiency and low cost compared to
conventional hydrogen production methods (Grigoriev et al., 2006).
The electrode in electrolyzer system functions as a support for the catalyst, an
electron and proton pathway, as well as needing to distribute the liquid reactant and
remove the gaseous products. The performance of membrane electrode assemblies
(MEAs) in fuel cells or electrolyzers is substantially affected by the structure of the
electrodes and satisfactory and uniform spatial characteristics are required. Hence, the
key technical issues for polymer electrolyte membrane (PEM) based systems such as
fuel cells and electrolyzers are porous structure, incorporation of catalytic materials,
membrane stability, adequate flow distribution, and system design. Electrochemical
reactions, heat transfer, and mass transport occur in the three-phase interface among
gaseous phase (hydrogen, air or water vapour), liquid phase (proton hydrate, hydroxyl
ion, peroxide ion, and water), and solid phase (porous gas diffusion layer, catalyst
composite, Nafion® electrolyte) (Zhu et al., 2007). The components needed for each
reaction determine the structure of the composite MEA and ultimately the stability,
degradation and lifetime of the MEA.
There are different approaches to preparing the system required for electrolysis using
a PEM system. In an early study, high-purity hydrogen was prepared by bringing a
hydrogen containing gas in contact with a hydrated solid polymer electrolyte cell

CHAPTER 6 _____________________________________________
190
comprised of a catalytic anode, perfluorocarbon sulfonate ion exchange membrane
and a catalytic cathode. Direct current energy was supplied between the electrodes to
overcome the internal resistance of the cell, dissociate the hydrogen in the impure gas
to protons, and drive the protons through the cation membrane for recovery at the
opposite electrode (Sedlak et al., 1981).
Takenaka et al., (1982) showed that electrocatalysts can be directly plated upon
perfluorosulfonic acid polymer membranes and applied for solid polymer
electrolyzers (SPE). Noble metals and their alloys were directly attached to both sides
of the membrane without a binder by metal plating methods, utilizing reactions of a
metal salt solution with a reducing agent on the membrane surface, which made it
possible to increase the adhesive strength of electrocatalysts to the membrane and
also to reduce the resistance of the electrocatalyst/SPE interface. Millet et al. (1990)
prepared electrocatalyst composites for water electrolysis, consisting of
microparticles of noble metal electrocatalyst, that were precipitated simultaneously
on both sides of a perfluorinated ion-exchange membrane by chemical reduction of
cationic precursor salts. Anodic overvoltage, cathodic overvoltage, ohmic drop within
the SPE and roughness factor of the electrodes were measured and low noble metal
loadings (< 1 mg cm−2), low cell voltage (-1.75 V at 1 A cm−2 and 80 °C) and long
term stability (over 15,000 h of continuous electrolysis) was achieved.
However, these various plating methods mainly produce a bulk two dimensional
metal film upon the membrane and the active catalytic surface area is relatively low.
Therefore there is an interest in the use of nanoparticulate electrocatalysts, but
stabilizing these materials is complex.
Various electrode fabrication techniques have been reported in literature such as
rolling, screen-printing, and spraying techniques, each with its own merits and
problems. Low operating and low capital cost, with high through-put and increased
turnaround times are necessary when fabricating components for electronic devices
such as PEM electrolyzers. This can be achieved by depositing catalytic materials in

CHAPTER 6 _____________________________________________
191
particulate form using spraycoating, screen-printing or by digital inkjet printing for
printing on fragile, dimensionally unstable and expensive substrates. Other methods
for preparing the electrode may include gravure coating, offset coating, comma
coating, die coating, slit coating, spray coating, plating, sol-gel processes, film
processes, chemical vapour deposition (CVD), vapour deposition, sputtering, and ion
plating (Okada et al., 2007). Not all of these methods are suited to processing
particulate catalytic materials.
6.2.1 Approaches To Preparing Gas Diffusion Electrodes
The gas diffusion electrodes (GDE) incorporating the catalyst in fuel cells and
electrolyzers are currently typically prepared by rolling, spraying, and recently by
screen printing methods (Tanaka et al, 2005) and the proton conductive phase,
normally a Nafion® solution, can be impregnated into the gas diffusion layer (GDL)
using for instance, spraying and brushing methods.
Direct-printing of an outer and an inner catalyst layer on the PEM in a layered anode
structure for a fuel cell is reported to improve the CO-tolerance ability and utilization
efficiency of the catalyst (Wan and Zhuang, 2006a; 2006b). The MEAs consisted of a
Nafion® 117 membrane and a commercial electrocatalyst (20% Pt/C from E-TEK)
on the cathode side. The inner catalyst layer providing the hydrogen oxidation
reaction was a pure Pt layer (0.07 mg cm−2) that was prepared by directly printing on
PEM. This example highlights the difference in the requirements between an
electrolyzer and a fuel cell, since in the electrolyzer water splitting replaces hydrogen
oxidation. The combination of catalyst deposition and screen-printing could allow
the mass production of materials possessing catalyst activity for hydrogen evolution.
The differences and complexity of each system affect the electrochemical reactivity
(Wang et al., 1998). Existing ink deposition methods such as spray painting are not
well suited for low (<0.5 mg Pt cm−2) catalyst loadings because of lack of
reproducibility and slow throughput. Moreover, the solution properties should also be

CHAPTER 6 _____________________________________________
192
compatible with the printing method, and catalyst utilization should be optimized
(Tanaka et al, 2005).
Recently, inkjet printing (IJP) has been developed (Murthy et al., 2000) and was used
to deposit water based catalyst ink solutions containing catalysts supported on
different carbon black sources onto gas diffusion layers (GDL) that were made into
membrane electrode assemblies (MEAs) for the polymer electrolyte fuel cell
(PEMFC). Ink jet printed MEAs with catalyst loadings as low as 0.020 mg Pt cm−2
showed Pt utilizations in excess of 16,000 mW mg−1 Pt which is higher than
traditional printed MEAs (800 mW mg−1 Pt). A graded distribution of Pt/C catalyst
structure using standard Johnson Matthey (JM) catalyst, showed enhanced
performance (Taylor et al., 2007).
A hybrid technique for fabricating low platinum loading electrodes was claimed to be
more successful than spraying and screen-printing techniques for the preparation of
PEMFC electrodes (Abaoud et al., 2005). Towne et al., (2007), used commercial
desktop inkjet printers to deposit the active catalyst electrode layer directly from print
cartridges onto Nafion® polymer membranes in the hydrogen form. Good adhesion
was achieved without any post-deposition hot press step and the layers were
subjected to tape peel, bending and abrasion tests. The elimination of the hot pressing
step indicated that inkjet-based fabrication or similar processing technologies may
provide a route to less expensive large-scale fabrication of MEAs, but these authors
concluded that it remained to be determined whether such routes for MEA production
offer performance advantages or lead to more efficient utilization of expensive
catalyst materials.
In the case of proton exchange membrane fuel cells the interfacial contact of the
catalyst with the membrane has been studied in a MEA fabrication method where
perfluorosulfonyl fluoride copolymer powder was pressed into a sheet at 230°C by
hot pressing. The Pt/C catalyst was screen-printed onto either side of the sheet,
followed by hot pressing which embedded the coated catalyst layer into the

CHAPTER 6 _____________________________________________
193
membrane. The resultant MEA was converted into perfluorosulfonate polymer by
hydrolysis using a NaOH solution (Kim et al., 1998).
U.S. Patent 5,783,325 (1998), UK Patent 2,316,802 (1999) and U.S. Patent 6,103,414
(2000) by Cabasso describe a polymer solution made of thermoplastic film former,
e.g., polysulfone and polyvinylidene fluoride, mixed with carbon and a common
solvent (DMF and NMP) that was cast on glass in the form of asymmetric flat sheet
electrodes to control of the gas-diffusion pores, and the electrode-catalyst-membrane
interface. A substantial reduction of the catalyst in the MEA was claimed, and less
than 0.1 mg cm-2 was shown to produce a high performance MEA.
The direct fabrication of Au and Pt nanoparticles by an electro deposition process on
screen-printed carbon strips was possible (Chikae et al., 2006). This is one approach
to the incorporation of nanophases into the screen printed carbon film. In another
approach a platinum loading of 0.38 mg cm-2 on a Nafion® membrane electrode was
achieved for the PEMFC by the simultaneous deposition and reduction of platinum
through an impregnation/reduction method. The current density reported was between
500 and 1000 mA cm-2 at 0.6 to 0.7 V (Rajalakshmi et al., 2004; 2007).
Most recently, studies have shown that optimization of the electrode structure is still
desirable. Zhang et al., (2007), describe a process for preparing a catalyst coated
membrane (CCM) to fabricate the MEA for solid polymer electrolyte (SPE) water
electrolysis. Spray coated Nafion® layers are shown to be effective for increasing the
reaction interface between SPE and the electrode catalyst layer. Their study of the
SPE electrolyzer with a new MEA structure could achieve about 0.1 V lower voltage
at atmospheric pressure and 2 A cm−2. Reshetenko et al., (2007), optimized the
cathode structure for an air-breathing direct methanol fuel cell (DMFC) by
application of pore-forming agents such as ammonium carbonate and ammonium
hydrocarbonate that form additional macro and mesoporosity increasing the
electrochemical active area and catalyst utilization. Improved performance of the
MEA was also attributed to the porosity of the cathode electrode by Chen and Tsao

CHAPTER 6 _____________________________________________
194
(2006), because a network of macro fissures and sub-micro fissures allowed air to
penetrate the electrode in the case of the fuel cell MEA. The relationship between the
total porosity of the electrodes and the MEA performance was demonstrated and the
specific power density nearly doubled when the total porosity was increased from
57% to 76%.
These efforts show that there is considerable opportunity to increase efficiencies by
improving the manner in which the electrode or MEA is structured for each
application.
6.2.2 Differences Between Fuel Cells And Electrolyzers
From the literature it is evident that most efforts have focused upon the optimization
of printing methods to prepare MEAs for the fuel cell and less effort has been aimed
at optimization of electrodes for SPE electrolyzer systems. The electrocatalyst
configuration and type used for hydrogen production is somewhat different to that
applicable in fuel cells. Electrodes for the electrolyzer systems are reversed compared
to the fuel cell system. In electrolyzer systems, water splitting is achieved on the
anode accompanied by evolution of O2 and hydrogen being produced on the cathode;
whereas in a fuel cell the oxidant (O2) and fuel (H2 or hydrocarbon) fed to the cathode
are recombined to form water on the anode. Thus accumulation of evolving gas on
the electrodes can occlude the electrode surface in electrolyzer systems whereas
water flooding is typically a problem of electrodes in PEM fuel cells (Tanaka et al,
2005). Hence, a different approach is required to preparing electrodes for each
specific system.
Hydrophobicity is required in a fuel cell to prevent flooding of the electrode, unlike
in the case of a SPE electrolyzer, where hydrophilic catalyst layers, coatings or gas
diffusion layers are required, in order to optimize the ingress of the reactant, water.
The diffusion layer in a PEMFC generally consists of a thin layer of carbon black
mixed with hydrophobic polytetrafluoroethylene (PTFE) that is coated onto a sheet of

CHAPTER 6 _____________________________________________
195
macro-porous carbon backing cloth or other substrates (Tanaka et al, 2005). Yu et al.,
(2006) showed that the catalyst microstructure and water transport is one of the key
components of PEMFCs because the electrochemical reaction occurs at the three-
phase interface of the catalyst layer. They found that it was necessary to optimize the
hydrophobic and/or hydrophilic properties of catalyst layers, which have a large
impact on the water transport and on the performance of the PEMFC.
The requirement for the anode also differs from that of the cathode. Jung et al.,
(2006) showed that different hydrophobic/hydrophilic conditions apply to the cathode
compared to the anode for fuel cells because of the difference conditions required at
the respective electrodes. According to these authors, wettability of the fuel cell
cathode caused flooding whereas increased wettability of the anode catalyst layer
caused by SiO2 addition allowed beneficial water adsorption from back diffusion.
Choi et al., (1996) demonstrated that in PTFE-bonded carbon electrodes, when the
hydrophobicity of the electrocatalyst layer increased, the hydrogen chemisorbed Pt
fraction and utilization of Pt decreased.
Because of the different reactions occurring in PEM electrolyzers compared to PEM
fuel cells it is not possible to directly apply the advances made in one system to that
of the other, and specific optimization of each electrode in each system is required.
Hence it is of importance to understand the parameters that may influence the
performance of these different gas diffusion electrodes.
6.2.3 Requirements Of Gas Diffusion Electrodes
It is well known that in electrochemical systems that the nature of the redox processes
that occur at the electrode/electrolyte interface and their rates can be partially
controlled by the applied potential, which may be influenced by the speed of
interfacial electron transfer. This is a function of the electrode structure which, in the
case of gas diffusion electrodes for electrolyzers and fuel cells, is composed of redox
centres (on the metal catalyst), an electron conductive phase (carbon) and a polymer

CHAPTER 6 _____________________________________________
196
binder (Nafion®) that also functions as a proton conductor/solid electrolyte. The rate
of charge transport in response to a change in the redox reaction on the metal centre
depends strongly upon the polymer electrolyte. The overall performance of these
electrodes is thus a function of the electron transfer at the electrode film interface,
charge transport through the layer, and mass transport of the reactant and products
within the layer (Rusling and Forster, 2003).
The performance of the PEM fuel cell or PEM electrolyzer electrodes is dependent
upon the proton network, electronic network and the interface between the electrolyte
and the electrocatalysts as well as the interfacial resistance (Rajalakshmi et al., 2007).
A two phase flow within the gas diffusion layer is caused by the reactant (liquid)
supply to the active layer and the removal of product (gaseous). In PEM electrodes,
an effective mass transport of reactants to, as well as of products from the reaction
zone is required to achieve high reaction rates and reduce efficiency losses. Therefore
electrodes in PEM electrolyzers or fuel cells include a porous GDL between the flow
field of the bipolar plate and the reaction zone of the electrode’s active layer, to
ensure a homogeneous and efficient mass transport over the whole active area of the
cell. Typically, the GDL is one to two orders of magnitude thicker than the active
layer where the reactions take place. The structure of the porous gas diffusion layer,
including its porosity and tortuosity, affects the two-phase mass transport in the
electrodes. The effects of different fabrication methods, thicknesses of gas diffusion
layer and the impregnation method of Nafion® solution, upon porosity and on fuel
cell performance have been explained in terms of reduced charge transfer resistance
and extension of the three-phase region (Lee et al., 2004).
Films of catalyst and ionomer in the micrometer range do not have the mechanical
integrity to be freestanding, therefore a composite is required in which a thin catalytic
substrate zone is located within a highly porous conductive matrix or upon the
polymer membrane itself. Cabasso, et al., in U.S. Patent 5,783,325 (1998) point out
that the most common binder and membrane used for composite electrodes is

CHAPTER 6 _____________________________________________
197
Nafion®, because of its proton conductive characteristics. The optimum Nafion®
content as binder affects both the activity of a catalyst and also the ionic resistance of
the electrode, therefore its presence in the catalyst layer is necessary for good
performance. These patents give typical Nafion® contents that may range from 30 –
40 dry wt % and loading is calculated as a dry weight (wt%) of ionomer divided by
the total dry weight of the catalyst and ionomer and multiplied by 100. Nafion®
solution has been used successfully in MEAs, but the mechanical properties of
Nafion® change above 90 ºC and under pressure plastic flow occurs and at >120ºC,
collapse of the interface occurs and the MEA irreversibly loses its properties.
Although many other substitutes for Nafion® have been explored, this problem has
not been solved yet.
Other issues such as variable membrane hydration, ternary gas mixtures for reactant
streams, phase change of water in the gas diffusion electrodes, and the temperature
distribution across the cell are also of importance in MEA performance (Rowe and
Li, 2001). Two-phase transport of reactants and products constitutes an important
limit in performance of polymer electrolyte systems. For instance, in fuel cells at high
current densities or low gas flow rates, product water condenses in the open pores of
the cathode gas diffusion layer (GDL) and limits the effective oxygen transport to the
active catalyst sites (Pasaogullari and Wang, 2004). Dynamic interactions within a
PEM electrolyzer such as water phenomena, electro-osmotic drag and diffusion
through the membrane should also be considered (Görgün, 2006).
The overall MEA performance will also be a function of the way in which the
catalyst is supported and the microstructure of the catalyst support as well as that of
the catalyst. For instance, carbon aerogel supported Pt catalysts with different pore
size distributions and Pt content were synthesized and tested in a PEMFC operation.
The microstructure of the support, the perfluorosulfonate-ionomer distribution and
the pore size distribution of the aerogel supported Pt catalyst was shown to have an
effect on the performance of the PEMFCs. The PEMFC prepared with a low Pt
loading (0.1 mg cm-2) of a porous aerogel supported catalyst showed high power

CHAPTER 6 _____________________________________________
198
densities up to 0.8 mW cm-2 in fuel cell operation conditions in air and at ambient
pressure (Smirnova et al, 2005).
MEA performance is highly dependent on catalyst structure, specifically the relative
volume fractions of gas pores and polymer membrane contained within the active
region as well as the geometry of the individual catalyst agglomerates (Siegel et al.,
2003).
These examples show that the performance of a MEA is not only determined by the
electrocatalyst activity, but by numerous other parameters relating to the electrode
structure. Although many of the above studies relate to the requirements of fuel cell
MEAs, the conclusions drawn can be extrapolated with due caution to the case of the
SPE electrolyzer MEAs, with consideration of the differences between the systems.
6.2.4 Screenprinting
Because screen printing was the method chosen for preparing electrodes in this
chapter, the general procedure was reviewed. It was not the aim of this study to
optimize the screen printing method but to adequately characterize the morphology
and electrical properties of the screenprinted film. The inks used for screenprinting in
this study consisted of finely divided particles in a paste blend.
Although screen and stencil technologies are well developed for manufacturing fuel
cell electrodes and membranes (DEK® International, 2007), production methods of
active components for fuel cell and electrolyzers must become faster and more highly
automated for lower costs and higher production volumes. High-speed, accurate,
repeatable, cost-effective screen printing with optimized ink formulations should
enhance delivery of high-quality membrane electrode assemblies (MEAs) suitable for
application in PEM systems such as SPE electrolyzers.

CHAPTER 6 _____________________________________________
199
During the screen printing process a free flowing ink is spread using a squeegee and
forced through the apertures of a screen mesh, overlaid with a patterned stencil
(Davis, 1999). Screens are made with various thread counts which can be altered
depending upon the chosen design. Typical screen materials are nylon, terylene and
metal and the film is about 20 µm in thickness. Various kinds of support materials or
carriers can be printed, using ultraviolet screen printing inks (Abbott, 2005). The
screen pitch, which is the shortest distance between the centres of two adjacent screen
apertures or cells, depends on the technology and the geometry used. A typical pitch
value for metal screens is 83 µm. The standard lines-per-inch (LPI) of a screen
printable design is 65 lpi for automatic process prints.
Problems in printing can be reduced by using a different angle of print with a higher
mesh count of 4 to 5 times the LPI (Fresener, 2008). During screen-printing with a
grid pattern, printing defects are likely in electrode layers. For instance, moire caused
by interference with the mesh of the screen of the printing plate, or breaking and
thickening of thin lines, may occur making precise printing difficult (Okada et al,
2007). United States Patent 6505554 issued to Rhein (2003) describes a process of
screen printing images on a substrate that utilizes specific screen angles which
effectively diminishes the moire effect and other screen printing process distortions.
Multiple layering is recommended as a means to avoid these problems. Other
problems that may arise during printing (Technigraphics, 2002) include smearing,
streaking, reduction, bleeding, haze, flow marks, pin holes, voids, and inconsistency.
Screen printing presents advantages as a high-throughput, automated solution for
creating fuel cell components. As example, the Hydrogen Institute of Applied
Technologies (H.I.A.T. gGmbH) advertise that proprietary screen-printing
techniques are a rapid, low-cost and repeatable way to prepare bifunctional catalytic
electrodes in a homogeneous layer of uniform thickness for polymer electrolyte
membrane fuel cells. Screen printing is possible on most polymers (e.g. different
types of Nafion®) as well as on gas diffusion layers (e.g. Toray paper). Homogeneous

CHAPTER 6 _____________________________________________
200
current distribution as well as optimized orientation of microstructure in the electrode
has been claimed.
Replicable, stable cell currents and voltages were obtained by screenprinted
electrodes (Pettersson, 2006). Various approaches have been taken to improve ink
formulations in screen printing for electrode performance. Eggins (2002) reports that
various modifying components can easily be incorporated into a carbon paste ink
suited for screen-printing thick film graphite powder based sensors. The
electrochemical behavior of thick film carbon sensors fabricated with four different
commercial carbon inks was compared for redox systems and different background
currents showed that the choice of the ink would depend upon the specific technique
being used (Wang et al., 1998).
Glycol-based solvent and iron oxide inks have been studied, to improve viscosity and
achieve a good level of screen printing performance by slurry control during screen-
printing. Optimum parameters of the screen such as aperture diameter (70 mesh) and
emulsion thickness (over 30 mm) were established (WE-NET, 1998). Screen-printing
of PEM fuel cell electrodes has been reported in the open literature (Park, 2002;
Tanaka et al, 2005). Tanaka and co-authors imply that the success of screen printing
is a complex interplay of the format of the screen printer device, the type of
dispersant used in the ink, the viscosity of the ink, as well as the ratios of the different
components in the inks. These variables have an effect upon the shear rate and
thixotrophy index of the ink. The complexity in preparing carbon based electrodes
and incorporating nanophases into electrodes result in many differences in the
composition of commercial and proprietary carbon inks used for fabricating screen-
printed electrodes.
Screen printing is not always the best approach to preparing electrodes for a specific
application as can be seen in the case of electrodes for solid oxide fuel cells (SOFC).
Good bonding and mechanical stability of screen printed electrodes for solid oxide
fuel cells requires high firing temperatures, which could cause formation of resistive

CHAPTER 6 _____________________________________________
201
reaction products detrimental to the electrode performance (Labrincha et al., 1993).
Cathodes could be deposited by screenprinting or by firing. Tape casting and co-
firing were methods used to prepare reduced temperature solid oxide fuel cell (SOFC)
anodes where thin film 8YSZ electrolytes were deposited on Ni–YSZ anode support
plates. (Van Herle et al., 2001).
Many electrochemical properties change when the electrodes in cells are layered
(Majima, 1997a and b; Majima, 1999; Majima, 2001; Kitoh, 1996). The different
zones of the screenprinted electrodes as well as the electrical contacts should be
studied in order to optimize both the composition and distribution of the layers
deposited on the support for the construction of a homogeneous and reproducible
layer of the catalyst on the substrate.
6.2.5 Other Applications Of Screenprinted Electrodes
Screen printing as an approach for the preparation of electrodes is widely utilized for
various other applications and a few examples are given. Screen-printing technology
is used for the mass-production of disposable electrochemical sensors. Multilayer
films containing multiwall carbon nanotubes and redox polymer were successfully
fabricated on a screen-printed carbon electrode using a layer-by-layer assembled
method for electro catalysis of ascorbic acid (Sha et al., 2006). Different strategies,
including palladium electro deposition, Pd sputtering and Nafion®-solubilized carbon
nanotube casting, were used to modify screen-printed carbon electrodes for the
fabrication of amperometric enzyme biosensors (Lee et al., 2007). In another earlier
example, semiconductor TiO2 thick film electrodes were prepared by screen printing
for sunlight photo electrolysis of water (Ahmed, 1986).

CHAPTER 6 _____________________________________________
202
6.2.6 Ink Formulations
From various references it could be seen that much of the information on ink
formulations is proprietary or patented. In U.S. Patent 7316475, issued to Cornell et
al. (2008), and 6158843 issued to Murthy et al. (2000) thermal inkjet printing of
aqueous inks heavily loaded with silver nanoparticles, typically the mole fraction of
water in the ink should be greater than 0.9 with respect to only the liquid components
of the ink and the ink viscosity be less than 3 Pa-s at 22 ºC, for inks containing metal
nanoparticles. According to Cornell et al., (2008) US patent 2003/0185971 by Saka
claims conductive ink formulations with low viscosity for ink jet printing, which are
limited to 10 % solids. The particle size should be less than 50 nanometers (nm) for
the best resolution and minimal settling. An upper limit to prevent excess particle
settling is about 132 nm (Cornell et al., 2008). Polymeric dispersants such as ionic
hydrophilic methacrylic acid and nonionic hydrophilic polyethylene glycol are used
in aqueous inkjet inks as dispersants, as well as ingredients such as humectants to
reduce evaporation, and such inks resulted in a sheet resistance of 0.16 Ohm (Guan et
al., 2006). According to Cornell et al., (2008) no theoretical basis exists for the
viscosity of liquid mixtures. This patent states that the mole fraction of water in the
ink should be greater than 0.9 computed with respect to only the liquid components.
An important requirement of a commercial ink formulation is to make a stable
aqueous based colloid dispersion. There are many ways to prevent the metal colloid
to agglomerate and precipitate. USPTO Application 20060044382 discloses
stabilizers such as surfactants, polyelectrolytes, gelatin, polyphosphates, amino
grafted polymer, or oligomer, dendrimer, crown ethers and amphiphilic polymers
such as carboxymethyl cellulose sodium salt. However, these stabilizers could cause
problems such as increasing the viscosity of the dispersion or not being compatible
with the components of the system or may introduce unwanted salts into the system,
and may create problems to remove the excess salt or stabilizer after printing.

CHAPTER 6 _____________________________________________
203
Differences in conductive ink formulations can have a pronounced effect upon
electrode performance. If nanoparticles form part of an ink formulation, it is
necessary to optimize the conductive inks and tailor the ink to provide high
conductivity and low resistance at low curing temperatures, to ensure good adhesion
on flexible substrates such as Nafion®, reduce interfacial problems and to provide
additional functionalities, such as diffusional properties. Moreover, different printing
technologies can introduce flaws such as severe moire patterns, horizontal print
banding frequencies and also result in ink bleeding due to too much ink printed
locally (Shu et al., 1997).
In many cases heat curing of the printed layer is desirable as at 66°C water begins to
leave the ink and at 94°C the binder may reach its lowest viscosity and maximum
surface contact is made with the substrate. At 105°C water should leave the ink
rapidly and at 133°C approximately fifty percent of the water is gone and the binder
and particles start to cure. By 150°C most of the water is gone and the binder-
particulate combination is partially cured. Maintaining this temperature for 30 s to 1
min should allow the binder and particulate to cure (NEHOC, 2008). However, when
using Nafion® PEM membranes as a substrate for printing, high heat curing is not
possible as the membrane is heat sensitive.
Tanaka et al (2005) used either dibutyl phthalate or isopropanol as dispersion media
or solvent during the development of an ink paste suited for screen-printing catalytic
electrodes for micro electromechanical system (MEMs) based fuel cells.
Dibutylphthalate was found to have the appropriate viscosity whereas isopropanol
had an undesirable decrease in viscosity at high shear rate causing unwanted and
excess flow during screen-prinitng. These authors also found that the viscosity of the
ink at a low shear rate should not be too high if uniformity of the screen-printed layer
was to be achieved. A degree of flow due to surface tension was required for
uniformity. The thixotrophy index should thus be small for screen printed inks.

CHAPTER 6 _____________________________________________
204
Based upon the limited information available on screen printing conductive
nanoparticle containing inks, this chapter focused on investigating the effect of some
variables such as dispersant type and ratio, overall ink composition, and substrate
type upon the electronic characteristics of the film formed on the substrate which was
either a gas diffusion layer or the ionomer membrane.
6.2.7 Surface Tension, Viscosity and Rheology
Surface tension is the energy required to stretch a unit change of the surface area due
to the unbalanced force experience by molecules at the surface of a liquid. As a result
of surface tension, a drop of liquid tends to form a sphere, which shape offers the
smallest area for a definite volume. Different liquids have different surface tensions.
The surface tension of water is 72.8 dynes cm-1 and the surface tension of propylene
glycol is 40.1 dynes cm-1 at 25 °C. Substances with low surface tension have a
tendency to form films. The intermolecular attraction between like molecules is
called cohesion, and adhesion is the attraction between unlike molecules. Liquids
with high surface tensions have strong cohesion forces, and are poor wetting liquids
due to low adhesion forces. A wetting agent increases the adhesion force between two
different materials. Molecules of wetting agents usually have a polar and a non-polar
portion. When added, the wetting agent increases the wetting action of water with the
non-polar material. For propylene glycol solutions in water the surface tension
decreases with increasing mass fraction (Horibe et al., 1997). Propylene glycol has an
amphiphilic nature, and hydrogen-bonding with strong solvation interactions with
water thus different molar fractions in water may allow tailoring of the
hydrophilic/hydrophobic balance. The interactions with water arise from the
hydrogen bond donor and acceptor properties of the hydroxyl function (---OH) and
the direct interactions between the alcohol groups and water are sufficiently high to
prevent phase separation at higher temperatures (Bauduin et al., 2004).
Viscosity is a measure of the resistance of a fluid which is being deformed by either
shear stress or extensional stress. Viscosity describes the internal resistance to flow of

CHAPTER 6 _____________________________________________
205
a fluid. Water has a viscosity of 1 centipoise at 20 °C and the viscosity of ethylene
glycol is 16.1 centipoise at 25 °C (Lide, 1992). Fluids such as the inks formulated in
this study do not have a constant viscosity, thus are Non-Newtonian fluids. Such
fluids exhibit a variety of different correlations between shear stress and shear rate.
Rheological characterization of ink is of relevance in printing technologies (Tanaka et
al. 2005). Modelling the rheological properties of solutions has received attention.
One of the more general models (Chhabra & Richardson, 1999) which has been used
consistently in the literature to describe the time independent viscous characteristics
of slurries such as the inks, is the Yield Pseudoplastic or Herschel-Bulkley model.
This model is also able to describe Power-law or pseudoplastic behaviour and
Bingham plastic behaviour. The general forms of these models are shown in Figures
6.1 to 6.3 (Chhabra & Richardson, 1999). The Newtonian model would appear as a
horizontal line in Figure 6.2. Referring to Figure 6.3, it can be seen that all three
models illustrate shear thinning behaviour, as viscosity decreases with an increase in
shear rate.
0
5
10
15
20
She
ar S
tress
0 20 40 60 80 100
Shear Rate
Bingham Plastic
Pseudoplastic
Yield Pseudoplastic
Figure 6.1 General form of the flow curve (or rheogram) - linear axes.

CHAPTER 6 _____________________________________________
206
1E-1
1E0
1E1
1E2
1E3
1E4
1E5
She
ar S
tress
1E0 1E1 1E2 1E3 1E4 1E5
Shear Rate
Bingham Plastic
Pseudoplastic
Yield Pseudoplastic
Figure 6.2 General form of the flow curve (or rheogram) - logarithmic axes.
0.001
0.01
0.1
1
10
Vis
cosi
ty
1E0 1E1 1E2 1E3 1E4 1E5
Shear Rate
Bingham Plastic
Pseudoplastic
Yield Pseudoplastic
Asymptote Slope = -1
Figure 6.3 General form of the viscosity diagram for the rheological models on
logarithmic axes.
Solids concentration is perhaps the most important parameter affecting slurry
rheology and slurry rheology can be correlated with solids concentration. It is
important that empirical methods are used in order to relate rheology to concentration
for the most meaningful and comparable results to be obtained (Chhabra &
Richardson, 1999).

CHAPTER 6 _____________________________________________
207
Besides solids concentration, a related factor influencing the rheology of the slurry is
maximum packing density which in turn is influenced by the particle size
distribution. Very little work has been done in attempting to relate these and other
particle properties to the rheology (Dabak & Yucel, 1987). Unfortunately there is no
correlation proposed for the flow behaviour index (n). Despite this, the rheological
constants can be correlated against concentration using simplified versions of the
correlations proposed by Landel et al. (1963) for the fluid consistency index (K) and
Dabak & Yucel (1987) for the yield stress (τy). In order to determine the rheological
parameters, a flow curve is needed, measuring the shear stress over a range of shear
rates. For any suspension, there may be time dependant behaviour. This is important
when constructing the flow curve, because if there are significant changes with time,
the flow curve should be constructed using viscosities measured at a time where it is
constant. This phenomenon can be investigated by measuring the change of viscosity
with time. The slurry viscosity may be stable with time for the first time period, after
which it may start to decrease as the solid particles began to settle out. At higher
shear rates, the particles may be kept in suspension with no significant decrease in the
viscosity (Chhabra & Richardson, 1999).
6.2.8 Characterization: Hall Measurements
Characterization of the activity of gas diffusion electrodes is typically confined to
cyclic voltammetry or stack testing. However, as Chapter 7 will specify, this can
introduce extraneous interferences which make it difficult to examine the quality of
the film containing the nanophase electrocatalyst. Various approaches have been
described for measuring the homogeneity of a gas diffusion electrode in a working
cell or stack (Stephan et al., 2006; Ghosh et al., 2006; Brett et al., 2007; Sauer et al.,
2008). Characterization of the homogeneity and current density of the electrode layer
prior to incorporation in the MEA is of importance, as inhomogeneity will directly
impact on its performance in a stack.

CHAPTER 6 _____________________________________________
208
Typically in this study (see Chapter 7) the MEA for H2 production was prepared as
follows: the cathode was prepared by spray painting or coating the carbon-supported
Pt electrocatalyst (1 to 6 mg cm-2) and ionomer onto the GDL. The anode was
prepared by spraying about 6mg cm2 IrO2 or carbon supported Pt onto pretreated
titanium fibre as GDL. The MEA was pressed by sandwiching the ionomer
membrane (typically Nafion® 117) between the cathode and anode electrodes and
hot-pressing at 130ºC and 40 bar for 5min. However, this procedure resulted in many
extraneous variables influencing the performance of the MEA, as is further described
in Chapter 7. Thus it was not possible to accurately characterize the films containing
the electrocatalysts separately once formed into a MEA.
Therefore the film was separately characterized using the Hall measurement system
by printing the film on a non-conductive substrate such as paper or on the PEM itself
and comparing the printed layers on these substrates with the substrate typically used
as gas diffusion layer in MEAs, namely carbon cloth.
Utilization of a magnetic field for characterization of the distribution of current
densities in proton exchange membrane fuel cells (PEMFC) to enable optimisation of
fuel cell performance has recently been described (Candusso et al., 2004). Hall
measurements were shown for IrO2 films (Patil et al., 2003). The Hall effect
measurements were carried out at room temperature and the values of Hall resistivity
(ρH) and carrier concentration (NH) were deduced showing their variation with film
thickness. These authors demonstrated that as film thickness increased, ρH decreased.
The decrement in ρH was ascribed to the increase in carrier concentration, which
stemmed from ionization of defect and change in mobility of charge carriers of IrO2
films. The surface properties or large defect concentration can dominate the transport
properties of such dioxides.
Current distribution mapping, increasing the homogeneity of the current density
distribution and achieving a uniform utilisation of the active area is of significant
importance in fuel cell and electrolyzer MEA developments (Eckl et al., 2006). The

CHAPTER 6 _____________________________________________
209
structure and current carrying capability of the catalyst containing film on the
electrode is the prime aspect in this chapter that was investigated. An intrinsic
material property such as resistivity (or conductivity) is required to quantify the
current-carrying capability of the material for comparisons between different
samples. Resistivity is not a fundamental material parameter, because different
materials can have the same resistivity. Different sample geometries also give
different resistance values. Thus it is necessary to consider carrier density n and
mobility µ in the electrical characterization of a material. In order to determine both
the mobility µ and the sheet density ns, a combination of a resistivity measurement
and a Hall measurement is required.
6.2.9 Resistivity And Hall Effects
The resistance (R) and conductance (G) of a material are measurable physical
quantities obtainable from two-terminal current (I) and voltage (V) measurements.
The resistance alone, however, does not adequately discriminate between materials as
different sample shapes give different resistance values. Resistivity on the other hand
allows the quantification of the current-carrying capability of a material for relevant
comparisons between different samples (EEEL-NIST, 2008).
The Hall effect is the potential difference (Hall voltage) on the opposite sides of an
electrical conductor created by a magnetic field applied perpendicular to a current
flow (EEEL-NIST, 2008). The Hall effect discriminates between positive charges or
holes moving in one direction and negative charges moving in the opposite.
Because resistivity by itself does not fully characterize the electrical transport of a
material, and carrier density n and mobility µ need to be considered it is necessary to
apply a magnetic force normal to the direction of the electron flow (Figure 6.4).

CHAPTER 6 _____________________________________________
210
Figure 6.4 Hall effect in a thin flat conductor (http://hyperphysics.phy-
astr.gsu.edu/hbase/magnetic/hall.html)
The force that arises as a result of the simultaneous current and magnetic flux is
called the Lorentz force, which influences the electrons to move sideways with a drift
velocity away from the line of electron flow, resulting in an excess surface electrical
charge accumulating on one side of the sample. This charge results in the Hall
voltage, a difference of potential between the two sides of the sample (Putley, 1960).
Various problems may arise in the measurements because of offset voltage caused by
nonsymmetric contact placement, sample shape, or non-uniform temperature
(Chwang et al., 1974), but modern instrumentation and careful sample preparation
can minimize these effects. The magnitude of the Hall voltage VH is equal to
VH =IB/qnd 6.1
where I is the current, B is the magnetic field, n is electron bulk density, d is the
sample thickness, and q (1.602 x 10⁻¹⁹ C) is the elementary charge. Layer or sheet
density (ns = nd) can be substituted instead of bulk density, thus:
ns = IB/q|VH| 6.2

CHAPTER 6 _____________________________________________
211
The values of I, B, and q are known and the Hall voltage VH can be measured, thus
the sheet density ns of charge carriers can be determined.
The Hall mobility µ is calculated as follows:
µ = 1/qnsRS (in units of cm2V-1s-1) 6.3
from the sheet carrier density ns and the sheet resistance RS. The sheet resistance RS is
determined by use of the van der Pauw resistivity measurement technique (Van der
Pauw, 1958; Putley, 1960). A resistivity and a Hall measurement are needed to
determine the mobility µ and the sheet density ns (ASTM method F76, 2000). The
Hall measurement, carried out in the presence of a magnetic field, yields the sheet
carrier density ns and the bulk carrier density n if the conducting layer thickness of
the sample is known. The carriers can be a positive or negative carrier type.
Conventionally in a dry semi-conducting material the positive carriers are “holes”
and the negative carriers, electrons. In electrolytes both carriers can be ions.
6.3 MATERIALS AND METHODS
6.3.1 Ink Preparation
The electrocatalyst used in the optimization of the ink formulation for screen printing
was a commercial electrocatalyst (Alpha Aesar 40% Pt on Carbon Black; Hispec
4000 (Stock 42204 ; Lot F01Q12)) in most cases. Sample series LP06 was made with
Alpha Aesar 40% Pt on Carbon Black (Hispec 4000: Lot J26P18). This commercial
catalyst was chosen as it is well characterized by the vendor and gives satisfactory
performance as the catalytic electrode of conventional PEM fuel cells and is the
benchmark in the thesis.

CHAPTER 6 _____________________________________________
212
Solvents that were used included ultra pure water, isopropanol or alternatively 1,2-
propanediol (Propylene Glycol) 99% (Sigma Aldrich, Cat. No. 13436B; Lot S39776-
337). Propylene Glycol specifications are: Boiling Point, °C : 187.3 ; Density, 20/20
°C : 1.0381; Surface Tension, dynes cm-1, 25 °C : 40.1; Viscosity, cP, 20 °C : 0.581
;Vapour pressure, mm Hg, 20 °C : 0.07 ; Solubility in water : Completely soluble.
Where any additional conductive phase was added to the catalytic ink a product sold
as “Fullerenes” by Aldrich (37946-2.56 03702HE 99.5% FW 720.67) was used.
Table 6.1 gives the exact composition of each ink. The catalyst was weighed and the
water added prior to addition of the solvent to prevent combustion of the catalyst
upon addition of the solvent. Each component was weighed sequentially into a vial
which was sealed until use. Inks were generally sonicated for 5 min prior to use.
Table 6.1 Ink compositions
Series Catalyst JM Pt40/C (g)
Water Nafion® 5% (g)
Isopropanol (g)
1,2 Propanediol (g)
Fullerenes (g)
LP00 0.0532 100 µL 0.0877 nil nil nil LP01 0.526 0.0984 g 0.0652 0.5432 nil nil LP02 0.1125 0.0999 g 0.0783 nil 0.5218 nil LP03 0.1009 0.1002 g 0.0788 nil 0.7481 nil LP04 0.1017 0.2173 g 0.0795 nil 0.6217 nil LP05 0.0983 0.2978 g 0.0793 nil 0.3191 nil LP06 0.0989 0.2952 g 0.0977 nil 0.2993 0.0353 LP07 0.1008 0.3324 g 0.0768 nil 0.3031 nil
Table 6.2 shows the molar ratio of the dispersants H20 and 1,2 propanediol,
normalized to H2O for ease of reference. The water and solvent accompanying the
Nafion® should also be considered but, as the value was kept fairly constant apart
from series LP06, this value was neglected for the purposes of calculating the molar
fractions of the dispersants H20 and 1,2 Propanediol.
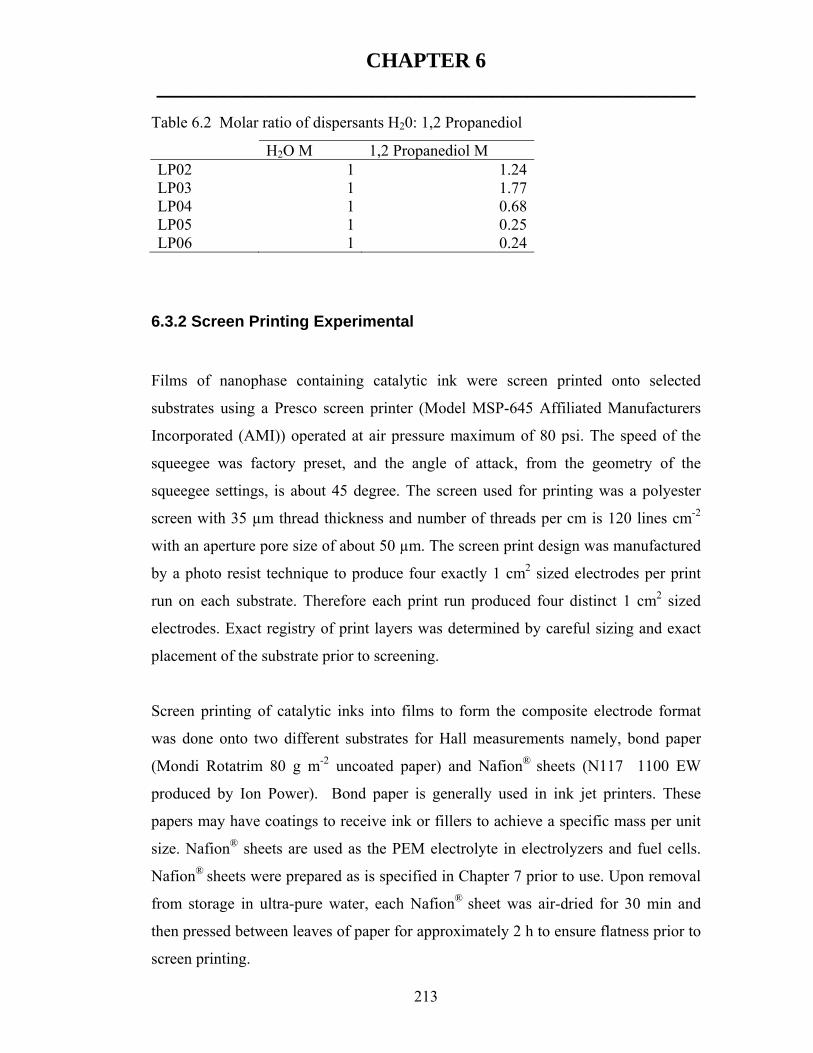
CHAPTER 6 _____________________________________________
213
Table 6.2 Molar ratio of dispersants H20: 1,2 Propanediol
H2O M 1,2 Propanediol M LP02 1 1.24LP03 1 1.77LP04 1 0.68LP05 1 0.25LP06 1 0.24
6.3.2 Screen Printing Experimental
Films of nanophase containing catalytic ink were screen printed onto selected
substrates using a Presco screen printer (Model MSP-645 Affiliated Manufacturers
Incorporated (AMI)) operated at air pressure maximum of 80 psi. The speed of the
squeegee was factory preset, and the angle of attack, from the geometry of the
squeegee settings, is about 45 degree. The screen used for printing was a polyester
screen with 35 µm thread thickness and number of threads per cm is 120 lines cm-2
with an aperture pore size of about 50 µm. The screen print design was manufactured
by a photo resist technique to produce four exactly 1 cm2 sized electrodes per print
run on each substrate. Therefore each print run produced four distinct 1 cm2 sized
electrodes. Exact registry of print layers was determined by careful sizing and exact
placement of the substrate prior to screening.
Screen printing of catalytic inks into films to form the composite electrode format
was done onto two different substrates for Hall measurements namely, bond paper
(Mondi Rotatrim 80 g m-2 uncoated paper) and Nafion® sheets (N117 1100 EW
produced by Ion Power). Bond paper is generally used in ink jet printers. These
papers may have coatings to receive ink or fillers to achieve a specific mass per unit
size. Nafion® sheets are used as the PEM electrolyte in electrolyzers and fuel cells.
Nafion® sheets were prepared as is specified in Chapter 7 prior to use. Upon removal
from storage in ultra-pure water, each Nafion® sheet was air-dried for 30 min and
then pressed between leaves of paper for approximately 2 h to ensure flatness prior to
screen printing.

CHAPTER 6 _____________________________________________
214
Each substrate was carefully weighed before and then after deposition and drying of
the separate layers with a hand held blow drier, and the mass calculated for each print
area of 4 cm2 in size, comprising four 1 cm2 electrodes. After the solvent evaporated,
the film that was deposited consisted primarily of electrocatalyst with only a small
amount of incorporated Nafion® ionomer as binder. No other components were
added to the ink formulations to minimize interferences.
Optical microscopy of printed electrode layers was performed to evaluate the printed
layer homogeneity and catalyst particle dispersion or agglomeration. Images were
taken with an Olympus SZX12 optical microscope at 20x magnification.
6.3.3 Hall Measurement Experimental
6.3.3.1. Sample preparation
After screen printing, electrode samples were prepared for resistivity and Hall effect
characterization. The 1 cm 2 screen printed electrode was carefully trimmed and
mounted on thin cardboard to ensure flatness and thereafter mounted onto the
Lakeshore Sample Holder (part number 750SC10-50) with “solvent and acid free
water soluble glue” (Henkel Pritt). The electrical contact was made by placing four
small ohmic contacts on the four corners of the supported film (Figure 6.5 (a and b))
using silver conductive ink (screen printed or hand painted using DuPont Silver paint
5000).
Thereafter contacts were hand painted between each corner of the 1 cm2 electrode
and silver contact points 1, 2, 3 and 4 on the Lakeshore Sample Holders. Mounted
samples were cured at 70 °C in a hot air oven for 30 min to ensure contact dryness.
This treatment was not suitable for Nafion® based samples as the Nafion® degraded,
thus samples on Nafion® substrates were air-dried.

CHAPTER 6 _____________________________________________
215
The printed sample could be connected to the Lakeshore Sample Holders (part
number 750SC10-50) using silver wire and Indium solder for electrical contact,
because the low temperature melting of indium allowed soldering of silver contacts
with indium foil onto paper backed samples and did not damage the sample as paper
can withstand 250 °C. Indium welded silver contacts were used in cases where the
catalytic ink was overprinted upon silver printed contacts as can be seen in Figure
6.5(b). It was found that hand painting the silver contacts onto the 1 cm2 screen
printed electrodes was more suitable for Hall measurements of these samples and this
was the mounting procedure used for characterization of screen printed sample
electrodes.
(a) Indium contacts for samples overprinted onto silver printed contacts on Lakeshore Sample Holders 750SC10-50
(b) Silver contact hand painted on screen printed samples
Figure 6.5 Electrode preparation for sample mounting
6.3.3.2 Instrumental set up conditions
The Hall measurements were obtained using a Lakeshore 7704 system with HMS
Matrix 775 control instrument sample Module Model 75013SCSM (max 100 V) and
a Sample Module Model 75013SCSM (Figure 6.6) to apply the magnetic field (with a
maximum of 10.8 Gauss).

CHAPTER 6 _____________________________________________
216
Figure 6.6 Lakeshore 7704 HMS Matrix Hall measurement system
Hall effects were determined at ambient temperature but without equilibration of
moisture content by placing mounted samples in a light proof sampling chamber
(Figure 6.6). The Lakeshore system was used to determine the film resistance RS via
the van der Pauw technique (Putley, 1960). The film carrier density ns was measured
by the Hall voltage VH .
Manual resistance measurements were firstly obtained to check the integrity of
contacts according to the van der Pauw geometry which is geometry independent
(van der Pauw, 1958). Terminals were painted on the corners of each electrode
(Figure 6.5 (b)). Connections were made according to the (R12,12; R23,23; R34,34;
R41,41) configuration for each prepared electrode after mounting in a Lakeshore
sample holder and a voltage applied between each terminal successively.
The Van der Pauw geometry (Van der Pauw, 1958; Putley, 1960) was used for IV
curve measurement starting at -1.0 mA to 1.0 mA with a step size of I=100 mA and a
dwell time of 5s. Thereafter a Variable Field measurement was obtained for each
sample between 10 kG and 1 kG at a step size of 1 kG and dwell time of 10 s at a
current of 1 mA. The mode chosen was linear sweep with field reversal and geometry
A+B to minimize any lack of symmetry.

CHAPTER 6 _____________________________________________
217
6.3.4 Experimental: Rheology of inks
Ink samples were prepared for rheological measurements using different solvents,
liquid to solids and solvent to water ratios as given in Table 6.3.
Table 6.3 Liquid to solid ratio and solvent to water ratios of ink formulations Sample Name LPO 1 LPO 10 LPO 4 LPO 5 LPO 11 Liquid:Solid ratio 14 14 8 6 14 Solvent: water ratio 5:1 5:1 3:1 1:1 1:1 Solvent type Iso-
propanol Propanediol Propanediol Propanediol Propanediol
After weighing and mixing the ingredients of each ink for 30 min using a magnetic
stirrer, inks were ultrasounded for 5 min before viscosity measurements were taken.
Rheological measurements were conducted using the Anton Paar Physica MCR 300
system. Viscosity measurements were obtained at 25ºC using CP50-4 measuring
system and TEK 150 PA-C measurement cell with 0.5 mm cone/plate gap, between 1
and 1000 reciprocal seconds.
6.4 SCREEN PRINTING RESULTS
A series of electrodes were printed as specified with either a single print or one or
two overprints as is listed herewith:
LP02: Run 1 = one layer; Run 2=one overprint, replicated 3 times
LP04: Run 1= 1 layer; Run 2=one overprint (2 layers); Run 3=two overprints (3
layers)
LP05: Run 1= 1 layer; Run 2=one overprint (2 layers); Run 3=two overprints (3
layers)
LP06: Run 1 =1 layer; Run 3= two overprints (3 layers)
Ink formulations printed on Nafion® sheet 117 as substrates, are denoted with the
suffix “nafion” in the text. These substrates could not be weighed accurately due to

CHAPTER 6 _____________________________________________
218
slow moisture loss from the moisturized Nafion® substrate over time. Nafion sheets
were printed at STP and were equilibrating during printing as the drying time of 30
min prior to printing was chosen to reduce deformation of the sheet and maintain
some hydration for characterization.
The mass % increase determined for the series of electrodes printed on bond paper as
substrate using the respective isopropanol or 1,2 propanediol based ink formulations
given in Table 6.1 are presented in Table 6.4.
Table 6.4 Mass % increase of substrate before and after printing (area of print = 4 cm2). LP02 LP04 LP05 LP06 Run 1 before (g) 0.7014 0.7039 0.6544 0.6509 Run 1 after (g) 0.7017 0.7081 0.6589 0.6554 Mass % increase 0.0428 0.5931 0.6829 0.6866 Run 2 before (g) 0.6595 0.6523 0.6825 Run 2 after (g) 0.6661 0.6603 0.6898 Mass % increase 0.9908 1.2116 1.05828 Run 2 before (g) 0.6527 Run 2 after (g) 0.6588 Mass % increase 0.9259 Run 2 before (g) 0.6922 Run 2 after (g) 0.6992 Mass % increase 1.00114 Run 3 before (g) 0.648 0.6441 0.6783 Run 3 after (g) 0.6602 0.6554 0.6873 Mass % increase 1.84793 1.7242 1.3095
Each print run using the respective formulations listed in Table 6.1 produced four
distinct 1 cm2 sized printed electrodes upon the selected substrate. The general design
of the screen, with 4 separate 1cm2 electrodes, thus gave two circular and two square
shaped electrodes for each print run. The shape of the electrode (round versus square)
was varied to establish what effect this would have on print quality and take-off
effects.
The mass increase of the film deposited on the substrate (paper), after each 4 cm-2
layer of ink was deposited by screen printing was fairly reproducible (Figure 6.7)

CHAPTER 6 _____________________________________________
219
using different the ink formulations detailed in Table 6.1. Series LP03 was not
weighed accurately thus this mass is not reported.
0
0.002
0.004
0.006
0.008
0.01
0.012
0.014
run 1 run 2 run 3
Mas
s (g
)
LP04 LP05
Figure 6.7 Mass (g) increase of the substrate after each successive overlayer for print series LP04 and LP05.
The mass (g) of the substrate approximately doubled upon deposition of each
successive layer superimposed upon the previous layer, increasing the substrate mass
by approximately 0.004 g / 4 cm -2 each time (Figure 6.8). Thus each separate
electrode of 1 cm2 increased by approximately 0.001 g with each successive
overprinted layer.
00.20.40.60.8
11.21.41.61.8
2
LP04 LP05 LP06
Mas
s %
incr
ease
run 1
run 2
run 3
Figure 6.8 Mass % increase of electrodes for electrodes after each successive deposition over 4 cm -2
It was thus possible to accurately deposit a chosen mass of active component per unit
area using the screen printing method, which depended upon the ink viscosity and the

CHAPTER 6 _____________________________________________
220
mass % increase was consistent between print runs and series (Figure 6.8). Ink
viscosity was a function of the amount of particulate matter (electrocatalyst) in the
formulation as well as the amount of Nafion® ionomer used as binder and the type
and relative amounts of each dispersant / solvent chosen. The amount of ionomer and
electrocatalyst was kept more or less constant, thus in this study the dispersant /
solvent type and ratio played the major role in ink viscosity.
6.4.1.1 LP01 series
Figure 6.9 shows the results of printing with series LP01 ink where an ink based upon
isopropanol as dispersant/solvent was used.
Figure 6.9 Series LP01 print run-1
LP01 series were printed using a typical spraycoating ink formulation used in
preparing fuel cell MEAs (Chapter 6), containing isopropanol (and not 1,2
propanediol) as is given in Table 6.1. Optical microscopy images (backlit) of the
films printed on bond paper are shown in Figure 6.10 (a-d).
LP01 series print runs 1-3 comprised of single print runs. LP01-4 comprised of one
overprint (2 runs). This formulation containing isopropanol and water was found to
be an inappropriate dispersant for screen printing, resulting in significant bleeding of
ink around the edges of the defined 1cm 2 print areas, and marked inhomogeneity of
printed layers, with smearing, flow marks and streaking visible on each printed

CHAPTER 6 _____________________________________________
221
electrode, and low density or opacity of the layer after printing. Similar problems are
reported by Tanaka et al., (2005) for this dispersant.
a. LP01-1 b. LP01-2
c. LP01-3 d. LP01-4 (2 runs)
Figure 6.10 Optical microscopy of LP01 series
The ink formulation used in the LP01 series was too thin/liquid and caused
agglomerated and very poorly connected islands of the electrocatalyst particles which
were poorly distributed upon the substrate showing significant lift-off characteristics
and uneven deposition. This formulation that is usually used for spray coating was
also unsuitable for use in screen printing as the ink spread outside the printing area
because of its low viscosity. The formulation used had 5.5 parts of isopropanol to 1
part of water as solvent (neglecting the isopropanol in the Nafion® solution that was
kept approximately constant throughout (Table 6.3)).
A single overprint gave more homogeneous results (LP01-4). However, the ink had
dried considerably between the time taken (<5 min) between the first print and the
500 µm 500 µm
500 µm 500 µm

CHAPTER 6 _____________________________________________
222
overprint because the dispersant evaporation (isopropanol) was too rapid, therefore
print surface coverage was incomplete and irregular.
Thus isopropanol as dispersant was unsuitable as it evaporated too quickly to achieve
good surface coverage during screenprinting. The volatility of the dispersant
determined the ease with which the screen printing could be repeatedly overprinted
with the same ink. As Tanaka et al., (2005) found, the screen-printability of inks
degraded progressively over time, particularly in the case of the isopropanol-based
inks. These authors also found that isopropanol had a lowered viscosity under
increased shear rate, which caused the ink to flow from the openings on the screen
and spread around the printed area as was observed in LP01 series.
6.4.1.2 LP02 series
LP02 series were printed using a formulation where isopropanol was substituted with
1,2 propanediol (99% Sigma Aldrich Lot S39776-337; Cat No. 13436B) in order to
increase the drying time of the ink and improve the viscosity. The amount of catalyst
was doubled with respect to the solvents for all the subsequent samples to further
increase the ink viscosity compared to LP01 series. This formulation had
approximately 1 part of water to 5 parts of 1,2 propanediol mass to mass as dispersant
(molar fraction 1:1.24 of H20:1,2 propanediol).
LP02-1 was printed once (run 1) without overprinting, showing a low ink deposition
rate. Ink deposition was much improved for this formulation by thereafter
overprinting the electrode once. Samples LP02-2 to 4 were each separately
overprinted once (2 runs). Figure 6.11 shows the replicability in mass increase of
overprinting of the electrode.

CHAPTER 6 _____________________________________________
223
0
0.001
0.002
0.003
0.004
0.005
0.006
0.007
0.008
print 1 Run 1overprint x1
Run 2overprint x1
Run 3overprint x1
Mas
s (g
)
LP02
Figure 6.11 Replicability of overprinting
The degree of replicability in the mass deposition observed for the overprinted
samples indicates that it was possible to accurately deposit between 0.006-0.007 g
over 4 cm2 of substrate. LP02-4 (one overprint (Run 3)) gave a somewhat denser film
indicating that the dispersant had started evaporating from the ink solution before the
overprint print could be done, hence it may be necessary to add a humectant to this
formulation when used in bulk.
For the ink formulation containing 1,2 Propanediol that was used in the LP02
formulation very little catalyst was deposited in the first run (LP02-1). Merely 0.0003
g was deposited. The ink formulation used in the LP02 series was visibly drying
during the time between print and overprint (approximately 5 min) yet this did not
significantly change the amount of ink deposited during overprinting, which was
replicable (compare Run 1 (LP02-2), Run 2 (LP02-3) and Run 3 (LP02-4)). The
difference in the deposited mass measured for 4 cm2 between Print 1 (LP02-1) and
one overprint (LP02-2) was 0.0063 g; between Print 1 (LP02-1) and replicate
overprint LP02-2 was 0.0057 g and between Print 1 (LP02-1) replicate overprint
LP02-3 was 0.0058 g. The mass % difference between replicate overprinting runs
(LP02-2, LP02-3 and LP02-4) was within 1% of each other showing good
reproducibility of the overprinting. The difference in mass between replicated

CHAPTER 6 _____________________________________________
224
overprinted layers (LP02-4) was an order of magnitude less than the difference
observed between the first print and the subsequent overprinted layer. The first print
run (LP02-1) deposited 20 times less catalyst than the subsequent overprinting run.
The difference in mass observed between the first print and the overprinted layer
cannot be ascribed to a change in the ink viscosity during the time taken to deposit
Print 1 and overprint one time. Hence, the inconsistent increase in mass between the
first print and the subsequent overprinting run indicates that the surface tension of the
substrate, paper, played a role in the degree of uptake of the ink upon the substrate.
The first layer merely served to prime the substrate for the subsequent printed
overlayer.
Optical microscopy with backlighting of series LP02 is presented in Figure 6.12.
a. LP02-1 b. LP02-2
c. LP02-3 d. LP02-4 Figure 6.12 Optical microscopy of series LP02
The smearing and bleeding observed with the isopropanol formulation (LP01 series)
is not visible in the overprinted samples of series LP02, which ink formulation
contained the dispersant 1,2 propanediol, showing that the substitution of isopropanol
500 µm 500 µm
500 µm 500 µm

CHAPTER 6 _____________________________________________
225
and the increase of the solid fraction (doubled) in this ink formulation resulted in a
significant improvement in the printing quality (SGIA, 2008). Mottling with voids
and substrate show through effects are still visible in samples LP02-4 which may be
reduced by overprinting to improve the density (opacity) of the film. Registry of the
overprinting was exact and no offset, bleeding or jagged edges were observed.
6.4.1.3 LP03 Series
Figure 6.13 shows optical microscopy images of LP03 series.
a. LP03-1 b. LP03-2
c. LP03-3 d. LP03- Nafion Figure 6.13 Optical microscopy images of LP03 series
LP03 series were printed using a formulation similar to that used in LP02 series with
slightly more 1,2 propanediol to adjust ink viscosity slightly to improve screening of
the ink during overprinting. This formulation had 1 part of water to 7.5 parts of 1,2
propanediol on a mass to mass basis of dispersant (molar fraction 1:1.77 of H20:1,2
propanediol). Some smearing of the layer was observed during screening LP03-1 but
500 µm 500 µm
500 µm 500 µm

CHAPTER 6 _____________________________________________
226
better deposition of the electrocatalyst was achieved in the first print run than was the
case for sample LP02-1. LP03-2 comprised of two overprints (3 runs) and LP03-3
comprised of one overprint (2 runs) as at this stage the ink became thicker due to its
volatility and print quality was better.
The inconsistency found in the deposition indicated that this formulation was still too
volatile over the duration of the overprinting therefore the ratio of water to 1,2
propanediol was adjusted further. The LP03 formulation was used for printing on the
treated Nafion® substrate as a trial run (Figure 6.13 (d)) and it was observed that the
particulates in the first printed layer on Nafion® showed similar patterns of mottling,
voids and agglomeration visible on the paper, which were still visible after
overprinting twice (3 runs). On the Nafion® flow patterning and lift-off smearing of
the print was also visible.
6.4.1.4 LP04 series
LP04 series were printed using a formulation where the mass of water was increased
and that of 1,2 propanediol was decreased in order to improve the wetting of the
Nafion® sheet during printing and try to minimize the mottling and agglomeration
observed in series LP03. This formulation had 1 part of water to 2.9 parts of 1,2
propanediol mass to mass as dispersant (molar fraction 1:0.68 of H20:1,2
propanediol).
Figure 6.14 shows optical microscopy images with backlighting of series LP04.
LP04-1 (Figure 6.14(a)) comprised of one print run and showed good coverage but
slight bleeding was observed around the edges of the print. LP04-2 (Figure 6.14 (b))
comprised of two layers (one overprint) and LP04-3 comprised of three layers (two
overprints) and achieved better coverage and opacity on the paper than was achieved
in previous series, showing that the higher water content relative to 1,2 propanediol
(1: 2.9 mass by mass ratio) improved the ink formulation for printing on paper.

CHAPTER 6 _____________________________________________
227
a. LP04-1 b. LP04-2
c. LP04-3 d. LP04-Nafion three runs
Figure 6.14 Optical microscopy images of LP04 series
However, this formulation was still not entirely satisfactory when Nafion® was used
as substrate (LP04-Nafion – Figure 6.14(d)). On the first Nafion® print run
significant take off effects were observed especially on circular designs of electrodes
whereas the quality of square design electrode prints were better. The first
overprinted layer on Nafion®, showed improvement of the printing for square
designs, whereas the circular electrode designs still showed problematic lift off
effects. During the second overprint on the Nafion® substrate fairly good surface
coverage was obtained.
500 µm 500 µm
500 µm 500 µm

CHAPTER 6 _____________________________________________
228
In order to view the structure of the
printed layers Scanning Electron
micrographs were obtained and the
image for LP04-3 is shown in Figure
6.15. The particulate nature of the
electrocatalyst can be seen as well as
the porous nature of the deposited
film. There is considerable surface
roughness and in some areas small
cracks could be observed.
Figure 6.15 LP04-3 SEM image at 3K
6.4.1.5 LP05 series
LP05 series were printed using a formulation where the mass of water was further
increased and that of 1,2 propanediol was decreased with respect to only the liquid
components of the ink without changing the overall amount of liquid, to improve the
wetting of the Nafion® sheet during printing. This formulation had 1 part of water to
1.07 part of 1,2 propanediol as dispersant on a mass to mass ratio (molar fraction
1:0.25 of H20:1,2 propanediol)), whereas the formulation for LP04 contained 1:0.68
molar ratio of water to 1,2 propanediol. Optical microscopy images of Series LP05
with backlighting are shown in Figure 6.16.
LP05-1 (Figure 6.16(a)) comprised of a single layer that was of a much better quality
than observed in any of the previous screen printed series. In this sample the screen
structure is visible with some pin hole defects but the electrode prints showed very
few lift-off effects. LP05 -2 (Figure 6.16(b)) comprised of 2 layers (one overprint)
and LP05 -3 (Figure 6.16(c)) comprised of 3 layers (overprinted twice), all samples
of which were significantly improved with respect to the surface coverage obtained as
well as a great improvement in the degree of bleeding and very little mottling or
agglomeration was noticeable on the paper compared with all other formulations.

CHAPTER 6 _____________________________________________
229
a. LP05 -1 b. LP05 -2
c. LP05 -3 d. LP05-Nafion – three runs
Figure 6.16 Optical microscopy images of Series LP05 LP05-Nafion (Figure 6.17(d)) comprised of three layers (two overprints). Although
the sample comprising of three layers is of better quality than the previous samples
printed on Nafion®, there is still a degree of mottling and agglomeration visible. The
lift-off on the circular electrode design was still apparent whereas the square
electrode design resulted in a relatively good quality print after three layers were
deposited.
500 µm 500 µm
500 µm 500 µm

CHAPTER 6 _____________________________________________
230
In order to view the structure of the
printed layer Scanning Electron
micrographs were obtained and the
image for LP05-3 is shown in Figure
6.17. Similar to LP04 series the
particulate nature of the
electrocatalyst can be resolved as
well as the porous nature of the
deposited film. Once again there is
considerable surface roughness and
in some areas small cracks could be
observed.
Figure 6.17 LP05-3: SEM image at 2K of Series LP05
6.4.1.6 LP06 Series
LP06 series were printed using a formulation where the dispersant ratio was similar
to LP05 with 1: 1.01 H20:1,2 propanediol on a mass to mass basis (molar fraction
1:0.24 of H20:1,2 propanediol) but about 30 mass % fullerenes relative to the
electrocatalyst mass were added to the formulation in order to determine the effect, if
any, on resistivity and electronic characteristics. It was expected that the fullerenes
would dominate the electronic characteristics of the electrodes. LP06-1 comprised of
one layer (1 run) and LP06-2 comprised of 3 runs (overprinted twice).

CHAPTER 6 _____________________________________________
231
(a)LP06 1 (b)LP06-2 3 runs
(c) LP06 –Nafion one run
Figure 6.18 Optical microscopy images of Series LP06
In the LP06 series the printing of only one layer already gave a homogeneous and
dense layer of the particulate electrocatalyst on paper (Figure 6.18(a)). Overprinting
this layer twice created a thick film on the paper substrate (Figure 6.18 (b). The ink
was however, too paste-like and viscous because of the additional solid phase to
allow the ink to flow readily upon the Nafion® substrate (sample LP06-nafion) and
the screen pitch or thread line widths are clearly visible due to lack of gain.
The SEM image of LP06-2 (Figure 6.19) again shows the particulate nature of the
electrocatalyst as well as the porous nature of the deposited film. Yet again there is
visible surface roughness but cracking was reduced compared to other formulations.
500 µm
500 µm500 µm

CHAPTER 6 _____________________________________________
232
Figure 6.19 LP06-2 SEM image at 3K Figure 6.20 “Fullerenes” as supplied by
Aldrich
The fullerenes supplied by Aldrich did not appear to have a fullerene crystal
morphology and the material was significantly agglomerated into large particles
(Figure 6.20). However, EDS analysis showed that this material was mainly
composed of carbon. The addition of the fullerenes to the ink increased the solids
fraction of the ink and appeared to improve the film structure when investigated by
optical microscopy and SEM.
6.4.1.7 LP07 series
Figure 6.21 shows the optical
microscopy image of the
electrode LP07-1 screen
printed on to a silver contact
preprinted upon paper. The
arrow indicates the boundary
of the preprinted silver
contact.
Figure 6.21 LP07-1 Electrode screen printed on silver contact
500 µm

CHAPTER 6 _____________________________________________
233
Three overprints of ink LP07 were screen printed onto prepared paper that already
had nanoparticulate silver contact strips screen printed for Hall measurements, as can
be seen in Figure 6.21. However, print registry between overprints was inexact and
the catalytic ink did not adhere at all well to the screen printed silver ink contacts.
The Hall effects were therefore not determined by using silver screen printed
contacts, but by handpainting silver contacts.
Figure 6.21 shows jagged edges and voids in the electrocatalyst printed layer
overlaying the silver contact. This result highlights the problem of unsuitable surface
energy of the substrate or any underlying printed contact. Thus ink formulations
would need to be significantly adapted to print directly onto printed conductive silver
contacts, which fell outside the scope of this study.
6.5 ELECTRONIC CHARACTERISTICS OF FILMS
6.5.1 Results and Discussion: Resistivity characteristics
Resistivity and Hall effects were obtained of each printed sample using the method
specified in Section 6.3.3 to characterize the electronic properties of the films
containing the particulate nano structured electrocatalyst. IV curve measurements
gave the following resistance readings (Table 6.5) between each contact pair probed.
For comparison, the resistances of Lydall carbon cloth (6100-300) and a spraycoated
electrode made with Lydall 6100-300 and JM Pt40/C (used in MEA65 as described in
Chapter 7) are shown in Table 6.5. Furthermore, the results obtained for CNT paper
(as described in Chapter 3) and CNT paper coated with Pt nanoparticles using the
galvanic displacement technique (described in Chapter 4) are also included.

CHAPTER 6 _____________________________________________
234
Table 6.5 Resistance of screenprinted samples (Units in K Ω unless specified)
Sample R12,12 R23,23 R34,34 R41,41
Blank paper (G Ω ) 6.8 12.8 7.5 10.0
Blank Nafion® (M Ω ) 72.3 253.3 214.9 188.3
LP02-1 (G Ω ) 5.573 5.017 3.611 4.148
LP02-2 17.654 74.88M Ω 2.347M Ω 769.18
LP02-4 11.185 16.338 14.235 8.608
LP02-Nafion 17.71 8.56 M Ω 9.169M Ω 449.59
LP03-1 40.118 5.177 M Ω 467.82 M Ω 39.243
LP03-2 4.724 6.37 7.748 7.567
LP03-3 4.724 6.37 7.748 7.567
LP03-Nafion 17.317 58.231 65.973 18.11
LP04-1 (G Ω ) 2.388 2.838 7.473 7.95
LP04-2 6.443 11.803 11.976 8.515
LP04-3 4.398 4.007 3.085 3.251
LP04-Nafion 5.780 5.502 5.341 6.183
LP05-1 8.377 7.481 5.835 6.437
LP05-2 3.045 3.018 3.341 3.217
LP05-3 1.498 1.379 1.593 1.625
LP05-Nafion 4.45 6.733 7.814 5.837
LP06-2 1.715 1.628 1.691 1.692
LP06-Nafion 19.54 14.143 13.59 111.41
Lydall 6100300 blank (Ω) 51.5 50.84 51.03 50.75
Lydall 6100300 S4 (Ω) 50.78 51.52 51.19 50.41
CNT paper (Ω) 49.57 49.65 49.39 49.30
CNT paper + Pt (Ω) 60.61 102.23 102.58 61.54
The variability of resistance between contact pairs was not significant for series
LP04, LP05 and LP06 except for LP06 Nafion where one contact was of poor quality.
The variation seen in LP01, LP02 and LP03 series in most cases, was attributed to
poor film quality and not to poor contacts as the contacts were inspected and their

CHAPTER 6 _____________________________________________
235
quality was acceptable. The resistance of the Nafion® blank (Table 6.5) was
somewhat lower than the paper sample showing the less insulating nature of this
substrate. Figure 6.22 shows the resistance of each film sample in each series
graphically.
1
10
100
1000
10000
100000
1000000
10000000
LP02-
1
LP02-
2LP
02-4
LP03-
1
LP03-
2
LP03-
3
LP04-
1
LP04-
2
LP04-
3
LP05-
1
LP05-
2
LP05-
3LP
06-2
Res
ista
nce
(kO
hm)
Figure 6.22 Averaged resistance as a function of number of layers of ink for each series printed on paper
Samples LP02-1 and 2 on paper substrates showed excessive resistivity (Figure 6.22)
which in the case of LP02-1was nearly equivalent to the blank paper sample, thus
these samples were not characterized further. LP02-2 had a similar mass loading to
LP02-4, but the resistivity was much higher. This shows the difficulty of achieving
reproducible electrical characteristics of films. Catalyst loading is not the only
variable of significance, the structure of the film contributes significantly to the
electronic properties of the film. Visual inspection and optical images of the printed
layers showed that the film obtained in the case of sample LP02-4 was more
coherent, with fewer void spaces and less mottling than was the case in sample LP02-
2. Hence basing electrode quality on mass loading measurements only is not sound.
In the case of series LP03, the first layer was poorly dispersed and thus highly
resistive whereas subsequent layers resulted in a significant decrease in resistance,
showing the importance of film thickness in reducing resistance.

CHAPTER 6 _____________________________________________
236
All the series showed a lowered resistance trend for each additional printed overlayer
(Figure 6.22). This reduction in resistance correlated inversely to the mass of
electrocatalyst loaded upon the substrate as can be seen in Figure 6.23. The
correlation between resistance and grams loaded for LP05 series is shown in Figure
6.23.
0
1
2
3
4
5
6
7
8
0.001 0.0015 0.002 0.0025 0.003
Mass (g)
Res
ista
nce
(kO
hm)
Figure 6.23 Correlation between resistance and grams loaded for LP05 series
Table 6.6 Resistance as a function of loading of electrocatalyst upon substrates
Mass (g) cm-2 Ave. Resistance (k Ω )
LP04-1 0.00111 5162250
LP04-2 0.0020 9.68425
LP04-3 0.00305 3.68525
LP05-1 0.00113 7.0325
LP05-2 0.00183 3.15525
LP05-3 0.00283 1.52375
Figure 6.23 and Table 6.6 demonstrate that the amount of conductive electrocatalyst
in the film directly impacted upon the conductivity of the film, since the only electro
conductive component in the film (and substrate) was the commercial electrocatalyst,

CHAPTER 6 _____________________________________________
237
composed of Pt on carbon. However, the LP04 series had roughly similar amounts of
electrocatalyst deposited per unit area for each layer compared to LP05 (Table 6.6)
yet showed generally much higher resistance, because of poorer print quality. The
resistivity results for sample LP04-1 were in Gohm (Table 6.5) as this single layer
was not homogenous or continuous due to poor dispersion and agglomeration of the
ink upon the substrate as can be seen in Figure 6.14 (a). The resistivity of the
electrode was significantly lowered by overprinting two successive ink layers there
after (Table 6.6, samples LP04-2 and LP04-3).
The difference in resistance observed between these two series cannot be ascribed to
catalyst loading only but also to the print quality and the conductive pathway created
by adjoining clusters of printed electrocatalyst, which was affected strongly by the
ink formulation. Hence, no matter how active the electrocatalyst, if the deposition of
the film on the substrate is substandard, electro activity will be low.
In series LP05, even the first printed layer on non-conductive paper (Table 6.5) had a
relatively low resistance (below 10 k Ω compared to 100,000 k Ω for other single
printed layers) showing the benefit of this water rich formulation to form a cohesive
film. Significantly less mottling and agglomeration was observed because of the
higher water content and resulted in better catalyst/binder dispersions upon the
substrate paper even for the first layer printed. The affinity of the water enriched
formulation for the surface of the substrate was thus improved, showing the impact of
the interaction of the ink with the substrate.
It is postulated that this effect is due to improved matching of the surface free energy
of the liquid with that of the substrate. The surface energy of a solid cannot directly
be measured (Kruss, 2008) but can be determined by contact angle measurement of
the liquid in contact with the surface considering surface interaction, surface
reactivity and surface solubility and will be specific to the liquid. The surface tension
of 1,2 propanediol increases as the concentration of the water in the mixture increases
(Horibe et al., 1997).

CHAPTER 6 _____________________________________________
238
As the change in the dispersant ratio in the formulation relates mainly to modifying
the polarity and surface tension of the mixture incrementally, with an increased water
content rendering the solution more polar, it is likely that molecular interactions have
improved between the ink formulation used in this case and the paper substrate
surface because of liquid/solid surface interactions increasing.
The formulation used for LP06 series showed low resistances for the sample prepared
on paper and overprinting resulted in an electrode with similar resistances compared
to LP05, despite the addition of a high proportion of “fullerenes”. The additional
“fullerenes” appeared to have no significant effect upon the resistance of the
electrode.
The samples that were printed on paper showed a good correlation between each
successive overprinted layer thickness and lowered resistance. The first printed layer
is typically high in resistance, the next overprinted layer reduced the resistance of the
electrode by orders of magnitude and the third overprinted layer caused the electrode
resistance to reduce even further. Addition of fullerenes did not apparently affect the
resistance significantly as the resistance of LP06-2 which contained fullerenes (three
successive overprinted layers) is similar to the resistance obtained with three layers of
the ink without fullerenes (LP05-3).
Comparison of the average resistance of samples prepared on the Nafion® substrate
(Figure 6.24) shows the large effect of the ink formulation upon the resistance of the
film.

CHAPTER 6 _____________________________________________
239
1
10
100
1000
10000
100000
1000000
Nafion blank LP02-Nafion LP03-Nafion LP04-Nafion LP05-Nafion LP06-Nafion
Res
ista
nce
(Koh
m)
Figure 6.24 Average resistance of samples prepared with Nafion® as substrate
For the samples screen printed upon Nafion® substrates it appeared that the more
water in the formulation, the better the adhesion and integrity of the film printed upon
the Nafion® substrate, up to an optimum low resistance achieved in the formulation
used for series LP04 that used a molar ratio of 1: 0.68 water to 1,2 propanediol. The
ink formulations and specifically the dispersant type, content and ratios are thus
shown to have a significant impact upon the electronic properties of the deposited
film.
The optimum resistance for the paper substrates was achieved with LP05 formulation
containing a molar ratio of 1:0.25 water to 1,2 propanediol, whereas the optimum
resistance for the Nafion® substrate was achieved in sample LP04 nafion, with a
molar ratio of 1: 0.68 of water to 1,2 propanediol, showing how differences in the
composition of the ink formulation could impact upon the electronic nature of the
film, depending upon the substrate used.
The films printed on Nafion® did not generally have the lowest resistance compared
to those printed on the paper substrate, mainly because the films screen printed upon
Nafion® substrates were generally neither homogenous nor very well dispersed, due
to the interaction of the ink with the substrate. This shows the significant impact that

CHAPTER 6 _____________________________________________
240
the interaction of the surface of the substrate with the ink has upon the electrical
characteristics of the film. The effect is postulated to relate to adhesion energy and
interfacial tension. Sample LP06 Nafion showed high resistance for points R41,41
that was anomalous and could indicate poor contact or damage of the film on the
electrode between these points, hence this result is merely shown for comparative
purposes. This sample had been cured at 80º C unlike other Nafion® printed samples
and the Nafion® had also been heat damaged. Curing would not be possible when
printing on Nafion® polymer electrolyte membrane because of its heat sensitivity,
thus formulations that do not require heat curing should be developed.
Spraycoated electrode samples on carbon cloth (as described in Chapter 7) and
carbon nanotube paper samples were tested for comparative purposes. The resistance
of samples 6100300 (Lydall carbon cloth 6100-300) and 6100300 S4 (Lydall carbon
cloth 6100-300 with spraycoated layers of JM Pt40/C namely MEA 65 as is described
further in Chapter 7) were measured using the Hall measurement system. Both these
samples showed an order of magnitude lower resistance than the samples prepared on
paper showing the effect of using a conductive support upon the resistance of the
composite electrode material. The difference in resistance due to the additional
spraycoated ink layer cannot easily be discriminated by resistance measurements
alone when using carbon cloth as substrate. The CNT paper itself had the lowest
resistance of all the substrates tested (49 Ω). Once the Pt was deposited upon the
CNT paper using the galvanic displacement technique the resistance increased to an
average resistance of 81 Ω.
These results show that the film characteristics depended upon the dispersant / water
ratio in the ink mixture and the type of dispersant used, the film layer thickness and
morphology as well as the nature of the substrate. Such large changes in the
resistance of the printed film as was observed in these experiments would have a very
significant impact on the ohmic drop experienced in a working cell, thus all these
factors should be taken into account when formulating a screen printing ink and

CHAPTER 6 _____________________________________________
241
depositing it. Resistance measurements showed some of the electronic properties of
the films.
6.5.2 Results and Discussion: IV Curve Measurement
Since resistance alone does not fully characterize a material, IV measurements and
Hall measurements were taken for the above samples. In this section the IV results of
samples screenprinted on paper and Nafion® as substrate are presented. For
comparative purposes the Lydall carbon cloth blank (6100-300) and the MEA 65
cathode electrode (6100300 S4) prepared by spraycoating layers of ink upon substrate
6100-300 (as is described in Chapter 7) was tested with the Hall measurement system
and results are shown as well where relevant. Furthermore, the results obtained for
CNT paper (as described in Chapter 3) and CNT paper coated with Pt nanoparticles
using the galvanic displacement technique (described in Chapter 4) are also included.
The galvanic displacement technique was used as an alternative and rapid route to
depositing Pt upon the GDL substrate without the need for binders, inks or printing.
A comparison of the IV curve measurements for each sample prepared on paper
substrates are shown in Figures 6.25- 6.30 which depict the voltage obtained under a
variable applied current from -1.0mA to 1 mA in steps of 100 µA.
6.5.2.1 Series LP02
The IV curves of series LP02 are shown in Figure 6.25. Samples LP02-1 and 2 are
not presented due to excessive resistance. At an applied current of -0.001mA a
voltage of >10 was obtained for both LP02-3 and LP02-nafion electrodes and the film
on the Nafion® substrate required a significant higher voltage (-17.7V) to achieve a
current flow of -0.001mA, showing the poor current carrying capacity obtained even
for overprinted films prepared with this ink formulation on the Nafion® substrate.

CHAPTER 6 _____________________________________________
242
-20-15-10-505
101520
-0.001 -0.0005 0 0.0005 0.001
Current (A)
Volta
ge (V
)
LP02-4 LP02-nafion
Figure 6.25 IV curves of series LP02
Although the mass of catalyst deposited upon this series of films prepared on bond
paper using isopropanol as solvent/dispersant was replicable, the films were not
homogeneous or continuous and this can be seen in the high resistance and the high
voltage required, between -18 and -11 V at -1 mA showing low current carrying
capacity.
6.5.2.2 Series LP03
The IV curves of series LP03 are shown in Figure 6.26.
-50-40-30-20-10
01020304050
-0.001 -0.0005 0 0.0005 0.001
Current (A)
Volta
ge (V
)
LP03-1 LP03-2 LP03-3 LP03-nafion
Figure 6.26 IV curves of series LP03
A high voltage requirement was necessary for LP03-1 because of the poor integrity of
the first layer of film deposited which resulted in the poor performance observed
during the linear IV sweep (Figure 6.26). Similar and lower voltage requirements (<

CHAPTER 6 _____________________________________________
243
10 V at applied current of -1 mA) were obtained for both samples LP03-2 and LP03-
3 during the linear IV sweep. Better film integrity was obtained both on the bond
paper with this formulation containing 1,2 propanediol than the previous formulation.
This resulted in less agglomeration during screen printing. The Nafion® based
sample LP03-nafion showed a non–linear IV curve with an increasing voltage
requirement as the sweep progressed from negative values to positive values. This is
atypical of an IV curve of a conducting material, and could relate to the poor structure
of the film prepared on this sample.
6.5.2.3 Series LP04
The IV curves for series LP04 are shown in Figure 6.27
-15
-10
-5
0
5
10
15
-0.001 -0.0005 0 0.0005 0.001
Current (A)
Volta
ge (V
)
LP04-2 LP04-3 LP04-nafion
Figure 6.27 IV curves for series LP04
The curve for sample LP04-1 is not shown as this sample showed high resistance.
The curves for LP04-2 and LP04-3 show the impact of the second overprinted layer
on the electrical properties of the film. A denser film with fewer voids was obtained
after overprinting (3 runs) in the case of LP04-3 which significantly improved the
performance of the film (<-2 V at -1 mA). The Nafion® sample was also overprinted
(3 runs) yet showed an intermediate performance (-5 V at -1 mA), as this ink
formulation did not disperse as well on the Nafion® substrate as on the paper.
6.5.2.4 Series LP05

CHAPTER 6 _____________________________________________
244
The IV curves for series LP05 are shown in Figure 6.28.
-8
-6
-4
-2
0
2
4
6
8
-0.001 -0.0005 0 0.0005 0.001
Current (A)
Volta
ge (V
)
LP05-1 LP05-2 LP05-3
Figure 6.28 IV curves for series LP05 printed on paper
Overprinting in the case of the LP05 series incrementally improved the electrode
performance and LP05-3 showed about -1.5 V at -1 mA, the best performance in the
series of electrodes prepared on a paper substrate.
-10
-5
0
5
10
15
-0.0006 -0.0004 -0.0002 0 0.0002 0.0004 0.0006
Current (A)
Volta
ge (V
)
1,2 2,3 3,4 4,1
Figure 6.29 IV curves for LP05-Nafion The linear IV sweep (Figure 6.29) of each contact set (1,2; 2,3; 3,4; 4,1) in the van
der Pauw configuration of sample LP05-Nafion showed a sigmoidal IV curve
particularly for the contact set 4,1. This film sample printed on Nafion® did not show
perfect surface coverage being non-uniform between contact pair (3,4) and (4,1) thus
causing high resistance for these contact points, yet this sample gave the best

CHAPTER 6 _____________________________________________
245
performance of the Nafion® series of samples. Nonlinearity can be attributed to
defects in contact point number 4.
6.5.2.5 Series LP06
The IV curves for LP06 series are shown in Figure 6.30.
-20
-15
-10
-5
0
5
10
15
20
-0.001 -0.0005 0 0.0005 0.001
Current (A)
Volta
ge (V
)
LP06-1 LP06-2 LP06-nafion
Figure 6.30 IV curves for LP06 series
A comparison of the IV curve measurements (Figure 6.30) for LP06-1 and LP06-2
show that the performance was similar, with similar voltage (<-2 V at -1 mA)
obtained as was the case for LP05-3, whereas the performance of the LP06 nafion
sample was poor, due to poor film integrity as observed by microscopy. Thus there
was no particular benefit apparent in the IV performance by adding an additional
fullerene phase to the ink formulation.
Comparison of IV curves for film samples prepared upon paper substrate is made in
Figure 6.31.

CHAPTER 6 _____________________________________________
246
-15
-10
-5
0
5
10
15
-0.001 -0.0005 0 0.0005 0.001
Current (A)
Volta
ge (V
)
LP02-4
LP03-3
LP04-3
LP05-3
LP06-2
Figure 6.31 Comparison of IV curves for film samples prepared upon paper substrate.
Linear IV curves were obtained for films on a paper substrate, with LP02-4 showing
the highest overvoltage whereas samples LP05-3 and LP06-2 show similarly low
overvoltage. These two samples also had the lowest resistance. Samples LP03-3 and
LP04-3 show an intermediate overvoltage. These results show that the best films
were obtained on paper with the formulations used for LP05 series and LP06 series
and specifically after 3 overprints. These two samples would require the lowest
energy input for a current to flow and there was a linear relationship between current
and voltage for all samples on the paper substrate.
The IV curve measurements for samples prepared on a Nafion® substrate are
compared in Figure 6.32 which depicts the voltage under a variable applied current
from -1.0mA to 1 mA in steps of 100 µA.

CHAPTER 6 _____________________________________________
247
-20
-15
-10
-5
0
5
10
15
20
-0.001 -0.0005 0 0.0005 0.001
Current (A)
Volta
ge (V
)
LP02-nafionLP03-nafionLP04-nafionLP05-nafionLP06-nafion
Figure 6.32 IV curves for samples prepared on a Nafion substrate
The Nafion® substrate samples cluster into two groups, namely the group of LP04-
nafion and LP05-nafion that show a lower overvoltage and thus low potential
requirement for each applied current and the group (LP02-nafion; LP03-nafion;
LP06-nafion) that resulted in significantly higher overvoltage and thus high potential
requirement for the same current input. These three samples also had significant
higher resistances (above 10 kOhm) than the other samples. Interestingly the samples
prepared on the Nafion® substrate in some cases showed a sigmoidal curve during
the IV measurement which indicates that an energy barrier should be overcome
before the current can flow. This was particularly noticeable for sample LP03-nafion
and in this case there was significant agglomeration of the particulates in the ink (see
Figure 6.13) which could indicate non continuous conductive pathways that impede
the flow of current, forcing the current to flow through the Nafion® film.
For comparative purposes the IV curves of Lydall carbon cloth blank (6100-300) and
the MEA 65 cathode electrode prepared by spraycoating layers of catalyst containing
ink upon substrate 6100-300 (6100300 S4) are shown in Figure 6.33. Furthermore,
the IV curves obtained for CNT paper (as described in Chapter 3) and CNT paper

CHAPTER 6 _____________________________________________
248
coated with Pt nanoparticles using the galvanic displacement technique (described in
Chapter 4) are also included.
-0.06
-0.04
-0.02
0
0.02
0.04
0.06
-0.001 -0.0005 0 0.0005 0.001
Current (I)
Pote
ntia
l (V)
6100300S4
6100300
Figure 6.33 IV curves for samples prepared by spraycoating on a carbon cloth substrate
-0.4
-0.3
-0.2
-0.1
0
0.1
0.2
0.3
0.4
-0.001 -0.0005 0 0.0005 0.001
Current (A)
Pote
ntia
l (V)
CNT paper + PtCNT paper
Figure 6.34 IV curves for the CNT paper and CNT paper + Pt
The IV curve (Figure 6.33) of the electrode sample MEA65 (denoted 6100300 S4)
prepared with spraycoating using Nafion® binder and JM Pt40/C is very similar to that
of the carbon cloth substrate (Lydall 6100300) without ink. The resistance
measurements of the two samples did not allow the discrimination of the
characteristics of the film itself separately from the substrate, and neither did the IV
curve, even though much lower overvoltages (Figure 6.33) were recorded for this
electrode compared to those prepared on the paper substrate or on Nafion® as
substrate. The carbon cloth substrate’s conductivity dominated the IV curve. The
performance of CNT paper (-0.1604 V at 1 mA) and CNT paper + Pt (-0.1604 V at 1

CHAPTER 6 _____________________________________________
249
mA) also showed very low potential at the applied currents (Figure 6.34). The carbon
cloth used is slightly more conductive than the CNT paper due to the cross sectional
area of the carbon cloth fibres and the thickness of the carbon cloth.
Based upon the structure of the electrodes, where R1 represents the catalyst
containing film and R2 the substrate upon which the film is printed the equivalent
circuit of an electrode with a film is shown in Figure 6.35
Figure 6.35 Equivalent circuit of printed electrode
It should be considered that 1/Req = 1/R1+ 1/R2 and thus Req = R1R2/R1+R2.
When R1<<R2
R1 becomes negligible and can be neglected in the term R1+R2
Thus Req = R1R2/R1+R2 can be rewritten as Req = R1R2/ R2 and since R2 cancels, the
equation can be written as Req = R1. In the cases where bond paper, with a far greater
resistance than the catalyst containing film, is used as substrate to support the film,
this case exists. Hence the use of the paper substrate for deposition of the film
allowed the detailed electronic characterization of the structure of the screenprinted
film by itself. Whereas in the case where the substrate is of equivalent resistance to
the film the equation Req = R1R2/R1+R2 can be rewritten as Req = R2/2R or Req =R/2.
Thus it becomes difficult to describe the film by itself when a conductive substrate is
used to support the film. Hence the substrate chosen as support for the electro
catalytic film is shown to have a very significant effect on the overall performance of
the electrode and upon its characterization. From these results it can be concluded
that the ink formulation, as well as the ink film thickness and the substrate type
significantly affect the IV relationship and the current density of electrodes prepared
with either screenprinted or spraycoated films containing the electrocatalyst.
V
R1
R2

CHAPTER 6 _____________________________________________
250
6.5.3 Results and Discussion: Variable Field Measurements
6.5.3.1 Sheet resistivity
Sheet resistivity measurements as a function of applied variable magnetic field for the
different series of screen printed electrodes are presented in Figures 6.36- 6.43.
1.00E+00
1.00E+01
1.00E+02
1.00E+03
1.00E+04
1.00E+05
1.00E+06
1.00E+07
1.00E+08
1.00E+09
1.00E+10
1.00E+11
1000 2000 3000 4000 5000 6000 7000 8000 9000 10000
Field (G)
Shee
t res
istiv
ity (o
hm/s
qr c
m)
lp02-4 paper blank nafion blank
Figure 6.36 Sheet resistivity of LP02-4 (3 runs) compared to blank substrates
As expected the blank substrates, Nafion® and bond paper, had high sheet resistances
which were reduced significantly by the deposition of a catalytic film by
screenprinting (LP02-4) upon the paper substrate (Figure 6.36). The sheet resistivity
was orders of magnitudes higher on both of the blank substrate types than on the
samples printed with a film of catalytic ink, showing the significant electronic
pathway provided by the film of catalytic ink, even in the first printing layer (Figure
6.37), which in this sample (LP03-1) was also not very homogeneous.

CHAPTER 6 _____________________________________________
251
1.E+02
1.E+04
1.E+06
1.E+08
1.E+10
1.E+12
0 2000 4000 6000 8000 10000Field [G]
Shee
t Res
istiv
ity [o
hm/s
qr c
m]
paper blank nafion blank lp03-1 lp03-2 lp03-3 lp03-nafion
Figure 6.37 Sheet Resistivity of series LP03
The sheet resistivity of series LP03 (Figure 6.37) decreased for subsequent layers
once the first layer was overprinted (from 24593 to 3941 Ω cm-2). The lowest
resistivity for this series was observed in the case of the sample prepared using
Nafion® as substrate (2158 Ω cm-2). Similar trends are observed in the case of series
LP04 (Figure 6.38). However in series LP04 the first layer (LP04-1) did not give
positive values and is thus not presented.
The ink formulation used for LP05 series (Figure 6.39) showed generally lower sheet
resistivity (584 -2670Ω cm-2) than the formulation applied in LP03 ( 3941-24593 Ω
cm-2) and LP04 series (1257-4360 Ω cm-2).

CHAPTER 6 _____________________________________________
252
1.E+02
1.E+04
1.E+06
1.E+08
1.E+10
1.E+12
0 2000 4000 6000 8000 10000Field [G]
Shee
t Res
istiv
ity [o
hm/s
qr c
m]
paper blank nafion blank lp04-2 lp04-3 lp04-nafion
Figure 6.38 Sheet Resistivity of series LP04
1.E+02
1.E+04
1.E+06
1.E+08
1.E+10
1.E+12
0 1000 2000 3000 4000 5000 6000 7000 8000 9000 10000
Field [G]
Shee
t Res
istiv
ity [o
hm/s
qr c
m]
paper blank nafion blank lp05-1 lp05-2 lp05-3 lp05-nafion
Figure 6.39 Sheet resistivity of series LP05
Each successive overprinting showed a decreasing tendency of the sheet resistivity
which ties in with the degree of electrode surface coverage obtained with this
formulation for each successive overprint layer. It is interesting that the Nafion®
substrate LP05-nafion showed an intermediate sheet resistivity (1101 Ω cm-2) which
relates to the relatively less favourable surface coverage obtained on this substrate
with this ink formulation. Addition of fullerenes (LP06 series) to this formulation
further lowered the sheet resistivity (Figure 6.40), hence the fullerenes are shown to
have a positive impact on sheet resistivity and thus film characteristics.

CHAPTER 6 _____________________________________________
253
1.E+02
1.E+04
1.E+06
1.E+08
1.E+10
1.E+12
0 1000 2000 3000 4000 5000 6000 7000 8000 9000 10000
Field [G]
Shee
t Res
istiv
ity [o
hm/s
qr c
m]
paper blank nafion blank lp06-1 lp06-2 lp06-nafion
Figure 6.40 Sheet resistivity of series LP06
The sheet resistivity of LP06-1 and LP06-2 was about 300 Ω cm-2 and that of the
Nafion® supported sample LP06 nafion about 370 Ω cm-2.
0
0.2
0.4
0.6
0.8
1
1.2
1000 3000 5000 7000 9000
Field (G)
Shee
t res
istiv
ity (O
hm/s
qr)
6100300 S4
6100300
Figure 6.41 Sheet resistivity of sample prepared on carbon cloth (Lydall 6100-300)
The sheet resistivity (Figure 6.41) of the electrode sample (6100300 S4; MEA65)
prepared by spraycoating the typical isopropanol ink formulation upon the Lydall
carbon cloth substrate (6100 300) was much lower than samples prepared on
Nafion® or paper substrates and lower than the carbon cloth substrate by itself (0.67

CHAPTER 6 _____________________________________________
254
vs 0.99 Ω cm-2). This result illustrates that the Hall sheet resistivity measurement is
able to discriminate the change in sheet resistivity due to the film of electrocatalyst
deposited upon the carbon cloth during spraycoating, whereas neither resistance
measurement or IV measurements could distinguish the difference. The sheet
resistivity of CNT paper compared to the Pt containing CNT paper prepared by
galvanic displacement is shown in Figure 6.42.
00.5
11.5
22.5
3
3.54
4.55
1000 2000 3000 4000 5000 6000 7000 8000 9000 10000
Field (G)
Shee
t Res
istiv
ity [o
hms/
sqr]
CNTpaper + PtCNT paper
Figure 6.42 Sheet resistivity of CNT paper compared to CNT paper + Pt
The sheet resistivity of CNT paper was 0.35 Ω cm-1 compared to CNT paper + Pt
which was 3.75 Ω cm-1 thus a small increase in sheet resistivity was observed when
the Pt was incorporated in the CNT paper. The use of a highly electroconductive
substrate thus had a significant effect upon lowering the overall sheet resistivity. The
applied magnetic field did not cause significant fluctuations in the sheet resistivity for
any samples, but the carbon cloth and CNT substrates showed the lowest fluctuations
in overall sheet resistivity under the applied field overall.
6.5.3.2 Sheet carrier density
Sheet carrier density as a function of magnetic flux for each series of screen printed
electrodes is presented in Figures 6.43- 6.50.

CHAPTER 6 _____________________________________________
255
1.00E+04
1.00E+07
1.00E+10
1.00E+13
1.00E+16
1.00E+19
1000 3000 5000 7000 9000
Field (G)
Shee
t car
rier d
ensi
ty (1
/cm
2)
lp02-4 paper blank nafion blank
Figure 6.43 Sheet carrier density of LP02-4 (3 runs)
The sheet carrier density for the blank bond paper and Nafion® substrates are low
and were significantly improved by even the poorest film (LP02-4) screenprinted
upon the paper.
1.E+02
1.E+04
1.E+06
1.E+08
1.E+10
1.E+12
1.E+14
1.E+16
1.E+18
0 2000 4000 6000 8000 10000
Field [G]
Shee
t Car
rier D
ensi
ty [1
/cm
2]
paper blank nafion blank lp03-1 lp03-2 lp03-3 lp03-nafion
Figure 6.44 Sheet Carrier Density of Series LP03 The sheet carrier density was significantly improved by the films of catalytic ink
applied in series LP03. The first printed layer was inhomogeneous and its carrier
density is lower than the samples that were overprinted (LP03-2 and LP03-3). The
poor surface coverage obtained in the case of the sample backed with Nafion®
substrate is visible by the lower sheet carrier density obtained in this case.

CHAPTER 6 _____________________________________________
256
1.E+06
1.E+08
1.E+10
1.E+12
1.E+14
1.E+16
1.E+18
1.E+20
0 2000 4000 6000 8000 10000Field [G]
Shee
t Car
rier D
ensi
ty [1
/cm
2]
paper blank nafion blank lp04-1 lp04-2 lp04-3 lp04-nafion
Figure 6.45 Sheet Carrier Density of Series LP04
Sheet carrier density of electrodes improved with each successive overprint on
samples with a paper substrate in series LP04. The formulation of ink used to print
series LP04 resulted in a higher carrier density than was the case in the LP03 series.
Once again the sample prepared with a Nafion® substrate showed an intermediate
sheet carrier density. This can be explained by the relative inhomogeneity of the
Nafion® printed films.
The sheet carrier density of all paper backed electrode samples prepared in Series
LP05 (Figure 6.46) showed an improved sheet carrier density compared to the
previous series once again showing the effect of the ink formulation upon the
dispersion and homogeneity of the film on this substrate. However, this formulation
did not result in an exceptional sheet carrier density for the electrode prepared using
Nafion substrate, and results showed that the formulation for Nafion® substrates may
require further optimization.

CHAPTER 6 _____________________________________________
257
1.E+041.E+061.E+081.E+101.E+121.E+141.E+161.E+181.E+20
0 2000 4000 6000 8000 10000Field [G]
Shee
t Car
rier D
ensi
ty
[1/c
m2]
paper blank nafion blank lp05-1 lp05-2 lp05-3 lp05
Figure 6.46 Sheet Carrier Density of Series LP05
Lower results were observed when fullerenes were added to this formulation printed
on Nafion® thus the addition of an additional conductive phase to the ink did not
improve the sheet carrier density (Figure 6.47).
1.E+021.E+041.E+061.E+081.E+101.E+121.E+141.E+161.E+181.E+20
0 2000 4000 6000 8000 10000
Field [G]
Shee
t Car
rier D
ensi
ty[1
/cm
2]
paper blank nafion blank lp06-1 lp06-2 lp06-nafion
Figure 6.47 Sheet Carrier Density for Series LP06
The sheet carrier density was relatively independent of the applied magnetic field as
no significant deviation was observed, for samples prepared on paper and on
Nafion® substrates. However this was not the case where carbon cloth was used as
substrate (Figure 6.48), where a significant fluctuation can be observed above 6000
G.

CHAPTER 6 _____________________________________________
258
1E+16
1E+17
1E+18
1E+19
1E+20
1E+21
1000 3000 5000 7000 9000
Field (G)
Shee
t Car
rier D
ensi
ty (1
/cm
2)
6100300 S4
6100300
Figure 6.48 Sheet carrier density of sample prepared using carbon cloth as substrate
The sheet carrier density of the electrode sample (6100300 S4; MEA 65) prepared by
spraycoating a film of electrocatalyst on Lydall carbon cloth (6100 300) was in the
same order of magnitude as samples of film prepared by screenprinting on paper.
This measurement did not discriminate the separate contribution of the film as
opposed to the substrate itself in the case of the conductive carbon substrate which
was also the case in the CNT paper and CNT + Pt samples (Figure 6.49).
1.E+16
1.E+17
1.E+18
1.E+19
1.E+20
1000 2000 3000 4000 5000 6000 7000 8000 9000 10000
Field (G)
She
et C
arrie
r Den
sity
[1/c
m2]
CNT paper + Pt
CNT paper
Figure 6.49 Sheet carrier density for CNT paper and CNT paper + Pt
In the case of the CNT paper and Pt containing CNT paper shown in Figure 6.49, the
sheet carrier density was generally similar and of the same order of magnitude as the
carbon cloth samples and paper samples thus neither of the conductive substrates

CHAPTER 6 _____________________________________________
259
made a significant difference to the sheet carrier density characteristics overall. An
anomalous fluctuation was observed in the case of the CNT+Pt sample during the
application of the magnetic field and this may be due to instability caused by
mechanical movement or displacement of the Pt particles relative to the CNT under
the applied magnetic field. The galvanic displacement method deposited not only Pt
but other metals from the sacrificial anode, the presence of which metals may have
caused a magnetic interaction. These results show that the hall measurement system
accurately determined sheet carrier density for the films supported on paper, and that
the film consisting of the Pt electrocatalyst and Nafion®, by itself functioned as main
carrier, whereas when carbon cloth or CNT was used as substrate the substrate also
acted as carrier.
6.5.3.3 Sheet Hall Coefficients
The average Sheet Hall Coefficients of the film samples are tabulated in Table 6.7
and the dominant carrier is shown for each case. As the Sheet Hall Coefficient is
reduced and values approach zero or become negative the sheet becomes more
electro-conductive.

CHAPTER 6 _____________________________________________
260
Table 6.7 Average Sheet Hall Coefficient (cm² C-1)
Sample Average Sheet Hall
Coeficient [cm² C-1]
Dominant carrier
Bond paper blank 2.76E+09 p
Nafion blank 2.50E+08 p
LP03-1 326000 P
LP03-2 52.1 P
LP03-3 1020 P
LP04-1 72400 P
LP04-2 157 P
LP04-3 5.7 P
LP04-nafion 11200 P
LP05-1 66.5 P
LP05-2 -66.9 N
LP05-3 -84.5 N
LP05-nafion 724000 P
LP06-1 -14 N
LP06-2 8.22 P
LP06-nafion -5370000 N
6100300 -3.24 N
6100300 S4 -3.29 N
CNT paper -1.383 N
CNT paper + Pt 1.372 P
Table 6.7 shows that generally as film characteristics improved on the paper
substrates the positive Sheet Hall Coefficient was lower and conductivity became
dominated by n-type carriers (electrons) whereas when film integrity was not good,
p-type carriers (holes or positive ions) dominated the conductivity. It appears that p
type carriers dominate when the main connection is the Nafion® binder soaking the
paper between catalyst agglomerates, whereas the n –type dominate where good
connectivity between catalyst particles was found.
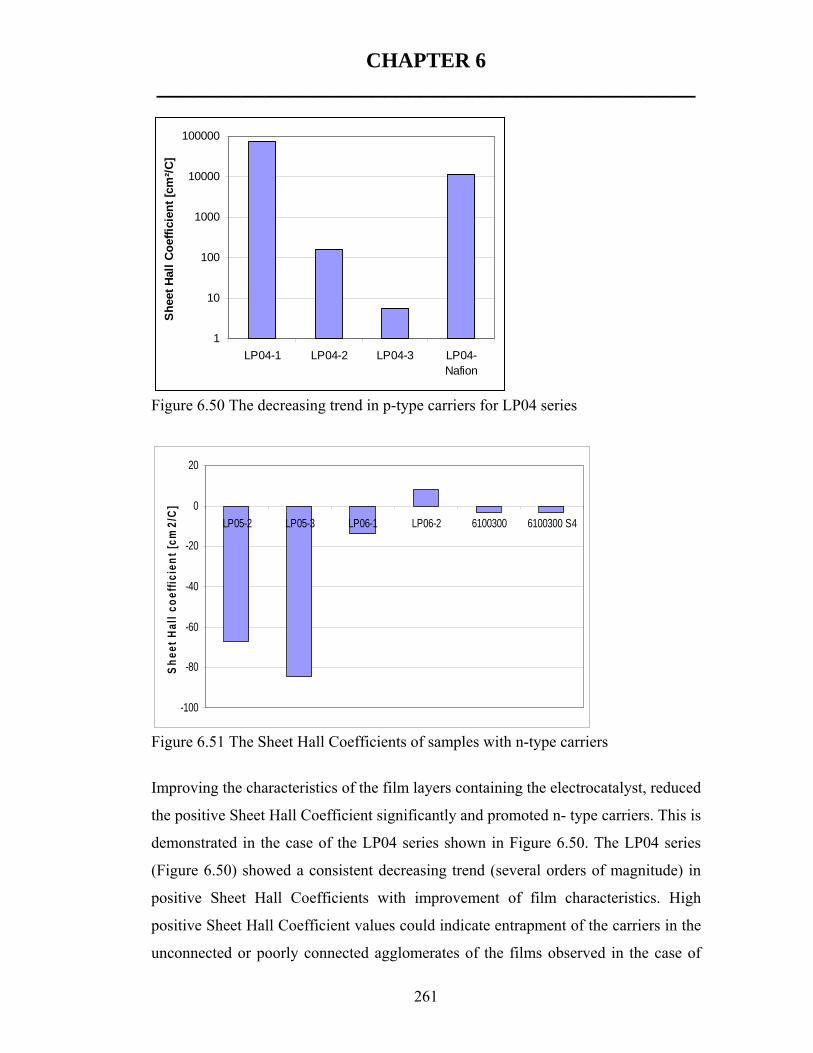
CHAPTER 6 _____________________________________________
261
1
10
100
1000
10000
100000
LP04-1 LP04-2 LP04-3 LP04-Nafion
She
et H
all C
oeffi
cien
t [cm
²/C]
Figure 6.50 The decreasing trend in p-type carriers for LP04 series
-100
-80
-60
-40
-20
0
20
LP05-2 LP05-3 LP06-1 LP06-2 6100300 6100300 S4
She
et H
all c
oeffi
cien
t [cm
2/C]
Figure 6.51 The Sheet Hall Coefficients of samples with n-type carriers
Improving the characteristics of the film layers containing the electrocatalyst, reduced
the positive Sheet Hall Coefficient significantly and promoted n- type carriers. This is
demonstrated in the case of the LP04 series shown in Figure 6.50. The LP04 series
(Figure 6.50) showed a consistent decreasing trend (several orders of magnitude) in
positive Sheet Hall Coefficients with improvement of film characteristics. High
positive Sheet Hall Coefficient values could indicate entrapment of the carriers in the
unconnected or poorly connected agglomerates of the films observed in the case of

CHAPTER 6 _____________________________________________
262
LP04-1 and -2 respectively. The paper supported samples (LP05 and LP06) with the
best film characteristics upon visual inspection in terms of good dispersion and
homogeneity as well as in terms of IV, sheet resistance etc, were predominantly n-
type carriers as is shown in Figure 6.51. Some samples switched from p- type carriers
to n – type carriers with improving film characteristics, notably series LP05. It is not
clear why this switch should be observed in series LP06 as these films, containing
fullerenes were well connected and homogeneous overall.
The CNT paper sample switched from n- to p-type carrier upon deposition of the Pt,
indicating that electron conduction changed to hole conduction upon deposition of the
Pt. This is a unique result and should be further investigated. It is possible that Pt
becomes a site for carrier recombination, thus the Pt may capture the charge carriers
and build up a charge as it can easily take up the charge but cannot transfer it further
via a chemical reaction due to the lack of reactant in the experimental system. This
may be indicative of quantum confinement of carriers in the nanoparticles of Pt
dispersed upon the CNT (Oncel et al., 2005).
The carrier densities of Nafion® based samples should not be compared directly to
that of the best samples prepared on the paper substrate which generally were
dominated by n-type (electron) carriers because of the different characteristics of the
proton conducting substrate. It is not clear whether the physical carrier is a positive
charge in the case of Nafion® substrate samples thus the carriers may be holes or
protons. The carrier types for the Nafion® substrate based samples (Table 6.7) were
p-type carriers except in the case of LP06-nafion which was dominated by n-type
carriers. This difference may be due to the addition of the conductive phase of
fullerenes that was added to this sample and should be further investigated. The
addition of a conductive phase to films printed upon the Nafion® substrate may thus
enhance the electron charge transfer. The Nafion® samples’ sheet carrier density
(Section 6.5.3.2) appears lower than the paper substrate samples because they mostly
had p-type carriers, which are less mobile than electrons.

CHAPTER 6 _____________________________________________
263
N-type carriers , which are normally found in metallic conductors, allow the transfer
and flow of electrons. In the cases where p-type carriers dominated it may be that the
electron flows were impeded due to lack of connectivity between catalyst particles.
Adequate connectivity between catalyst particles or agglomerates would be required
for a percolation pathway threshold. An optimum distribution and density is required
for continuous electronic contact.
6.5.3.4 Hall Mobility
Hall mobility as a function of magnetic flux for each series of screen printed
electrodes is presented in Figures 6.52- 6.57.
0.001
0.01
0.1
1
10
100
1000
10000
1000 2000 3000 4000 5000 6000 7000 8000 9000 10000
Field (G)
Hal
l mob
ility
(cm
2/VS
)
LP02-4 nafion blank paper blank
Figure 6.52 Hall mobility of LP02-4 (3 runs)
0.001
0.1
10
1000
100000
0 1000 2000 3000 4000 5000 6000 7000 8000 9000 10000
Field [G]
Hal
l Mob
ility
[cm
2/(V
/S)]
paper blank nafion blank lp03-1 lp03-2 lp03-3 lp03-nafion
Figure 6.53 Hall Mobility of Series LP03

CHAPTER 6 _____________________________________________
264
0.0001
0.001
0.01
0.1
1
10
100
1000
10000
0 2000 4000 6000 8000 10000
Field [G]
Hal
l Mob
ility
[cm
2/(V
S)]
paper blank nafion blank lp04-1 lp04-2 lp04-3 lp04-nafion
Figure 6.54 Hall Mobility of Series LP04
0.001
0.01
0.1
1
10
100
1000
10000
0 1000 2000 3000 4000 5000 6000 7000 8000 9000 10000
Field [G]
Hal
l Mob
ility
[cm
2/(V
S)]
paper blank nafion blank lp05-1 lp05-2 lp05-3 lp05-nafion
Figure 6.55 Hall Mobility of Series LP05

CHAPTER 6 _____________________________________________
265
0.001
0.01
0.1
1
10
100
1000
10000
0 2000 4000 6000 8000 10000
Field [G]
Hal
l Mob
ility
[cm
2/(V
S)]
paper blank nafion blank lp06-1 lp06-2 lp06-nafion
Figure 6.56 Hall Mobility of Series LP06
Hall mobility indicates the possible pathways for the charge carriers to move and
gives an indication of the length of the carrier pathway before recombination in the
case of holes. The hall mobility (Figures 6.52- 6.57) was significantly affected by the
substrate type and Nafion® as substrate caused significant hall mobility whereas the
hall mobility was orders of magnitude lower for paper and paper based electrodes.
The lowest hall mobility was observed in the case of the LP06 series which had the
fullerenes added as additional component to the ink formulation. The hall mobility
did not correlate well with film thickness and overprinting did not result in a
significant difference in hall mobility. In fact the blank substrates showed the greatest
hall mobility compared to the respective printed electrodes, which indicates that the
hall mobility is a function of the substrate characteristics, which dominated the effect.
Fluctuations in the hall mobility were observed under the applied magnetic field but
this was variable and did not correlate directly or inversely to the applied field. The
mobility of carriers was independent of film thickness.
6.5.3.5 The effect of Nafion substrate
The hall mobility, sheet resistivity and sheet carrier density for electrodes on
Nafion® substrate are presented in Figures 6.57- 6.59.

CHAPTER 6 _____________________________________________
266
1
10
100
1000
10000
0 2000 4000 6000 8000 10000
Field [G]
Hal
l Mob
ility
[cm
2/(V
S)]
nafion blank lp03-nafion lp04-nafionlp05-nafion lp06-nafion lp02-nafion
Figure 6.57 Comparison of Hall mobility of samples screenprinted on Nafion® substrate
The Hall mobility of samples was independent of film layer thickness but was
dominated by the substrate in the case of Nafion® supported electrodes, except in the
case of the LP04-nafion that showed low hall mobility. This sample was also the
Nafion® – based sample with the highest sheet carrier density and lowest sheet
resistivity.
100
1000
10000
100000
1000000
10000000
0 2000 4000 6000 8000 10000
Field [G]
Shee
t Res
istiv
ity [o
hm/s
qr]
nafion blank lp02-nafion lp06-nafionlp03-nafion lp04-nafion lp05-nafion
Figure 6.58 Comparison of sheet resistivity of samples screenprinted on Nafion® substrate
The Nafion® supported electrodes generally had similar sheet resistivity (Figure
6.58) despite the different ink formulations that were applied, except in the case of

CHAPTER 6 _____________________________________________
267
LP02-nafion and the ink formulation which had fullerenes added, in which case the
sheet resistivity was increased significantly.
1.E+071.E+081.E+091.E+101.E+111.E+121.E+131.E+141.E+151.E+16
0 1000 2000 3000 4000 5000 6000 7000 8000 9000 10000
Field [G]Sh
eet C
arrie
r Den
sity
[1
/cm
2]
nafion blank lp03-nafion lp04-nafion lp05-nafionlp06-nafion lp02-nafion
Figure 6.59 Sheet carrier density of samples screenprinted on Nafion® substrate compared
Differences were observed in sheet carrier density of samples screenprinted on
Nafion® (Figure 6.59). The sheet carrier density of the ink formulation used in series
LP04, when printed on Nafion® substrate, resulted in the highest sheet carrier
density, followed by that of the formulation used in series LP05, whereas the sheet
carrier density for the formulation used for LP02-nafion was the lowest. These results
indicate that the composition of the ink formulation and thus the relative ratio of the
solvents used, had a discernible impact upon the functionality of the resultant
Nafion® supported electrode, because of the film morphology.
6.5.3.6 The Hall mobility of conductive substrates

CHAPTER 6 _____________________________________________
268
0
2
4
6
8
10
12
14
16
1000 3000 5000 7000 9000
Field (G)
Hall
Mob
ility
[cm
2/(V
S)]
6100300 S46100300
Figure 6.60 Hall mobility of Carbon cloth based samples
0
5
10
15
20
25
30
35
40
0 2000 4000 6000 8000 10000 12000
Field (G)
Hal
l mob
ility
[cm
2/(V
S)] CNT paper +Pt
CNT paper
Figure 6.61 Hall mobility of CNT based samples
The Hall mobility of the CNT based electrode samples (Figure 6.61) were in the same
order of magnitude as those of the carbon cloth samples (Figure 6.60) and the Hall
mobility of both these series was between one and two orders of magnitude higher
than the films supported on the paper substrates, but generally lower than those
samples prepared on the Nafion® substrate. It is interesting to observe that deposition
of Pt upon CNT reduced the overall hall mobility, which once again may indicate the
role of Pt as a recombination site and supports the possibility of quantum
confinement of charge carriers by Pt nanoparticles (Oncel et al., 2005).

CHAPTER 6 _____________________________________________
269
6.6 RHEOLOGICAL CHARACTERISTICS OF INKS
Screen printing of inks used in this study was performed at high shear rate of about
2000 reciprocal seconds, with a short contact period between ink and substrate. To
correlate rheology with the application it is interesting to measure viscosity at high
shear rates. On the other hand, the yield stress related to final printing quality is
measured at very low shear rates.
Viscosity of a liquid is a measure of its resistance to flow, and this is measured in N s
m-2 (SI Units) or poise (P) or centipoise (cP). The viscosity of water depends on
temperature. At 20 °C the viscosity of water is 1.002 cP (1 P = 0.1 N s m-2 ; 1 cP =
0.001 N s m-2). Its viscosity decreases as the temperature increases. The viscosity of
Propylene glycol (1,2 propanediol) is 0.581 cP at 20 °C, (Cyberspace Chemistry,
2008).
In Newtonian fluids, the stress is linearly proportional to the strain rate. Non-
Newtonian fluids have a non-linear response to the strain rate and the relationship
between stress and strain depends on time, thus their viscosity is not constant but
dependant on shear rate. Their effective stiffness depends on the rate of application of
the load. Viscoelastic substances lose energy when a load is applied, then removed.
Viscoelastic materials have an elastic component and a viscous component and
viscoelasticity is due to a molecular rearrangement (Viscoelasticity, 2008). In the
case of viscoelastic material hysteresis is seen in the stress-strain curve and stress
relaxation occurs.
The viscosity in the printing stage should not be too low but at the same time it
should not be too high. Too low a viscosity can cause penetration of ink into the
substrate giving a 'blurred' impression. Too high a viscosity causes flow instabilities
during printing, which can result in uneven printing as well as bad coverage. The
effects of solvent type and solids loading on yield stress and viscosity was determined

CHAPTER 6 _____________________________________________
270
for the ink formulations used in screen printing catalytic particles upon various
substrates. The following results show the effect of different formulations on the
rheological behaviour of the ink. From the shear stress versus shear rate curve, the
yield stress can be obtained which determines the processability and storage stability
of the ink sample.
Samples LP0 1 and LP0 10 were compared at the same liquid to solid (L:S) ratio with
different solvents (isopropanol vs 1,2 propanediol respectively) to understand the
effect of changing the solvent on the rheology of the ink. Ink sample LP0 5 was
compared with LP0 11 to understand the effect of changing the L:S ratio (6:1 vs
14:1). LP0 10 and LP0 11 were compared to understand the effect of the solvent to
water ratio (5:1 vs 1:1 respectively). These two samples were prepared for the
rheological experiments but were not used during screenprinting. A standard Pt
printing ink (Pt ink for ceramic substrates; stock# 43653; supplied by Alpha Aesar)
was compared for reference. The viscosity of the inks was compared (Figure 6.62).
0.001
0.01
0.1
1
10
100
Pa·s
η
1
10
0.1 1 10 100 1,0001/s
Shear Rate γ.
ETA, TAU log/log
Platinum ink (standard) 1
CP 50-4; d=0.05 mm
η Viscosity
LPO 1
CP 50-4; d=0.05 mm
η Viscosity
LPO 4 second tes t (more sample) 1
CP 50-4; d=0.05 mm
η Viscosity
LPO 11
CP 50-4; d=0.05 mm
η Viscosity
LPO 5
CP 50-4; d=0.05 mm
η Viscosity
Figure 6.62 Viscosity of screenprinting formulations compared to a standard Pt ink

CHAPTER 6 _____________________________________________
271
In Figure 6.62 a comparison of the shear stress (τ) vs shear rate (γ) curves of ink
samples is presented.
Figure 6.63 Comparison of the shear stress (τ) vs shear rate (γ) curves of ink samples
A very low viscosity (Figure 6.62) was observed in the case of LP0 1, containing the
solvent isopropanol. Replacing the solvent isopropanol (LP0 1) with 1,2-propanediol
(LP0 10) increased both the viscosity and the apparent yield stress of the ink at the
same solids loading, improving the structure of the ink. Changing the solvent to
water ratio for the same solvent (1,2 propanediol) had no effect on the viscosity (LP0
10 compared with LP0 11 in Figure 6.3). Increasing the solids loading (LP0 5
compared with LP0 11) increased the viscosity (Table 6.8 and Figure 6.2) and the
yield stress (Figure 6.3) of the ink indicating an improvement in the structural
strength of the ink compared to the formulation containing isopropanol. This was
also confirmed by the higher values obtained for the elastic modulus (Figure 6.64)
which shows the viscoelastic behaviour of these two inks with the elastic modulus
(G') as a function of shear stress (τ).

CHAPTER 6 _____________________________________________
272
10-1
10 0
10 1
10 2
10 3
Pa
G'
100
101
0.001 0.01 0.1 1 100Pa
LPO 11 CP 50-4; d=0.05 mm
G' Storage Modulus
LPO 5 CP 50-4; d=0.05 mm
G' Storage Modulus
Figure 6.64 Viscoelastic behaviour of inks: elastic modulus (G') as a function of shear stress (τ)
The longer linear viscoelastic region for LP0 5 extends to higher shear stresses (2 Pa)
than LP0 11 (0.3 Pa), indicating a more homogeneous structure. LP0 5 with a higher
solid loading but the same solvent had a higher level of structure than LP0 11,
indicated by the higher values obtained for the elastic modulus (Figure 6.64). A more
finely dispersed system resulted in a longer linear viscoelastic region which was
observed in the case of LP0 11.
A higher degree of viscoelasticity will produce a better printing quality. Greater
interaction between the particles gives a higher viscosity and viscoelasticity.
Indications of these interactions could be observed at low frequencies, by monitoring
the elastic modulus. The level of structure is directly proportional to the elastic
modulus, G' (Chhabra & Richardson, 1999). For non-agglomerated ink samples, the
elastic modulus would be lower indicating less strength in the interactions but when a
higher value of the critical strain is observed, this would show that the ink sample
was more homogeneous and therefore more stable. Agglomeration is indicated by an
increase in elastic modulus, G', and a decrease in the critical strain. High
agglomeration leads to bad printing quality. Therefore, for non-agglomerated
samples, the elastic modulus would be lower indicating less strength in the

CHAPTER 6 _____________________________________________
273
interactions but when a higher value of the critical strain is observed, it shows that the
sample is more homogeneous and therefore more stable. LP05 had a higher degree of
viscoelasticity as well as a higher value of critical strain showing this formulation’s
homogeneity as well as stability.
Plotting the elastic (or storage) modulus (G') as a function of shear stress (Pa) (Figure
6.65) showed that for the samples made with the same L:S ratio but different type of
solvents (LP0 1 and LP0 11), G' is the same, but G'' (loss modulus) is quite different.
In Figure 6.65 the storage modulus (G') is plotted vs strain (x-axis) and G'' (secondary
y axis) for ink samples LP0 1 and LP0 11 in which the solvent : water ratio varied
between 5:1 and 1:1 respectively at a L:S ratio of 14. LP0 4 and LP05 are included
for comparison as these inks gave the best print quality.
10 -1
10 0
10 1
10 2
10 3
Pa
G'
10-1
100
101
102
103
Pa
G''
0.01 0.1 1 10 1,000%Strain γ
LPO 1
CP 50-4; d=0.05 mm
G' Storage Modulus
G'' Loss Modulus
LPO 4
CP 50-4; d=0.05 mm
G' Storage Modulus
G'' Loss Modulus
LPO 11 1
CP 50-4; d=0.05 mm
G' Storage Modulus
G'' Loss Modulus
LPO 5
CP 50-4; d=0.05 mm
G' Storage Modulus
G'' Loss Modulus
Figure 6.65 Storage modulus (G') plotted vs strain for ink samples LP0 1 and LP0 11

CHAPTER 6 _____________________________________________
274
The loss modulus G'' is plotted on the secondary y axis. As G' was higher than G'' in
all cases, the elastic behaviour dominated the viscous behaviour. The crossover points
between G' and G'' for each of the different formulations are shown in Table 6.8 and
the viscosity in Table 6.8 and Figure 6.65.
Table 6.8 Viscoelastic crossover points (G' vs G'') and viscosity of ink formulatons
Ink formulation G' (y-axis) Strain (x-axis) Viscosity (η at 0.1γ)
Viscosity (η at 100γ)
LP0 1 3.9 6.4 1.2 0.01 LP0 4 84.7 3.2 100 0.13 LP0 5 224 1.6 100 0.15 LP0 11 3.9 13.0 10 0.08 Standard reference Pt ink
~10 (by extrapolation
0.12
The storage modulus (G') for LP0 4 and LP0 5 was 84.7 and 224 respectively (Figure
6.65) whereas that of the isopropanol based ink LP0 1 had a storage modulus of only
3.9. Energy losing materials display irreversible behaviour. LP0 1 had the lowest
overall viscosity and a low G'. This may be why, after this ink was sheared during
screen printing, it flowed outside the printed area. On the other hand the inks
containing 1,2 propanediol (LP0 4, LP0 5 and LP0 11) showed higher viscosity and
shear dependant and reversible storage behaviour visible by the reversible inflections
in G'' curves and thus were quite elastic, indicating a breaking of the agglomerated
structure under shear and then a reagglomeration of the particles when the shear is
removed. G'' is a function of the deformation energy used up in the sample during the
shearing process. This energy is either lost to the sample afterwards by changing the
structure of the sample permanently or is dissipated as heat (Mezger in Zorll, 2002).
The storage modulus is also a measure of the energy stored in the shearing process
and when the shear force is removed this energy is available as a driving force
causing re-agglomeration of particles.
Hence structural decomposition after shearing (thixotrophy) was observed for the ink
prepared using isopropanol (LP0 1) whereas structural regeneration (rheopexy) was
observed for the ink formulations containing 1,2 propanediol (LP0 4, LP0 5 and LP0

CHAPTER 6 _____________________________________________
275
11). It is also noteworthy that a difference in G' exists between the formulation used
for LP0 4 and LP0 5. LP0 4 formulation was more suitable for printing on Nafion®
whereas LP0 5 formulation gave the best coverage on paper substrates.
A high yield stress as well as viscoelasticity which is correlated with high solids
content in sample LP05 is preferable for inks, as the higher solids content creates a
more structured material which will result in precise, quality printing. The higher
solids content provides higher structural strength and therefore the plateau of the
amplitude sweep dependence continues to higher stresses for this sample.
The difference in the G'' values (at the same G' value) can be understood if one bears
in mind that G' is related to the solid phase and G'' to viscosity of a liquid phase.
Therefore by changing the solvent the G'' values could be controlled. For practical
application, viscosity (and G'') should be low enough for high fluidity of inks but still
high enough for the printed layer to be stable on a substrate (higher yield stress that
correlated with G').
The optimum ink formulation had a ratio of between 3 - 1 : 1 of 1,2
propanediol:water, a liquid: solid ratio of between 6-8:1 and a storage modulus (G')
of between 84 and 224. Reversible viscoelastic behaviour of inks correlated with
good print quality. Rheological determination of ink formulations is thus
demonstrated to give good predictive information of the printability of an ink upon
paper, but formulations would require further optimization depending upon the
surface energy of the substrate type chosen.
6.7 CONCLUSIONS
Screen printing a nanophase containing catalytic ink is shown to be reproducible.
Each electrode of 1cm2 increased by approximately 0.001 -0.0015 g with each
successive overprinted layer using the screenprinting technique as a means to directly

CHAPTER 6 _____________________________________________
276
and rapidly deposit a catalytic ink upon a substrate. Accurately depositing a specified
amount of electrocatalyst per unit area of substrate in a uniform, homogeneous and
well dispersed manner required optimization of the ink formulation. Homogeneity
was dependent upon the substrate type as well as the ink formulation. Significant take
off effects were observed especially on circular designs of electrodes whereas the
square design electrode prints were of more consistent quality.
Different ink formulations were suitable for printing upon specific substrates but ink
formulations suited for spray coating were not suitable for screen printing. The
volatility of the solvent determined the ease with which the ink could be repeatedly
overprinted. Low viscosity of isopropanol based inks during screenprinting causing
bleeding and agglomeration and also caused too rapid drying of ink in between
successive print runs. In this study variation of the solvent played the major role in
ink viscosity. Substitution of isopropanol with 1,2 propanediol resulted in an
improvement of viscosity, which was tailored by increasing the amount of water and
solids in the formulation. The surface tension of the substrate played a role in the
degree of uptake of the ink upon the substrate.
The optimum ink formulation had a ratio of between 2.9 -1.0 : 1 of 1,2 propanediol to
water as solvent. These ink formulations were more appropriate for printing on
Nafion® substrates and less agglomeration was observed because of the higher water
content and resulted in better catalyst/binder dispersions even for the first layer
printed, as well as better deposition on the Nafion® substrate. The samples that were
printed on paper showed a good correlation between each successive overprinted
layer thickness and lowered resistance. The first printed layer was typically high in
resistance, the next overprinted layer reduced the resistance of the electrode and the
third overprinted layer caused the electrode resistance to reduce even further.
Addition of fullerenes did not apparently affect the resistance significantly.
As the change in the dispersant ratio in the formulation relates mainly to modifying
the polarity and surface tension of the mixture incrementally, with an increased water

CHAPTER 6 _____________________________________________
277
content rendering the solution more polar, it is likely that molecular interactions were
improved between the ink formulation used and the paper substrate surface because
of liquid/solid surface interactions increasing.
Variable Field Hall measurement showed that the film characteristics depended upon
the solvent used as well as the printed layer thickness and the nature of the substrate.
The sheet resistivity was orders of magnitudes higher on both of the blank substrate
types than on the samples printed with a film of catalytic ink, showing the significant
carrier pathway provided by the film of catalytic ink, even in the first printing layer,
even though that was generally not very homogeneous. Each successive overprinting
showed a decreasing tendency of the sheet resistivity which correlated with the
degree of electrode surface coverage. The use of an electro-conductive substrate had
a significant effect upon lowering the sheet resistivity. The substrate chosen as
support for the electrocatalytic film was shown to have a very significant effect on the
overall performance of the electrode. The difference in resistance observed could not
be ascribed to catalyst loading only but also to the print quality and the conductive
pathway created by adjoining clusters of printed electrocatalyst, which was affected
strongly by the ink formulation. Hence, no matter how active the electrocatalyst, if
the deposition of the film on the substrate is substandard, electro activity will be low.
Films screen printed upon Nafion® substrates were generally neither homogenous
nor very well dispersed, due to the interaction of the ink with the substrate. This
shows the significant impact that the interaction of the surface of the substrate with
the ink has upon the electrical characteristics of the film. The effect is postulated to
relate to adhesion energy and interfacial tension (Hartland, 2004; Pourdeyhimi et al.,
2007; Britton et al, 2007).
The hall mobility did not correlate well with film thickness and overprinting did not
result in a significant difference in hall mobility. In fact the blank substrates showed
the greatest hall mobility compared to the respective printed electrodes, which
indicates that the hall mobility is a function of the substrate sheet resistivity, which
dominated the hall mobility. The ink formulation used in series LP04, when printed

CHAPTER 6 _____________________________________________
278
on Nafion® substrate, resulted in the highest sheet carrier density, followed by that of
the formulation used in series LP05. The addition of a conductive phase to films
printed upon the Nafion® substrate may enhance the electron charge transfer
significantly. These results indicated that the composition of the ink formulation and
the relative ratio of the solvents used, had a discernible impact upon the functionality
of the resultant Nafion® supported electrode, because of the film morphology.
Generally, as film characteristics improved on the paper substrates, the Sheet Hall
Coefficient was lower and conductivity became dominated by n-type carriers
(electrons) whereas when film integrity was not good, p-type carriers (holes)
dominated. Improving the characteristics of the film layers containing the
electrocatalyst, reduced the positive Sheet Hall Coefficient significantly and
promoted n-type carriers.
Rheological determination of ink formulations gave good predictive information of
the printability of an ink upon paper. Increasing the solids loading and changing the
solvent increased the viscosity, and the storage modulus (G') of between 84 and 224
and viscoelastic behaviour of inks correlated with good print quality. Formulations
would require further optimization depending upon the surface energy of the
substrate type chosen.
This study demonstrated that the film characteristics depended upon the dispersant /
water ratio in the ink mixture and the type of dispersant used, the film layer thickness
and morphology of the film formed as well as the nature of the substrate. Such large
changes in the characteristics of the printed film as was observed in this study would
have a very significant impact on the ohmic drop experienced in a working cell, thus
all these factors should be taken into account when formulating and optimizing a
screen printing ink and depositing it upon a substrate.

CHAPTER 7 _____________________________________________
279
7. MEMBRANE ELECTRODE ASSEMBLIES FOR SPE ELECTROLYZERS
In this chapter the technological optimization of a solid polymer electrolyzer is
studied using commercial materials.
7.1 INTRODUCTION
In about 1929 Bacon built a demonstration fuel cell consisting of porous nickel
electrodes and is credited with creating a stable three phase reaction zone of
electrode, gas, and electrolyte. In 1957 Grubb reported that the liquid electrolyte in a
gas diffusion electrode (GDE) could be replaced by a solid, ionically conductive
polymer to form electrode-electrolyte assemblies consisting of porous electrodes and
ionically conductive polymers. These electrode assemblies that incorporate a gas-
liquid-solid interface into the electrode element using a solid polymer electrolyte
thus eliminate the liquid electrolyte and can be applied in various electrochemical
processes. The electrolytic production of pure hydrogen and oxygen is possible
through a solid polymer electrolyte assembly where an ion-exchange membrane such
as DuPont's Nafion® is the electrolyte. These assemblies are called either membrane
electrode assemblies (MEA), or solid-polymer electrolyte (SPE), or proton exchange
membrane (PEM) which terms refer to the use of an ionically conducting membrane
as an integral element in a device (De Castro, 1996).
Water electrolysis in a SPE cell possesses certain advantages compared with the
classical alkaline process such as increased energy efficiency and specific production
capacity and a simple system with a solid electrolyte operating at a low temperature.
The cell resistance of the SPE system including the MEA can be as low as 0.075
Ohm in ultra pure water. On the other hand the relatively high resistance (about 0.2
Ohm) for alkaline systems limits the output of alkaline cells to about 1A cm-2, since

CHAPTER 7 _____________________________________________
280
above this current density the ohmic drop becomes high. The specific energy
consumption of the SPE electrolyzer has been reported as 4.1 kWh Nm-3 - H2 at 1 x
104 Am-2 which is better than the typical specific energy consumption of 5 kWh Nm-3
-H2 for an alkaline electrolyzer (Kondoh et al., 2000). A commercial system analysed
by Ivy et al., (2004) had a system efficiency of 73%.
This study is limited to the optimization of the SPE electrolyzer MEA using
commercial benchmark electrocatalysts. Requirements were investigated for
membrane electrode assemblies for SPE systems and prototype SPE electrolyzer
operation including the selection of components and optimizing the system. In this
chapter the choice of components, as well as the working conditions of the MEA
were explored. Choices were made of substrates and supports that could be used as
gas diffusion layers for the anode and the cathode. Furthermore, different anode and
cathode catalysts were investigated which were processed in the form of micro-
emulsions using the most suitable binders and applied to the gas diffusion layers or
alternatively to the polymer electrolyte membranes. Conditions were evaluated to
assemble the MEA and form the composite electrodes. The operational issues of a
working module such as temperature, flow rate, moisturization, gas evolution, and
insulation were also examined. Impediments for durability and stability and issues of
reproducibility were addressed for scaleability and modularization.
7.2 OVERVIEW OF SPE ELECTROLYZER SYSTEMS
General Electric Co. developed the first electrolyzers using polymer membranes as
electrolyte in 1966 for space applications (Davenport et al., 1991). Extensive
research and development on solid polymer electrolyte (SPE) or otherwise named
polymer electrolyte membrane (PEM) electrolyzers has been performed over the last
several decades. The company ABB developed the commercial Membrel electrolyzer
in the period 1976/1989 (Stucki and Scherer, 1998). Two units of 100 kW were
tested over the longer term with an average voltage 1.75 V at 1 A cm-2 and 80 °C.
Within the Japanese WE-NET program a cell voltage of 1.68 V at 1 A cm-2 was

CHAPTER 7 _____________________________________________
281
obtained on a single cell of 50 cm2 at 80 °C. The goal of the WE-NET programme is
to construct a worldwide energy network for effective supply, transportation and
utilization of renewable energy using hydrogen (Mitsugi et al., 1998).
A schematic of a typical membrane electrode assembly for an electrolyzer is shown
in Figure 7.1.
Figure 7.1 Schematic of membrane electrode assembly for the SPE electrolyzer
The main working components of the membrane electrode assembly (MEA) are (i)
the gas diffusion layers, and (ii) the catalytic layers, which are layered on both sides
of the (iii) polymer electrolyte membrane. This assembly is clamped and sealed
between the current collectors serving as anode and cathode that are connected to an
external circuit, across which a working potential is applied to polarize the
electrodes. Ultra pure water is typically fed only to the anode side as reactant and
also serves to remove the O2 evolving during electrolysis. Water can be fed on the
cathodic side to keep the MEA evenly moisturized and to act as a medium to remove
the H2 gas that evolves during electrolysis and prevent its build-up. A schematic
comparison of the fuel cell and the electrolyzer functionality is presented in Figure
7.2.
H+
H+
H+
H+
O2/H2O
H2O
H2
H+
H+
H+
H+
O2/H2O
H2O
H2
Anode Cathode Gas outlet Gas diffusion layers Current collector Catalyst layers Polymer electrolyte membrane Gaskets

CHAPTER 7 _____________________________________________
282
Figure 7.2 Schematic representation of PEM water electrolyzer and a fuel cell
(Barbir, 2005)
It is possible to reverse the direction of the electrolyzer and allow it to operate in fuel
cell mode periodically, utilizing the H2 prepared during electrolysis as fuel. Such
systems are termed unitized regenerative fuel cells (URFC). However the efficiency
of both processes is reduced in regenerative systems because of the different
optimized requirements for the fuel cell reactions versus those of the electrolyzer.
Liu et al., (2004) describe a composite electrode assembly incorporating the proton
exchange membrane for unitized regenerative fuel cells (URFCs) with an improved
cycle life. In this system the cell works in electrolysis mode for one cycle and then
by reversing the polarity, operates in fuel cell mode in the next cycle. The cycle life
and polarization curves for both fuel cell and electrolysis modes of URFC operation
were investigated with a new electrode with a composite structure and performance
was found to be constant over 25 cycles, demonstrating that this dual system has
potential.
7.2.1 Electrocatalysts
In the assembly of the SPE (or PEM) system it is firstly required that the correct
choice of catalyst is made for the reaction occurring on the anode versus the reaction
that takes place on the cathode. The electrocatalyst must be an electrical conductor in

CHAPTER 7 _____________________________________________
283
addition to being an active catalyst. This restricts the choice of catalysts mainly to
metals. The catalyst may be distributed in the bulk of substrate grains or at their
external surface (Chirkov and Rostokin, 2005). An extensive review of scientific
knowledge on this topic is reported by Wiesener et al., (1990). The catalysts can be
used as bulk powders, or as admixtures, to which graphite powders are added in
order to increase the transversal electric conductivity within the layer and decrease
the amount of catalyst used. Catalysts may also be supported on a conductive
material free of catalytic activity, e.g. carbons optionally graphitised in part, like
those commercialised by Cabot Corporation under the trademark Vulcan XC-72 or
Shawinigan Acetylene Black. Vulcan XC-72 is reported to have a surface area of
250m2 g-1 (Vielstich et al., 2003). Typically the catalysts sold by various commercial
suppliers such as Johnson Matthey may contain 10 to 50 % of the precious metal
catalyst dispersed on the conductive support. Such materials are disclosed, with the
relevant fabrication methods, in the patent literature, e.g. in United States Patents
4,614,575 (Juda et al., 1986) and 5,584,976 (Nishiki et al., 1996). Carbon nanotubes
have been used to stabilize high Pt dispersions, and increase the electronic
conductivity of the electrodes and also improve the gas transport rate through the
electrodes reactive layers. Scodelaro et al., (2005) demonstrated that high loadings
(20-30 wt %) of Pt with high dispersions (Pt nanoparticle sizes as low as 1-2 nm)
could be obtained upon CNTs. Commercial catalysts are sold with even higher
loadings of Pt.
Platinum based, bimetallic and ternary electrocatalysts have been well described in
the literature. Pt is used because of its stability and because it is a hydrogen
absorbing metal which is capable of electro-chemically absorbing and desorbing
hydrogen. Platinum is well known to be the best catalyst for water electrolysis due to
its moderate strength of adsorption of the reaction intermediates. It has the lowest
over-voltage of all metals. Ultra-fine Pt particles can either be deposited on the
electrode support i.e. the gas diffusion layer, or directly onto the polymer electrolyte
membrane (Millet et al., 1988).

CHAPTER 7 _____________________________________________
284
The oxygen electrode (anode) is the main source of overpotential in the water
electrolysis process using the SPE system. The low activation loss on the cathode
electrode where hydrogen is produced is usually neglected. There are few electrode
materials that resist both dissolution and the formation of obstructive films when
anodically polarised. For example, in contact with the acidic Nafion® membrane
non-noble catalytic metals like Ni and Co will corrode and Pt will be covered by a
low conducting oxide film. Henry B. Beer obtained a patent on dimensionally stable
anodes (DSA) in 1965, and oxides of Ir and Ru have typically been used as anode
catalysts on titanium substrates in DSA (Rasten et al., 2003). Various attempts to
change the catalyst type have been made. For instance, Andolfatto et al., (1994)
found that the performance and long-term stability of a water electrolysis pilot plant
could be enhanced when IrO2/Ti electrodes were hot-pressed on both sides of a
Nafion® membrane in comparison with Pt electrodes, and they obtained lower anodic
overvoltages and a better long-term stability of the cell voltage due to a lower
sensitivity to poisoning.
The theory of the process mechanisms at the oxygen evolution electrode is less well
understood than for hydrogen evolution reactions because of the difficulties
introduced by the participation of the anode material itself in the electrode process.
The most probably discharge step involves the formation of oxygen atoms lightly
adsorbed on a metal already covered with strongly bound oxygen atoms:
Discharge
MO + OH → MO – O + H+ +2e (7.1)
Where MO – O represents an oxygen atom lightly adsorbed on an oxidized surface
of the metal M. The discharge of hydrogen ions is believed to occur in two possible
desorption steps that lead to the formation of the molecular product, in this case,
oxygen. The first step is
Combination
2MO – O → 2MO + O2 (7.2)

CHAPTER 7 _____________________________________________
285
This is followed by a secondary step with the secondary discharge of a hydroxyl ion
and the desorption of a lightly adsorbed oxygen atom (Potter (1970).
2º discharge
2MO – O + OH- → 2MO + O2 + H+ + 2e- (7.3)
Generally the heterogeneous reaction rate taking place at the electrodes surface is
described in units of mol per unit area by equation 4.1 (Chapter 4).
The rate of the electrode reaction O + ne-↔R depends on various surface effects in
addition to the usual kinetics variables. The reaction is thus composed of various
steps to convert the dissolved oxidized species to the reduced form (Yaritsa, 2004).
The electron transfer has to proceed at a reasonable rate and produce an efficient
quantity of product, thus if an anodic catalyst’s activity is poor a significant amount
of applied voltage would be required. Minimizing the activation overpotential
requires maximizing the catalyst area available for the reaction. The chemical
processes that contribute to the activation loss involve the adsorption of reactant
species, transfer of electrons across the double layer of an electrolyzer, desorption of
a product species, and the nature of the electrode surface (Bard and Faulkner, 2001).
Yim et al., (2005) prepared bifunctional electrocatalysts for the oxygen electrode that
were tested on the URFC performance including both fuel cell and water electrolysis
in a single cell URFC system. The Pt black catalyst performance in fuel cell mode
was higher than bi or trimetallic catalysts whereas in water electrolysis mode the
performance of PtIr was better than Pt black. Overall the PtIr combination catalyst
showed the best URFC performance. As the Ir or IrO2 content in the anode catalyst
was increased the fuel cell performance decreased while the water electrolysis
performance was significantly improved. The catalyst content was optimized at 1.0
mg cm-2 of Pt black as hydrogen electrode and 2.0 mg cm-2 of PtIr (99:1) as oxygen
electrode. In binary mixtures such as IrO2 +SnO2, the activity during oxygen
evolution was enhanced as the proportion of IrO2 increased in the mixture (Kawar et

CHAPTER 7 _____________________________________________
286
al., 2003). IrO2 is known for its high chemical stability, high mechanical strength,
superior oxidation resistance and high electrical conductivity, however it is a
somewhat less active electrocatalyst than RuO2 for oxygen evolution although it is
less susceptible to corrosion than RuO2. The metal oxides of IrO2 or RuO2 are
normally mixed with inert components like Ta2O5, TiO2 or SnO2. The metal oxides
are preferred to the metal only because the metal catalysts are unstable (Musiani et
al., 1999).
Such studies highlighted the performance of Pt as multifunctional catalyst for the
URFC system and the benefits of Ir catalysts for the anode in electrolyzer systems
(Ioroi et al., 2000; 2002). Chen et al., (2001) looked at combinations of the following
elements (Pt, Ru, Os, Ir, and Rh) and found that the ternary catalyst comprised of
PtRuIr, with atomic ratios of 4.5:4:0.5 respectively, was the best performing oxygen
reduction catalyst for URFC. The addition of Ru to the Pt/Ir electrode helped to
increase the reaction rate because it stabilized surface atom/oxygen bonds. Anode
catalysts based on platinum-ruthenium and platinum-molybdenum alloys have been
developed by Johnson Matthey (Platinum Metals Review - Volume 46 Number 3
(July 2002)). The use of IrO2 still permits electron conduction to take place. Trassati
et al., (1991; 2000) suggested that the oxide layer resistivity is related to the
intergrain region and that conductivity takes place by hopping mechanisms from
grain to grain.
Transition metal oxides, like IrO2 constitute an interesting class of materials because
of various properties they exhibit. Their characteristics have been found to depend
strongly on the kind of preparation techniques and conditions (Mousty et al., 1999).
In studies of its electroactivity by cyclic voltammetry (da Silva et al., 1997; Mousty
et al., 1999), the main feature of Ir was the presence of the reversible peaks (at about
0.9V) which are generally attributed to the redox process Ir(III) to Ir(IV),
corresponding to the formation of IrO(OH)2. Ir(IV) may be further oxidised at higher
potential to a final oxidation state of Ir(VI). This final redox state was achieved (at

CHAPTER 7 _____________________________________________
287
about 1.3V), and it has been proposed to correspond to Ir(IV)/Ir(VI). During the
anodic sweep equation 7.4 takes place:
IrO3 + 2e- + 2H+ ↔ IrO(OH)2 (7.4)
This reaction becomes competitive to the oxygen evolution reaction:
IrO3 + H2O → IrO(OH)2 + 1/2O2 (7.5)
Andolfatto et al., (1994) did durability studies for membrane electrode assembly
(MEA) with IrO2 catalysts supported on titanium fibre in both electrodes. The
durability was found to be nearly 6000 h at standard conditions, 2.2 V cell voltage
and with a current density output of 500 mA cm-2. The relatively low performance
reported may be due to the low catalyst loading used, which was 2.4 - 3 mg cm-2.
Based on the stability obtained by Andofaltto et al., IrO2 can be an interesting
catalyst for both anode and cathode for further research.
The effects of catalyst preparation and dispersion on activity are among the major
issues that still need to be addressed for improving cell performance and so that an
optimum compromise is achieved between performance and cost. A significant
ohmic, activation and transport loss is attributable to the dispersion of the metal
oxide catalyst on a conductive support. Good contact between the electrocatalyst and
the support is essential in order to minimize the ohmic losses and contact between
the electrocatalyst and electrolyte is a necessity for proton transport to the
electrocatalyst particles. The electrolyte, which is in contact with the active layer of
the supported electrocatalyst upon the GDL of the electrode, also has to be
continuous up to the interface of the active layer with the polymer electrolyte
membrane layer to minimise ohmic loss. The overall catalytic performance is
affected by the catalyst layer and therefore it is important to achieve the optimum
catalyst loading on the GDL in contact with the polymer, which should provide ionic
pathways for protons and low resistance to proton transport. Only catalysts in contact
with the polymer electrolyte as well as the reactant are electrochemically active. The
catalyst particles should also be electrochemically connected to the external circuit.

CHAPTER 7 _____________________________________________
288
Thus catalysts in the electrode structure should not be buried in the bulk of the
support (Lee et al., 1998; Wang et al., 2001).
Moreover, the electrode kinetics, electrolyte mass transfer, ionic and electronic
conductivity also determine the electric potential and current distribution in the
three-dimensional electrode structure and ultimately affect the catalytic activity.
7.2.2 Choice of gas diffusion layers
A gas diffusion electrode (GDE) is constructed by forming an asymmetric electrode
from a porous substrate layer called a gas diffusion layer (GDL) that contains or
supports a super-fine particle catalyst layer. The GDL connects the current collector
via its gas-liquid permeable layer to the electrode substrate. Various configurations
of GDL are, for instance, foams with open cells, matted felts consisting in entangled
fibres, or planar meshes formed by layers of crossed and overlaid or interwoven
fibres. The challenge in preparing the gas diffusion electrode is to have a durable
and high surface area gas- liquid permeable layer, that is simultaneously electro
conducting and of the right texture to support the catalyst layer. The mass transport
characteristics of a GDL are defined by the morphology and characteristics of the
material, such as its pore size distribution, interconnectivity and hydrophilicity
(Kramer et al., 2008). Many patents have been granted for the development of GDE
that are applicable to electrolyzers or fuel cells (e.g. United States Patent 5618392
(Furuya, 1997); United States Patent 6444602 (DeMarinis et al., 2002); United States
Patent 5733430 (Ashida et al., 1998); United States Patent 6361666 (Lipinski and
Leuschner, 2002)). According to the patent literature, improving gas, liquid and
vapour transport through the electrode can be achieved by regulating the porosity of
the GDL, reformulating the applied ink containing the electrocatalyst, and creating a
film coating structure of the ink on a conductive matrix.

CHAPTER 7 _____________________________________________
289
In some studies hydrophobic PTFE is applied to inhibit aqueous solutions from
penetrating the electrode structure whereas the typically used carbon black catalyst
support can be wetted by the electrolyte (De Castro, 1996). Direct electrochemistry
on a gaseous species is limited by the gas-liquid solubility, but the solution layer acts
as a thin meniscus which is able to achieve high gas flux rates. The high surface area
that is inherent in most GDEs forming part of the MEA may allow an order of
magnitude amplification of current compared to what may be achieved on an
equivalent geometric area.
Hayashi and Furuya (2004) describe the preparation of gas diffusion electrodes by
electrophoretic deposition of precipitates deposited from carbon-
polytetrafluoroethylene dispersions. Pt was then incorporated as catalyst and in
alkaline solution the gas diffusion electrode promoted oxygen reduction and
hydrogen oxidation in an H2-O2 fuel cell. Morimoto et al., (2000) describe gas
diffusion electrodes made of electro conductive porous polytetrafluoroethylene
(PTFE) sheets supporting Pt catalysts that were applied as the oxygen reduction
cathodes for chlor-alkali electrolysis. These authors also report the oxidative
corrosion of the carbon carrier.
GDEs using ionically conductive polymer electrolytes require improved electrode
structures, and the void volume percentage, average pore diameter size, and electrode
thickness should be taken into account. Good wettability of GDL surfaces may
promote complete occupation of the void spaces in the electrodes by the liquid
reactant water which is desired in electrolyzers but not beneficial to fuel cell systems.
The release of the gas bubbles from the reaction liquid in which they are formed,
gives rise to difficulties such as anodic and cathodic pressure variations that may be
harmful for the ion-exchange membranes, or partial blocking of the electrodes under
the action of the adhering bubbles causing increased ohmic drop, as the electric
conductivity is decreased by the presence of gas. The gaseous product normally
causes a gas film layer at the electrode surface that constitutes a resistance to flow.
This can be minimized by rapidly removal of the electrode gases by either employing

CHAPTER 7 _____________________________________________
290
a thinner gas diffusion layer (GDL), a special type of flow field plate or changing
water flow rate (Reiger, 1994; Bockris, 1973; Koryta et al., 1993; Hamman et al.,
1998; Crow, 1994). Furthermore, combining these changes with an optimized
coating methodology may allow the production of GDEs in an automated way.
7.2.3 Ionomer content in electrodes
Proton conductive polymers play varied roles within the MEA as they must create a
durable and robust binder or structure for catalyst retention that must adhere well to
the membrane-electrolyte or GDL, and enhance ion exchange or proton conduction
capacity of the electrode. The polymer ionomer content in the electrodes
simultaneously affects the activity of a catalyst and also the ionic resistance,
therefore the optimum ionomer content in the catalyst layer is necessary for good
performance. Normally ionomer loading as wt % is calculated as a dry weight of
ionomer divided by the total dry weight of a catalyst and ionomer and multiplied by
100. Many studies have reported the effect of ionomer content, with differing
optimum contents recommended by different researchers. Lee et al., (1998) showed
that the Nafion loading correlated with the activation polarization characteristics
which showed increased activity up to a loading of 1.3 mg cm-2 followed by a more
gradual change with maxima at 1.9 mg cm-2 which trend was found to correlate well
with the decrease in charge transfer resistance and increase in the electrochemically
active surface area. Ioroi et al., (2002) reported that the amount of Nafion added as
binder to the catalyst layer and proton conductor should be in the range of 7-9 % by
weight. Other studies confirmed that the catalyst is more active at an ionomer content
ranging from 30 – 40 dry wt %. In porous gas diffusion systems with polymer
electrolytes the electrode is often coated with a solution of the solid electrolyte and
aliphatic alcohol to increase the catalytically active area in contact with the ionomer
and to achieve penetration of the polymer electrolyte into the electrode (Wöhr et al.,
1996; Ioroi et al., 2003).

CHAPTER 7 _____________________________________________
291
7.2.4 Choice of solid polymer electrolyte membrane
In polymer electrolyte membrane (PEM) form, the polymer should be impermeable
to gas whilst being simultaneously able to take up and retain moisture and enable ion
conductance in order to be a suitable separator of the anodic and cathodic
compartments of a working SPE cell. The behaviour of the membrane is closely
linked to its structure. The fixed anions in the pores of the ionomer, which are filled
with water, exert an electrostatic influence on the ions of the electrolyte so that a
diffuse double layer is formed in the pores. The ion-exchange properties proceed
under the flow of electric current across the membrane. The membrane must remain
hydrated in order to be proton conductive. The requirement to keep the membrane
hydrated restricts the operation of the cell to temperatures under the boiling point of
water (Robbins, 1972).
Intense studies have been carried out in recent years on the synthesis of new proton
conducting membranes, which may play the role of a solid electrolyte in SPE
systems such as electrolyzers and fuel cells. The classical methods include the
synthesis of polyelectrolytes comprising SO3H groups (e.g. poly perfluorosulfonated
acids and sulfonated polysulfines). In these membrane there is a hydrophobic region
containing the fluorocarbon backbone and a hydrophilic region containing the
sulphonate sites, the protons and the water of hydration. The solid polymer
electrolyte typically consists of a chemically altered solid fluoropolymer containing
sulphonic acid groups, SO3H, which release their hydrogen as positively-charged
protons:
SO3H → SO3- + H+
These charged forms promote water penetration into the membrane structure but
exclude the product gases, molecular hydrogen and oxygen. The resulting hydrated
proton, H3O+, is free to move whereas the sulphonate ion is part of the backbone of
fluorocarbon comprising the repeating structural unit of the ionomer. Proton
conduction through the membrane proceeds via the protons from the anode entering
the membrane, becoming solvated by water molecules and thus giving rise to H3O+

CHAPTER 7 _____________________________________________
292
ions which move through the hydrated regions to the cathode. The phenomenon of
the proton transport via the water molecules is called ‘Electro-osmosis’ (Koryta,
1986; Okada et al., 1998). Formation of a Zundel cation, H5O2+ from combination of
the ‘proton hole’, H2O and a nearby hydronium ion, H3O+ has also been reported
(Eikerling et al., 2003). In water electrolysis the hydrated protons are attracted to the
negatively-charged electrode (cathode) when an electric field is applied across the
membrane and thus the membrane acts as a proton conductor (Greenwinds, 2002).
A typical example of this material is the perfluorinated sulfonic acid polymers such
as Nafion® that can be obtained from the E. I. Dupont De Nemours and Company. It
is available as thin pre-formed membranes in thicknesses of about 100 µm, or as a 5
% solution which may be deposited and evaporated to leave a polymer layer.
Nafion® has some limitations due to high cost and lack of thermal stability in high
temperature applications and is problematic in fuel cell assemblies because of
methanol crossover (Liao et al., 2002a; 2004), which was not a problem in the
electrolysis system being investigated.
The proton conductivity of Nafion® membrane materials is complex, being favoured
by a high level of hydration and dependent on the pre-treatment, operating
temperature and operational conditions. The structure of the Nafion® membrane is
shown in Figure 7.3. The values of n, x and m can be varied to produce the material
of equivalent weight (EW), where EW is the number of grams of the polymer per
mole of fixed sulphonate sites.
Figure 7.3 General structure of a Nafion® membrane
[(CF2CF2) n CFCF2] x
(OCF2CF) m OCF2CF2SO3H
CF3

CHAPTER 7 _____________________________________________
293
According to Sone et al., (1996) the membrane conductivity without heat-treatment
was ca. 7.8 × 10⁻² S cm–1 at ambient temperature and 100 % relative humidity and
varied strongly with the humidity and heat-treatment of the membrane. Slade et al.,
(2002) demonstrated that Nafion® 112 exhibited the best performance compared to
other available Nafion® membranes such as 117, 115 and 113. These membranes all
have the same equivalent weight (EW), 1100, but their proton conductivity is
different as well as the film diameter thickness of 175, 125, 87, and 50 μm
respectively for the different Nafion® membranes 117,115,113, and 112.
Many attempts have been made to improve the PEM. For instance, Gore-Textile
Associates developed Gore-SelectTM composites by impregnating Nafion® solution
in highly porous polytetrafluoroethylene (PTFE) films (Bahar et al., 1997). Zhang et
al., (2006) found that doped sulfonated poly(phthalazinone ether ketone) (SPPEK)
membrane showed higher water uptake and proton conductivity than pure SPPEK
membranes. Thus composite membranes can be an alternative solution, in which
inorganic acids are immobilized in polymeric matrices characterized by strong basic
properties (e.g. H3PO4 / polybenzimidazole system). Suitable proton conductive
polymers include those in U.S. Patent 7052805 (Narang et al., 2006), describing a
polymer with acidic subunits, another polymer with basic subunits, and an
elastomeric polymer with elastomeric subunits. U.S. Patent 5,783,325 (1998), UK
Patent 2,316,802 (1999) and U.S. Patent 6,103,414 (2000) by Cabasso describe a
polymer solution made of thermoplastic film former, e.g., polysulfone and
polyvinylidene fluoride, mixed with carbon and a common solvent (DMF and NMP)
and cast as asymmetric flat sheet electrodes on glass to control the gas-diffusion
pores, and the electrode-catalyst-membrane interface. A substantial reduction of the
catalyst in the MEA was claimed, and less than 0.1 mg cm-2 was shown to produce
high performance MEA.
There are many efforts reported in the literature to enhance or replace the Nafion
based membrane (Linkov et al., 2002; Liao et al., 2002 b; Vaivars et al., 2004;

CHAPTER 7 _____________________________________________
294
Alonso and Turrillas, 2005). However, since developing the polymer electrolyte
membrane was not the focus of this study such efforts are not further reviewed. This
study mainly considered the effect of different film thicknesses of Nafion® or
commercial substitutes for this material, and assembly conditions, upon overall cell
performance.
7.2.5 Assembly of the Membrane Electrode Assembly
The various components specified above were used to assemble the membrane
electrode assembly (MEA). Chinese GEFC®- MEA made by Golden Energy Fuel
Cell Co., Ltd. (Beijing) is an example of a commercially available ready to use MEA
for the reversible H2 PEM cell and is also used as the proton exchange membrane
(PEM) in the direct methanol fuel cell (DMFC). It is a catalyst coated membrane
MEA along with two separate high efficiency gas diffusion layers trademarked as
GEFC®-GDL. According to the suppliers’ technical notes it consists of proprietary
GEFC®-11N (N=1~20 mil) perfluorinated PEM coated with a bi-network electrode
on either side of the PEM, where the bi-network electrode is interconnectively
composed of the catalyst network coated with thin perfluorinated proton exchange
film and electrolyte network coated with thick perfluorinated proton exchange film.
The technical index given by the supplier states that the reversible H2 MEA is
configured as a Pt-PEM-Pt MEA with 2.5 mg Pt cm-2 and 2.5 mg Pt cm-2 on the
anode and cathode side respectively and is specified to have a maximum power
density of between 0.3 and 0.6 W cm-2 (at 30 °C, 0.0 MPa dry H2/Air & O2
respectively). This technical description gives the characteristics of typical assembly
conditions for the MEA.
There are various approaches to preparing and assembling the components of the
MEA used in a SPE electrolyzer. After a choice is made of the specific components
for the anode or the cathode side of the MEA, the components have to be assembled
together. Firstly the chosen catalyst has to be deposited on the polymer electrolyte or

CHAPTER 7 _____________________________________________
295
onto the GDL using an appropriate binder and deposition technique for the anode
and cathode respectively. Typically an ink is prepared containing the catalyst. A
basic method for preparation of a catalyst ink composed of the ion conducting
copolymer (usually 5% polymer by weight) dispersed in a diluent, the catalyst
particles, and additives to ease processing is described by Shin et al., (2002). The
catalyst can be incorporated into the MEA using various techniques including: i)
coating of catalyst ink on the GDL, ii) coating of the catalyst ink directly upon the
proton-exchange membrane and iii) using transfer decals to apply catalyst ink over
the membrane by hotpressing.
Thereafter the asymmetric cathode and anode electrodes have to be bonded to the
solid polymer electrolyte membrane. Yamaguchi et al., (1995) describe a hot-press
method in which a catalyst film is adhered to the polymer membrane by means of hot
pressing to create the three-dimensional electrode membrane interface. In their study
the catalyst was introduced into a PTFE solution and a film containing the catalyst
was formed and dried where after the catalyst film was heat treated and then
laminated on the ion-exchange membrane followed by the hot-pressing stage.
The Handbook of Fuel cells (Vielstich et al., 2003) describes various approaches for
the preparation of the MEA. For instance, the catalytic paste could be prepared by
ball milling a solution of the ionomer used as binder and proton conductor with the
electrocatalyst in an alcoholic solution until the carbon showed a uniform size
distribution (Tada in Vielstich et al., 2003). The paste was then printed onto a
prepared gas diffusion layer (GDL) and was dried at 100 °C for 3 h and then hot
pressed at 130 °C for 1 min at 20 kg cm-2. The process could be repeated until the
required catalyst loading was obtained. It was observed that the higher the ionomer
content of the ink paste, the lower the pore volume of the carbon black support. The
ionomer was used in the ink paste to obtain sufficient proton conductivity and
catalyst utilization in the catalyst layer, as well as binder to ensure durability of the
electrode. The oxygen diffusion was inhibited through the catalyst layer when the
pore volume was decreased because of the addition of ionomer. The amount of

CHAPTER 7 _____________________________________________
296
ionomer per gram of carbon black depended on the pore volume of the support and
amounts of 0.2 - 0.4 g of ionomer per gram of carbon black was recommended by
these authors.
The amount of catalyst and Nafion in the ink deposited on the GDL plays a major
role in the activity of the MEA. Ioroi et al., (2002) showed that the Nafion content in
the electrode affected the water electrolysis performance and 7–9 wt.% Nafion
showed good performance. A typical Pt loading on electrodes was 0.25 mg cm-2,
which was dependent on the cell voltage applied. These authors found that the
utilization of the anode catalysts was effective only in a thin segment of the catalyst
layer because of a gradient of electrochemical potential caused by limited electronic
conductance of the catalyst layer. It has also been demonstrated that higher catalyst
loading and thinner layers gave better overall results (Vielstich et al., 2003).
Millet et al., (1990; 1993) describe a procedure for the preparation of the SPE
electrocatalyst in which noble metal cationic species were chemically reduced
directly on both surfaces of a perfluorinated ion-exchange membrane by chemical
reduction of cationic precursor salts. They found that the metallic particles were not
homogeneously distributed across the SPE thickness but predominated near its
surfaces. The electrodes were then bonded onto the SPE. Low noble metal loadings
(< 1 mg cm-2) and a low cell voltage of 1.75 V at 1 A cm-2 at 80 degree ºC and long
time stability (over 15,000 h of continuous electrolysis) were reported.
7.2.5 Challenges in the enhancement of MEA output
It is not a simple process to optimize a MEA because of the multitude of variables
that play a role in the overall output of the electrolyzer cell. It is difficult to compare
the overpotentials of electrodes that are disclosed in various patents and articles
mentioned in this review because each system uses different electrolytes and
different temperatures and not all procedures are specified for SPE electrolyzers but
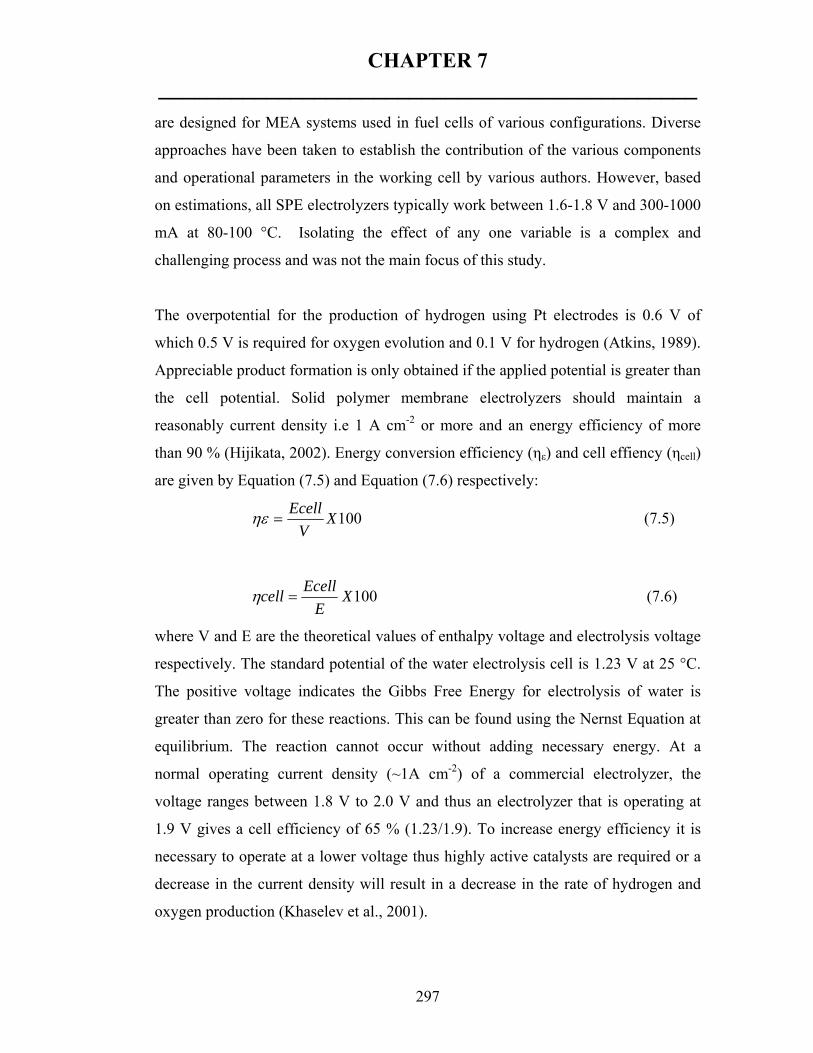
CHAPTER 7 _____________________________________________
297
are designed for MEA systems used in fuel cells of various configurations. Diverse
approaches have been taken to establish the contribution of the various components
and operational parameters in the working cell by various authors. However, based
on estimations, all SPE electrolyzers typically work between 1.6-1.8 V and 300-1000
mA at 80-100 °C. Isolating the effect of any one variable is a complex and
challenging process and was not the main focus of this study.
The overpotential for the production of hydrogen using Pt electrodes is 0.6 V of
which 0.5 V is required for oxygen evolution and 0.1 V for hydrogen (Atkins, 1989).
Appreciable product formation is only obtained if the applied potential is greater than
the cell potential. Solid polymer membrane electrolyzers should maintain a
reasonably current density i.e 1 A cm-2 or more and an energy efficiency of more
than 90 % (Hijikata, 2002). Energy conversion efficiency (ηε) and cell effiency (ηcell)
are given by Equation (7.5) and Equation (7.6) respectively:
100XV
Ecell=ηε (7.5)
100XE
Ecellcell =η (7.6)
where V and E are the theoretical values of enthalpy voltage and electrolysis voltage
respectively. The standard potential of the water electrolysis cell is 1.23 V at 25 °C.
The positive voltage indicates the Gibbs Free Energy for electrolysis of water is
greater than zero for these reactions. This can be found using the Nernst Equation at
equilibrium. The reaction cannot occur without adding necessary energy. At a
normal operating current density (~1A cm-2) of a commercial electrolyzer, the
voltage ranges between 1.8 V to 2.0 V and thus an electrolyzer that is operating at
1.9 V gives a cell efficiency of 65 % (1.23/1.9). To increase energy efficiency it is
necessary to operate at a lower voltage thus highly active catalysts are required or a
decrease in the current density will result in a decrease in the rate of hydrogen and
oxygen production (Khaselev et al., 2001).

CHAPTER 7 _____________________________________________
298
The surface properties as well as the energetics at the electrode/electrolyte interface
contribute to the complexity of the working catalyst and affect the electrochemical
reaction steps, the adsorption-desorption processes at the electrode surface as well as
the transport processes and thermal behaviour of gas diffusion electrodes (M. Wöhr
et al., 1996).
In the membrane electrode assembly used in SPE electrolyzers there are two
different diffusion processes, the gas diffusion and the liquid or vapour diffusion.
During the phase transition of gas/liquid occurring in the electrochemical reaction
(water to oxygen and hydrogen) it is possible to hamper the reactions by diffusion
limitations that may occur because of the significant difference in density and
mobility, and the different time scales of both diffusion processes (Wang et al.,
1999). For liquid transport the material characteristics are important, especially the
wetting angle of the catalyst, and the characteristics of the respective catalyst
support. The liquid transport can be changed from a diffusion mode to an osmotic
mode by varying the composition of the electrode.
The interface of the electrode and electrolyte is a solid-solid transition that may
consist of a high number of single contact points. This interface can therefore
produce high ohmic losses on charge transition (Wöhr et al., 1996). Properties such
as the anodic overvoltages, cathodic overvoltage, ohmic drop within the SPE and
roughness factor of electrodes have been measured (Millet et al., 1989; 1990). The
ohmic overpotential is due to the total resistances in the electrolyzer. These
resistances can be found in practically all cell components: ionic resistance in the
membrane, ionic and electronic resistance in the electrode and electronic resistance
in the gas diffusion layer, flow field plate and terminal connections (Roshandel et al.,
2005). But the largest source of ohmic loss in the cell arises from the electrolyte
membrane.
Grigor'ev et al., (2004) developed a mathematical model for analyzing spatial
distributions of the transport and the concentration of reactants and current density

CHAPTER 7 _____________________________________________
299
over a fuel cell with a solid polymer electrolyte. The effect of the catalytic layer
activity, reactant speed, bipolar-plate geometry, thickness and porosity of current
collector and gas-diffusion layer, and the reaction mixture composition on the fuel
cell efficiency was modelled and the relative contribution of each component
highlighted. That study highlights the complexity of the SPE system.
Chirkov and Rostokin (2005) showed that the magnitude of currents of electrodes in
hydrogen-oxygen fuel cells of all types is determined by values of the effective
coefficient of gas diffusion, the effective coefficient of ionic conduction, and the
characteristic bulk current density.
7.2.6 The working cell
Industrial electrolyzers are made of a multiplicity of elementary cells in hydraulic
and electrical connection, pressed one against the other to form a modular
arrangement. The electrical connection may be of a monopolar or bipolar type and
the cell constitutes one of a repeating element in a modular electrolyzer. An intimate
contact between membrane, electrode and current distributor should be mechanically
ensured and the elements comprising the cell should have sufficient elasticity to
undergo a deflection when the various constitutive elements are tightened in the
modular arrangement. A fully operational electrolyzer system is described for
instance, in United States Patent 6569298 (Merida-Donis, 2003) where the
deionization of water and hydrogen fuel production in a fuel generation mode, and
electricity production in a power generation mode are integrated. A capacitive
deionization device receives water and electrical energy to produce deionized water
that is transferred to the PEM electrolyzer to produce hydrogen fuel. A storage
system receives the hydrogen which is then transferred to the PEMFC device that
produces electrical energy.

CHAPTER 7 _____________________________________________
300
In this study only a single element of a modular array was optimized. Full integration
with the peripheral systems was not considered as this fell outside the scope of the
study. The objectives of this part of the study were to gain an understanding of the
factors that have an effect upon the operation and current density of a working
module, to decouple the effect of the catalyst and influence of different components
from operational issues. Effect of variables such as ink composition, type of gas
diffusion layer, loading variability, stability and durability, catalyst type for anode
and temperature were investigated.
7.3 EXPERIMENTAL: MEMBRANE ELECTRODE ASSEMBLIES FOR SPE
SYSTEMS
This section lists the chemicals, components and methods used to assemble the
MEAs that were then tested in the electrolyzer cell module.
7.3.1 Chemicals
i) De-ionized water
ii) Iso-propanol 99 %, liquid, m.p-89.50 and b.p-82.40 from Aldrich
iii) Nafion® solutions in water
Ion Power, Inc supplied LIQUION™ solutions which are dissolved
NAFION® resins in a mixture of water and alcohols. The NAFION® is
Perfluorosulfonic Acid/TFE Copolymer. The solutions are available in solid
concentrations of 5 or 15 weight %. The solutions can be dried to form films
and coatings of NAFION® or mixed with other solids to form electrodes.
7.3.2 Components

CHAPTER 7 _____________________________________________
301
7.3.2.1 Polymer Electrolyte Membranes Available commercial proton conductive polymers membranes used to separate the
anode and cathode compartments of the water electrolyzer included:
Perfluorinated sulfonic acid polymer membrane Nafion® from the E. I. Dupont De
Nemours and Company, which is supplied by Electro chem. Inc. 400 West
Cummings Park, Woburn MA 01801 USA and available in sheet form as Nafion
membranes “EC – NM – 117” , “EC – NM – 115”, and “EC – NM – 112” which
specifies the thickness of the PEM films. For instance Nafion 112 has a thickness of
50 µm; Water uptake of about 25% ; Proton conductivity(S cm-1) about 1.0 × 10⁻².
A Chinese equivalent GEFC®-11N perfluorinated proton exchange membrane was
also used. The technical indices of this material were: Nominal Thickness: N mil
(N=1~20); Acid Capacity 0.97 mmol g-1; Conductivity 0.1 S cm-1 ( 25 °C ); Water
Uptake 50 % (at 100 °C, 1 h ); Linear Expansion 1% (at 23 °C, from 50 % RH to
water soaked); Tensile Strength 37 MPa (at 50 % RH, 23 °C, Isotropy ); Melting
Point 219 °C.
7.3.2.2 Gas diffusion layers
Lydall Carbon cloth called Technimat, which is a carbon paper used as pyrolysed
diffusion layer with no PTFE content, with controlled porosity. Technimat exists in a
number of basis weights (from 6.8 to 102 g m-2). Various grades were considered and
a typical specification given by the suppliers of the 6100-200 grade was: Grade-Basis
Weight 41.7; Lbs/3000 ft²-Caliper @ 4psf 56.6; mils-Caliper @ 8 psi 25.8; mils-
Tensile MD 3800; gms/inch-Tensile CD 5400; gms/inch-MD/CD Ratio1.07.
Etek LT-1400W GDL with electrical resistance of 500 mΩ cm-1; air permeability
500 mL min-1; mean pore size 7 µm (further specifications available from Etek,
2008).

CHAPTER 7 _____________________________________________
302
Titanium fibre Bekinit KK, supplied by Bekaert (Japan) stock number
ST/Ti/20/200/56, with specifications of t=0.1 mm; or Bekinit ST/Ti/20/400/76, with
specifications t = 0.35 mm (Bekaert BFT, 2008). Both types have fibre diameter of
20 μm; weight : 300 to 200 g m-2; porosity : 52 to 56 %; thickness : 0.14 to 0.1
mm.
7.3.2.3 Binders
5 wt % LIQUION™ composition is: NAFION® 4.95-5.05 wt% in a solvent
comprising Water: 20 wt%; Isopropanol :75 wt% ; Density: 0.86 g cm-3
15 wt% LIQUION™ composition is: NAFION® 14.9-15.1 wt% in a solvent
comprising Water: 45 wt%; Isopropanol :40 wt% ; Density: 1.0 g cm-3;
Electrical properties: 880 Ω cm-1 DC, 330 Ω cm-1 AC
7.3.3 Methods
7.3.3.1 Pretreatment of titanium fibre GDL.
20 g of Oxalic acid was dissolved in 200 mL water (10 % w/w solution). The
solution was heated to boiling and then the required size of the fibre was placed in
the boiling solution, treated for 6-7 min, rinsed with de-ionized water and then dried.
7.3.3.2 Preparation of Proton conducting membrane
Chinese Proton Exchange Membrane GEFC®-11N was soaked in 5% H2O2, H2O,
0.5 M H2SO4 and H2O respectively at 80 °C for 1 h, and rinsed thoroughly with pure
water. The treated membranes may be stored in pure water or allowed to dry.
Perfluorinated Proton Exchange Membrane Nafion® sheets were cleaned and
activated as follows: The Nafion® sheet was cut into appropriate sizes and boiled in 9
M HNO3 for 1 h, rinsed with deionized water, and then placed in H2O2 solution for 1
h at 60 °C. (The H2O2 solution is made with 51 mL in 1 L distilled water). The
Nafion® sheet was rinsed in distilled water for 30 min while heating. Thereafter the
Nafion® sheet was boiled in H2SO4 for 1 h (the H2SO4 solution was prepared from

CHAPTER 7 _____________________________________________
303
54.3 mL in 1 L distilled water). Finally the Nafion® sheet was washed in distilled
water for 30 min while heating.
7.3.3.3 Catalysts
Commercial anode and cathode catalysts obtained from Alpha Aesar, a division of
Johnson Matthey, were applied in the MEA assembly unless otherwise specified.
Premion Iridium (IV) oxide, 99.99 % (metals basis) Ir 84.5 % minimum, total
impurities <100 ppm supplied by Alfa Aesar, a Johnson Matthey Company (Stock #
43396; Lot # E27P20). This catalyst will be referred to as JM IrO2.
Pt catalyst HiSpec™ 4000, 40 % on carbon black with 39.74 % Pt, 1.33 % moisture,
3.54 nm crystalline size supplied by Alfa Aesar, a Johnson Matthey Company (Stock
#42204; Lot # J26P18 or F01Q12). This catalyst will be referred to as JM Pt40/C.
Homemade IrO2 Catalyst preparation method.
In the synthesis of Iridium oxides, Iridium chloride (H2IrCl6 or IrCl3) precursors
were oxidised within a melt of sodium nitrate according to the Adam’s fusion
method. To evenly disperse the precursor throughout the NaNO3, 0.4 g of IrCl3.x
H2O and 20 g of NaNO3 were dissolved in 100 mL of deionised water. The solution
was stirred for more than 6 h using a magnetic stirrer. The solution was dried in an
oven at 80 °C. The dried mixture was then introduced into a pre-heated ceramic
furnace at 350 - 450 °C and kept in these conditions for 30 min until a dark brown
nitrous gas evolved. The fused salt melt was cooled to room temperature and then
leached by repetitive washing with deionised water to leach out all the excess salt.
The oxidised iridium solids remaining were then separated by the use of a centrifuge
and the wet IrO2 particles were dried at 80 °C. Further heat treatment was performed
in a preheated furnace at 450 – 580 °C to anneal the catalyst. This catalyst will be
referred to as IrO2 HM.
7.3.3.4 Ink formulations

CHAPTER 7 _____________________________________________
304
Specific ink formulations that were used are specified with each particular
experimental result in the following sections. The inks were prepared according to
the following basic formulation as is given in Table 7.1 which was varied. The
Nafion® solution should always be added after the water because the catalyst can
ignite the solvent. The ink mixture was ultra sounded for 5 min then stirred until use.
Table 7.1 Ink formulations Anode Cathode Catalyst 0.1275 or 0.05 g 0.1275 or 0.05 g Water 0.25 cm3 0.25 cm3 Nafion solution 1.275 or 0.06 g 1.275 or 0.06 g Iso-propanol 0.5 cm3 0.5 cm3
7.3.3.5 Drying/curing procedure
After deposition of the ink on the chosen GDL, the solvent should be removed by
heating the electrode at 50 °C for 30 min, followed by a curing step at 80-120 °C for
15 min.
7.3.3.6 Ink deposition
The ink was deposited on a specifically sized inert GDL substrate (either of 5 cm2, 4
cm2 or 1 cm2) and cured to form the GDE. The catalytic ink was alternatively
spraycoated or brushcoated onto the GDL. Spraycoating was achieved by use of an
artist’s airbrush or airgun No. 100 fine 0.1755CG, Badger USA by loading the ink
into the reservoir and propelling the ink with a pure N2 stream. In Chapter 6 screen
printing as ink deposition was assessed after developing new ink formulations
suitable for screenprinting.
The inks were applied directly onto different types of GDL comprising carbon
cloths (Lydall, 6100-200AC or 6100-300) or titanium fibre (Bekinit, thickness
0.1mm; Bekinit St Ti 20 200 56 or Bekinit St Ti 20 300 66) for cathode and anode
respectively. ETEK ready to press with ionomer was also compared as GDL for the
MEA. Various mass % loadings were achieved and compared to find an optimum
loading.
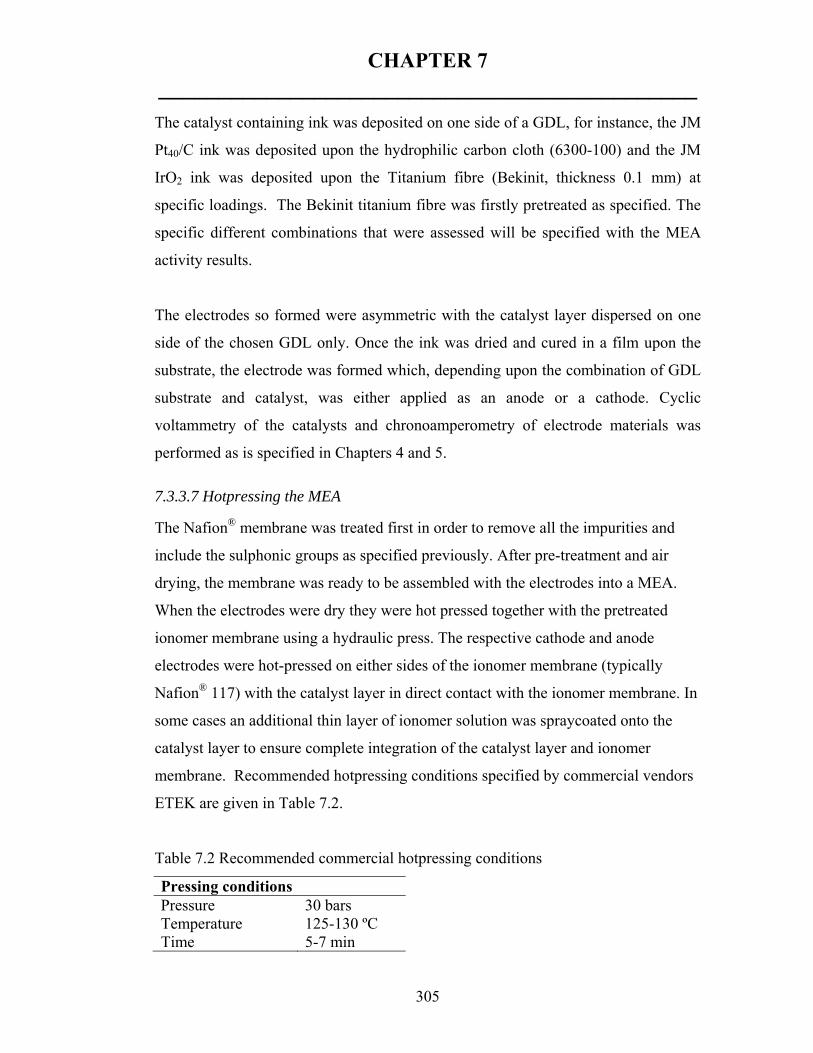
CHAPTER 7 _____________________________________________
305
The catalyst containing ink was deposited on one side of a GDL, for instance, the JM
Pt40/C ink was deposited upon the hydrophilic carbon cloth (6300-100) and the JM
IrO2 ink was deposited upon the Titanium fibre (Bekinit, thickness 0.1 mm) at
specific loadings. The Bekinit titanium fibre was firstly pretreated as specified. The
specific different combinations that were assessed will be specified with the MEA
activity results.
The electrodes so formed were asymmetric with the catalyst layer dispersed on one
side of the chosen GDL only. Once the ink was dried and cured in a film upon the
substrate, the electrode was formed which, depending upon the combination of GDL
substrate and catalyst, was either applied as an anode or a cathode. Cyclic
voltammetry of the catalysts and chronoamperometry of electrode materials was
performed as is specified in Chapters 4 and 5.
7.3.3.7 Hotpressing the MEA
The Nafion® membrane was treated first in order to remove all the impurities and
include the sulphonic groups as specified previously. After pre-treatment and air
drying, the membrane was ready to be assembled with the electrodes into a MEA.
When the electrodes were dry they were hot pressed together with the pretreated
ionomer membrane using a hydraulic press. The respective cathode and anode
electrodes were hot-pressed on either sides of the ionomer membrane (typically
Nafion® 117) with the catalyst layer in direct contact with the ionomer membrane. In
some cases an additional thin layer of ionomer solution was spraycoated onto the
catalyst layer to ensure complete integration of the catalyst layer and ionomer
membrane. Recommended hotpressing conditions specified by commercial vendors
ETEK are given in Table 7.2.
Table 7.2 Recommended commercial hotpressing conditions
Pressing conditions Pressure 30 bars Temperature 125-130 ºC Time 5-7 min

CHAPTER 7 _____________________________________________
306
The specific components and hotpressing conditions that were applied in this study
varied between about 3-7 min, 120-130 0C and 20-140 bars, and are specified
separately in the appropriate sections.
7.3.3.8 SPE Electrolyzer Cell Assembly
The MEA was assembled in the SPE test module as is schematically shown in Figure
7.4.
Figure 7.4 Schematic assembly of the SPE electrolyzer
A current collector with serpentine channels for water flow was clamped on each
side of the MEA with suitable seals. A porous titanium frit was interspersed on each
side between the current collector and the MEA to support the MEA and to ensure
even water distribution and gas removal. The current collector was suitably insulated
from the clamps and peripherals on each side of the cell. Electric leads were
connected to each side of the cell. The piping from the cell to the water reservoir was
attached as shown in Figure 7.5. Each MEA was moisturized for a specific time as
specified prior to the start of the experiment.
7.3.3.9 SPE Electrolyzer operation
Setting up the prototype bench scale module of a SPE electrolyzer included modular
cell design and peripheral selection. The SPE electrolyzer setup is shown in Figure
7.5.

CHAPTER 7 _____________________________________________
307
Ti cell with porous Ti current collectors
Gas / electrolyte separation
Bubble flow meters to check the gas production rate (measurement within 95% of theoretical production)
Ti cell with porous Ti current collectorsTi cell with porous Ti current collectors
Gas / electrolyte separationGas / electrolyte separation
Bubble flow meters to check the gas production rate (measurement within 95% of theoretical production)
Figure 7.5 Laboratory scale set up and SPE testing module
The following peripheral equipment was required to operate the SPE testing module:
Magnetic heater and stirrer; Gas separation system including fittings, glassware and
tubing for feed and product streams; 2 X Soap bubble meters; Electrolyzer module;
Watson-Marlow 323 U/D peristaltic pump; Watson-Marlow 313X Extension
Pumphead; Hoiki 3560 AC milli Ohm Hi Tester for testing cell resistance; Autolab
PGSTAT 30 (Eco Chemie BV, Netherlands) as power source. A power source
Powerflex TT CPX Dual PSU with maximum output of 35 V and 10Amp was used
as potentiometer in some cases.
A process flow diagram is presented schematically in Figure 7.6 for assembling and
testing the MEA.

CHAPTER 7 _____________________________________________
308
Solvents
Catalyst
Nafion ink
H2O
C3H8O
GDL Substrate
H2O
Cathode and Anode
KOH
H2SO4 Nafion sheet
MEA
Nafion sheet
H2O
H2O
H20
H2 MEA
O2 H2O
Figure 7.6 Schematic process flow diagram for assembling and testing the MEA
The power source provided the electrical potential across the cell. The ultrapure
water feed was pumped at a set rate using the pump, from the reservoir to the
electrolyzer module, where the water was split into hydrogen and oxygen, which
gases were then respectively collected in the gas phase separators. Gas flow rate was
measured using the soap bubble meters. The operational parameters that were
optimized as well as the activity of the catalyst were identified by the current density
that was registered on the Auto lab.
Mixer Coating Drying
Oven
Pressing
Moisturizing MEA
Hydrogen Collection
Treating

CHAPTER 7 _____________________________________________
309
The MEA was thus prepared and tested according to the following summarized
steps:
i. Separately weigh appropriate amount of electrocatalyst for anode and
cathode.
ii. Mix the cathode and anode catalyst separately with appropriate amount of
ultra pure water.
iii. Weigh appropriate amount of Nafion solution (5 % w/w) and add drop wise
to each catalyst, while stirring.
iv. Add isopropanol drop wise to each catalyst with stirring.
v. Ultrasound ink for 5 min and continue with magnetic stirring overnight.
vi. Cut and weigh the appropriate GDL substrate for cathode and anode
respectively.
vii. Deposit respective anode and cathode inks upon appropriate substrates using
appropriate deposition technique, drying and weighing in between. Repeat
until appropriate layer thickness /loading achieved. The calculated catalyst
(e.g. platinum or iridium metal loading) should be about 1-6 mg cm-2 both for
anode and cathode.
viii. After the respective coating, dry and cure gas diffusion electrodes (GDE).
ix. Pretreat the appropriately sized Nafion® membrane sheet.
x. Place treated Nafion membrane sheet between the anode and cathode GDE,
and hotpress using suitable hotpressing conditions.
xi. Test current density after suitable moisturization times of MEA

CHAPTER 7 _____________________________________________
310
7.4 RESULTS AND DISCUSSIONS
7.4.1 Characterization of components
7.4.1.1 Catalysts for anode and cathode of SPE electrolyzer
Characteristics of the commercial electrocatalysts that were applied in this study are
given in the specifications from the suppliers. Micrographs and other characteristics
of JM Pt40/C are given in Chapter 4. SEM micrographs of (a) Ir Black and (b) IrO2
(HM) prepared according to Section 7.3.3.3 that was also tested as anode catalyst are
presented in Figure 7.7.
(a) Johnson Matthey Ir Black with particles size range 30-50nm
(b) Annealed HM IrO2 with particle sizes average 5-10nm
Figure 7.7 SEM micrographs of Iridium catalysts
The XRD spectra of the benchmark commercial JM IrO2 and HM IrO2 pyrolysed at
450 ºC and annealed at 550 ºC are presented in Figure 7.8.

CHAPTER 7 _____________________________________________
311
0
500
1000
1500
2000
2500
3000
10 20 30 40 50 60 70 80 90 100
2 theta angle
Cou
nts 200
210
301 321
222
0
500
1000
1500
2000
2500
3000
10 20 30 40 50 60 70 80 90 100
2 theta angle
Cou
nts 200
210
301 321
222
0
500
1000
1500
2000
2500
3000
15 35 55 75 95
Degrees 2 theta
Inte
nsity
101
110
200
211
0
500
1000
1500
2000
2500
3000
15 35 55 75 95
Degrees 2 theta
Inte
nsity
101
110
200
211
(a) (b) Figure 7.8 XRD spectrum of (a) commercial JM IrO2 (b) HM IrO2 pyrolysed at 450 ºC and annealed at 550 ºC
The observed d values of the major XRD reflections were compared with standard d
values as given in the JCPDS data file. Typical reflections for IrO2 can be observed
at 28.05 º2θ, (110), 34.95 º2θ (101), 55.34 º2θ (211) and 39.75 º2θ (200), with
standard d values respectively of: 3.1780 (110); 2.582 (101); 2.2488 (200); 1.696
(211) (Osaka et al., 1994). The commercial sample consisted of four major peaks that
are associated with 200, 210, 301, 321 faces, whereas XRD peaks for homemade
samples were associated with 101, 110, 211, 112 faces with good agreement between
the observed and standard d values. The annealed IrO2 particles sizes were between
8-10 nm as calculated by the Scherrer equation from XRD data and by visual
inspection of TEM images and most of these particles were agglomerations of
smaller particles showing the sintering effect of the high annealing temperature used.
An annealing temperature of 550 ºC was applied. It is well known that the material
properties of IrO2 are susceptible both to the deposition technique and preparative
parameters (Patil et al., 2003).

CHAPTER 7 _____________________________________________
312
Figure 7.9 TGA of HM IrO2
The thermal analysis (Figure 7.9) showed that the prepared IrO2 nanoparticles were
not stable. Mass loss was observed between 50-100 ºC and again between 100-700
ºC. The first mass loss of about 3 % was attributed to the removal of moisture and a
portion of the second mass loss (between 100-300 ºC) could be attributed to the
possible removal of the remainder of NO2 formed during the Adams fusion method.
Thereafter a slow but steady mass loss was observed. This mass loss is ascribed to
the fact that the chemical stoichiometry of the oxide nanoparticles is not maintained
as the temperature increases. It is only under high annealing temperatures that the
surfaces of metal oxides are terminated with metal cations (al-Abadleh Hind et al.,
2003). These authors found that under non-annealing temperatures, metal oxide
nanoparticles are oxygen terminated and metal cations fully coordinated in the bulk.
High concentration of negative oxide ions on the surface causes oxide ion bond
lengths to relax and react with ambient gases, such as water, forming hydroxyl
groups, of which residual groups persist on the surface of nanoparticles even after
relatively high thermal treatment. Annealing of the IrO2 caused sintering of the
nanoparticles and crystal growth, as is apparent from the observed high intensity
XRD peaks, which may have improved electronic pathways by creating gooseneck
boundaries between crystals. Hackwood et al. (1982) showed that exothermic
transitions exist at 300 °C and at 700 °C, the higher of which is due to amorphous-to-
crystalline transition where after IrO2 loses its electro catalytic properties that are
associated with the fast-ion mobility in the amorphous state.

CHAPTER 7 _____________________________________________
313
7.4.2 Characteristics of macroporous conductive supports
Micrographs of the various carbon based support substrates used as GDL are shown
in Figure 7.10 (a to c).
(a) Hydrophilic carbon cloth (Lydall 6100-
200AC)
(b) Hydrophilic carbon cloth (Lydall 6100-
300)
(c) Hydrophobic carbon cloth (Lydall 484C)
Figure 7.10 Types of carbon cloth support taken at 300 magnifications, by Scanning Electron Microscope (SEM)
The micrographs in Figure 7.10 (a-c) show the typical macroporosity of these GDL
substrates with large, 50-100 µm sized void spaces and the matted fibrous structure
of the carbon matrix. The commercial hydrophobic cloth (Figure 7.9(c)) is typically
impregnated with PTFE to repel water ingress into the GDL layer and thus the gas
diffusion pathways are partially obstructed. In GDL with various PTFE loadings of

CHAPTER 7 _____________________________________________
314
the hydrogen electrode (Ioroi et al., 2001; 2002; 2003), both the fuel cell and water
electrolysis performances were not affected by the amount of PTFE loading and 5–7
wt % was found appropriate. These authors found that the efficiency of the URFC
decreased with increasing cycles when the PTFE loading on the oxygen side GDL
was too low. Hence the PTFE treated hydrophobic GDL would be of importance as
anodic substrate should the SPE cell be operated in both electrolyzer and fuel cell
mode. Micrographs of other commercial GDL materials are presented in Figures
7.11 (a to d).
a) ETEK ready to press with ionomer – GDL side woven matrix
b) ETEK ready to press with ionomer – ionomer side
(c) Bekinit St Ti 20 200 56 (d) Bekinit St Ti 20 300 66
Figure 7.11 SEM micrographs of GDL substrates
ETEK ready to press GDL with ionomer is shown in Figure 7.11 (a) on the GDL
side exposing the woven matrix and (b) on the ionomer coated side, which shows the
much denser woven fibrous texture of this commercial GDL material, with gas
diffusion pores in the region of 5-10 µm. The Titanium meshes supplied by Bekaert
(Bekinit type) are presented in Figure 7.11 (c and d).These micrographs show the

CHAPTER 7 _____________________________________________
315
matted metallic mesh diameter (50 µm) and the large void spaces representing the
gas diffusion pathways or porosity between the individual strands of Ti. The
difference between these two Ti materials is the thickness.
7.4.3 Characteristics of ink formulations
The characteristics of the ink formulations are described in Chapter 6 in which the
viscosity and rheology of the different formulations used in screen printing are
investigated. In this section the inks were mainly used directly after composing them
due to the volatility of the isopropanol solvent used in spraycoating and
brushcoating. It was evident that particles were agglomerating and thus the JM Pt40/C
ink formulation was checked for particle distribution using a non-invasive
backscatter spectroscopy (NIBS) technique.
Figure 7.12 Particle size distribution for the typical JM Pt40/C ink formulation
Particle size distribution (Figure 7.12) determined by NIBS for the JM Pt40/C ink
formulation, revealed no bimodal distribution for the catalyst containing sample and
the diameter of the particles was close to 1000 nm, showing that the catalyst particles
supported on carbon black were prone to agglomeration in the formulations used.
SEM micrographs (Chapter 4) showed that the Vulcan carbon black upon which the
nanoparticles of Pt are supported in the case of the JM Pt40/C catalyst was typically
between 2-5 µm in particle size. Hence inter particular attraction played a role in
causing particle agglomeration, which resulted in uneven particle deposition. To
prevent this from occurring many patented ink formulations add various or

CHAPTER 7 _____________________________________________
316
undisclosed dispersants. In this study these additives were not added to the ink
formulations used in order to eliminate extraneous variables during electrode testing.
7.4.4 Characteristics of electrodes
There are many different ink formulations, and types of GDL substrates as well as
various ways of depositing the ink on the GDL reported in the literature and each
preparation technique as well as the different choices of components may have an
effect on the overall activity of the electrolyzer cell. In this section the electrodes are
characterized after the deposition and curing of the ionomer containing catalyst layer.
The purpose of the characterization was to establish whether good dispersion of Pt
catalyst and homogeneous electrode structures had been prepared. Homogeneity or
high dispersion versus agglomeration and poor dispersion was initially determined
by optical or scanning microscopy.
The ink solution for JM Pt40/C on carbon cloth as well as for Pt HMS (carbonized)
on Bekinit titanium support was typically prepared as follows: 0.25 g of catalyst was
mixed with 1.00 g H20, 0.67 of 5 % Nafion solution and 1.00 cm3 of isopropanol.
This formulation was varied as is further specified. Selected examples of SEM
micrographs, alternatively optical microscopy of typical Ir and Pt containing
composite electrodes prepared as anodes and cathodes using carbon cloth GDL are
presented in Figure 7.13 and Figure 7.14 after ink deposition with anodic and
cathodic inks upon carbon cloth substrates, showing ink adhesion on carbon fibres.

CHAPTER 7 _____________________________________________
317
Figure 7.13 SEM of Ir Black on carbon cloth anode
Figure 7.14 SEM of IrO2 on carbon cloth anode
The SEM micrographs of the Ir containing catalytic ink dispersed upon the gas
diffusion layer (Figure 7.13 and 7.14) shows that there is much potential for
improvement that can be achieved by using a finer and possibly more dense carbon
backing layer as GDL. It is highly unlikely that more than a very insignificant
portion of the catalyst could be in intimate contact with the Nafion membrane or with
the carbon cloth due to the large voids and catalyst interpenetration between fibres of
the GDL. Possibly, direct electrochemical deposition of Ir upon carbon may result in
more uniform and stable coatings, where after the material may be impregnated with
Nafion.
Figure 7.15 Optical microscopy of typical composite electrode JM Pt40/C on carbon cloth
Figure 7.16 Ink coated by brushing Pt ink on cathode (MEA 59) on GDL Lydall Carbon Cloth 6100-300

CHAPTER 7 _____________________________________________
318
Optical microscopy and SEM micrographs of typical JM Pt40/C on carbon cloth GDL
forming a composite electrode are shown in Figures 7.15 and 7.16, before hot-
pressing the electrodes into a MEA. SEM micrographs of anodes prepared using
Titianium mesh (Bekinit) are shown in Figures 7.17 and 7.18 and in Figures 7.19 and
7.20 spraycoated cathodes are shown.
Figure 7.17 Anode based upon Bekinit St Ti 20 300 66; ink brush coated (IrO2 MEA 59)
Figure 7.18 Anode based upon Bekinit St Ti 20 300 66; ink spraycoated (with 6 mg IrO2)
Figure 7.19 Pt cathode based on GDL Lydall Carbon Cloth 6100-300; ink spray coated
Figure 7.20 Pt cathode on GDL Lydall Carbon Cloth 6100-300; ink spray coated with higher loading of catalyst
SEM and optical microscopy showed that typically after ink deposition and curing a
catalyst layer was formed that interpenetrated the fibres of the GDL and adhered to
the fibre surfaces. As the resolution of optical microscopy was sufficient to inspect
electrodes, this method was generally used as quality control measure during MEA
preparation.

CHAPTER 7 _____________________________________________
319
Ink adhesion upon the GDL was generally good, and the correct catalyst loading
could be achieved by careful weighing in between deposition of layers and weighing
the product after ink deposition. As the micrographs show, the integrity of the film
layers was higher when spraycoating was used instead of brushcoating, but this
depended upon the loading achieved as well as the substrate type. Brush coating was
found to result in lack of reproducibility in catalyst loading, and a greater degree of
crack formation. Spray coating was more reproducible but it was found to be
laborious and care was required to ensure that all areas of the electrode were coated
evenly and that equivalent loadings were achieved from one MEA to the next. Both
techniques were wasteful of the expensive catalysts due to losses occurring during
preparation. The layers of cured ink containing the electrocatalyst and the ionomer
were prone to a high degree of crack formation upon drying and curing, most likely
due to the different coefficient of expansions or thermal shocks during heat curing of
the ink layer and the underlaying GDL (Patil et al., 2003) or the lack of elasticity and
heat sensitivity of the ionomer Nafion® that was used as binder, which may contract
or degrade during heat curing. Samples exhibit a characteristic “cracked-mud”
appearance. Transition metal dioxide layers very often exhibit such features. Such
features are, in principle, favourable for some applications such as O2 or H2
evolution because it gives rise to higher macroscopic surface area (Hine et al., 1979;
Pizzini et al., 1972; Savinell et al., 1990). However, the micrographs gave no
indication of the dispersion of Pt over the electrode surface. Determining the
electrical conductive characteristics of the electrodes would require different means
of characterization which are set out in Chapter 6.
7.4.5 Characterization of homogeneity and reproducibility of electrodes
Characterization of the spatial distribution of Pt or Ir nanoparticles upon modified
electrodes prior to hot pressing was necessary in order to develop well defined
deposition technology. The characteristics of representative electrodes were

CHAPTER 7 _____________________________________________
320
determined in terms of Pt or Ir loading per geometric surface area, as measured by
photon induced X-Ray emission (PIXE) spectroscopy using a dynamic mapping
technique (Ryan et al., 1995). This was characterized by elemental mapping of
micro-regions in the micrometer scale of active elements dispersed upon conductive
(i.e. carbon based and titanium based) support matrixes (Figures 7.21 and 7.22).
A
B
Figure 7.21 Elemental distribution map of Pt (A) and Ir (B) on carbon cloth electrodes calculated by Dynamic Analysis method of mapping from micro-PIXE data
Figure 7.22 PIXE spectra of (a) Pt cathode and (b) Ir anode
PIXE spectra shown in Figure 7.21 from a Pt cathode (a) and an Iridium oxide anode
(b) were obtained from irradiation with 3.0 MeV protons at the nuclear microprobe
b)
a)

CHAPTER 7 _____________________________________________
321
facility, Materials Research Group, iThemba LABS. All X-ray lines correspond to
the L-shell X-ray excitation from both Pt and Ir. The smaller lines on the right of
each spectrum are artefacts related to pile-up in the Si(Li) X-ray detector.
Calculation of Pt and Ir concentrations were done using the L lines marked in Figure
7.22.
PIXE analysis and SEM micrographs showed that the uneven dispersion as well as
agglomeration and cracking of deposited catalytic ink layers that occurred after
drying and curing, particularly in the case of brush coated electrode preparation
techniques, resulted in inhomogeneity of catalytic nanoparticles in the deposited
layers. In Figure 7.21 (a) the layer of Pt ink presents localised areas of agglomeration
(with maximum Pt concentration levels at 25 %) separated by regions where the Pt
concentration was depleted (~2 %). In the case of the IrO2 the PIXE map shows
restricted regions of high (10 %) and low (0-2 %) concentrations of Iridium Oxide.
The Pt particles are more dispersed than the IrO2 particles over the whole micro-
region, which indicated that the formulations of inks would need to be optimized
considerably to prevent the significant agglomeration and poor dispersion observed.
This aspect was addressed in Chapter 6.
The agglomeration that was observed could be caused by inter particular attraction
due to electrostatic forces or by surface energy of the substrate, or by polarity of the
solvent used in the ink. The ink formulations were further optimized as is described
in Chapter 6 and the interplay between these forces is explored therein.
SECM imaging of activity of the composite JM Pt40/C catalyst deposited on highly
orientated pyrolytic graphite (HOPG) as conductive substrate towards the hydrogen
evolution reaction (HER) in 5 mM H2SO4 electrolyte solution is shown in Figure
7.23.

CHAPTER 7 _____________________________________________
322
Figure 7.23 SECM Imaging of activity of Pt40/C electrode towards HER in 5 mM H2SO4 electrolyte solution
The SECM imaging (Figure 7.23) indicated a similar trend to that observed in the
PIXE elemental maps, of relative inhomogeneity of the active surface area of the
active electrocatalyst dispersed in the composite electrode. Better uniformity of the
electrodes was achieved by changing the substrate type and the type of catalyst
support combination (Figures 7.24 and 7.25).
Figure 7.24 JM Pt40/C on carbon cloth Figure 7.25 Pt HMS (carbonized) on Bekinit substrate
Optical micrographs of comparable scale of a micro-region selected at random on a
cathode with JM Pt40/C spraycoated on carbon cloth (Figure 7.24) or Pt HMS
(carbonized) catalyst spraycoated on the Bekinit titanium substrate as cathode is
shown in Figure 7.25. The preparation of Pt HMS (carbonized) catalyst was
described in Chapter 4. The optical micrograph of the electrode is compared with
elemental maps for Pt and Ti calculated by Dynamic Analysis method from micro-
1.00mm 1.00mm

CHAPTER 7 _____________________________________________
323
PIXE data obtained on the JM Pt40/C spraycoated on carbon cloth and Pt HMS
(carbonized) on Ti support as cathode samples, that are shown in Figure 7.26 (a) and
(b) respectively.
(a) Pt elemental map of Pt HMS (carbonized) catalyst deposited on Ti Bekinit substrate
(b) Ti elemental map of Pt HMS (carbonized) catalyst deposited on the Ti Bekinit substrate
Figure 7.26 Elemental distribution map of Pt (a) and Ti (b) in titanium substrate GDL electrodes containing a film of supported Pt HMS (carbonized) catalyst
The elemental distribution map (Figure 7.26) of Pt (a) and Ti (b) of an electrode
prepared with Pt HMS (carbonized) catalyst on titanium Bekinit substrate was
calculated by the Dynamic Analysis method of mapping from micro-PIXE data.
PIXE spectra were obtained from irradiation with 3.0 MeV protons. X-ray lines
correspond to the L-shell X-ray excitation from Pt and K-shell excitation from the
rest of the elements (Ti, Cr, Fe, Cu, Zn and Ru). The map for Pt (Figure 7.26(a))
shows regions of homogeneous and well dispersed concentration distribution levels
of Pt (Pt~3 %) even though some crack formation is apparent. These regions are
undergirded by the Ti substrate fibres (Figure 7.27(b)) where Pt conc. is lower (Pt~1
%). The Ti is distributed according to the network of Ti fibres in the GDL support
with levels of 10-40 % by mass. A Fe signal was also detected in the Ti substrate as
can be seen in the PIXE spectrum shown in Figure 7.27.

CHAPTER 7 _____________________________________________
324
Figure 7.27 PIXE spectra of HMS/Pt/LPG catalyst on titanium substrate
The substrate/ film interaction was significantly improved and much more uniform
distribution with less agglomeration of the electrocatalyst was achieved for the Pt
HMS (carbonized) catalyst on titanium GDL substrate electrode combination, most
likely due to the inter particular repulsion between the HMS Si substrate supported
Pt nanoparticles causing less agglomeration. The HMS is an isolating Si based
support matrix and relatively hydrophobic because of its siliceous nature. Inter
particular repulsion is thus likely. This interesting result offers scope for further
investigation. PIXE is thus shown to be a powerful technique to determine the
distribution and homogeneity of the electrocatalyst in the composite electrode.
7.4.6 Conclusions on characterization of electrodes
There are many different combinations of catalysts and gas diffusion layers and also
various ways of depositing the ink on the GDL and each has an effect on the
characteristics of the electrode. The deposition methods characterized in this section
were brush coating and spray coating. The brush coating method was a relatively
simple way of depositing the ink upon the electrode but non-uniformity and high
crack formation was apparent. The spray coating technique allowed better control of

CHAPTER 7 _____________________________________________
325
the deposition process and the layer by layer deposition allowed careful
measurement of the degree of coating and the amount deposited. It was however a
considerably more tedious method to prepare the electrode and electrodes were
ultimately also prone to crack formation unless deposited layers were kept very thin
or great care was taken not to exceed the thermal degradation point of the ionomer
added to the ink during curing of the electrode. The Lydell 6100-300 carbon cloth
and the Bekinit titanium mesh GDL were both found to be suitable GDL. The carbon
cloth did not have a high physical integrity and was inclined to shed fibres during
processing whereas the thin titanium mesh was stronger yet sufficiently flexible to
process into MEA.
It was found that supporting the electrocatalysts upon these gas diffusion layers was
successful but that composite electrodes were not easily prepared in reproducible and
homogeneous fashion, thus this aspect of the study required further attention, and
different supports should be explored that may be more durable and that have a finer
porous texture. This aspect was partially addressed in Chapter 5 and in Chapter 6.
There is still much potential for improvement that can be achieved by using a finer
GDL and different types of electrocatalysts. Possibly, direct deposition of the
catalyst upon carbon fibres may result in more uniform and stable coatings, where
after the material may be impregnated with Nafion. This deposition approach was
investigated in Chapter 4.
PIXE was found to be a relatively accurate way to establish the spatial distribution
and % loading of catalyst per geometric area and determine whether adequate spatial
distribution was achieved on the cathode and anode. Catalytic activity could further
be confirmed by SECM analysis, however this was not quantitative.
7.5 OPTIMIZATION OF SPE ELECTROLYZER

CHAPTER 7 _____________________________________________
326
7.5.1 Components, design and configuration
The various MEA tested in the SPE electrolyzer were prepared according to Section
7.2.5. Various combinations of components were tested (Table 7.3).
Table 7.3 Summary of different membrane electrode assembly (MEA) components
No Conditions for MEA assembly
Anode GDL Anode catalyst
ionomer Cathode catalyst
Cathode GDL
2 120ºC at 40 bars for 2min:Flow 2mL s-1
Toray 0% PTFE
JM Pt40/C Nafion® 117
JM Pt40/C Toray 0% PTFE
3 120ºC at 40 bars for 2min
Toray 0% PTFE
JM Pt40/C Nafion® 117
JM Pt40/C Toray 10% PTFE
4 120ºC at 40 bars for 2min;Flow 2mL s-1
Toray 6% PTFE
JM Pt40/C Nafion® 117
JM Pt40/C Toray 10% PTFE
6 130ºC at 80 bars for 2min;Flow 2mL s-1
Lydall 6100-200
JM Pt40/C 0.0507g / 5cm2
Nafion® 117
JM Pt40/C 0.0644g/ 5cm2
Lydall 6100-200
7 130ºC at 80 bars for 2min;Flow 2mL s-1
Lydall 6100-200
JM Pt40/C 0.0560g/ 5cm2
Nafion® 117
JM Pt40/C 0.0626g / 5cm2
Lydall 6100-200
8 1300C at 80bars for 2min; Flow 2mL s-1
Lydall 6100-200
JM Pt40/C 0.0268g/5cm2
Nafion® 117
JM Pt40/C 0.032g/ 5cm2
Lydall 6100-200
9 135ºC and 40bars for 2min; Flow 2mL s-1
Toray 10% PTFE
JM IrO2 0.0285g /5cm2
Nafion® 117
JM Pt40/C 0.054g/ 5cm2
Toray 0% PTFE
10 1300C at 40bars for 2min; Flow 2mL s-1
Lydall 6100-200
JM Pt40/C 0.0137g OR 0.00915 per 5cm2
Nafion® 117
JM Pt40/C 0.0195g OR 0.023 per 5cm2
Lydall 6100-200
11 1300C at 40bars for 2min;Flow 2mL s-1
Lydall 6100-200
JM Pt40/C 0.0381g per5cm2
Nafion® 117
JM Pt40/C 0.0367g /5cm2
Lydall 6100-200
13 135ºC at 40bars for 2 min;Flow 2mL s-1
Lydall 6100-300
JM Pt40/C ~0.06g / 5cm2
Nafion® 117
JM Pt40/C ~0.06g / 5cm2
Lydall 6100-300
14 135ºC at 40bars for 2 min;Flow 2mL s-1
Lydall 6100-300
JM Pt40/C ~0.06g / 5cm2
Nafion® 117
JM Pt40/C ~0.06g / 5cm2
Lydall 6100-300
15 135ºC at 40bars for 2 min;Flow 2mL s-1
Lydall 6100-300
JM Pt40/C ~0.06g per 5cm2
Nafion® 117
JM Pt40/C ~0.06g per 5cm2
Lydall 6100-300
16 135ºC at 40bars for 2 min; Flow 2mL s-1
Lydall 6100-300
JM Pt40/C ~0.06g per 5cm2
Nafion® 117
JM Pt40/C ~0.06g per 5cm2
Lydall 6100-300
17 135ºC at 40bars for 2 min; Flow 2mL s-1
Lydall 6100-300
JM Pt40/C ~0.06g per 5cm2
Nafion® 117
JM Pt40/C ~0.06g per 5cm2
Lydall 6100-300
25 135ºC at 40bars for 3 min; Flow 2 mL s-1
Lydall 6100-200
Iridium black 0.0027g cm-2
Nafion® 117
JM Pt40/C 0.0049g cm-2
Lydall 6100-200
26 135 °C at 60 bars for 3min;Flow 4.34 mL s-1
Lydall 6100-200
JM Pt40/C 0.0068g cm-2
Nafion® 117
JM Pt40/C 0.007g cm-2
Lydall 6100-200
28 130ºC at 40bars for 5min; Flow 4.34 mL s-1
Lydall 6100-300
Iridium black 0.0045g cm-2
Nafion® 117
JM Pt40/C 0.0048g cm-2
Lydall 6100-300
29 130ºC at 40bars for Lydall 6100- Iridium black Nafion® JM Pt40/C Lydall 6100-

CHAPTER 7 _____________________________________________
327
5min;Flow 4.34mL s-
1 300 0.0022g cm-2 117 0.0035g cm-2 300
31 130 ºC 30bar 5min Flow 4.34mL s-1
Etek LT 1400-W
JM IrO2 0.0025 g cm-2
Nafion® 117
0.00305g cm-2 GDL Etek LT 1400-W
32 150 ºC 30bar 5min Flow 4.34ml s-1
Etek LT 1400-W
JM IrO2 0.0028 g cm-2
Nafion® 117
Pt incorporated
Etek Ready-to-Press
33 150 ºC 30bar 5min; Flow 3.34mL s-1
Etek LT 1400-W
JM IrO2 0.0031g cm-2
Nafion® 117
Pt incorporated
Etek Ready-to-Press
38 130ºC at 30bars for 5min Flow 3.34mL s-
1
Lydall 6100-300
0.0092 g GEFC-112
JM Pt40/C 0.0085 g cm-2
Lydall 6100-300
42 130 °C at140bars for 6 min Flow 3.34mLs-
1
Bekinit Ti GDL
JM IrO2 GEFC 117 JM Pt40/C Bekinit Ti GDL
51 130ºC at140bars for 6min;Flow 3.34mL s-
1
Bekinit Ti GDL
HM IrO2 0.0078 g cm-2
Nafion® 117
JM Pt40/C 0.0083 g cm-2
Bekinit Ti GDL
55 130ºC at 140bar for 6min;Flow 3.34mL s-
1
Bekinit Ti GDL
JM Ir Black 0.0025g cm-
Nafion®
117 JM Pt40/C 0.0056g cm-2
Lydall 6100-300
63 130ºC at 400 bar and 5 min;Flow 4.2mLs-1.
Bekinit Ti GDL
JM IrO2 0.006g cm-2
Nafion®
117 JM Pt40/C 0.001g cm-2
Lydall 6100-300
64/ 65
130ºC at 400 bar and 5 min; Conditioned 6 days Flow 4.2mLs-1.
Bekinit Ti GDL
JM IrO2 0.006g cm-2
Nafion® 115
JM Pt40/C 0.001g cm-2
Lydall 6100-300
Numbering of the MEA combinations is not consecutive (Table 7.3) as some
combinations were unsuccessful. The configuration and process conditions of the
SPE system were iteratively optimized. The following section will describe the effect
of different components, configurations and process conditions.
Chrono amperometry of the MEA was performed using a power source. The
potential was stepped up in 0.5-1.0 V steps after a dwell time of 300 s at each applied
potential in most cases to check for MEA activity for the hydrogen evolution
reaction (HER) and electrode stability, as is shown by example in Figure 7.28.

CHAPTER 7 _____________________________________________
328
0 250.000 500.000 750.000 1000.000 1250.000-1.250
-1.000
-0.750
-0.500
-0.250
0
t / s
i / A
Figure 7.28 Chrono amperometry cycle used to test MEA activity for H2 production
The average current density obtained at atmospheric pressure, per geometric area
(Ag) over time for each applied potential and each MEA combination was plotted as
a function of the current – voltage (I-V) relationship. In each case the activity for the
HER of the various MEA tested is given as a function of current density per Ag
specified. The hydrogen was collected initially and the amount produced at each
temperature was recorded at the applied voltage for a specific period of time to
ensure that the cell did not leak and no crossover or permeation occurred through the
ionomer membrane.
The influence of various parameters will be described according to incremental
improvements obtained in cell output for different applied potential. Where
components were altered these will be specified prior to the obtained results. Data for
the initial experiments are presented for Ag of 5 cm2 because of the low current
densities obtained, and once better outputs were achieved the data is normalized to
Ag of 1 cm2.
PLEASE NOTE: For simplicity all potentials are represented in the positive direction
on the x–axis in the figures presented in this Chapter whereas the actual applied
potential was negative, between -1.3 V and -2 V.
7.5.1.1 The effect of hydrophobicity of the GDL

CHAPTER 7 _____________________________________________
329
MEA series (2,3,4 and 5) were prepared using Toray carbon paper with various
degrees of Poly-tetra-floro-ethylene (PTFE) incorporated to understand whether
hydrophobic elements in the GDL would be beneficial to the MEA assembly and cell
output. A further MEA series (MEA 6 and 7) were prepared on hydrophilic carbon
cloth (Lydall 6100-200). The ink formulations used are specified in Tables 7.4 and
7.5.
Table 7.4 Ink formulation for MEA series 2,3 and 4
Material used Cathode Anode JM Pt40/C (g) 0.2101 0.2133 Nafion (5%) (g) 0.6774 0.6763 De-ionized water (g) 1.0180 1.0259 Isopropanol (g) 1.0166 1.0017 Table 7.5 Ink formulation for MEA series 5 and 6 Component Anode Cathode JM 40% Pt/C 0.2114 g 0.2101 g Nafion (5%) 0.8007 g 0.8086 g H2O 1.0123 g 1.0210 g Iso-propanol 1.0180 g 1.0206 g
The ink was spray coated for MEA2 upon Toray carbon paper with 0 % PTFE that
was used as GDL on both the cathode and anode side. In the case of MEA3 a GDL
with 10 % PTFE (hydrophobic) was used for the cathode and for the anode a GDL
with 0% PTFE (hydrophilic) was used and spraycoated with the same ink
formulation. In MEA4 a GDL containing 10 % (hydrophobic) PTFE was used as
cathode and for the anode a GDL containing 6 % PTFE was used. After the ink had
been deposited and dried each electrode was coated with a thin layer of Nafion
before hot pressing. The electrodes were combined with the Nafion membrane by hot
pressing at 120 ºC at 40 bars for 2 min.
MEA series (MEA 6 and 7) were prepared on hydrophilic carbon cloth (Lydall 6100-
200) The Nafion solution in the ink formulation was increased to about 0.8 g as the
step of coating a thin film of the Nafion on the carbon cloth before pressing was
eliminated because the Nafion film caused the carbon cloth to adhere to the
polytetrafloroethylene (PTFE) liner of the hot press during lamination of the MEA.

CHAPTER 7 _____________________________________________
330
The ink mixture was brushcoated over Ag 5 cm2 pieces of carbon cloth. After each
coat of ink the electrodes were put into an oven for 2 min at 100 ºC. The MEA was
hot pressed at 130 ºC at 80 bars for 2min with Nafion 117 ionomer membrane to
improved lamination of the MEA. Care was taken to improve the reproducibility of
catalyst loading and the loading achieved is detailed in Table 7.6. The Ag of these
MEA electrodes was 5 cm2.
Table 7.6 Catalyst loading on 5cm2 for MEA 6, 7 and 8
Mass loading on 5cm2
Anode (g) Cathode (g)
MEA6 0.0507 0.0644 MEA7 0.0560 0.0626 MEA8 0.0268 0.032 NOTE: In the masses given as loadings there is always the small amount of Nafion
used as binder in the ink formulation which remains after curing the electrode and
which has not been corrected for in the given catalyst loading.
After assembly of the MEA in the cell, the MEA was moisturized for 30 to 60 min
before applying a voltage across the cell at 25 ºC. The water flow rate was 23.5 mL
min-1. The overall cell resistance was 0.3 Ω for MEA2, 0.15 Ω for MEA3 and 0.072
Ω for MEA4. This MEA combination was not stable therefore the hot pressing
conditions were changed using a higher temperature and longer time. The cell
resistance for MEA 6 was 0.081 Ω and for MEA 8 was 0.079 Ω.
Chrono amperometry was performed using a power source between an applied
potential of -1.3 and -2 V. The potential was stepped up after a dwell time of 300 s at
each potential to check for MEA activity and stability. The average current density
over 5 cm -2 for each potential step and each MEA combination was plotted in Figure
7.29.

CHAPTER 7 _____________________________________________
331
0
100
200
300
400
500
600
700
800
900
1000
1.3 1.4 1.5 1.6 1.7 1.8 1.9 2
Potential (V)
Cur
rent
den
sity
per
5cm
2
MEA 6 MEA 7 MEA 3 MEA 2 MEA 5 MEA 8
Figure 7.29 MEA output using Toray PTFE or Lydall 6100-200 carbon paper at 25 ºC over 5 cm -2
The average current density output for MEA over 5 cm -2 using Toray paper at 25 ºC
was low but improved stepwise according to the applied potential between -1.3 and -
2.0 V as expected, for MEA 3. The low output observed for MEA 2 and 4
combinations was ascribed to the PTFE content of the GDL. It was also possible that
the temperature of hot pressing was inadequate, because MEA 4 became unstable at
an applied voltage of -1.9 V. Ioroi et al., (2002; 2003) found that cell performance
was not affected by the PTFE loadings on the GDL in the cathode side of
electrolyzer cells whereas the PTFE loadings on the oxygen electrode GDL affected
cell output considerably. However, in their study the cell was operated in both
electrolysis mode and fuel cell mode in sequential cycles and it was largely the fuel
cell mode that was affected. They found however, that the Nafion content in the
electrode affected both the fuel cell and water electrolysis performance; their
electrodes containing 7–9 wt % Nafion showed good performance. They also
demonstrated that lower catalyst loadings could be applied without detrimental effect
and that a small % of Ir added to the anode would improve the fuel cell cycle without
impeding the electrolytic cycle. Because this study was restricted to optimizing the
SPE electrolyzer mode, and because the results of MEA formed with PTFE content
in the GDL were low overall the Toray hydrophobic GDL were not tested further.

CHAPTER 7 _____________________________________________
332
The results of MEA series 6 and 7 and an additional replicate (MEA 8) were
reasonably reproducible, with MEA 6 giving slightly higher output (980 mA per
5cm2 at -2 V) compared to MEA 7 and 8 (841 and 844 mA respectively per 5cm2 at -
2 V). All MEAs that were assembled using the hydrophilic Lydall 6100-200 GDL
were significantly more active than those prepared using PTFE coated Toray paper.
The increase of the cell temperature in the case of MEA 8 significantly improved the
cell output to above 1 A per 5 cm2 at -2.0 V. The moisturization time of the MEA
had a significant effect upon overall cell resistance with moisturization time
inversely correlating with resistance as is shown in Figure 7.30.
72
74
76
78
80
82
84
86
88
40 60 80 100 120 140
Moisturization time (min)
Cel
l res
ista
nce
(mO
hm)
Figure 7.30 Effect of MEA moisturization time upon overall cell resistance
The change in cell resistance due to moisturization time is a function of the water
uptake into the Nafion® membrane, and it can be expected that the thickness of the
Nafion® film as well as the amount of Nafion® ionomer incorporated as binder in the
ink formulation would have an effect on the time required before the MEA is fully
moisturized. It was therefore necessary to test all MEA at the same time after
commencement of moisturizing to eliminate this extraneous variable and this
moisturization time was set at 30 min for initial tests. Thus it is evident that
preliminary testing was not fully optimized as the tests were performed before the
water content of the ionomer was properly equilibrated and thus an incomplete level
of proton conduction may have added to cell resistance.

CHAPTER 7 _____________________________________________
333
7.5.1.2 The effect of catalyst loading
The effect of catalyst loading was assessed in MEA 10 and MEA 11 using the Lydall
6100-200 GDL and hot pressing conditions of 130 ºC at 40 bars for 2 min. In these
combinations the JM Pt40/C catalyst loading on MEA 10 was 0.0137 g on the anode
and 0.0195 g per 5 cm2 on the cathode, whereas in MEA 11 the loading was 0.0381 g
and 0.0367 g per 5 cm2 respectively, (more or less double the amount) which in both
cases was considerably less catalyst than was used in the MEA 6 and 7 series. All
other variables were kept as constant as possible (except for temperature which was
20 ºC in this case) and the tests were performed as previously specified. The current
density of the two MEAs with different catalyst loading is compared in Figure 7.31
(a).
0
100
200
300
400
500
600
700
1.3 1.4 1.5 1.6 1.7 1.8 1.
Potential (V)
Cur
rent
den
sity
(mA
/5cm
2)
MEA10 20degC
MEA10 40degC
MEA11 20degC
MEA11 40degC
700
800
900
1000
1100
1200
1300
1 2 3 4 5 6 7
Loading (mg cm2)
Cur
rent
den
sity
(mA/
cm2)
(a) Effect of catalyst loading on current density for JM Pt40/C catalyst at 20ºC
(b) Effect of catalyst loading on current density for IrO2 at -1.8 V, 80 ºC and water flow rate 3.17 ml s-1 ;Ag 1cm-2
(Thamahane, 2005) Figure 7.31 Effect of catalyst loading on current density
The effect of catalyst loading on current density at 20ºC for JM Pt40/C catalyst could
be discerned (Figure 7.31(a)). At higher temperatures the MEA both became
unstable and output decreased dramatically. Even though MEA 10 and MEA 11 had
considerably less catalyst on both anodes and cathodes than the previous series, the
current density at 20 ºC was equivalent to the previously tested MEAs in the case of
MEA10, which only had 0.0137 g per 5 cm2 JM Pt40/C on the anode and 0.0195 g per
5 cm2 of JM Pt40/C on the cathode. MEA 11 showed a better output than the
previous series at -1.9 V with a catalyst loading of 0.0381 g JM Pt40/C per 5 cm2 on

CHAPTER 7 _____________________________________________
334
the anode and 0.0367 g JM Pt40/C per 5 cm2 on the cathode. The series (MEA 6 to 8
and MEA13 to 17) had approx 0.06 g JM Pt40/C per 5 cm2 on either side of the
MEAs. This result highlights the importance of using no more than necessary of the
expensive Pt catalyst. The loading of the IrO2 catalyst on the anode was also shown
to require optimization (Thamahane, 2005). In that study an optimum loading of IrO2
was achieved at 0.005 g cm-2 as is shown in Figure 7.31 (b). The decrease in
performance observed at the higher temperature Figure 7.31 (a) was ascribed to
excess accumulation of gas in the cell and further testing was performed to eliminate
this problem. The cell was there after operated in a vertical position with the water
outlets on top to allow gas egress due to gravity. The change in cell orientation
resulted in a continuous flow of fine bubbles being observed in the water outlet
tubes. With the change of position of the cell the improved flow significantly
reduced the electrode blinding problems, which showed that the effects of gravity
need to be kept in mind.
7.5.1.3 Reproducibility and stability of MEA assembly
Reproducibility and stability of MEA assembly was tested in a series of MEAs,
MEA 13 to 17, assembled using similar process conditions and the same
components. The ink formulation used for this series is shown in Table 7.7.
Table 7.7 Ink formulation used for MEA 13 to 17 Component Anode (g) Cathode (g) Pt catalyst 0.2131 0.2123 Water 1.0362 1.0399 Nafion (5 %) 0.8086 0.8042 Iso-propanol 1.0089 1.0023
The inks were stirred overnight and then electrodes were prepared. The mass of JM
Pt40/C catalyst loaded was typically 0.06 g per 5 cm2 on the anode as well as on the
cathode side respectively. This ink formulation had a somewhat higher Nafion
ionomer content than used in previous ink formulations, in order to improve
adhesion of layers and limit delamination problems.

CHAPTER 7 _____________________________________________
335
Reproducibility was tested in the assembly of MEA 13,14,15,16 and 17 using the
Lydall 6100-300 GDL for the cathode as well as the anode and the following hot
pressing conditions: 135 ºC at 40 bars for 2 min. The JM Pt40/C catalyst was used on
both anode and cathode side and catalyst loadings varied somewhat but was around
0.06 g per 5 cm2 for both the cathode and the anode.
020406080
100120140160180200
20 30 40 50 60 70 80Time (min)
Cur
rent
(mA
/ 5cm
2)
MEA13 (1.8V) MEA13 MEA14
MEA15 MEA16 MEA17
Figure 7.32 Replication study of steady state current density output at -1.7 V of MEA 13 to 17
Figure 7.33: Current density trend over time after 24h (-1.8V) and after 48h (-1.75 V) for MEA 13
The current output was obtained at -1.7 V to prevent delamination, as above this
potential vigorous evolution of gas was observed. Testing of the MEAs at room
temperature (Figure 7.32) and -1.7 V over a period of time showed that even though
catalyst loading on the electrodes varied somewhat, a relatively reproducible but low
initial current density output of between 100-140 mA over a geometric area of 5 cm2
at -1.7 V (an average of about 25 mA cm-2 at -1.7 V and 25 ºC) was achieved which
output was not stable over time, decreasing to below 60 mA over 5 cm2 at -1.7 V
after 80 min. The use of the Lydall 6100-300 GDL apparently did not have any effect
upon the performance of the cell as the output at -1.7 V was similar to the output at
that potential when Lydall 6100-200 GDL was used previously. The only difference
between these two GDL materials from the same supplier was the thickness of the
GDL layers. Increasing the applied voltage to -1.8 V (MEA 13) increased the current
density as expected, to an output of 180 mA over an Ag of 5 cm2. The catalyst
loading varied in these tests but the lack of sensitivity of the cell output to the degree
of catalyst loading indicated that the Pt catalyst was not being applied to good effect
and that catalyst loading could be optimized. Furthermore the lack of stability
0
50
100
150
200
10 20 30 40 50 60Time (min)Cu
rrent
dens
ity (m
A/5c
m2)
1.8 V1.75V
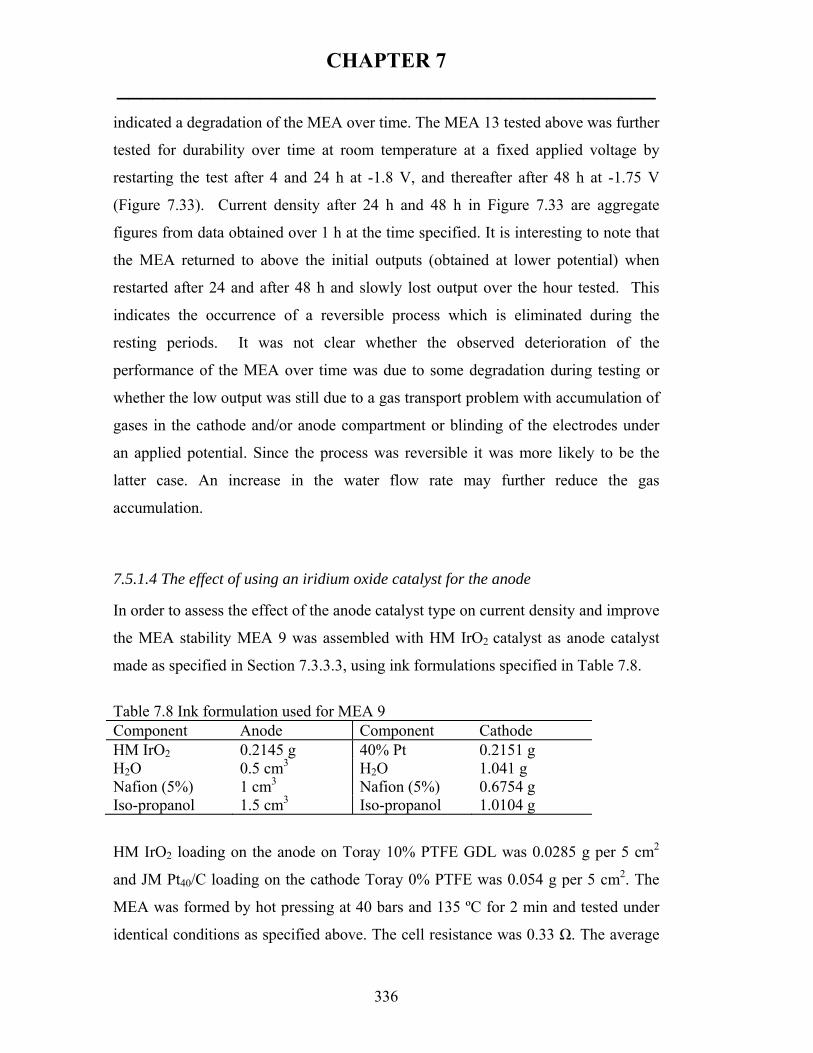
CHAPTER 7 _____________________________________________
336
indicated a degradation of the MEA over time. The MEA 13 tested above was further
tested for durability over time at room temperature at a fixed applied voltage by
restarting the test after 4 and 24 h at -1.8 V, and thereafter after 48 h at -1.75 V
(Figure 7.33). Current density after 24 h and 48 h in Figure 7.33 are aggregate
figures from data obtained over 1 h at the time specified. It is interesting to note that
the MEA returned to above the initial outputs (obtained at lower potential) when
restarted after 24 and after 48 h and slowly lost output over the hour tested. This
indicates the occurrence of a reversible process which is eliminated during the
resting periods. It was not clear whether the observed deterioration of the
performance of the MEA over time was due to some degradation during testing or
whether the low output was still due to a gas transport problem with accumulation of
gases in the cathode and/or anode compartment or blinding of the electrodes under
an applied potential. Since the process was reversible it was more likely to be the
latter case. An increase in the water flow rate may further reduce the gas
accumulation.
7.5.1.4 The effect of using an iridium oxide catalyst for the anode
In order to assess the effect of the anode catalyst type on current density and improve
the MEA stability MEA 9 was assembled with HM IrO2 catalyst as anode catalyst
made as specified in Section 7.3.3.3, using ink formulations specified in Table 7.8.
Table 7.8 Ink formulation used for MEA 9 Component Anode Component Cathode HM IrO2 0.2145 g 40% Pt 0.2151 g H2O 0.5 cm3 H2O 1.041 g Nafion (5%) 1 cm3 Nafion (5%) 0.6754 g Iso-propanol 1.5 cm3 Iso-propanol 1.0104 g
HM IrO2 loading on the anode on Toray 10% PTFE GDL was 0.0285 g per 5 cm2
and JM Pt40/C loading on the cathode Toray 0% PTFE was 0.054 g per 5 cm2. The
MEA was formed by hot pressing at 40 bars and 135 ºC for 2 min and tested under
identical conditions as specified above. The cell resistance was 0.33 Ω. The average

CHAPTER 7 _____________________________________________
337
current density after a dwell time of 1000 s at each applied potential obtained for the
5 cm2 MEA for different temperatures is presented in Figure 7.34 and Table 7.9.
0
50
100
150
200
250
300
1.3 1.5 1.7 1.9
Potential (V)
Cur
rent
den
sity
(mA)
/5cm
2
25degC 40degC 60degC
Figure 7.34 Output of MEA 9 with HM IrO2 anode catalyst at different temperatures
A clear trend of increasing current density output (mA per 5 cm2) was observed
when the temperature was increased step wise after each experiment at a specific
temperature and at the specified applied potentials between -1.3 and -2 V. The
current output achieved for this MEA in the electrolyzer test at -2.0 V and at 25 ºC
was lower (250 mA per 5 cm2) than that achieved over Pt catalysts (980 mA per 5
cm2). This poor performance could have been due to the use of the PTFE loaded
Toray GDL as this GDL type previously gave poor results most likely because of
exclusion of the feed water from the GDL due to its hydrophobicity. This MEA was
also tested for durability over 5 days after steady state polarization at -2 V. Table 7.9
specifies the current density obtained on 5 cm2 over 1000 s at -2 V and at different
temperatures for MEA 9.
Table 7.9 Current density over time for MEA 9 with IrO2 anode at different temperatures Temperature Volts Time Current 250C -2 V 1000 s 97 mA 400C -2 V 1000 s 187 mA 600C -2 V 1000 s 301 mA

CHAPTER 7 _____________________________________________
338
Under steady state polarization the output of MEA 9 with HM IrO2 anode catalyst
was stable for 5 days, whereas previous MEAs prepared with Pt containing anodes
degraded after 2 days of steady state polarization. This result showed that the
problem of MEA durability could be improved by application of the IrO2 catalyst on
the anode and indicated that catalyst type and stability may have a role in preventing
the degradation of the MEA performance over time.
7.5.1.5 The effect of an iridium black catalyst for the anode
In a further experiment MEA 28 and 30 were prepared using the ink formulation
specified in Table 7.10. The catalysts used were JM Pt40/C on carbon for the cathode
and J.Matthey Iridium black 99.8% (Stock # 12071, Lot # K01M11) for the anode.
The electrode size was 4 cm2 but the data presented in Figures 7.35 and 7.36 have
been normalized to 1cm2. The anode loading was 0.0045 g cm-1 and the cathode
loading was 0.0048 g cm-1 in the case of MEA 28 and in the case of MEA 29 the
loading was 0.0022 g and 0.0035 g respectively.
Table 7.10 Ink formulation for MEA 28 and 29
Anode Cathode Catalyst 0.1072 g 0.1071 g Water 0.25 cm3 0.25 cm3 Nafion soln (5%) 1.2476 g 1.2477 g Iso-propanol 0.5 cm3 0.5 cm3
The MEAs were assembled using hot pressing conditions of 40 bars at 130 ºC for 5
min with GDL 6100-300 for both cathode and anode and Nafion®117 as ionomer
membrane and tested in the cell at a flow rate of 4.12 mL s-1. Cell resistance was
171.187 mΩ. The comparison of the IrO2 anode catalyst with commercial JM Ir
Black as anode catalyst at 40 ºC is presented in Figure 7.35.

CHAPTER 7 _____________________________________________
339
0
50
100
150
200
250
300
1.5 1.55 1.6 1.65 1.7
Potential (V)
Cur
ren
t den
sity
(m
A)
/cm
2
MEA 28 40 deg.C MEA 29 40 deg.C
0
50
100
150
200
250
300
350
400
20 30 40 50 60 70 80Temperature (°C)
Cur
rent
den
sity
(mA
/cm
2)
Ir black(6100-200)
Ir black(6100-200)
Ir black(6100-200)
Ir black on Ti GDL
Figure 7.35 Comparison of current density (mA cm-2) of JM IrO2 with JM Ir Black (MEA28 and MEA 29) at 40ºC
Figure 7.36 Replication study of current density (mA cm-2) using Ir black as anode catalyst at -1.7 V
Figure 7.36 shows that an optimum catalyst loading on the anode or cathode may
affect the cell output, since MEA 28 which had the higher anode and cathode catalyst
loading performed at more than 250 mA cm-2 at -1.7 V and 40ºC whereas MEA29
with significantly lower catalyst loading on the anode gave a lower current density
output of under 200 mA cm-2. Figure 7.36 shows the replication studies performed
on Ir black anodes assembled into MEAs and tested at fairly similar catalyst loadings
under similar conditions. The temperature was increased at a fixed potential of -1.7
V and the results also indicated that increased activity could be expected at higher
temperatures once stability of the MEA could be achieved. Figure 7.36 also shows
that replacing the GDL 6100-300 with the Bekinit titanium mesh GDL on the anode
side (sample Ir Black on Ti GDL) had little overall effect on cell output in this case.
The Ti GDL delaminated during testing when hot-pressed under the same conditions
as the other MEAs, so the hot-pressing time should be increased in order to improve
the contacts between the components.
These results show that applying IrO2 or Ir black by itself as anodic catalyst is not the
only factor requiring attention for improving cell output of the SPE electrolyzer.
Various other factors such as ink formulations and deposition conditions (adding
different amounts of proton conductive phase as binder, loading different amounts of
catalyst), components used (different catalysts or use of hydrophobic vs hydrophobic
GDL), operational conditions (changing operating temperature, or moisturization

CHAPTER 7 _____________________________________________
340
time), may all affect the output of the cell. The multi-variant complexity of
assembly, operation and testing an SPE electrolyzer makes this system a very poor
choice as system for testing catalyst activity per se or for assessing the quality of
electrodes or the effect of different components.
7.5.1.6 Effect of ionomer membrane type
Replacing the Nafion® membrane in the MEA by using Chinese GEFC-11N type
GEFC-112 with conductivity of 0.1 S cm-1 (25 °C) was tested in order to establish
whether a thinner ionomer membrane could reduce cell resistance and improve
output accordingly. New MEAs were prepared using the thin Chinese proton
conductor, GEFC-11N type GEFC-112 (Perfluorinated Proton Exchange Membrane)
to separate the anode cathode compartment of Proton Exchange Membrane (PEM)
water electrolyzer. The MEA 38 was prepared using Lydall carbon cloth 6100-300
and JM Pt40/C catalyst (Lot#D20K28) on both cathode (loading 0.0085 g cm-2) and
anode side (loading 0.0092 g cm-2). The cell was tested at a flow rate of 3.34 mL s-1
and cell resistance was between 146.91, 112.05, 77.14, and 69.72 mΩ respectively
for each temperature tested (23, 30, 50 and 70 °C). The current density (mA cm-2)
obtained at various applied voltages and temperatures are shown in Figure 7.37.
020406080
100120140160
1.5 1.55 1.6 1.65 1.7Potential (V)
Cur
rent
den
sity
(mA
/cm
2)
23
30
50
70
Figure 7.37 Current density (mA cm-2) for MEA 38 prepared with Chinese ionomer membrane GEFC-11N type GEFC-112
No current density increase was observed with an increase in applied voltage. The
results shown in Figure 7.37 were not encouraging, as it appeared that the thin
ionomer membrane may allow gas diffusion. The overall cell resistance indicated
that the MEA did, however, maintain its integrity during testing. Cyclic voltammetry

CHAPTER 7 _____________________________________________
341
was performed to understand whether there was a possibility of short circuit by
penetration of the MEA during hot pressing. The cyclic voltammogram did not
indicate any short circuit caused by perforation of the membrane. The conclusion
drawn was that the membrane was too thin and may allow gas diffusion, or otherwise
proton conduction degradation occurred during the experiment by instability of the
membrane.
The effect of using the thicker Chinese proton conductor, GEFC-11N type GEFC
117 (Perfluorinated Proton Exchange Membrane) was tested in MEA 42. The ink
formulation used is shown in Table 7.11.
Table 7.11 Ink formulation for MEA 42. Anode Cathode Catalyst type JM IrO2 JM Pt40/CCatalyst quantity (g) 0.1072 0.10725 Water (cm3) 0.25 0.25 Nafion (5%) soln (g) 1.245 1.2459Iso-propanol (cm3) 0.5 0.5
The inks were brush coated upon the respective anode and cathode GDL. The
catalyst loading on the anode was 0.00457 g cm-1 and on the cathode 0.00475 g cm-1.
The thin Bekinit titanium GDL was applied on both anode and cathode side and hot
pressing conditions used were a pressure of 140 bars and a temperature of 130 °C
and a time of 6 min. These more stringent conditions were applied to properly
laminate the ionomer and the rigid Ti GDL layers. The cell resistance of MEA 42
was 249 mΩ. The flow rate of water was 3.34 mL s-1. The current density obtained
for MEA 42 is shown in Figure 7.38.

CHAPTER 7 _____________________________________________
342
0
50
100
150
200
250
300
350
1.5 1.55 1.6 1.65 1.7Potential (V)
Cur
rent
den
sity
(mA
/cm
2) 21°C30°C50°C70°C
Figure 7.38 The current density (mA cm-2) of MEA 42 using GEFC-11N type GEFC 117 ionomer
The activity of this MEA was quite high with an output of nearly 300 mA at -1.7 V
at 70 ºC even though the catalyst loading on the cathode side was low, and the ideal
MEA pressing conditions had not yet been established for the relatively rigid Bekinit
Ti GDL. Thus the replacement industrial ionomer of similar thickness to the Nafion®
ionomer did not negatively affect the cell performance and neither did the application
of the Ti GDL and these results show the potential of using alternative cheaper
commercial components in MEA assemblies. However various commercially
available materials may not all be suitable as components for the SPE electrolyzer as
can be seen in the case of the ionomer.
7.5.1.7 Effect of catalyst deposition method
MEA 26 was prepared using a different ink composition and deposition method
using the usual hydrophilic carbon gas diffusion layer (6100-200AC). The ink was
prepared, with the composition shown in Table 7.12.
Table 7.12 Ink Composition for MEA 26
Anode Cathode Catalyst 0.050 g 0.050 g Water 0.3999 g 0.4056 g Nafion (5%) 0.2086 g 0.2002 g Iso-propanol nil nil
This mixture with no additional solvent, apart from water and the solvent inherent in
the Nafion solution, was placed in the ultrasound bath for 1 min then magnetically

CHAPTER 7 _____________________________________________
343
stirred for 10 min and again put in the ultrasound bath for another 5 min. The
catalytic ink was then brush coated onto the carbon gas diffusion layer. The MEA
was hot pressed at 60 bars and 135 °C for 3 min. The MEA size was 4 cm2. The flow
applied in this experiment performed using MEA 26 was 4.34 mL s-1. Each data
point obtained was stable over 300s during chrono-coulometry with the GPES
system. The cell resistance was between 133.62 mΩ over the time of the experiment.
However, although this ink formulation allowed a high catalyst loading (0.0068g cm-
2) on the GDL, the high catalyst loading did not correlate with high current density
(only between 22-38 mV cm-2 at 1.8 V at 25 ºC), compared to the results obtained
previously.
A further set of experiments was performed in which the aim was to determine the
performance of catalyst, using unsupported cathode and anode catalysts deposited
directly onto the ionomer membrane. MEAs were prepared according to the
procedure described by Ioroi et al (2002). As an anode catalyst, commercial JM IrO2
was processed into an ink that was dispersed on a 5 cm2 PTFE sheet used as transfer
decal. The same procedure was done for the cathode catalyst using the JMPt40/C. The
PTFE sheets were dried at 80 °C, then the electrocatalyst-coated PTFE sheets were
placed on both sides of the pre-treated 117 Nafion membrane and finally hot-pressed
to form a MEA at 130 °C. After hot-pressing the PTFE sheets were gently removed
leaving the catalyst attached onto either side of the Nafion membrane and this
composite was placed directly against the Ti frits without any additional GDL. The
catalyst loading on PTFE for MEA IrO2 sample was 0.0013 g cm-2 on the anode and
0.0025g cm-2 JM Pt40/C on the cathode. The MEA pressing conditions were 140 bars
at 120 °C for 3 min. The MEA size was 5 cm2. However the results that were
obtained from this literature referenced method were very poor compared to the
results that had been obtained using the carbon hydrophilic gas diffusion layer (6100-
300). The maximum current density of 93.6 mA cm2 at 70 ºC, was far lower than
what was obtained previously. This confirms the vital role that adequate gas
diffusion has on the outcome of the overall MEA output.

CHAPTER 7 _____________________________________________
344
7.5.1.8 Effect of water flow rate, water purity and temperature
The effect of the water flow rate was evaluated with MEA 25. The anode catalyst
was Iridium Black (Alpha Aesar Lot#K01M11, Stock#12071) and the cathode
catalyst was JM Pt40/C. The MEA size was 4 cm2 and the anode and cathode GDL
was Lydall 6100-200 carbon cloth, with a loading of 0.0107 g catalyst on the anode
and 0.0198 g catalyst on the cathode per 4 cm2. The ink composition is given in
Table 7.13.
Table 7.13 Ink Composition for MEA 25 Component Mass Catalyst 0.1072 g Water 0.25 cm3 Nafion (5%) 1.2487 g Iso-propanol 0.5 cm3
MEA assembly conditions applied were a pressure of 40 bars and a temperature of
135 ºC for 3 min. Each data point obtained was stable over 300 s during chrono-
coulometry with the GPES system. The results were obtained at 23 ºC. Three
different water flow rates were applied namely 2 mL s-1, 3.27 mL s-1 and 4.2 mL s-1.
The cell resistance was 164 mΩ. The current density obtained when altering the flow
rate of water is presented in Figure 7.39. The direct correlation between flow rate and
current density is shown in Figure 7.40.
0
50
100
150
200
250
300
1.3 1.4 1.5 1.6 1.7 1.8 1.9 2
Potential (V)
Cur
rent
den
sity
(mA/
cm2) 4.2ml/s
3.27ml/s
2ml/s
0
50
100
150
200
250
300
1.5 2 2.5 3 3.5 4 4.5
Flow rate (ml/s)
Curr
ent d
ensi
ty (m
A/cm
2)
1.8V
1.7V
1.6V
Figure 7.39 The effect of the water flow rate on current density (mA cm-2) at 23 ºC for MEA 25
Figure 7.40 Positive correlation between flow rate and current density (mA cm-2) at applied voltages between -1.6 and -1.8 V

CHAPTER 7 _____________________________________________
345
150
170
190
210
230
250
270
290
25 30 35 40 45 50
Temperature(C)
curr
ent d
ensi
ty (m
A/c
m2)
100
150
200
250
300
350
400
20 30 40 50 60Temperature (°C)
Cur
rent
den
sity
(mA/
cm2) MEA 28-6100 300
MEA 25 -6100 200MEA 29 -6100 200
Figure 7.41 The effect of increasing temperature at a potential of -1.7 V on current density (mA cm-2) for MEA 25
Figure 7.42 Comparison of current density (mA cm-2) of MEA 25 with MEA 28 and 29 at -1.7 V
An increased flow of water from 2 mL s-1 to 3.27 mL s-1 through the cell improved
the cell output considerably from 117 to between 262 and 275 mA cm-2 at the
specified conditions because of the more efficient removal of generated gas which
would otherwise occlude the electrode surfaces and also increase the resistance of the
cell (Figure 7.39). Further increasing the flow did not improve the cell output for this
MEA therefore it is evident that an optimum flow rate was achieved at 3.27 mL s-1
for this laboratory scale electrolysis module testing system. After a flow of 3.27 mL
s-1 it was deemed that no further accumulation of gases causing blinding and
occlusion of catalytic sites would have occurred as the flow rate increase showed no
further improvement.
In a separate test, the performance of the cell was severely impacted by the use of tap
water instead of ultrapure water as feed and the detrimental effect of an impure feed
stream upon cell performance highlighted the necessity of providing consistently
high purity water to an SPE electrolyzer if catalyst poisoning or ionomer degradation
is to be prevented.
The effect of increasing temperature at a fixed applied potential on current density
for MEA 25 is shown in Figure 7.41. When the temperature was incrementally raised
over time at the same applied potential (-1.7 V) the current density improved, as was
previously observed for MEA 9. It is worth noting that the MEA 25 produced current

CHAPTER 7 _____________________________________________
346
densities that were over range for the Autolab at -1.8 V for the geometric surface
area tested (4 cm-2, but reported as 1 cm-2) which may have affected the results
obtained at the higher ranges.
Several more MEAs were made in the same manner with only slight differences in
the GDL components (using Lydall carbon cloth 6100 300 or 6100-200 GDL) used
for assembly and compared to MEA 25 as is shown in Figure 7.42. These
adjustments in the MEA preparation procedure did not show a significant effect on
performance. MEA 28 was prepared using the Lydall GDL 6100 300 compared to
the 6100-200 GDL and a higher anode loading of catalyst and performed somewhat
better than MEA 25. MEA 29 was made using an ink that was ultra-sounded for 30
min before deposition. The purpose of increasing ultrasound time was to ensure high
dispersion of the catalyst particles in the ink, however, this additional processing step
did not apparently lead to higher activity. It is also noteworthy that MEA 29 was
tested at a high temperature of 70 ºC and this MEA was robust enough to withstand
the high degree of gas evolution at this temperature.
7.5.1.9 Comparison with industrial GDL components
The objective of the following experiments was to further assess industrially
available GDL materials. Etek carbon cloth GDL and Bekinit Ti GDL materials were
assessed. By changing the GDL the assembly conditions of the MEA required
optimization for each new type of GDL. Contact between the membrane and the
electrode is very important to minimize cell resistance. Moreover, sometimes too
much pressure and an overly long hot pressing time or too high temperature may
result in ionomer membrane damage. The Etek materials came with manufacturer
specified conditions for hot pressing and these were followed. In the case of the Ti
GDL optimized conditions were determined (Thamahane, 2005), and applied in this
study.
MEA 31 was prepared using GDL Etek LT 1400-W for both the cathode and anode
side whereas MEA 32 and MEA 33 were prepared using Etek LT 1400-W as GDL

CHAPTER 7 _____________________________________________
347
for the anode with the JM IrO2 catalyst and Etek Ready-to-Press-to-MEA (ionomer
incorporated) for the cathode which is a Pt and Nafion impregnated carbon cloth on
the cathode side. In the case of MEA 32 and 33 the catalyst loading was not specified
in the case of the commercial Pt containing Etek GDL.
MEA 31, 32 and 33 were prepared using commercial J.Matthey Iridium (IV) oxide
99.99 % ink painted on the anode. The anode catalyst loading for MEA 31, 32 and
33 was 0.0025, 0.0028 and 0.0031 g cm-2 respectively. The cathode loading in the
case of MEA 31 was 0.00305 g cm-2 of JM Pt40/C.
The cell resistance for MEA 31 ranged from 313 to 270 mΩ; for MEA 32 from 244-
164 mΩ; and for MEA 33 from 223 to 179 mΩ. The cell resistances started
somewhat high at 23 ºC and decreased during testing at higher temperatures (50-70
ºC). Thus the two MEAs prepared with the Etek Ready-to-Press-to-MEA Pt and
ionomer incorporated GDL on the cathode had lower cell resistances than that of
MEA 31 made with Etek LT 1400-W on both cathode and anode sides.
The recommended Etek GDL LT 1400-W MEA pressing conditions were 30atm at
130 ºC for 5min, which were used. The MEA 31 and 32 were tested under a flow of
water of 4.34 mL s-1 at 30, 40 and 60 °C respectively and MEA 33 was tested under a
flow of 3.34 mL s-1. The results obtained (Figure 7.43) were not as high as the
current density (mA cm-2) of MEA 25 and 29 previously obtained at -1.7 V and 30 to
60ºC as can be seen in Figure 7.44. However, the anodic catalyst was also different
as the previous MEAs were prepared using JM Ir Black which may account for the
differences observed.

CHAPTER 7 _____________________________________________
348
0
20
40
60
80
100
120
140
160
180
200
1.5 1.55 1.6 1.65 1.7
Potential (V)
Cur
rent
den
sity
(mA
cm
2)MEA31 30 °C
MEA31 40 °C
MEA31 60 °C
MEA32 30°C
MEA32 40°C
MEA32 50°C
MEA33 30°C
MEA33 50°C
MEA33 70°C
0
50
100
150
200
250
300
1.2 1.3 1.4 1.5 1.6 1.7 1.8 1.9 2 2.1Potential (V)
Cur
rent
den
sity
(mA
/cm
2) MEA 25 24°CMEA 32 30°CMEA 31 30°CMEA 33 30°C
Figure 7.43 Comparison of current densities (mA cm-2) obtained for MEA 31, 32 and 33 using Etek GDL
Figure 7.44 Comparison of current densities (mA cm-2) obtained for Etek materials with MEA 25 at low temperatures
Due to the parameters that varied the results obtained for MEA 31, 32 and 33 are not
similar and no clear trend could be discerned except the effect of temperature. MEA
32 became unstable at 50 ºC and MEA 33 performed the best at a high temperature
with an output of about 200 mA cm-2 at -1.7 V and 70 ºC. These results however,
indicate that neither the Etek gas diffusion layer nor the Etek catalyst containing
GDL are critical parameters for high performance but that Lydall 6100-200AC GDL
is probably a better GDL to use. However, the durability of the Lydall materials is
not exceptionally good. Therefore the Bekinit Titanium mesh was further evaluated
as GDL. A series of MEAs were prepared using the Ti GDL. The ink formulation for
MEA 51 is shown in Table 7.14.
Table 7.14 Ink formulation for MEA 51 Anode Cathode Catalyst type HM IrO2 JM Pt40/C Catalyst quantity (g) 0.0504 0.0497 Water (g) 0.25 cm3 0.25 cm3 Nafion (5%) soln (g) 0.0622 0.0599 Iso-propanol (g) 0.5 cm3 0.5 cm3
A catalyst, HM IrO2 prepared at 350 ºC and annealed at 450 ºC, was used as anode
catalyst for MEA51 and the JM Pt40/C was used as the cathode catalyst and Nafion®

CHAPTER 7 _____________________________________________
349
117 as ionomer membrane. The ink was brush coated on the cathode (loading 0.0083
g cm-2) and on the anode (loading 0.0078 g cm-2). Bekinit Ti GDL was used on both
the cathode and anode side. Nafion® membrane 117 was used, as previously, for the
ionomer membrane. The hot pressing conditions that were applied to form the
MEA51 were a pressure of 140 bars, at 130 ºC for 6 min. The flowrate of water was
3.34 mL s-1. The results of chrono amperometry of MEA 51 are presented in Figure
7.45 and compared with replicated results in Figure 7.46 at 80 ºC. The cell resistance
of MEA 51 varied with temperature and the inverse correlation is shown in Figure
7.47.
050
100
150200250300350
400450500
1.45 1.55 1.65 1.75 1.85
Potential (V)
Cur
rent
den
sity
(mA
/cm
2)
30°C
50°C
70°C
0
200
400
600
800
1000
1200
1.4 1.5 1.6 1.65 1.7 1.8 1.9Potential (V)
Curr
ent d
ensi
ty (m
A/c
m2) MEA 51 80°C
Replicate 80°C
Figure 7.45 Chrono amperometry of MEA51 at different temperatures; flowrate of water 3.34 mL s-1
Figure 7.46 Comparison of current density (mA cm-2) of MEA 51 with replicate MEA52 at 80 ºC
0
100
200
300
400
500
600
700
20 30 40 50 60 70 80 90
Temperature (deg C)
Resi
stan
ce (m
Ohm
)
0
200
400
600
800
1000
1200
1.5 1.6 1.7 1.8 1.9 2Applied Potential (V)
Cur
rent
den
sity
(mA
/cm
2)
80°C70°C60°C50°C23°C
Figure 7.47 Inverse correlation between temperature and cell resistance
Figure 7.48 Current density (mA cm-2) of MEA 55 with Ti fibre anode and Lydall 6100-300 cathode GDL
Good replication and high outputs were achieved in the range between -1.5 and-1.7
V compared to previous results. A high current density of nearly 500 mA cm-2 was

CHAPTER 7 _____________________________________________
350
obtained at -1.7 V and at 80 ºC (Figure 7.46), which could be replicated and was
similar to that obtained by Thamahane (2005).
A further experiment was performed with MEA55 (Figure 7.48) where the GDL
used for the cathode was the Lydall 6100-300 and the anode used was the Ti GDL.
The ink formulation used is shown in Table 7.15.
Table 7.15 Ink formulation for MEA55
Anode Cathode Catalyst type Iridium black Platinum Catalyst quantity (g) 0.04 0.05 Water 0.2 cm3 0.25 cm3 Nafion (5%) soln (g) 0.048 0.06 Iso-propanol (g) 0.4 cm3 0.5 cm3
Catalyst loadings differed in the MEA 55 compared to MEA 51 and 52 prepared
previously due to the problem of changes in the viscosity of inks as a result of the
volatility of the solvent isopropanol during ink processing. The loading for the
MEA55 was 0.0025 g cm-2 for the anode and 0.0056 g cm-2 for the cathode. The hot
pressing conditions were 140 bar at 130 ºC for 6 min. Cell resistance varied from 700
to 300mΩ depending on the temperature applied. The flow rate of water was 3.34
mL s-1. The current density at different temperatures and applied potentials is
presented in Figure 7.48. The output of this MEA was slightly lower at -1.7 V than
MEA 51. However, when the potential was increased to -2 V at 80ºC an output
current density of nearly 1200 mA cm-2 was achieved.
The fact that MEA 51 was somewhat more active than MEA 55 may possibly be
ascribed to the use of the Bekinit Ti mesh on both anode and cathode side of MEA
51. The anode catalyst loading of MEA55 was also considerably lower (0.0025 g cm-
1 compared to 0.0078 g cm-1 in the case of MEA51) and could have affected the
output as well. Too much catalyst on the surface might also have had an effect on
the mass transport of water in the case of MEA51 which may have affected the
performance. Nevertheless, the current density for MEA 51 of about 550 mA cm-2 at

CHAPTER 7 _____________________________________________
351
80 ºC and 1.7 V was close to that obtained by Ioroi et al., (2002) for IrO2/Pt
composites. These values were, however, still not equivalent to other values reported
in literature (Millet et al., 1989; Khaselev et al., 2001; Hijikata et al., 2002) but it
should be considered that the output is given for one geometric cm2 and can be
increased by increasing the geometric area of the cell or increasing the operational
temperature.
7.5.1.10 Durability study
A durability study was performed on MEA 55 (prepared as is described in Section
7.5.1.7) at 60 °C and -1.7 V. The electrolyzer operated at atmospheric pressure and at
a water flow rate of 3.17 mL s-1. The electrode geometric area was 1 cm-2 and results
of the durability study are presented in Figure 7.49.
0
100
200
300
400
500
600
700
1 3 5 7 9 11 13 15 17 19 21 23 25 27Time (hr)
Cur
rent
Den
sity
(mA
/cm
2)
Figure 7.49 Durability study of HM IrO2 catalyst applied in MEA 55 at -1.7 V
Stability tests were initially performed of the MEA55 at -1.7 V and 80 °C giving a
current density of 581 mA cm-2 at the beginning in the first cycle (Figure 7.49).
Thereafter the temperature was lowered to 60 °C and a stable output of 400 mA cm-2
was achieved for 6 h. The MEA testing was stopped overnight after each subsequent
6 h testing period and cooled down, and a lower output was observed upon start up
after each shut down cycle period. A continuous testing system should be
implemented to prevent this problem. It is not clear why the output was lower in this
case after restarting the durability test, whereas previously transient changes were
observed that were eliminated by intermittent testing.
60 ºC
80 ºC

CHAPTER 7 _____________________________________________
352
Replication of the durability study with continuous testing was performed using JM
IrO2 as anode catalyst and also using a lower loading of the HM IrO2 catalyst with
other variables kept constant. Catalyst loadings differed in the various MEAs
prepared due to the problem of viscosity of inks previously mentioned. The loadings
on the anodes were 0.0072 g cm-2 for the JM IrO2 MEA (JM) sample that was stable
for 900 h, but was 0.0059 g cm-2 for the MEA sample marked HM IrO2 tested for
200 h and 0.0042 mg cm-2 for the HM IrO2 low loading sample, that was stopped
after 60 h.
0
100
200
300
400
500
600
700
0 50 100 150 200Hours
Cur
rent
den
sity
(mA
/cm
2)
JMHM IrO2HM IrO2 low loading
Figure 7.50 Replication study of MEA durability at 60 °C and -1.7 V at atmospheric pressure and water flowrate of 3.17 mL s-1.
The MEA (sample HM IrO2) was tested for 200 h (Figure 7.50) where after the
activity decreased. The cell output under continuous operation was however
generally higher (approximately 550-600 mA at -1.7 V) and much more stable than
the output seen for MEA55 which decreased from about 580 mA to below 400 mA at
-1.7 V after interrupted testing. Hence the problem of decreasing activity observed
during the intermittent testing was eliminated by continuous testing. It is surmised
that the slow decrease in activity over time could be because of contamination of the
ultrapure water which was recycled or to slow degradation of the anode catalyst. If it
was due to a reversible problem such as inadequate gas removal the output would
have decreased as previously observed prior to optimization of flow rates and cell
position. The HM IrO2 low loading sample underperformed because of the lower
catalyst loading on the anode, but still gave a steady output of above 400 mA cm-2
for 60 h under the applied conditions.

CHAPTER 7 _____________________________________________
353
7.5.1.11 The optimized MEA conditions
In a further series of MEAs the optimization of fabrication of electrodes compared to
previous MEA series was achieved. Various parameters were implemented that had
been shown to have an effect previously and conditions of preparation were adjusted
accordingly. Parameters that were improved and are demonstrated in the case of
MEA63 included 3 h ultrasound of the ink formulation and spray coating of the ink
using a Badger airbrush. The ink formulation used is shown in Table 7.16
Table 7.16 Ink formulation for MEA 63, 64 and 65
Anode Cathode Catalyst type JM IrO2 JM Pt40/C Catalyst quantity (g) 0.080 0.192 Water (g) 0.160 0.384 Nafion (5%) soln (g) 0.480 1.152 Iso-propanol (g) 1.440 3.456
In the preparation of MEA 63, 64 and 65, electrodes sizes of 12 cm-2 were prepared
for the cathodes and anodes and divided into 4 cm2 pieces for each MEA in order to
minimize differences in the electrode morphologies and loadings. The ink was spray
coated in layers and dried with a blow-drier then weighed in between each layer. The
Pt catalyst loading was minimized by depositing 0.001 g cm-2 JM Pt40/C on the
cathode and using an optimum loading of 0.006 g cm-2 JM IrO2 on the anode.
Nafion® 117 was used as ionomer in the case of MEA 63 and Nafion®115 in the case
of 64 and 65. Bekinit Ti GDL was used for the anode and Lydall 6100-300 was used
as GDL for the cathode. The MEAs were hotpressed at 400 bar at 130 ºC and 5 min,
and tested at atmospheric pressure and a flow rate of 4.2 mL s-1. Figure 7.52 shows
the current density at different temperatures for MEA 63.

CHAPTER 7 _____________________________________________
354
0
200
400
600
800
1000
1200
1.5 1.55 1.6 1.65 1.7 1.75 1.8Potential (V)
Cur
rent
den
sity
mA
/cm
2 97°C90°C80°C80 repl60°C30°C
300
400
500
600
700
800
900
1000
30 40 50 60 70 80 90
Temperature (deg C)
Curr
ent d
ensi
ty (m
A/cm
2) MEA 63MEA replication
Figure 7.51 Current density (mA cm-2) of MEA 63 at atmospheric pressure; flow rate 4.2 mL s-1
Figure 7.52 Replicate of MEA 63 tested at atmospheric pressure; flow rate 4.2 mL s-1
The current density (mA cm-2) of MEA 63 was obtained at atmospheric pressure at a
flow rate of 4.2 mL s-1 after 6 days of conditioning (Figure 7.51). Sample (80repl) is
a replicate MEA tested under similar conditions after 6 days of conditioning at 1.7 V.
MEA63 and its replicate (Figure 7.52) gave an output of above 600 mA cm-2 at 60
°C at an applied voltage of -1.7 V and above 800 mA cm-2 at 80 °C. At 97 °C a
current density of 993 mA cm-2 at -1.7 V was achieved thus the output of this
optimized MEA was nearly one Amp cm-2. The water bath temperature could not
reach 100 °C with the set-up used.
The installation of MEA 63 in the test module was also improved because of better
isolation between current collectors and clamps using Teflon washers, and a torque
wrench was used to exactly tighten the set-up. Since the performance (electrolysis
reaction) depends mainly on the potential applied between the electrodes, the contact
between the MEA and the current collector is a crucial junction, which had not
previously been controlled adequately. To estimate the magnitude of the effect, the
cell was tightened further after the initial readings were taken and the performance of
MEA63 was retested. An increase of about twice the performance was noted. At 60
ºC and 1.7 V the current before and after tightening the cell was 756 and 1204 mA
cm-2 respectively. This highlights the fact that the pressure applied between the
current collector blocks of the cell plays a critical part in the reproducibility and the
performance of the cell. This also indicates that the pressure applied should be the

CHAPTER 7 _____________________________________________
355
maximum to get the best output. Pressure was best controlled using a torque wrench
to be kept constant. The tightening of the cell to the correct reading on the torque
wrench was extremely important to eliminate problems in replicability. Contact
resistance between the GDL and flow field rib in the current collectors, as well as
GDL bulk conductivity, is strongly dependent on clamping pressure and represents a
substantial amount of the total ohmic drop (Freunberger et al., 2006). Since great
care was taken to do this tightening exactly the same in the replicate, the slight
difference for the replicate showed that there were other nuisance variables to
consider. The output of MEA 63 compared to the replicate showed that the
reproducibility of the MEA could be influenced by contact issues. The MEA 63 is
assumed to be somewhat better in performance than the replicate, because of better
isolation using Teflon washers. The effect of flow rate was previously established up
to 4.2 mL s-1. A higher flow rate was evaluated with MEA 63 (Figure 7.53) because
of the high degree of gas evolution that was achieved with the spray coated
electrodes.
720
740
760780
800
820
840
30 40 50 60
Flow
Cur
rent
den
sity
(mA
/cm
2)
at 1
.7V
Figure 7.53: Effect of water flow on current density for MEA 63 at 1.7 V and 80 °C
A rapid flow rate (setting 50 on the pump) somewhat above 4.2 mL s-1 (setting 40)
improved the current density output to above 820 mA cm-2 at 1.7 V and 80 °C but
too rapid a flow (setting 60) led to a decline in performance to levels slightly above
that observed for 3.47 mL s-1 (setting 30). In MEA 63 the highest outputs obtained
on previously prepared MEAs was considerably exceeded, and this high current
density was achieved with less than half the amount of Pt catalyst used previously for
the cathode during brush painting.

CHAPTER 7 _____________________________________________
356
One of the problems identified with ink deposition using brush coating was that
when the catalyst ink was painted on the electrode, while making the anode electrode
on Bekinit Ti mesh the ink was found to run through the GDL. Another problem was
replicating the loading of the electrodes using brush coating, where reproducing
fixed amounts of catalyst was difficult. Changing the ink deposition method to spray
coating allowed much greater reproducibility of loading and better distribution across
the electrode. Spray coating the electrodes improved these problems as careful
control of the mass of each sprayed layer was performed by drying and weighing the
electrodes between each layer deposited. However, this was a time consuming
procedure when done manually and as was shown in PIXE studies, the ink
significantly agglomerated, lowering the catalyst utilization values.
The cell performance increased with time of conditioning, from 1047 mA cm-2 on the
first day to 1253 mA cm-2 after two days and 1277 mA cm-2 after six days at 80 oC
and 1.7 V. Moreover it was observed that it took nearly a week of moisturization in
the cell for stable readings to be obtained on the MEA63 mainly because of the effect
of moisturization time upon resistance (Figure 7.54).
Day 6
Day 7 Day 3
Day 2
Day 11000
1050
1100
1150
1200
35 36 37 38 39Cell resistance (mOhm)
Cur
rent
den
sity
(m
A/c
m2)
at 8
0° 1
.7V
Figure 7.54 Effect of moisturization time on cell resistance at 80 °C and 1.8 V
It is not clear why the output tailed off after 6 days moisturization (Figure 7.54). It
may be because the water feed was recycled and may have become contaminated and
perhaps have inactivated the catalyst or else the catalyst was slowly leaching out of
the MEA during the working cycles.

CHAPTER 7 _____________________________________________
357
MEA 64 was assembled with the same materials at that of MEA63 but with
Nafion®115 instead of Nafion®117. The results compared to Nafion®117 are
tabulated below (Table 7.17) at -1.7 V and a flow rate of 4.2 mL s-1. As expected,
Nafion®115 was found to perform better than Nafion 117. The comparison between
Nafion®115 and 117 is shown graphically in Figure 7.55 in which comparison of
current density (mA cm-2) obtained using Nafion 115 (MEA63) instead of Nafion
117 (MEA 64) at different temperatures is made. Nafion 117 has a thickness of 178
µm and Nafion 115 is 127 µm thick.
Table 7.17 Nafion® 117 compared with Nafion®115 at -1.7 V; Flow 4.2 mLs-1. Temperature / oC MEA 63 Nafion 117 / mA cm-2 MEA 64 Nafion 115 / mA cm-2
30 377 404
60 601 685
80 805 899
90 909 986
The cell output was improved by about 10 % merely by using a thinner ionomer
membrane and thus reducing the cell resistance as is shown in Figure 7.55 and 7.56.
200
300
400
500
600
700
800
900
1000
1100
20 40 60 80 100
Temperature (deg C)
Cur
rent
den
sity
(mA
/cm
2)
Nafion 117
Nafion 115
0
10
20
30
40
50
60
70
30 40 50 60 70 80 90
Temperature (deg C)
Res
ista
nce
(mill
iOhm
) Nafion117Nafion115
Figure 7.55 Comparison of current density (mA cm-2) obtained using Nafion 115 (MEA63) instead of Nafion 117 (MEA 64) at -1.7V and different temperatures
Figure 7.56 Comparison of overall cell resistance (mΩ) at different temperatures using either Nafion 117 or Nafion 115 as ionomer in MEAassembly

CHAPTER 7 _____________________________________________
358
Comparison of overall cell resistance (mΩ) prior to applying a potential across the
cell, at different temperatures, using either Nafion®117 or Nafion®115 as ionomer in
MEA assembly is shown in Figure 7.56. The difference in resistance was more
pronounced at lower temperatures and overall cell resistance was reduced between
14 to 8 mΩ by using Nafion®115 instead of the thicker Nafion®117. Another MEA
was assembled with Nafion®112 membrane, expecting the performance to be better
than that of Nafion®115. However, preliminary tests showed a direct contact between
the electrodes (cell resistance of 1.69 mΩ was noted). The reason for this might be
due to a puncture of the ionomer membrane causing a short circuit. Hot-pressing the
membrane using previous MEA hot pressing conditions might have perforated the
membrane. Optimizing the hot pressing conditions for this thin membrane type or
other similar types may in future make it possible to reduce the cell resistance even
more, without short circuiting the cell.
The electric cables leading to the power source were changed with that of a low
resistance copper type cable. The leads were tested for resistance and 1 m of the
cable used in previous tests (rated 60 V DC; 16 A) had a resistance of 21.20 mΩ m-1
whereas the new cable used as leads had a resistance of 5 mΩ m-1. The change in
current density observed when using either high or low resistance cabling as
electrical leads between the power source and the cell is shown in Figure 7.57.
0
200
400
600
800
1000
1200
1400
1600
1800
2000
1.4 1.5 1.6 1.7 1.8
Potential (V)
Cur
rent
den
sity
(mA/
cm2)
High resistance Low resistance
Figure 7.57 Cell performance using MEA 65 made with Nafion 115 and tested with low and high resistance leads
The cell with MEA 65 was tested at 90 oC and at -1.7 V the current density was
909.25 mA cm-2 before changing the wires and 1248 mA cm-2 after changing the

CHAPTER 7 _____________________________________________
359
cables (Figure 7.57). The increase in the current density output is attributed to the
minimized resistance of the new cables. These results again emphasize the fact that
cell output was incrementally improved step by step not only by optimizing the
components used in the assembly but also operational and systemic conditions. This
improvement was most noticeable at higher applied potentials. The cell was tested
with low resistant cables at 97 oC and -1.7 V and the current density output was 1329
mA cm-2, an improvement of over 480 mA cm-2 (38%). This was the highest output
achieved in this study and is also significantly higher than electrolyzer output
typically reported in literature.
7.6 CONCLUSIONS
The objective of this study was to fabricate the state of the art of membrane electrode
assemblies (MEAs), gaining detailed understanding of electrode structure in order to
get maximum catalyst utilization. Issues of reproducibility for scalability as well as
durability and stability were addressed. Different types of MEA- preparation
methods were carried out in search for conditions that would give better catalyst
utilization. Another objective was to study the effect of catalyst loading on the
activity of water electrolysis based on the anode electrode where the water oxidation
takes place. Finally, it was necessary also to study the effect of operational
parameters such as temperature and water flow rate during water electrolysis.
On the development of membrane electrode assemblies (MEA) various components
were evaluated for effectiveness as part of a MEA. This was done by using different
diffusion layers (GDL) and ionomer membranes and testing the activity at similar
catalyst loading and conditions. Ink formulations and deposition methods were
varied to improve homogeneity of electrodes and attain even loading. The inks were
applied either directly onto the membrane or onto different types carbon cloths
(Lydall) or titanium fibre (Bekinit, thickness 0.1 mm) by a brushing method or spray
coating method.

CHAPTER 7 _____________________________________________
360
The cell performance was increased with temperature due to enhancement of
electrode kinetics, proton transport, and also the conductivity of the membrane. The
performance was also improved by higher water flow rates due to better removal of
gaseous product accumulating in the anode and cathode compartments that caused
blinding of electrodes and increased cell resistances. It also became apparent that
components provided commercially for fuel cells, such as thin ionomer membranes,
are not necessarily usefully applied in a solid polymer electrolyte electrolyzer.
Several of the commercially available components were not beneficial to improving
cell output and were too heat labile or fragile to withstand the hot pressing conditions
applied. Moreover, it was highly problematic to achieve adequate replication, due to
the many different variables that had to be accurately controlled both in the assembly
and in the operational conditions. Delamination of MEA was a problem which
required optimization of laminating conditions during hot pressing and pressure,
temperature, as well as hot pressing time were iteratively improved.
Bekinit Titanium fibre substrate was the most promising anodic GDL and catalyst
support, compared with GDL such as Lydall carbon cloth (6100-300 and 6100-200),
Toray carbon cloth (hydrophobic), or with direct deposition methods onto the
membrane. The cathode loading of 1 mg cm-2 and anode loading of 6 mg cm-2 was
found to be the optimum loading that could be used for water electrolysis. The
Nafion®115 membrane proved to be the best ionomer membrane applied in this
study. High current densities of 1329 mA cm-2 at 97 oC and 1.7 V were achieved
when the correct choice of components as well as the optimum catalyst loading for
anode and cathode was made but this was only achieved when the system parameters
such as high operational temperature, optimum water flow rate, extensive
moisturization time, correct current collector clamping pressure, proper insulation
and low resistance electrical leads were implemented.
This study demonstrated that applying highly active electrocatalysts in the MEA is
not the only factor requiring attention for improving cell output of the SPE
electrolyzer. Various other factors such as ink formulations and deposition

CHAPTER 7 _____________________________________________
361
conditions (adding different amounts of proton conductive phase as binder, loading
different amounts of catalyst), components used (different catalysts or use of
hydrophobic vs hydrophobic GDL), operational conditions (changing operating
temperature, or moisturization time), as well as systemic components (such as
electrical resistivity of leads, proper insulation, adequate water flow paths) may all
affect the output of the cell. The multi-variant complexity of assembly, operation
and testing an SPE electrolyzer makes this a very poor choice as system for testing
catalyst activity per se or for assessing the quality of electrodes and even the most
active catalyst will not enhance SPE cell performance unless other parameters are
adequately addressed.

CHAPTER 8 ___________________________________________
362
8. OVERALL CONCLUSIONS The summary of findings and the overall conclusions of the thesis are
consolidated in this chapter. A summary of the contributions that this dissertation
has made as well as recommendations for future research are then presented. A
list of the outputs in terms of the peer reviewed publications and other
presentations of this study are then provided as a citations list.
8.1 SUMMARY OF FINDINGS
South Africa, the main supplier of PGM metal, stands to benefit from
diversification of Pt containing materials and developed capabilities in the
emerging hydrogen economy. When hydrogen production cost can be reduced
and the output increased, a viable hydrogen economy may be realized. An
overview of the literature showed the necessity for improving electrolyzer
systems for hydrogen production to facilitate the realization of the hydrogen
economy. Diverse authors detail what the problems are that limit the large scale
application of hydrogen from water electrolysis systems, which mainly is related
to the cost of the components and excessive power consumption of operating
electrolyzer systems.
The purpose of this study was the development of nanophase noble metal
electrocatalysts based on high surface area supports and their application in
composite gas diffusion electrodes, for improving the efficiency of hydrogen
generation by water electrolysis through reduction of the overvoltage of
electrolyzer systems. The development of a three dimensional array of active sites
on electrodes was the main approach as the necessary catalytic activity has to
date not yet been achieved on a two dimensional planar electrode element.
Incorporation of nanophase components into electrolyzers required consideration
of many aspects of assembly for integration into the working system.
Three dimensional macro-, meso- and microporous supports were therefore
selected or developed as matrixes to stabilize nanophase electro active noble

CHAPTER 8 ___________________________________________
363
metals in high dispersion and low agglomeration. Microporous zeolites such as
FAU, mesoporous Si materials such as HMS and MCM-41, newly developed
conductive mesoporous carbon (OMC), and carbon nanotubes (CNT) were
explored as supports suitable for stabilizing electro catalytic nanoparticles. The
characterization of these materials elucidated their porous nature and their
stability. A CVD technique using LPG as a carbon source, pyrolized upon a
mesoporous Si matrix, HMS, produced nanostructured ordered mesoporous
carbon (OMC) with graphitic character after removing the Si matrix. The low
angle XRD peak, observed for the HMS silica precursor and also the resulting
OMC analogue of HMS, is a typical feature of mesoporous materials with pores
in the region of 1-3 nm, and the porosity of the OMC was confirmed by N2
adsorption and HRTEM. Selected area diffraction established that a crystalline
graphitic material was formed in agreement with XRD results. This OMC is
useful as a conductive three dimensional porous matrix for support of catalytic
nanophase Pt metals.
Processes to incorporate active nanophase Pt metal electrocatalysts into
microporous FAU, and mesoporous HMS or MCM-41 were developed. The
influence of the nature and porosity of the catalyst support upon activity was
demonstrated with Pt FAU< PtHMS=PtMCM-41 showing the beneficial effect of
a nanometre sized porous structure compared to an Ångstrom sized porous
support. Thus the pore size of the host matrix support is a significant parameter in
preparing supported electrocatalysts.
Methods for preparing active nanophase Pt electrocatalysts on CNT or CNT
paper substrates were developed. The nano-dimensions of the CNT fibres in the
CNT paper that could be utilized as a gas diffusion layer, resulted in a material
with macropores an order of magnitude smaller than the typical commercial
carbon cloths applied as gas diffusion layers. The CNT paper also showed high
conductance. Deposition of Pt on CNT paper by a simple galvanic displacement
technique formed a new, highly conductive and active Pt gas diffusion electrode,
eliminating the extensive processing required to prepare composite gas diffusion
electrodes (GDE). It was found that the reduction potential of the sacrificial
anode (Al, Fe, Pb foils) did not correlate with Pt deposition rate but bimetallic

CHAPTER 8 ___________________________________________
364
systems were controlled by deposition time. CNT were also applied to prepare a
Pt/CNT (propanol) electro catalyst via a wet chemical route using propanol and
the analysis of its structure showed well dispersed Pt nanoparticles. The new
electrocatalysts were compared to an industry standard commercial Pt catalyst
stabilized on Vulcan carbon black for electro activity and in the case of the
electro catalyst sample Pt/CNT_BP (Pb foil (20 min)) the anodic peak indicating
the overpotential of hydrogen evolution (-0.68 V) was similar to the case
observed in the Pt/CNT (propanol) sample (-0.66 V) and both peaks occurred at
lower overpotentials than the commercial JM Pt40/C sample (-0.77 V) when
cycled between -1100 and 1100 V at 50 mV s-1 and sensitivity of 100 µA V-1 in a
ClLiO4 (Ag/AgCl) system. Thus the use of CNT as support substrate and the Pt
deposition techniques applied were shown to result in electrocatalysts that could
reduce the energy requirements of the hydrogen evolution reaction.
Pt-FAU, Au–HMS, Pt-HMS and Pt-MCM were applied as examples of
processing 3-dimensional supported nanophase materials, with high surface areas
and high porosity, into supported films to form composite gas diffusion
electrodes (GDE). Nanoparticles of Sb/SnO were used in preparation of such
films, as an example of processing non-supported nanophase particulates into
composite GDE. It was shown that Pt-FAU, Au–HMS, -HMS and Pt-MCM
containing electrodes achieved current densities of ~650 mA cm-2 at 60 °C at an
applied potential of -2V in an alkaline electrolyzer. It was found that nanophase
Sb/SnO, a non noble nano particulate, could also be applied as electro catalyst for
hydrogen production. Homogeneous distribution and loadings of nanophases on
electrode substrates was dependent upon deposition method, substrate type,
binder type as well as ink formulation.
Optimization of the ink formulation and the ink deposition method using
screenprinting produced homogeneous and well dispersed layers of 0.001 -
0.0015 g cm-2 of electro catalyst per unit area of substrate. Substitution of
isopropanol with 1,2 propandiol as solvent in inks resulted in an improvement of
viscosity and viscoelasticity which was tailored by increasing the amount of
water and solids in the formulation to print quality catalytic films on Nafion®
substrates. Rheological determination of ink formulations gave good predictive

CHAPTER 8 ___________________________________________
365
information of the printability of an ink upon paper. The optimum ink
formulation had a ratio of between 3 - 1 : 1 of 1,2 propandiol : water, a liquid :
solid ratio of between 6-8 : 1 and a storage modulus (G') of between 84 and 224.
Reversible viscoelastic behaviour of inks correlated with good print quality. The
morphology of the film was strongly affected by the ink formulation. Film
quality depended upon the polarity and viscosity of the solvent, the printed layer
thickness, the nature and the surface energy of the substrate. Hence, no matter
how active the electro catalyst, if the deposition of the film on the GDE substrate
is substandard, resistance will be high and electro activity low.
A method using of a paper substrate was developed to evaluate the electronic
characteristics of films separately from the GDL substrate using Variable Field
Hall measurements. Variable Field Hall measurements showed that the electronic
characteristics of catalyst containing films could be separately evaluated from the
substrate by use of the paper substrate method. The addition of a conductive
fullerene nanophase to films printed upon Nafion® substrates may enhance the
electron charge transfer. It was found that improving the film characteristics by
improved ink formulations and print quality reduced the positive Sheet Hall
Coefficient significantly and promoted n-type rather than p-type carriers. The
substrate chosen as support for the electrocatalytic film was shown to have a very
significant effect on the overall performance of the electrode. The difference in
resistance observed could not be ascribed to catalyst loading only but also to the
print quality and the conductive pathway created by adjoining clusters of printed
electro catalyst, which was affected strongly by the ink formulation. CNT based
Pt containing electrodes were studied and it was found that n-type carrier CNT
paper with low resistance and high carrier density switched to a p-type carrier
upon deposition of Pt by galvanic displacement.
Technological optimization of membrane electrode assemblies applicable in a
solid polymer electrolyte electrolyzer resulted in a current density of 1.33A cm-2
at 97 oC and -1.7 V. Several of the commercially available components were not
beneficial to improving cell output. Bekinit Titanium fibre substrate was the most
promising anodic GDL catalyst support, and hydrophilic Lydall carbon cloth
(6100-300 and 6100-200) was suitable as cathode GDL. A cathode loading of 1

CHAPTER 8 ___________________________________________
366
mg cm-2 Pt/C and anode loading of 6 mg cm-2 IrO2 was found to be the optimum
catalyst loading using commercial catalysts. The Nafion®115 membrane proved
to be the best ionomer membrane. High output was realized when system
parameters such as operational temperature, water flow rate, moisturization time,
current collector clamping pressure, insulation and low resistance electrical leads
were optimized.
Various factors such as ink formulations and deposition conditions (adding
different amounts of proton conductive phase as binder, loading different
amounts of catalyst), components used (different catalysts or use of hydrophobic
vs hydrophobic GDL), operational conditions (changing operating temperature,
or moisturization time), as well as systemic components (such as electrical
resistivity of leads, proper insulation, adequate water flow paths) may all affect
the output of the SPE electrolyzer cell.
8.2 CONCLUSIONS
High dispersal of nanophase metals in three dimensional substrates enhanced the
process of water electrolysis. Composite gas diffusion electrode surfaces
containing nanophases resulted in high activity for hydrogen production because
of high dispersion, high surface area and enhanced transport of reagents and
products. Highly dispersed active nano sized Pt, Au, Ir and SnO components
reduced the over voltage of electro catalytic reactions resulting in overall increase
in energy efficiency of the processes. Nanophase electro catalytic materials were
successfully incorporated into composite gas diffusion electrodes in catalytic
films and maintained high catalytic activity for hydrogen production and
achieved high electro- and proton conductivity. This study demonstrated that
applying highly active electrocatalysts in the MEA is not the only factor requiring
attention for improving cell output of the SPE electrolyzer. The multi-variant
complexity of assembly, operation and testing an SPE electrolyzer makes this a
very poor choice as system for testing catalyst activity per se or for assessing the
quality of electrodes and even the most active catalyst will not enhance SPE cell
performance unless other parameters are adequately addressed.

CHAPTER 8 ___________________________________________
367
8.3 SUMMARY OF CONTRIBUTIONS
In this dissertation the following contributions were made:
CHAPTER 3:
Demonstrated new route to make graphitic ordered mesoporous carbon that can
be applied as nanophase metal catalyst support
Developed fabrication route for preparing CNT paper from multiwalled CNT
CHAPTER 4:
Developed routes to prepare nanophase Pt and Au electrocatalysts based on
microporous (FAU zeolite) and mesoporous supports (HMS and MCM-41)
Demonstrated preparation and metal reduction procedures for fabricating
nanophase electrocatalysts that can be easily upgraded to industrial conditions
Developed CVD route using LPG to deposit a conductive layer of carbon on Si
matrix supported electrocatalysts
Demonstrated proof of concept of new route to use CNT paper as nanophase
catalyst support by deposition of bimetallic nanophase electrocatalysts using a
galvanic displacement technique
Demonstrated preparation procedure to directly incorporate the active nanophase
bimetallic Pt containing particle on CNT paper suited as gas diffusion electrode
thus eliminating the need for processing of pre-prepared electrocatalysts into
films for deposition on substrates to form composite electrodes
Pt on CNT paper by a simple galvanic displacement technique formed a new,
highly conductive and active Pt containing gas diffusion electrode

CHAPTER 8 ___________________________________________
368
CHAPTER 5:
Developed processing methodology by sequential deposition for incorporating
and stabilizing supported or unsupported nanophase electrocatalysts into catalytic
films as composite gas diffusion electrode materials for alkaline electrolyzer
systems
Prepared new nanophase containing catalytic ink formulations that can be
spraycoated for preparation of composite electrodes
Developed nanophase deposition procedures suitable for different substrate types
to form composite electrodes containing nanophase electrocatalysts
Achieved techniques of electrode preparation incorporating supported nano
materials for hydrogen production in alkaline electrolyzers
Developed rapid screening technique to screen materials for activity and
durability in high electrolyte systems
Developed stable and durable nanophase nanophase containing composite gas
diffusion electrodes capable of high current densities with high hydrogen
production capacity
Demonstrated the suitability of various nanophase materials, proton and electron
conductive phases, binders and solvents for composite formation on a variety of
conductive substrates
Demonstrated the activity of microporous and mesoporous supported
electrocatalytic nanoparticles in composite format for hydrogen production in
alkaline electrolyzers
Demonstrated the activity of unsupported SbSnO nanoparticles in composite
format for hydrogen production in alkaline electrolyzers

CHAPTER 8 ___________________________________________
369
Fabricated electrodes containing nanophase particulates of Sb/SnO or supported
electrocatalysts, Pt FAU, Pt MCM-41, Pt HMS or Au HMS composite GDE
materials prepared with Nafion® as binder, with capability of current densities of
between 600 and 750 mA cm-2 at 60 °C at an applied potential of -2 V in an
alkaline electrolyzer.
CHAPTER 6:
Demonstrated an approach to achieving homogeneity and high dispersion of
active nanophases in composite format by matching substrate and electro catalyst
type
Demonstrated method to characterize homogeneity and high dispersion of the
active metal component in composite gas diffusion electrodes using micro PIXE
Developed new nanophase containing catalytic ink formulations that are printable
by the screenprinting technique
Developed methodology for direct screen printing of nanophase containing
catalytic ink upon Nafion or other substrates
Developed screenprinting ink formulations with a ratio of between 3 - 1 : 1 of 1,2
propandiol:water, a liquid: solid ratio of between 6-8:1 and a storage modulus
(G') of between 84 and 224.
Demonstrated the application of the Hall measurement technique for
characterizing the electronic properties of films containing the nanophase
electrocatalysts
Developed a paper substrate methodic that allowed the electronic characteristics
of films to be evaluated separately from the substrate using Variable Field Hall
measurements
CHAPTER 7:

CHAPTER 8 ___________________________________________
370
Developed optimized process conditions for preparation of membrane electrode
assemblies that are applicable to SPE electrolyzers and regenerative fuel cells
Developed stable and durable membrane electrode assemblies applicable to SPE
electrolyzers
Demonstrated the role of process variables in the output of an SPE electrolyzer
and the relative contribution of each variable upon the functionality of the system
Obtained overall increase in energy efficiency of the electrolysis process both in
alkaline and SPE electrolysis systems
Developed a membrane electrode assembly fabrication process using Bekinit
Titanium fibre anodic GDL catalyst support, and hydrophilic Lydall carbon cloth
(6100-300 or 6100-200) cathode GDL with cathode loading of 1mg cm-2 Pt/C and
anode loading of 6mg cm-2 IrO2 and a Nafion®115 membrane, that produced a
current density of 1.33A cm-2 at 97oC and -1.7V
8.4 RECOMMENDATIONS AND FUTURE RESEARCH
Future work in composite preparation by sequential deposition should include the
following aspects:
• Investigate other ratios, different loadings and different types of
nanophase electrocatalysts should be investigated.
• The lowest required loading of noble metal on supports should be
determined.
• The possibility to use nanophase metal oxides such as SnO should be
further explored.
• The use of the new mesoporous conductive OMC substrate to support
metals should be further evaluated and optimized.
• Binder to conductive phase ratios should be further optimized.

CHAPTER 8 ___________________________________________
371
• More resilient supports that are also conductive should be sourced and
used as substrates for hotpressing
• Other conductive binders should be investigated in spraycoating
techniques as Nafion® is expensive.
• Processing techniques would need to be automated to prepare
reproducible materials in a standardized manner.
• Processing techniques would need to be automated to prepare
reproducible materials in a standardized manner.
• The benefit of higher activity of the newly developed electrocatalysts and
gas diffusion electrodes should be explored in the SPE electrolyzer
system.
• The optimum catalyst type for the O2 evolution anode used in water
electrolysis based upon bimetallic nanophase metal oxides should be
explored in the form of physical admixtures with conductive binders
• Printing technologies such as screen printing or ink jet printing should be
further explored
• Standardized fabrication procedures and high throughput screening
techniques to screen materials for activity and durability.

CHAPTER 8 ___________________________________________
372
8. 5 CITATIONS
Petrik, L. F.; Z. G. Godongwana; P. Ndungu; V. M. Linkov; and S. Liao. 2008.
LPG synthesis of carbon analogue of HMS. In: Hadjiivanov, K.; V. Valtchev; S.
Mintova; and G. Vayssilov (eds.). Topics in Chemistry and Material Science,
Vol.1: Advanced Micro- and Mesoporous Materials. Sofia: Heron Press
L.F.Petrik, Z.G.Godongwana, E.I. Iwuoha. Platinum Nanophase Composite Gas
Diffusion Electrodes. In Press: POWER Ms. Ref. No 10855. J. Power Sources
(2008), doi:10.1016/j.jpowsour.2008.06.091
L. F. Petrik, Z. G. Godongwana, P. Ndungu, A. Nechaev, S.Liao, V. Linkov.
Synthesis of Carbon Nanostructured Materials Using LPG. In Press: Ms. Ref.
No.: MICMAT-D-08-00143. Microporous and Mesoporous Materials (2009),
doi:10.1016/j.micromeso.2008.05.030
INTENDED PUBLICATIONS AND JOURNALS Petrik, L. F., P. Ndungu, E.I. Iwuoha. 2008. Galvanic displacement technique for
preparing gas diffusion electrodes based on carbon nanotubes. Submitted to
J.Power Sources
Petrik, L.F. V.Fester, E.I. Iwuoha. 2008. Rheological characteristics of
screenprinting ink formulations for the preparation of nanophase containing
composite electrodes. (In preparation).
Petrik, L.F. M.Härting, D.T. Britton, E.I. Iwuoha. 2008. Electronic characteristics
of nanophase containing composite electrodes. (In preparation). To be submitted
to the J.Power Sources

REFERENCES _____________________________________________
373
al-Abadleh Hind, A.; and V. H. Grassian. 2003. Oxide surfaces as environmental
interfaces. Surface Science Reports 52 (3–4): 63–161. Abaoud, H. A.; M. Ghouse; K. V. Lovell; and G. N. al-Motairy. 2005. A hybrid
technique for fabricating PEMFC’s low platinum loading electrodes. International Journal of Hydrogen Energy 30 (4): 385–91.
Abbott, S.. 2005a. Explaining moiré effects in screen printing. News release from MacDermid Autotype, Wantage, UK. In: Mayor, I. (ed.), Printingtalk, 18 February 2005. [Printingtalk, free e-mail newsletter.] London: Pro-Talk Ltd / Centaur Media plc. http://www.printingtalk.com/news/aot/aot109.html. [May 2008]
Abbott, S.. 2005b. Screen printing moiré—its main characteristics. News release from MacDermid Autotype, Wantage, UK. In: Mayor, I. (ed.), Printingtalk, 30 March 2005. [Printingtalk, free e-mail newsletter.] London: Pro-Talk Ltd / Centaur Media plc. http://www.printingtalk.com/news/aot/aot110.html. [May 2008]
Adora, S.; J. P. Simon; Y. Soldo-Olivier; R. Faure; E. Chaînet; and R. Durand. 2004. Electrochemical deposition of platinum nanoparticles on carbon: A study by standard and anomalous x-ray diffraction. ChemPhysChem 5 (8): 1178–84.
Ahmed, S. M.. 1986. The Canadian contribution to the I.E.A. [International Energy Agency] work on photoelectrolysis of water. International Journal of Hydrogen Energy 11 (10): 627–37.
Ahmed, S.; J. I. Shan; L. Petrik; and V. M. Linkov. 2004. Scanning electrochemical microscopic study of hydrogen oxidation and evolution at electrochemically deposited Pt nanoparticulate electrode incorporated in polyaniline. Analytical Sciences 20 (9): 1283–7.
Ahn, S.; and B. J. Tatarchuk. 1997. Fibrous metal–carbon composite structures as gas diffusion electrodes for use in alkaline electrolyte. Journal of Applied Electrochemistry 27 (1): 9–17.
Allen, E.; P. Smith; and J. Henshaw. 2001. A review of particle agglomeration. Report no. AEAT/R/PSEG/0398, 25 April 2001. Prepared for US Department of Energy (DOE). Contract no. DE-GI01-00EW-56054. http://www.tanks.org/ttgdoc/AEAT-R-PSEG-0398.doc. [May 2008]
Alonso, J. A.; and X. Turrillas. 2005. Location of H+ sites in the fast proton-conductor (H3O)SbTeO6 pyrochlore. Journal of the Chemical Society, Dalton Transactions 2005: 865–7.
AMIA Labs. 2005. Application note C01, Crystallite size and microstrain analysis of thin films. Leesburg, VA: AMIA Laboratories. http://amialabs.com/AppNoteC01.swf. [May 2008]
Andolfatto, F.; R. Durand; A. Michas; P. Millet; and P. Stevens. 1994. Solid polymer electrolyte water electrolysis: Electrocatalysis and long-term stability. International Journal of Hydrogen Energy 19 (5): 421–7.
Appleby, A. J.; and G. Crepy. 1979. Improvements in electrolysis technology in alkaline solutions. In: Veziroglu, T. N.; and W. Seifritz (eds.), Hydrogen Energy System. Proceedings of the Second World Hydrogen Energy Conference (WHEC), Zurich, Switzerland, 21–24 August 1978 (Vol 1). Oxford: Pergamon Press, 227–40.

REFERENCES _____________________________________________
374
Ashida, T; T. Shimamune; Y. Nishiki. 1998. Gas diffusion electrode and electrolytic
method using it. US Patent 5733430, issued 31/03/1998; Application No. 626924 filed on 04/03/1996; Assignee Permelec Electrode Ltd.
ASTM Standard F76–86. 2002. Standard test methods for measuring resistivity and Hall coefficient and determining Hall mobility in single-crystal semiconductors. Annual Book of ASTM Standards, Vol. 10.04: Electronics; Declarable Substances in Materials. West Conshohocken PA: ASTM International. http://www.astm.org/Standards/F76.htm. [May 2008]
Atkins, P. W.. 1989. General Chemistry. New York: Scientific American Books, distr. W. H. Freeman and Co., 644.
Bahar, B.; A. R. Hobson; and J. A. Kolde. 1997. Electrode apparatus containing an integral composite membrane. US patent 5635041, issued 1997/06/03. Application no. 567466, filed 1995/12/05. Assignee: W. L. Gore & Associates, Inc..
Bahar, B.; A. R. Hobson; and J. A. Kolde. 1997. Integral composite membrane. US patent 5599614, issued 1997/02/04. Application no. 561514, filed 1995/11/21. Assignee: W. L. Gore & Associates, Inc..
Barbir, F.. 2005. PEM electrolysis for production of hydrogen from renewable energy sources. Journal of Solar Energy 78 (5): 661–9.
Bard, A. J.; and L. R. Faulkner. 2001. Ch. 10, Techniques based on concepts of impedance. In: Electrochemical Methods: Fundamentals and Applications, 2 ed.. New York: John Wiley & Sons, 368–416.
Bard, A. J.; and L. R. Faulkner. 2001. Electrochemical Methods: Fundamentals and Applications, 2 ed.. New York: John Wiley & Sons, 137; 226–49; 376–87.
Barrer, R. M.. 1981. Zeolites and their synthesis. Zeolites 1 (3): 130–40. Barrer, R. M.. 1982. Hydrothermal Chemistry of Zeolites. London: Academic Press. Bass, L. J.; and G. L. Turner. 1997. Anion distributions in sodium silicate solutions.
Characterization by 29SI NMR and infrared spectroscopies, and vapor phase osmometry. Journal of Physical Chemistry B 101 (50): 10638–44.
Bauduin, P.; L. Wattebled; S. Schrödle; D. Touraud; and W. Kunz. 2004. Temperature dependence of industrial propylene glycol alkyl ether/water mixtures. Journal of Molecular Liquids 115 (1): 23–8.
Baughman, R. H.; A. A. Zakhidov; and W. A. de Heer. 2002. Carbon nanotubes—the route toward applications. Science 297 (5582): 787–92.
Beer, H. B.. 1969. Improvements in or relating to electrodes for electrolysis. British patent GB1147442, published 1969/04/02. Application no. 20133/65 (GB19650020133), filed 1965/05/12. Assignee: Chemnor Corporation AG (BR). http://www.wikipatents.com/gb/1147442.html. [May 2008]
Bekaert BFT. [nd]. About metal fibres. [What are metal fibres; metal fibre manufacturing – bundle drawing; shaving (Bekinit®); available forms/alloys; unique characteristics.] http://www.bekaert.com/bft/About%20metal%20fibres.htm. [May 2008]
Bekinit K. K. [nd]. Bekinit® sintered titanium fiber—Titanium porous structure. http://www.bekinit.co.jp/downloads/Engtitanium_outlined.PDF. [May 2008]
Bekinit K. K. The Metal Fiber Company. [Development, manufacture using metal fiber products. Joint venture between N.V. Bekaert S.A., Belgium, and Nippon

REFERENCES _____________________________________________
375
Institute of Technology (NIT), Saitama Prefecture, Japan.] http://www.bekinit.co.jp/English/. [May 2008]
Beni, G.; S. Hackwood; and J. L. Jackel. 1982. Continuous electrowetting effect. Applied Physics Letters 40: 912.
Beni, G.; and J. L. Shay. 1978. Electrochromism of heat-treated anodic iridium oxide films in acidic, neutral, and alkaline solutions. Applied Physics Letters 33: 567.
Benning, P. J.; F. Stepniak; D. M. Poirier; J. L. Martins; J. H. Weaver; L. P. Chibante; and R. E. Smalley. 1993. Electronic properties of K-doped C60(111): Photoemission and electron correlation. Physical Review B: Condensed Matter 47 (20): 13843–7.
Benson, J.; G. Gericke; G. Mutemeri; W. Nel; L. Petrik; R. Pickering; R. Rossouw; and D. van Vuuren. 2006. South African fuel cell and hydrogen economy baseline study. CSIR File: Contract 86DB / HT544. Prepared for F. Molebatsi, Department of Science and Technology (DST) in July 2004. Issued in February 2006.
Bentham, J.. 2005. News: Shell opens hydrogen fueling site in DC. Fuel Cells Bulletin. 2005 (1) January: 5
Bessel, C. A.; and D. R. Rolison. 1997. Topological redox isomers: Surface chemistry of zeolite-encapsulated Co(salen) and [Fe(bpy)3]2+ complexes. Journal of Physical Chemistry B 101 (7): 1148–57.
Blouin M.; and D. Guay. 1997. Activation of ruthenium oxide, iridium oxide, and mixed RuxIr1-x oxide electrodes during cathodic polarization and hydrogen evolution. Journal of the Electrochemical Society 144 (2): 573–81.
Bockris, J. O’M. (ed.). 1973. Electrochemistry. Vol. 6 of Physical Chemistry Series 1, ser. ed. A. D. Buckingham. London: Butterworth, 49–105.
Bradley, S. A.; M. J. Gattuso; and R. J. Bertolacini (eds.). 1989. Characterization and Catalyst Development: An Interactive Approach (ACS Symposium Series 411). Washington, DC: American Chemical Society, 279–85.
Breck, D. W.. 1973. Zeolite Molecular Sieves: Structure, Chemistry and Use. New York: John Wiley & Sons.
Brett, D. J. L.; S. Atkins; N. P. Brandon; N. Vasileiadis; V. Vesovic; and A. R. Kucernak. 2007. Membrane resistance and current distribution measurements under various operating conditions in a polymer electrolyte fuel cell. Journal of Power Sources 172 (1): 2–13.
Britton, D.T.; Odo, E.A.; Härting, M.. 2007. Thick Film Semiconducting Inks. WO/2007/072162. International Patent Application No.: PCT/IB2006/003666; Publication Date: 28.06.2007; International Filing Date: 18/12/2006
Bruce, J. Todd. 1996. Rustenburg and Johnson Matthey, An Enduring Relationship. Sixty-five years of continuous committed development. Platinum Metals Review. 40 (1) January: 2-7
Bulan, A.; F. Gestermann; H-D Pinter; P. Weuta; W. Klesper. 2005. Method for producing gas diffusion electrodes. US Patent 6838408, issued 04/01/2005. Application No. 10815711 filed on 04/02/2004; Assignee Bayer Material Science AG
Cabasso, I.; and Y. Yuan. 1998a. Gas diffusion electrode based on polyethersulfone carbon blends. Patent CA2213967, published 1998/02/27. Application no. CA19972213967, filed 1997/08/26. Applicant: Research Foundation of State University of New York (SUNY). Also published as JP10092439(A);

REFERENCES _____________________________________________
376
GB2316802(A); FR2755542(A1); DE19737389(A1); BR9704215(A); TW4040079B(B). [Canadian Intellectual Property Office (CIPO). Dead application 2003/08/26.] http://www.wikipatents.com/ca/2213967.html. [May 2008]
Cabasso, I.; and Y. Yuan. 1998b. Gas diffusion electrode based on polyethersulfone carbon blends. UK patent GB2316802 (GB9718153.1), published 1998/03/04. Application no. GB19970018153, filed 1997/08/27. Priorities: US08/697583, filed 1996/08/27. Applicant: Research Foundation of State University of New York (SUNY). [UK patents ceased 2002/08/27 (per Patents Office Patents and Designs Journal no. 5943, 16 April 2003).] http://www.wikipatents.com/gb/2316802.html. [May 2008]
Cabasso, I.; Y. Yuan; and C. Mittelsteadt. 2000. Blend membranes based on sulfonated poly(phenylene oxide) for enhanced polymer electrochemical cells. US patent 6103414, issued 2000/08/15. Application no. 133228, filed 1998/08/13. Assignee: Research Foundation of State University of New York (SUNY).
Cabasso, I.; Y. Yuan; and X. Xu. 1998. Gas diffusion electrodes based on poly(vinylidene fluoride) carbon blends. US patent 5783325, issued 1998/07/21. Application no. 697582, filed 1996/08/27. Assignee: Research Foundation of State University of New York (SUNY).
Cabot™ Corporation. [nd]. Creating what matters. [Global chemical manufacturer of carbon black, fumed metal oxides, tantalum, inkjet colourants, Nanogel® aerogels, masterbatch, conductive compounds, specialty fluids, micropowders, supermetals.] http://w1.cabot-corp.com/index.jsp. [May 2008]
Calvo, S. R.; and P. B. Balbuena. 2007. Theoretical analysis of reactivity on Pt(111) and Pt-Pd(111) alloys. Surface Science 601 (21): 4786–92.
Candusso, D.; J. P. Poirot-Crouvezier; B. Bador; E. Rullière; R. Soulier; and J. Y. Voyant. 2004. Determination of current density distribution in proton exchange membrane fuel cells. The European Physical Journal Applied Physics (EJP AP) 25 (1): 67–74.
Chhabra, P. P.; and J. F. Richardson. 1999. Ch. 1, Non-Newtonian fluid behaviour; and ch. 2, Rheometry for non-Newtonian fluids. Non-Newtonian Flow in the Process Industries. Fundamentals and Engineering Applications. Oxford: Butterworth-Heinemann, 1–36; 37–70.
Che, G.; B. B. Lakshmi; C. R. Martin; E. R. Fisher; and R. S. Ruoff. 1998. Chemical vapor deposition based synthesis of carbon nanotubes and nanofibers using a template method. Chemistry of Materials 10 (1): 260–7.
Chen, C. Y.; and C. S. Tsao. 2006. Characterization of electrode structures and the related performance of direct methanol fuel cells. International Journal of Hydrogen Energy 31 (3): 391–8.
Chen, G.; D. A. Delafuente; S. Sarangapani; and T. E. Mallouk. 2001. Combinatorial discovery of bifunctional oxygen reduction—water oxidation catalysts for regenerative fuel cells. Catalysis Today 67 (4): 341–55.
Chikae, M.; K. Idegami; K. Kerman; N. Nagatani; M. Ishikawa; Y. Takamura; and E. Tamiya. 2006. Direct fabrication of catalytic metal nanoparticles onto the surface of a screen-printed carbon electrode. Electrochemistry Communications 8 (8): 1375–80.

REFERENCES _____________________________________________
377
Chirkov, Y. G.; and V. I. Rostokin. 2005. Calculating a characteristic bulk current density in the cathode of a hydrogen–oxygen fuel cell with a solid polymer electrolyte. Russian Journal of Electrochemistry 41 (9): 985–95.
Choi, B.-W.; S.-J. Chung; and D.-R. Shin. 1996. Microstructure of PTFE and acid absorption behavior in PTFE-bonded carbon electrodes. International Journal of Hydrogen Energy 21 (7): 541–6.
Choi, H. C.; M. Shim; S. Bangsaruntip; and H. Dai. 2002. Spontaneous reduction of metal ions on the sidewalls of carbon nanotubes. Journal of the American Chemical Society 124 (31): 9058–9.
Chwang, R.; B. J. Smith; and C. R. Crowell. 1974. Contact size effects on the Van der Pauw method for resistivity and Hall coefficient measurement. Solid-State Electronics 17 (12): 1217–27.
Cornell, R. W.; J. Casteel Holiway; and A. P. Holloway. 2008. Thermal printing of silver ink. US patent 7316475, issued 2008/01/08. Application no. 10985708, filed 2004/11/10. http://www.patentstorm.us/patents/7316475.html. [May 2008]
Corrosion Doctors. [nd]. What is an overpotential? www.corrosion-doctors.org/Corrosion-Kinetics/Overpotential_definition.htm. [May 2008]
Corrosion Source. [nd]. The exchange current. [Definition and variables affecting exchange current density.] www.corrosionsource.com/technicallibrary/corrdoctors/ Modules/Kinetics/Exchange.htm. [May 2008]
Cox, P; S.-Y. Cha; G. Hou; N. Tran; and A. Duong. 2005. Catalyst agglomerates for membrane electrode assemblies. US patent 6911411, issued 2005/06/28. Application no. 10301131, filed 2002/11/21. Assignee: Polyfuel, Inc..
Crow, D. R.. 1994. Principles and Applications of Electrochemistry, 4 ed.. Glasgow: Blackie Academic and Professional, 129–50.
Cyberspace Chemistry (CaCt). 2008. The Liquid State. [http://www.science.uwaterloo.ca/~cchieh/cact/c123/liquid.html]
Dabak, T.; and O. Yucel. 1987. Modelling of the concentration and particle size distribution effects on the rheology of highly concentrated suspensions. Powder Technology 52 (3): 193–206.
Da Silva, L. A.; V. A. Alves; M. A. P. da Silva; S. Trasatti; and J. F. C. Boodts. 1997. Oxygen evolution in acid solution on IrO2+TiO2 ceramic films. A study by impedence, voltammetry and SEM. Electrochimica Acta 42 (2): 271–81.
Davenport, R. J.; F. H. Schubert; and D. J. Grigger. 1991. Space water electrolysis: Space station through advanced missions. Journal of Power Sources 36 (3): 235–50.
Davis, R. 1999. Identifying, understanding, and controlling tertiary moiré. When separation angles clash. Screenweb, 15 December 1999. [Companion site for ScreenPrinting magazine.] Cincinnati, OH: Screenweb, ST Media Group International. http://www.screenweb.com/index.php/channel/1/id/4/. [May 2008]
De Castro, E. S.. 1996. The electrochemistry of gases: New sensing opportunities. Watts New (Quarterly newsletter of Electrosynthesis Co., Inc.) 2 (1): [np]. http://www.electrosynthesis.com/news/w2content.html. [May 2008]
De Jong, K. P.; and J. W. Geus. 2000. Carbon nanofibers: Catalytic synthesis and applications. Catalysis Reviews—Science and Engineering 42 (4): 481–510.

REFERENCES _____________________________________________
378
DEK® International. 2007. Fuel cells. [Screen printing processes and technologies for commercial high-volume fuel-cell production – process challenges – manufacturing challenges – screens and stencils – enclosed head printing – fuel cell successes.] http://www.dek.com/web.nsf/dek/fuel_cell. [May 2008]
DeMarinis, M.; E.S. De Castro; R.J. Allen; K. Shaikh. 2002. Structures and methods of manufacture for gas diffusion electrodes and electrode components US Patent 6444602, issued 03/09/2002; Application No. 715458 filed on 14/11/2000
Ding H.; Feng Y.; and Liu J.. 2007. Preparation and properties of Ti/SnO2-Sb2O5 electrodes by electrodeposition. Materials Letters 61 (27): 4920–3.
Divisek J.; and H. Schmitz. 1984. Electrolyzer for alkaline water electrolysis. US patent 4445994, issued 1984/05/01. Application no. 06/351408, filed 1982/02/23. Assignee: Kernforschungsanlage Jülich GmbH (DE). http://www.patentstorm.us/patents/4445994.html. [May 2008]
Du, L.; S. Huiyu, Y. Xu, S. Liao, L.F. Petrik. 2008. A novel hollow sphere mesoporous material synthesized by using DADD template and embedding Nd into framework simultaneously. Microporous and Mesoporous Materials 113: 261–7
Ebbing, D. D.. 1993. General Chemistry, 4 ed.. Boston: Houghton Mifflin Co., 743–819.
Eckl, R.; R. Grinzinger; and W. Lehnert. 2006. Current distribution mapping in polymer electrolyte fuel cells—A finite element analysis of measurement uncertainty imposed by lateral currents. Journal of Power Sources 154 (1): 171–9.
EEEL-NIST. 2008. Electronics and Electrical Engineering Laboratory publications. National Institute of Standards and Technology (NIST). http://www.eeel.nist.gov/812 [May 2008]
Eggins, B. R.. 2002. Chemical Sensors and Biosensors. New York: John Wiley & Sons.
Eikerling, M.; S. J. Paddison; L. R. Pratt; and T. A. Zawodzinski, Jr. 2003. Defect structure for proton transport in a triflic acid monohydrate solid. Chemical Physics Letters 368 (1–2): 108–14. http://nrc.org/publ/ICCN2002/307.pdf. [May 2008]
Elumalai, P.; Vasan, H. N.; Munichandraiah, N.; Shivashankar, S. A.. 2002. Kinetics of hydrogen evolution on submicron size Co, Ni, Pd and Co-Ni alloy powder electrodes by DC polarization and AC impedence studies. Journal of Applied Electrochemistry 32 (9): 1005–10.
Ertl, G.; H. Knözinger; and J. Weitkamp (eds.). 1997. Handbook of Heterogeneous Catalysis. 5 vols.. Weinheim, Germany: Wiley-VCH.
Erwin A., Minister of Public Enterprises. 24 Feb 2006. The challenges facing South Africa’s power-generation sector. [E-mail transcript, circulated by ESKOM.]
Etek, 2008. http://www.etek-inc.com/standard/product_GDL%20LT.php?prodid=56 [May 2008]
Feijen, E. J. P.; J. A. Martens; and P. A. Jacobs. 1997. Hydrothermal zeolite synthesis. In: Ertl, G.; H. Knözinger; and J. Weitkamp (eds.), Handbook of Heterogeneous Catalysis. Weinheim, Germany: Wiley-VCH.
Franco, R. W. A.; J. P. Donoso; C. J. Magon; C. B. Rodella; A. O. Florentino; M. J. Saeki; J. M. Pernaut; and A. L. de Oliveira. 1998. Electric and magnetic properties of polymer electrolyte/carbon black composites. Solid State Ionics 113–5: 149–60.

REFERENCES _____________________________________________
379
Fresener, S. 2008. Glossary of screenprinting terms. Tempe, AZ: US Screen Print and Inkjet Technology. http://www.screenprinters.net/articles.php?art=33. [May 2008]
Freunberger, S. A.; M. Reum; A. Wokaun; and F. N. Büchi. 2006. Expanding current distribution measurement in PEFCs to sub-millimeter resolution. Electrochemistry Communications 8 (9): 1435–8.
Frost and Sullivan Research Service. 2003. D270, Renewable Energy Technologies: Global Developments (Technical Insights). (Published 23 December 2003.) www.frost.com/prod/servlet/report-brochure.pag?id=D270-01-00-00-00.
Frost and Sullivan Research Service. 2004. D318, Hydrogen Storage—Advances in Hydrogen Production and Storage Technologies (Technical Insights). (Published 13 December 2004.) www.frost.com/prod/servlet/report-brochure.pag?id=D318-01-00-00-00.
Fuertes, A. B.; and D. M. Nevskaia. 2003. Control of mesoporous structure of carbons synthesised using a mesostructured silica as template. Microporous and Mesoporous Materials 62 (3): 177–90.
Furuya, N.. 2001. Gas diffusion electrode, method for manufacturing the same and fuel cell using it. International patent no. WO/2001/094668, published 2001/12/13. International application no. PCT/JP2001/004693, filed 2001/06/04. (WIPO).
Furuya, N.. 1997. Gas diffusion electrode. US Patent 5618392, issued 08/04/1997; Application No. 421840 filed on 04/13/1995; Assignee Tanaka Kikinzoku Kogyo K.K.Furuya; Nagakazu
Furuya, N.; and H. Aikawa. 2000. Comparative study of oxygen cathodes loaded with Ag and Pt catalysts in chlor-alkali membrane. Electrochimica Acta 45 (25–26): 4251–6.
Furuya, N.; and H. Aikawa. 1999. A study of the gas-diffusion electrodes for chlor-alkali membrane cell. In: Burney, H. S.; N. Furuya; F. Hine; and K. Ohta (eds.), Chlor Alkali and Chlorate Technology: R. B. MacMullin Memorial Symposium, Honolulu, Hawaii, Fall 1999. Pennington, NJ: Electrochemical Society. PV99-21: 180.
Furuya, N.. 2001. http://www.electrochem.org/dl/ma/206/pdfs/1834.pdf and www.aba-brno.cz/aba2002/abstracts/24.pdf [May 2008]
Gaudet, J.; A. C. Tavares; S. Trasatti; and D. Guay. 2005. Physicochemical characterization of mixed RuO2-SnO2 solid solutions. Chemistry of Materials 17 (6): 1570–9.
General Electric Company. 1981. Solid polymer electrolyte water electrolysis technology development for large-scale hydrogen production. DE82010876, Final report for the period October 1977–November 1981. [Report no. DOE/ET/26202-1; covers portions of General Electric Electrolyte Bulk Hydrogen Water Electrolysis Development Program sponsored by DOE from October 1997 to November 1981, under contract no. AC02-78ET26202.] Wilmington, MA: General Electric Company; and US DOE.
Ghosh, P. C.; T. Wüster; H. Dohle; N. Kimiaie; J. Mergel; and D. Stolten. 2006. In situ approach for current distribution measurement in fuel cells. Journal of Power Sources 154 (1): 184–91.
Ginter, D. M.; C. J. Radke; and A. T. Bell. 1989. Applications of MAS-NMR spectroscopy to the study of faujasite synthesis. In: Jacobs, P. A.; and R. A. van

REFERENCES _____________________________________________
380
Santen (eds.), Zeolites: Facts, Figures, Future. Vol. 49A of Studies in Surface Science and Catalysis. Amsterdam: Elsevier Science Publishers B.V., 161–8.
Giz, M. J.; M. C. Marengo; E. A. Ticianelli; and E. R. Gonzalez. 2003. Electrochemical and physical characterization of Ni-Cu-Fe alloy for chlor-alkali hydrogen cathodes. Eclética Química (São Paulo) 28 (2): 21–8.
Godongwana, Z. G.. 2006. Homogeneity of nanophase electrocatalysts supported on mesoporous materials. Unpublished MSc thesis. Department of Chemistry, University of the Western Cape.
Goldemberg, J. (ed.); and United Nations Development Programme (UNDP). 2000. World Energy Assessment. Energy and the Challenge of Sustainability. New York: UNDP, UN-DESA, and World Energy Council, 221. http://www.undp.org/energy/weapub2000.htm. [May 2008]. Download individual chapters or overview WEA in Brief [42 pp.]: http://www.undp.org/activities/wea/draft-start.html.
Görgün, H.. 2006. Dynamic modelling of a proton exchange membrane (PEM) electrolyzer. International Journal of Hydrogen Energy 31 (1): 29–38.
Govindaraj, A.; S. R. C. Vivekchand; and C. N. R. Rao. 2007. Novel vapor phase reactions for the synthesis and modification of carbon nanotubes and inorganic nanowires. Journal of Nanoscience and Nanotechnology 7 (6): 1695–702.
Greenwinds. 2002. Electrolyzers. [Introduction and overview – process details – glossary.] http://www.pege.org/greenwinds/electrolyzer.htm. [May 2008]
Grigor’ev, S. A.; A. A. Kalinnikov; V. I. Porembskii; I. E. Baranov; E. V. Borisova; and V. N. Fateev. 2004. Optimization of mass transfer processes in the zone of the air electrode of a fuel cell with a solid polymer electrolyte. Russian Journal of Electrochemistry 40 (11): 1188–92.
Grigoriev, S. A.; V. I. Porembsky; and V. N. Fateev. 2006. Pure hydrogen production by PEM electrolysis for hydrogen energy. International Journal of Hydrogen Energy 31 (2): 171–5.
Grubb, W. T.. 1957. Ion-exchange batteries. In: Proceedings of the 11th Annual Battery Research and Development Conference, Atlantic City, N.J., 22–23 May 1957. Red Bank, NJ: PSC Publications Committee, 5–8.
Grün, M.; K. K. Unger; A. Matsumoto; and K. Tsutsumi. 1999. Novel pathways for the preparation of mesoporous MCM-41 materials: Control of porosity and morphology. Microporous and Mesoporous Materials 27 (2–3): 207–16.
Guan, Y.; J. X. Sun; and M. N. Sun. 2006. Metal colloid dispersions and their aqueous metal inks. USPTO application no. 20060044382, filed 2006/03/02.
Guo, J. W.; T. S. Zhao; J. Prabhuram; R. Chen; and C. W. Wong. 2005. Preparation and characterization of a PtRu/C nanocatalyst for direct methanol fuel cells. Electrochimica Acta 51 (4): 754–63.
Hackwood, S.; A. H. Dayem; and G. Beni. 1982. Amorphous-nonmetal to crystalline-metal transition in electrochromic iridium oxide films. Physical Review B: Condensed Matter 26 (2): 471–8.
Hamann, C. H.; A. Hamnett; and W. Vielstich. 1998. Electrochemistry. Weinheim, Germany: Wiley-VCH Verlag GmbH, 143–50; 216–24.
Hampden Smith, M.; P. Atanassova; O. Atanassov; and T. Kodas. 2003. Ch 40, Manufacture of electrocatalyst powders by a spray-based production platform (polymer electrolyte membrane fuel cells, PEMFC). In: Vielstich, W.; A. Lamm;

REFERENCES _____________________________________________
381
and H. A. Gasteiger (eds.), Handbook of Fuel Cells: Fundamentals, Technology and Applications. Vol 3, Fuel Cell Technology and Applications (Part 1). West Sussex: John Wiley & Sons, 497–508.
Hartland S.. (ed.). 2004. Surface and Interfacial Tension: Measurement, Theory, and Applications, New York, Marcel Dekker, 425 – 81.
Hartmann, M.. 2005. Ordered mesoporous materials for bioadsorption and biocatalysis. Chemistry of Materials 17 (18): 4577–93.
Hashimoto, K.; T. Sasaki; S. Meguro; and K. Asami. 2004. Nanocrystalline electrodeposited Ni-Mo-C cathodes for hydrogen production. Materials Science and Engineering A 375–7: 942–5.
Hayashi, K.; and N. Furuya. 2004. Preparation of gas diffusion electrodes by electrophoretic deposition. Journal of the Electrochemical Society 151 (3): A354–7.
Hijikata, T.. 2002. Research and development of international clean energy network using hydrogen energy (WE-NET). International Journal of Hydrogen Energy 27 (2): 115–29.
Hine, F.; M. Yasuda; T. Noda; T. Yoshida; and J. Okuda. 1979. Electrochemical behavior of the oxide-coated metal anodes. Journal of the Electrochemical Society 126 (9): 1439–45.
Ho, L.-W.; C.-P. Hwang; J.-F. Lee; I. Wang; and C.-T. Yeh. 1998. Reduction of platinum dispersed on dealuminated beta zeolite. Journal of Molecular Catalysis A: Chemical 136 (3): 293–9.
Hoogers, G. (ed.). 2003. Fuel Cell Technology Handbook. Boca Raton, FL: CRC Press.
Horibe, A.; S. Fukusako; M. Yamada; and K. Fumoto. 1997. Surface tension of aqueous binary solutions at low temperatures. International Journal of Thermophysics 18 (2): 387–96.
Horkans, J.; and M. W. Shafer. 1977. An investigation of the electrochemistry of a series of metal dioxides with rutile-type structure: MoO2, WO2, ReO2,RuO2, OsO2, and IrO2. Journal of the Electrochemical Society 124 (8): 1202–7.
Hrussanova, A.; E. Guerrini; and S. Trasatti. 2004. Thermally prepared Ti/RhOx electrodes IV: O2 evolution in acid solution. Journal of Electroanalytical Chemistry 564 (Special issue): 151–7.
HyWeb Gazette. Online newsletter of Ludwig-Bölkow-Systemtechnik GmbH (LBST) and the German Hydrogen Association (DWV). http://www.hydrogen.org/News/gazette.htm. [May 2008]
IEA Renewable Energy Working Party. 2002. Renewable Energy into the Mainstream. Paris: International Energy Agency (IEA). [54 pp.]. www.iea.org/textbase/nppdf/free/2000/Renew_main_2003.pdf. Adapted from: Goldemberg, J. (ed.); and United Nations Development Programme (UNDP). 2000. World Energy Assessment. Energy and the Challenge of Sustainability. [500 pp.]. New York: UNDP, UN-DESA, and World Energy Council. [May 2008]
Iijima, S.. 1991. Helical microtubules of graphitic carbon. Nature 354: 56–8. Iijima, S.; and T. Ichihashi. 1993. Single-shell carbon nanotubes of 1-nm diameter.
Nature 363: 603–5.

REFERENCES _____________________________________________
382
Ikhsan, J.; B. B. Johnson; and J. D. Wells. 1999. A comparative study of the adsorption of transition metals on kaolinite. Journal of Colloid and Interface Science 217 (2): 403–10.
Imarisio, G.; and A. S. Strub (eds.); Commission of the European Communities. 1983. Hydrogen as an Energy Carrier: Proceedings of the 3rd International Seminar, Lyon, 25–27 May 1983. Dordrecht, Holland: D. Reidel Publishing Co.. [Sold and distributed in the USA and Canada by Kluwer Academic Publishers, Hingham MA, and in all other countries by Kluwer Academic Publishers Group, Dordrecht, Holland.]
International Union of Pure and Applied Chemistry (IUPAC); McNaught, A. D.; and A. Wilkinson (compilers). 1997. IUPAC Compendium of Chemical Terminology (‘The Gold Book’), 2 ed.. London: Blackie Scientific Publications. PDF version: http://old.iupac.org/publications/compendium/. [May 2008]
International Union of Pure and Applied Chemistry (IUPAC); Nic, M.; J. Jirak; and B. Kosata. 2005. IUPAC Compendium of Chemical Terminology (‘The Gold Book’). Advanced XML version: http://goldbook.iupac.org/. [May 2008]
IZA_online, 2008. International Zeolite Association 2008. http://www.IZA_online.com [May 2008]
Ioroi, T.; N. Kitazawa; K. Yasuda; Y. Yamamoto; and H. Takenaka. 2001. IrO2-deposited Pt electrocatalysts for unitized regenerative polymer electrolyte fuel cells. Journal of Applied Electrochemistry 31 (11): 1179–83.
Ioroi T.; N. Kitazawa; K. Yasuda; Y. Yamamoto; and H. Takenaka. 2000. Iridium oxide/platinum electrocatalysts for unitized regenerative polymer electrolyte fuel cells. Journal of the Electrochemical Society 147 (6): 2018–22.
Ioroi, T.; T. Oku; K. Yasuda; N. Kumagai; and Y. Miyazaki. 2003. Influence of PTFE coating on gas diffusion backing for unitized regenerative polymer electrolyte fuel cells. Journal of Power Sources 124 (2): 385–9.
Ioroi, T.; K. Yasuda; Z. Siroma; N. Fujiwara; and Y. Miyazaki. 2002. Thin film electrocatalyst layer for unitized regenerative polymer electrolyte fuel cells. Journal of Power Sources 112 (2): 583–7.
Ivy, J.. 2004. Summary of Electrolytic Hydrogen Production: Milestone Completion Report. NREL/MP-560-36734 [replaces 560-35948], September 2004. [27 pp.]. DOE Contract no. AC36-99-GO10337. Golden, CO: National Renewable Energy Laboratory (NREL). http://www/nrel.gov/publications. [May 2008]
Iwuoha, E. I.; S. E. Mavundla; V. S. Somerset; L. F. Petrik; M. J. Klink; M. Sekota; and P. Bakers. 2006. Electrochemical and spectroscopic properties of fly ash–polyaniline matrix nanorod composites. Microchimica Acta 155 (3–4): 453–8.
Jakšić, M. M.. 1984. Electrocatalysis of hydrogen evolution in the light of the Brewer–Engel theory for bonding in metals and intermetallic phases. Electrochimica Acta 29 (11): 1539–50.
Janssen, H.; J. C. Bringmann; B. Emonts; and V. Schroeder. 2004. Safety-related studies on hydrogen production in high-pressure electrolysers. International Journal of Hydrogen Energy 29 (7): 759–70.
Jarvi, T. D; and E. M. Stuve. 1998. Fundamental aspects of vacuum and electrocatalytic reactions of methanol and formic acid on platinum surfaces. In: Lipkowski, J; and P. N. Ross, Jr. (eds.), Electrocatalysis. New York: Wiley-VCH, 75–153.

REFERENCES _____________________________________________
383
Jiang, L.; G. Sun; Z. Zhou; S. Sun; Q. Wang; S. Yan; H. Li; J. Tian; J. Guo; B. Zhou; and Q. Xin. 2005. Size-controllable synthesis of monodispersed SnO2 nanoparticles and application in electrocatalysts. Journal of Physical Chemistry B 109 (18): 8774–8.
Johnson Matthey™. [nd]. HiSPEC® Catalyst Datasheet. http://www.johnsonmattheyfuelcells.com/HiSPEC_Datasheet.pdf. [May 2008]
Jordan, L. R.; A. K. Shukla; T. Behrsing; N. R. Avery; B. C. Muddle; and M. Forsyth. 2000. Effect of diffusion-layer morphology on the performance of polymer electrolyte fuel cells operating at atmospheric pressure. Journal of Applied Electrochemistry 30 (6): 641–6.
Juda, W.; A.B. Ilan. 1986. Polymeric hydrogel-containing gas diffusion electrodes and methods of using the same in electrochemical systems. US Patent 4614575, issued 30/09/1986; Application No. 06/673041 filed on 19/11/1984; Assignee: Prototech Company.
Jung, U. H.; K. T. Park; E. H. Park; and S. H. Kim. 2006. Improvement of low-humidity performance of PEMFC by addition of hydrophilic SiO2 particles to catalyst layer. Journal of Power Sources 159 (1): 529–32.
Kaisheva, A.. 2004. Comparative methods for gas-diffusion electrodes diagnostics. In: Stoynoy, Z.; and D. Vladikova (eds.), Proceedings of International Workshop ‘Advanced Techniques for Energy Sources Investigation and Testing’, Sofia, Bulgaria, 4–9 September 2004. Sofia: Centre of Excellence POEMES Series.
Kato, T.; M. Kubota; N. Kobayashi; and Y. Suzuoki. 2005. Effective utilization of by-product oxygen from electrolysis hydrogen production. (Paper presented at annual meeting of International Energy Workshop (IEW), held at IIASA, Laxenburg, Austria, 24–26 June 2003. www.iiasa.ac.at/Research/ECS/IEW2003/Papers/2003P_kato.pdf.) Journal of Energy 30 (14): 2580–95.
Kawar, P. K.; P. S. Chigare; and P. S. Patil. 2003. Substrate temperature dependent structural, optical and electrical properties of spray deposited iridium oxide thin films. Applied Surface Science 206 (1–4): 90–101.
Kendall, T. 2006. Platinum 2006: Johnson Matthey plc, London: 1-52 Khaselev, O.; A. Bansal; and J. A. Turner. 2001. High-efficiency integrated
multijunction photovoltaic/electrolysis systems for hydrogen production. International Journal of Hydrogen Energy 26 (2): 127–32.
Kim, C. S.; Y. G. Chun; D. H. Peck; and D. R. Shin. 1998. A novel process to fabricate membrane electrode assemblies for proton exchange membrane fuel cells. International Journal of Hydrogen Energy 23 (11): 1045–8.
Kim, T. W.; I. S. Park; and R. Ryoo. 2003. A synthetic route to ordered mesoporous carbon materials with graphitic pore walls. Angewandte Chemie (International Edition) 42 (36): 4375–9.
Kinoshita, K. 1988. Carbon: Electrochemical and Physicochemical Properties. New York: Wiley, 147.
Kitoh, K., H. Schönfelder; and H. Nemoto. 1997. Nanostructure criteria for lithium intercalation in non-doped and phosphorus-doped hard carbons. (From 8th International Meeting on Lithium Batteries (IMLB-8), Nagoya, Japan, 16 June 1996. Part II, poster presentations.) Journal of Power Sources 68 (2): 258–62.

REFERENCES _____________________________________________
384
Kondoh, M.; N. Yokoyama; C. Inazumi; S. Maezawa; N. Fujiwara; Y. Nishimura; K. Oguro; and H. Takenaka. 2000. Development of solid polymer-electrolyte water electrolyser. Journal of New Materials for Electrochemical Systems 3 (1): 61–5.
Koryta, J.. 1986. Ions, Electrodes and Membranes, 2 ed.. New York: John Wiley & Sons.
Koryta, J.; J. Dvorak; and L. Kavan. 1993. Principles of Electrochemistry, 2 ed.. Chichester and New York: John Wiley & Sons, 253–79.
Kramer, D.; S. A. Freunberger; R. Flückiger; I. A. Schneider; A. Wokaun; F. N. Büchi; and G. G. Scherer. 2008. Electrochemical diffusimetry of fuel cell gas diffusion layers. Journal of Electroanalytical Chemistry 612 (1): 63–77.
Krätschmer, W.; L. D. Lamb; K. Fostiropoulos; and D. R. Huffman. 1990. Solid C60: A new form of carbon. Nature 347: 354–8.
Kresge, C. T.; M. E. Leonowicz; W. J. Roth; J. C. Vartuli; and J. S. Beck. 1992. Ordered mesoporous molecular sieves synthesized by a liquid-crystal template mechanism. Nature 359: 710–12.
Kruss, 2008 USA Technical note#306,; http://higheredbcs.wiley.com/legacy/college/cutnell/0471713988/ste/ste.pdf [May 2008]
Kuch, W.; M. Schulze; W. Schnurnberger; K. Bolwin; and B. Bunsenges. 1993. Kinetics of H2O adsorption and clean potassium precovered nickel (III) surfaces. Journal of Physical Chemistry 97 (3): 356–9.
Kudryashov, I. V.; and E. S. Burmistrov. 1970. Kinetics of the cathodic evolution of hydrogen on single crystals of Ni-CO-Fe ternary alloys. Elektrokhimiya 6 (8): 1153–5.
Kudryashov, I. V.; E. S. Burmistrov; and V. L. Kirlis. 1970. Kinetics of the cathodic evolution of hydrogen from single-crystal Ni-CO alloys in various media. Electrokhimiya 6 (5): 737–41.
Labrincha, J. A.; L.-J. Meng; M. P. dos Santos; F. M. B. Marques; and J. R. Frade. 1993. Evaluation of deposition techniques of cathode materials for solid oxide fuel cells. Materials Research Bulletin 28 (2): 101–9.
Laitinen, H. A.; and Thornton, D. C.. 1981. Thin platinum films on tin oxide substrates. US patent 4273624, issued 1981/06/16. Application no. 06/024531, filed 1979/03/28. Assignee: Board of Regents, State of Florida, for the use and benefit of.
Landel, R. F.; B. G. Moser; and A. J. Bauman. 1965. Rheology of concentrated suspensions: Effect of a surfactant. In: Lee, E. H. (ed.), Proceedings of the Fourth International Congress on Rheology, Brown University, Providence, Rhode Island, 26–30 August 1963 (Parts 1–4), Part 2. New York: Interscience Publishers, 663–92.
Langley, P. J.; and J. Hulliger. 1999. Nanoporous and mesoporous organic structures: New openings for materials research. Chemical Society Reviews 28: 279–91.
Lee, C.-H.; S.-C. Wang; C.-J. Yuan; M.-F. Wen; and K.-S. Chang. 2007. Comparison of amperometric biosensors fabricated by palladium sputtering, palladium electrodeposition and Nafion/carbon nanotube casting on screen-printed carbon electrodes. Biosensors and Bioelectronics 22 (6): 877–84.

REFERENCES _____________________________________________
385
Lee, H.-K.; J.-H. Park; D.-Y. Kim; and T.-H. Lee. 2004. A study on the characteristics of the diffusion layer thickness and porosity of the PEMFC. Journal of Power Sources 131 (1–2): 200–6.
Lee, J.; J. Kim; and T. Hyeon. 2006. Recent progress in the synthesis of porous carbon materials. Advanced Materials 18 (16): 2073–94.
Lee, S. J.; S. Mukerjee; J. McBreen; Y. W. Rho; Y. T. Kho; and T. H. Lee. 1998. Effects of Nafion impregnation on performances of PEMFC electrodes. Electrochimica Acta 43 (24): 3693–701.
Lee, T. H.; S. Wang; S. E. Dorris; and U. Balachandran. 2004. Hydrogen production by high-temperature water splitting using electron-conducting membranes. US patent 6726893, issued 2004/04/27. Application no. 10245039, filed 2002/09/17. Assignee: University of Chicago.
Li, N.; C. R. Martin; and B. Scrosati. 2000. A high-rate, high-capacity, nanostructured tin oxide electrode. Electrochemical and Solid-State Letters 3 (7): 316–8.
Li, N.; C. J. Patrissi; G. Che; and C. R. Martin. 2000. Rate capabilities of nanostructured LiMn2O4 electrodes in aqueous electrolyte. Journal of the Electrochemical Society 147 (6): 2044–9.
Li, W. Z.. 2003. The research of cathode carbon support platinum catalyst for direct methanol fuel cell. Published PhD thesis. Dalian Institute of Chemical Physics (DICP), Chinese Academy of Sciences, Dalian, People’s Republic of China.
Li, W.; W. Zhou; H. Li; Z. Zhou; B. Zhou; G. Sun: and Q. Xin. 2004. Nanostructured Pt-Fe/C as cathode catalyst in direct methanol fuel cell. Electrochimica Acta 49 (7): 1045–55.
Liao S; V. M. Linkov; and L. F. Petrik. 2004. Anodic oxidation of ethanol on inorganic membrane-based electrodes. Applied Catalysis A: General 258 (2):183–8.
Liao S; V. M. Linkov; and L. F. Petrik. 2002a. Electrooxidation of methanol over a membrane-based electrode and effect of tungsten and molybdenum on the activity. Applied Catalysis A: General 235 (1–2): 149–55.
Liao S; V. M. Linkov; and L. F. Petrik. 2002b. Preparation and measurement of inorganic proton conductive membrane for fuel cell. Battery Bimonthly (Chinese) 32 (3): 159.
Liao, S.; J. Shan; V.M. Linkov; L.F. Petrik. 2003. Preparation and structure characterization of a mesoporous solid superacid catalyst SO4
2-/Zr-HMS Department of Applied Chemistry, South China University of Technology, Canton, Peop. Rep. China. Gaodeng Xuexiao Huaxue Xuebao , 24(3), 469-472. CODEN: KTHPDM ISSN: 0251-0790. Journal written in Chinese. CAN 138:227403 AN 2003:247943 CAPLUS (Copyright 2003 ACS)
Lide D.R., Editor-in-Chief, 1992-1993 CRC Handbook of Chemistry and Physics, 73rd edition, CRC Press: Boca Raton FL
Linkov, V.; L. Petrik; G. Vaivars; A. Maluleke; and G. Gericke. 2002. Ceramic-based materials for electrochemical applications. In: Sanderson, R. D.; and H. Pasch (eds.), Polymer Characterization and Materials Science. Vol. 178 of Macromolecular Symposia (Fourth Annual UNESCO School and IUPAC Conference on Macromolecules and Materials Science, Stellenbosch, South Africa, 7–11 April 2001.) Weinheim, Germany: Wiley-VCH, 153–68.

REFERENCES _____________________________________________
386
Lipinski, M.; R. Leuschner. Gas diffusion electron, process for producing an electrode an carbonizable composite. 2002. US Patent 6361666, issued 26/03/2002 Application No. 575006 filed on 05/19/2000; Assignee: Siemens Aktiengesellschaft
Liu, X. Y.; B. C. Huang; and N. J. Coville. 2002. The Fe(CO)(5) catalyzed pyrolysis of pentane: Carbon nanotube and carbon nanoball formation. Carbon 40 (15): 2791–9.
Liu J.; S. Liao; G. Jiang; X. Zhang; L.F. Petrik. 2006. Preparation, characterization and catalytic activity of Zr embedded MSU-V with high thermal and hydrothermal stability. Microporous and Mesoporous Materials 95, (1-3): 306-11
Liu, H.; B. Yi; M. Hou; J. Wu; Z. Hou; and H. Zhang. 2004. Composite electrode for unitized regenerative proton exchange membrane fuel cell with improved cycle life. Electrochemical and Solid-State Letters 7 (3): A56–9.
MacInnes, D. A.; and L. Adler. 1919. Hydrogen overvoltage. Proceedings of the National Academy of Sciences of the United States of America 5 (5): 160–3.
MacInnes, D. A.; and A. W. Contieri. 1919. Some applications of the variation of hydrogen overvoltage with the pressure. Proceedings of the National Academy of Sciences of the United States of America 5 (8): 321–3.
Majima, M.; K. Hanafusa; Y. Oka; G. Tanaka; H. Yoshida; E. Yagasaki; and T. Tada. 1997. Development of 1kWh (300 Ah) class lithium-ion battery. Journal of Power Sources 68 (2): 448–50.
Majima, M.; Y. Oka; K. Miyazaki; H. Yoshida; E. Yagasaki; and T. Tada. 1997. In: Holmes, C. F.; and A. R. Landgrebe (eds.), Batteries for Portable Applications and Electric Vehicles. Pennington, NJ: Electrochemical Society. PV97-18: 362. [Out of print.] Referred to in Park, M.; H. Jung; S.-I. Yoo; J. B. Bates: and S.-K. Joo. 2006. Electrochemical properties of layer-built cells. Journal of Power Sources 158 (2): 1447–50.
Majima, M.; T. Tada; S. Ujiie; E. Yagasaki; S. Inazawa; and K. Miyazaki. 1999. Design and characteristics of large-scale lithium-ion battery. Journal of Power Sources 81–82: 877–81.
Majima, M.; S. Ujiie; E. Yagasaki; K. Koyama; and S. Inazawa. 2001. Development of long-life lithium-ion battery for power storage. Journal of Power Sources 101 (1): 53–9.
Manitoba Hydrogen Steering Committee and Working Group. 2003. The Preliminary Hydrogen Opportunities Report, 16 April 2003. Winnipeg: Manitoba Energy, Science and Technology; Energy Development Initiative. http://www.gov.mb.ca/stem/energy/hydrogen/report.html. [May 2008]
Marburger J.; J. Bolten. 2007. "Interagency R&D Priorities"; and also "General R&D Program Guidance" and "R&D Investment Criteria." http://www.ostp.gov/html/budget/2007/ostp_omb_guidancememo_FY07.pdf. [May 2007]
Marković, N. M; V. Radmilovic; and P. N. Ross, Jr. 2003. Physical and electrochemical characterization of bimetallic nanoparticle electrocatalysts. In: Wieckowski, A; E. R. Savinova; and C. G. Vayenas (eds.), Catalysis and Electrocatalysis at Nanoparticle Surfaces. New York: Marcel Dekker Inc., 311–42.

REFERENCES _____________________________________________
387
Mastalir, Á.; B. Rác; Z. Király; G. Tasi and Á. Molnár. 2008. Preparation of monodispersed Pt nanoparticles in MCM-41, catalytic applications. Catalysis Communications 9 (5): 762–8.
Maxwell, I. E.; and W. H. J. Stork. 2001. Hydrocarbon processing with zeolites. In: Van Bekkum, H.; E. M. Flanigen; P. A. Jacobs; and J. C. Jansen (eds.), Introduction to Zeolite Science and Practice, 2 ed.. Vol. 137 of Studies in Surface Science and Catalysis. Amsterdam: Elsevier Science Publishers B.V., 747–819.
Meier, W. M.. 1968. Molecular Sieves. London: Society of Chemical Industry, 10. Merida-Donis, W. R. 2003. Apparatus for integrated water deionization, electrolytic
hydrogen production, and electrochemical power generation. US Patent 6569298 issued 27/05/2003. Application No. 875281 filed on 06/05/2001; Assignee: Walter Roberto Merida-Donis
Mezger, T.G.. 2002. The Rheology Handbook. Coatings Compendium Series, edited by Zorll, U.. Hannover, Germany: Vincentz Verlag.
Millennium Cell, Inc. (MCEL). Hydrogen on Demand (HOD™). http://www.millenniumcell.com/fw/main/Technology_FAQ-33.html. [May 2008]
Millet, P.; T. Alleau; and R. Durand. 1993. Characterization of membrane-electrode assemblies for solid polymer electrolyte water electrolysis. Journal of Applied Electrochemistry 23 (4): 322–31.
Millet, P.; R. Durand; and M. Pineri. 1990. Preparation of new solid polymer electrolyte composites for water electrolysis. International Journal of Hydrogen Energy 15 (4): 245–53.
Millet, P.; M. Pineri; and R. Durand. 1989. New solid polymer electrolyte composites for water electrolysis. Journal of Applied Electrochemistry 19 (2): 162–6.
Mitsugi C.; A. Harumi; and F. Kenzo. 1998. WE-NET: Japanese hydrogen program. International Journal of Hydrogen Energy 23 (3): 159–65.
Mogensen, M.. 2000. Composite electrodes in solid oxide fuel cells and similar solid state devices. Journal of Electroceramics 5 (2): 141–52.
Morimoto, T.; K. Suzuki; T. Matsubara; and N. Yoshida. 2000. Oxygen reduction electrode in brine electrolysis. Electrochimica Acta 45 (25): 4257–62.
Moscou, L. 1991. The zeolite scene. In: Van Bekkum, H.; E. M. Flanigen; and J. C. Jansen (eds.), Introduction to Zeolite Science and Practice, 1 ed.. Vol. 58 of Studies in Surface Science and Catalysis. Amsterdam: Elsevier Science Publishers B.V., 1–12.
Mousty, C.; G. Fóti; C. Comninellis; and V. Reid. 1999. Electrochemical behaviours of DSA type electrodes prepared by induction heating. Electrochimica Acta 45 (3): 451–6.
Murthy, A.; S. R. Komplin; R. W. Cornell; J. H. Powers; and B. D. Gibson. 2000. Ink jet printer nozzle plates with ink filtering projections. US patent 6158843, issued 2000/12/12. Application no. 827242, filed 1997/03/28. Assignee: Lexmark International, Inc..
Musiani, M.; F. Furlanetto; and R. Bertoncello. 1999. Electrodeposited PbO2+RuO2: A composite anode for oxygen evolution from sulphuric acid solution. Journal of Electroanalytical Chemistry 465 (2): 160–7.
Nanotube Site, The. 2007. [Links to nanotube sites; electronic access to bibliographical information and preprints; information about providers of

REFERENCES _____________________________________________
388
nanotubes.] Maintained by D. Tomanek. http://www.pa.msu.edu/cmp/csc/nanotube.html. [May 2008]
Nanotube Synthesis Site, The. [nd]. [Shared database focused on single-wall nanotube synthesis. Reference, links and information for techniques to grow SWNTs.] Maintained by D. Tomanek. http://nanotube.msu.edu/synthesis/. [May 2008]
Narang, S; S.C. Ventura; D.L.Olmeijer. 2006. Polymer electrolyte having acidic, basic and elastomeric subunits. US Patent 7052805, issued 30/05/2006; Application No. 09872770 filed on 06/01/2001; Assignee: SRI International
Nart, F. C; and W. Vielstich. 2003. Normalization of porous active surfaces. In: Vielstich,. W.; A. Lamm; and H. A. Gasteiger (eds.), Handbook of Fuel Cells: Fundamentals, Technology, and Applications. 4 vols.. Vol 2, Electrocatalysis. Chichester: John Wiley & Sons, 306–7.
NEHOC. [nd]. Information sheet #25, Screen printing technique. [How to screen print with RISO system, including angle of squeegee, pressure and printing actions.] NEHOC Australia (Pty) Ltd. http://www.nehoc.com.au/training/is/25/index.htm. [May 2008]
Nielsen, L. H.; H. Larsen; J. Jensen; and A. H. Petersen. 2004. Hydrogen infrastructure. In: Larsen, H.; R. Feidenhans’l; and L. Sønderberg Petersen (eds.), Risø Energy Report 3. Hydrogen and its Competitors. Risø-R-1469(EN), 52–5.
Nishiki, Y; T. Ashida; T. Shimamune; Y. Nakajima. 1996. Gas diffusion electrode. US Patent 5584976, issued on 17/12/1996; Application No. 636185 filed on 22/04/1996; Assignee: Permelec Electrode Ltd.
Nordstrom, R.. 2003. Energy Independence: Preparing Minnesota for the Coming Hydrogen Economy. (Minnesota H2 Initiative Forum, March 2003.) St Paul, MN: Critical Issues Team, Minnesota Planning. www.pca.state.mn.us/oea/p2/forum/030307nordstrom.ppt. [May 2008]
Norman, T.; and E. Schmitt. 2004. Low cost electrolyzer system. Provisional patent application no. 60/27788, filed October 2004. Cited in: Cropley, C.. 2005. PD23, DOE Hydrogen Program Review, 25 May 2005. Giner Electrochemical Systems LLC.
Nørskov, J. K.; T. Bligaard; A. Logadottir; J. R. Kitchin; J. G. Chen; S. Pandelov; and U. Stimming. 2005. Trends in the exchange current for hydrogen evolution. Journal of the Electrochemical Society 152 (3): J23–6.
Okada, A.; A. Kiyohara; H. Tanaka; T. Honda; M. Ito; J. Kato; N. Toshima; and Y. Nakao. 2007. Electromagnetic wave shielding material and process for producing the same. USPTO 20070212536, published 2007/09/13. Serial no. 11569544, filed 2005/05/19. Assignee: Gunze Limited Fujikura Kasei Co., Ltd.
Okada, T.; S. Møller-Holst; O. Gorseth; and S. Kjelstrup. 1998. Transport and equilibrium properties of Nafion® membranes with H+ and Na+ ions. Journal of Electroanalytical Chemistry 442 (1–2): 137–45.
Oncel, N.; A. van Houselt; J. Huijben; A. Hallbäck; O. Gurlu; H. J. W. Zandvliet; B. Poelsema. 2005. Quantum Confinement between Self-Organized Pt Nanowires on Ge(001). Phys. Rev. Lett. 95: 116801
Osaka, A.; T. Takatsuna; and Y. Miura. 1994. Iridium oxide films via sol-gel processing. Journal of Non-Crystalline Solids 178: 313–9.
Parfit, M.. 2005. Powering the future. National Geographic Magazine 208 (2): [np].

REFERENCES _____________________________________________
389
Park, M.; H. Jung; and S.-K. Joo. 2003. The study on the cell performances by the stacking structure of screen-printed cathodes, electrolytes, and anodes. (Abstract #190; Symposium C1, Battery and Energy Technology Joint General Session.) In: Proceedings of the 203rd Electrochemical Society Meeting, Paris, France, 27 April–2 May 2003. Pennington, NJ: Electrochemical Society. http://www.electrochem.org/dl/ma/203/pdfs/0190.pdf. [May 2008]
Park, M.; J.-H. Park; H. Jung; and S.-K. Joo. 2002. The study of the fabrication of LiMn2O4 cathode by screen printing, and characteristics of LiAl anode. (Poster #EE6.11; Symposium EE, Solid-State Ionics.) In: Technical Program of the 2002 Materials Research Society (MRS) Fall Meeting, Boston, MA, 2–5 December 2002.
Pasaogullari, U.; and C.-Y. Wang. 2004. Two-phase transport and the role of microporous layer in polymer electrolyte fuel cells. Electrochimica Acta 49 (25): 4359–69.
Patil, P. S.; P. S. Chigare; S. B. Sadale; T. Seth; D. P. Amalnerkar; and R. K. Kawar. 2003. Thickness-dependent properties of sprayed iridium oxide thin films. Materials Chemistry and Physics 80: 667–75.
Pauly, T. R.; and T. J. Pinnavaia. 2001. Pore size modification of mesoporous HMS molecular sieve silicas with wormhole framework structures. Chemistry of Materials 13 (3): 987–93.
Petrii, O.; and G. Tsirlina. 1994. Electrocatalytic activity prediction for hydrogen electrode reaction: Intuition, art, science. Electrochimica Acta 39 (11–12): 1739–47.
Petrik, L. F.. 2002. Nanophase composite catalysts for electrosynthesis. Unpublished MSc thesis. University of the Western Cape, South Africa.
Petrik, L. F.; Z. G. Godongwana; P. Ndungu; V. M. Linkov; and S. Liao. 2008. LPG synthesis of carbon analogue of HMS. In: Hadjiivanov, K.; V. Valtchev; S. Mintova; and G. Vayssilov (eds.), Advanced Micro- and Mesoporous Materials. (Proceedings of Second International Symposium, Advanced Micro and Mesoporous Materials, Varna, Bulgaria, 6–9 September 2007.) Sofia: Heron Press.
Petrik, L. F.; C. T. O’Connor; and S. Schwarz. 1995. The influence of various synthesis parameters on the morphology and crystal size of ZSM-5, and the relationship between morphology and crystal size and propene oligomerization. In: Beyer, H. K.; H. G. Karge; I. Kiricsi; and J. B. Nagy (eds.), Catalysis by Microporous Materials. (Proceedings of Zeocat ’95, Szombathely, Hungary, 9–13 July 1995.) Studies in Surface Science and Catalysis, vol. 94. Amsterdam: Elsevier, 517.
Pettersson, J.; B. Ramsey; and D. J. Harrison. 2006. Fabrication of bifunctional membrane electrode assemblies for unitised regenerative polymer electrolyte fuel cells. Electronics Letters 42 (25): 1444–6.
Pham, A-Q.; T. H. Lee; and R. S. Glass. 1999. Colloidal spray deposition technique for the processing of thin film solid oxide fuel cells. (Abstract #1554.) In: Dokiya, M.; and S. C. Singhal (eds.), Solid Oxide Fuel Cells (SOFC) VI. (From the 196th Meeting of the Electrochemical Society / Proceedings of the 6th International Symposium on SOFC, Honolulu, Hawaii, 17–22 October 1999.) Pennington, NJ: Electrochemical Society. PV99-19: 172–8.

REFERENCES _____________________________________________
390
Pinault, M.; M. Mayne-L’Hermite; C. Reynaud; V. Pichot; P. Launois; and D. Ballutaud. 2005. Growth of multiwalled carbon nanotubes during the initial stages of aerosol-assisted CCVD. Carbon 43 (14): 2968–76.
Pizzini, S.; G. Buzzanca; C. Mari; M. Rossi; and S. Torchio. 1972. Preparation, structure and electrical properties of thick ruthenium dioxide films. Materials Research Bulletin 7 (5): 449–62.
Plambeck, J. A.. 1982. Electroanalytical Chemistry: Basic Principles and Applications. New York: John Wiley & Sons, 318–26.
Popov, V. N.. 2004. Carbon nanotubes: Properties and application. Materials Science and Engineering Reports 43 (3): 61–102.
Pourdeyhimi, B.; E. Grant ; H. T. Nagle. 2007. Printing Electric Circuits onto Nonwoven Conformal Fabrics. NTC Project: F04-NS171. National Textile Center Annual Report: November 2007
Potter, E. C.. 1956. Electrochemistry. Principles and Applications. London: Cleaver-Hume Press Ltd; and New York: Macmillan Co..
Pozio, A.; M. De Francesco; A. Cemmi; F. Cardellini; and L. Giorgi. 2002. Comparison of high surface Pt/C catalysts by cyclic voltammetry. Journal of Power Sources 105 (1): 13–19.
Prabhuram, J; T. S. Zhao; C. W. Wong; and J. W. Guo. 2004. Synthesis and physical/electrochemical characterization of Pt/C nanocatalyst for polymer electrolyte fuel cells. Journal of Power Sources 134 (1): 1–6.
Prisyazhyi, V.D.; D. A. Tkalenko; N. A. Chmilenko; and M. D. Tkalenko. 2000. Overvoltage in cathode evolution of hydrogen from aqueous solutions on the rectifying metals. Dop NAS of Ukraine 9: 145–7.
Putley, E. H.. 1960. The Hall Effect and Related Phenomena. London: Butterworth. Qu, L.; and L. Dai. 2005. Substrate enhanced electroless deposition of metal
nanoparticles on carbon nanotubes. Journal of the American Chemical Society 127 (31): 10806–7.
Rajalakshmi, N.; and K. S. Dhathathreyan. 2007. Catalyst layer in PEMFC electrodes: Fabrication, characterisation and analysis. Chemical Engineering Journal 129 (1–3): 31–40.
Rajalakshmi, N.; H. Ryu; and K. S. Dhathathreyan. 2004. Platinum catalysed membranes for proton exchange membrane fuel cells—higher performance. Chemical Engineering Journal 102 (3): 241–7.
Rasten, E.; G. Hagen; and R. Tunold. 2003. Electrocatalysis in water electrolysis with solid polymer electrolyte. Electrochimica Acta 48 (25–26): 3945–52.
Reiger, P. H.. 1994. Electrochemistry, 2 ed.. New York: Chapman & Hall, Inc., 315–69.
Reshetenko, T. V.; H.-T. Kim; and H.-J. Kweon. 2007. Cathode structure optimization for air-breathing DMFC by application of pore-forming agents. Journal of Power Sources 171 (2): 433–40.
Rhein, R.. 2003. Screen printing process with diminished moiré effect. US patent 6505554, issued 2003/01/14. Application no. 897343, filed 2001/07/03. http://www.patentstorm.us/patents/6505554.html. [May 2008]
Riley, T.; T. Tomlinson (authors); and A. M. James (ed.). 1987. Principles of Electroanalytical Methods. New York: John Wiley & Sons [Published on behalf of ACOL, London, by Wiley], 167–80.
REFERENCES _____________________________________________
391
Robbins, J.. 1972. Ions in Solution. Vol. 2, An Introduction to Electrochemistry. Oxford: Clarendon Press.
Roe, R. J.. 2000. Methods of X-ray and neutron scattering in polymer science. New York: Oxford University Press.
Rolison, D. R.; E. A. Hayes; and W. E. Rudzinski. 1989. Electrode-modified zeolites: Electrode microstructures contained in and on a heterogeneous catalyst. Journal of Physical Chemistry 93 (14): 5524–31.
Roshandel, R.; B. Farhanieh; E. Saievar-Iranizad. 2005. The effect of variable porosity distribution of gas diffusion layer on PEM fuel cell performance. Renewable Energy 30 (10): 1557–72.
Rowe, A.; and X. Li. 2001. Mathematical modeling of proton exchange membrane fuel cells. Journal of Power Sources 102 (1–2): 82–96.
Rusling, J. F.; and R. J. Forster. 2003. Electrochemical catalysis with redox polymer and polyion–protein films. Journal of Colloid and Interface Science 262 (1): 1–15.
Rusta-Sellehy, A.; and D. Frank. 2004. Chemical hydride hydrogen generation system and an energy system incorporating the same. US patent 6737184, issued 2004/05/18. Application no. 09986638, filed 2001/11/09. Assignee: Hydrogenics Corporation.
Rusta-Sellehy, A.; D. Frank; and R. Rady-Pentek. 2005. Chemical hydride hydrogen generation system and an energy system incorporating the same. US patent 6946104, issued 2005/09/20. Application no. 09900469, filed 2001/07/09. Assignee: Hydrogenics Corporation.
Ryan, C.G.; D. N. Jamieson; C. L. Churms; and J. V. Pilcher. 1995. A new method for on-line true-elemental imaging using PIXE and the proton microprobe. Nuclear Instruments and Methods in Physics Research B: Beam Interactions with Materials and Atoms 104 (1–4): 157–65.
Saha, M. S.; R. Li; and X. Sun. 2007. Composite of Pt-Ru supported SnO2 nanowires grown on carbon paper for electrocatalytic oxidation of methanol. Electrochemistry Communications 9 (9): 2229–34.
Sato, S.; and J. M. White. 1981. Photocatalytic reaction of water with carbon over platinized titania. Journal of Physical Chemistry 85 (4): 336–41.
Sauer, D. U.; T. Sanders; B. Fricke; T. Baumhöfer; K. Wippermann; A. A. Kulikovsky; H. Schmitz; and J. Mergel. 2008. Measurement of the current distribution in a direct methanol fuel cell. Confirmation of parallel galvanic and electrolytic operation within one cell. Journal of Power Sources 176 (2): 477–83.
Savinell, R. F.; R. L. Zeller III; and J. A. Adams. 1990. Electrochemically active surface area. Journal of the Electrochemical Society. 137 (2): 489–94.
Schuegraf, K. K. (ed.). 1988. The Handbook of Thin-Film Deposition Processes and Techniques: Principles, Methods, Equipment and Applications. Park Ridge, NJ: Noyes Publications.
Scodelaro, F. A.; B. Hoyos; L. Balzano; and D. E. Resasco. 2005. Performance of PEM fuel cell electrodes using single wall carbon nanotubes as catalyst support. Proceedings of 2005 AIChE Annual Meeting and Fall Showcase, Cincinnati, OH, 30 October–4 November 2005. American Institute of Chemical Engineers. http://www.aiche.confex.com/aiche/2005/techprogram/P29188.HTM. [May 2008]
Scriba, M.; L. Petrik; D. Britten; A. Botha. 2003. Nanowonders—endless possibilities: Africa’s big opportunity in a small-scale technology. A strategy for

REFERENCES _____________________________________________
392
the future SA nanoeconomy. [Policy document. Submitted to Government of South Africa Department of Science and Technology (DST) in August 2003. Issued by the DST as The National Nanotechnology Strategy in April 2006 (ISBN 0-621-36395-2). http://www.dst.gov.za/publications-policies/strategies-reports.]
Sedlak, J. M.; J. F. Austin; and A. B. LaConti. 1981. Hydrogen recovery and purification using the solid polymer electrolyte electrolysis cell. International Journal of Hydrogen Energy 6 (1): 45–51.
Sha, Y.; L. Qian; Y. Ma; H. Bai; and X. Yang. 2006. Multilayer films of carbon nanotubes and redox polymer on screen-printed carbon electrodes for electrocatalysis of ascorbic acid. Talanta 70 (3): 556–60.
Shan, J.; S.Liao,; V.M. Linkov; L.F. Petrik. 2002. Preparation and characterization of novel superacid catalyst SO4
2-/Zr-ZSM-5. Fenzi Cuihua, 16(5), 379-383. Chemical Engineering College, South China University of Technology, Canton, Peop. Rep. China. CODEN: FECUEN ISSN: 1001-3555. Journal written in English. CAN 137:342492 AN 2002:877740 CAPLUS (Copyright 2003 ACS)
Shao, Z.; Yi B.; and Han M.. 1999. Bifunctional electrodes with a thin catalyst layer for ‘unitized’ proton exchange membrane regenerative fuel cell. Journal of Power Sources 79 (1): 82–5.
Shen, C.; X. Zhang; Y. Zhou; and H. Li. 2003. Preparation and characterization of nanocrysatlline Li4Ti5O12 by sol-gel method. Materials Chemistry and Physics 78 (2): 437–41.
Shin, S.-J.; J.-K. Lee; H.-Y Ha; S.-A. Hong; H.-S. Chun; and I.-H. Oh. 2002. Effect of the catalytic ink preparation method on the performance of polymer electrolyte membrane fuel cells. Journal of Power Sources 106 (1–2): 146–52.
Shu, J.; J. Li; and A. Pascovici. 1997. Multiple layer screening for reducing moiré patterning and ink bleeding. In: Proceedings of the 1997 International Conference on Image Processing (ICIP ’97), Washington DC, 26–29 October 1997. 3 vols.. Washington DC: IEEE Computer Society, 1: 803–6.
Shukla, P. K.; R.. K. Karn; A. K. Singh; and O. N. Srivastava. 2002. Studies on PV assisted PEC solar cells for hydrogen production through photoelectrolysis of water. International Journal of Hydrogen Energy 27 (2): 135–41.
Siegel, N. P.; M. W. Ellis; D. J. Nelson; and M. R. von Spakovsky. 2003. Single domain PEMFC model based on agglomerate catalyst geometry. Journal of Power Sources 115 (1): 81–9.
Sillen, C. W. M. P.; and S. J. D. van Stralen. 1980. Gas evolution during water electrolysis: Gas bubble behaviour and potential drop measurements. In: Veziroglu, T. N. (ed.). 1980. Alternative Energy Sources III: Proceedings of the 3rd International Conference on Alternative Energy Sources, Miami Beach Fl., 15 December 1980. Washington DC: Hemisphere Publishing Corp., 5 (3): 357–69.
Simonov, P. A.; and V. A. Likholobov. 2003. Ch. 12, Physicochemical aspects of preparation of carbon-supported noble metal catalysts. In: Wieckowski, A.; E. R. Savinova; and C. G. Vayenas (eds.), Catalysis and Electrocatalysis at Nanoparticle Surfaces. New York: Marcel Dekker, Inc., 409–54.
Sklyarov, A. T.; F. V. Kupovich; and V. Busse-Macukas. 1991. Cathode with low overvoltage of hydrogen evolution. Electrokhimiya 27 (12): 1588–94.

REFERENCES _____________________________________________
393
Sklyarov, A. T.; F. V. Kupovich; V. Busse-Macukas; and A. F. Mazanko. 1991. A cathode with low hydrogen overpotential for the membrane-cell process of chlorine and caustic soda production. Soviet Electrochemistry 27 (12): 1405–10.
Slade, S.; S. A. Campbell; T. R. Ralph; and F. C. Walsh 2002. Ionic conductivity of an extruded Nafion 1100 EW series of membranes. Journal of the Electrochemical Society 149 (12): A1556–64.
Smirnova, A.; X. Dong; H. Hara; A. Vasiliev; and N.. Sammes. 2005. Novel carbon aerogel-supported catalysts for PEM fuel cell application. International Journal of Hydrogen Energy 30 (2): 149–58.
Smith, S. P. J.; V. M. Linkov; C. T. O’Connor; L. F. Petrik; R. D. Sanderson; and K. Keiser. 1995. Preparation of hollow-fibre composite carbon-zeolite membranes. Microporous Materials 4 (5): 385–90.
SHEC™ Solar Hydrogen Energy Corporation (SHEC). Press release, 2006 A solution to global warming. http://www.solar-h2.com ; and http://www.shec-labs.com. [May 2008]
Somerset, V.; L. F. Petrik; and E. Iwuoha. 2005. Alkaline hydrothermal conversion of fly ash filtrates into zeolites (2): Utilization in wastewater treatment. Journal of Environmental Science and Health 40 (8): 1627–36.
Sone, Y.; P. Ekdunge; and D. Simonsson. 1996. Proton conductivity of Nafion 117 as measured by a four-electrode AC impedence method. Journal of the Electrochemical Society 143 (4): 1254–9.
Sørensen, B.; A. H. Petersen; C. Juhl; H. Ravn; C. Søndergren; P. Simonsen; K. Jørgensen; L. H. Nielsen; H. V. Larsen; P. E. Morthorst; L. Schleisner; F. Sørensen; and T. E. Pedersen. 2004. Hydrogen as an energy carrier: Scenarios for future use of hydrogen in the Danish energy system. International Journal of Hydrogen Energy 29 (1): 23–32.
Spahr, M. E.; P. Stoschitzki-Bitterli; R. Nesper; O. Haas; and P. Novák. 1999. Vanadium oxide nanotubes. A new nanostructured redox-active material for the electrochemical insertion of lithium. Journal of the Electrochemical Society 146 (8): 2780–3.
Specialty Graphic Imaging Association (SGIA). 2008. ASPT student screen printing and digital imaging competition. [Judging criteria.] Fairfax, VA: SGIA. http://www.sgia.org/pdf_server.cfm?pdf=/aspt/downloads/ASPT.pdf. [May 2008]
Steigerwalt, E. S.; G. A. Deluga; D. E. Cliffel; and C.M. Lukehart. 2001. A Pt-Ru/graphitic carbon nanofiber nanocomposite exhibiting high relative performance as a direct-methanol fuel cell anode catalyst. Journal of Physical Chemistry B 105 (34): 8097–101.
Stoltenberg J., Press statement. 18.04.2008: http://www.regjeringen.no/en/dep/smk/Press-Center/Press-releases/2008/norway-to-cooperate-with-south-africa-on.html?id=508133. [May, 2008]
Strong, K. L.; D. P. Anderson; K. Lafdi; and J. N. Kuhn. 2003. Purification process for single-wall carbon nanotubes. Carbon 41 (8): 1477.
Stucki, S.; and G. G. Scherer. 1998. PEM water electrolysers: Evidence for membrane failure in 100kW demonstration plants. Journal of Applied Electrochemistry 28 (10): 1041–9.
Sui S.; Gu J.; Li G.; and Sui Z.. [nd]. Development status of oxygen electrodes for proton exchange membrane fuel cells. http://www.hxtb.org/col/2000/c00009.htm

REFERENCES _____________________________________________
394
(Chinese). Referred to in Lykhnytskyi, K. V.; V. Z. Barsukov; and M. Jaskuła. 2007. Promising catalysts for H2-O2 fuel cells (Review). In: Veziroglu, T. N. et al (eds.), Hydrogen Materials Science and Chemistry of Carbon Nanomaterials. (NATO Science for Peace and Security Series A: Chemistry and Biology, vol. 41). Springer, 177–85.
Sunde, S.. 2000. Simulations of composite electrodes in fuel cells. Journal of Electroceramics 5 (2): 153–82.
Szostak, R.. 1992. Handbook of Molecular Sieves. New York: Van Nostrand Reinhold.
Tafel J.. The Polarization During Cathodic Hydrogen Evolution. Zeitschrift fur physikalische Chemie. Vol. 50, pp 641-712, 1905
Takasu, Y.; S. Onoue; K. Kameyama; Y. Murakami; and K. Yahikozawa. 1994. Preparation of ultrafine RuO2-IrO2-TiO2 oxide particles by a sol-gel process. Electrochimica Acta 39 (13): 1993–7.
Tamura, H.. 2004. Theorization on ion-exchange equilibria: Activity of species in 2-D phases. Journal of Colloid and Interface Science 279 (1): 1–22.
Tanaka, S.; K.-B. Min; N. Kato; H. Oikawa; and M. Esashi. 2005. Application of screen-printed catalytic electrodes to MEMS-based fuel cells. IEEJ Transactions on Sensors and Micromachines 125 (10): 413–7.
Tanev, P. T.; and T. J. Pinnavaia. 1995. A neutral templating route to mesoporous molecular sieves. Science 267 (5199): 865–7.
Taylor, A. D.; E. Y. Kim; V. P. Humes; J. Kizuka; and L. T. Thompson. 2007. Inkjet printing of carbon-supported platinum 3-D catalyst layers for use in fuel cells. Journal of Power Sources 171 (1): 101–6.
Technigraphics. 2002. Technigraphics cosmetic specifications 2/1/93 Rev. A. [7 pp.]. [Cosmetic reference standard, screenprinting judging criteria, guidelines and definitions of terms.] http://www.technigraphics.com/downloads/cosmetic_specs_020193.pdf. [May 2008]
Thamahane, T. C.. 2005. Development of anodic electrocatalyst and optimization of membrane electrode assembly for hydrogen reduction by water electrolysis. Unpublished MSc thesis. Department of Chemistry, University of the Western Cape.
Thomas, C. E.; I. F. Kuhn, Jr; B. D. James; F. D. Lomax, Jr; G. N. Baum. 1998. Affordable hydrogen supply pathways for fuel cell vehicles. International Journal of Hydrogen Energy 23 (6) June: 507-16.
Tokumisu, K.; J. S. Wainwright; and R. F. J. Savinell. 1999. Journal of New Materials for Electrochemical Systems 2: 171. [Out of print.]
Tomanek, D. (ed.). [nd]. Carbon arc (CA) synthesis of single-wall carbon nanotubes. http://nanotube.msu.edu/synthesis/ca.html. [May 2008]
Tosco, P.; L. Kosbach; Y. Yu; C. Orecchia. 2005. Gas diffusion electrodes containing modified carbon products. US Patent 6881511, issued 19/04/2005; Application No. 10638260 filed on 08/08/2003; Assignee: Cabot Corporation, Edison Termoelettrica, S.p.A.
Towne, S.; V. Viswanathan; J. Holbery; and P. Rieke. 2007. Fabrication of polymer electrolyte membrane fuel cell MEAs utilizing inkjet print technology. Journal of Power Sources 171 (2): 575–84.

REFERENCES _____________________________________________
395
Trasatti, S.. 2000. Electrolysis: Understanding the success of DSA®. Electrochimica Acta 45 (15–16): 2377–85.
Trasatti, S.. 1991. Physical electrochemistry of ceramic oxides. Electrochimica Acta 36 (2): 225–41.
Turner, J.A.. 2004. Sustainable Hydrogen Production. Science 305 (5686) 13 August: 972 - 74
Uchida, M.; Y. Fukuoka; Y. Sugawara; N. Eda; and A. Ohta. 1996. Effects of microstructure of carbon support in the catalyst layer on the performance of polymer-electrolyte fuel cells. Journal of the Electrochemical Society 143 (7): 2245–52.
US Department of Energy (DOE). 2002a. National Hydrogen Energy Roadmap. Toward a more secure and cleaner energy future for America. Production – delivery – storage – conversion – applications – public education and outreach. (November 2002.) Based on results of National Hydrogen Energy Workshop, Washington DC, 2–3 April 2002. US DOE, Office of Energy Efficiency and Renewable Energy. http://www1.eere.energy.gov/hydrogenandfuelcells/pdfs/national_h2_roadmap.pdf. [May 2008]
US Department of Energy (DOE). 2002b. A National Vision of America’s Transition to a Hydrogen Economy—to 2030 and Beyond. Toward a more secure and cleaner energy future for America. (February 2002.) Based on results of the National Hydrogen Vision Meeting, Washington DC, 15–16 November 2001. US DOE, Office of Energy Efficiency and Renewable Energy. http://www1.eere.energy.gov/hydrogenandfuelcells/pdfs/vision_doc.pdf. [May 2008]
US Department of Energy (DOE). 2002c. Proceedings of National Hydrogen Energy Roadmap Workshop, Washington DC, 2–3 April 2002. US DOE, Office of Energy Efficiency and Renewable Energy. http://www1.eere.energy.gov/hydrogenandfuelcells/wkshp_proceedings.html#vision_roadmaps. [May 2008]
US Department of Energy (DOE). 2002d. Proceedings of National Hydrogen Vision Meeting, Washington DC, 15–16 November 2001. US DOE, Office of Energy Efficiency and Renewable Energy. http://www1.eere.energy.gov/hydrogenandfuelcells/wkshp_proceedings.html#vision_roadmaps. [May 2008]
Vaivars, G.: N. W. Maxakato; T. Mokrani; L.F. Petrik; J. Klavins; G. Gericke; and V. Linkov. 2004. Zirconium phosphate-based inorganic direct methanol fuel cell. Materials Science 10 (2): 162–5.
Van der Pauw L.J., 1958. A method of measuring specific resistivity and Hall effects of discs of arbitrary shape. Phillips Res.Repts, 13 (1-9) 20: No 1: 220-4.
Van Herle, J.; R. Ihringer; R. Vasquez Cavieres; L. Constantin; and O. Bucheli. 2001. Anode supported solid oxide fuel cells with screen-printed cathodes. Journal of the European Ceramic Society 21 (10–11): 1855–9.
Vazquez-Gomez, L.; S. Ferro; and A. De Battisti. 2006. Preparation and characterization of RuO2-IrO2-SnO2 ternary mixtures for advanced electrochemical technology. Applied Catalysis B: Environmental 67 (1–2): 34–40.

REFERENCES _____________________________________________
396
Vielstich, W.. 2003. Fuel Cell Technology and Applications (Part 1). Vol 3 of Handbook of Fuel Cells: Fundamentals, Technology and Applications (4 vols.), edited by W. Vielstich; A. Lamm; and H. A. Gasteiger. West Sussex, England: John Wiley & Sons.
Vielstich, W.; A. Lamm; and H. A. Gasteiger (eds.). 2003. Handbook of Fuel Cells: Fundamentals, Technology and Applications. 4 vols.. Vol 3, Fuel Cell Technology and Applications (Part 1). West Sussex, England: John Wiley & Sons.
Viscoelasticity. (From Wikipedia, the free encyclopedia.) http://en.wikipedia.org/wiki/Viscoelasticity. [28 May 2008]
Vivekchand, S. R. C; L. M. Cele; F. L. Deepak; A. R. Raju; and A. Govindaraj. 2004. Carbon nanotubes by nebulized spray pyrolysis. Chemical Physics Letters 386 (4–6): 313–8.
Vogel, W.M.; and J. M. Baris. 1977. The reduction of oxygen on platinum black in acid electrolytes. Electrochimica Acta 22 (11): 1259–63.
Vohrer, U.; Kolaric, I.; Haque, M.H.; Roth, S.; Detlaff-Weglikowska, U. 2004. Carbon nanotube sheets for the use as artificial muscles. Carbon 42 1159–64
Wan, C.-H.; and Q.-H. Zhuang. 2007. Novel layer wise anode structure with improved CO-tolerance capability for PEM fuel cell. Electrochimica Acta 52 (12): 4111–23.
Wan, C.-H.; Q.-H. Zhuang; C.-H. Lin; M.-T. Lin; and C. Shih. 2006. Novel composite anode with CO ‘filter’ layers for PEFC. Journal of Power Sources 162 (1): 41–50.
Wang, B.; W. Kong; and H. Ma. 2007. Electrochemical treatment of paper mill wastewater using three-dimensional electrodes with Ti/Co/SnO2-Sb2O5 anode. Journal of Hazardous Materials 146 (1–2): 295–301.
Wang, J.; B. Tian; V. B. Nascimento; and L. Angnes. 1998. Performance of screen-printed carbon electrodes fabricated from different carbon inks. Electrochimica Acta 43 (23): 3459–65.
Wang, Y; X. Xu; Z. Tian; Y. Zong; H. Cheng; and C. Lin. 2006. Selective heterogeneous nucleation and growth of size-controlled metal nanoparticles on carbon nanotubes in solution. Chemistry—A European Journal 12 (9): 2542–9.
Wang, X.; I.-M. Hsing; and P. L. Yue. 2001. Electrochemical characterization of binary carbon supported electrode in polymer electrolyte fuel cells. Journal of Power Sources 96 (2): 282–7.
Wang C.Y.; Z.H. Wang, Pan Y. 1999. Two-phase transport in proton exchange membrane fuel cells. Proceedings of the ASME Heat Transfer Division: 1999, American Society of Mechanical Engineers
Weitkamp, J.. 2000. Zeolites and catalysis. Solid State Ionics 131: 175–88. Wen, X.; and S. Yang. 2002. Cu2S/Au core/sheath nanowires prepared by a simple
redox deposition method. Nano Letters 2 (5): 451–4. WE-NET. 1998. Development of hydrogen production technology. Summary of
Annual Reports 1998. [R&D goals – results in FY 1998 – ion exchange membrane technology – hydrogen production technology by electroless plating method – technology for hydrogen production by hot-pressing method – economics of hydrogen production plant – high temperature resistant polymeric electrolyte – literature pertaining to water electrolysis.] New Energy and Industrial Technology

REFERENCES _____________________________________________
397
Development Organisation. http://www.enaa.or.jp/WE-NET/report/1998/english/4_1.htm. [May 2008]
Wiesener, K.; and D. Ohms. 1990. Electrocatalysis of the cathodic oxygen reduction. In: Wendt, H. (ed.), Electrochemical Hydrogen Technologies. Electrochemical Production and Combustion of Hydrogen. New York: Elsevier, 63–103.
Williams, M.; L. Khotseng; Q. Ying; L. F. Petrik; A. Nechaev; V. Linkov. 2008. Applicability of analytical protocols for the characterization of carbon-supported platinum group metal electrocatalysts. Submitted to South African Journal of Science.
Wöhr, M.; K. Bolwin; W. Schnurnberger; M. Fischer; W. Neubrand; and G. Eigenberger. 1998. Dynamic modelling and simulation of a polymer membrane fuel cell, including mass transport limitation. International Journal of Hydrogen Energy 23 (3): 213–8.
Wood, N. S.. 1986. Electrolytic cell with low hydrogen overvoltage cathode. US patent 4586998, issued 1986/05/06. Application no. 06/642166, filed 1984/08/20. Assignee: Imperial Chemical Industries (ICI) PLC (Great Britain).
Wu, Y. H.; P. W. Qiao; T. C. Chong; and Z. X. Shen. 2002. Carbon nanowalls grown by microwave plasma enhanced chemical vapor deposition. Advanced Materials 14 (1): 64–7.
Wurster, R.; and J. Schindler. 2003. Ch. 5, Solar and wind energy coupled with electrolysis and fuel cells. In: Vielstich, W.; A. Lamm; and H. A. Gasteiger (eds.), Handbook of Fuel Cells: Fundamentals, Technology and Application. 4 vols.. Vol 3, Fuel Cell Technology and Applications (Part 1). West Sussex, England: John Wiley & Sons, 62–78.
Xie, F.; H. Meng; and P. K. Shen. 2008. Diffusion study in a novel three-dimensional electrode for direct methanol fuel cells. Electrochimica Acta 53 (15): 5039–44.
X-Ray Diffraction Lab. [nd]. Experiment 2, Pinhole/Polaroid Diffractometer. http://www.eng.uc.edu/~gbeaucag/Classes/XRD/Labs/Lab2html/Lab2 Pinhole_PE.html. [May 2008]
Yamaguchi, M.; T. Shinohara; and K. Okisawa. 1995. In: Proceedings of International Hydrogen and Clean Energy Symposium (IHCE ’95), Tokyo, Japan, 6–8 February 1995. Asian Technology Information Program (ATIP) Reports, ATIP95-63: 205–8.
Yamanaka K.. 1989. Anodically electrodeposited iridium oxide films (AEIROF) from alkaline solutions for electrochromic display devices. Japanese Journal of Applied Physics 28 (1/4): 632–7.
Yaritza, M.. 2004. Characterization of proton exchange membrane and PEM electrolyzer using non-steady state electrochemical techniques. Unpublished MSc thesis, University of Puerto Rico, 1–23.
Yim, S. D.; G. G. Park; Y. J. Sohn; W. Y. Lee; Y. G. Yoon; T. H. Yang; S. Um; S. P. Yu; and C. S. Kim. 2005. Optimization of PtIr electrocatalyst for PEM URFC. International Journal of Hydrogen Energy 30 (12): 1345–50.
Ying, Q.. 2005. Preparation and characterization of highly active nano Pt/C electrocatalyst. Unpublished MSc thesis, University of the Western Cape.
Yogi Goswami, D.. 1998. Solar Thermal Power Technology: Present Status and Ideas for the Future. Energy Sources, Part A: Recovery, Utilization, and Environmental Effects 20 (2) February: 137 – 45.

REFERENCES _____________________________________________
398
Yu, H. M.; C. Ziegler; M. Oszcipok; M. Zobel; and C. Hebling. 2006. Hydrophilicity and hydrophobicity study of catalyst layers in proton exchange membrane fuel cells. Electrochimica Acta 51 (7): 1199–207.
Yumurtaci, Z.; E. Bilgen. 2004. Hydrogen production from excess power in small hydroelectric installations. International Journal of Hydrogen Energy. 29 (7) July: 687-93
Yusti, E.; M. Pilkun; V. Shaibe; and A. Vinsel. 1962. Highly active hydrogen diffusive electrode. Izd. Inostr. Lit. Moscow, 296.
Zeolyst company webpage. http://www.zeolyst.com [May 2008] Zhang, H.; B. Zhu; and Y. Xu. 2006. Composite membranes of sulfonated poly
(phthalazinone ether ketone) doped with 12-phosphotungstic acid (H3PW12O40) for proton exchange membranes. Solid State Ionics 177 (13–14): 1123–8.
Zhang, J.. 2004. Investigation of CO tolerance in proton exchange membrane fuel cells. PhD thesis. Worcester, England: Worcester Polytechnic Institute.
Zhang, W.; T. R. Pauly; and T. J. Pinnavaia. 1997. Tailoring the framework and textural mesopores of HMS molecular sieves through an electrically neutral (SI) assembly pathway. Chemistry of Materials 9 (11): 2491–8.
Zhang, Y.; C. Wang; N. Wan; Z. Liu; and Z. Mao. 2007. Study on a novel manufacturing process of membrane electrode assemblies for solid polymer electrolyte water electrolysis. Electrochemistry Communications 9 (4): 667–70.
Zhou, W.. 2003. Research on anode catalysts for low temperature direct alcohol fuel cells. Dalian Institute of Chemical Physics (DICP), Chinese Academy of Sciences, Dalian, People’s Republic of China.
Zhou, Y.; and H. Li. 2002. Sol-gel template synthesis and structural properties of a highly ordered LiNi0.5Mn0.5O2 nanowire array. Journal of Materials Chemistry 12: 681–6.
Zhou, Z.; S. Wang; W. Zhou; G. Wang; L. Jiang; W. Li; S. Song; J. Liu; G. Sun; and Q. Xin. 2003. Novel synthesis of highly active Pt/C cathode electrocatalyst for direct methanol fuel cell. Chemical Communications 3: 394–5.
Zhu, W. H.; R. U. Payne; M. Nelms; and B. J. Tatarchuk. 2007. In situ electrical characterization of PEM fuel cells at load. Paper #295e presented at AIChE Annual Meeting, Salt Lake City, UT, 3–9 November 2007. http://aiche.confex.com/aiche/2007/techprogram/meeting.htm. [May 2008]