PT Indocement Tunggal Prakarsa Tbk Q1 2018 Results · Tiga Roda 53% Tiga Roda 38% Tiga Roda 35%...
29
INDOCEMENT PT Indocement Tunggal Prakarsa Tbk H1 2018 Results
-
Upload
nguyenkhanh -
Category
Documents
-
view
239 -
download
2
Transcript of PT Indocement Tunggal Prakarsa Tbk Q1 2018 Results · Tiga Roda 53% Tiga Roda 38% Tiga Roda 35%...
INDOCEMENT
PT Indocement Tunggal Prakarsa Tbk
H1 2018 Results

INDOCEMENT
Slide 2 - 16 Aug 2018
H1 2018 Results - Indocement
Agenda
Indocement : a well positioned player
Market & Financial Update
Vision 2020 – Strategies & Outlook
Final Message

INDOCEMENT
Slide 3 - 16 Aug 2018
H1 2018 Results - Indocement
Indocement: a well positioned player
Strong position with further upside potential
• Presence in strongly growing markets West and Central Java
• Strong RMC position in Jakarta with pull-through on CEM
Favorable regional exposure
• Innovative ways to maintain competitive cash cost, while still
maintaining high product quality, environmental, social, and
governance
• Absence of interest costs further enhances our competitiveness
Innovative ways to
maintain cost efficiency
• Strong distributors’ network and strategic terminals location, in addition to our Plant proximity to home market area
• Tiga Roda awarded Best Brand for 11th consecutive year
Best access to market
• Supply-demand gap set to reduce
• Multiplier effect to private sectors after massive infrastructure built
• Favorable macroeconomic drivers population: growth & urbanization
• Consolidation imminent: smaller players operating at cash losses
Further potential from
market upswing

INDOCEMENT
Slide 4 - 16 Aug 2018
H1 2018 Results - Indocement
MALAYSIA
BRUNEI
ANDAMAN SEA
INDIAN OCEAN
Jakarta
Strong footprint in West Java as a key advantage
Asset base
25 mt CEM capacity
2.8 mt AGG capacity
43 RMC plants
Integrated CEM plant
CEM terminal
AGG plant
RMC plant
Country capital
West Java is one of the fastest growing part of the country

INDOCEMENT
Slide 5 - 16 Aug 2018
H1 2018 Results - Indocement
Strategic location of plants & terminals
Market position Trends & potential Strategy & focus
50% market share in West
Java and 40% in Jakarta.
Strong RMC presence in
Jakarta with pull-through
effect on cement.
Strategically-placed
warehouses in all main areas
of Jakarta.
Well-known premium “Tiga
Roda” brand.
Huge infra projects in West
Java, such as Jakarta-
Cikampek & Bogor-Ciawi toll
road, LRT, MTR and Kertajati
airport.
Increased demand for better
quality housing in the capital
region driving cement
consumption per capita.
Defending market share in
home market by dual-brand
strategy, marketing initiatives
and increasing the RMC
footprint.
Being a reliable partner for
infrastructure providing
quality bulk cement &
concrete.
Increasing AGG presence to
benefit from vertical
integration.
13 CEM
plants
8 CEM
terminals
2 AGG
plants
39 RMC
plants
18
distributors
172
warehouses
Close location to the strongest growing markets of West Java & Jakarta

INDOCEMENT
Slide 6 - 16 Aug 2018
H1 2018 Results - Indocement
Brand is a very important marketing tool in Indonesia
“Tiga Roda” is the strongest brand in Indonesia
BUILDING MATERIAL
Cement
CATEGORY
White Cement Mortar
Our premium
brand Perception Award
• “Tiga Roda” brand is perceived to have best
quality & service in the country.
• “Top Brand” since eleven years.
• In 2017, we won in the three categories:
cement, white cement and mortars.
Results of the Top Brand survey 2017
Cement White cement Mortar
Brand Votes Brand Votes Brand Votes
Tiga Roda 53% Tiga Roda 38% Tiga Roda 35%
Semen Gresik 15% Semen Gresik 17% Mortar Utama 27%
Tonasa 13% Mortar Utama 17% Holcim 19%

INDOCEMENT
Slide 7 - 16 Aug 2018
H1 2018 Results - Indocement
Agenda
Indocement : a well positioned player
Market & Financial Update
Vision 2020 – Strategies & Outlook
Final Message

INDOCEMENT
Slide 8 - 16 Aug 2018
H1 2018 Results - Indocement
New LTV Relaxation Regulation to Boost Property Sector
-20%
-10%
0%
10%
20%
30%
40%
2011 *2012 2013 2014 2015 2016 2017 2018
Consumption: Housing, Flats, Shophouse* Construction*
Real Estate, Financial, and Business Services*/** Cement Consumption***
4. August 16
LTV for
• 1st House at 85%
• 2nd House of 80%
5. August 18
LTV for
• 1st House at 100%
• 2nd House at 80% - 90%
1
1. March 2012
LTV for 1st House at 70%
No LTV
3. June 15
LTV for
• 1st House at 80%
• 2nd House of 70%
2. September 2013
LTV for 2nd House at 60%
2
• Loan To Value introduction in 2012 successfully cool off the massive credit growth
• Easing of LTV regulation in 2015 and 2016 were not successful to stimulate credit growth as economic growth still
stagnant amid low consumption and investment
• Jokowi focus on infrastructure spending helped drive construction sector and lead to recovery in cement demand
particularly bulk sales. Slower property sector towards the end of 2016 were related to scrutiny by tax authority,
which was resolved via tax amnesty in 2017.
Jokowi step into Office
* Growth of average 12 month balance
** June 2017 up to 2018 using recalculated figures – changes method in Central Bank
*** 12 month rolling growth Source: Bank of Indonesia, Indonesia Cement Association
3 4
5

INDOCEMENT
Slide 9 - 16 Aug 2018
H1 2018 Results - Indocement
Indonesia – Favorable macroeconomic environment
Significant long-term growth potential
Strong population growth
One of the fastest growing countries
globally
Key: growing middle class
Middle class will have doubled by 2030
Upward trend in urbanization
By 2050 almost 75% of the population will live
in urban centers
264 296
2017 2030
+32 million
115
222
2017 2030
+107 million
53.3% 62.8%
2015 2030
+9.5%

INDOCEMENT
Slide 10 - 16 Aug 2018
H1 2018 Results - Indocement
Long-term potential of Indonesia is clearly visible
Significant headroom for growth
Essroc adds
1.7mt
Cement consumption tons per capita in kg
1,648
1,000
763
617
458 399
262 248 244 163
Australia China South
Korea
Malaysia Vietnam Pakistan Indonesia Phillippines Thailand India
462
Average
excluding
China:
INDOCEMENT
Slide 11 - 16 Aug 2018
H1 2018 Results - Indocement
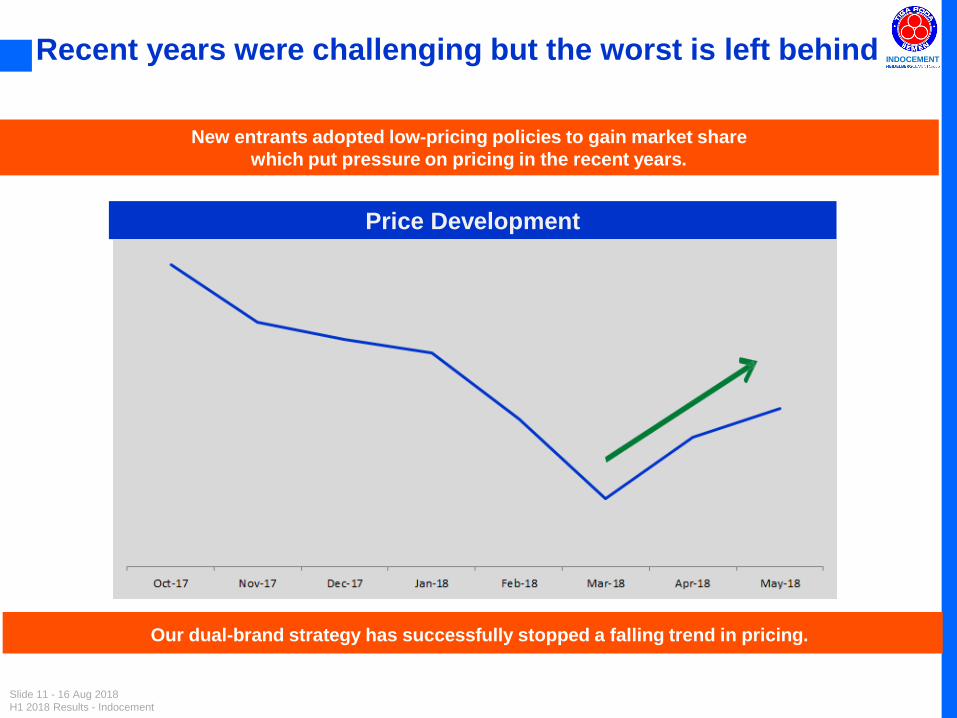
Recent years were challenging but the worst is left behind
Our dual-brand strategy has successfully stopped a falling trend in pricing.
Price Development
New entrants adopted low-pricing policies to gain market share
which put pressure on pricing in the recent years.

INDOCEMENT
Slide 12 - 16 Aug 2018
H1 2018 Results - Indocement
Regional Shift of Demand: Better Growth Outlook in Central Java and Sumatera
Nusa
Tenggara
Market shares based on cement domestic sales (Q2 2017, Q2 2018)
6.0Mt
1.8Mt
16.4M
t
2.3Mt
1.7Mt 0.7Mt
29.0Mt
Source: Asosiasi Semen Indonesia
6.5Mt
2.0Mt
25.4
%
10.9
%
41.3
%
21.1
%
11.6
%
41.6
%
6.6%
22.4
%
42.1
%
6.8%
22.8
%
40.2
%
0.8%
8.6%
67.2
%
1.4%
10.7
%
60.2
%
2.4Mt
0.9%
16.6
%
47.5
%
0.4%
8.8%
42.8
%
0.7Mt
5.2%
34.3
%
33.0
%
5.0%
33.7
%
31.9
%
1.7Mt 15.6
%
33.1
%
38.1
%
17.4
%
34.3
%
36.0
%
16.8M
t
15.0
%
25.5
%
41.3
%
15.2
%
26.1
%
39.3
%
30.0Mt
Sumatera:
71% , +7.5%
Kalimantan:
74% , +8.4% Sulawesi:
39% , +4.0%
Western Java:
38% , +3.6%
Central Java:
122% , +8.1%
Java:
47% , +2.2%
East Java
40% , -6.1%
East Indonesia:
141% , +4.2%
Data in Box: Utilization Rate and Growth Rates YoY per area for Q2 2018
Nusa Tenggara:
557% , -1.9%
Indonesia:
65% , +3.6%

INDOCEMENT
Slide 13 - 16 Aug 2018
H1 2018 Results - Indocement
Solid footing to capitalize on demand recovery in key markets
• Jakarta
• Banten
• Nusa Tenggara
• W. Java
• Yogyakarta
• E. Java
• Sumatera
• Kalimantan
• Sulawesi
• East Indonesia
• C. Java
Indonesia
Significant future potential as key markets are nearing bottom and enter recovery phase
Near bottom: <10% vol. growth rate from
lowest point in ’14 – ‘18
Recovery: 10% - 30% vol. growth rate from
lowest point in ’14 – ‘18
Strong Recovery: >30% vol. growth rate from
lowest point in ’14 – ‘18
Source: Indonesia Cement Association
INDOCEMENT
Slide 14 - 16 Aug 2018
H1 2018 Results - Indocement
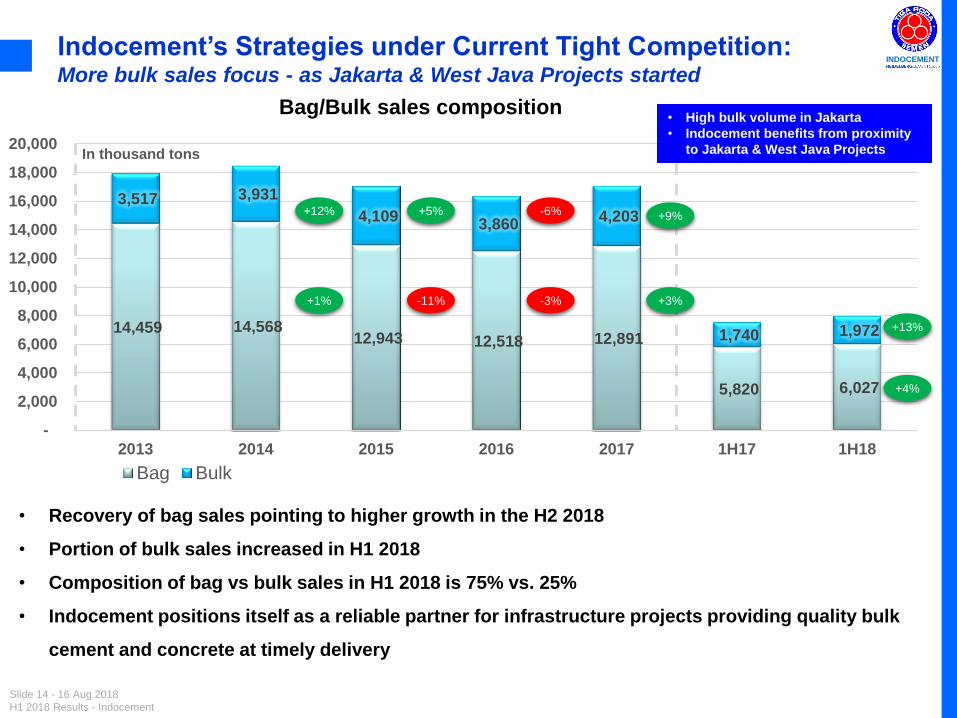
Indocement’s Strategies under Current Tight Competition: More bulk sales focus - as Jakarta & West Java Projects started
14,459 14,568 12,943 12,518 12,891
5,820 6,027
3,517 3,931
4,109 3,860
4,203
1,740 1,972
-
2,000
4,000
6,000
8,000
10,000
12,000
14,000
16,000
18,000
20,000
2013 2014 2015 2016 2017 1H17 1H18
In thousand tons
Bag Bulk
• Recovery of bag sales pointing to higher growth in the H2 2018
• Portion of bulk sales increased in H1 2018
• Composition of bag vs bulk sales in H1 2018 is 75% vs. 25%
• Indocement positions itself as a reliable partner for infrastructure projects providing quality bulk
cement and concrete at timely delivery
• High bulk volume in Jakarta
• Indocement benefits from proximity
to Jakarta & West Java Projects
Bag/Bulk sales composition
+12%
+1%
+5%
-11%
-6%
-3%
+9%
+3%
+13%
+4%

INDOCEMENT
Slide 15 - 16 Aug 2018
H1 2018 Results - Indocement
Consolidated Statement of Comprehensive Income
902
355
59
482
117 1
17
72
2
164
0
100
200
300
400
500
600
700
800
900
1,000
NI 2017 Revenues Costs.Rev. Del.Sel. Gen.Adm. Other Inc. Fin.Results Equities Tax NI 2018
Bio
ID
R
1
1
2
2
• EBITDA margin reduction from
22.0% to 13.5% contributed by
a. Lower sales volume during
EID holiday due to truck ban
that causes effective day to
be 1 week lower than last
year
b. higher cost of production
amidst soaring coal prices,
c. higher delivery expenses
related to Tarjun plant
overhaul prompting delivery
to Eastern Indonesia from
Citeureup
Low volume during EID holiday
Energy
Pressure
Delivery
and
Promotion Lower Cash
Balance
INDOCEMENT
Slide 16 - 16 Aug 2018
H1 2018 Results - Indocement
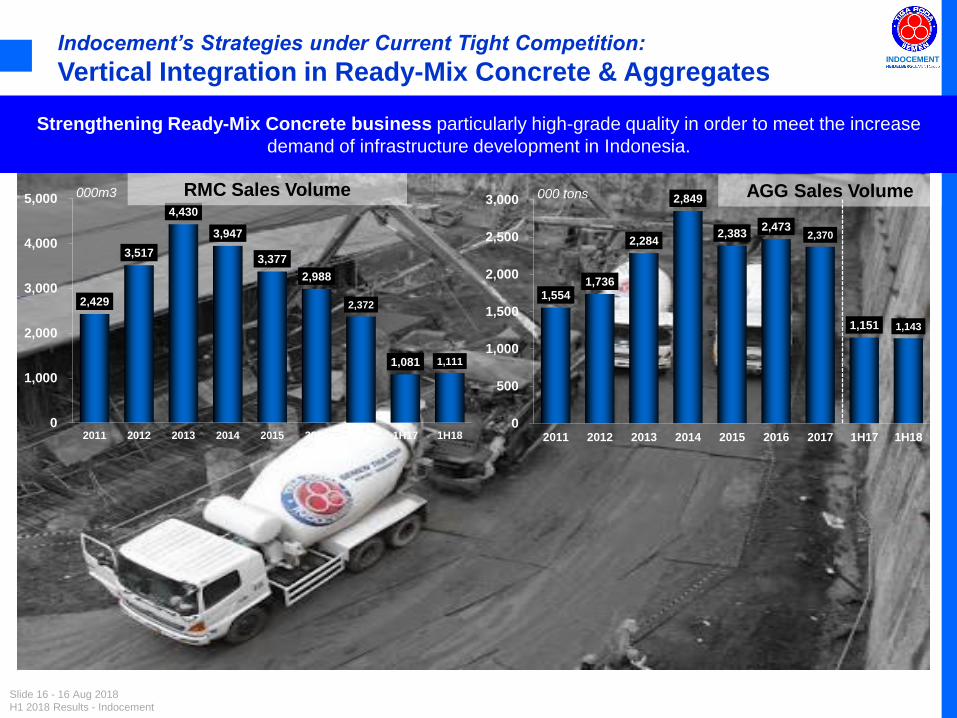
1,554 1,736
2,284
2,849
2,383 2,473
2,370
1,151 1,143
0
500
1,000
1,500
2,000
2,500
3,000
2011 2012 2013 2014 2015 2016 2017 1H17 1H18
000 tons
2,429
3,517
4,430
3,947
3,377
2,988
2,372
1,081 1,111
0
1,000
2,000
3,000
4,000
5,000
2011 2012 2013 2014 2015 2016 2017 1H17 1H18
000m3 RMC Sales Volume AGG Sales Volume
Indocement’s Strategies under Current Tight Competition:
Vertical Integration in Ready-Mix Concrete & Aggregates
Strengthening Ready-Mix Concrete business particularly high-grade quality in order to meet the increase
demand of infrastructure development in Indonesia.
INDOCEMENT
Slide 17 - 16 Aug 2018
H1 2018 Results - Indocement
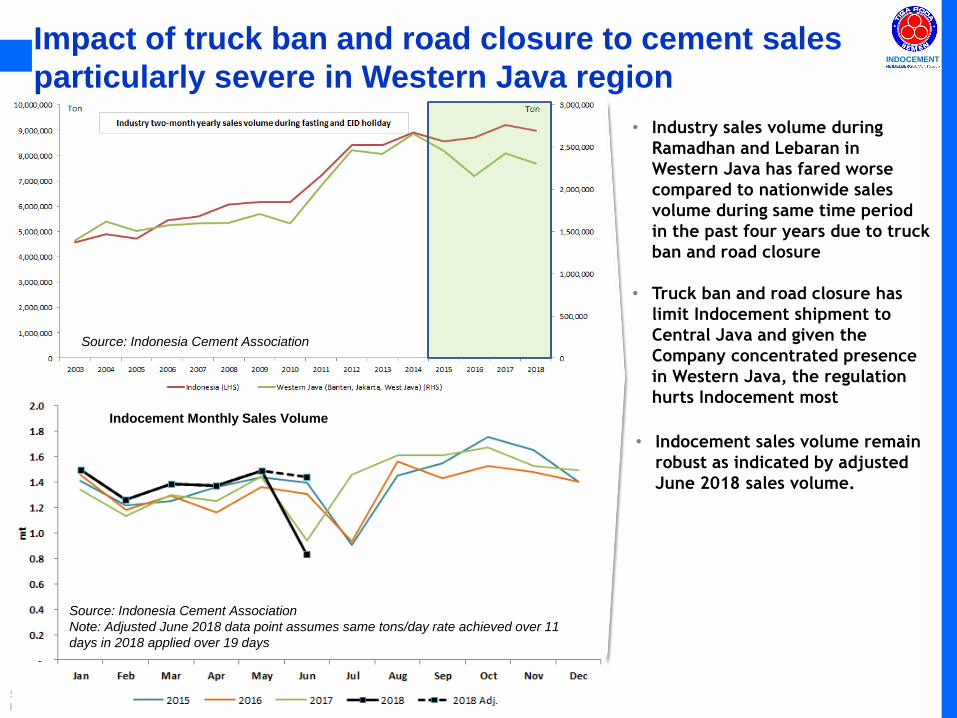
Impact of truck ban and road closure to cement sales
particularly severe in Western Java region
• Industry sales volume during
Ramadhan and Lebaran in
Western Java has fared worse
compared to nationwide sales
volume during same time period
in the past four years due to truck
ban and road closure
• Truck ban and road closure has
limit Indocement shipment to
Central Java and given the
Company concentrated presence
in Western Java, the regulation
hurts Indocement most
• Indocement sales volume remain
robust as indicated by adjusted
June 2018 sales volume.
Source: Indonesia Cement Association
Indocement Monthly Sales Volume
Source: Indonesia Cement Association
Note: Adjusted June 2018 data point assumes same tons/day rate achieved over 11
days in 2018 applied over 19 days
INDOCEMENT
Slide 18 - 16 Aug 2018
H1 2018 Results - Indocement
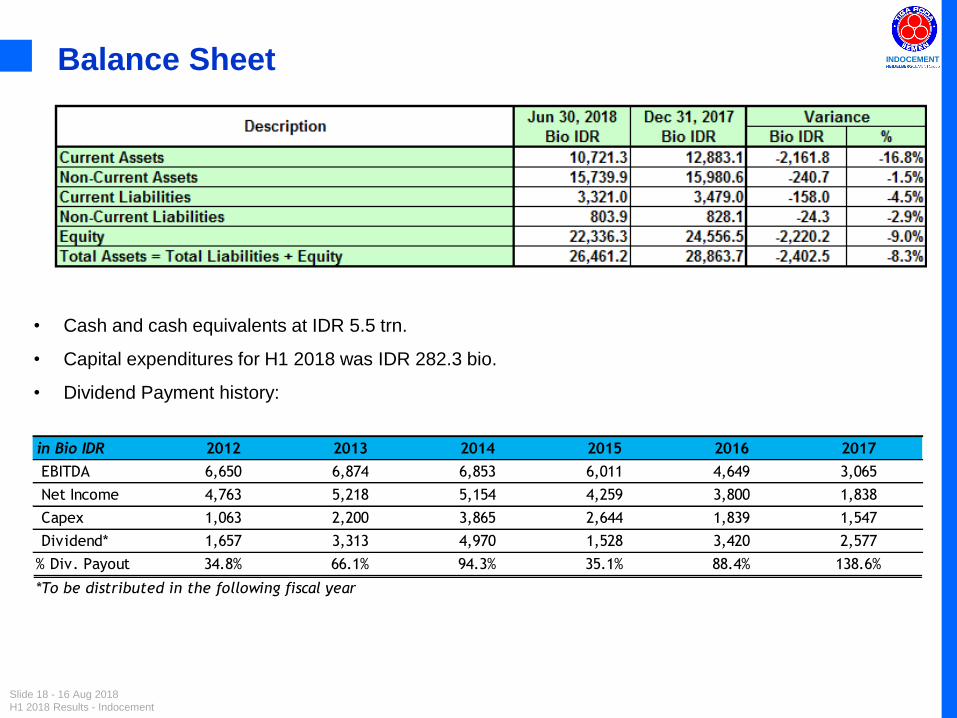
Balance Sheet
• Cash and cash equivalents at IDR 5.5 trn.
• Capital expenditures for H1 2018 was IDR 282.3 bio.
• Dividend Payment history:
in Bio IDR 2012 2013 2014 2015 2016 2017
EBITDA 6,650 6,874 6,853 6,011 4,649 3,065
Net Income 4,763 5,218 5,154 4,259 3,800 1,838
Capex 1,063 2,200 3,865 2,644 1,839 1,547
Dividend* 1,657 3,313 4,970 1,528 3,420 2,577
% Div. Payout 34.8% 66.1% 94.3% 35.1% 88.4% 138.6%
*To be distributed in the following fiscal year

INDOCEMENT
Slide 19 - 16 Aug 2018
H1 2018 Results - Indocement
Agenda
Indocement : a well positioned player
Market & Financial Update
Vision 2020 – Strategies & Outlook
Final Message
INDOCEMENT
Slide 20 - 16 Aug 2018
H1 2018 Results - Indocement
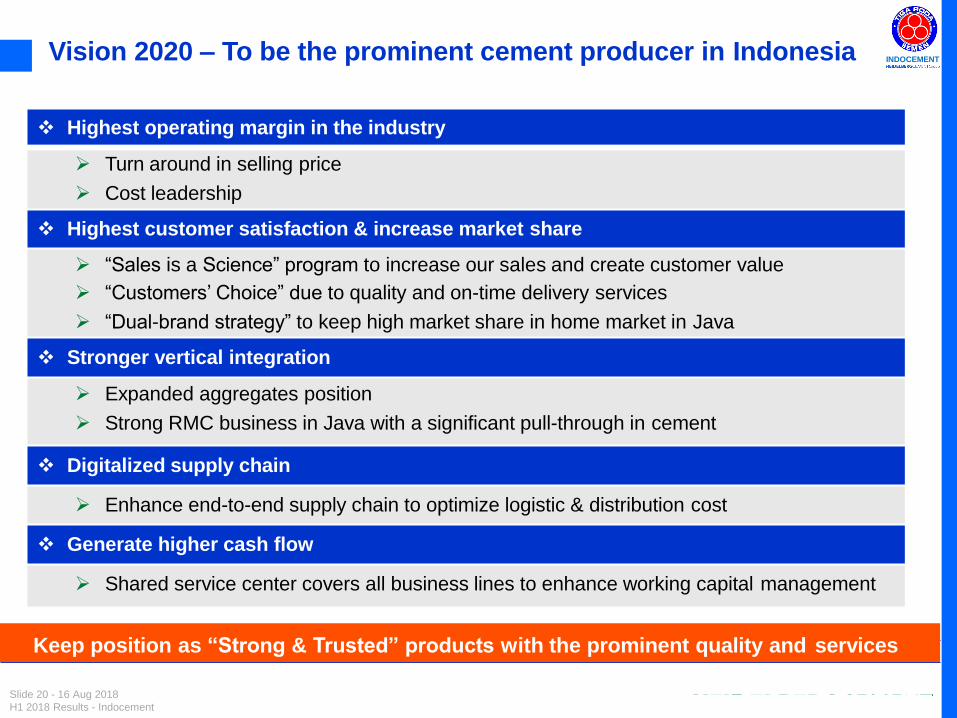
Vision 2020 – To be the prominent cement producer in Indonesia
Keep position as “Strong & Trusted” products with the prominent quality and services
Highest operating margin in the industry
Turn around in selling price
Cost leadership
Highest customer satisfaction & increase market share
“Sales is a Science” program to increase our sales and create customer value
“Customers’ Choice” due to quality and on-time delivery services
“Dual-brand strategy” to keep high market share in home market in Java
Stronger vertical integration
Expanded aggregates position
Strong RMC business in Java with a significant pull-through in cement
Digitalized supply chain
Enhance end-to-end supply chain to optimize logistic & distribution cost
Generate higher cash flow
Shared service center covers all business lines to enhance working capital management

INDOCEMENT
Slide 21 - 16 Aug 2018
H1 2018 Results - Indocement
Clear drivers of future growth
Growth drivers
Strong volume
momentum and outlook
Improving supply – demand
dynamics
Pricing stabilized and
improving
Unique market position of Indocement

INDOCEMENT
Slide 22 - 16 Aug 2018
H1 2018 Results - Indocement
Potential market consolidation as an additional upside
Newcomers under cash pressure as market turned down since they commissioned new capacities
Newcomers operate
at cash losses
Unfavorable cost structure due lower capacity and inferior equipment
Interest to be paid on debt-financed investment
Weak pricing & energy cost inflation
No sustainable business model
Consolidation
seems to be imminent
Newcomers actively look for buyers for their assets
Consolidation will clearly improve the pricing in the market
We cautiously check the possible
options in the market
We will participate the consolidation only if there is a clear value creation,
limited operational risks and a reasonable price

INDOCEMENT
Slide 23 - 16 Aug 2018
H1 2018 Results - Indocement
Located in Katibung, South Lampung
Coverage area : Lampung
3 steel silos cement @ 4,000 ton (total
cap. 12,000 ton)
1 Packers 180 ton/hour
1 Line of bulk loading system
1 Truck scale cap. 100 ton
1 Warehouse 1,000 M2
Area 4.2 Ha
1 Jetty Port
Commissioning Target: mid of August -
2018
Operating Target: September - 2018
50 % ( Civil & Mechanical)
Lifting and installation of silo
Jetty is finished Silo fabrication in progress

INDOCEMENT
Slide 24 - 16 Aug 2018
H1 2018 Results - Indocement
Located in Puspanegara village,
Karawang – West Java
Coverage area : Karawang &
vicinity
2 steel silos cement @ 500 ton
(total cap. 1,000 ton)
1 Line of bulk loading system
1 Truck scale cap. 80 ton
Area 500 M2
Commissioning Target:
beginning of August - 2018
Operating Target: mid of
August - 2018
60% (Civil & Mechanical)
Weigh bridge office in progress Weigh bridge ramp concrete pouring preparation
Building Permit process
Civil & mechanical works in progress

INDOCEMENT
Slide 25 - 16 Aug 2018
H1 2018 Results - Indocement
Slag Cement Concrete fc’ 35 – At Lampung Jetty
Mix Design
Slag Cement General Type
539 kg / m³
Silica Fume 20 kg / m³
Time 13:30 14:30 15:30
Minutes 0’ 30’ 60’
Slump (cm) 16 15 15
Temperature (°C) 30 30 32
Initial Setting Time 9 hours 30 minutes
No Cementitious Peak
Temperature (°C)
Placement Temperature
(°C)
Heat of Hydration
(°C)
Heat of Hydration / 100 kg
Cementitious (°C)
1 Slag Cement + Silica Fume
539 S.C. + 20 S.F.
86 30 56 10.02
2 100% Slag
Cement 539 83.2 30 53.2 9.87
Estimated Heat of Hydration
Mock-up Block for Thermal Properties
(1.5x1.5x1.5m)
1
5 7
28
0
10
20
30
40
50
0 5 10 15 20 25 30Co
mp
ress
ive
Stre
ngt
h (
MP
a)
Age (Days)
Compressive Strength (MPa) Development
0
20
40
60
80
100
0 5 10 15 20 25 30
Tem
per
atu
re (
°C)
Time (Days)
Temperature Monitoring for 28 days (°C)
Temperature at the Base (83°C)
Temperature at Top Surface (76°C)
Peak Temperature at Center (86°C)

INDOCEMENT
Slide 26 - 16 Aug 2018
H1 2018 Results - Indocement
Outlook of Indonesian Cement Market
National cement consumption growth started to turn positive and grew by 7.6% in 2017
(versus negative growth of -0.6% in 2016) and expected to grow by 7-8% in 2018
Consumption in 2018 will still be driven by infrastructure projects and some of commercial and
residential projects that have been launched in 2017. However, US policies to increase interest
rate and reduce corporate tax will somewhat affect Indonesia, i.e.: weakening exchange rate of
IDR/USD and possible IDR interest rate increase. In turn, such macroeconomic condition will
weaken demand in 2018
Strong concrete and bulk cement demand anticipated in Sumatera, Greater Jakarta, Central, and
East Java in 2018 due to Government’s infrastructure projects and the multiplier effect
projects.
Coal price remained at elevated level.
Over supply will continue in next few years -- We still expect the continuing tight competition
among 19 brands from 15 players (from 9 brands and 9 players previously) especially in Jakarta
and West Java due to more players located in these areas will hinder the price to increase.

INDOCEMENT
Slide 27 - 16 Aug 2018
H1 2018 Results - Indocement
Agenda
Indocement : a well positioned player
Market & Financial Update
Vision 2020 – Strategies & Outlook
Final Message

INDOCEMENT
Slide 28 - 16 Aug 2018
H1 2018 Results - Indocement
Indocement: a well positioned player
Strong position with further upside potential
• Presence in strongly growing markets West and Central Java
• Strong RMC position in Jakarta with pull-through on CEM
Favorable regional exposure
• Innovative ways to maintain competitive cash cost, while still
maintaining high product quality, environmental, social, and
governance
• Absence of interest costs further enhances our competitiveness
Innovative ways to
maintain cost efficiency
• Strong distributors’ network and strategic terminals location, in addition to our Plant proximity to home market area
• Tiga Roda awarded Best Brand for 11th consecutive year
Best access to market
• Supply-demand gap set to reduce
• Multiplier effect to private sectors after massive infrastructure built
• Favorable macroeconomic drivers population: growth & urbanization
• Consolidation imminent: smaller players operating at cash losses
Further potential from
market upswing

INDOCEMENT
Slide 29 - 16 Aug 2018
H1 2018 Results - Indocement
Important Notice
Disclaimer
This presentation contains general information which provided without any representations or warranties, express or implied and does not constitute or form
part of, and is not made in connection with, any offer for sale or subscription of or solicitation, recommendation, or invitation of any offer to buy or subscribe
for any securities nor shall it or any part of it form the basis of or be relied on in connection with any contract, commitment, or investment decision
whatsoever.
Terms of Use
Slides prepared in this presentation are strictly confidential and have been prepared as a support for verbal discussions only. The information contained in
this presentation is being presented to you solely for your information and may not be reproduced or redistributed to any other person, in whole or in part. You
acknowledge that, because of the limited nature of communication through our presentation features, any assistance you may receive using any such
features is likely to be incomplete and may even be misleading.
Forward-Looking Statements
This presentation includes forward-looking statements, which are based on the expectation or forecast about future events, formed by Indocement after
reviewing existing data and research. Such statements involve known and unknown risks including factors such as: (i)Global macroeconomic and geopolitical
situations; (ii) Indonesia macroeconomic and geopolitical situation; (iii) Competition from incumbents and new players; (iii) Changes in laws, regulation,
taxation, or accounting standards or practices; (iv) Acquisitions, divestitures, and various business opportunities that we may pursue; (v)Force majeure;
(vi)Labor unrest or other similar situations; (vii)Outcome of pending or threatened litigation
Indocement does not give assurance that such outcome will be attained. If you have any specific questions about any legal, financial or tax matter, you
should consult your lawyer/financial/tax Consultant or other professional legal services provider.
For further information please contact
PT Indocement Tunggal Prakarsa Tbk.
Wisma Indocemen, 8th Floor
Jl. Jend. Sudirman Kav 70 - 71
Jakarta 12910, Indonesia
Phone : +62 21 2512121
e-mail: [email protected].
©2018, PT Indocement Tunggal Prakarsa Tbk. All rights reserved.