Interpretation of Basic Semen Analysis and Advanced Semen Testing

INDOCEMENT
PT Indocement Tunggal Prakarsa Tbk
Q1 2018 Results
Jakarta, 18 May 2018
INDOCEMENT
Slide 2 - 18 May 2018
Q1 2018 Results - Indocement
Agenda
Indocement Fact Sheet & Indocement Today
Current Domestic Market Condition
Financial Update Q1 2018
Investment Strategy
Outlook 2018

INDOCEMENT
Slide 3 - 18 May 2018
Q1 2018 Results - Indocement
Cement
3 Factory Locations with 8 Terminals (+1 under Construction)
13 Kiln Lines 26 Grinding Units
Clinker Capacity: 19 million tons
Cement Capacity: 24.9 million tons
Ready Mix and
Aggregates
43 Batching Plants
in 31 Strategic Locations
601 Truck
Mixers
Ready Mix Capacity: 5 million
m3
Aggregate Capacity:
2.8 million tons
Indocement Fact Sheet
1985 - Start:
Merger 6 Companies with 8
Plants
1989: Go Public
1991: Plant 9 +
RMC Business 1996/97:
Plant 10/11
1998: Merge
with IKC/ Plant 12
2001: HC Group
2005: PCC
2007: P8
Modification +
Aggregates
Business
2010: Cirebon
Mill Expansio
n
2013: P14
Construction
Started
2014: VRM
2016: Kiln P14
2017: P14
Completed
18 distributors
18,500 retailers
172 warehouses

INDOCEMENT
Slide 4 - 18 May 2018
Q1 2018 Results - Indocement
Indocement Today
The second largest listed cement manufacturer in Indonesia
Integrated cement operations
Total current production capacity of 24.9 mt of cement
As of 31 March 2018:
Market capitalization IDR ~59 trillion (IDR 16,000/share) - one of the largest in IDX.
with 6,034 employees (Cement 4,164; RMC & Aggregates 1,870)
Leading Indonesian Producer of Quality & Specialty Cement
Products
Well established “Tiga Roda” and “Rajawali” brand which just launched in October 2016
Diversified product range:
OPC, PCC, PPC, TR Rapid, PCC Industry,
and the new products – Slag Cement
The one and only White Cement producer in Indonesia to date.
One of the world’s largest cement producers - is the majority & controlling shareholder

INDOCEMENT
Slide 5 - 18 May 2018
Q1 2018 Results - Indocement
640 534 1,024 1,238 1,472
3,520
1,216 1,344
2,400 2,400
3,200
15,788
18,988
1975:Plant-1
1976:Plant-2
1979:Plant-3
1980:Plant-4+5
1983:Plant-6
1984:Plant-7+8
1991:Plant-9
1996:Plant-10
1999:Plant-11
2000:Plant-12
2016:Plant-14
Clinker Capacity: Scaling Up Production Capacity in Indonesia
Cement Grinding Production Capacity
24.9 MillionTon per Year
In Thousand Tons Cinker Per Year

INDOCEMENT
Slide 6 - 18 May 2018
Q1 2018 Results - Indocement
Citeureup Factory
10 plants with
production capacity
of 18.2mt
Tj. Priok Terminal
Palimanan Factory
2 plants with production
capacity of 4.1mt
Surabaya
Terminal
Lombok Terminal
Tarjun Factory
1 plant with production
capacity of 2.6mt
Samarinda Terminal
Cigading Terminal
Sepanjang
Terminal
Citeureup Factory is one of the largest integrated factory complexes in the world.
State-of-art technology with some of the most efficient kilns in operation today.
Current total capacity is 24.9 mt of cement.
Cement distribution using train for some locations.
PontianakTerminal
Geographical Position 13 Plants at 3 locations and 8 cement terminals
Banyuwangi Terminal
Palembang Terminal
Lampung Terminal
(under Construction)
INDOCEMENT
Slide 7 - 18 May 2018
Q1 2018 Results - Indocement
Agenda
Indocement Fact Sheet & Indocement Today
Current Domestic Market Condition
Financial Update Q1 2018
Investment Strategy
Outlook 2018

INDOCEMENT
Slide 8 - 18 May 2018
Q1 2018 Results - Indocement
Macro Summary
Nevertheless, Government efforts came with challenges:
Its costly infra structure programs, increase the debt level, thus,
Forex reserve as of March declined by US$ 2bio to US$ 126 bio due to forex
loan payment and also IDR stabilization amid global protectionism lead by
US and triggered monetary tightening on some countries.
Energy recovery potentially push the inflation, on March, inflation rose to
3.4% attributable to increase of non-subsidized fuel prices
No kickback from Government efforts – consumption yet increased: housing
sector still indicates slow growth, despite recovery on commodity sector.
Rating Agencies Indonesia Sovereign
Credit Rating
Outlook
Standard & Poor's BBB- Stable
Fitch Ratings BBB Stable
Moody's Investor Service Baa2 (Upgraded from Baa3 on April 6th)
Stable
Japan Credit Rating Agency BBB- Positive
Rating and Investment
Information Inc.
BBB- Positive
-30%
-20%
-10%
0%
10%
20%
30%
40%
20/10/2014 20/10/2015 20/10/2016 20/10/2017
JCI - Indonesia SET - Thailand
STI - Singapore
Jokowi’s
Inauguration
Strong Investor Trust
Government aims consistently try to keep budget deficit at 2.19% of GDP this
year by continuing its effort to ease business despite its current populism
policy near presidential election (increase social fund, subsidized energy,
Coal DMO, toll tariff reduction – on plan)
Simplified Tax Holidays announced to the market.
Continued Infra structure programs to aim long term benefits.
90%
110%
130%
150%
170%
190%
20/10/2014 20/10/2015 20/10/2016 20/10/2017
Indonesia India BrazilTurkey South Africa
Relatively Strong Currency
Strong Investment Market Indicator

INDOCEMENT
Slide 9 - 18 May 2018
Q1 2018 Results - Indocement
Indonesia Cement Industry 2018 Landscape
Sumatera: 18.2
SI: 11.2 (I)
LHI: 1.8 (I)
SMBR: 3.8 (I)
BSM: 1.0 (GM)
MP: 0.4 (I)
* In million ton per annum; including
grinding mill capacity
West Java: 42.6
SI: 1.0 (GM)
INTP: 21.4 (I)
LHI: 4.9 (I)
CCI: 4.0 (GM)
MP: 4.7 (I)
SCG: 2.0 (I)
JSI: 2.0 (I)
Other: 2.7 (GM)
Central Java: 7.7
SI: 1.6 (I)
LHI: 4.1 (I)
STAR: 2.0 (I)
East Java: 20.8
SI: 14.4 (I)
LHI: 3.2 (I)
BSM: 1.5 (GM)
MP: 1.2 (GM)
Puger: 0.5 (I)
East Indonesia: 1.6
SK: 0.6 (I)
CCI: 1.0 (I)
Kalimantan: 5.3
INTP: 2.8 (I)
CCI: 2.5 (I)
SI: 7.8 (I)
BSM: 4.1 (I)
CCI: 0.5 (I)
Sulawesi: 12.4
Integrated: 94.3
Grinding Mill: 14.3
Indonesia: 108.6
SI: Semen Indonesia, INTP: Indocement, LHI: Lafarge Holcim, CCI: Conch, MP: Merah
Putih, SCG: Siam, JSI: Jui Shin, SMBR: Baturaja, BSM: Bosowa, SK: Semen Kupang,
Puger, STAR: Semen Bima, Other: Hao Han, Semen Jakarta, Sun Fook

INDOCEMENT
Slide 10 - 18 May 2018
Q1 2018 Results - Indocement
Indonesia Cement Industry 2018 Capacity Share Capacity in million Tons per Annum
Capacity Grew by 7.6% YoY or 7.6 mtpa in 2018e Source: Asosiasi Semen Indonesia
(Capacity Share)
61 63 65 70 74
7 7
8 10 11
2 6
13 21 23
2014 2015 2016 2017 2018e
New Entrants (CG, JSI, SJW, STA, CCI)
2nd Tier Incumbents (SBM, SB, SK)
Top 3 Incumbents (ITP, SI, LHI)
76.5 86.2 101.0 108.6 69.5
1. Semen Indonesia: 36.0 (33.1%)
2. Indocement: 24.9 (22.3%)
3. LHI: 14.0 (12.8%)
5. Bosowa: 6.7 (6.1%)
6. Cemindo Gemilang: 6.3 (5.8%)
4. Conch: 8.0 (7.4%)
7. Semen Baturaja:3.8 (3.5%)
9. Siam Cement: 2.0 (1.8%)
8. Panasia: 2.0 (1.8%)
10. Juishin: 2.0 (1.8%)
11. Semen Kupang: 0.6 (0.6%)
Puger, Hao Han, Semen Jakarta,
Sun Fook: 3.2 (2.9%)
INDOCEMENT
Slide 11 - 18 May 2018
Q1 2018 Results - Indocement
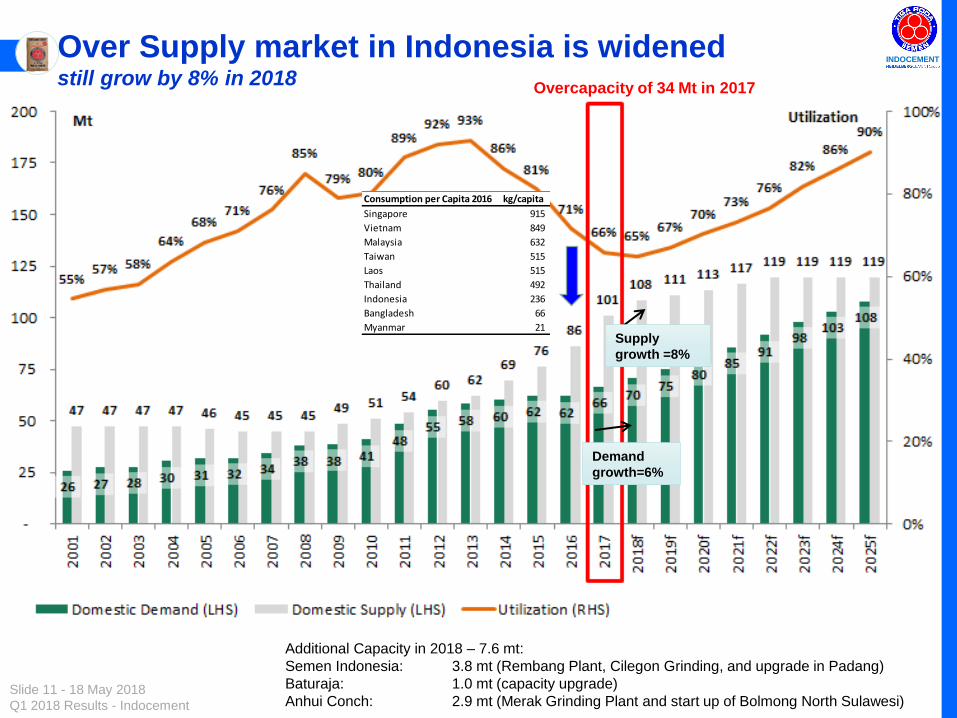
Over Supply market in Indonesia is widened still grow by 8% in 2018
Overcapacity of 34 Mt in 2017
Supply
growth =8%
Demand
growth=6%
Consumption per Capita 2016 kg/capita
Singapore 915
Vietnam 849
Malaysia 632
Taiwan 515
Laos 515
Thailand 492
Indonesia 236
Bangladesh 66
Myanmar 21
Additional Capacity in 2018 – 7.6 mt:
Semen Indonesia: 3.8 mt (Rembang Plant, Cilegon Grinding, and upgrade in Padang)
Baturaja: 1.0 mt (capacity upgrade)
Anhui Conch: 2.9 mt (Merak Grinding Plant and start up of Bolmong North Sulawesi)

INDOCEMENT
Slide 12 - 18 May 2018
Q1 2018 Results - Indocement
Supply Side: 9 New Players In The Last 6 Years and At Least 1 More Showed Interest in Entering
Indonesia Market
SS
2017 2013 2019 2015 2016 2018 2014 2020
Planned commissioning year unknown1
2012
Today
Timeline of cement new entrants commissioning year
1. Incoming capacity up to 2020: Semen Indonesia Aceh, Semen Indonesia Jayapura, Conch North Sulawesi, Conch South Sulawesi; and Semen Grobogan in 2021
9 new players in 2012-
2016 with current
combined capacity of
~23.4 Mt

INDOCEMENT
Slide 13 - 18 May 2018
Q1 2018 Results - Indocement
Regional Shift of Demand: Better Growth Outlook in Central & East Java and Sumatera
Nusa
Tenggara
Market shares based on cement domestic sales (Q1 2017, Q1 2018)
3.1Mt
0.9Mt
8.3Mt
1.2Mt
0.9Mt 0.4Mt
14.8Mt
Source: Asosiasi Semen Indonesia
3.4Mt
1.0Mt
26%
11%
41%
21%
12%
41%
7%
23%
44%
7%
25%
41%
1%
8%
68%
1%
11%
61%
1.3Mt
1%
16%
47%
0%
6%
45%
0.4Mt
5%
35%
34%
6%
35%
29%
0.8Mt 16%
33%
38%
17%
35%
36%
8.8Mt
15%
26%
41%
15%
26%
39%
15.7Mt
Sumatera:
75% , +11.7%
Kalimantan:
78% , +11.5% Sulawesi:
41% , +5.9%
Western Java:
40% , +7.8%
Central Java:
122% , +12.1%
Java:
49% , +6.1%
East Java
42% , -2.4%
East Indonesia:
166% , +0.5%
Data in Box: Utilization Rate and Growth Rates YoY per area for Q1 2018
Nusa Tenggara:
529% , -9.2%
Indonesia:
58% , +6.6%

INDOCEMENT
Slide 14 - 18 May 2018
Q1 2018 Results - Indocement
25.7 27.1 27.5 30.2 31.5 31.9 34.2
38.1 38.4 40.8
48.0
55.0 58.0 59.9 62.0 61.6
66.3
3.3% 4.5% 4.8% 5.0% 5.7% 5.5%
6.3% 6.0% 4.6%
6.2% 6.2% 6.0% 5.6% 5.0% 4.7% 5.0% 5.1%
15.2%
5.2%
1.8%
9.7%
4.2% 1.5%
7.0% 11.4%
0.9%
6.2%
17.7%
14.5%
5.5% 3.3% 3.5%
-0.6%
7.6%
2001 2002 2003 2004 2005 2006 2007 2008 2009 2010 2011 2012 2013 2014 2015 2016 2017
Domestic Demand (mio T) GDP Growth Demand Growth
Cement Demand Rebounds After 4 Years of Down Trend
Infrastructure Spending Realized in Q1 2018
Cement Demand Q1 2018 supported by Infrastructure
Weighing by relatively high mortgage rate
Source: Indonesian Cement Association, BPS Statistic
10.6%
4.3%
0.0%
3.0%
6.0%
9.0%
10.0%
11.0%
12.0%
13.0%
14.0%
10 11 12 13 14 15 16 17
Investment Loan - Commercial Banks (LHS)
BI Rate (RHS)
BI 7 Days (RHS)
Average Growth of All Types Residential Property Sales
Average Growth of Last 3Years Sales
Residential Sector still weak
Credit Down
Buy on Low Credit
Stop on Trend Up
Credit Rate Credit Already
Down
Weak
Property
Sales
Infrastructure
Push Demand
INDOCEMENT
Slide 15 - 18 May 2018
Q1 2018 Results - Indocement
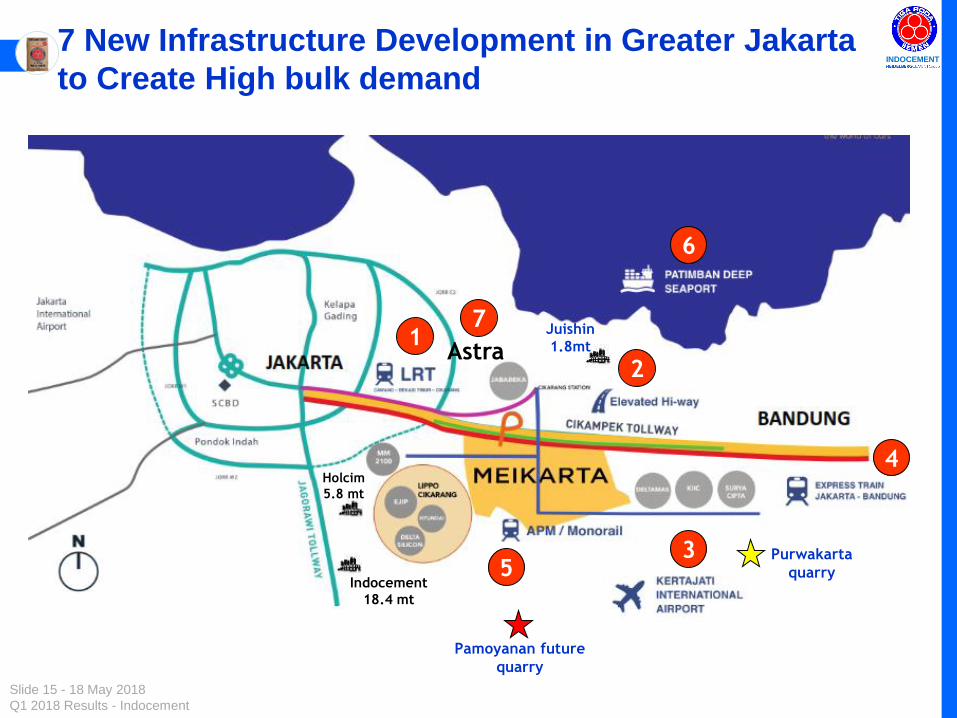
7 New Infrastructure Development in Greater Jakarta
to Create High bulk demand
1
3
2
4
5
6
7
Astra
Indocement
18.4 mt
Holcim
5.8 mt
Juishin
1.8mt
Purwakarta
quarry
Pamoyanan future
quarry

INDOCEMENT
Slide 16 - 18 May 2018
Q1 2018 Results - Indocement
Multiplier Effects After Infrastructure Established: Industrial Estates in Greater Jakarta
Juishin
1.8mt Merah Putih
6.3 mt
Siam
1.8 mt
Conch
2.2 mt
Indocement
18.4 mt
Est. of overall area of 16,500 ha
Est. cement consumption 230 kg per sqm
Jakarta, Banten, West Java demand:
2017: 17.7 mt
Q1 2017: 4.0 mt
Q1 2018: 4.3 mt
Holcim
5.8 mt

INDOCEMENT
Slide 17 - 18 May 2018
Q1 2018 Results - Indocement
73% 72% 73% 72% 74% 73% 73%
27% 28% 27% 28% 26% 27% 27%
2013 2014 2015 2016 2017 1Q17 1Q18
Java Ex Java
Indocement’s Strategies Under Current Tight Competition:
Rebalance Portfolio and Focus on Home Market
Java Presence Grows
• To reduce logistics
cost and to defend
market share at
home markets sales
are targeted
towards home
market
• Central Java is one
of the fastest
growing market and
underserved (high
utilization rate)
• Multiplier effects
across Java
generally, and
greater Jakarta
specifically are
observed since Q2
2017

INDOCEMENT
Slide 18 - 18 May 2018
Q1 2018 Results - Indocement
Indocement’s Strategies under Current Tight Competition: More bulk sales focus - as Jakarta & West Java Projects started
14,459 14,568 12,943 12,518 12,891
3,008 3,203
3,517 3,931
4,109 3,860 4,203
845 1,022
-
2,000
4,000
6,000
8,000
10,000
12,000
14,000
16,000
18,000
20,000
2013 2014 2015 2016 2017 1Q17 1Q18
In thousand tons
Bag Bulk
• Portion of bulk sales increased in Q1 2018
• Composition of bag vs bulk sales in Q1 2018 is 76.0% vs. 24.0%
• Indocement positions itself as a reliable partner for infrastructure projects providing quality bulk
cement and concrete at timely delivery
• High bulk volume in Jakarta
• Indocement benefits from proximity
to Jakarta & West Java Projects
Bag/Bulk sales composition Jan - Dec
20% 21% 24%
24% 25%
22% 24%

INDOCEMENT
Slide 19 - 18 May 2018
Q1 2018 Results - Indocement
Indocement’s Strategies under Current Tight Competition: Shut Down Old Kilns and Run the most efficient kilns
831 694
1,330
1,608
1,912
4,571
1,579 1,745
3,117 3,117
4,156
1975P1
1976P2
1979P3
1980P4 + P5
1983P6
1984P7 + P8
1991P9
1996P10
1999P11
2000P12
2016P14
Run P14 production (10,000 tpd) in full-swing in 2018 will help to reduce production cost up
to USD 7-8 per ton
640 534 2,400 2,400 3,200 1,024 1,238 1,472 3,520 1,216 1,344
In ‘000 ton; top: clinker capacity, bottom: cement mill capacity

INDOCEMENT
Slide 20 - 18 May 2018
Q1 2018 Results - Indocement
Agenda
Indocement Fact Sheet & Indocement Today
Current Domestic Market Condition
Financial Update Q1 2018
Investment Strategy
Outlook 2018

INDOCEMENT
Slide 21 - 18 May 2018
Q1 2018 Results - Indocement
Consolidated Statement of Comprehensive Income
492
264
63
240
71 22
7
35
1
70
0
100
200
300
400
500
600
NI 2017 Revenues Costs.Rev. Del.Sel. Gen.Adm. Other Inc. Fin.Results Equities Tax NI 2018
Bio
ID
R
1
1
2
2
• EBITDA margin reduction from
23.0% to 16.3% contributed by
a. lower pricing that offset by
volume recovery
b. higher cost of production
amidst soaring coal prices,
c. higher delivery expenses
related to Tarjun plant
overhaul prompting delivery
to Eastern Indonesia from
Citeureup
d. Active end user program
scheduled from February to
July 2018 to support volume
growth Market Recovery amid tight price
Energy
Pressure Delivery
and
Promotion Lower Rate
Lower
Income Bef.
Tax

INDOCEMENT
Slide 22 - 18 May 2018
Q1 2018 Results - Indocement
Balance Sheet
• Cash and cash equivalents at IDR 8.0 trn.
• Trade receivables balance increased due to higher revenues.
• Capital expenditures for Q1 2018 was IDR 106.8 bio.
• Dividend Payment history:

INDOCEMENT
Slide 23 - 18 May 2018
Q1 2018 Results - Indocement
34.8% 34.2% 33.0% 33.1%
33.9% 29.6% 29.6% 27.9%
23.0% 21.0% 22.2%
19.1% 16.3%
0.0%
5.0%
10.0%
15.0%
20.0%
25.0%
30.0%
35.0%
40.0%
Q1 Q2 Q3 Q4
2015 2016 2017 2018
44.5% 45.4% 43.8% 43.9%
43.2% 40.3% 41.4% 40.0%
34.5% 34.0% 34.9% 35.3%
28.7%
0.0%
10.0%
20.0%
30.0%
40.0%
50.0%
Q1 Q2 Q3 Q4
2015 2016 2017 2018
Continuing competitive environment, Management focus in taking respective initiatives early on during the year:
Operational Excellence program
Fixed cost reduction program
Managing efficient kiln utilization
INTP EBITDA margin development
New market entrants leading to higher competition and pricing pressure
combined with higher fuel cost continued to depress margin
INTP Gross margin development
Continue in Cost Leadership to Maintain a Decent Margin

INDOCEMENT
Slide 24 - 18 May 2018
Q1 2018 Results - Indocement
Agenda
Indocement Fact Sheet & Indocement Today
Current Domestic Market Condition
Financial Update Q1 2018
Investment Strategy
Outlook 2018

INDOCEMENT
Slide 25 - 18 May 2018
Q1 2018 Results - Indocement
(New) Palembang Terminal: Commissioning in March 2018
• Located in Palembang, South
Sumatera
• Coverage area : Palembang &
South Sumatera
• 2 Silos Cement @ 5.000 ton
• 1 packers 120 ton/hour
• 1 Line of bulk loading system
• 1 Warehouse: 1,458 M2
• Truck scale cap. 80 ton
• Area 3.2 Ha
• 1 Jetty Port
Palembang Terminal
(March 2018)

INDOCEMENT
Slide 26 - 18 May 2018
Q1 2018 Results - Indocement
(New) Terminal Lampung: Under Construction
• Located in Katibung, South Lampung
• Coverage area : Lampung
• 3 steel silos cement @ 4,000 ton (total
cap. 12,000 ton)
• 1 Packers 180 ton/hour
• 1 Line of bulk loading system
• 1 Truck scale cap. 100 ton
• 1 Warehouse 1,000 M2
• Area 4.2 Ha
• 1 Jetty Port
• Operating Target Q3 - 2018
Lampung Terminal
(under construction)

INDOCEMENT
Slide 27 - 18 May 2018
Q1 2018 Results - Indocement
Agenda
Indocement at Glance
Current Domestic Market Condition
Financial Update 2017
Investment Strategy
Outlook 2018
INDOCEMENT
Slide 28 - 18 May 2018
Q1 2018 Results - Indocement
Outlook of Indonesian Cement Market
National cement consumption growth started to turn positive and grew by 7.6% in 2017
(versus negative growth of -0.6% in 2016) and expected to grow by 6-7% in 2018
Consumption in 2018 will still be driven by infrastructure projects and some of commercial and
residential projects that have been launched in 2017. However, US policies to increase interest
rate and reduce corporate tax will somewhat affect Indonesia, i.e.: weakening exchange rate of
IDR/USD and possible IDR interest rate increase. In turn, such macroeconomic condition will
weaken demand in 2018
Strong concrete and bulk cement demand anticipated in Sumatera, Greater Jakarta, Central, and
East Java in 2018 due to Government’s infrastructure projects and the multiplier effect
projects.
Coal price to approx. $100 as the price has now dropped a little.
Over supply will continue in next few years -- We still expect the continuing tight competition
among 19 brands from 15 players (from 9 brands and 9 players previously) especially in Jakarta
and West Java due to more players located in these areas will hinder the price to increase.

INDOCEMENT
Slide 29 - 18 May 2018
Q1 2018 Results - Indocement
Action Plan
Run P14 production (10,000 tpd) in full-swing in 2018 will help to reduce production cost up to USD 7-8
per ton. Optimize product mix from 13 line of cement production will bring competitive advantages of
Indocement to introduce different types of cement (OPC, PCC, PPC, TR Rapid, PCC Industry and
future products- slag cement). Possible ASP increase in second half of 2018 in certain growth area.
Indocement expansion in cement terminals in Sumatera and batching plants will be ready in 2018.
Clinker exports and domestic clinker sales will be done more during oversupply to abroad countries.
Strengthen our Pull demand in bagged cement segment for end-user customers through strong
Retail/ Distribution channel, will continue to enhance our brand image, TIGA RODA
Using RAJAWALI brand as fighting brand to get some volume from customers, who perceive
cement as “commodity” product and in low-price cement segment - in competition with
2nd tier brands out of new players; currently offered in Jakarta, Banten, West Java (excl. Bandung),
Central Java (4 cities), Bali, and Pontianak
Develop new business line of prefabricated affordable housing products “Rumah Pabrikasi
Indocement” through new subsidiary.
Keep expanding in RMC and aggregates as well as limestone sand business to enable Indocement
offering bundling package

INDOCEMENT
Slide 30 - 18 May 2018
Q1 2018 Results - Indocement
Indocement’s Strategies under Current Tight Competition: Super Slag Cement – The most environmentally friendly product
Durable and Ecofriendly Product
• Slag cement is a product of
Consistent Quality
Conservation of Natural
Resources and Lower Green
House Emission
Long-term Compressive
Strength Development due to
continued hydration
Low Heat Slag Cement :
Suitable for Mass Concrete
Applications
No Thermal Cracks
General Purpose Slag Cement :
Suitable for Marine
Applications
Long-Term Durability:
Resistance to Water
Penetration
Resistance to Sea Salt Attack
on rebar steel
Resistance to Sulfate Attack
on concrete
S.No. Embodied CO2 Emission for
Raw Material CO2
Emission
(kg/Tonne)
% Reduction
Compared to
OPC Type I
1 OPC Type 1 768.55 ---
2 15% Fly Ash + 85% OPC 703.04 8.52
3 Slag Cement: Low Heat 339.80 55.78
4 Slag Cement: General Purpose 351.18 54.31
Mix Type Cradle to Gate
CO2 Emission
kg / m3
% Savings in CO2
Emission
FC 30 Concrete having 100% OPC Type I 450.19 ---
FC 30 concrete having 15% Fly Ash + 85%
OPC Type I
436.98 2.93
FC 30 concrete having Slag Cement: Low
Heat
288.12 36
FC 30 concrete having Slag Cement:
General Purpose
292.43 35
Table 2: A comparison of Cradle to Gate Carbon Footprint for mixes
Table. 1: A comparison of Carbon Footprint of cementitious materials

INDOCEMENT
Slide 31 - 18 May 2018
Q1 2018 Results - Indocement
Indocement’s Strategies under Current Tight Competition: End-User Program to Boost Customer Loyalty in Weak Demand Period
Want to win a lot? Buy “Tiga Roda” because the "Tiga Roda Menang Banyak" Promo has been launched
since Monday (19/02/2018) and will end on July 31, 2018.
In accordance with its tagline, "Tiga Roda Menang Banyak“ Promo distributed tens of thousands of
prizes to cement buyers Tiga Roda 40 & 50 Kg with special marks on their zak.

INDOCEMENT
THANK YOU
43 Years Building Indonesia KOKOH

INDOCEMENT
Slide 33 - 18 May 2018
Q1 2018 Results - Indocement
Important Notice
Disclaimer
This presentation contains general information which provided without any representations or warranties, express or implied and does not constitute or form
part of, and is not made in connection with, any offer for sale or subscription of or solicitation, recommendation, or invitation of any offer to buy or subscribe
for any securities nor shall it or any part of it form the basis of or be relied on in connection with any contract, commitment, or investment decision
whatsoever.
Terms of Use
Slides prepared in this presentation are strictly confidential and have been prepared as a support for verbal discussions only. The information contained in
this presentation is being presented to you solely for your information and may not be reproduced or redistributed to any other person, in whole or in part. You
acknowledge that, because of the limited nature of communication through our presentation features, any assistance you may receive using any such
features is likely to be incomplete and may even be misleading.
Forward-Looking Statements
This presentation includes forward-looking statements, which are based on the expectation or forecast about future events, formed by Indocement after
reviewing existing data and research. Such statements involve known and unknown risks including factors such as: (i)Global macroeconomic and geopolitical
situations; (ii) Indonesia macroeconomic and geopolitical situation; (iii) Competition from incumbents and new players; (iii) Changes in laws, regulation,
taxation, or accounting standards or practices; (iv) Acquisitions, divestitures, and various business opportunities that we may pursue; (v)Force majeure;
(vi)Labor unrest or other similar situations; (vii)Outcome of pending or threatened litigation
Indocement does not give assurance that such outcome will be attained. If you have any specific questions about any legal, financial or tax matter, you
should consult your lawyer/financial/tax Consultant or other professional legal services provider.
For further information please contact
PT Indocement Tunggal Prakarsa Tbk.
Wisma Indocemen, 8th Floor
Jl. Jend. Sudirman Kav 70 - 71
Jakarta 12910, Indonesia
Phone : +62 21 2512121
e-mail: [email protected].
©2018, PT Indocement Tunggal Prakarsa Tbk. All rights reserved.