PT Delta Dunia Makmur Tbk. 9M 2016 Results · o A life of mine contract with PT Tadjahan Antang...
24
PT Delta Dunia Makmur Tbk. 9M 2016 Results November 2016
Transcript of PT Delta Dunia Makmur Tbk. 9M 2016 Results · o A life of mine contract with PT Tadjahan Antang...

PT Delta Dunia Makmur Tbk.
9M 2016 Results
November 2016

The Company
General overview
3
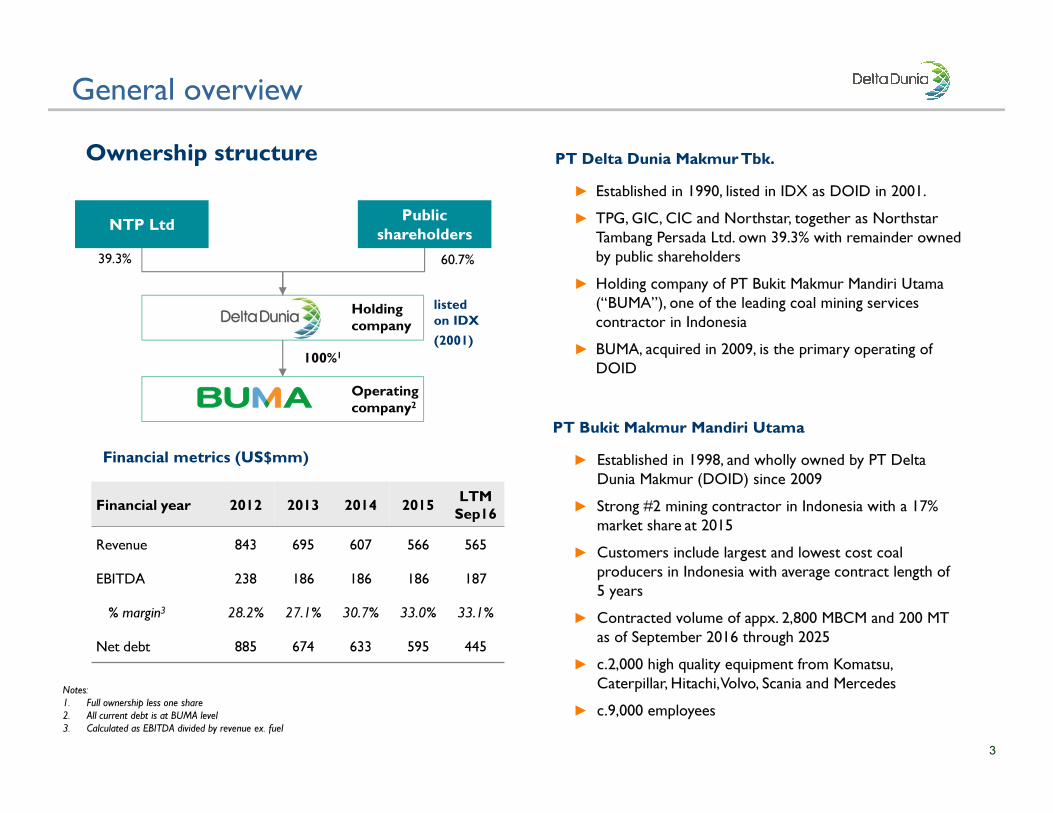
Ownership structureOwnership structure
listed
on IDX
(2001)
100%1
NTP Ltd
60.7%
Public
shareholders
Holding
company
Operating
company2
39.3%
PT Bukit Makmur Mandiri UtamaPT Bukit Makmur Mandiri Utama
► Established in 1998, and wholly owned by PT Delta
Dunia Makmur (DOID) since 2009
► Strong #2 mining contractor in Indonesia with a 17%
market share at 2015
► Customers include largest and lowest cost coal
producers in Indonesia with average contract length of
5 years
► Contracted volume of appx. 2,800 MBCM and 200 MT
as of September 2016 through 2025
► c.2,000 high quality equipment from Komatsu,
Caterpillar, Hitachi, Volvo, Scania and Mercedes
► c.9,000 employees
PT Delta Dunia Makmur Tbk.PT Delta Dunia Makmur Tbk.
► Established in 1990, listed in IDX as DOID in 2001.
► TPG, GIC, CIC and Northstar, together as Northstar
Tambang Persada Ltd. own 39.3% with remainder owned
by public shareholders
► Holding company of PT Bukit Makmur Mandiri Utama
(“BUMA”), one of the leading coal mining services
contractor in Indonesia
► BUMA, acquired in 2009, is the primary operating of
DOID
Financial metrics (US$mm) Financial metrics (US$mm)
Financial year 2012 2013 2014 2015LTM
Sep16
Revenue 843 695 607 566 565
EBITDA 238 186 186 186 187
% margin3 28.2% 27.1% 30.7% 33.0% 33.1%
Net debt 885 674 633 595 445
Notes:
1. Full ownership less one share
2. All current debt is at BUMA level
3. Calculated as EBITDA divided by revenue ex. fuel

Scope of business
4
4
► The contract miner is an indispensable part of the coal mining value chain, with their efficiency
and consistency the key to mine profitability
BUMA work scope covers the full mining production spectrumBUMA work scope covers the full mining production spectrum
Mine owner
Provide overburden
removal, coal mining and
coal transportation services
Planning and scheduling of
mining operations within
parameters set by the mine
owners
Coal mining contract
miners play a critical role in
the Indonesian coal
industry, producing ~90% of
coal output
Business overviewBusiness overviewB
UM
A S
co
pe o
fW
ork

Historical overview
5
► Company has taken a series of steps to transform into a professionally managed organization
1998 – 2009
Family run organization
2009 – 2012
Strong coal market;
Capex driven growth
funded by debt
2012 – 2016
Soft Coal market : Extend
contracts, operational
excellence & cost discipline,
and strategic partnership
� DOID, focused on
textile business, listed
on the Indonesia
Stock Exchange
� NTP (Northstar) acquired 40%
of DOID, DOID
acquired100% of BUMA (less
one share)
� BUMA issued US$315mm
bond due 2014 and
US$285mm loan due 2013
� Consortium consisting of
TPG, GIC, and CIC acquired
interest in NTP
� Increased syndicated loan
from US$285mm to
US$600mm and redeemed
US$315mm bond
� DOID completed a
~US$142mm Rights Issue
� BUMA completed syndicated
loan issuance of US$800mm to
refinance US$600mm existing
facility
� Appointment of
current management
� Amended and
extended bank
loan for remaining
US$603mm
� Since Dec 2013, BUMA
repaid more than US$200mm
of its’ loan
� Contracted volume
of appx.2,800 mbcm
and 200 mt through
2025
� 17% reduction in unit
cash cost since 2013
201520122011201020092001 2014 Present1998
� Establishment
of BUMA as a
family owned
private
enterprise

Existing Contracts
No Customers Period
1 Adaro (Paringin) 2009-2019
2 Kideco 2004-2019
3 Berau Coal (Lati) 2012-20253)
4 Berau Coal – Hauling (Suaran) 2003-2018
5 Berau Coal (Binungan) 2003-2020
7 KPC (Bengalon) 2011-20161)
8 Darma Henwa (KPC) 2014-20172)
9 Sungai Danau Jaya ( SDJ) 2015- 20233)
10 Tadjahan Antang Mineral (TAM) 2015-20243)
Kalimantan
Kideco
Adaro
Berau - Lati
Berau -
Binungan
Berau -
Suaran
Balikpapan
KPC
Samarinda
Banjarmasin
Pontianak
6
262.1277.7 292.3
334.1 348.1
297.0275.7 272.5
201.5 213.2
2008 2009 2010 2011 2012 2013 2014 2015 9M15 9M16
+5.8%
OVERBURDEN REMOVAL VOLUME
(MBCM)
36.432.8 35.0 34.7 34.5
32.631.0
33.2
24.8 24.9
2008 2009 2010 2011 2012 2013 2014 2015 9M15 9M16
COAL PRODUCTION
(MT)
TAM
SDJ1) Production has ceased and both parties are working to conclude a mutual agreement for
termination
2) In August 2016, the agreement was mutually terminated
3) Life of mine contract
+0.3%

Latest Performance Highlights

8
9M 2016 Key Consolidated Results
Notes:
1) Includes restricted cash in bank.
2) Debt includes only the outstanding contractual liabilities.
3) Restated due to retroactive implementation of PSAK 24 (Employee Benefits), effective January 2015.
4) Margins are based on net revenues excluding fuel.
5) Capital expenditures as recognized per accounting standards.
HIGHLIGHTS OF CONSOLIDATED RESULTS
(in US$ mn unless otherwise stated)
Volume 9M16 9M15 YoY
OB Removal (mbcm) 213.2 201.5 6%
Coal (mt) 24.9 24.8 0%
Profitability 9M16 9M15 3) YoY
Revenues 418 419 0%
EBITDA 140 139 0%
EBITDA Margin 4) 34.8% 33.9% -
Operating Profit 69 64 7%
Operating Margin 4) 17.2% 15.7% -
Net Profit (Loss) 25 (4) 774%
EPS (in Rp) Rp 41 Rp (6) n.m
Cash Flows 9M16 9M15 YoY
Capital Expenditure 5) 34 31 8%
Free Cash Flow 151 110 38%
Balance Sheet Sep-16 Dec-15 YTD
Cash Position 1) 151 99 52
Net Debt 2) 445 568 (123)
HIGHLIGHTS OF QUARTERLY RESULTS
(in US$ mn unless otherwise stated)
Volume 1Q15 2Q15 3Q15 4Q15 1Q16 2Q16 3Q16
OB Removal (mbcm) 59.0 70.1 72.3 71.1 62.4 71.4 79.4
Coal (mt) 8.1 7.9 8.9 8.3 8.0 7.7 9.2
Financials 1Q15 2Q15 3Q15 4Q15 1Q16 2Q16 3Q16
Revenues 122 145 152 147 127 132 159
EBITDA 33 49 58 46 39 43 58
EBITDA Margin 4) 27.5% 34.4% 38.4% 33.7% 31.6% 33.4% 38.5%
Operating Profit 8 24 33 23 15 19 35
Operating Margin 4) 6.4% 16.8% 21.9% 16.5% 11.9% 14.9% 23.3%
Net Profit (Loss) (10) 0 5 (3) 3 5 17
Cost efficiency, FCF generation and deleveragingCost efficiency, FCF generation and deleveraging

9
Consolidated Statements of Cash Flows
Delta Consolidated – Key Financial Highlights
Consolidated Financial Ratios 3)
Consolidated Statements of Financial Position Consolidated Statements of Profit or Loss and Other
Comprehensive Income
1. Reported EPS translated into Rp using average exchange rate Rp13,328 and Rp13,263 for 9M16 and 9M15, respectively.
2. Excluding restricted cash in bank.
3. Margins are based on net revenues excluding fuel.
4. Restated due to retroactive implementation of PSAK 24 (Employee Benefits, effective January 2015.
5. Reclassification to the presentation for comparative purposes
In US$ mn (unless otherwise stated) 9M16 9M154) YoY
Net revenues 418 419 0%
Revenue excl. fuel 401 411 -2%
Cost of revenues 319 325 -2%
Gross profit 99 94 6%
Operating expenses (30) (29) 3%
Finance cost (34) (35) -1%
Others - net 4 (30) n.m.
Pretax profit (loss) 39 (0) n.m.
Tax expense (benefit) 13 3 303%
Profit (loss) for the period 25 (4) 774%
Other comprehensive income - net 2 5 -66%
Comprehensive income (loss) 27 1 n.m.
EBITDA 140 139 0%
EPS (in Rp)1)
Rp 41 Rp (6) 774%
In US$ mn (unless otherwise stated) Sep-16 Dec-15 YTD
Cash and cash equivalents 134 71 90%
Trade receivables - current 128 138 -7%
Other current assets 86 100 -13%
Trade receivables - non-current - 1 n.m.
Restricted cash in bank 17 28 -49%
Fixed assets - net 339 379 -11%
Other non-current assets 135 116 17%
TOTAL ASSETS 839 832 1%
Trade payables 58 26 120%
LT liabilities – current 64 47 35%
Derivative liabilities-current - 2 n.m.
Other current liabilities 33 26 24%
LT liabilities - non current 536 614 -13%
Other non-current liabilities 34 30 14%
TOTAL LIABILITIES 725 747 -3%
TOTAL EQUITY 115 85 35%
9M16 9M15
Gross margin 24.7% 22.8%
Operating margin 17.2% 15.7%
EBITDA margin 34.8% 33.9%
Pretax margin 9.7% -0.1%
Net margin 6.3% -0.9%
In US$ mn (unless otherwise stated) 9M16 9M15
Net CF from Operating Activities 5) 152 108
Net CF from Investing Activities (5) (9)
Net CF from Financing Activities (84) (52)
Net change in cash & cash equivalents 62 47
Beginning balance cash & cash equivalents 71 75
Effect of foreign exchange rate changes 5) 1 (4)
Ending balance cash & cash equivalents 2) 134 118

10
9M 2016 Other UpdatesN
ine-m
on
th U
pd
ate
New Contracts► BUMA signed several contracts in November 2016 with an aggregate value of over Rp42 trillion (~US$3.3 billion), which will contribute
positively to the Company’s future growth:
o A life of mine contract with PT Tadjahan Antang Mineral (“TAM”) with a contract value of approximately IDR 3.8 trillion
(~US$288 million). This contract is an extension of a previous contract signed in August 2015. The mining services contract has a total
production target of approximately 147 million bcm of overburden and 28 million tons of coal. The project is located in Gunung Mas
District, Central Kalimantan.
o Two contract amendments for Lati and Binungan projects with PT Berau Coal at an aggregate contract value of approximately Rp39
trillion (~US$ 3 billion). These contracts were initially signed in 2014. A breakdown of the production targets and contract period of
both contracts are set out below:
o An Infrastructure Contract with PT UPC Sidrap Bayu Energy. The contract value is approximately Rp57 billion (~US$4 million).
This is the first Power Plant Infrastructure project for BUMA with most of the work related to infrastructure within earthmoving
operations.
Debt Repayments► As of September 30, 2015, BUMA made a total voluntary prepayment of US$40 million toward its US$603 million Syndicated Loan Facility and
US$25 million PT CIMB Niaga Tbk. Credit Facility. Throughout 2016, including the scheduled amortization and finance leases, BUMA has
reduced its debt level by US$70 million.
► Since the beginning of 2014, BUMA reduced its outstanding debt by US$293 million, bringing the total outstanding debt down to US$596
million as of September 30, 2016 from US$889 million as of December 31, 2013.
Potential bond issuance► BUMA is currently exploring to issue a high-yield global bond with a maximum size of US$500 million. The Company intend to use the
proceed from the bond issuance to repay in pro-rata its two bank facilities. The bond issuance will not increase the total debt of the Company.
► Company has secured Shareholders’ approval on its EGMS held November 15, 2016.
Location OB Volume Coal Volume Contract Period
LATI 1,360 MBCM 112 MT Life of Mine (2025)
BINUNGAN 300 MBCM 33 MT 2020
TOTAL 1,660 MBCM 145 MT

BUMA – The Strategy

Strategy during market downturn
FOCUS ON OPERATIONS FOCUS ON FCF AND CAPITAL STRUCTURE
People &
Communication
Customer
Relationship
Management
Operational
Improvements &
Cost Efficiency
Cash Flow &
Capex
EBITDA CapexWorking
Capital
Capital Structure Improvement
Debt Repayments
Free Cash Flow Generation1
2
3
4
5
12
Hard work and discipline for survival and turnaround during downturnHard work and discipline for survival and turnaround during downturn

Survival and turnaround
13
Newcastle coal price (US$)Newcastle coal price (US$) Historical volumeHistorical volume
Revenue ex fuel (US$/unit) Revenue ex fuel (US$/unit) Cash cost ex fuel (US$/unit)Cash cost ex fuel (US$/unit)
81.8 80.3
64.7
53.5 51.6 51.8
63.9
110.5
Dec-12 Dec-13 Dec-14 Dec-15 Mar-16 Jun-16 Sep-16 10-Nov-1634.5 32.6 31.0 33.2 33.3
348.1 297.0 275.7 272.5 284.2
10.1x9.1x 8.9x 8.2x 8.5x
2012 2013 2014 2015 LTM Sep16Coal production volume (MT) OB removal volume (MBCM) Strip ratio
1.92 1.89 1.89
1.79 1.71
2012 2013 2014 2015 LTM Sep 16
1.19 1.20 1.16
1.07
1.00
2012 2013 2014 2015 LTM Sep 16
Resilience during coal market downturnResilience during coal market downturn
Stable production volumeStable production volume Operational excellenceOperational excellence Significant cost reductionSignificant cost reduction
Sharp increase only since Jun-
16, after prolonged slump
-11%+1%
-13% -8%
-6%-2%

Survival and turnaround
14
885
674 633 595
445
2012 2013 2014 2015 As on Sep16
Net debt (US$mm)
Liquidity management – EBITDA improvement and strict capex monitoringLiquidity management – EBITDA improvement and strict capex monitoring
2
264
98120
155
2012 2013 2014 2015 LTM Sep16
FCF (US$mm)
50% reduction
238
188 186 187 187
28.2% 27.1% 30.7% 33.0% 33.1%
-50.0%
-30.0%
-10.0%
10.0%
30.0%
50.0%
150
170
190
210
230
250
270
290
2012 2013 2014 2015 LTM Sep 16
EBITDA (US$mm) and EBITDA margin (%)
230
2346 55 58
2012 2013 2014 2015 LTM Sep16
Capex (US$mm)
Generating FCF and deleverageGenerating FCF and deleverage
Significant deleveraging during the coal market downturnSignificant deleveraging during the coal market downturn
Stable EBITDA marginsStable EBITDA margins Liquidity managementLiquidity management Positive FCF generationPositive FCF generation

Indonesian coal market
15
Coal will continue to dominate Indonesia’s fuel mix demandCoal will continue to dominate Indonesia’s fuel mix demand
Coal continues to be the preferred fuel for power generation in
Indonesia
Coal continues to be the preferred fuel for power generation in
Indonesia
Indonesia has proximity to key export marketsIndonesia has proximity to key export markets
India
China
VietnamThailand
Philippines
Taiwan
South
Korea Japan
Malaysia
Indonesia
Hong Kong
Indonesia is one of the lowest relative cost producing markets
globally (US$/MT)
Indonesia is one of the lowest relative cost producing markets
globally (US$/MT)
0
20
40
60
80
100
0 75 150 225 300 375 450 525 600 675 750
Total thermal coal production for 2016E (MT)
Average cost of coal production (US$/MT)
IndonesiaColombiaSouth
Africa Australia USA
Domestic Foreign
52%
56%
60%
64%
68%
72%
0
100
200
300
400
500
2014 2015 2016 2017 2018 2019 2020 2021 2022 2023 2024 2025
Coal Gas Hydro Fuel OilDiesel Geothermal wind SolarRenewables Imports Coal % (RHS)
Forecast
Gri
d g
en
era
tio
n (
TW
h)
Co
al %
US$/M
Wh
Marginal cost by technology (2020)
0
100
200
300
400
500
Piped G
as
LNG
Coal
Hydro
Fuel Oil
(ST)
Diesel
(OCGT)
Nuclear
(PW
R)
Geotherm
al
Wind
(Onshore)
Solar
(PV)
� Strong foreign market demand due to proximity to key markets and the low cost
� Strong domestic market demand due to policy initiatives, electrification agenda

Strong management team
16
35
678
629
692 Junior high
High school
College
Delta Dunia senior managementDelta Dunia senior management
BUMA senior managementBUMA senior management
Ronald Sutardja, President Director
� 16 years of professional experience
� Year joined: 2012
Experienced BUMA operational teamExperienced BUMA operational team
� 52 people
� 17 years average industry
experience
� 8 years average tenure with
BUMA
Manager overview
� 15 people
� 18 years average industry
experience
� 7 years average tenure with
BUMA
General manager
overview
Hagianto Kumala, President Director
� 30+ years of experience
� Year joined: 2009
Years of service
Leadership positions: 2,034 employees
20483921
456 155
<3 yrs
3 - 10 yrs
11 - 15 yrs
>16 yrs
Skilled workers: 6,580 employees
Employees education
Rani Sofjan, Director
� 22+ years of experience
� Year joined: 2009
Eddy Porwanto, Finance Director
� 23+ years of experience
� Year joined: 2014
Errinto Pardede, Director
� 22+ years of experience
� Year joined: 2013
Una Lindasari, Finance Director
� 30+ years of experience
� Year joined: 2014
Jason Thompson, Business Development Director
� 24+ years of experience
� Year joined: 2014
Indra Kanoena, Plant Director / HR &GA
� 19+ years of experience
� Year joined: 2013
Sorimuda Pulungan, Operations Director
� 22+ years of experience
� Year joined: 2012
Management’s vision and experienced BUMA operational team is key to the resilient performance of the Company

4%
Strong, interdependent customer base
17
55%
70%
10% 18%
100%
Years of
relationship18 years 14 years 12 years 1 year1 year
Contribution to
BUMA revenue
(%)
BUMA wallet
share (%)
BUMA is deeply entrenched with its customersBUMA is deeply entrenched with its customers
16%14% 10%
100%
Current contract
maturityMar 20252) Dec 2019 Dec 2019 Dec 20231) Dec 20241)
� Fixed price grid in key contracts
� Floor price with ability to share upside
with customersPrice
Price
Volume
Volume
Termination
Termination
Sound and transparent contractual termsSound and transparent contractual terms
� Contracted volume under long term or
Life of Mine (“LOM”) contracts
� BUMA agrees annual volume with
customers based on various factors such
as mine plan etc.
� Key contracts have minimum volume
guarantee with penalty if not met
� Only under non-performance by BUMA
and mutual agreement
Others
Others
� Key contracts have interest penalty on
delayed payment from mine owners
� Key contracts have penalty on stoppage
on production cause by mine owners
Long-term, strong customer relationshipLong-term, strong customer relationship
BUMA’s reliability and
operational excellence
BUMA’s reliability and
operational excellenceInterdependenceInterdependence Significant switching costsSignificant switching costs
1) Life of mine contracts
2) Life of mine contract on certain pit

Operational excellence
18
Availability1 (%)Availability1 (%)
86% 85% 87% 87%85% 86% 87% 87%
FY13 FY14 FY15 9M16
PA Loader % PA Hauler %
Productivity (BCM/Hour)Productivity (BCM/Hour)
696 750 775 787
131 131 134 142
FY13 FY14 FY15 9M16
Loader Hauler
LTIFR (Lost Time Injury Frequency Rate) &
Fatality Rate
LTIFR (Lost Time Injury Frequency Rate) &
Fatality Rate
0
3
2 2
0 0 0
0.38
0.29
0.46
0.180.21
0.05
0.10
2009 2010 2011 2012 2013 2014 2015
Fatality LTIFR
Utilization2,3 (%)Utilization2,3 (%)
61% 63% 63% 63%54% 56% 58% 58%
FY13 FY14 FY15 9M16
UA Loader % UA Hauler %
Improvement in productivity coupled with focus on safety has resulted in solid operational excellence
Notes:1 Availability refers to % of available time equipment was operating based on production schedule2 Utilization refers to % of physical available time equipment was operating3 Total utilization includes rain, halts due to slippery ground, prayer and meals

Sustainable low cost
19
Breakdown of BUMA’s cash cost (LTM Sep-16)Breakdown of BUMA’s cash cost (LTM Sep-16)
Spare parts &
maintenance
40%
Employee
compensation
23%
Overhead &
office
10%
Blasting &
drilling
9%
Tires
6%
Rental
4%
Others
8%
1
0.08 0.10 0.10 0.09
2013 2014 2015 LTM Sep-16
Per unit trend of major cost items (US$/unit)Per unit trend of major cost items (US$/unit)
0.47 0.46 0.45 0.39
2013 2014 2014 LTM Sep-16
Spare
parts &
main.
Spare
parts &
main.
0.27 0.23 0.22 0.23
2013 2014 2015 LTM Sep-16
Employee
comp.
Employee
comp.
TiresTires
► In-house equipment maintenance instead of third party
contracts
► Extend component life
► In-house equipment maintenance instead of third party
contracts
► Extend component life
Key cost reduction initiativesKey cost reduction initiatives
► Deliver efficient and consistent tire monitoring process► Deliver efficient and consistent tire monitoring process
► Optimize drilling & blasting process to reduce explosives
usage and deliver quality blasting
► Optimize drilling & blasting process to reduce explosives
usage and deliver quality blasting
Blasting
& drilling
Blasting
& drilling
0.09 0.08 0.07 0.06
2013 2014 2015 LTM Sep-16
► Right size employee headcounts
► Equipment optimization that leads to reduced employee
costs
► Right size employee headcounts
► Equipment optimization that leads to reduced employee
costs
Cash cost ex fuel (US$/unit)Cash cost ex fuel (US$/unit)
1.19 1.20
1.16
1.07
1.00
2012 2013 2014 2015 LTM Sep 16
BUMA’s initiatives has led to improved efficiency and lower costs

Strategic partnership
20
Medium
fleet2Medium
fleet2
Support
equipment3Support
equipment3
Large fleet1Large fleet1
Coal haulerCoal hauler
Strategic partnerStrategic partner StrategyStrategy
N/AN/A
� Fully deploy existing fleet to
match LATI Life of Mine
� Full utilization without
incremental capex
� Fully deploy existing fleet to
match LATI Life of Mine
� Full utilization without
incremental capex
� Continue to invest to service
contracts on hand
� Most flexible fleet easily
redeployed if required
� Sign strategic partners to
lock in long term benefits
� Continue to invest to service
contracts on hand
� Most flexible fleet easily
redeployed if required
� Sign strategic partners to
lock in long term benefits
Fleet typeFleet type
1 Large: Loader > 300 ton; Hauler > 150 ton; 2 Medium: Loader > 100 ton; Hauler > 60ton; 3 Support equipment = Excavator > 20 ton
No price escalation or rise & fall scheme linked with
certain coal index
No price escalation or rise & fall scheme linked with
certain coal index
Secured leasing facility for new equipmentSecured leasing facility for new equipment
Longer & robust warranty scheme and promise to
improve performance annually
Longer & robust warranty scheme and promise to
improve performance annually
Guaranteed second life at lower price Guaranteed second life at lower price
Provide more value add, such as training, improve
technology & equipment buyback schemes
Provide more value add, such as training, improve
technology & equipment buyback schemes
Guaranteed or cost cap for equipment lifecycle costGuaranteed or cost cap for equipment lifecycle cost
Partnership benefits with supply partnersPartnership benefits with supply partners
Investment strategy with supply partnersInvestment strategy with supply partners
� Lock in partnership in down cycle to gain maximum
benefits
� Ensure back-to-back investment and customer
contracts esp. volume
� No annual “must” spend and flexibility to delay
spending, if necessary
� Lock in partnership in down cycle to gain maximum
benefits
� Ensure back-to-back investment and customer
contracts esp. volume
� No annual “must” spend and flexibility to delay
spending, if necessary
Strategic and flexible capex support plan to support contracted production volumes

Recap
21
Significant achievementsSignificant achievements Future strategyFuture strategy
Contracted volume of appx. 2,800MBCM
and 200MT through 2025
Contracted volume of appx. 2,800MBCM
and 200MT through 2025
Achieved solid operational and cost
metrics and stable EBITDA
Achieved solid operational and cost
metrics and stable EBITDA
Consistently delivered FCF generation
through the down cycle
Consistently delivered FCF generation
through the down cycle
Demonstrated strong capex and working
capital management
Demonstrated strong capex and working
capital management
Reduced net debt by close to US$500mm
since 2012
Reduced net debt by close to US$500mm
since 2012
��
��
��
��
��
Continue delivering operational excellence
in execution of existing secured contracts
Continue delivering operational excellence
in execution of existing secured contracts
Continue delivering stable profitability and
free cash flow generation
Continue delivering stable profitability and
free cash flow generation
Continue to maintain stable capital
structure and strong liquidity
Continue to maintain stable capital
structure and strong liquidity
Further improve cost competitiveness
with technology and strategic partnership
Further improve cost competitiveness
with technology and strategic partnership
Capture new contracts only when internal
rigorous thresholds are met
Capture new contracts only when internal
rigorous thresholds are met
��
��
��
��
��

Key takeaways
During the
downturn
What to
expect
� Coal market was on a prolonged downturn in the past few years, all the way up until first
half of 2016
� Managed to record stable EBITDA margin through various initiatives that improved
operational excellence and cost efficiency
� Disciplined capex and liquidity management led to positive FCF generation which was used
to significantly deleverage
� Secured long-term contracts with customers, as well as with partnership with major
suppliers to support the expected volume
� Coal price has significantly improved in the past few months
� Expects to benefit of higher rate from the coal index linked price-grid
� Expects volume increase in the coming years from the recent long-term contracts signed,
and potentially from the other customers due to improved coal price
� Expects to benefit from supplier partnership at favorable terms and price, designed to
provide back-to-back support to the contracted volume
22

End of Presentation - Thank You

24
Disclaimer
These presentation materials have been prepared by PT Delta Dunia Makmur Tbk (“Delta”) (the “Company”), solely for the use at this presentation and have not been independently
verified. Information relating to PT Bukit Makmur Mandiri Utama (“BUMA”) has been included with its content, and has not been independently verified.
This presentation is being communicated only to persons who have professional experience in matters relating to investments and to persons to whom it may be lawful to communicate
it to (all such persons being referred to as relevant persons). This presentation is only directed at relevant persons and any investment or investment activity to which the presentation
relates is only available to relevant persons or will be engaged in only with relevant persons. Solicitations resulting from this presentation will only be responded to if the person
concerned is a relevant person. Other persons should not rely or act upon this presentation or any of its contents.
You agree to keep the contents of this presentation strictly confidential. This presentation material is highly confidential, is being presented solely for your information and may not be
copied, reproduced or redistributed to any other person in any manner. In particular, this presentation may not be taken or transmitted into Canada or Japan or distributed, directly or
indirectly, in the Canada or Japan. Further, this presentation should not be distributed to U.S. persons except to (1) qualified institutional buyers in reliance on the exemption from the
registration requirements of the Securities Act provided by Rule 144A and (2) to non-U.S. persons outside the United States in an “offshore transaction” as defined in Regulation S of the
U.S. Securities Act of 1933, as amended.
No representations or warranties, express or implied, are made as to, and no reliance should be placed on, the accuracy, fairness or completeness of the information presented or
contained in this presentation. Neither the Company nor any of its affiliates, advisers or representatives accepts any responsibility whatsoever for any loss or damage arising from any
information presented or contained in this presentation. The information presented or contained in this presentation is current as of the date hereof and is subject to change without
notice and its accuracy is not guaranteed. Neither the Company nor any of its affiliates, advisers or representatives make any undertaking to update any such information subsequent to
the date hereof. This presentation should not be construed as legal, tax, investment or other advice.
In addition, certain information and statements made in this presentation contain “forward-looking statements.” Such forward-looking statements can be identified by the use of forward-
looking terminology such as “anticipate,” “believe,” “considering,” “depends,” “estimate,” “expect,” “intend,” “plan,” “planning,” “planned,” “project,” “trend,” and similar expressions.
All forward-looking statements are the Company's current expectation of future events and are subject to a number of factors that could cause actual results to differ materially from
those described in the forward-looking statements. Caution should be taken with respect to such statements and you should not place undue reliance on any such forward-looking
statements.
Certain data in this presentation was obtained from various external data sources, and the Company has not verified such data with independent sources. Accordingly, the Company
makes no representations as to the accuracy or completeness of that data, and such data involves risks and uncertainties and is subject to change based on various factors.
This presentation does not constitute an offer or invitation to purchase or subscribe for any shares or other securities of the Company or BUMA and neither any part of this
presentation nor any information or statement contained therein shall form the basis of or be relied upon in connection with any contract or commitment whatsoever. Any decision to
purchase securities in any offering of securities of the Company or BUMA should be made solely on the basis of the information contained in the offering document which may be
published or distributed in due course in connection with any offering of securities of the Company or BUMA, if any.
By participating in this presentation, you agree to be bound by the foregoing limitations.