PT Delta Dunia MakmurTbk. · 2018-08-08 · 2 Ownership structure listed on IDX ... Operating...
22
PT Delta Dunia Makmur Tbk. Full Year 2017 Results March 2018
Transcript of PT Delta Dunia MakmurTbk. · 2018-08-08 · 2 Ownership structure listed on IDX ... Operating...

PT Delta Dunia MakmurTbk.
Full Year 2017 Results
March 2018

General overview
2
Ownership structureOwnership structure
listed on
IDX
(2001)
100%1
NTP Ltd
61.8%
Public
shareholders
Holding
company
Operating
company2
38.4%
PT Bukit Makmur Mandiri UtamaPT Bukit Makmur Mandiri Utama
► Established in 1998, and wholly owned by PT Delta Dunia
Makmur (DOID) since 2009
► Strong #2 mining contractor in Indonesia with c.20% market
share
► Customers include largest and lowest cost coal producers in
Indonesia and new players with high potential for future
growth
► Secured long-term, life of mine contracted volume, with total
order book of around US$5.5 billion
► c.2,500 high quality equipment from Komatsu, Caterpillar,
Hitachi, Volvo, Scania and Mercedes
► c.11,500 employees
PT Delta Dunia Makmur Tbk.PT Delta Dunia Makmur Tbk.
► Established in 1990, listed in IDX as DOID in 2001.
► TPG, GIC, CIC and Northstar, together as NorthstarTambang
Persada Ltd. own 38.2% with remainder owned by public
shareholders
► Holding company of PT Bukit Makmur Mandiri Utama
(“BUMA”), one of the leading coal mining services contractor in
Indonesia
► BUMA, acquired in 2009, is the primary operating of DOID
Financial metrics (US$M) Financial metrics (US$M)
Financial year 2012 2013 2014 2015 2016 2017
Revenue 843 695 607 566 611 765
Revenue ex. fuel 740 635 583 551 584 727
EBITDA 238 188 186 186 217 281
% margin3 32.1% 29.7% 32.0% 33.8% 37.1% 38.6%
Net debt 885 674 633 568 497 488
Notes:
1. Full ownership less one share
2. All current debt is at BUMA level
3. Calculated as EBITDA divided by revenue ex. fuel

3
Industry update
81.8 80.3
64.7
53.5 51.6 51.8
63.9
98.5
83.8 83.089.0
99.595.3
102.6
Annual progression Quarterly progression
Newcastle coal price (US$)Newcastle coal price (US$)
Prolonged downturn Recovery
Sustaining at high price
474
435
392
456 461477
2013 2014 2015 2016 2017 2018
Indonesia Coal Production (MT)Indonesia Coal Production (MT)
96.75
84.95
77.75
50.00
60.00
70.00
80.00
90.00
100.00
Mar-18 Jun-18 Sep-18 Dec-18 Mar-19 Jun-19 Sep-19 Dec-19
26-Mar-18 25-Oct-17
26-Jul-17 28-Apr-17
Source: www.barchart.com ICE Newcastle futures
Coal futuresCoal futures
89.30 95.45
105.65
106.50
100.15
92.75
50.00
70.00
90.00
110.00
130.00
2-Oct-17 2-Nov-17 2-Dec-17 2-Jan-18 2-Feb-18 2-Mar-18
Coal price trend in last six monthsCoal price trend in last six months
Market recovery
► Market confidence has improved over sustainability of
coal price in 2017 running over to 2018
► Having coal price remained
sustainably high over a lengthy period of time brought overall
volume growth in Indonesia particularly from increased
strip ratio
► China’s supply control will
continue to sustain global coal price
Source: Platts’ FOB Newcastle 6,300 GAR
DMO Price Cap
► DMO selling price intended for domestic power plant of
US$70 or HBA whichever is lower
► Compliance over DMO rules
puts miners eligible for 10% additional production volume
► DMO applies to only 20-25% of BUMA’s customers
production
► Price cap will not impact BUMA while global coal price
continue to sustain at current level

4
Key consolidated results
Notes:
1) Includes restricted cash in bank and current investments.
2) Debt includes only the outstanding contractual liabilities.
3) Free cash flow is cash flow before debt service, excluding financing proceeds.
4) Margins are based on net revenues excluding fuel.
5) Capital expenditures as recognized per accounting standards.
HIGHLIGHTS OF CONSOLIDATED RESULTS
(in US$ mn unless otherwise stated)
Volume FY17 FY16 YoY
OB Removal (mbcm) 340.2 299.8 13%
Coal (mt) 40.2 35.1 14%
Profitability FY17 FY16 YoY
Revenues 765 611 25%
EBITDA 281 217 30%
EBITDA Margin 4) 38.6% 37.1% 1.5%
Operating Profit 172 122 40%
Operating Margin 4) 23.6% 20.9% 2.7%
Net Profit 47 37 26%
Recurring profit 87 51 69%
EPS (in Rp) Rp 74 Rp 59 25%
Cash Flows FY17 FY16 YoY
Capital Expenditure 5) 186 126 48%
Operating Cash Flow 262 228 15%
Free Cash Flow 3) 77 107 -28%
Balance Sheet Dec-17 Dec-16 ∆
Cash Position 1) 94 96 (2)
Net Debt 2) 488 497 ( 9)
HIGHLIGHTS OF QUARTERLY RESULTS
(in US$ mn unless otherwise stated)
Volume Q1 16 Q2 16 Q3 16 Q4 16 Q1 17 Q2 17 Q3 17 Q4 17
OB Removal (mbcm) 61.2 71.9 81.8 84.9 83.2 83.1 91.3 82.6
Coal (mt) 7.8 7.7 9.3 10.3 10.2 9.9 10.5 9.6
Financials Q1 16 Q2 16 Q3 16 Q4 16 Q1 17 Q2 17 Q3 17 Q4 17
Revenues 127 132 159 193 181 180 198 206
EBITDA 39 43 58 77 70 61 76 74
EBITDA Margin 4) 31.6% 33.4% 38.5% 42.1% 40.3% 35.7% 40.2% 38.2%
Operating Profit 15 19 35 53 44 35 47 45
Operating Margin 4) 11.9% 14.9% 23.3% 29.1% 25.8% 20.4% 25.2% 23.0%
Net Profit (Loss) 3 5 17 12 24 (15) 23 15
Cash Q1 16 Q2 16 Q3 16 Q4 16 Q1 17 Q2 17 Q3 17 Q4 17
Operating cash flows 78 (32) 136 46 41 86 40 95
Free cash flows 76 (33) 108 (44) 21 15 15 26
Focused on operating performance and cash flow generationFocused on operating performance and cash flow generation

5
Extensive expansion
Volume expansion (MBCM) 1)Volume expansion (MBCM) 1)
109.5 142.8
185.4 204.3
2014 2015 2016 2017
Berau 2)
102.1 87.6 82.7 84.0
2014 2015 2016 2017
Adaro and Kideco
- -
25.2
46.0
2014 2015 2016 2017
New players 3)
Notes:1 Presented in terms of million bcm of overburden removal volume2 Includes Lati and Binungan pits3 Includes Geo Energy group, TAM, and Pada Idi
Resources expansionResources expansion
1,933 1,968 2,272
2,499
Dec-14 Dec-15 Dec-16 Dec-17
Number of Equipment
8,580 8,071 9,677
11,314
Dec-14 Dec-15 Dec-16 Dec-17
Number of Employees
+10%+2%
+82%
Expansion growth Stable volume Ramp-up growth
Significant expansion by
contracts
Limited availability of equipment
and skilled laborsTimely resource fulfillment and
ramp-up became challenging

Operational metrics
6
Availability1 (%)Availability1 (%)
86% 85% 87% 90% 91%85% 86% 87% 89% 89%
2013 2014 2015 2016 2017
PA Loader % PA Hauler %
Productivity (BCM/Hour)Productivity (BCM/Hour)
696 750 775 789 777
131 131 134 139 119
2013 2014 2015 2016 2017
Loader Hauler
Utilization2,3 (%)Utilization2,3 (%)
61% 63% 63% 66%
56%54% 56% 58%64%
58%
2013 2014 2015 2016 2017
UA Loader % UA Hauler %
BUMA focuses on resources optimization and solid operational excellence to deliver profitable growth
Notes:1 Availability refers to % of available time equipment was operating based on production schedule2 Utilization refers to % of physical available time equipment was operating3 Total utilization includes rain, halts due to slippery ground, prayer and meals
Operational measurements
� Delayed productivity improvement
� Lower utilization rate
Prolonged weather challengesProlonged weather challenges
Extensive ramp-up challengesExtensive ramp-up challenges

1.19 1.20 1.16
1.07
0.99
1.05
2012 2013 2014 2015 2016 2017
Cash costs
7
BUMA’s cash cost ex fuel (FY 2017)BUMA’s cash cost ex fuel (FY 2017)
Spare parts &
maintenance
40%
Employee
compensation
24%
Overhead &
office
11%
Drilling &
blasting
8%
Tires
5%
Lubricants
3%
Rental
4%
Others
5%
Cash cost ex fuel (US$/unit)Cash cost ex fuel (US$/unit)
1. High rain hours
2. Upfront costs from ramp-up process
3. Customer-originated distance adjustments
► In-house maintenance instead of outsourced to suppliers
► Extended component life through condition-based monitoring
► In-house maintenance instead of outsourced to suppliers
► Extended component life through condition-based monitoring
Key cost reduction initiativesKey cost reduction initiatives
► Deliver efficient and consistent tire monitoring process► Deliver efficient and consistent tire monitoring process
► Optimize drilling & blasting process to reduce explosives usage
and deliver quality blasting
► Optimize drilling & blasting process to reduce explosives usage
and deliver quality blasting
► Right size employee headcounts
► Equipment optimization that leads to reduced employee costs
► Right size employee headcounts
► Equipment optimization that leads to reduced employee costs
+6%
-18%+1%
Spareparts &
maintenance
Spareparts &
maintenance
Employee
compensation
Employee
compensation
Drilling & blastingDrilling & blasting
TiresTires
Technology
implementation
Technology
implementation
Procedures
streamlining
Procedures
streamlining
Increased productivityIncreased productivity Improved efficiencyImproved efficiency
Using less resources for higher volumeUsing less resources for higher volume
Sustainable cost efficiencySustainable cost efficiency
Resource
optimization
Resource
optimization

Liquidity and capital structure
8
885
674 633568
497 488
Dec-12 Dec-13 Dec-14 Dec-15 Dec-16 Dec-17
Consolidated net debt (US$M)
1.7x2.3x3.0x3.4x3.6x3.7x
Liquidity management – EBITDA improvement and strict capex monitoringLiquidity management – EBITDA improvement and strict capex monitoring
184
276
160 162
228262
(35)
265
116 110 10777
2012 2013 2014 2015 2016 2017
Operating CF & FCF (US$M)Operating CF FCF
238
188 186 186217
281
32.1% 29.7% 32.0% 33.8% 37.1% 38.6%
-100.0%
-80.0%
-60.0%
-40.0%
-20.0%
0.0%
20.0%
40.0%
100
150
200
250
300
350
2012 2013 2014 2015 2016 2017
EBITDA (US$M) and EBITDA margin (%)
230
2346 56
126
186
2012 2013 2014 2015 2016 2017
Capex (US$M)
Generating cash flows and deleverageGenerating cash flows and deleverage
Significant deleveraging and investing for profitable growthSignificant deleveraging and investing for profitable growth
Stable EBITDA marginsStable EBITDA margins Liquidity managementLiquidity management Positive FCF generationPositive FCF generation
Net debt to EBITDA ratio
2018 Guidance – Continued growth
9
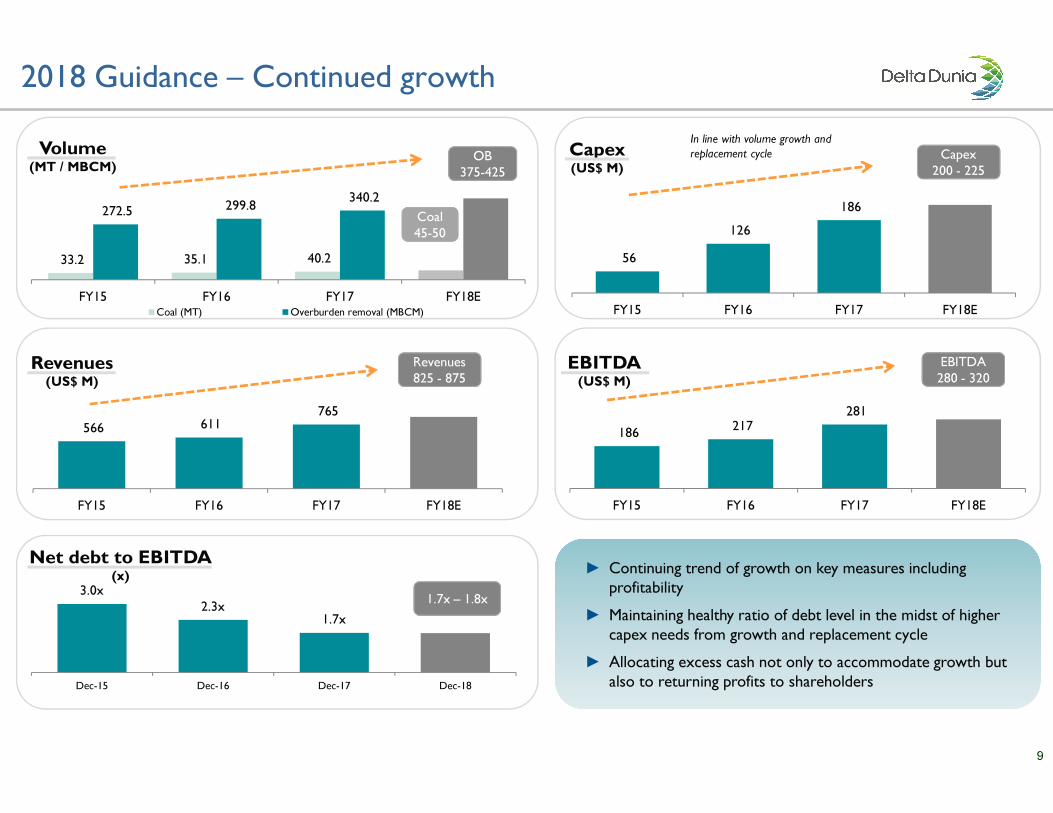
33.2 35.1 40.2
272.5 299.8 340.2
FY15 FY16 FY17 FY18E
Volume(MT / MBCM)
Coal (MT) Overburden removal (MBCM)
566 611 765
FY15 FY16 FY17 FY18E
Revenues(US$ M)
56
126
186
FY15 FY16 FY17 FY18E
Capex(US$ M)
3.0x2.3x
1.7x
Dec-15 Dec-16 Dec-17 Dec-18
Net debt to EBITDA(x)
Coal
45-50
Coal
45-50
OB
375-425
OB
375-425
Capex
200 - 225
Capex
200 - 225
Revenues
825 - 875
Revenues
825 - 875
186 217
281
FY15 FY16 FY17 FY18E
EBITDA(US$ M)
EBITDA
280 - 320
EBITDA
280 - 320
1.7x – 1.8x
► Continuing trend of growth on key measures including
profitability
► Maintaining healthy ratio of debt level in the midst of higher
capex needs from growth and replacement cycle
► Allocating excess cash not only to accommodate growth but
also to returning profits to shareholders
► Continuing trend of growth on key measures including
profitability
► Maintaining healthy ratio of debt level in the midst of higher
capex needs from growth and replacement cycle
► Allocating excess cash not only to accommodate growth but
also to returning profits to shareholders
In line with volume growth and
replacement cycle

Existing contracts
No Customers Period
1 Adaro (Paringin) 1) 2009-20221)
2 Kideco 2004-2019
3 Berau Coal (Lati) 1) 2012-20251)
4 Berau Coal (Binungan) 2003-2020
5 Sungai Danau Jaya ( SDJ) 1) 2015-20231)
6 TadjahanAntang Mineral (TAM) 1) 2015-20241)
7 Angsana Jaya Energi (AJE) 2016-2018
8 Pada Idi (P-Di) 2017 - 2027
9 Tanah Bumbu Resources (TBR) 1) 2018-20241)
Kalimantan
2 Balikpapan
Samarinda
Banjarmasin
Pontianak
10
1) Life of mine contract
2) Based on FY2017 Revenues
1
7
34
5
6
8
Contribution to
BUMA revenue
(%) 2)
BUMA is deeply entrenched with its customersBUMA is deeply entrenched with its customers
SDJ
Years of
relationship19 years 15 years 3 year3 year13 years
57%
11% 12% 12%
9
Ramp-up
NEW
The contractsThe contracts
2 year
6%
NEW
Preparation
AJE TBRP-Di
On Hold
Long-term contracts Secured volume Market-linked pricing

Current
Comps: 6.4x
Avg: 5.0x
STD +2: 7.8x
STD -2: 2.2x
2.0x
3.0x
4.0x
5.0x
6.0x
7.0x
8.0x
9.0x
Jan-12
Aug-12
Mar-13
Oct-13
May-14
Dec-14
Jul-15
Feb-16
Sep-16
Apr-17
Nov-17
UNTR: 6.7x
DOID 280:
3.8x
DOID 320:
3.4x
Current
Comps: 15.1x
Avg: 12.8x
STD +2: 19.3x
STD -2: 6.3x
5.0x
7.0x
9.0x
11.0x
13.0x
15.0x
17.0x
19.0x
21.0x
Jan-12
Aug-12
Mar-13
Oct-13
May-14
Dec-14
Jul-15
Feb-16
Sep-16
Apr-17
Nov-17
UNTR: 13.7x
DOID: 6.4x 1)
Valuation gap
11
P/E OF COMPARABLE COMPANIES
(x)
EV/EBITDA OF COMPARABLE COMPANIES
(x)
Source: Capital IQ Source: Capital IQ
Pre coal crash (2010-2011), DOID was trading at an average EV/EBITDA of 5.6x
1) Based on consensus 2018 profit2) Comps include United Tractors, CIMIC, Downer EDI and Macmahon

End of Presentation

Appendix
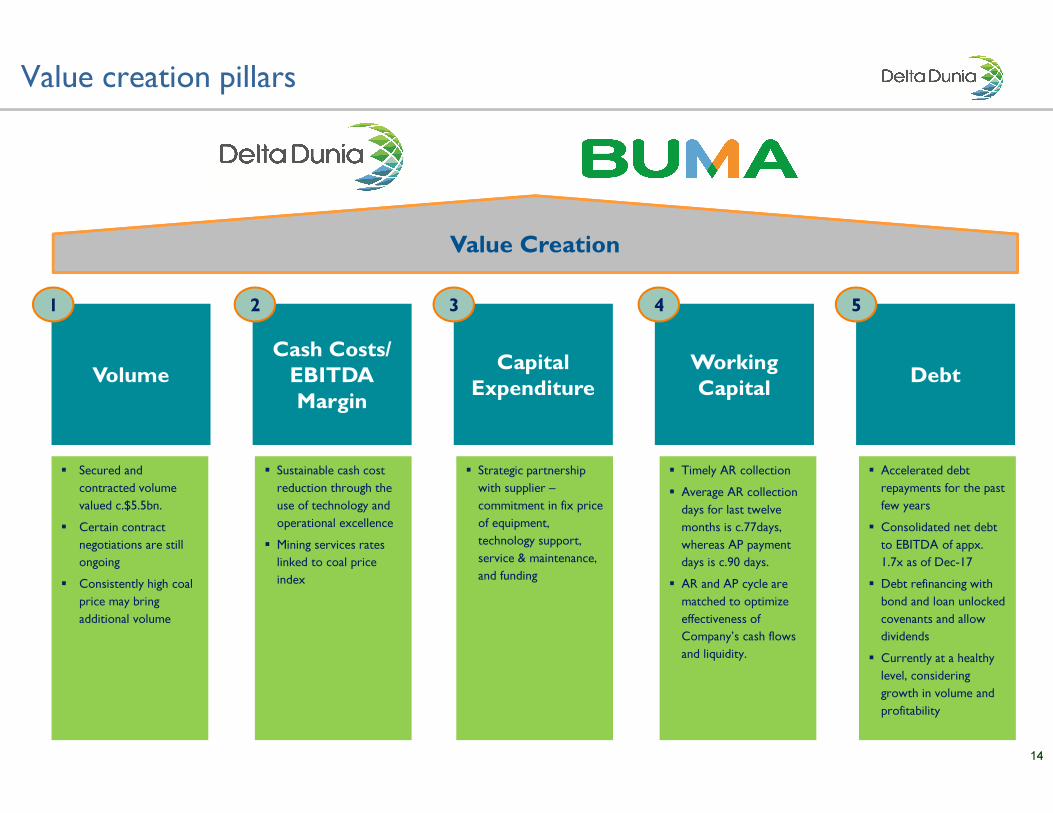
Value creation pillars
14
Capital
Expenditure
� Secured and
contracted volume
valued c.$5.5bn.
� Certain contract
negotiations are still
ongoing
� Consistently high coal
price may bring
additional volume
Cash Costs/
EBITDA
Margin
VolumeWorking
CapitalDebt
� Sustainable cash cost
reduction through the
use of technology and
operational excellence
� Mining services rates
linked to coal price
index
� Strategic partnership
with supplier –
commitment in fix price
of equipment,
technology support,
service & maintenance,
and funding
� Timely AR collection
� Average AR collection
days for last twelve
months is c.77days,
whereas AP payment
days is c.90 days.
� AR and AP cycle are
matched to optimize
effectiveness of
Company’s cash flows
and liquidity.
� Accelerated debt
repayments for the past
few years
� Consolidated net debt
to EBITDA of appx.
1.7x as of Dec-17
� Debt refinancing with
bond and loan unlocked
covenants and allow
dividends
� Currently at a healthy
level, considering
growth in volume and
profitability
1 2 3 4 5
Value Creation

Consolidated performance
15
Consolidated Statements of Cash Flows Financial Ratios 1)
Consolidated Statements of Financial Position Consolidated Statements of Profit or Loss and OCI
Notes:
1) Margins are based on net revenues excluding fuel.
2) Excludes other financial assets which consists of restricted cash in bank and current investments.
3) Reported EPS are translated into Rp using average exchange rate of Rp13,384 and Rp13,307 for FY17
and FY16, respectively.
— STRICTLY CONFIDENTIAL —
In US$ mn (unless otherwise stated) Dec-17 Dec-16 YTD
Cash and cash equivalents 68 67 1%
Other financial assets - current 26 - 100%
Trade receivables - current 175 144 21%
Other current assets 84 88 -4%
Trade receivables - non-current 4 - 100%
Other financial assets - 29 -100%
Fixed assets - net 484 406 19%
Other non-current assets 104 148 -30%
TOTAL ASSETS 946 882 7%
Trade payables 102 80 28%
LT liabilities - current 67 106 -36%
Other current liabilities 49 34 45%
LT liabilities - non current 502 501 0%
Other non-current liabilities 48 35 36%
TOTAL LIABILITIES 768 756 2%
TOTAL EQUITY 177 126 40%
In US$ mn (unless otherwise stated) FY17 FY16 YoY
Net revenues 765 611 25%
Revenue excl. fuel 727 584 24%
Cost of revenues 539 447 21%
Gross profit 225 164 37%
Operating expenses (53) (42) 28%
Finance cost (52) (53) -3%
Others - net (33) (8) 313%
Pretax profit 87 61 43%
Tax expense 40 24 69%
Profit for the year 47 37 26%
Other comprehensive income - net (4) 1 -378%
Comprehensive income 43 39 11%
EBITDA 281 217 30%
Basic EPS (in Rp) 3)
74 59 25%
In US$ mn (unless otherwise stated) FY17 FY16
Net CF from Operating Activities 162 190
Net CF from Investing Activities (63) (36)
Net CF from Financing Activities (99) (159)
Net change in cash & cash equivalents 1 (5)
Beginning balance cash & cash equivalents 67 71
Effect of foreign exchange rate changes (0) 1
Ending balance cash & cash equivalents2) 68 67
FY17 FY16
Gross margin 31.0% 28.0%
Operating margin 23.6% 20.9%
EBITDA margin 38.6% 37.1%
Pretax margin 11.9% 10.4%
Net margin 6.4% 6.3%

BUMA performance
16
Consolidated Statements of Cash Flows Financial Ratios 1)
Consolidated Statements of Financial Position Consolidated Statements of Profit or Loss and OCI
Notes:
1) Margins are based on net revenues excluding fuel.
2) Excludes restricted cash in bank.
FY17 FY16
Gross margin 31.0% 28.0%
Operating margin 24.1% 21.4%
EBITDA margin 39.1% 37.6%
Pretax margin 12.4% 12.1%
Net margin 6.9% 8.2%
— STRICTLY CONFIDENTIAL —
In US$ mn (unless otherwise stated) Dec-17 Dec-16 YTD
Cash 40 49 -18%
Restricted cash in bank - current 11 - 100%
Trade receivables - current 175 144 21%
Due from related party - current 150 182 -18%
Other current assets 84 88 -4%
Trade receivables - non-current 4 - 100%
Restricted cash in bank - 29 -100%
Fixed assets - net 484 405 19%
Other non-current assets 104 148 -30%
TOTAL ASSETS 1,052 1,045 1%
Trade payables 102 80 28%
LT liabilities - current 67 106 -36%
Other current liabilities 51 35 44%
LT liabilities - non-current 502 501 0%
Other non-current liabilities 48 35 36%
TOTAL LIABILITIES 770 757 2%
TOTAL EQUITY 283 288 -2%
In US$ mn (unless otherwise stated) FY17 FY16 YoY
Net revenues 765 611 25%
Revenue excl. fuel 727 584 24%
Cost of revenues 539 447 21%
Gross profit 225 164 37%
Operating expenses (50) (39) 29%
Finance cost (52) (53) -3%
Others - net (33) (1) 2564%
Pretax profit 90 71 28%
Tax expense 40 22 79%
Profit for the year 50 48 4%
Other comprehensive income - net (4) 1 -376%
Comprehensive income 46 50 -7%
EBITDA 284 220 30%
In US$ mn (unless otherwise stated) FY17 FY16
Net CF from Operating Activities 163 194
Net CF from Investing Activities (48) (36)
Net CF from Financing Activities (124) (159)
Net change in cash (9) (1)
Beginning balance cash 49 50
Effect of foreign exchange rate changes (0) 1
Ending balance cash1) 40 49
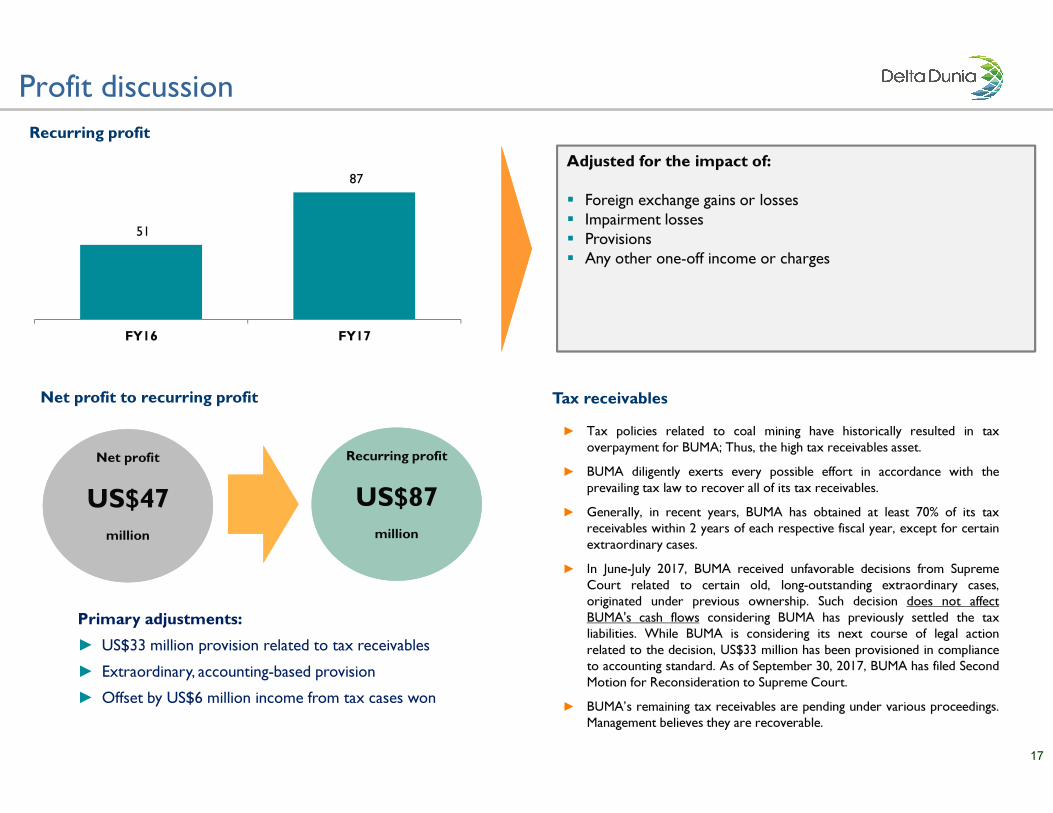
Net profit
US$47
million
Net profit
US$47
million
Profit discussion
17
Adjusted for the impact of:
� Foreign exchange gains or losses
� Impairment losses
� Provisions
� Any other one-off income or charges
Tax receivablesTax receivables
► Tax policies related to coal mining have historically resulted in tax
overpayment for BUMA; Thus, the high tax receivables asset.
► BUMA diligently exerts every possible effort in accordance with the
prevailing tax law to recover all of its tax receivables.
► Generally, in recent years, BUMA has obtained at least 70% of its taxreceivables within 2 years of each respective fiscal year, except for certain
extraordinary cases.
► In June-July 2017, BUMA received unfavorable decisions from Supreme
Court related to certain old, long-outstanding extraordinary cases,originated under previous ownership. Such decision does not affect
BUMA's cash flows considering BUMA has previously settled the taxliabilities. While BUMA is considering its next course of legal action
related to the decision, US$33 million has been provisioned in complianceto accounting standard. As of September 30, 2017, BUMA has filed Second
Motion for Reconsideration to Supreme Court.
► BUMA’s remaining tax receivables are pending under various proceedings.Management believes they are recoverable.
Recurring profitRecurring profit
51
87
FY16 FY17
Net profit to recurring profitNet profit to recurring profit
Recurring profit
US$87
million
Recurring profit
US$87
million
Primary adjustments:
► US$33 million provision related to tax receivables
► Extraordinary, accounting-based provision
► Offset by US$6 million income from tax cases won

Strategic partnership
18
Medium fleet2Medium fleet2
Support
equipment3Support
equipment3
Large fleet1Large fleet1
Coal haulerCoal hauler
Strategic partnerStrategic partner StrategyStrategy
N/AN/A
� Fully deploy existing fleet to
match LATI Life of Mine
� Full utilization without
incremental capex
� Fully deploy existing fleet to
match LATI Life of Mine
� Full utilization without
incremental capex
� Continue to invest to service
contracts on hand
� Most flexible fleet easily
redeployed if required
� Sign strategic partners to lock
in long term benefits
� Continue to invest to service
contracts on hand
� Most flexible fleet easily
redeployed if required
� Sign strategic partners to lock
in long term benefits
Fleet typeFleet type
1 Large: Loader > 300 ton; Hauler > 150 ton; 2 Medium: Loader > 100 ton; Hauler > 60ton; 3 Support equipment = Excavator > 20 ton
No price escalation or rise & fall scheme linked with certain
coal index
No price escalation or rise & fall scheme linked with certain
coal index
Secured leasing facility for new equipmentSecured leasing facility for new equipment
Longer & robust warranty scheme and promise to improve
performance annually
Longer & robust warranty scheme and promise to improve
performance annually
Guaranteed second life at lower price Guaranteed second life at lower price
Provide more value add, such as training, improve technology
& equipment buyback schemes
Provide more value add, such as training, improve technology
& equipment buyback schemes
Guaranteed or cost cap for equipment lifecycle costGuaranteed or cost cap for equipment lifecycle cost
Partnership benefits with supply partnersPartnership benefits with supply partners
Investment strategy with supply partnersInvestment strategy with supply partners
� Lock in partnership in down cycle to gain maximum benefits
� Ensure back-to-back investment and customer contracts esp.
volume
� No annual “must” spend and flexibility to delay spending, if
necessary
� Lock in partnership in down cycle to gain maximum benefits
� Ensure back-to-back investment and customer contracts esp.
volume
� No annual “must” spend and flexibility to delay spending, if
necessary
Strategic and flexible capex support plan to support contracted production volumes

19
Debt structure
BUMA Refinanced of its tightly-restricted syndicated bank facilities in February 2017
US$350 million
Senior Notes
� Coupon of 7.75% p.a.
� Tenor of 5NC3 – ending 2022
� Settlement at maturity (no amortization)
� Secured by DSRA
US$350 million
Senior Notes
� Coupon of 7.75% p.a.
� Tenor of 5NC3 – ending 2022
� Settlement at maturity (no amortization)
� Secured by DSRA
Current Debt Structure
US$150 million
BTMU Loan Facility
� US$50m term loan + US$100m revolver
� Interest of LIBOR+3% p.a.
� Tenor of 4 years
� Straight-line amortization
� Same security package as previous loan
US$150 million
BTMU Loan Facility
� US$50m term loan + US$100m revolver
� Interest of LIBOR+3% p.a.
� Tenor of 4 years
� Straight-line amortization
� Same security package as previous loan
Various Finance Leases
� Average cost of LIBOR + 3.5%
� Tenor 4 – 5 years, some extendable to 7
years
� Straight-line installments
� Outstanding at Dec 2017 appx.
US$180m
Various Finance Leases
� Average cost of LIBOR + 3.5%
� Tenor 4 – 5 years, some extendable to 7
years
� Straight-line installments
� Outstanding at Dec 2017 appx.
US$180m
Cash flow and operational flexibility to
support future growthLower cost of funding to accommodate ongoing growth
Currently healthy debt ratioCurrently healthy debt ratioAmple headroom from debt
covenant
Ample headroom from debt
covenant
Wide access to capital funding
needed for the growth
Wide access to capital funding
needed for the growth
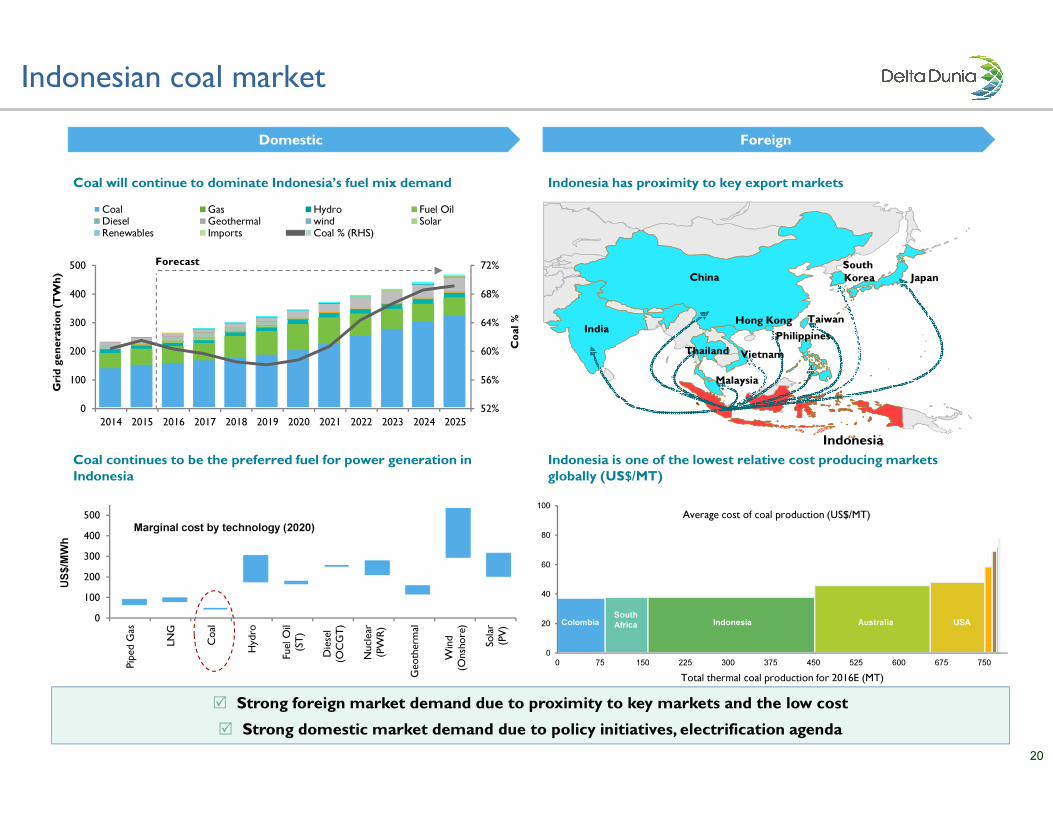
Indonesian coal market
20
Coal will continue to dominate Indonesia’s fuel mix demandCoal will continue to dominate Indonesia’s fuel mix demand
Coal continues to be the preferred fuel for power generation in
Indonesia
Coal continues to be the preferred fuel for power generation in
Indonesia
Indonesia has proximity to key export marketsIndonesia has proximity to key export markets
India
China
VietnamThailand
Philippines
Taiwan
South
Korea Japan
Malaysia
Indonesia
Hong Kong
Indonesia is one of the lowest relative cost producing markets
globally (US$/MT)
Indonesia is one of the lowest relative cost producing markets
globally (US$/MT)
0
20
40
60
80
100
0 75 150 225 300 375 450 525 600 675 750
Total thermal coal production for 2016E (MT)
Average cost of coal production (US$/MT)
IndonesiaColombiaSouth
Africa Australia USA
Domestic Foreign
52%
56%
60%
64%
68%
72%
0
100
200
300
400
500
2014 2015 2016 2017 2018 2019 2020 2021 2022 2023 2024 2025
Coal Gas Hydro Fuel OilDiesel Geothermal wind SolarRenewables Imports Coal % (RHS)
Forecast
Gri
d g
en
era
tio
n (
TW
h)
Co
al %
US$/M
Wh
Marginal cost by technology (2020)
0
100
200
300
400
500
Piped G
as
LNG
Coal
Hydro
Fuel Oil
(ST)
Diesel
(OCGT)
Nuclear
(PW
R)
Geotherm
al
Wind
(Onshore)
Solar
(PV)
� Strong foreign market demand due to proximity to key markets and the low cost
� Strong domestic market demand due to policy initiatives, electrification agenda

3743
3769
509350
<3 yrs
3 - 10 yrs
10 - 15 yrs
>15 yrs
Strong management team
21
Delta Dunia senior managementDelta Dunia senior management
BUMA senior managementBUMA senior management
Ronald Sutardja, President Director
� Appointed VP Director in June 2012, President Director in March 2014
� Previously a Director at PT Trikomsel Oke Tbk.
Experienced BUMA operational team 1)Experienced BUMA operational team 1)
� 51 people
� 17 years average industry
experience
� 7 years average tenure with
BUMA
Manager overview
� 15 people
� 18 years average industry
experience
� 6 years average tenure with
BUMA
General manager
overview
Hagianto Kumala, President Director
� Has served as President Director of Delta Dunia since 2009
� Previously held various senior roles in Astra Group, including UNTR
Years of service
Leadership positions: 2,371 employees
Skilled workers: 8,371 employees
Employees education
Rani Sofjan, Director
� Has served as Director of Delta Dunia since 2009
� Also serves as an Executive Director of PT Northstar Pacific Capital
Eddy Porwanto, Finance Director
� Serves as Delta Dunia as Director and BUMA Commissioner since 2014
� Previously a Director at Archipelago Resources and Garuda Indonesia
Una Lindasari, Finance Director
� Appointed as Director in August 2014
� Previously CFO of Noble Group from 2008
Jason Thompson, Business Development Director
� Appointed as Director in August 2014
� Previously held various positions in surface mining operations
Indra Kanoena, Plant Director / HR &GA
� Appointed as Director in January 2013
� Previously held various senior positions in Human Resources areas
Sorimuda Pulungan, Operations Director
� Appointed as Director in January 2012
� Experienced in mining industry (gold/nickel/coal)
Management’s vision and experienced BUMA operational team is key to the resilient performance of the Company
30+ years
22+ years
23+ years
23+ years
30+ years
25+ years
18+ years
17+ years
1) Data as per December 31, 2016
14 96
1234
290
737Elementary
Junior high
High school
Tertiary degree
Bachelor degree &
above

Thank You