PT Bank Danamon Indonesia, Tbk Full Year … market loan has grown by ... SME, retail banking, ......
36
Untuk Anda, Bisa Slide 1 PT Bank Danamon Indonesia, Tbk Full Year 2013 Financial Results Jakarta, 12 February 2014
Transcript of PT Bank Danamon Indonesia, Tbk Full Year … market loan has grown by ... SME, retail banking, ......

Untuk Anda, Bisa
Slide 1
PT Bank Danamon Indonesia, Tbk
Full Year 2013 Financial Results
Jakarta, 12 February 2014

Untuk Anda, Bisa
Slide 2
Agenda
• 2013 Achievement
• Macroeconomy
• Indonesia Banking Sector and Automotive Industry
• Appendix

Untuk Anda, Bisa
Slide 3
2013 Achievement
Conscious effort to bring down LDR to 95.1%.
LDR
CASA rose Rp 10 trillion or 23% from the previous year (CAGR 5yr of 22%). CASA to deposits composition stood at 48% (2012: 47%).
CASA
Non-mass market loan has grown by 30% YoY and contributed to 48% of total loan (2012: 43%). This is in line with the bank’s strategy to capitalise on the SME and Commercial segments.
Rp 65.4 trillion30% YoY
Non-mass market loan
In 2013 total loans was Rp 135 trillion, an increase of 16% from the previous year.
Rp 135 trillion↑↑↑↑16% YoY
Loan
Better asset quality management is indicated by a decrease in NPL to 1.9% (2012: 2.4%) and a decrease in CoC to 2.6% (2012: 2.8%).
NPL 1.9%CoC 2.6%
Asset Quality
Robust growth of trade finance. Cash loans and non-cash loans increased 45% and 76%, respectively.
Cash↑↑↑↑45% YoYNon-cash↑↑↑↑76% YoY
Trade Finance
CASA Ratio (%)
2640 48
2008 2010 2013
LDR (%)
95.1103.5 105.4 99
1Q13 2Q13 3Q13 4Q13

Untuk Anda, Bisa
Slide 4
Liquidity : LDR was lowered to 95%
IDR Cost of Funds (%), LDR (%)
95.1
99
105.4103.5
8.88.18.0 8.1
6.25.24.84.6
1Q13 2Q13 3Q13 4Q13
◄ LDR
◄ ADMF CoF
◄ IDR CASA, TD
CoF
IDR Yield (%), IDR Loans (Rp tn)
38%40%41%42%
62%60%59%58%
24.324.6
24.124.2
11.9 11.7 11.9 12.2
1Q13 2Q13 3Q13 4Q13
107.3 113.8 116.3 122.6
◄ Non Mass Mkt
+4w Yield
◄ Mass mkt
loans yield
NIM and Risk Adj NIM (%)
7.8 7.3 6.8 7.0
2.4 2.7 2.8 2.3
6.8
2.7
4Q12 1Q13 2Q13 3Q13 4Q13
Risk Adj NIM CoC
10.2 10.1 9.7 9.7 9.1• LDR was lower at the expense of NIM.
• Asset repricing for non mass-market loans was materialized in the second half of the year.
◄ Mass mkt
loans
◄ Non Mass Mkt
+4w loans

Untuk Anda, Bisa
Slide 5
Liquidity : Continue the use of borrowings and long
term funding for growth amid rising price of liquidity
• ADMF is financed through bonds and long term borrowing at fixed price to address interest rate risk and assets liability duration mismatch.
• Long term borrowing of subsidiaries and other liquid assets provided 34% LDR saving.
Capital
59%
LT
Fund.
1%
Bonds
40%
ADMF Source of Funds
Capital
21%
LT.
Fund.
39%
Bonds
40%
2010 2013
Rp 6.4 tn Rp 28.7 tn
LDR 2013 (%)
26.4 24.8
121.5
95.1 96.7
87.4
BDI Stand
Alone
BDI +
ADMF
Loans
LDR Consol Loan to
Funding
▲
ADMF
loans
LT. Fund
▼
ADMF - JF vs Self Finance (Rp tn)
78% 67% 49% 39%
22%33% 51% 61%
2010 2011 2012 2013
JF Self Fin
30.7
41.445.6
47.9

Untuk Anda, Bisa
Slide 6
CASA Journey : Continues effort to increase CASA
ratio from 26% to 48%
Customer Deposits (Rp tn)
26%41%
48%
52%
59%74%
2008 2011 2013
CASA TD
75.488.1
110.8CAGR CASA 5yr 22%
• CASA grew CAGR 22% driven by 4 champion products, enhancement of acquisition strategy, improving products and services as well as sales capacity.
Customers People & Infrastructure Product / Services
• Grow the customer base focusing on self employed and affluent segment
• Leverage Adira and DSP – 2 Adira branches and all DSP branches were upgraded to full service
• Roll out mobile apps and branchless banking, branch revamping
• 15 new privilege centers, 8 new mobile branches
• Improve skills and increase +/- 1,000 number of sales force to nearly 3,000 by end of 2013 from 2008.
• Financial Supply Chain to boost funding
• X-sell, new Bancassurance and CASA products
• Speed up process, reduce queuing time • Centralized complaint handling system

Untuk Anda, Bisa
Slide 7
CASA journey: Financial Supply Chain to boost funding
• Financial Supply Chain (FSC) is a joint program between SME, retail banking, ADMF and DSP to optimize funding
capacity targeting principal/anchors down to distributors
nationwide
• Today, Danamon involves anchors and distributors to support
this project.• Average growth per month of FSC funding is 5%
• 63% of FSC Funding is composed by CASA
FSC Funding Project (Rp bn)
693
572703
1,0541,024
668
656770
1,158 1,138
Dec-12 Mar-13 Jun-13 Sep-13 Dec-13
O/S Ave. Bal
70%
CASA VC Project
(Rp mn)
474
4,621
Dec-12 Dec-13
O/S
No of Acct
191
482
Dec-12 Dec-13
152%
• CASA supply chain is one of Danamon’s
funding programs
specifically targeting
distributor, retailers,
students, individual/employees
particularly to boost
CASA in certain area.
• The major contributors for this project are SME
and Retail Banking.

Untuk Anda, Bisa
Slide 8
Loans grew 16% yoy. Non-mass market grew strongly.
57% 56% 54% 53% 52%
6% 6% 7% 6% 7%
26% 27%27% 27% 28%
11% 11%12%
13%14%
4Q12 1Q13 2Q13 3Q13 4Q13
Loan Composition Rp trillion
116 117124
129
Loan Growth
%
Rp billion 2012 2013 ����YoY
� Wholesale 12,663 18,828 49%
� SMEC* 30,544 37,606 23%
� Retail 7,115 8,988 26%
� Mass
Market66,063 69,961 6%
Total 116,385 135,383 16%
* SME and Commercial segments
135

Untuk Anda, Bisa
Slide 9
9.9
3.82.2 1.9
11.7
4.32.7 2.2
Java, Bali, Lampung,
NTT, NTB
Sumatra Kalimantan Sulawesi + E.Ind
2012 2013
SME Loans (Rp tn)
11.3
14.2
17.8
21
2010 2011 2012 2013
SME : Loan to SME shows a robust growth
Aver.loans size
Relationship officers
Loan disbursed(Rp tn)
1.38bn/cust.
1.61 bn/cust.
1.84 bn/cust.
2.10 bn/cust.
333 391 482 487
6.6 8.1 10.1 11.0
% to total loan
13.6% 14.0% 15.3% 15.5% BDI SME NPL
290292
189 242
1.41.41.32.6
2010 2011 2012 2013
Rp bn %
SME Loans by Region (Rp tn)
CAGR 23%
59,854 59,353 60,462 61,450# of Customers
2013201220112010
18%
13%24%
18%

Untuk Anda, Bisa
Slide 10
SME : Balancing strong loan growth and benign NPL,
enforcing funding capacity.
Customers People & Infrastructure Product / Services
• Target of 10% increase in number of
customers in 2014
• Utilize activity and promotional event to
gain volume & top up portfolio
• Customised approach and pricing
strategy for high end customer with
sensitive pricing
• Double marketing effort to create a
robust communication
• Expand of 100 new networks in 2014 (12
networks realised in Jan 2014)
• Increase head count for about 20%,
including +400 headcounts for the new SME
branches
• Increse people’s competence through
internal training and professional
certification
• Targets of 22% - 25% CAGR for total
lending and funding.
• Intensify Danamon Online Banking and
Cash@Work
• Building strengh through Financial Supply
Chain (FSC)
SME CASA (Rp tn)
5.5
3.4 3.8
4.9
2010 2011 2012 2013
CAGR 18%
Constr.
2% , 0.5%
Property
5% , 1.1%
Household
58% , 1.4%
Others
17% , 0.4%Trading
16% , 2.2%
Mining,
Quarrying
2% , 6.2%
2013 SME Loans by Industry (%), NPL (%)
Rp 20,971 bn

Untuk Anda, Bisa
Slide 11
Trade Finance : Robust growth above 30% per annum.
Cash Loans (Rp tn)
9.8
6.9
4.43.4
2010 2011 2012 2013
Non-cash Loans (Rp tn)
9.9
5.64.9
4.2
2010 2011 2012 2013
CAGR 43%
Customers People & Infrastructure Product / Services / Coverage
• Robust growth driven by Corporate and
Commercial segment, rose by 48% y-y
to Rp 4.3tn and 40% y-y to Rp 5.1tn
• Danamon is investing New Trade Finance
System (NTFS) to add more customer touch
point.
• More than 25 trade specialists
• Centralized Trade Operation, enabling
Danamon to process and serve efficiently
• Generic, Structured, Commodity Financing
& Syariah (e.g. L/C, trust receipt, guarantee,
outgoing collection service, outgoing
collection financing)
• Trade Service Point at Port (TSPP) in
Jakarta, Medan and Surabaya for Import
Tax Payment and B/L endorsement
• Trade representatives in 14 big cities in
Java, Sumatra, Kalimantan, Sulawesi.
CAGR 34%
Best Trade Finance bank in Indonesia by Exporta
2011, 2012, 2013
Best Local Trade Bank2009
by Euromoney
The Best Trade Bank 2007 - 2009
by FinanceAsia
The Best Trade Bank In Indonesia 2006by Asiamoney
The Best Trade Bank2005 - 2012
Best Local Cash Management Bank in Indonesia by Asiamoney
2009 - 2011

Untuk Anda, Bisa
Slide 12
Corporate and Commercial Funding
(Rp tn)
32.3
17.920.3
24.3
2010 2011 2012 2013
Corporate and Commercial : Ample growth with
preserved asset quality accounted for 26% of loan book.
Corporate NPL
18.8
10.712.5 12.7
1.13.83.43.9
2010 2011 2012 2013
Rp bn %
Commercial NPL
16.6
8.410.0
12.7
0.31.63.35.2
2010 2011 2012 2013
Rp bn %
Others
, 77%
Corp,
Comm.
, 23%
Others
, 74%
Corp.,
Comm.
, 26%
2010 2013
Corporate and Commercial Lending
Portion
CAGR 22%
CAGR 26%CAGR 21%

Untuk Anda, Bisa
Slide 13
ADMF Loans (Rp tn)
47.9
30.541.1
45.2
2010 2011 2012 2013
ADMF : 2W share shift compensated by 4W. Healthy
growth in second semester.
35% of total loans
37% of total loans
18% of tot. pf. / 52% of ADMF
25% of tot. pf / 68% of ADMF
17% of tot. pf / 49% of ADMF
13% of tot. pf / 35% of ADMF
CAGR 16%
CAGR 6%
2W Unit Sales and ADMF Mkt Shr
7,7717,373 8,0447,064
12.615.715.815.7
2010 2011 2012 2013
Industry sales (000)
ADMF Mkt Shr (%)
4W Unit Sales and ADMF Mkt Shr
1,230765
8941,116
5.45.66.65.2
2010 2011 2012 2013
Industry sales (000)
ADMF Mkt Shr (%)
CAGR 31%
CAGR 2%CAGR 17%
2W Loans (Rp tn)
24.720.6
25.4 25.4
2010 2011 2012 2013
4W Loans (Rp tn)
23.6
10.516.4
20.3
2010 2011 2012 2013
Note: loans include acquisition cost, exclude interest receivables

Untuk Anda, Bisa
Slide 14
ADMF : Repo assets and loss on repo assets has been
manageable
0.53%0.47% 0.46%
0.40%
0.02% 0.03% 0.04% 0.02%
0.00%
0.20%
0.40%
0.60%
0.80%
1.00%
2010 2011 2012 2013
All Stock >180 days
Repo Assets as % of Receivables (%)
• % Repo / ENR was
manageable at 0.4%
• Old Inventory (>180 days) was
kept at 0.02%
• LOR Rate relatively showed
manageable trend
26%
27%
27%
22%
0%
10%
20%
30%
40%
50%
20
10
20
11
20
12
20
13
%LOR
24%
Loss on Repo Assets – Average (%)
Customers People & Infrastructure Product / Services / Coverage
• Customer Satisfaction Program & Adira
Club Member
• Dealer and agent management to secure
repeat order, develop lower cost payment
point, offer a total dealer support system
to retain good dealers and increase sales
• Upgrade staffs’ skill to support total
dealer relationship, productivity
• Business Process Redesign to improve
operating efficiency
• Business Network Redesign to improve
the productivity of network.
• Product differentiation through cross-
selling/bundling with financial products.

Untuk Anda, Bisa
Slide 15
SEMM : Challenges in Java remain, asset quality at
manageable level. DSP Loans (Rp tn) and Gross NPL (%)
15.3 16.418.8 19.9
5.95.35.65.1
2010 2011 2012 2013
15% of total loans
19% of total loans
Loans by Region (Rp tn)
8.8
4.2 5.7
18.8
8.8
4.76.3
19.9
Java Sulawesi and
East
Sumatra Total
2012 2013
10%14%
-1%
• Strategic Business Alliance increased by
22%
• To increase funding by 24% to Rp 1.6tn
• Launched Bancassurance Primajaga
• Improved productivity at collection has
improved recovery by 36% in Q4-14
• Dedicated semi secured sales specialists
: 1,117 AOs to serve 1,217 units
Product / Services / Coverage / FundingCustomers People & Infrastructure
• Boost upper tier micro to reach Rp 1.3tn
from Rp 333b in 2013
• Increase agri by 30% to reach Rp 3.2tn
• Referral program through DSP prime
customers (3,000 referrors)
• Implementation of CPA (credit process
application) in all branches
• Mobile Collection
• Direct reporting of credit officers to Risk in
hub & spoke branches
• Implement Hub and Spoke models in
selected Java and Jakarta units
• In 2014 plan to merge 137 units , while
170 Pasar units in Java and Jakarta area
will be converted into functional office.
• Optimize capacity (10% reduction of non
performer)
• Competency building (increase
knowledge scoring target)
6%

Untuk Anda, Bisa
Slide 16
Adira Insurance : Strong growth of GWP and number
of active policy
Gross Written Premium (Rp bn)
1,792
1,085
1,4741,605
2010 2011 2012 2013
No of Active Policy (000)
7,623
4,680
5,660 5,799
2010 2011 2012 2013
% 2010 2011 2012 2013
RBC 401 337 234 205*
CIR 31 32 35 40
RoE 36 38 36 29
RoA 15 14 11 9
• GWP in 2013 was Rp1,792bn or increased by 12%YoY.
• No. of active policies was 7,6mn or increased by 31%YoY.
CAGR 18% CAGR 18%
* Lower RBC and RoA from 2011 to 2012 due to the implementation IFRS Insurance

Untuk Anda, Bisa
Slide 17
2013 GWP by Source of Business
Others
13%
Group
69%
Strategic
Ind
6%
Finance
Ind
12%
Adira Insurance : Leading Indicators
Customers People & Infrastructure Products / Services / Coverages
• Call center serves 24 hour and during
2013 receive 79thousands number of
calls
• Workshop partner as of 2013 was 428
workshops
• Health business supported by 619
Hospitals
• Supported by 1,078 employees in 53 outlets
by end of 2013
• In 2013 launched Travellin, medicillin &
autocillin mobile apps (blackberry & google
play)
• Health insurance includes hospitalization,
outpatient, dental & optical care.
• Travel insurance covers losses whilst
travelling abroad & locally, coverage include
PA, medical, travel delay, cancellation, loss
of baggage & others
2013 GWP by Class of Business
Auto
63%
Engineeri
ng
5%
Others
20%
HE
3%
Property
9%
660 (37%)Non MV
Rp bn
MV 1,133 (63%)Rp 1,792 bn568 (31%)Non Grp
Rp bn
Group 1,224 (69%)
Rp 1,792 bn

Untuk Anda, Bisa
Slide 18
Bancassurance excluding one time
fee (Rp bn)
171
104140 129
2010 2011 2012 2013
Cash Management (Rp bn)
253
192216 228
2010 2011 2012 2013
Fee Income : Non credit related fee rose 12% driven by
general insurance, cash management, and bancassurance.
Rp 1,536bn
Distribution of Fee Income
2013 (%)
Others
28%Gen ins
45%
Cash Mgt
16%
Bancas.
Excl one
time fees
11%
General Insurance (Rp bn)
687
504
618 664
2010 2011 2012 2013
Note : General insurance including investment fees
CAGR 10%
CAGR 18%
CAGR 11%

Untuk Anda, Bisa
Slide 19
BDI NPL (%)
2.4 1.9 1.42.2
6.4
0.92.0 2.0 2.0
3.0
8.0
1.0
Trading Household Property Agri Mining Construction
2012 2013
Asset Quality :BDI Loans by are dominated by trading
industry. NPL by economic sector remain benign.
BDI Loans by Industry (% of total loans)
3126.4
7 4.4 2.3 1.8
33.1
21
6.9 4.4 2.2 1.9
Trading Household Property Agri Mining Construction
2012 2013
Industry Loans by Industry (% of total loans)
18.2
29.8
5.6 5.1 3.7 3.8
19.6
28.1
5.9 5.3 3.8 3.7
Trading Household Property Agri Mining Construction
2012 2013
• Trading loans rose driven by Commercial and Corporate segment
Industry NPL (%)
2.91.6 1.6 1.8 1.3
3.92.6
1.6 1.9 1.6 1.5
3.8
Trading Household Property Agri Mining Construction
2012 2013
• NPL in mining industry was driven by Corporate segment.

Untuk Anda, Bisa
Slide 20
Highlights of Balance Sheet
Rp billion 2012 2013 ����YoY 1Q13 2Q13 3Q13 4Q13
Total Assets 155,791 184,237 18% 153,785 158,103 173,094 184,237
Loans (gross) 116,385 135,383 16% 117,484 123,935 129,065 135, 383
Government Bonds 4,063 5,598 38% 4,066 3,895 5,548 5,598
Total Deposits 115,926 139,858 21% 114,028 118,741 130,611 139,858
Current Account 15,854 21,132 33% 15,845 15,631 20,705 21,132
Savings 27,270 32,053 18% 25,940 25,991 26,494 32,053
Time Deposit 48,552 57,621 19% 47,205 51,316 55,123 57,621
Borrowings and LT.
Fundings24,252 29,052 20% 25,038 25,803 28,288 29,052
Equity 28,494 31,251 10% 29,504 29,234 30,228 31,251

Untuk Anda, Bisa
Slide 21
Highlights of Income Statement
Rp billion 2012 2013 ����YoY 1Q13 2Q13 3Q13 4Q13
Net Interest Income 12,922 13,531 5% 3,334 3,349 3,421 3,427
Non-Interest Income 4,433 4,929 11% 1,122 1,253 1,322 1,232
Operating Income 17,355 18,460 6% 4,456 4,602 4,743 4,659
Cost of Credit (2,984) (3,184) 7% (770) (828) (835) (751)
Risk Adjusted Op.
Income14,371 15,276 6% 3,686 3,774 3,908 3,908
Operating Expenses (8,809) (9,695) 10% (2,308) (2,391) (2,507) (2,489)
Net Profit after Tax 4,012 4,042 1% 1,005 980 1,022 1,035

Untuk Anda, Bisa
Slide 22
Key Ratios
149.1130.8119.4107.444.4149.1104.7Coverage (LLP/NPL) – Non Mass Mkt
% 2012 2013 ����YoY 1Q13 2Q13 3Q13 4Q13
Net Interest Margin 10.1 9.6 -0.5 10.1 9.7 9.7 9.1
Cost of Credit 2.8 2.6 -0.2 2.7 2.8 2.7 2.3
Cost / Income 50.8 52.5 1.7 51.8 52.0 52.8 53.4
ROAA 2.7 2.5 -0.2 2.7 2.5 2.5 2.3
ROAE 16.2 14.5 -1.7 14.4 14.2 14.8 14.7
Assets to Capital (x) 6.3 6.7 0.3 5.7 6.0 6.4 6.7
Stand Alone Loan to Funding * 89.2 86.6 -2.6 89.1 91.9 87.6 86.6
Consolidated Loan to Funding * 89.5 87.4 -1.7 89.4 91.1 88.4 87.4
Regulatory LDR 100.7 95.1 -5.6 103.5 105.4 99.0 95.1
Stand Alone CAR 18.4 17.5 -0.9 20.0 18.4 18.1 17.5
Consolidated CAR 18.9 17.9 -1.0 20.1 18.7 18.3 17.9
NPL – Gross 2.4 1.9 -0.5 2.5 2.4 2.2 1.9
Impairment (LLP/Total Loans) 2.6 2.4 -0.2 2.6 2.6 2.6 2.4
Coverage (LLP/NPL) – Mass Mkt 117.1 121.0 3.9 112.7 112.0 115.2 121.0
*) Loan to funding is defined as (Loans + Reserves with BI + Cash in Vault + HTM bonds) / (Third Party Deposits + net borrowing and Long term
funding + net capital)
Untuk Anda, Bisa
Slide 23
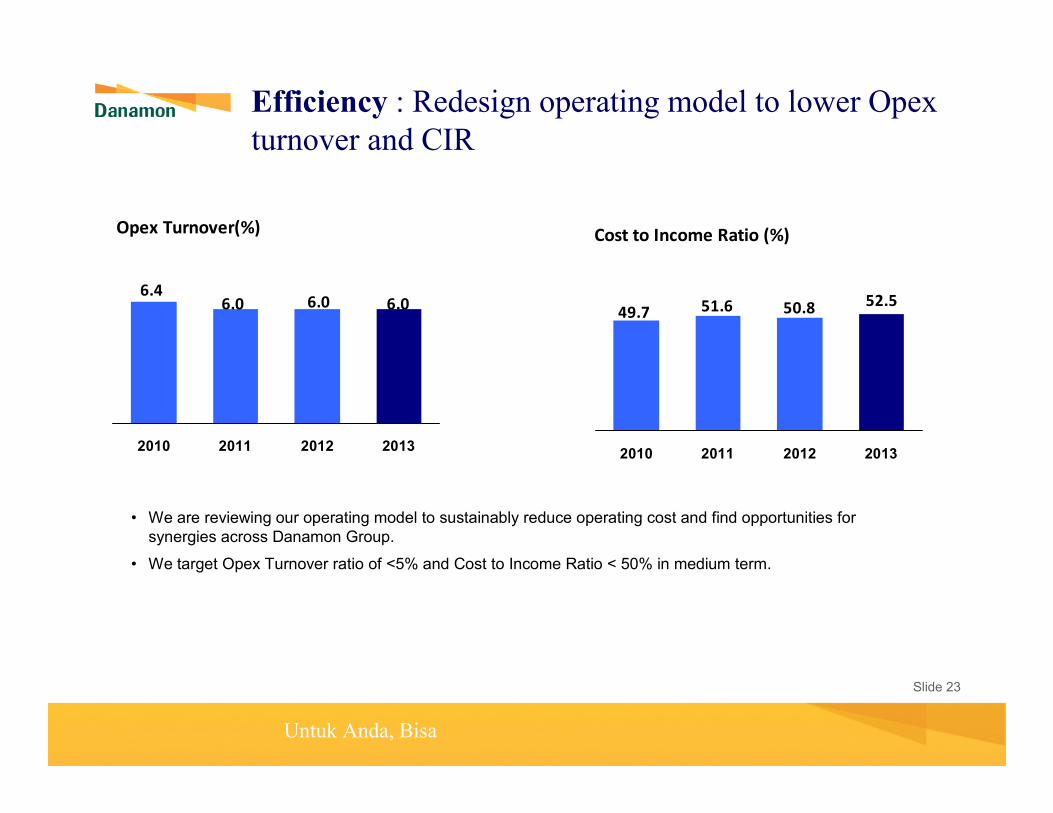
Opex Turnover(%)
6.06.06.06.4
2010 2011 2012 2013
Cost to Income Ratio (%)
52.550.851.649.7
2010 2011 2012 2013
Efficiency : Redesign operating model to lower Opex
turnover and CIR
• We are reviewing our operating model to sustainably reduce operating cost and find opportunities for synergies across Danamon Group.
• We target Opex Turnover ratio of <5% and Cost to Income Ratio < 50% in medium term.

Untuk Anda, Bisa
Slide 24
Ample capitalization for growth
RWA / Total Assets Capital Adequacy Ratio (%)
% 4Q12 1Q13 2Q13 3Q13 4Q13
CAR w/ Credit
Risk23.4 25.6 23.5 22.8 22.0
Market Risk
Charge0.0 0.0 0.1 0.1 0.0
Operational
Risk Charge4.5 5.4 4.7 4.4 4.1
CAR
Consolidated18.9 20.1 18.7 18.3 17.9
18.318.920.1
18.717.9
18.4
20.0
17.518.118.4
4Q12 1Q13 2Q13 3Q13 4Q13
Consolidated Stand Alone
RWA BDI Only RWA Consolidated
18.4
19.6
18.217.8
17.3
0.5
0.5
0.50.5
0.6
4Q12 1Q13 2Q13 3Q13 4Q13
Tier 1 Capital Tier 2 Capital
Tier 1 and Tier 2 capital ratio (%) -
Consol
67%68%72%69%68%
4Q12 1Q13 2Q13 3Q13 4Q13
84%86%90%88%84%
4Q12 1Q13 2Q13 3Q13 4Q13
RWA Other Assets
18.9
20.1
18.718.3
17.9
Untuk Anda, Bisa
Slide 25
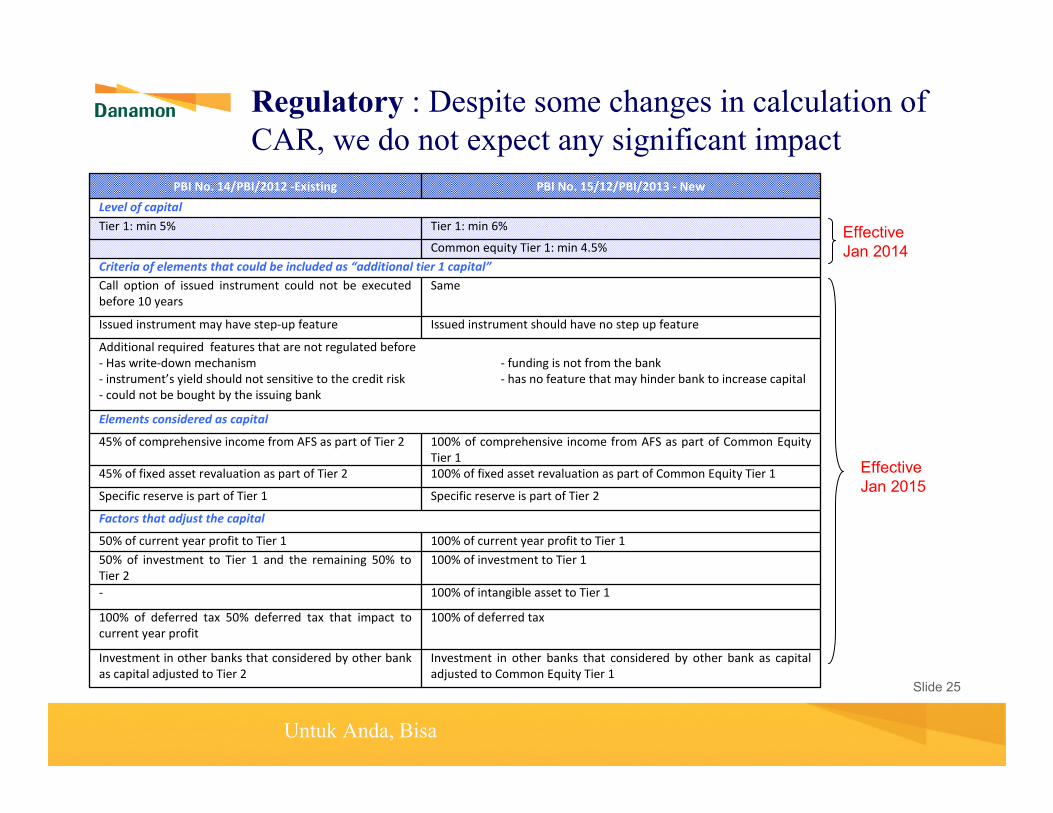
Regulatory : Despite some changes in calculation of
CAR, we do not expect any significant impact
Specific reserve is part of Tier 2Specific reserve is part of Tier 1
100% of fixed asset revaluation as part of Common Equity Tier 145% of fixed asset revaluation as part of Tier 2
100% of comprehensive income from AFS as part of Common Equity
Tier 1
45% of comprehensive income from AFS as part of Tier 2
Elements considered as capital
100% of deferred tax100% of deferred tax 50% deferred tax that impact to
current year profit
100% of intangible asset to Tier 1-
100% of investment to Tier 150% of investment to Tier 1 and the remaining 50% to
Tier 2
100% of current year profit to Tier 150% of current year profit to Tier 1
Factors that adjust the capital
Investment in other banks that considered by other bank as capital
adjusted to Common Equity Tier 1
Investment in other banks that considered by other bank
as capital adjusted to Tier 2
Issued instrument should have no step up featureIssued instrument may have step-up feature
SameCall option of issued instrument could not be executed
before 10 years
Criteria of elements that could be included as “additional tier 1 capital”
Additional required features that are not regulated before
- Has write-down mechanism - funding is not from the bank
- instrument’s yield should not sensitive to the credit risk - has no feature that may hinder bank to increase capital
- could not be bought by the issuing bank
Common equity Tier 1: min 4.5%
Tier 1: min 6%
PBI No. 15/12/PBI/2013 - New
Tier 1: min 5%
Level of capital
PBI No. 14/PBI/2012 -Existing
Effective Jan 2014
Effective Jan 2015

Untuk Anda, Bisa
Slide 26
Regulatory : We are ready for the additional buffer
required by BI
1 – 2.5%1 – 2.5%1 – 2.5%1 – 2.5%Surcharge D-SIB
0 – 2.5%0 – 2.5%0 – 2.5%0 – 2.5%Countercyclical Buffer
CAR Type 2013 2014 2015 2016 2017 2018 2019
Total minimum CAR still based on Risk Profile Risk Rating:
• Rating 1 : CAR min 8%
• Rating 2 : CAR min 9-<10%
• Rating 3 : CAR min 10-<11%
• Rating 4 & 5 : CAR min 11-<14%
No Change
Conservation Buffer 0.625% 1.25% 1.875% 2.5%

Untuk Anda, Bisa
Slide 27
Agenda
• 2013 Achievement
• Macroeconomy
• Indonesia Banking Sector and Automotive Industry
• Appendix

Untuk Anda, Bisa
Slide 28
Growth Outlook: Relatively stable in 2014
Economic Growth
• GDP growth in Q4 came out better than expected at (-1.42%qtq) 5.72%yoy. That led to a better full year 2013 growth at 5.78%yoy
• Private consumption still support growth as retail sales growth remained stable. Car sales and motorcycle sales was also seen stabilizing in Dec
• Investment was seen slowing down as affected from the policy rate hike
• This year, we expect the economy to grow relatively steady, and could grow by 5.73% yoy as impact of the interest rate hike will materialize, but may be cushioned by support from election spending.
Retail Sales
Growth Outlook
%yoy
Car & Motorcycle Sales
%
Jun-06 Sep-07 Dec-08 Mar-10 Jun-11 Sep-12 Dec-13
100
50
0
-50
-100
100
50
0
-50
-100
Motorcycle sales
(% y-o-y, rhs)
Car sales: GAI
(% y-o-y)
4.6 6.2 6.5 6.2 5.8 5.7 6.2
2.78
6.96
3.794.3
8.7
4.9
4.6
2009 2010 2011 2012 2013E 2014E 2015E
GDP Inflation (YE)%, yoy
Retail Sales
Q3-08 Q2-09 Q1-10 Q4-10 Q3-11 Q2-12 Q1-13 Q4-13
8
6
4
2
0
-2
40
30
20
10
0
-10
% y-o-yGDP growth
Consumption
Investment (RHS)
% y-o-y
Government (RHS)

Untuk Anda, Bisa
Slide 29
External Trade (BPS data)USD bn, %yoy
Positive result on inflation and trade data
Headline Vs. Core Inflation%yoy
Inflation
• Inflation rose to1.07%yoy (8.22%yoy) in Jan due to seasonally high food price and impact of LPG price hike, but the impact in some part was overshadowed by the implementation of the new base year 2012=100 (from previously 2007=100)
• We expect the YE inflation to be relatively low at 4.9%, though still noting some upside risk due to the potentially electricity rate hike for some of the industrial users.
External Trade & BoP
• We see a significantly wider surplus in the trade balance in Dec at USD1.5bn
• The surplus was driven by a jump in exports, though this may be caused by the front-running of raw mineral exports. Imports declined slightly .
BoP
• Expect the CA deficit to record
-3.53%of GDP in 2013. This year the CA deficit may improve to -2.9% of GDP.
Source: BI, CEIC
Balance of Payment (USD Mn)
Source: BPS, CEIC
-15,000
-10,000
-5,000
0
5,000
10,000
15,000
Mar-10
Jun-10
Sep-10
Dec-10
Mar-11
Jun-11
Sep-11
Dec-11
Mar-12
Jun-12
Sep-12
Dec-12
Mar-13
Jun-13
Sep-13
Current Account
Capital and Financial Account
Overall Balance
US$ Mn
-50
-35
-20
-5
10
25
40
55
70
85
-3.0
-2.5
-2.0
-1.5
-1.0
-0.5
0.0
0.5
1.0
1.5
2.0
2.5
3.0
3.5
4.0
010203040506070809101112010203040506070809101112 1 2 3 4 5 6 7 8 9 101112
2011 2012 2013
Trade Balance (lhs)
Export (fob)
Import (cif)
USD bn %YoY
Dec-10 Dec-11 Dec-12 Dec-13
9
8
7
6
5
4
3
Inflation
Headline (%yoy ) Core (%y oy )
Balance of Payment (USD Mn)
Untuk Anda, Bisa
Slide 30
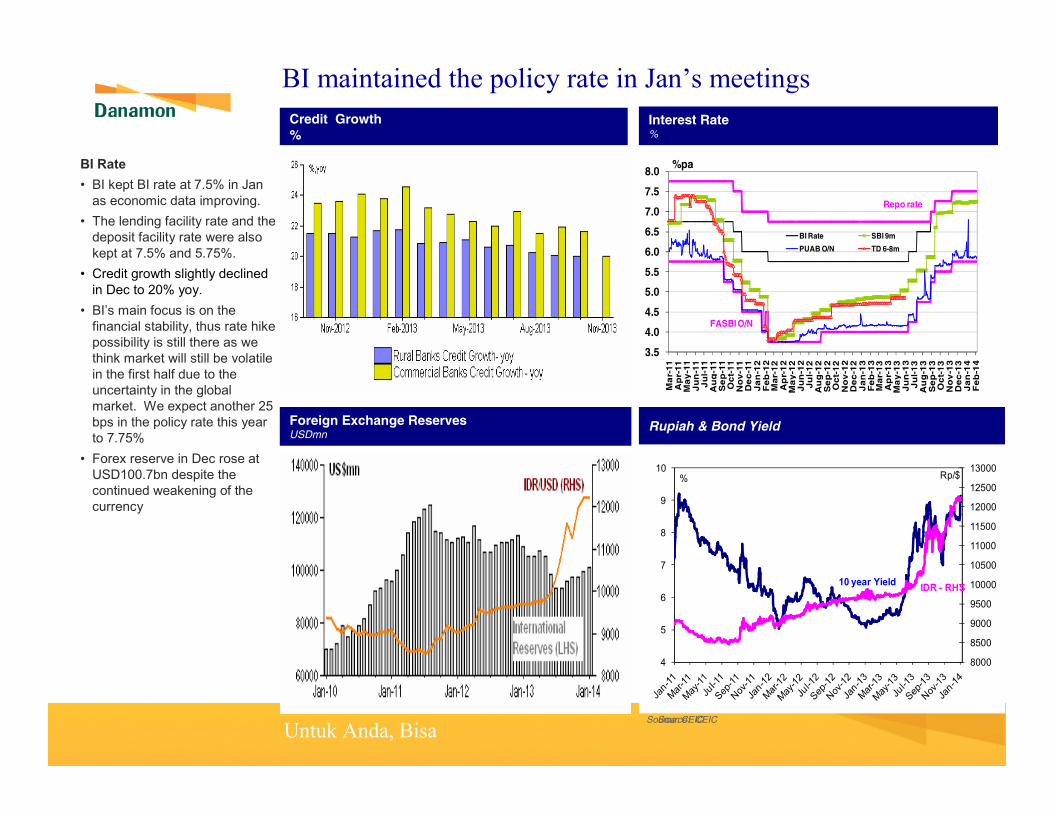
BI maintained the policy rate in Jan’s meetings
Interest Rate%
Source: CEIC
Foreign Exchange ReservesUSDmn
3.5
4.0
4.5
5.0
5.5
6.0
6.5
7.0
7.5
8.0
Mar-11
Apr-11
May-11
Jun-11
Jul-11
Aug-11
Sep-11
Oct-11
Nov-11
Dec-11
Jan-12
Feb-12
Mar-12
Apr-12
May-12
Jun-12
Jul-12
Aug-12
Sep-12
Oct-12
Nov-12
Dec-12
Jan-13
Feb-13
Mar-13
Apr-13
May-13
Jun-13
Jul-13
Aug-13
Sep-13
Oct-13
Nov-13
Dec-13
Jan-14
Feb-14
BI Rate SBI 9m
PUAB O/N TD 6-8m
%pa
FASBI O/N
Repo rate
Source: CEIC
Credit Growth
%
BI Rate
• BI kept BI rate at 7.5% in Jan as economic data improving.
• The lending facility rate and the deposit facility rate were also kept at 7.5% and 5.75%.
• Credit growth slightly declined in Dec to 20% yoy.
• BI’s main focus is on the financial stability, thus rate hike possibility is still there as we think market will still be volatile in the first half due to the uncertainty in the global market. We expect another 25 bps in the policy rate this year to 7.75%
• Forex reserve in Dec rose at USD100.7bn despite the continued weakening of the currency
Rupiah & Bond Yield
8000
8500
9000
9500
10000
10500
11000
11500
12000
12500
13000
4
5
6
7
8
9
10% Rp/$
IDR - RHS10 year Yield

Untuk Anda, Bisa
Slide 31
Agenda
• 2013 Achievement
• Macroeconomy
• Indonesia Banking Sector and Automotive Industry
• Appendix

Untuk Anda, Bisa
Slide 32
Banking and Automotive Industry
ADMF Monthly Market Share
FY13, market share mcy 12.6%; car 5.4%
Automotive Industry
2-Wheeler 8,018 7,047 7,769 10% -12%
4-Wheeler 894 1,116 1,227 10% 5%
FY13FY12YoY B/(W)
FY11Industry ADMF
Unit sales ('000)
Nov-12 Nov-13
Assets 3,653 4,103 4,263 4,818 17% 16% 3.7% 3.6%
Loans 2,200 2,631 2,708 3,214 22% 16% 4.3% 4.1%
Deposits 2,785 3,131 3,225 3,563 14% 16% 2.8% 2.8%
Current accounts 653 736 767 870 18% 28% 1.9% 2.1%
Savings 898 1,012 1,077 1,138 12% 12% 2.5% 2.5%
Time deposits 1,234 1,383 1,381 1,555 12% 14% 3.4% 3.5%
NPAT 75.1 84.9 92.8 98.5 16% 1% 4.2% 3.7%
NIM (%) 5.9 5.5 5.5 4.9 (0.6) (0.4)
LDR (%) 78.8 83.6 83.6 90.0 (6.4) 2.7
NPL (%) 2.2 2.0 1.9 1.9 0.1 0.3
CAR (%) 16.1 17.4 17.4 18.7 1.3 (0.6)
Number of offices 14,797 16,067 16,625 18,303 14% -6%
Dec-11Rp trillion Nov-12 Dec-12Market ShareYoY B/(W)
Industry BDINov-13

Untuk Anda, Bisa
Slide 33
Agenda
• 2013 Achievement
• Macroeconomy
• Indonesia Banking Sector and Automotive Industry
• Appendix

Untuk Anda, Bisa
Slide 34
Danamon Rating
Daily share price and trading volumeBDMN IJ
The ultimate shareholder of AFI is Temasek Holding Pte. Ltd, an
investment holding company based in Singapore.
Ownership Structure
As of 30 December 2013
Number of
Shares
Ownership (%)
Asia Financial (Indonesia) Pte, Ltd. 6,457,558,472 67.4%
JPMCB - Franklin Templeton Inv.
Funds
613,019,888 6.4%
Public < 5% 2,514,065,005 26.2%
Total 9,584,643,365 100.00%
Danamon
PEFINDO
August 2013
Outlook Stable
LT General Obligation idAA+
Standard &
Poor’s
December 2013
Outlook
LT Foreign Issuer Credit
ST Foreign Issuer Credit
Stable
BB
B
LT Local Issuer Credit
ST Local Issuer Credit
BB
B
Fitch’s
August 2013
Outlook
LT Issuer Default Rating
ST Issuer Default Rating
Individual Rating
Support Rating
Viability
Stable
BB+
B
WD
3
bb+
National Long Term AA+ (idn)
Moody’s
October 2013
Outlook
Long Term Rating
Foreicn LT Bank Deposits
Local LT Bank Deposits
Bank Financial Strength
Foreign Currency ST Dept
Local Currency ST Debt
Stable
Baa3
Baa3
Baa3
D
P-3
P-3
0
10,000
20,000
30,000
40,000
50,000
60,000
Jun-13 Jul-13 Aug-13 Sep-13 Oct-13 Nov-13 Dec-13
0
2,500
5,000
7,500Volume('000)Share Price

Untuk Anda, Bisa
Slide 35
Reconciliation with Newsletter
a b c d e f g h i
Net Interest
Income
Net Under-
writing
Income
Net Sharia
Interest
Income
Other
Operating
Income
Other
Operating
Expenses
Non Operating
Income
Non
Operating
Loss
Income
before Tax Taxes
Minority
Interest Income after Minority Interest
13,600 487 121 8,947 (17,550) - (75) 5,530 (1,371) (118) 4,042
a+c b+d e f+g h i
Net Interest
Income
Non-
Interest
Income
Operating
Income
Operating
Expenses
Pre-
Provision
Operating
Profit Cost of Credit
Non
Operating
Income/
(Loss) Taxes
Minority
Interest
Net Profit
after Tax
and
Minority
Interest Remark
13,720 9,435 23,155 (17,550) 5,605 - (75) (1,371) (118) 4,042
(189) (189) 189 - - LPS Deposit Insurance
- - (3) 3 - Loss on reposess assets
(27) (27) (27) 27 - Provision for ADMF acquisition cost
(139) (139) (139) 139 - Write off on amortization cost
(177) (177) 177 - - ADMF indirect acquisition cost
(3,777) (3,777) 3,777 - - Decrease in fair value of financial assets (MTM)
(9) (9) 9 - - Losses from sale of financial assets (marketable securities)
(6) (6) 6 - - - Losses from spot and derivative transaction (realised)
- 3,347 3,347 (3,347) - Impairment losses on financial assets
(354) (354) 354 - - Fees/commissions and administrative expenses
- 1 1 (1) - Allowance for possible losses on non earning assets
(16) (16) (4) (21) 21 - Others
13,531 4,929 18,460 (9,695) 8,766 (3,184) (52) (1,371) (118) 4,042
Newsletter
Analyst Briefing Presentation

Untuk Anda, Bisa
Slide 36
Thank You
Investor RelationsPT Bank Danamon Indonesia, TbkMenara Bank Danamon, 6th Floor
Jl. Prof. Dr. Satrio Kav. E4 No.6
Mega Kuningan, Jakarta 12950
Phone: +62 21 5799 1001-03Fax: +62 21 5799 1445
Email: [email protected]
IR Contacts:
Kienata – [email protected] Hermawan – [email protected]
Ridy Sudarma – [email protected]
Noorvia Kesuma – [email protected]
Disclaimer:This report has been prepared by PT Bank Danamon Indonesia Tbk independently and is circulated for the purpose of general information only. It is not intended to the specific person who may receive this report. The information in this report has been obtained from sources which we deem reliable. No warranty (expressed or implied) is made to the accuracy or completeness of the information. All opinions and estimates included in this report constitute our judgment as of this date and are subject to change without prior notice. We disclaim any responsibility or liability (expressed or implied) of PT Bank Danamon Indonesia Tbk and/or its affiliated companies and/or their respective employees and/or agents whatsoever and howsoever arising which may be brought against or suffered by any person as a result of acting in reliance upon the whole or any part of the contents of this report and neither PT Bank Danamon Indonesia Tbk and/or its affiliated companies and/or their respective employees and/or agents accepts liability for any errors, omissions or mis-statements, negligent or otherwise, in this report andany inaccuracy herein or omission here from which might otherwise arise.