PT ABM Investama Tbk · PT ABM Investama Tbk (ABM) is an integrated energy company involved in...
82
1H 2014 Result Company Presentation PT ABM Investama Tbk
Transcript of PT ABM Investama Tbk · PT ABM Investama Tbk (ABM) is an integrated energy company involved in...
1H 2014 Result Company Presentation
PT ABM Investama Tbk
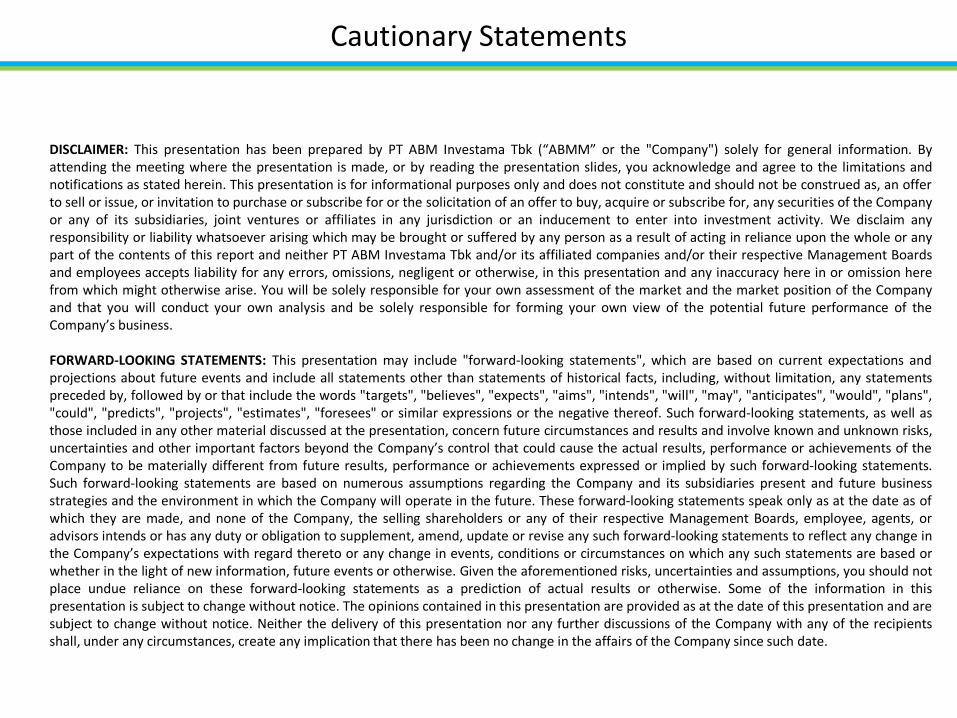
DISCLAIMER: This presentation has been prepared by PT ABM Investama Tbk (“ABMM” or the "Company") solely for general information. By attending the meeting where the presentation is made, or by reading the presentation slides, you acknowledge and agree to the limitations and notifications as stated herein. This presentation is for informational purposes only and does not constitute and should not be construed as, an offer to sell or issue, or invitation to purchase or subscribe for or the solicitation of an offer to buy, acquire or subscribe for, any securities of the Company or any of its subsidiaries, joint ventures or affiliates in any jurisdiction or an inducement to enter into investment activity. We disclaim any responsibility or liability whatsoever arising which may be brought or suffered by any person as a result of acting in reliance upon the whole or any part of the contents of this report and neither PT ABM Investama Tbk and/or its affiliated companies and/or their respective Management Boards and employees accepts liability for any errors, omissions, negligent or otherwise, in this presentation and any inaccuracy here in or omission here from which might otherwise arise. You will be solely responsible for your own assessment of the market and the market position of the Company and that you will conduct your own analysis and be solely responsible for forming your own view of the potential future performance of the Company’s business. FORWARD-LOOKING STATEMENTS: This presentation may include "forward-looking statements", which are based on current expectations and projections about future events and include all statements other than statements of historical facts, including, without limitation, any statements preceded by, followed by or that include the words "targets", "believes", "expects", "aims", "intends", "will", "may", "anticipates", "would", "plans", "could", "predicts", "projects", "estimates", "foresees" or similar expressions or the negative thereof. Such forward-looking statements, as well as those included in any other material discussed at the presentation, concern future circumstances and results and involve known and unknown risks, uncertainties and other important factors beyond the Company’s control that could cause the actual results, performance or achievements of the Company to be materially different from future results, performance or achievements expressed or implied by such forward-looking statements. Such forward-looking statements are based on numerous assumptions regarding the Company and its subsidiaries present and future business strategies and the environment in which the Company will operate in the future. These forward-looking statements speak only as at the date as of which they are made, and none of the Company, the selling shareholders or any of their respective Management Boards, employee, agents, or advisors intends or has any duty or obligation to supplement, amend, update or revise any such forward-looking statements to reflect any change in the Company’s expectations with regard thereto or any change in events, conditions or circumstances on which any such statements are based or whether in the light of new information, future events or otherwise. Given the aforementioned risks, uncertainties and assumptions, you should not place undue reliance on these forward-looking statements as a prediction of actual results or otherwise. Some of the information in this presentation is subject to change without notice. The opinions contained in this presentation are provided as at the date of this presentation and are subject to change without notice. Neither the delivery of this presentation nor any further discussions of the Company with any of the recipients shall, under any circumstances, create any implication that there has been no change in the affairs of the Company since such date.
Cautionary Statements
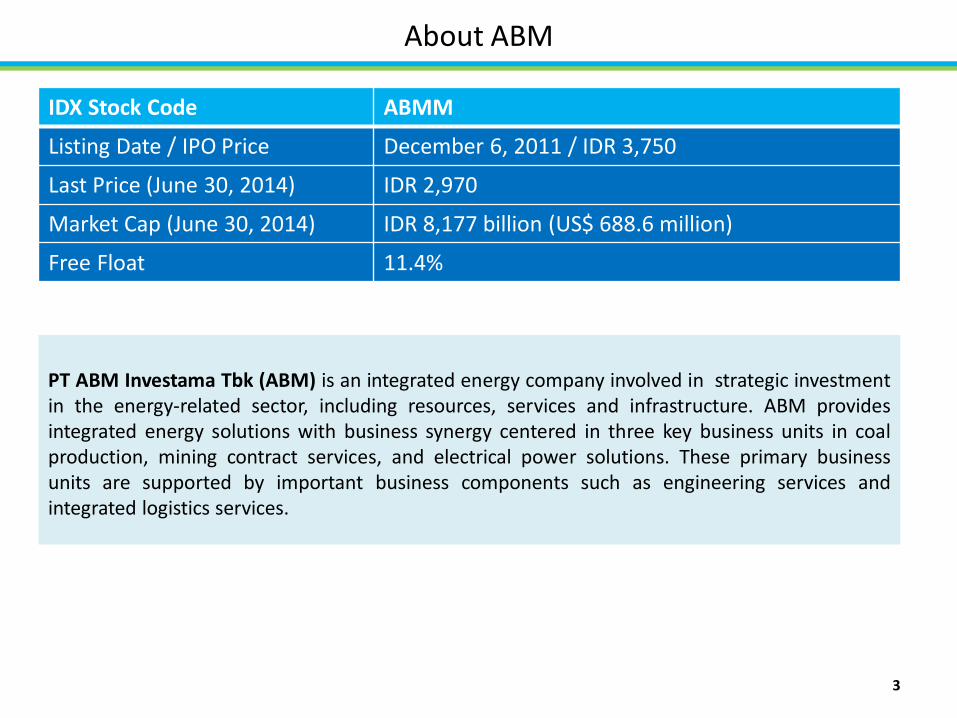
PT ABM Investama Tbk (ABM) is an integrated energy company involved in strategic investment in the energy-related sector, including resources, services and infrastructure. ABM provides integrated energy solutions with business synergy centered in three key business units in coal production, mining contract services, and electrical power solutions. These primary business units are supported by important business components such as engineering services and integrated logistics services.
IDX Stock Code ABMM
Listing Date / IPO Price December 6, 2011 / IDR 3,750
Last Price (June 30, 2014) IDR 2,970
Market Cap (June 30, 2014) IDR 8,177 billion (US$ 688.6 million)
Free Float 11.4%
About ABM
3
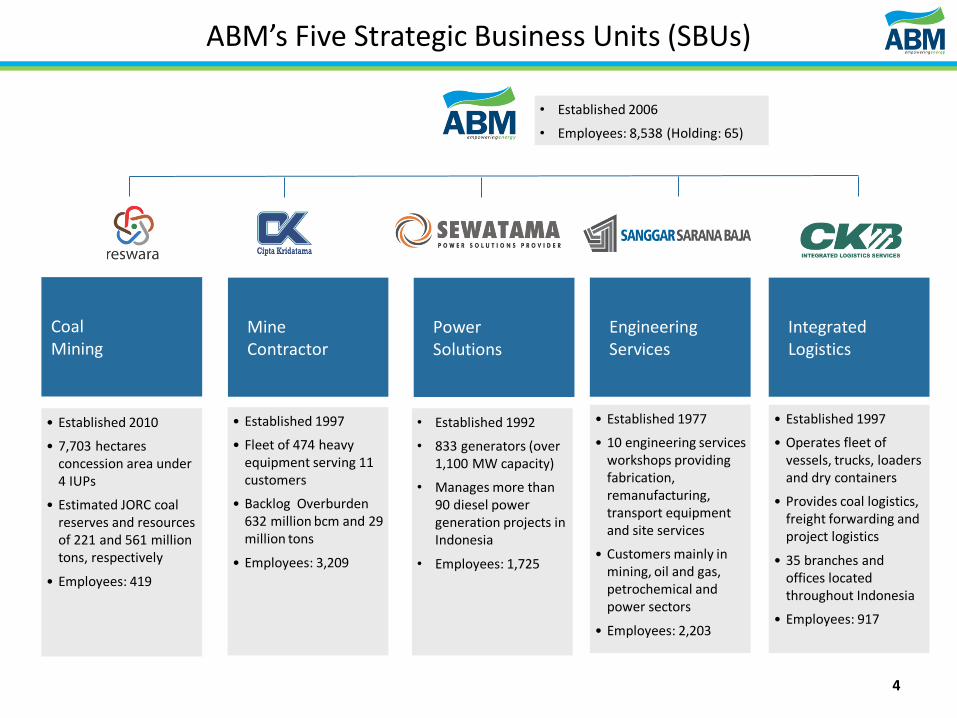
Engineering Services
Integrated Logistics
Power Solutions
Mine Contractor
Coal Mining
• Established 2010
• 7,703 hectares concession area under 4 IUPs
• Estimated JORC coal reserves and resources of 221 and 561 million tons, respectively
• Employees: 419
• Established 1997
• Fleet of 474 heavy equipment serving 11 customers
• Backlog Overburden 632 million bcm and 29 million tons
• Employees: 3,209
• Established 1992
• 833 generators (over 1,100 MW capacity)
• Manages more than 90 diesel power generation projects in Indonesia
• Employees: 1,725
• Established 1997
• Operates fleet of vessels, trucks, loaders and dry containers
• Provides coal logistics, freight forwarding and project logistics
• 35 branches and offices located throughout Indonesia
• Employees: 917
• Established 1977
• 10 engineering services workshops providing fabrication, remanufacturing, transport equipment and site services
• Customers mainly in mining, oil and gas, petrochemical and power sectors
• Employees: 2,203
ABM’s Five Strategic Business Units (SBUs)
4
• Established 2006
• Employees: 8,538 (Holding: 65)
Operational Highlights Financial Highlights Strategy and Mitigations Appendices
Recent Updates 6
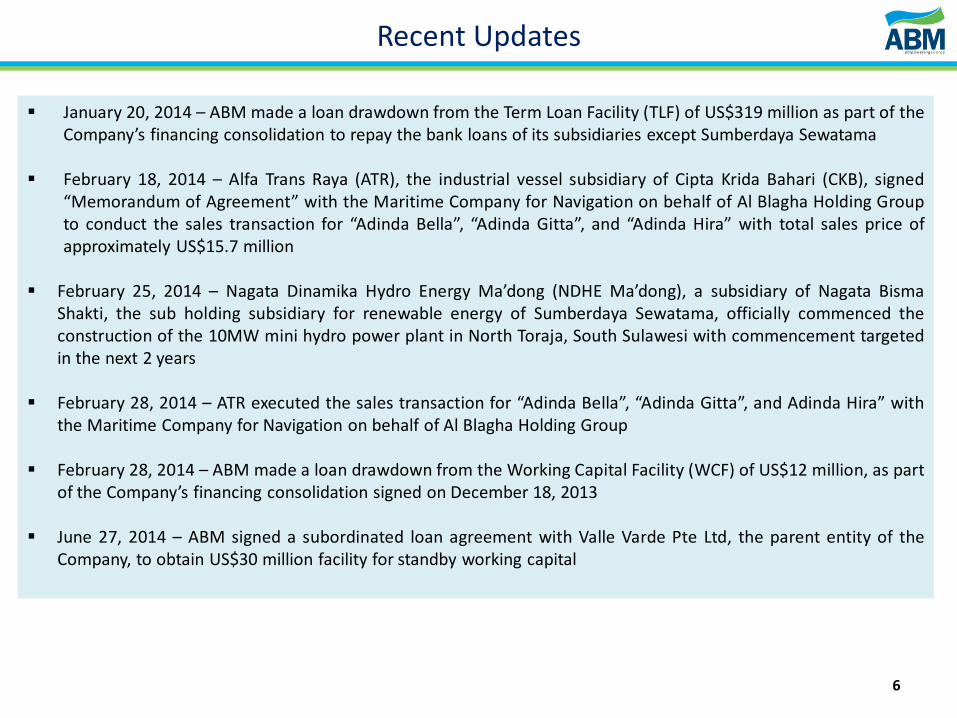
Recent Updates
January 20, 2014 – ABM made a loan drawdown from the Term Loan Facility (TLF) of US$319 million as part of the Company’s financing consolidation to repay the bank loans of its subsidiaries except Sumberdaya Sewatama
February 18, 2014 – Alfa Trans Raya (ATR), the industrial vessel subsidiary of Cipta Krida Bahari (CKB), signed “Memorandum of Agreement” with the Maritime Company for Navigation on behalf of Al Blagha Holding Group to conduct the sales transaction for “Adinda Bella”, “Adinda Gitta”, and “Adinda Hira” with total sales price of approximately US$15.7 million
February 25, 2014 – Nagata Dinamika Hydro Energy Ma’dong (NDHE Ma’dong), a subsidiary of Nagata Bisma
Shakti, the sub holding subsidiary for renewable energy of Sumberdaya Sewatama, officially commenced the construction of the 10MW mini hydro power plant in North Toraja, South Sulawesi with commencement targeted in the next 2 years
February 28, 2014 – ATR executed the sales transaction for “Adinda Bella”, “Adinda Gitta”, and Adinda Hira” with the Maritime Company for Navigation on behalf of Al Blagha Holding Group
February 28, 2014 – ABM made a loan drawdown from the Working Capital Facility (WCF) of US$12 million, as part of the Company’s financing consolidation signed on December 18, 2013
June 27, 2014 – ABM signed a subordinated loan agreement with Valle Varde Pte Ltd, the parent entity of the Company, to obtain US$30 million facility for standby working capital
6
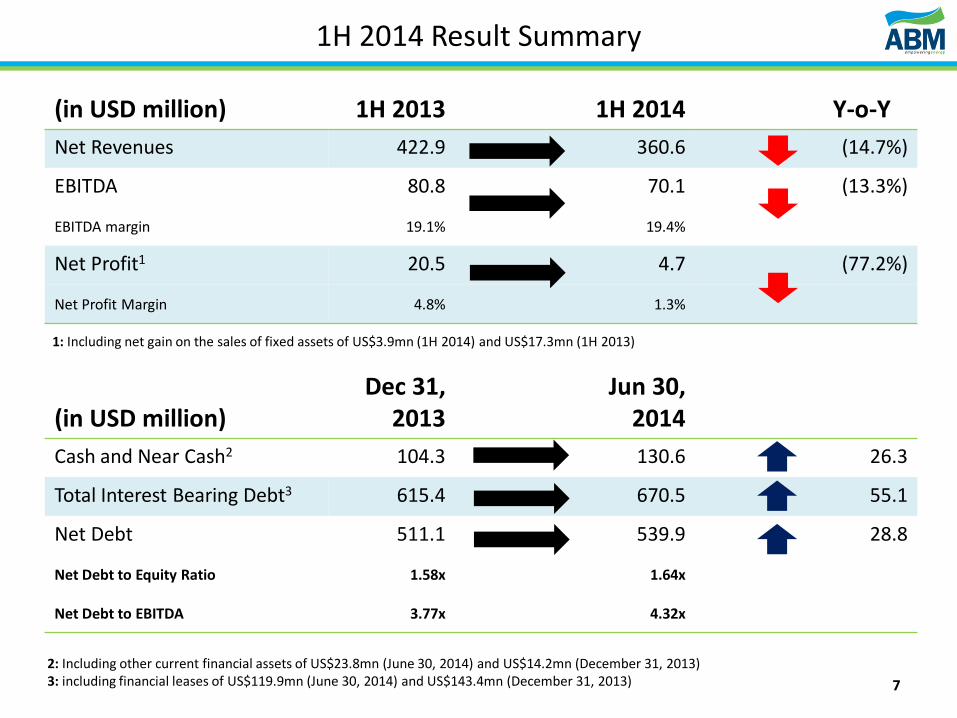
(in USD million) 1H 2013 1H 2014 Y-o-Y
Net Revenues 422.9 360.6 (14.7%)
EBITDA 80.8 70.1 (13.3%)
EBITDA margin 19.1% 19.4%
Net Profit1 20.5 4.7 (77.2%)
Net Profit Margin 4.8% 1.3%
(in USD million)
Dec 31, 2013
Jun 30, 2014
Cash and Near Cash2 104.3 130.6 26.3
Total Interest Bearing Debt3 615.4 670.5 55.1
Net Debt 511.1 539.9 28.8
Net Debt to Equity Ratio 1.58x 1.64x
Net Debt to EBITDA 3.77x 4.32x
1H 2014 Result Summary
7
1: Including net gain on the sales of fixed assets of US$3.9mn (1H 2014) and US$17.3mn (1H 2013)
2: Including other current financial assets of US$23.8mn (June 30, 2014) and US$14.2mn (December 31, 2013) 3: including financial leases of US$119.9mn (June 30, 2014) and US$143.4mn (December 31, 2013)
Recent Updates Financial Highlights Strategy and Mitigations Appendices
Operational Highlights 9
Operational Highlights
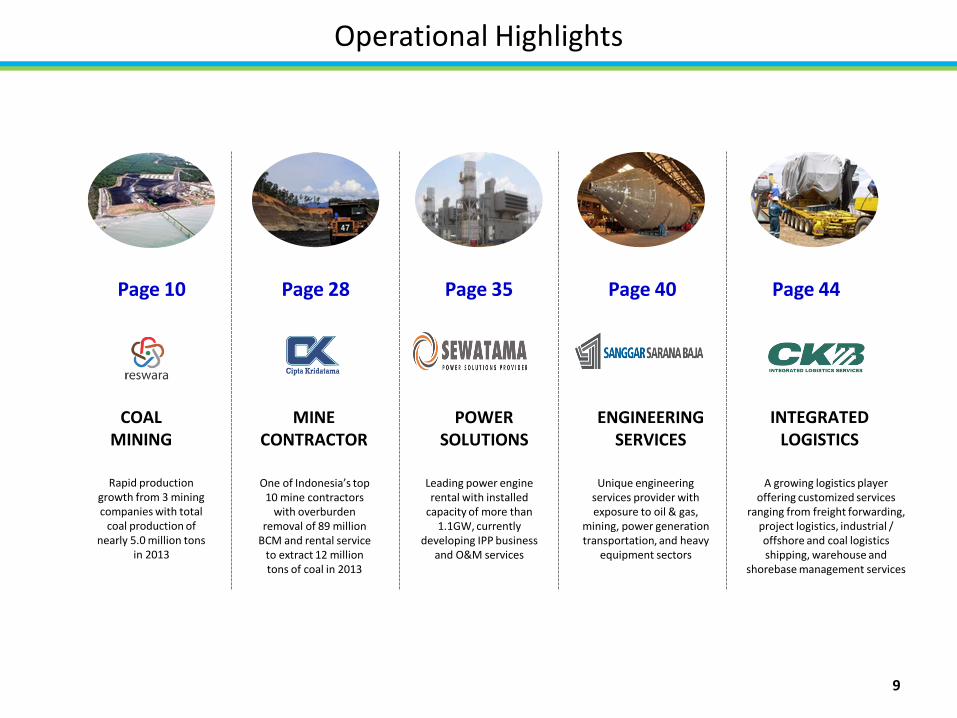
Page 10 Page 28 Page 35 Page 40 Page 44
COAL MINING
MINE CONTRACTOR
POWER SOLUTIONS
ENGINEERING SERVICES
INTEGRATED LOGISTICS
Rapid production growth from 3 mining companies with total
coal production of nearly 5.0 million tons
in 2013
One of Indonesia’s top 10 mine contractors
with overburden removal of 89 million
BCM and rental service to extract 12 million tons of coal in 2013
Leading power engine rental with installed
capacity of more than 1.1GW, currently
developing IPP business and O&M services
Unique engineering services provider with exposure to oil & gas,
mining, power generation transportation, and heavy
equipment sectors
A growing logistics player offering customized services
ranging from freight forwarding, project logistics, industrial / offshore and coal logistics shipping, warehouse and
shorebase management services
9
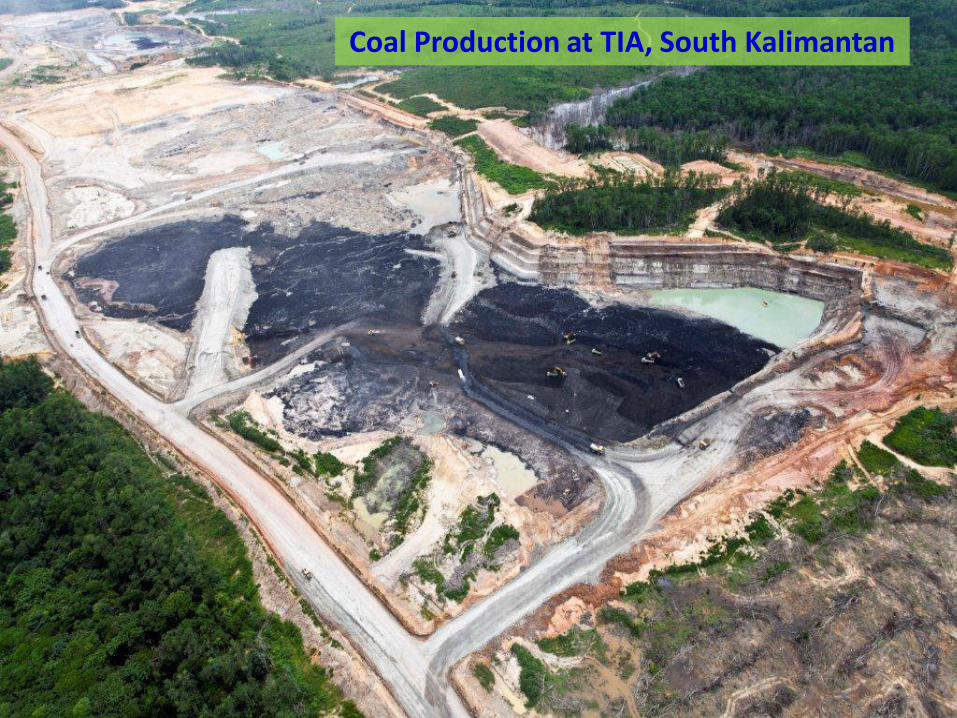
Coal Production at TIA, South Kalimantan
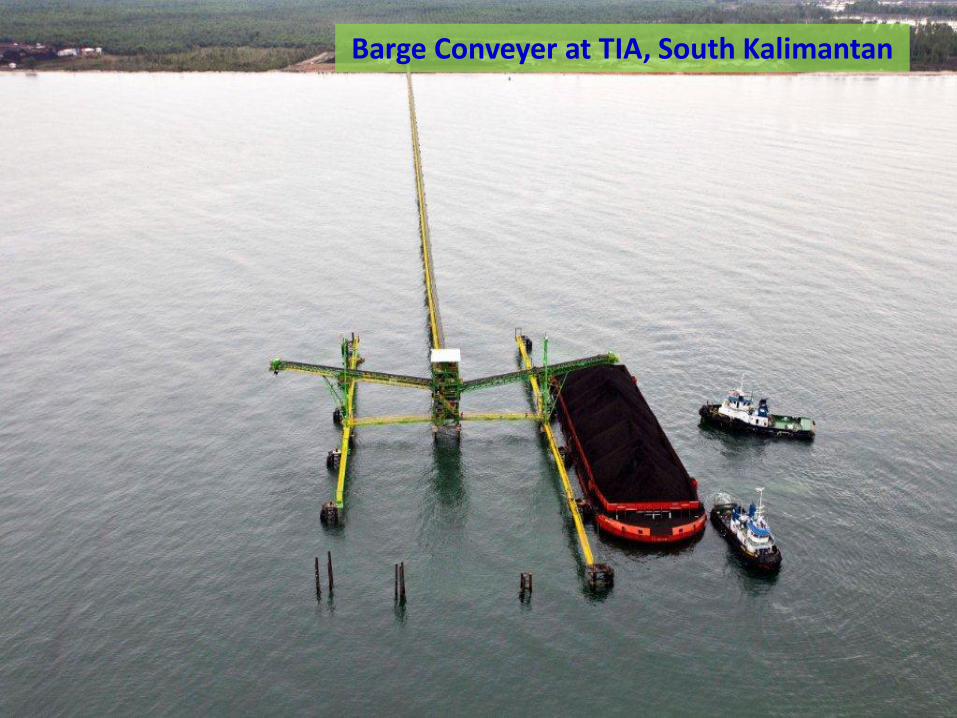
Barge Conveyer at TIA, South Kalimantan
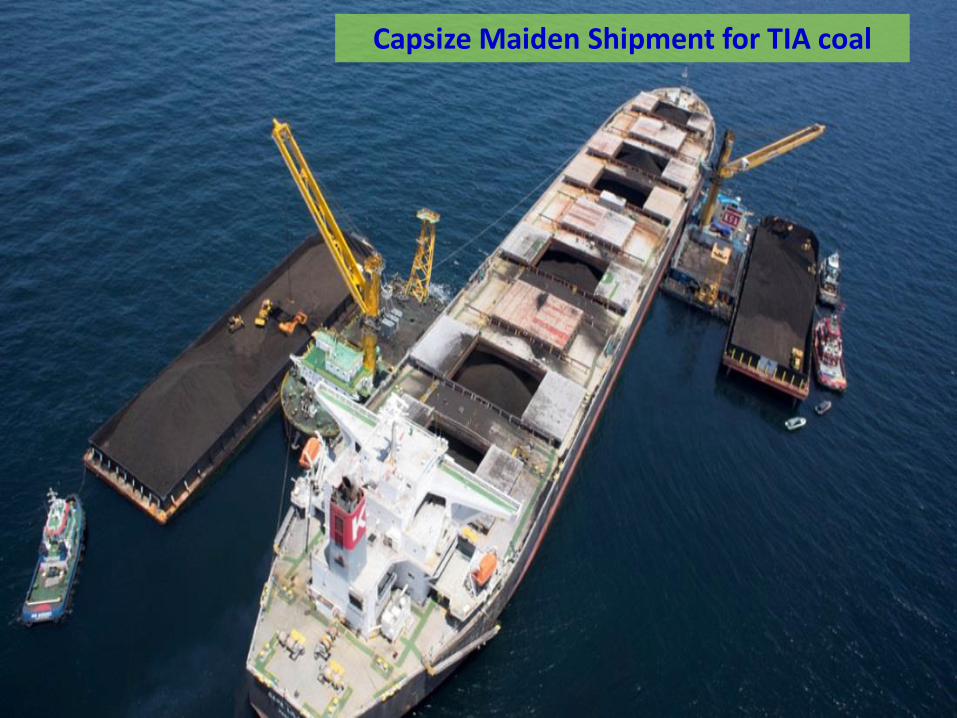
Capsize Maiden Shipment for TIA coal
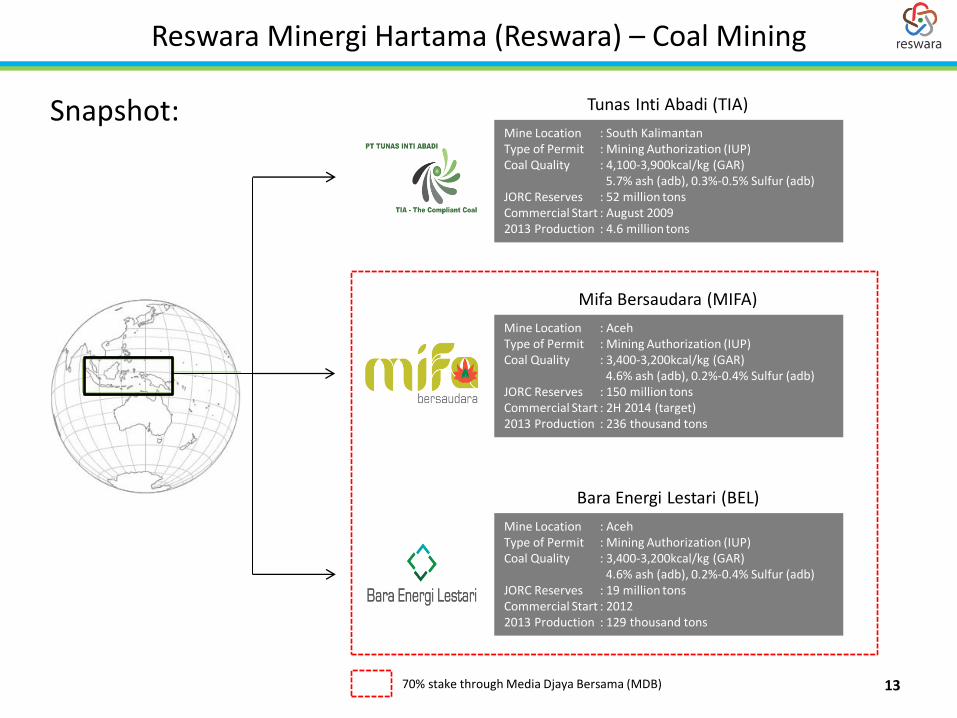
Reswara Minergi Hartama (Reswara) – Coal Mining
Snapshot: Mine Location : South Kalimantan Type of Permit : Mining Authorization (IUP) Coal Quality : 4,100-3,900kcal/kg (GAR) 5.7% ash (adb), 0.3%-0.5% Sulfur (adb) JORC Reserves : 52 million tons Commercial Start : August 2009 2013 Production : 4.6 million tons
Tunas Inti Abadi (TIA)
Mifa Bersaudara (MIFA)
Mine Location : Aceh Type of Permit : Mining Authorization (IUP) Coal Quality : 3,400-3,200kcal/kg (GAR) 4.6% ash (adb), 0.2%-0.4% Sulfur (adb) JORC Reserves : 150 million tons Commercial Start : 2H 2014 (target) 2013 Production : 236 thousand tons
Bara Energi Lestari (BEL)
Mine Location : Aceh Type of Permit : Mining Authorization (IUP) Coal Quality : 3,400-3,200kcal/kg (GAR) 4.6% ash (adb), 0.2%-0.4% Sulfur (adb) JORC Reserves : 19 million tons Commercial Start : 2012 2013 Production : 129 thousand tons
70% stake through Media Djaya Bersama (MDB) 13
Reswara Minergi Hartama (Reswara) – Coal Mining
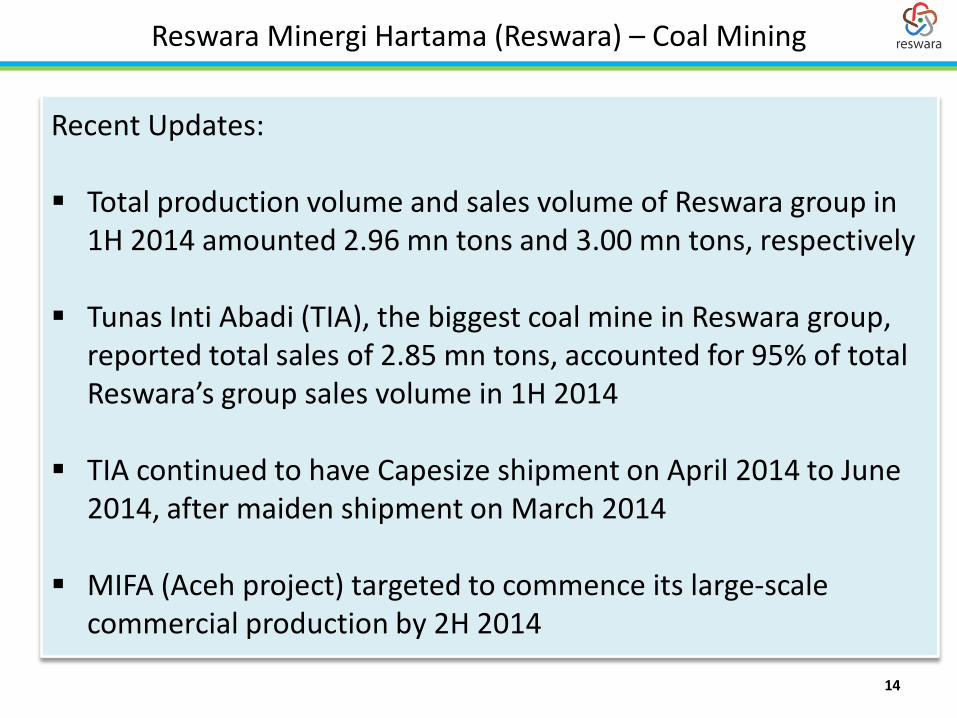
Recent Updates: Total production volume and sales volume of Reswara group in
1H 2014 amounted 2.96 mn tons and 3.00 mn tons, respectively
Tunas Inti Abadi (TIA), the biggest coal mine in Reswara group, reported total sales of 2.85 mn tons, accounted for 95% of total Reswara’s group sales volume in 1H 2014
TIA continued to have Capesize shipment on April 2014 to June 2014, after maiden shipment on March 2014
MIFA (Aceh project) targeted to commence its large-scale commercial production by 2H 2014
14
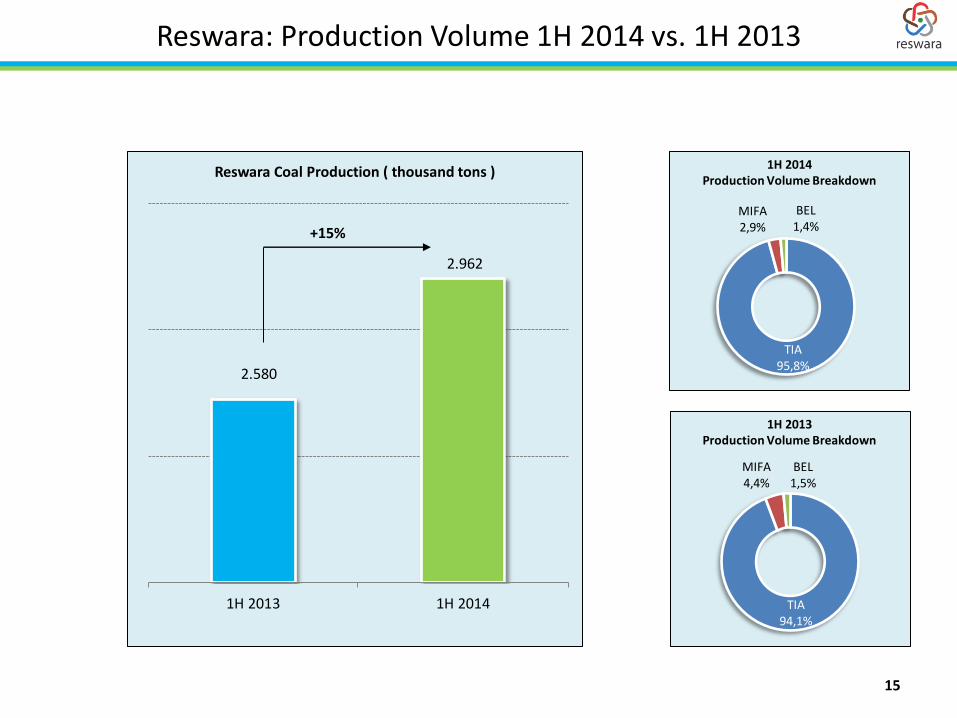
Reswara: Production Volume 1H 2014 vs. 1H 2013
2.580
2.962
1H 2013 1H 2014
Reswara Coal Production ( thousand tons )
15
TIA 95,8%
MIFA 2,9%
BEL 1,4%
1H 2014 Production Volume Breakdown
TIA 94,1%
MIFA 4,4%
BEL 1,5%
1H 2013 Production Volume Breakdown
+15%
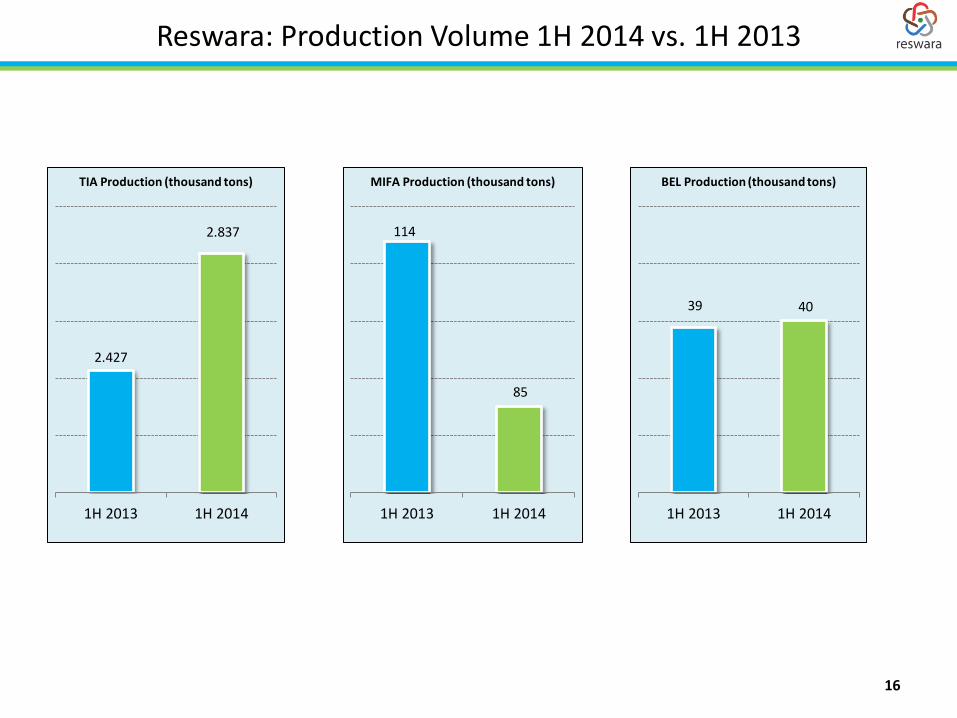
Reswara: Production Volume 1H 2014 vs. 1H 2013
2.427
2.837
1H 2013 1H 2014
TIA Production (thousand tons)
114
85
1H 2013 1H 2014
MIFA Production (thousand tons)
39 40
1H 2013 1H 2014
BEL Production (thousand tons)
16
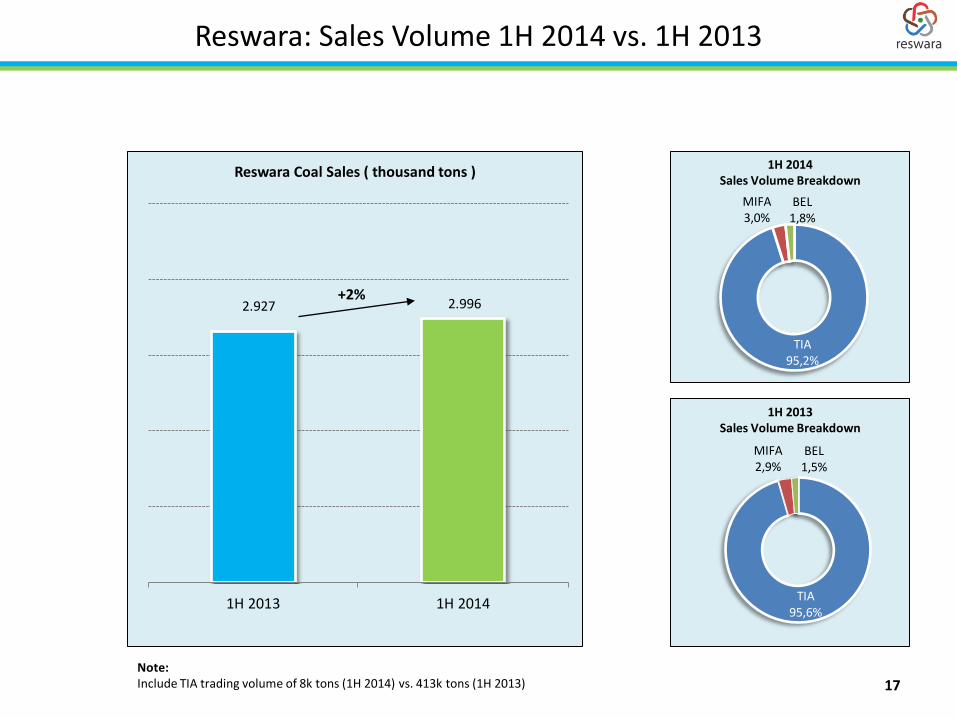
Reswara: Sales Volume 1H 2014 vs. 1H 2013
2.927 2.996
1H 2013 1H 2014
Reswara Coal Sales ( thousand tons )
17
TIA 95,2%
MIFA 3,0%
BEL 1,8%
1H 2014 Sales Volume Breakdown
TIA 95,6%
MIFA 2,9%
BEL 1,5%
1H 2013 Sales Volume Breakdown
Note: Include TIA trading volume of 8k tons (1H 2014) vs. 413k tons (1H 2013)
+2%
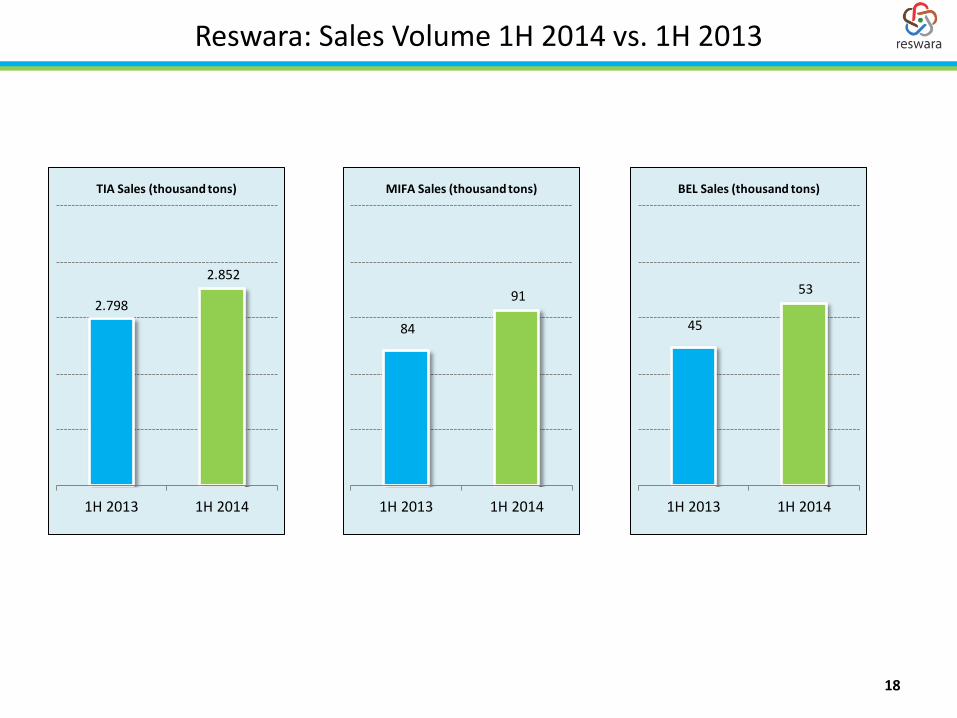
Reswara: Sales Volume 1H 2014 vs. 1H 2013
2.798
2.852
1H 2013 1H 2014
TIA Sales (thousand tons)
84
91
1H 2013 1H 2014
MIFA Sales (thousand tons)
45
53
1H 2013 1H 2014
BEL Sales (thousand tons)
18
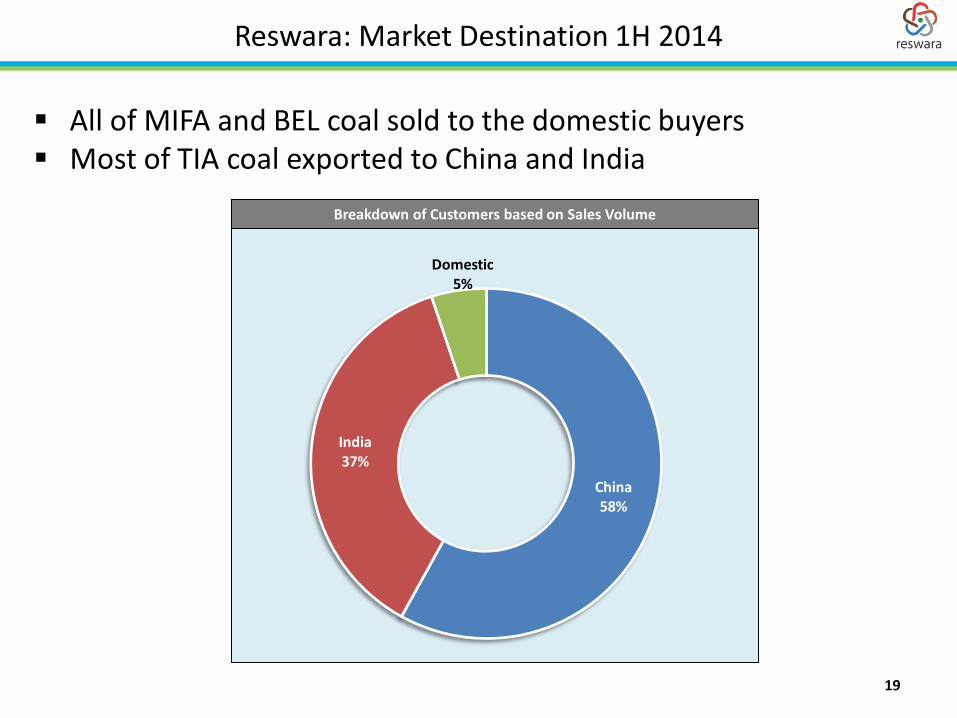
Reswara: Market Destination 1H 2014
All of MIFA and BEL coal sold to the domestic buyers Most of TIA coal exported to China and India
19
China 58%
India 37%
Domestic 5%
Breakdown of Customers based on Sales Volume
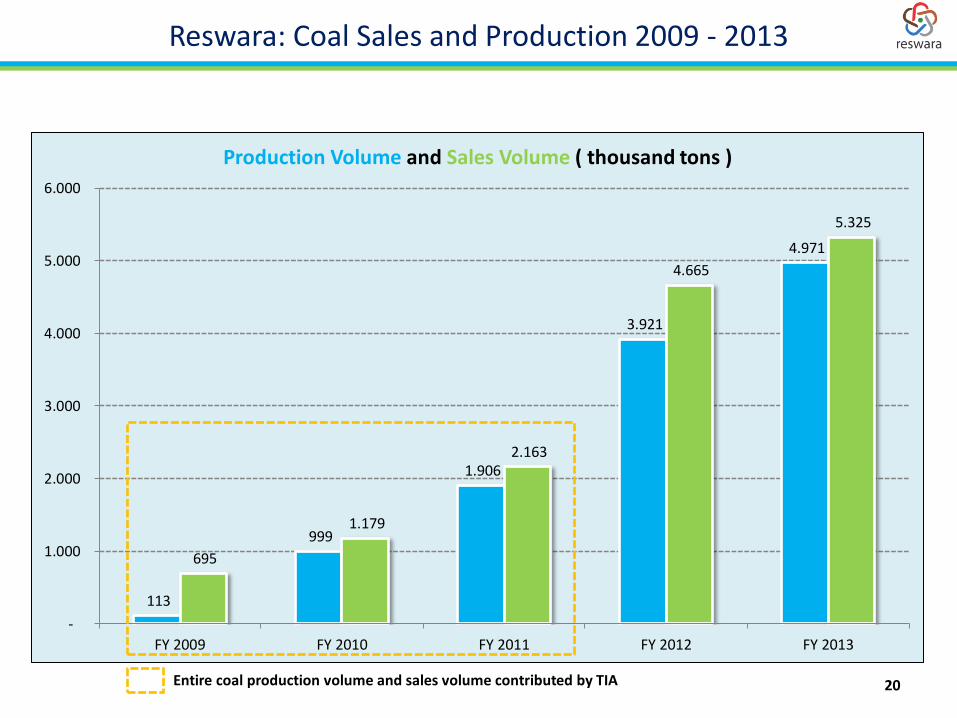
Reswara: Coal Sales and Production 2009 - 2013
113
999
1.906
3.921
4.971
695
1.179
2.163
4.665
5.325
-
1.000
2.000
3.000
4.000
5.000
6.000
FY 2009 FY 2010 FY 2011 FY 2012 FY 2013
Production Volume and Sales Volume ( thousand tons )
Entire coal production volume and sales volume contributed by TIA 20
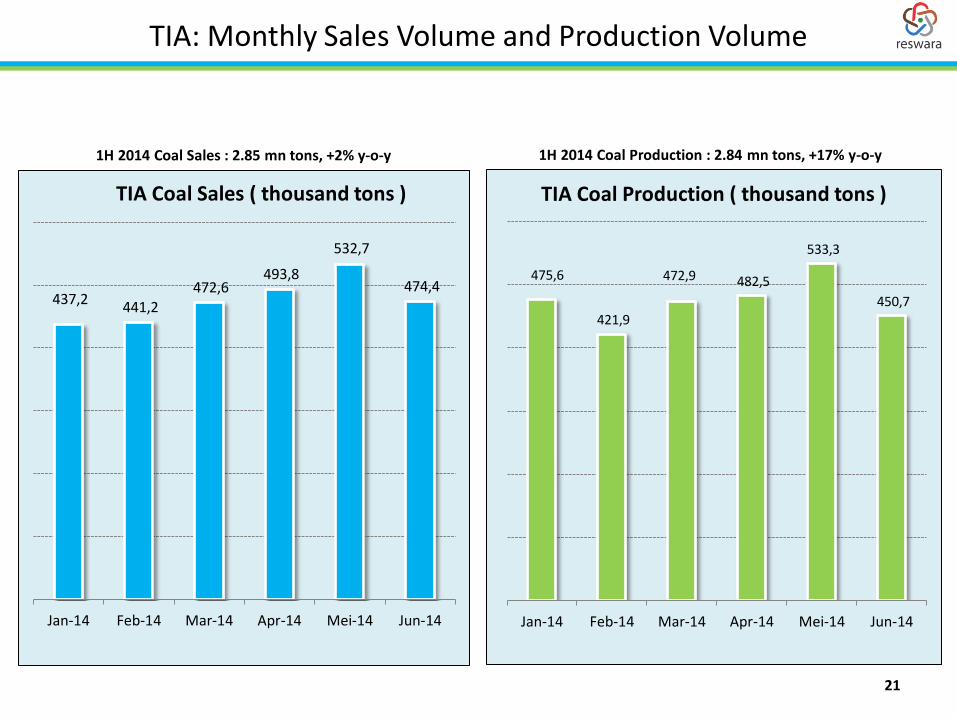
TIA: Monthly Sales Volume and Production Volume
437,2 441,2
472,6 493,8
532,7
474,4
Jan-14 Feb-14 Mar-14 Apr-14 Mei-14 Jun-14
TIA Coal Sales ( thousand tons )
475,6
421,9
472,9 482,5
533,3
450,7
Jan-14 Feb-14 Mar-14 Apr-14 Mei-14 Jun-14
TIA Coal Production ( thousand tons )
1H 2014 Coal Sales : 2.85 mn tons, +2% y-o-y 1H 2014 Coal Production : 2.84 mn tons, +17% y-o-y
21
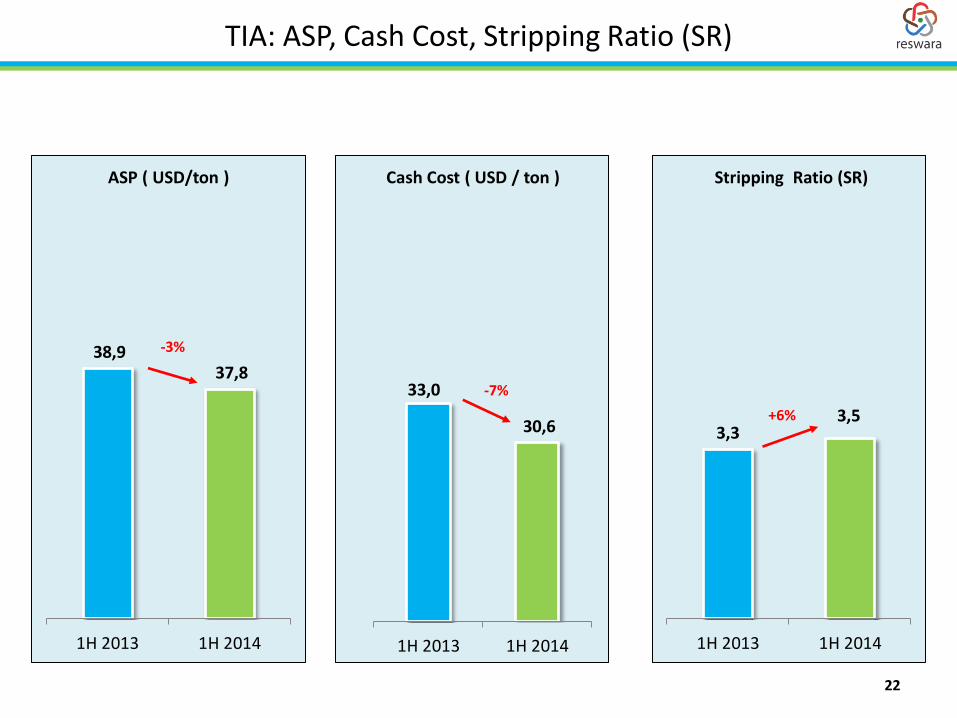
TIA: ASP, Cash Cost, Stripping Ratio (SR)
38,9 37,8
1H 2013 1H 2014
ASP ( USD/ton )
33,0
30,6
1H 2013 1H 2014
Cash Cost ( USD / ton )
-7%
3,3 3,5
1H 2013 1H 2014
Stripping Ratio (SR)
+6%
22
-3%
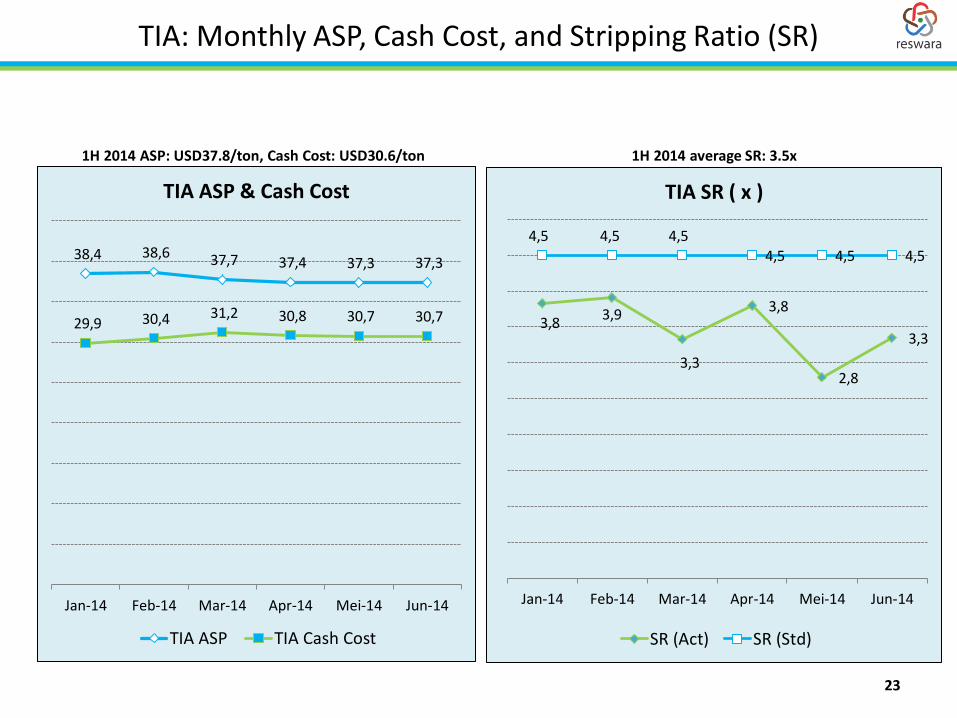
TIA: Monthly ASP, Cash Cost, and Stripping Ratio (SR)
1H 2014 ASP: USD37.8/ton, Cash Cost: USD30.6/ton 1H 2014 average SR: 3.5x
38,4 38,6 37,7 37,4 37,3 37,3
29,9 30,4 31,2 30,8 30,7 30,7
Jan-14 Feb-14 Mar-14 Apr-14 Mei-14 Jun-14
TIA ASP & Cash Cost
TIA ASP TIA Cash Cost
3,8 3,9
3,3
3,8
2,8
3,3
4,5 4,5 4,5 4,5 4,5 4,5
Jan-14 Feb-14 Mar-14 Apr-14 Mei-14 Jun-14
TIA SR ( x )
SR (Act) SR (Std)
23
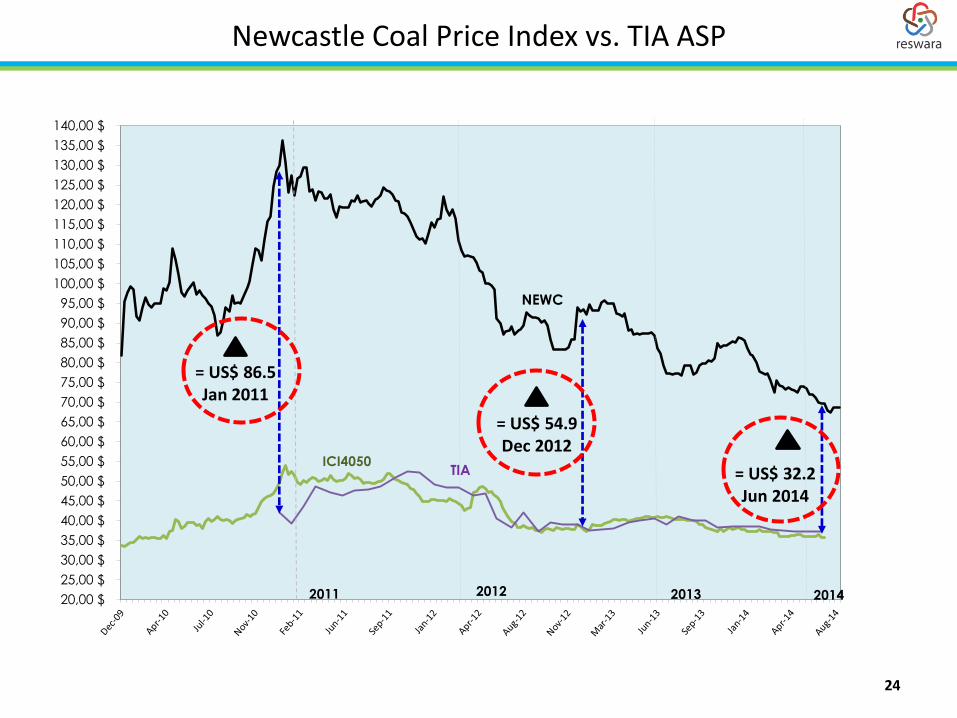
Newcastle Coal Price Index vs. TIA ASP
24
20,00 $
25,00 $
30,00 $
35,00 $
40,00 $
45,00 $
50,00 $
55,00 $
60,00 $
65,00 $
70,00 $
75,00 $
80,00 $
85,00 $
90,00 $
95,00 $
100,00 $
105,00 $
110,00 $
115,00 $
120,00 $
125,00 $
130,00 $
135,00 $
140,00 $
2011 2012
NEWC
2013
ICI4050 TIA
2014
= US$ 86.5 Jan 2011
= US$ 54.9 Dec 2012
= US$ 32.2 Jun 2014
MDB Project Update: 1H 2014
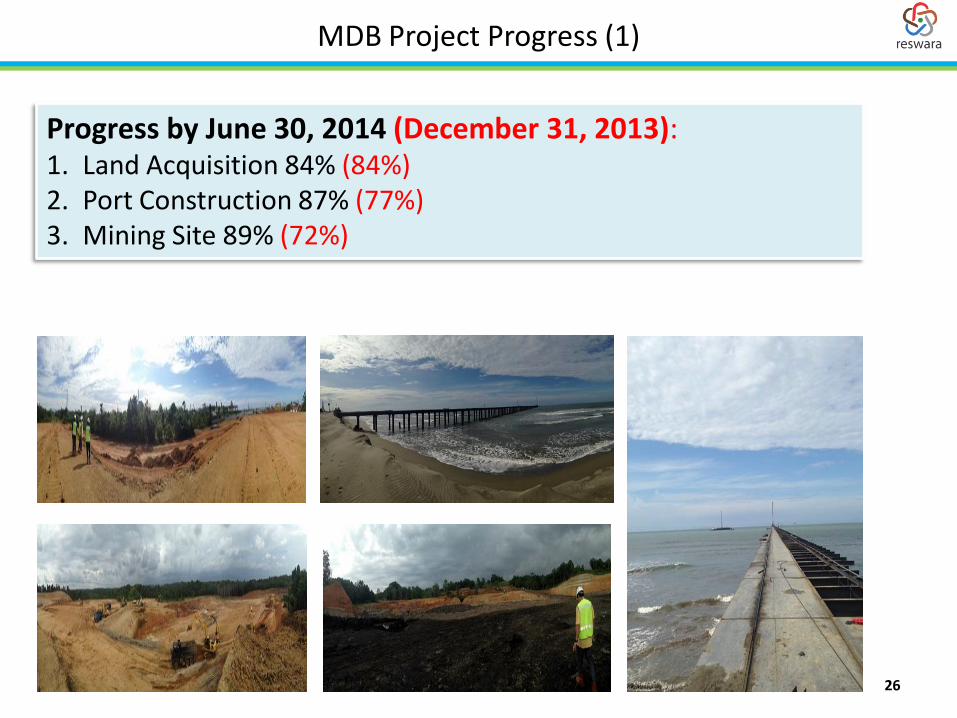
MDB Project Progress (1)
Progress by June 30, 2014 (December 31, 2013): 1. Land Acquisition 84% (84%) 2. Port Construction 87% (77%) 3. Mining Site 89% (72%)
26
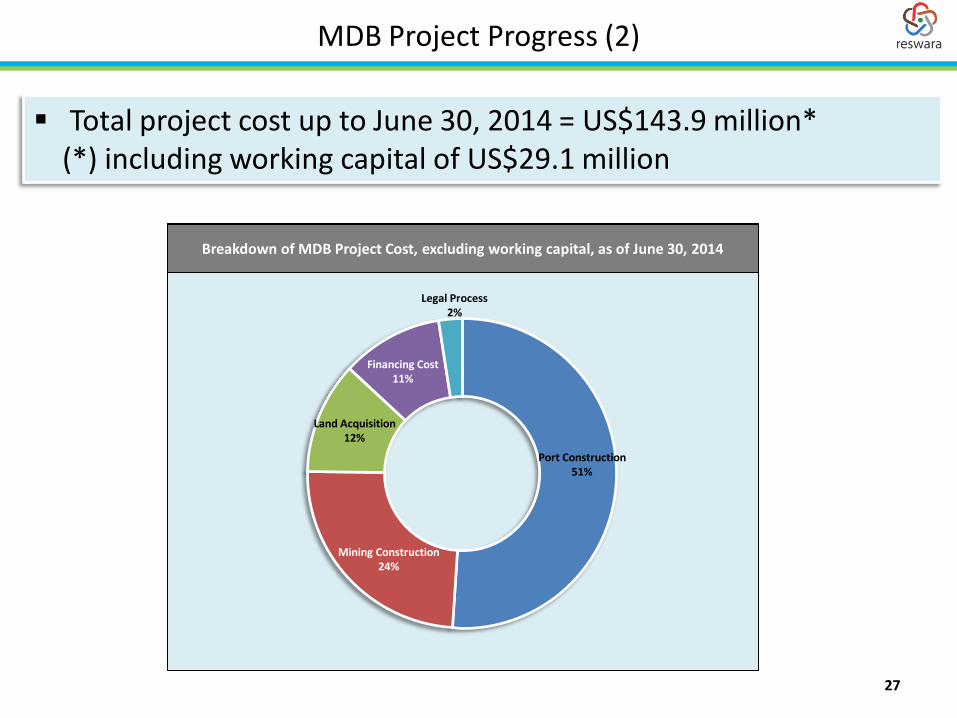
MDB Project Progress (2)
Total project cost up to June 30, 2014 = US$143.9 million* (*) including working capital of US$29.1 million
27
Port Construction 51%
Mining Construction 24%
Land Acquisition 12%
Financing Cost 11%
Legal Process 2%
Breakdown of MDB Project Cost, excluding working capital, as of June 30, 2014
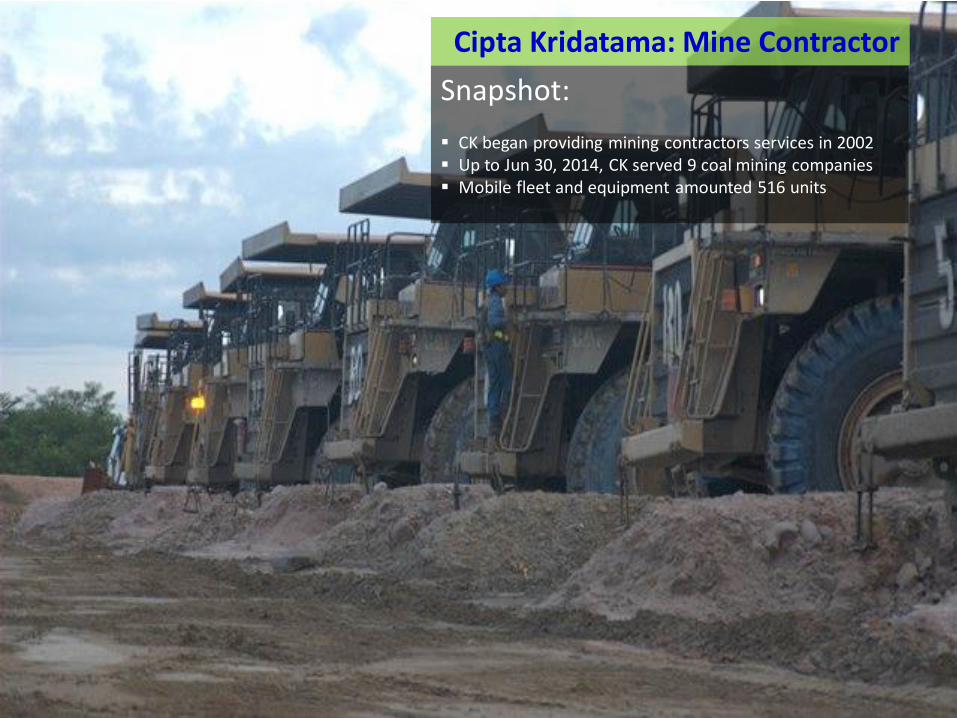
Snapshot: CK began providing mining contractors services in 2002 Up to Jun 30, 2014, CK served 9 coal mining companies Mobile fleet and equipment amounted 516 units
Cipta Kridatama: Mine Contractor
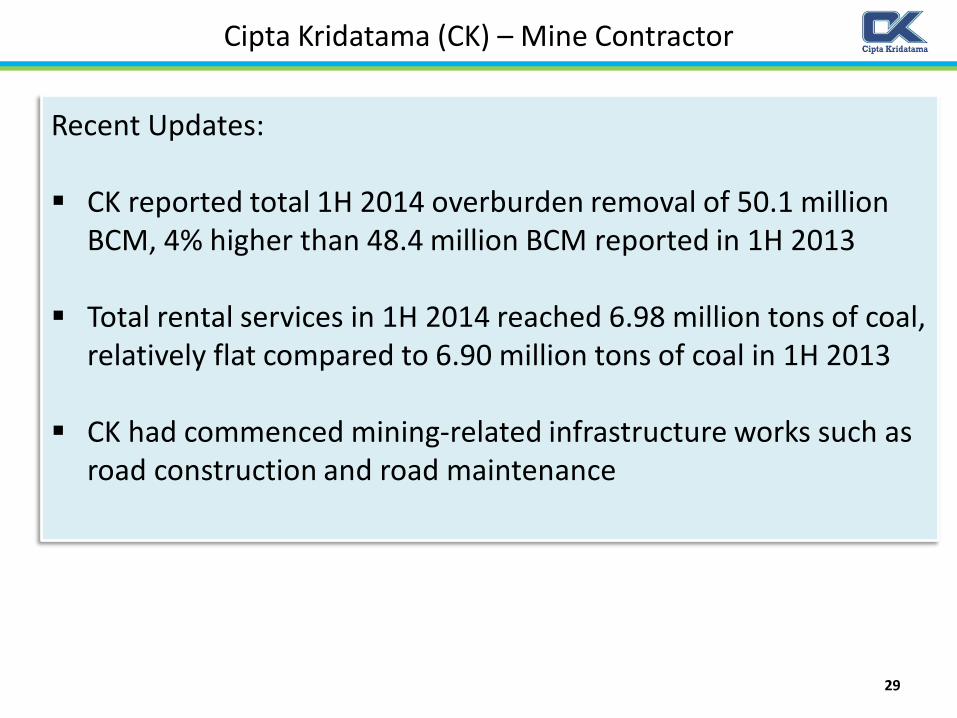
Cipta Kridatama (CK) – Mine Contractor
Recent Updates: CK reported total 1H 2014 overburden removal of 50.1 million
BCM, 4% higher than 48.4 million BCM reported in 1H 2013 Total rental services in 1H 2014 reached 6.98 million tons of coal,
relatively flat compared to 6.90 million tons of coal in 1H 2013
CK had commenced mining-related infrastructure works such as road construction and road maintenance
29
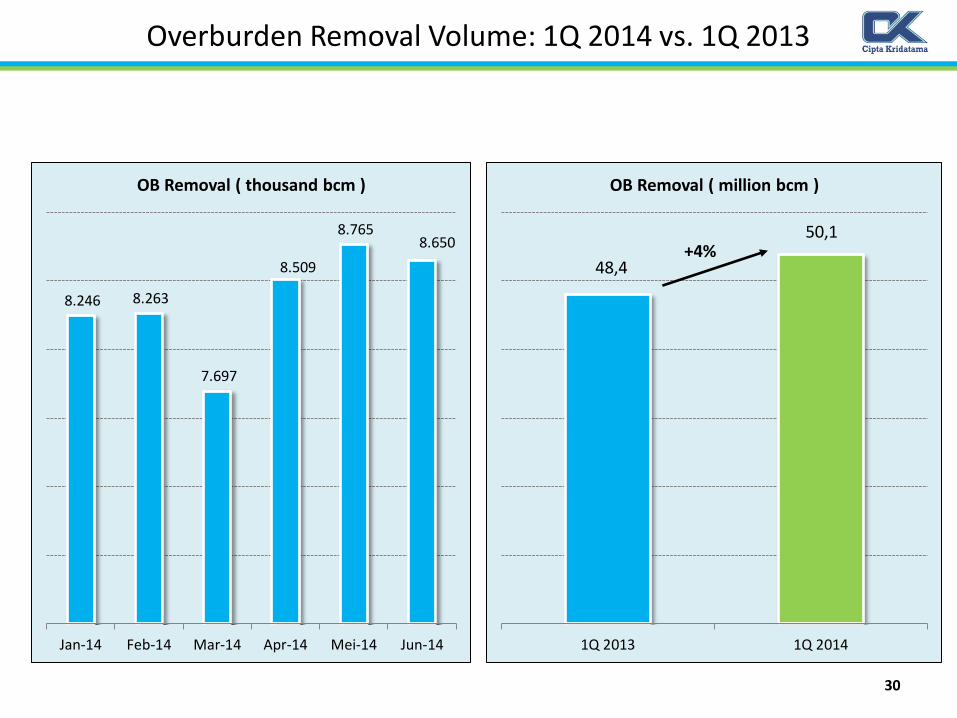
Overburden Removal Volume: 1Q 2014 vs. 1Q 2013
48,4
50,1
1Q 2013 1Q 2014
OB Removal ( million bcm )
8.246 8.263
7.697
8.509
8.765 8.650
Jan-14 Feb-14 Mar-14 Apr-14 Mei-14 Jun-14
OB Removal ( thousand bcm )
+4%
30
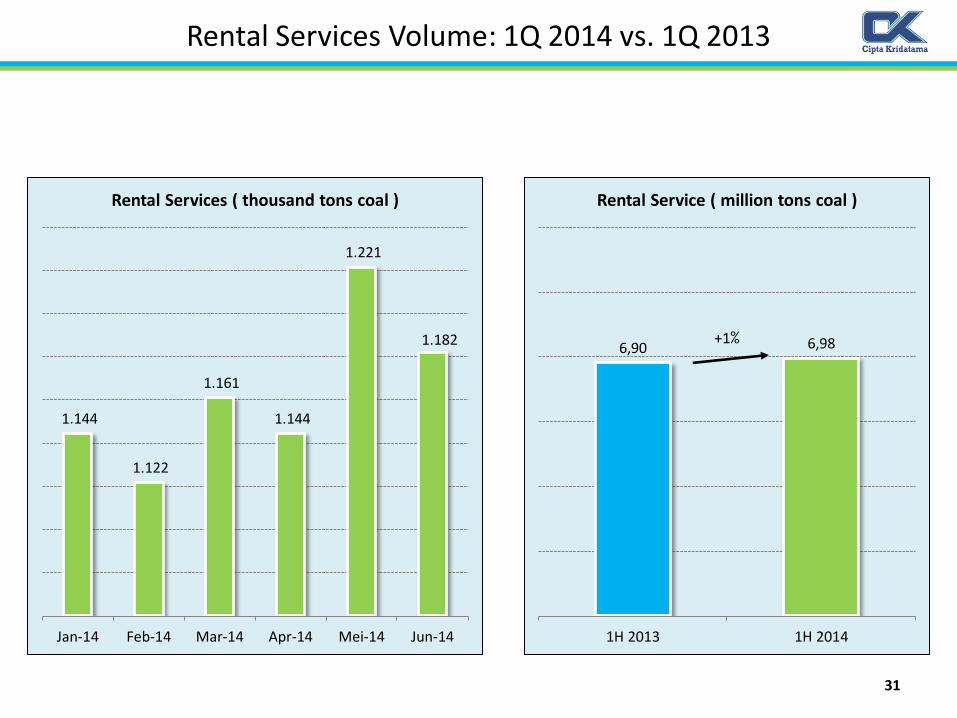
Rental Services Volume: 1Q 2014 vs. 1Q 2013
6,90 6,98
1H 2013 1H 2014
Rental Service ( million tons coal )
1.144
1.122
1.161
1.144
1.221
1.182
Jan-14 Feb-14 Mar-14 Apr-14 Mei-14 Jun-14
Rental Services ( thousand tons coal )
+1%
31
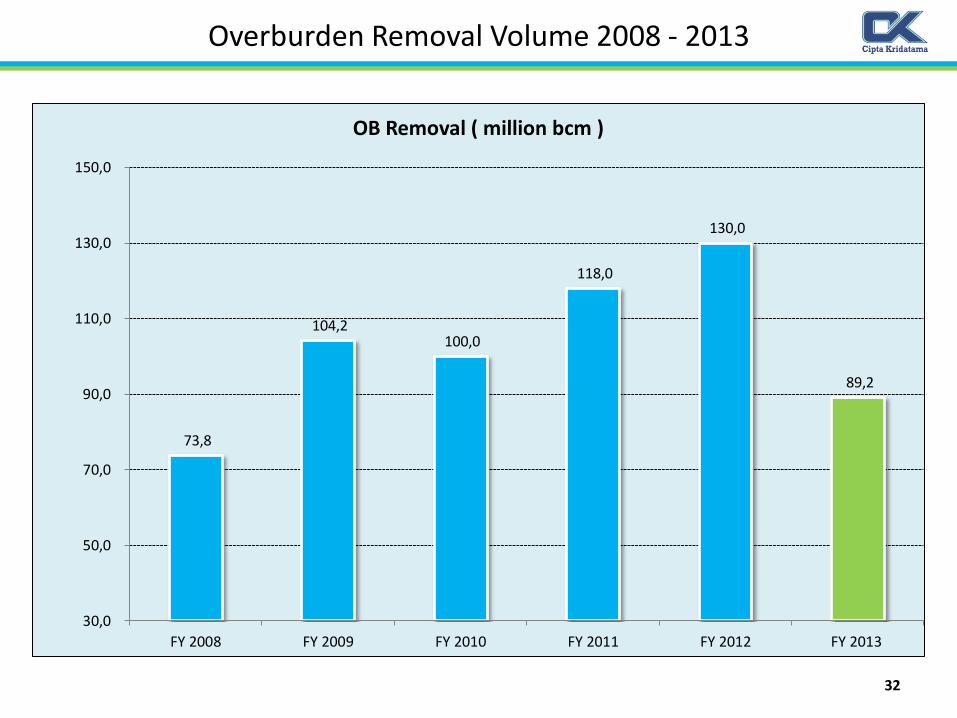
Overburden Removal Volume 2008 - 2013
73,8
104,2 100,0
118,0
130,0
89,2
30,0
50,0
70,0
90,0
110,0
130,0
150,0
FY 2008 FY 2009 FY 2010 FY 2011 FY 2012 FY 2013
OB Removal ( million bcm )
32
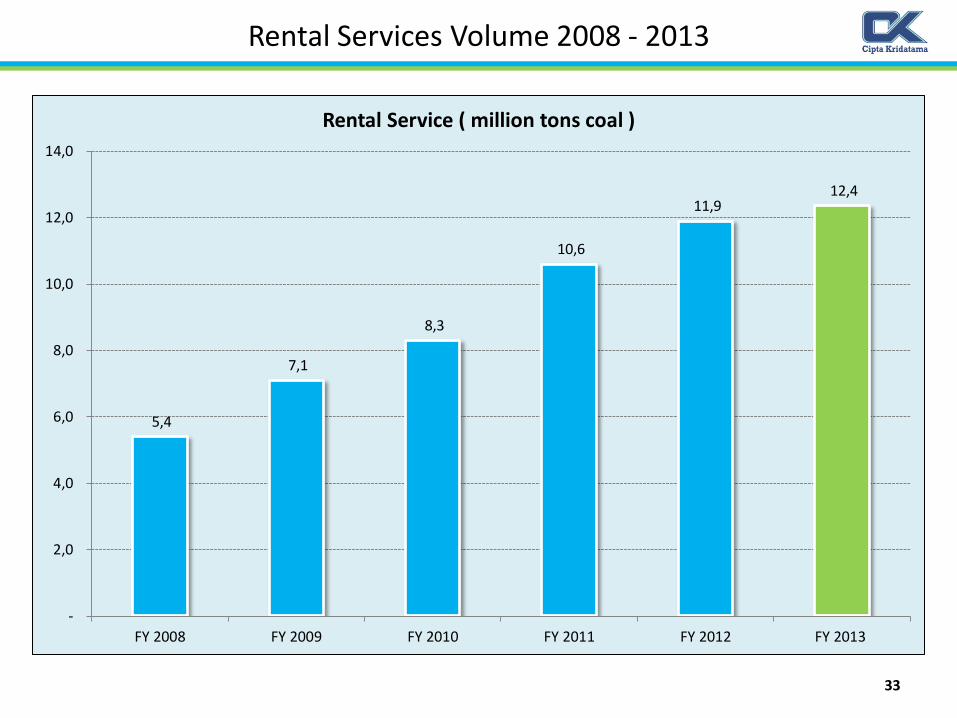
Rental Services Volume 2008 - 2013
5,4
7,1
8,3
10,6
11,9 12,4
-
2,0
4,0
6,0
8,0
10,0
12,0
14,0
FY 2008 FY 2009 FY 2010 FY 2011 FY 2012 FY 2013
Rental Service ( million tons coal )
33
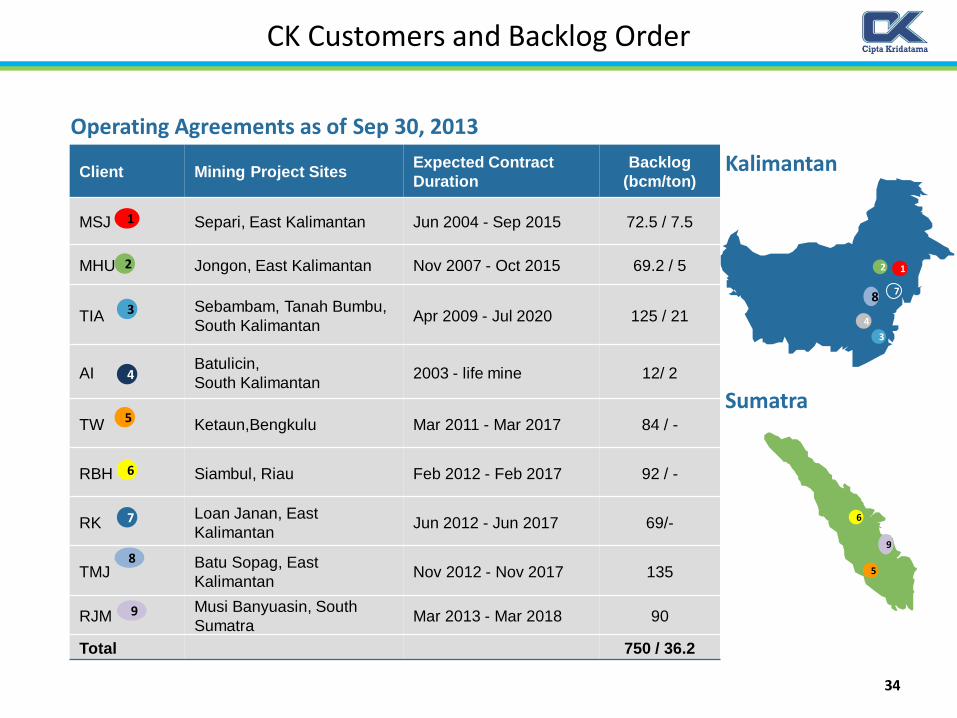
CK Customers and Backlog Order
Operating Agreements as of Sep 30, 2013
1 2
3
4
6
7
Kalimantan
Sumatra
Client Mining Project Sites Expected Contract
Duration
Backlog
(bcm/ton)
MSJ Separi, East Kalimantan Jun 2004 - Sep 2015 72.5 / 7.5
MHU Jongon, East Kalimantan Nov 2007 - Oct 2015 69.2 / 5
TIA Sebambam, Tanah Bumbu,
South Kalimantan Apr 2009 - Jul 2020 125 / 21
AI Batulicin,
South Kalimantan 2003 - life mine 12/ 2
TW Ketaun,Bengkulu Mar 2011 - Mar 2017 84 / -
RBH Siambul, Riau Feb 2012 - Feb 2017 92 / -
RK Loan Janan, East
Kalimantan Jun 2012 - Jun 2017 69/-
TMJ Batu Sopag, East
Kalimantan Nov 2012 - Nov 2017 135
RJM Musi Banyuasin, South
Sumatra Mar 2013 - Mar 2018 90
Total 750 / 36.2
1
2
3
4
5
6
7
5 8
8
9
9
34
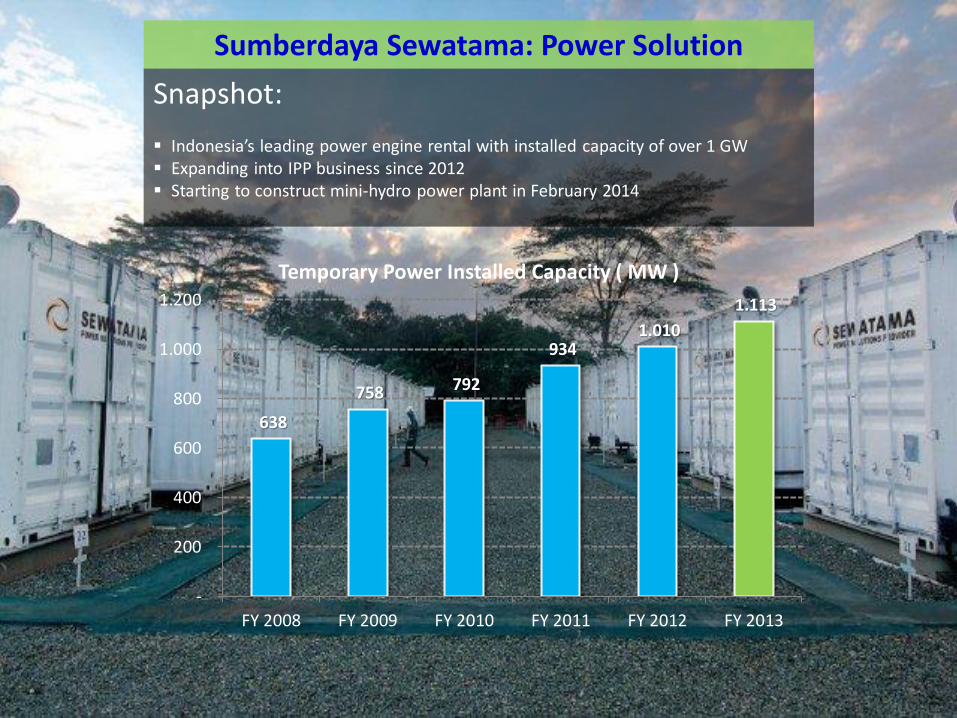
Sumberdaya Sewatama: Power Solution
Snapshot: Indonesia’s leading power engine rental with installed capacity of over 1 GW Expanding into IPP business since 2012 Starting to construct mini-hydro power plant in February 2014
638
758 792
934 1.010
1.113
-
200
400
600
800
1.000
1.200
FY 2008 FY 2009 FY 2010 FY 2011 FY 2012 FY 2013
Temporary Power Installed Capacity ( MW )
Sumberdaya Sewatama: Power Solution
Recent Updates:
Electricity production from temporary power reached 2,448 million kWh, a 9% Y-o-Y increase
IPP business produced electricity amounted 30.3 million kWh, increased by 9% Y-o-Y
Construction of mini-hydro plant had started on February with commencement target in 2 years
36
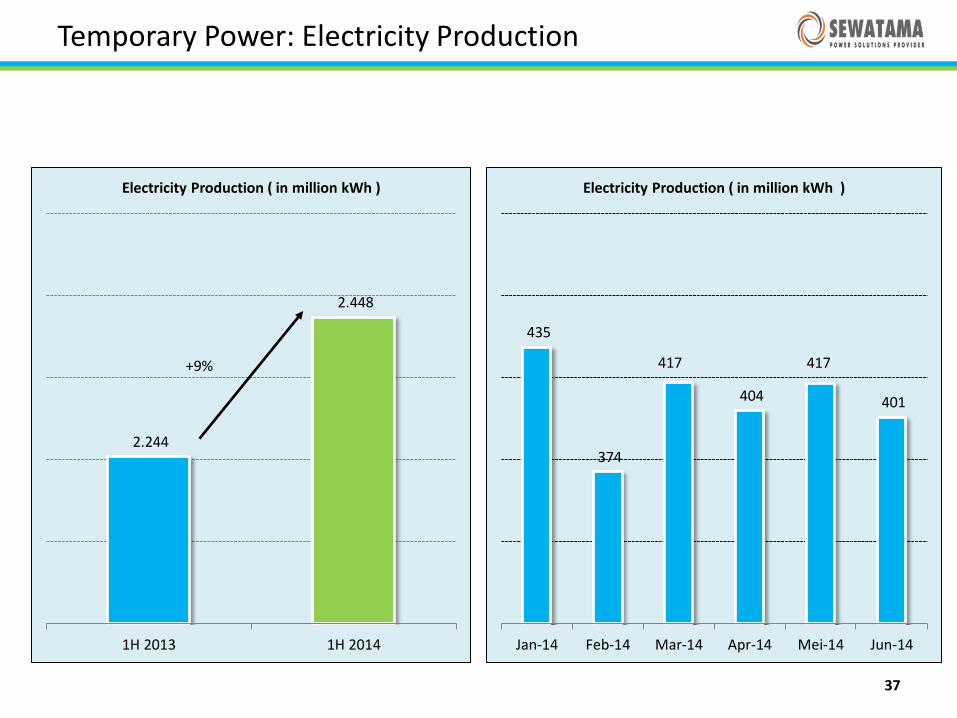
2.244
2.448
1H 2013 1H 2014
Electricity Production ( in million kWh )
37
435
374
417
404
417
401
Jan-14 Feb-14 Mar-14 Apr-14 Mei-14 Jun-14
Electricity Production ( in million kWh )
+9%
Temporary Power: Electricity Production
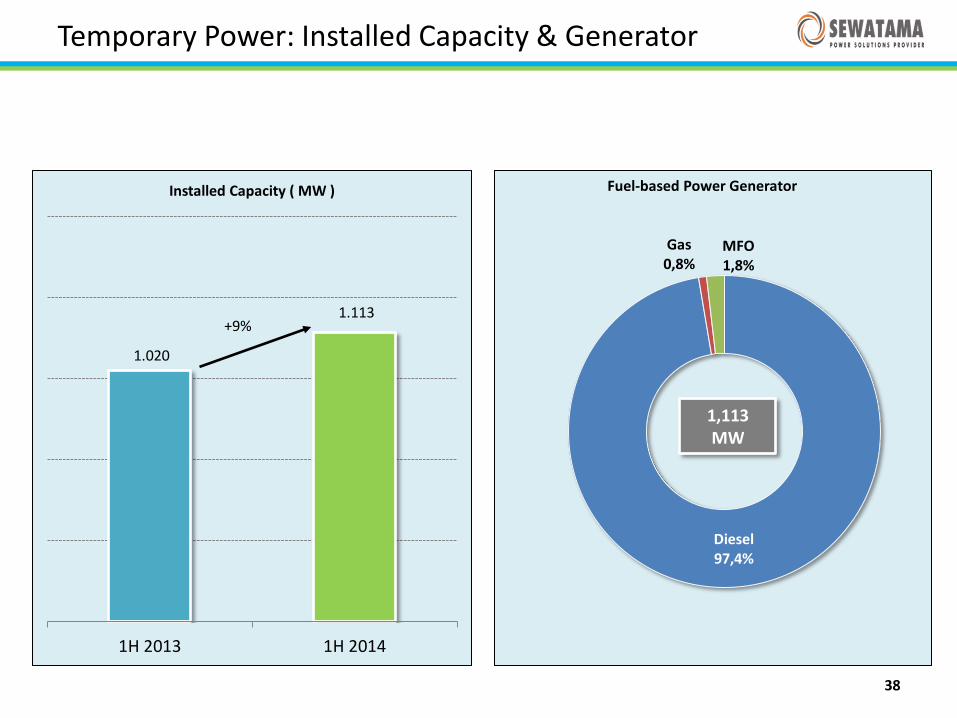
1.020
1.113
1H 2013 1H 2014
Installed Capacity ( MW )
+9%
38
Diesel 97,4%
Gas 0,8%
MFO 1,8%
Fuel-based Power Generator
1,113 MW
Temporary Power: Installed Capacity & Generator
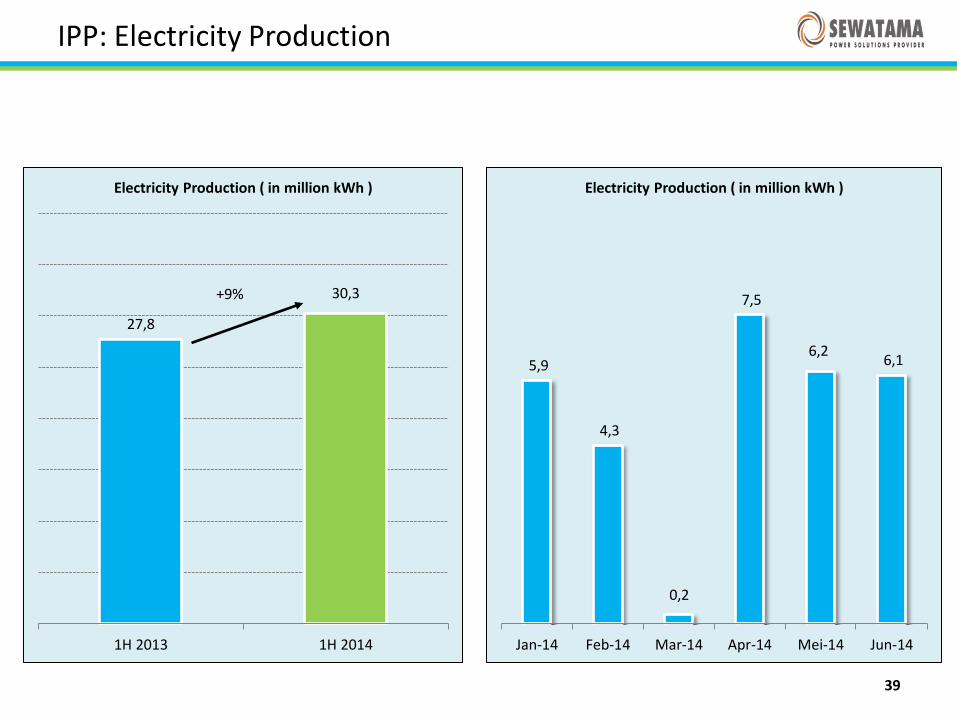
27,8
30,3
1H 2013 1H 2014
Electricity Production ( in million kWh )
+9%
39
5,9
4,3
0,2
7,5
6,2 6,1
Jan-14 Feb-14 Mar-14 Apr-14 Mei-14 Jun-14
Electricity Production ( in million kWh )
IPP: Electricity Production
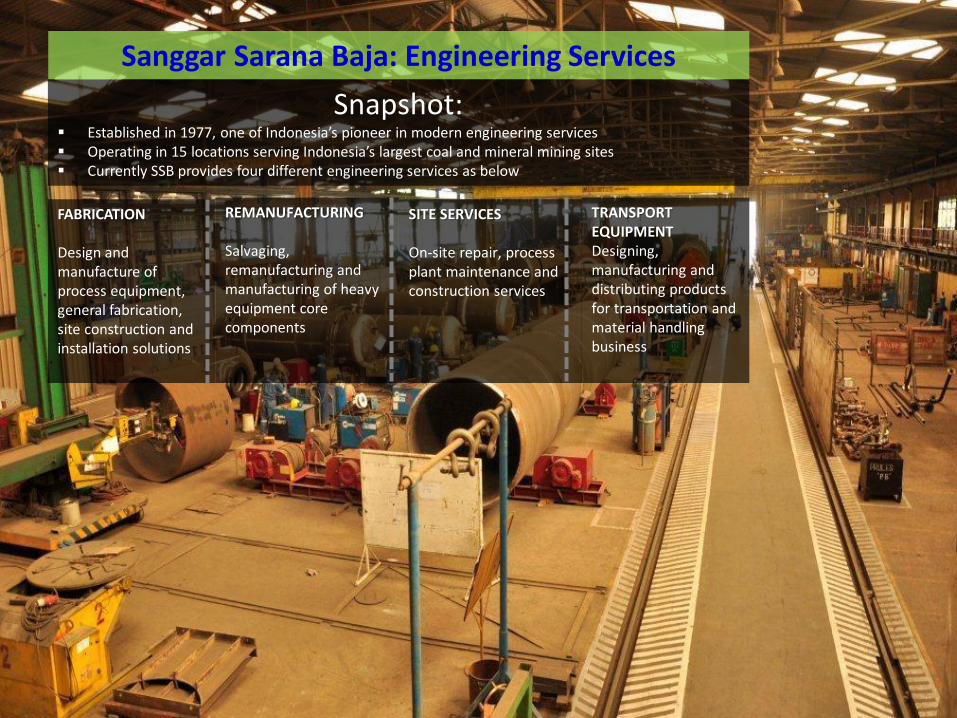
Sanggar Sarana Baja: Engineering Services
FABRICATION Design and manufacture of process equipment, general fabrication, site construction and installation solutions
TRANSPORT EQUIPMENT Designing, manufacturing and distributing products for transportation and material handling business
REMANUFACTURING Salvaging, remanufacturing and manufacturing of heavy equipment core components
SITE SERVICES On-site repair, process plant maintenance and construction services
Snapshot: Established in 1977, one of Indonesia’s pioneer in modern engineering services Operating in 15 locations serving Indonesia’s largest coal and mineral mining sites Currently SSB provides four different engineering services as below
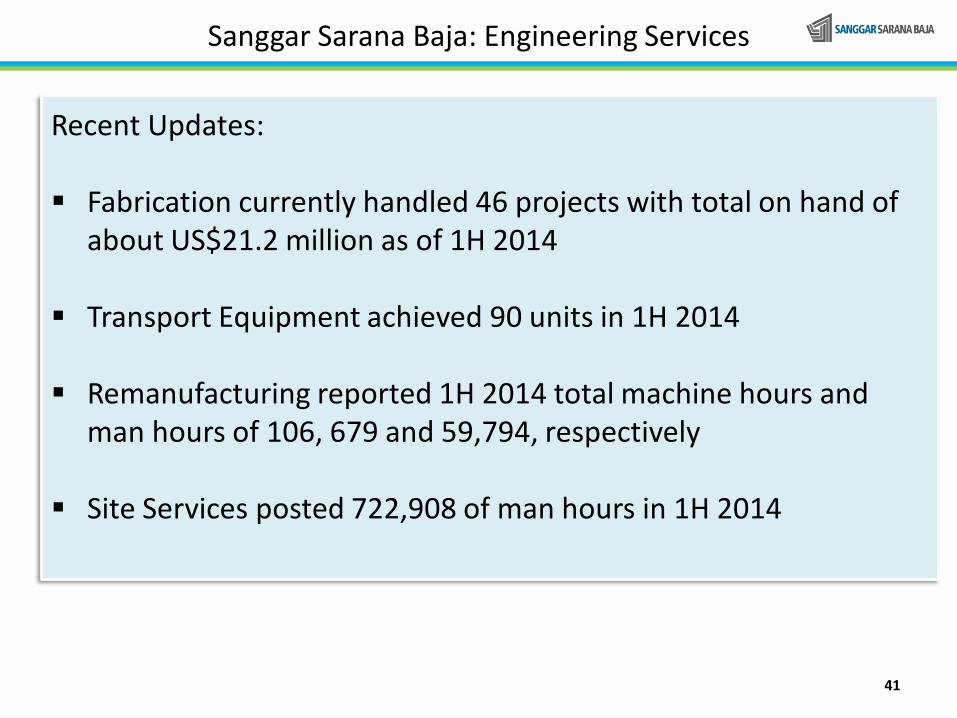
Sanggar Sarana Baja: Engineering Services
Recent Updates: Fabrication currently handled 46 projects with total on hand of
about US$21.2 million as of 1H 2014
Transport Equipment achieved 90 units in 1H 2014
Remanufacturing reported 1H 2014 total machine hours and man hours of 106, 679 and 59,794, respectively
Site Services posted 722,908 of man hours in 1H 2014
41
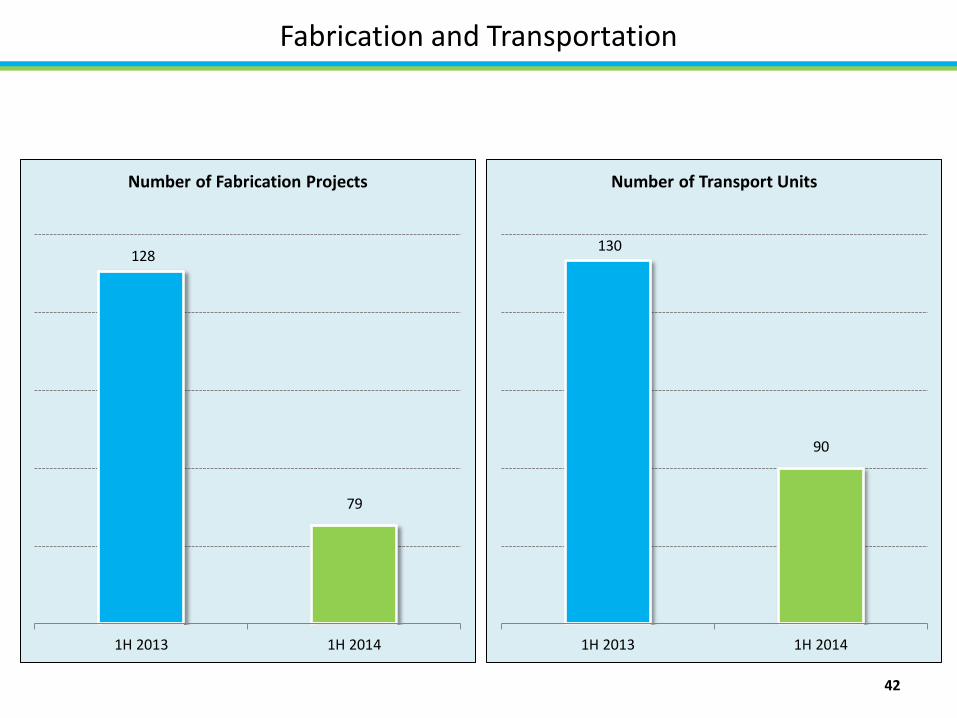
Fabrication and Transportation
130
90
1H 2013 1H 2014
Number of Transport Units
128
79
1H 2013 1H 2014
Number of Fabrication Projects
42
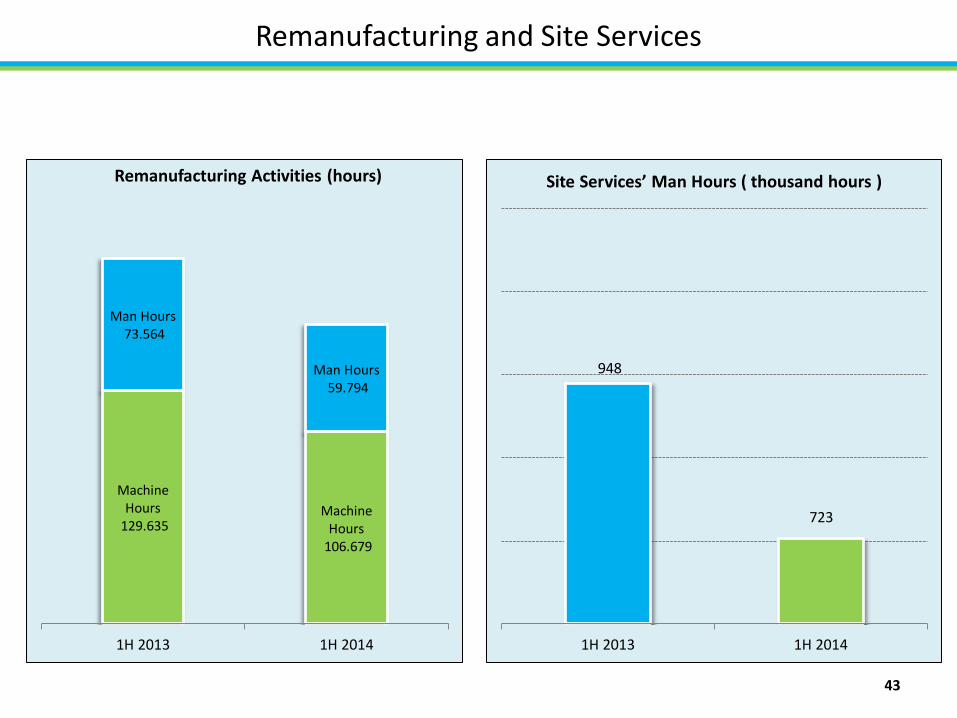
Remanufacturing and Site Services
948
723
1H 2013 1H 2014
Site Services’ Man Hours ( thousand hours )
43
Machine Hours
129.635 Machine
Hours 106.679
Man Hours 73.564
Man Hours 59.794
1H 2013 1H 2014
Remanufacturing Activities (hours)
Cipta Krida Bahari: Integrated Logistics
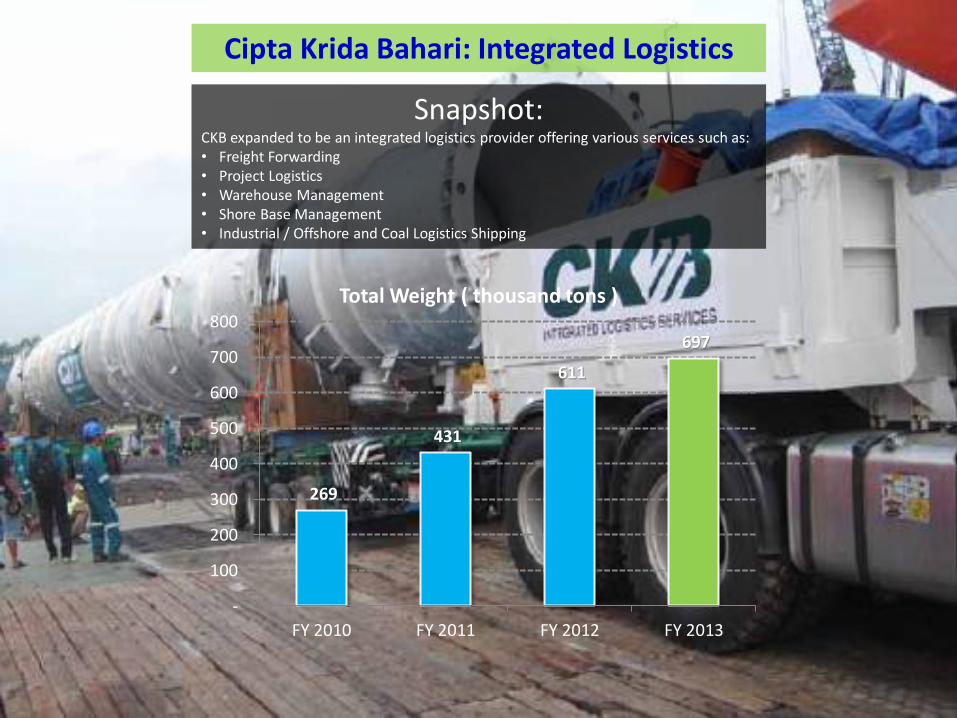
Snapshot: CKB expanded to be an integrated logistics provider offering various services such as: • Freight Forwarding • Project Logistics • Warehouse Management • Shore Base Management • Industrial / Offshore and Coal Logistics Shipping
269
431
611
697
-
100
200
300
400
500
600
700
800
FY 2010 FY 2011 FY 2012 FY 2013
Total Weight ( thousand tons )
Cipta Krida Bahari (CKB): Integrated Logistics
Recent Updates:
Chargeable weight of Integrated Logistics achieved 21.3 thousand tons, number of heavy equipment moved amounted 900 units, and floor space rented was 545 thousand square meters (SQM) as of 1H 2014
ATR had total billable days of 2,468 from total fleet of 18 vessels in 1H 2014
BDD handled nearly 2.9mn tons of coal in 1H 2014
45
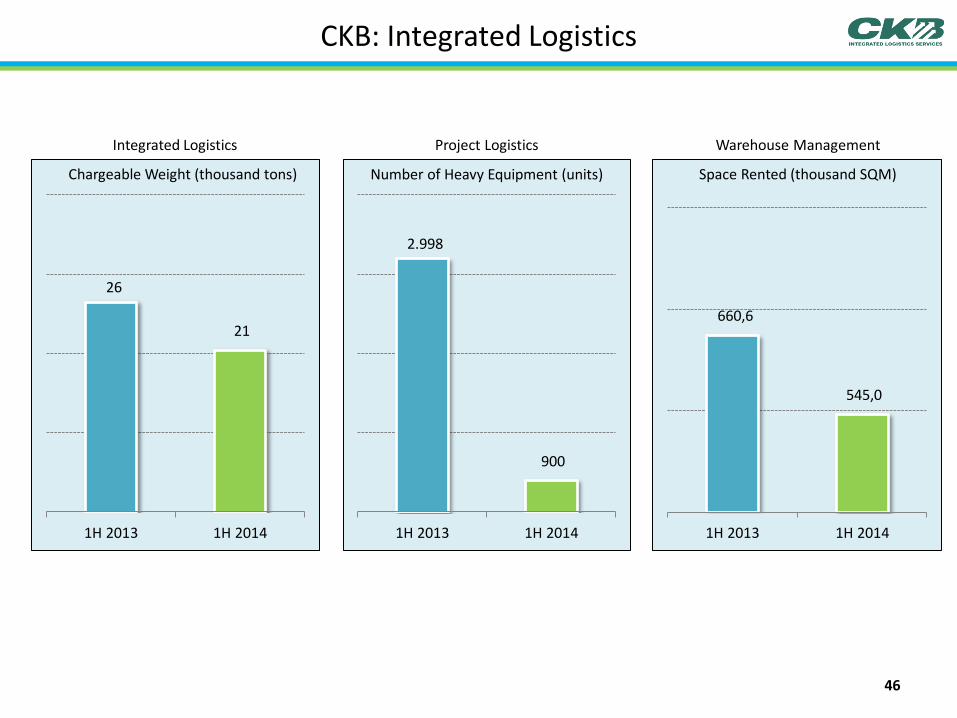
CKB: Integrated Logistics
Integrated Logistics Project Logistics
2.998
900
1H 2013 1H 2014
660,6
545,0
1H 2013 1H 2014
Warehouse Management
Space Rented (thousand SQM) Number of Heavy Equipment (units)
46
26
21
1H 2013 1H 2014
Chargeable Weight (thousand tons)
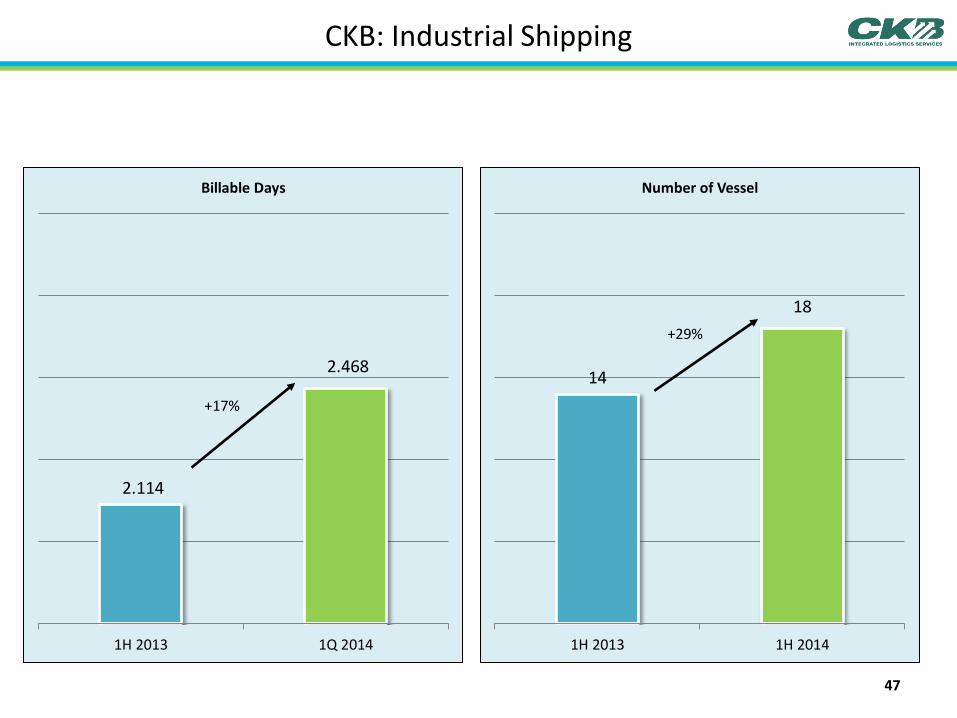
CKB: Industrial Shipping
2.114
2.468
1H 2013 1Q 2014
Billable Days
+17%
14
18
1H 2013 1H 2014
Number of Vessel
+29%
47
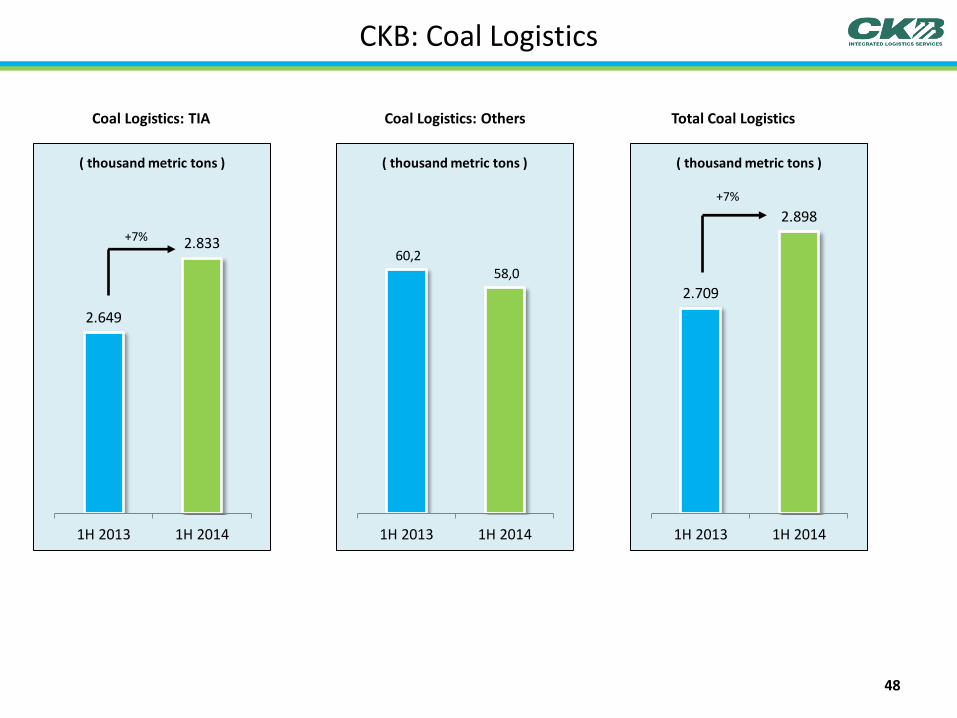
CKB: Coal Logistics
2.649
2.833
1H 2013 1H 2014
( thousand metric tons )
Coal Logistics: TIA
60,2 58,0
1H 2013 1H 2014
( thousand metric tons )
2.709
2.898
1H 2013 1H 2014
( thousand metric tons )
Coal Logistics: Others Total Coal Logistics
+7%
+7%
48
Recent Updates Operational Highlights
Strategy and Mitigations Appendices
Financial Highlights 50
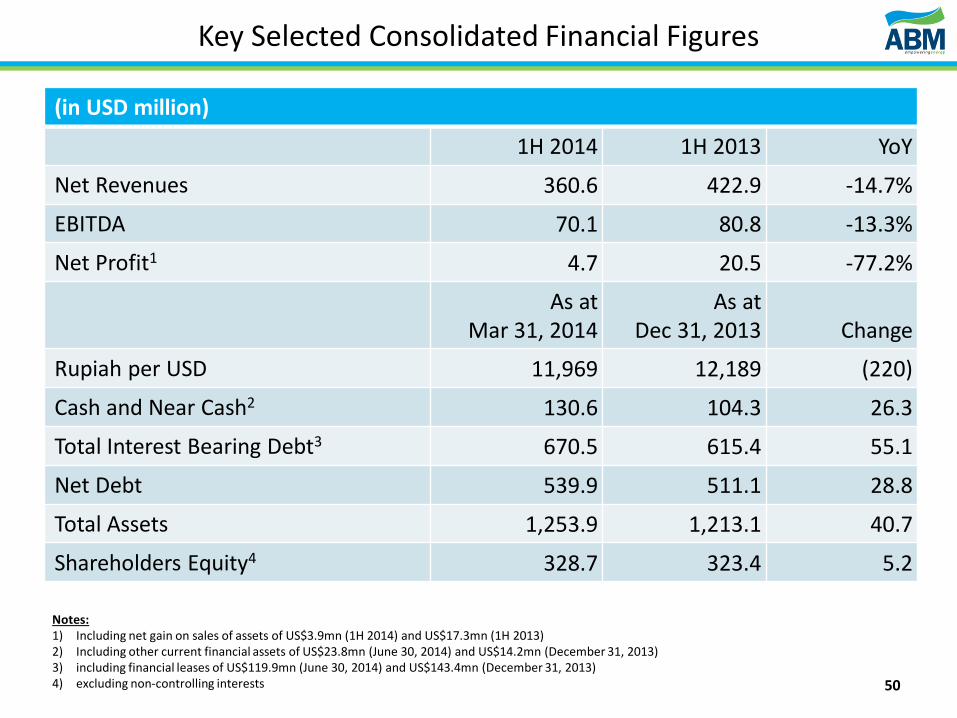
1H 2014 1H 2013 YoY
Net Revenues 360.6 422.9 -14.7%
EBITDA 70.1 80.8 -13.3%
Net Profit1 4.7 20.5 -77.2%
As at Mar 31, 2014
As at Dec 31, 2013
Change
Rupiah per USD 11,969 12,189 (220)
Cash and Near Cash2 130.6 104.3 26.3
Total Interest Bearing Debt3 670.5 615.4 55.1
Net Debt 539.9 511.1 28.8
Total Assets 1,253.9 1,213.1 40.7
Shareholders Equity4 328.7 323.4 5.2
Key Selected Consolidated Financial Figures
(in USD million)
Notes: 1) Including net gain on sales of assets of US$3.9mn (1H 2014) and US$17.3mn (1H 2013) 2) Including other current financial assets of US$23.8mn (June 30, 2014) and US$14.2mn (December 31, 2013) 3) including financial leases of US$119.9mn (June 30, 2014) and US$143.4mn (December 31, 2013) 4) excluding non-controlling interests 50
51
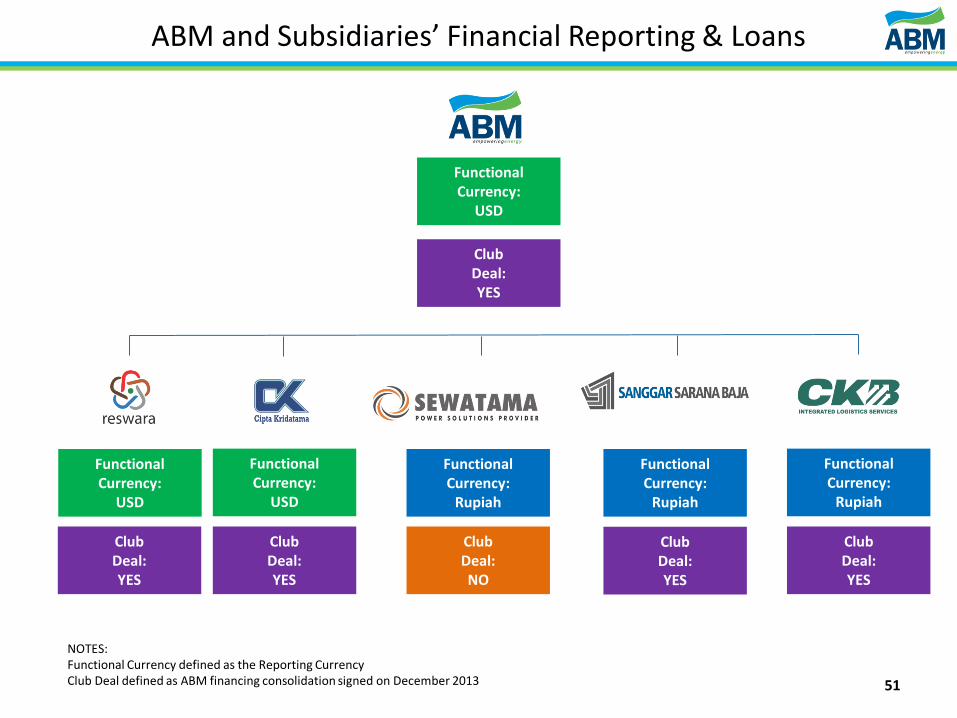
ABM and Subsidiaries’ Financial Reporting & Loans
Functional Currency:
USD
Functional Currency:
USD
Functional Currency:
USD
Functional Currency:
Rupiah
Functional Currency:
Rupiah
Functional Currency:
Rupiah
Club Deal: YES
Club Deal: YES
Club Deal: YES
Club Deal: YES
Club Deal: NO
Club Deal: YES
NOTES: Functional Currency defined as the Reporting Currency Club Deal defined as ABM financing consolidation signed on December 2013
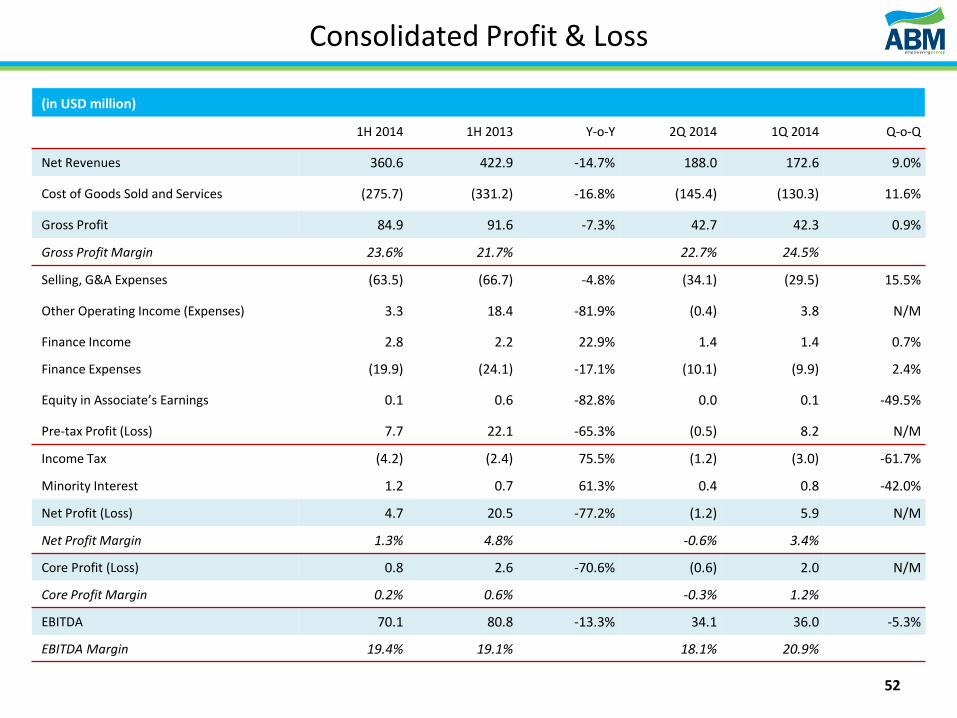
1H 2014 1H 2013 Y-o-Y 2Q 2014 1Q 2014 Q-o-Q
Net Revenues 360.6 422.9 -14.7% 188.0 172.6 9.0%
Cost of Goods Sold and Services (275.7) (331.2) -16.8% (145.4) (130.3) 11.6%
Gross Profit 84.9 91.6 -7.3% 42.7 42.3 0.9%
Gross Profit Margin 23.6% 21.7% 22.7% 24.5%
Selling, G&A Expenses (63.5) (66.7) -4.8% (34.1) (29.5) 15.5%
Other Operating Income (Expenses) 3.3 18.4 -81.9% (0.4) 3.8 N/M
Finance Income 2.8 2.2 22.9% 1.4 1.4 0.7%
Finance Expenses (19.9) (24.1) -17.1% (10.1) (9.9) 2.4%
Equity in Associate’s Earnings 0.1 0.6 -82.8% 0.0 0.1 -49.5%
Pre-tax Profit (Loss) 7.7 22.1 -65.3% (0.5) 8.2 N/M
Income Tax (4.2) (2.4) 75.5% (1.2) (3.0) -61.7%
Minority Interest 1.2 0.7 61.3% 0.4 0.8 -42.0%
Net Profit (Loss) 4.7 20.5 -77.2% (1.2) 5.9 N/M
Net Profit Margin 1.3% 4.8% -0.6% 3.4%
Core Profit (Loss) 0.8 2.6 -70.6% (0.6) 2.0 N/M
Core Profit Margin 0.2% 0.6% -0.3% 1.2%
EBITDA 70.1 80.8 -13.3% 34.1 36.0 -5.3%
EBITDA Margin 19.4% 19.1% 18.1% 20.9%
Consolidated Profit & Loss
(in USD million)
52
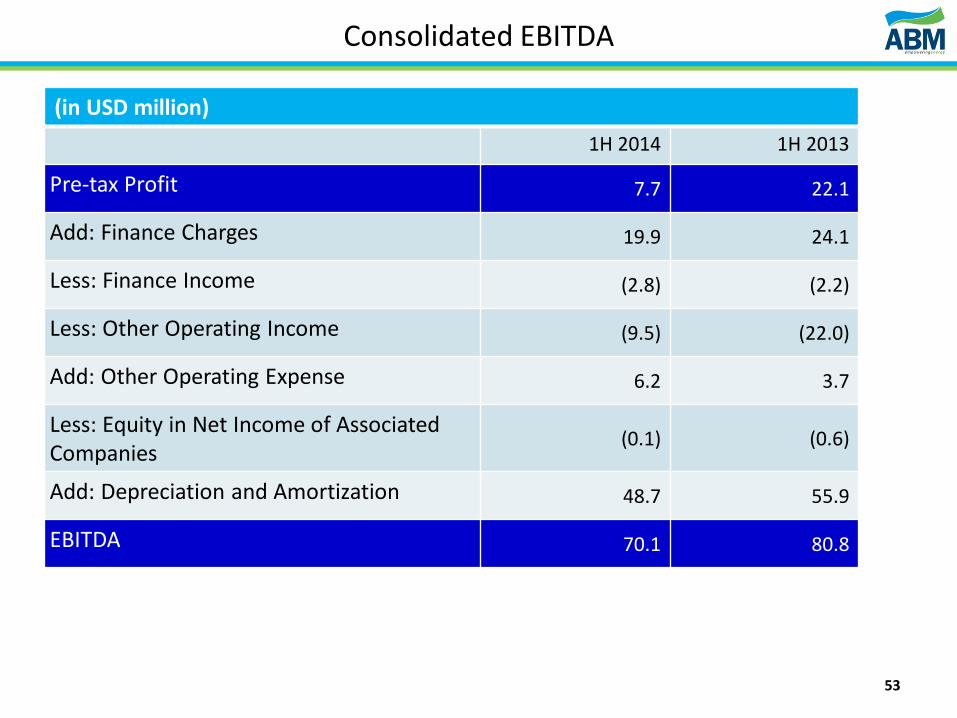
Consolidated EBITDA
1H 2014 1H 2013
Pre-tax Profit 7.7 22.1
Add: Finance Charges 19.9 24.1
Less: Finance Income (2.8) (2.2)
Less: Other Operating Income (9.5) (22.0)
Add: Other Operating Expense 6.2 3.7
Less: Equity in Net Income of Associated Companies
(0.1) (0.6)
Add: Depreciation and Amortization 48.7 55.9
EBITDA 70.1 80.8
(in USD million)
53
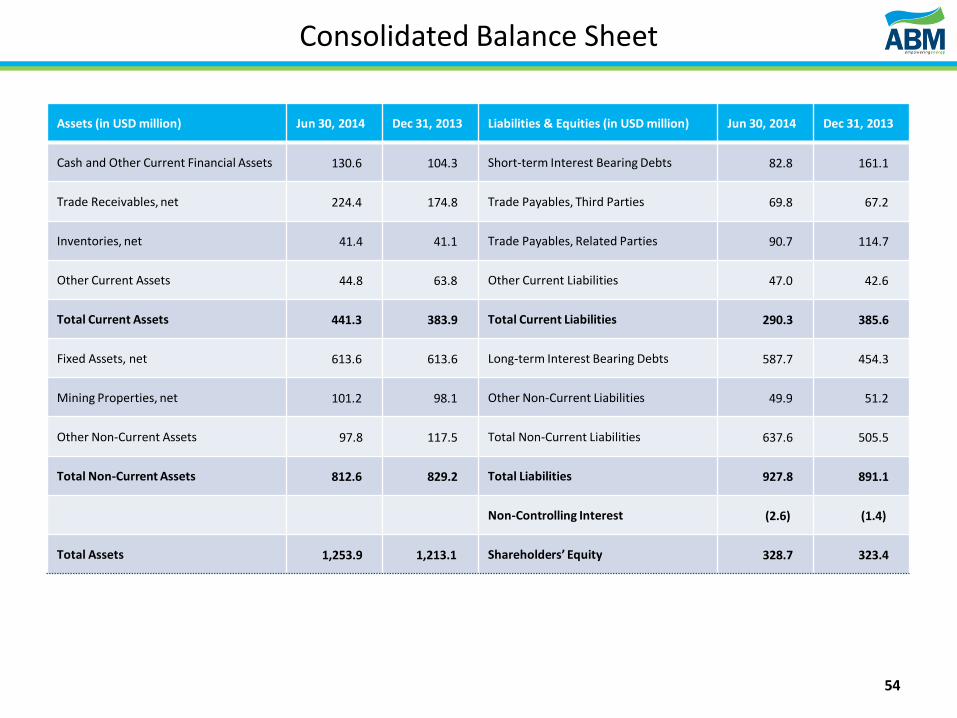
Consolidated Balance Sheet
Assets (in USD million) Jun 30, 2014 Dec 31, 2013 Liabilities & Equities (in USD million) Jun 30, 2014 Dec 31, 2013
Cash and Other Current Financial Assets 130.6 104.3 Short-term Interest Bearing Debts 82.8 161.1
Trade Receivables, net 224.4 174.8 Trade Payables, Third Parties 69.8 67.2
Inventories, net 41.4 41.1 Trade Payables, Related Parties 90.7 114.7
Other Current Assets 44.8 63.8 Other Current Liabilities 47.0 42.6
Total Current Assets 441.3 383.9 Total Current Liabilities 290.3 385.6
Fixed Assets, net 613.6 613.6 Long-term Interest Bearing Debts 587.7 454.3
Mining Properties, net 101.2 98.1 Other Non-Current Liabilities 49.9 51.2
Other Non-Current Assets 97.8 117.5 Total Non-Current Liabilities 637.6 505.5
Total Non-Current Assets 812.6 829.2 Total Liabilities 927.8 891.1
Non-Controlling Interest (2.6) (1.4)
Total Assets 1,253.9 1,213.1 Shareholders’ Equity 328.7 323.4
54
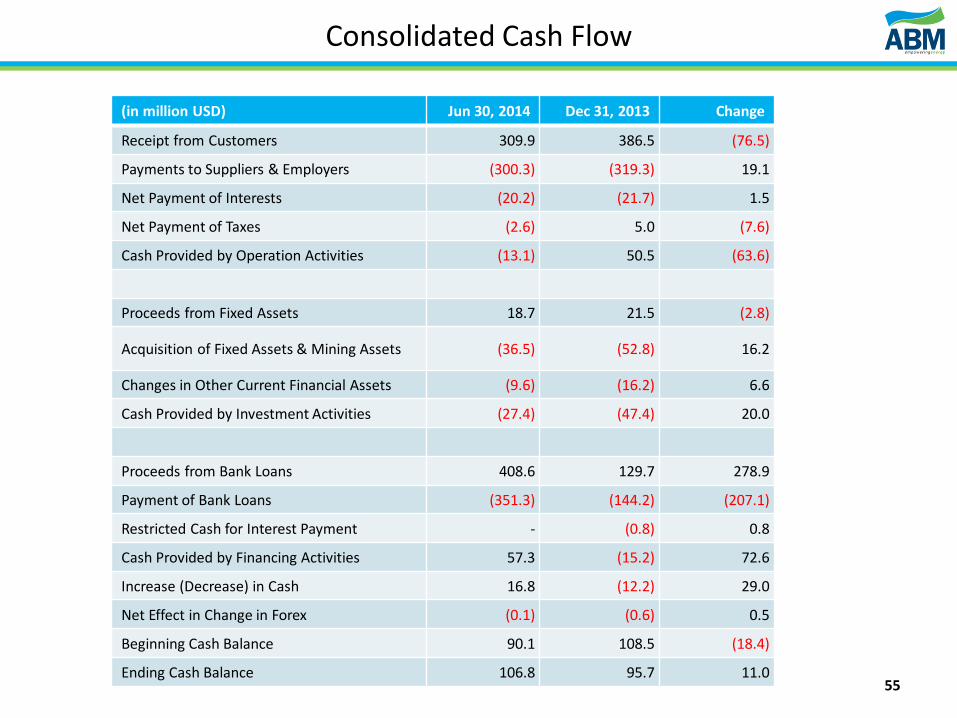
Consolidated Cash Flow
(in million USD) Jun 30, 2014 Dec 31, 2013 Change
Receipt from Customers 309.9 386.5 (76.5)
Payments to Suppliers & Employers (300.3) (319.3) 19.1
Net Payment of Interests (20.2) (21.7) 1.5
Net Payment of Taxes (2.6) 5.0 (7.6)
Cash Provided by Operation Activities (13.1) 50.5 (63.6)
Proceeds from Fixed Assets 18.7 21.5 (2.8)
Acquisition of Fixed Assets & Mining Assets (36.5) (52.8) 16.2
Changes in Other Current Financial Assets (9.6) (16.2) 6.6
Cash Provided by Investment Activities (27.4) (47.4) 20.0
Proceeds from Bank Loans 408.6 129.7 278.9
Payment of Bank Loans (351.3) (144.2) (207.1)
Restricted Cash for Interest Payment - (0.8) 0.8
Cash Provided by Financing Activities 57.3 (15.2) 72.6
Increase (Decrease) in Cash 16.8 (12.2) 29.0
Net Effect in Change in Forex (0.1) (0.6) 0.5
Beginning Cash Balance 90.1 108.5 (18.4)
Ending Cash Balance 106.8 95.7 11.0 55
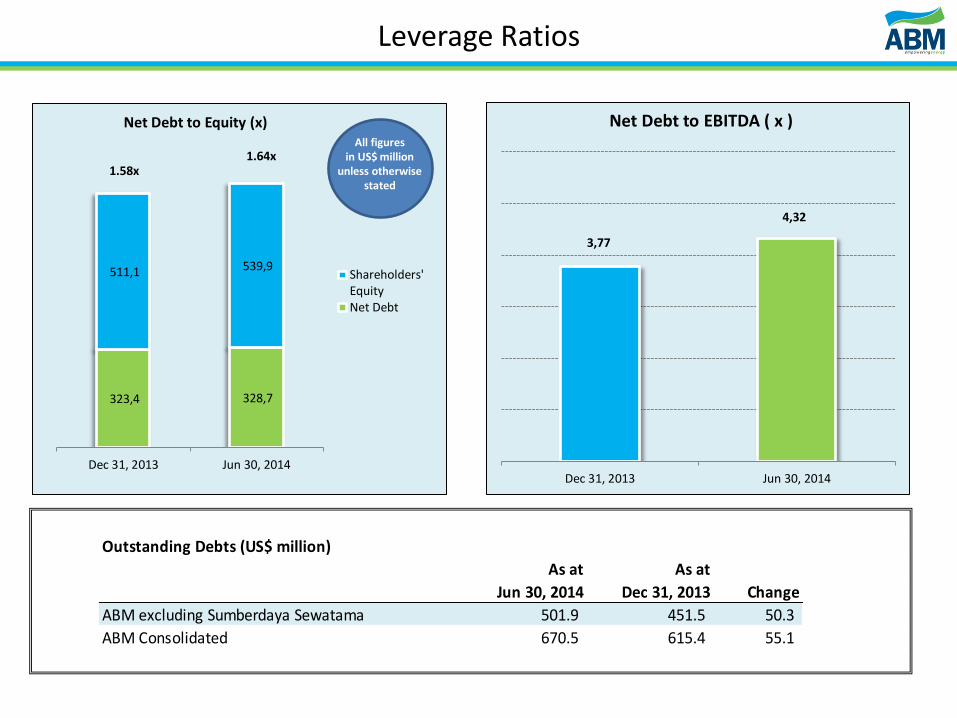
Leverage Ratios
3,77
4,32
Dec 31, 2013 Jun 30, 2014
Net Debt to EBITDA ( x )
Outstanding Debts (US$ million)
As at As at
Jun 30, 2014 Dec 31, 2013 Change
ABM excluding Sumberdaya Sewatama 501.9 451.5 50.3
ABM Consolidated 670.5 615.4 55.1
323,4 328,7
511,1 539,9
Dec 31, 2013 Jun 30, 2014
Shareholders'EquityNet Debt
1.58x 1.64x
Net Debt to Equity (x) All figures
in US$ million unless otherwise
stated
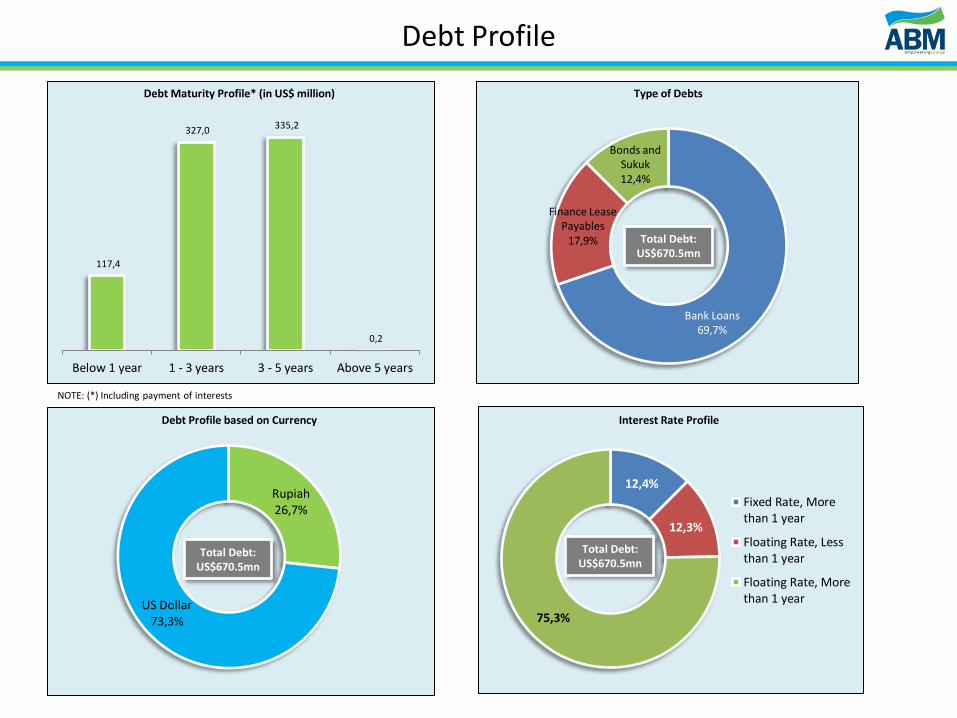
12,4%
12,3%
75,3%
Fixed Rate, Morethan 1 year
Floating Rate, Lessthan 1 year
Floating Rate, Morethan 1 year
Rupiah 26,7%
US Dollar 73,3%
Bank Loans 69,7%
Finance Lease Payables
17,9%
Bonds and Sukuk 12,4%
Debt Profile
NOTE: (*) Including payment of interests
Interest Rate Profile
Total Debt: US$670.5mn
Total Debt: US$670.5mn
Total Debt: US$670.5mn
117,4
327,0 335,2
0,2
Below 1 year 1 - 3 years 3 - 5 years Above 5 years
Debt Maturity Profile* (in US$ million) Type of Debts
Debt Profile based on Currency
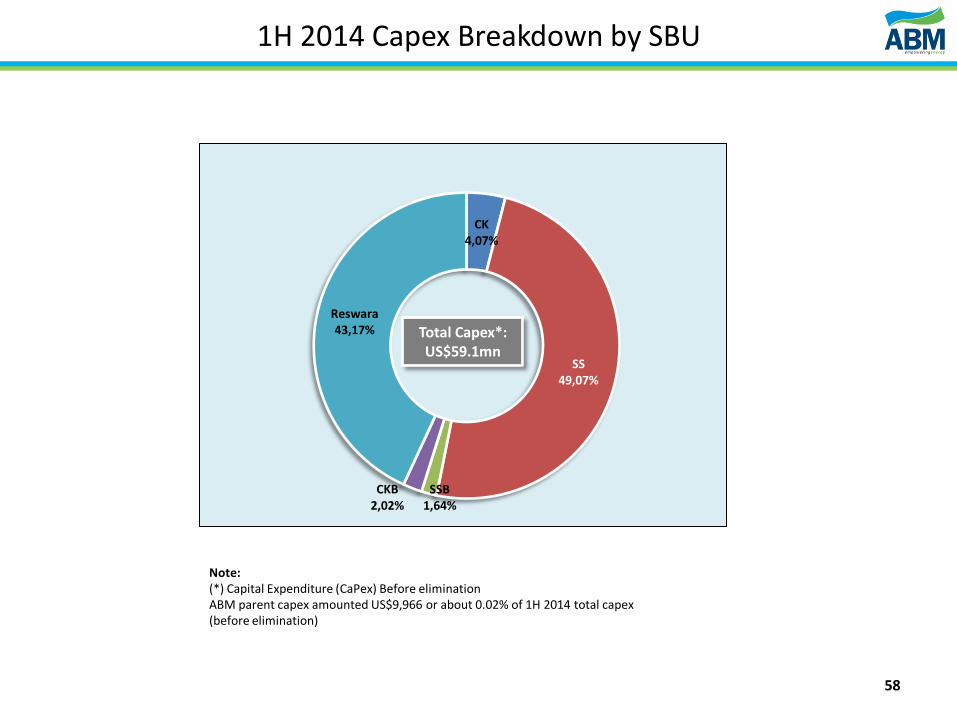
CK 4,07%
SS 49,07%
SSB 1,64%
CKB 2,02%
Reswara 43,17%
58
1H 2014 Capex Breakdown by SBU
Total Capex*: US$59.1mn
Note: (*) Capital Expenditure (CaPex) Before elimination ABM parent capex amounted US$9,966 or about 0.02% of 1H 2014 total capex (before elimination)
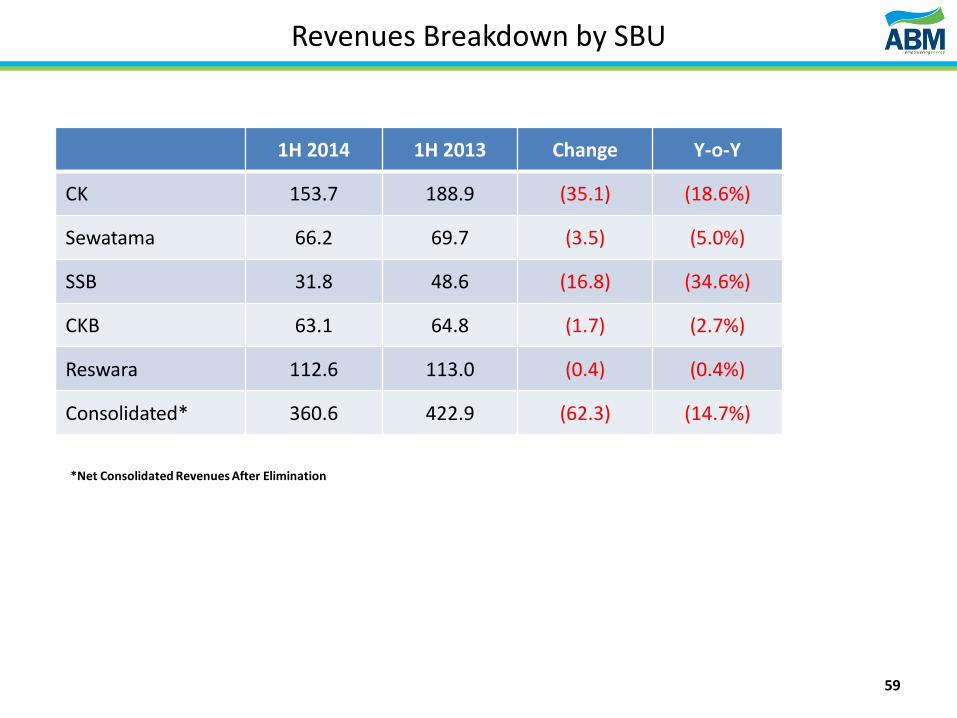
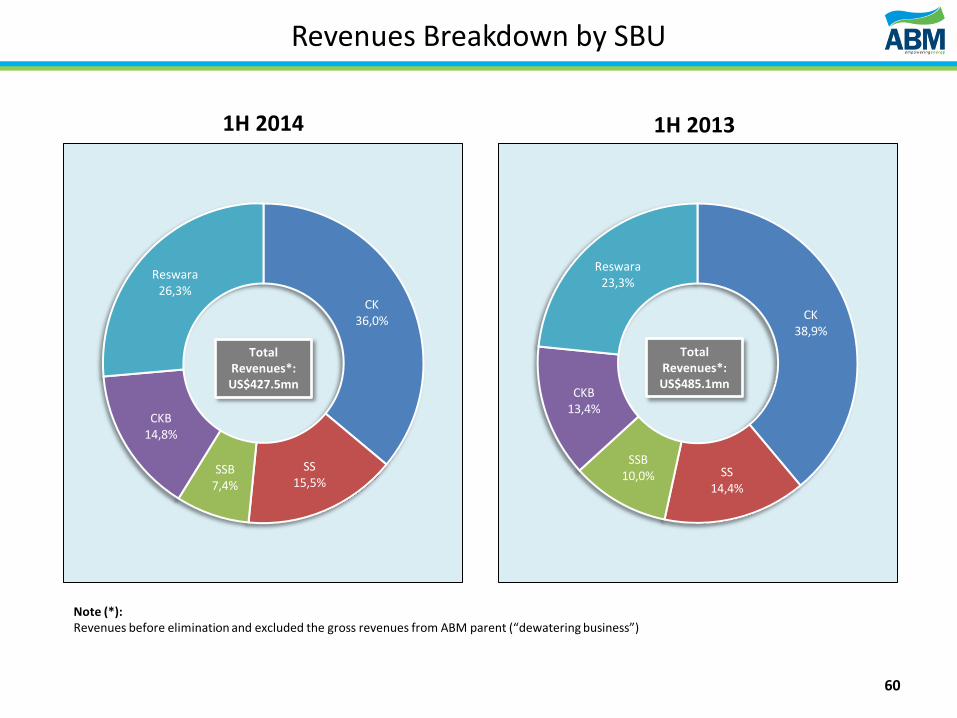
Revenues Breakdown by SBU
59
1H 2014 1H 2013 Change Y-o-Y
CK 153.7 188.9 (35.1) (18.6%)
Sewatama 66.2 69.7 (3.5) (5.0%)
SSB 31.8 48.6 (16.8) (34.6%)
CKB 63.1 64.8 (1.7) (2.7%)
Reswara 112.6 113.0 (0.4) (0.4%)
Consolidated* 360.6 422.9 (62.3) (14.7%)
*Net Consolidated Revenues After Elimination
CK 38,9%
SS 14,4%
SSB 10,0%
CKB 13,4%
Reswara 23,3%
CK 36,0%
SS 15,5%
SSB 7,4%
CKB 14,8%
Reswara 26,3%
Revenues Breakdown by SBU
Total Revenues*: US$427.5mn
Total Revenues*: US$485.1mn
1H 2014 1H 2013
Note (*): Revenues before elimination and excluded the gross revenues from ABM parent (“dewatering business”)
60
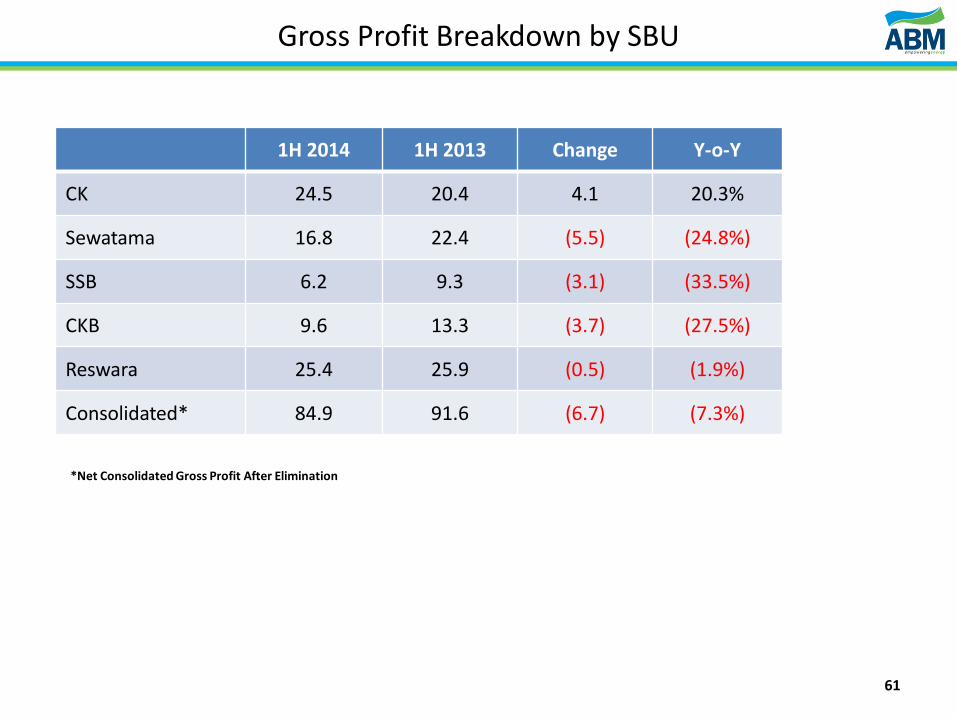
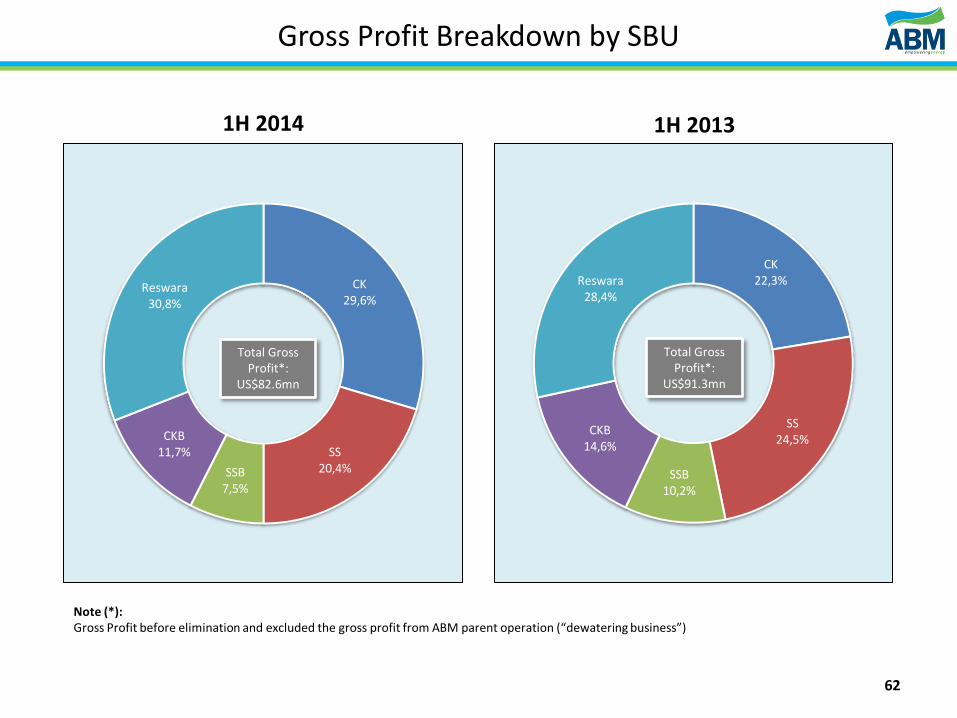
Gross Profit Breakdown by SBU
61
1H 2014 1H 2013 Change Y-o-Y
CK 24.5 20.4 4.1 20.3%
Sewatama 16.8 22.4 (5.5) (24.8%)
SSB 6.2 9.3 (3.1) (33.5%)
CKB 9.6 13.3 (3.7) (27.5%)
Reswara 25.4 25.9 (0.5) (1.9%)
Consolidated* 84.9 91.6 (6.7) (7.3%)
*Net Consolidated Gross Profit After Elimination
CK 22,3%
SS 24,5%
SSB 10,2%
CKB 14,6%
Reswara 28,4%
CK 29,6%
SS 20,4% SSB
7,5%
CKB 11,7%
Reswara 30,8%
Gross Profit Breakdown by SBU
1H 2014 1H 2013
Total Gross Profit*:
US$82.6mn
Note (*): Gross Profit before elimination and excluded the gross profit from ABM parent operation (“dewatering business”)
Total Gross Profit*:
US$91.3mn
62

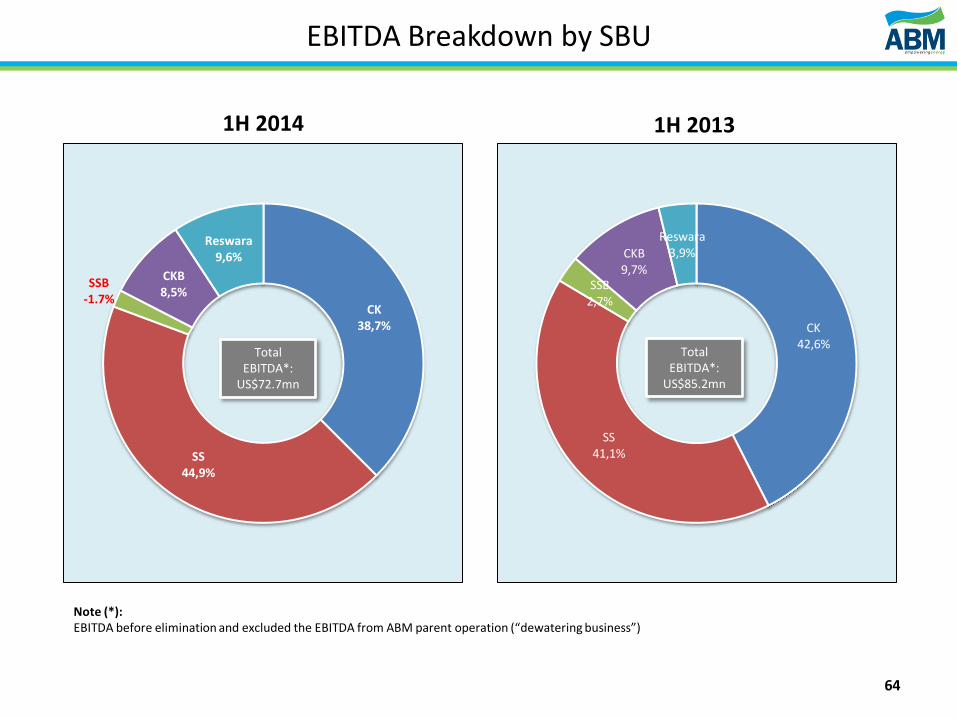
EBITDA Breakdown by SBU
63
1H 2014 1H 2013 Change Y-o-Y
CK 28.1 36.3 (8.1) (22.4%)
Sewatama 32.6 35.0 (2.4) (6.9%)
SSB (1.3) 2.3 (3.6) N/M
CKB 6.2 8.3 (2.1) (25.2%)
Reswara 7.0 3.3 3.7 110.7%
Consolidated* 70.1 80.8 (10.7) (13.3%)
*Net Consolidated EBITDA After Elimination
CK 42,6%
SS 41,1%
SSB 2,7%
CKB 9,7%
Reswara 3,9%
CK 38,7%
SS 44,9%
SSB -1.7%
CKB 8,5%
Reswara 9,6%
64
EBITDA Breakdown by SBU
1H 2013 1H 2014
Total EBITDA*:
US$85.2mn
Total EBITDA*:
US$72.7mn
Note (*): EBITDA before elimination and excluded the EBITDA from ABM parent operation (“dewatering business”)
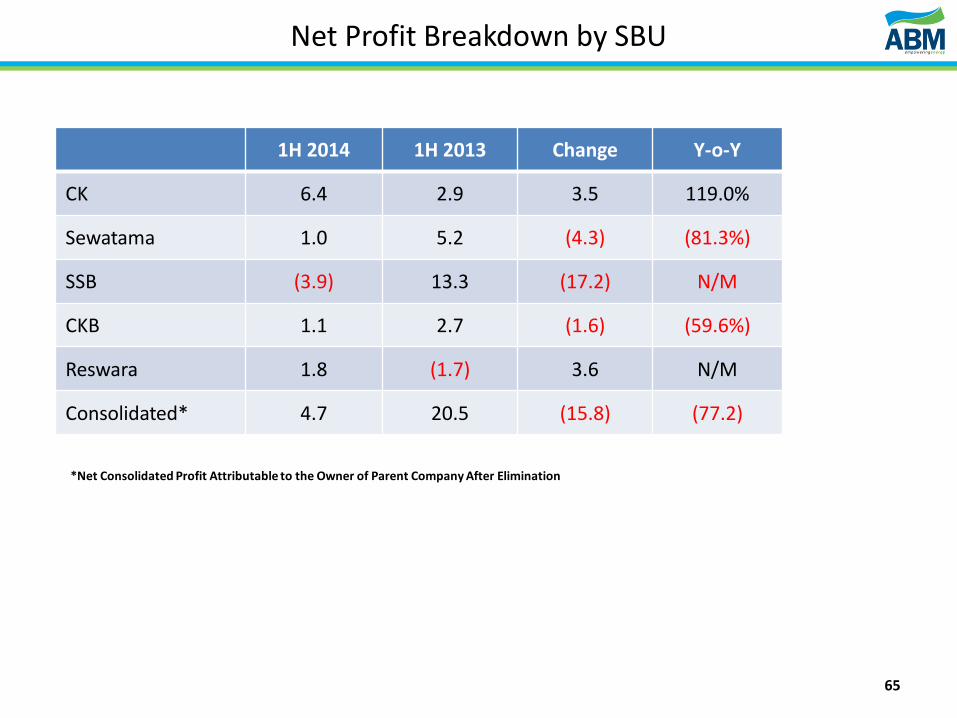
Net Profit Breakdown by SBU
65
1H 2014 1H 2013 Change Y-o-Y
CK 6.4 2.9 3.5 119.0%
Sewatama 1.0 5.2 (4.3) (81.3%)
SSB (3.9) 13.3 (17.2) N/M
CKB 1.1 2.7 (1.6) (59.6%)
Reswara 1.8 (1.7) 3.6 N/M
Consolidated* 4.7 20.5 (15.8) (77.2)
*Net Consolidated Profit Attributable to the Owner of Parent Company After Elimination
66
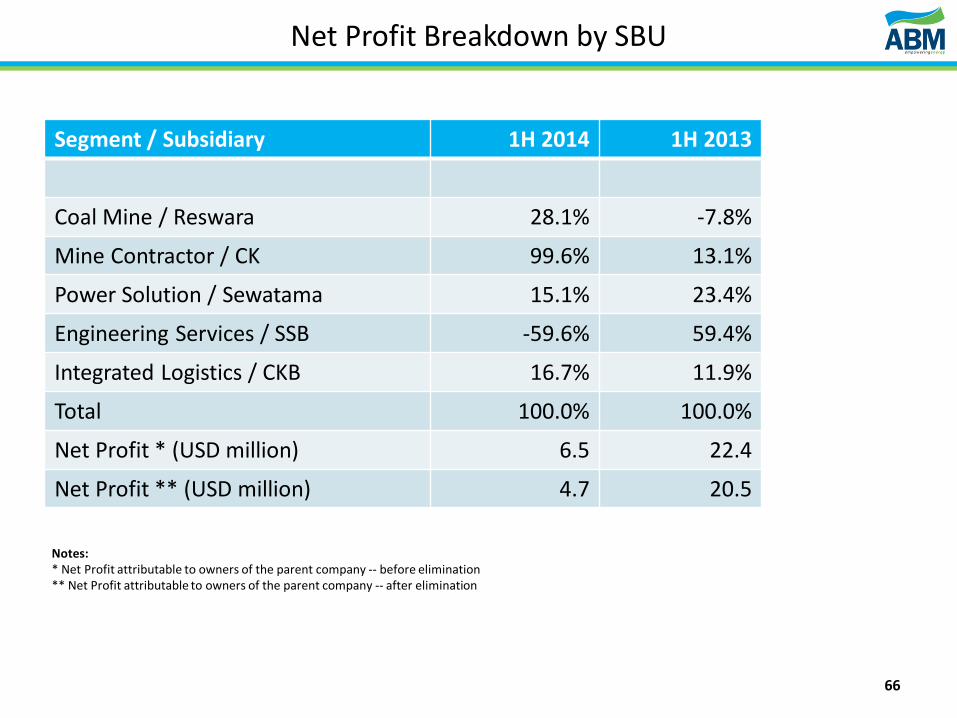
Net Profit Breakdown by SBU
Segment / Subsidiary 1H 2014 1H 2013
Coal Mine / Reswara 28.1% -7.8%
Mine Contractor / CK 99.6% 13.1%
Power Solution / Sewatama 15.1% 23.4%
Engineering Services / SSB -59.6% 59.4%
Integrated Logistics / CKB 16.7% 11.9%
Total 100.0% 100.0%
Net Profit * (USD million) 6.5 22.4
Net Profit ** (USD million) 4.7 20.5
Notes: * Net Profit attributable to owners of the parent company -- before elimination ** Net Profit attributable to owners of the parent company -- after elimination
Recent Updates Operational Highlights Financial Highlights Appendices
Strategy and Mitigations 68
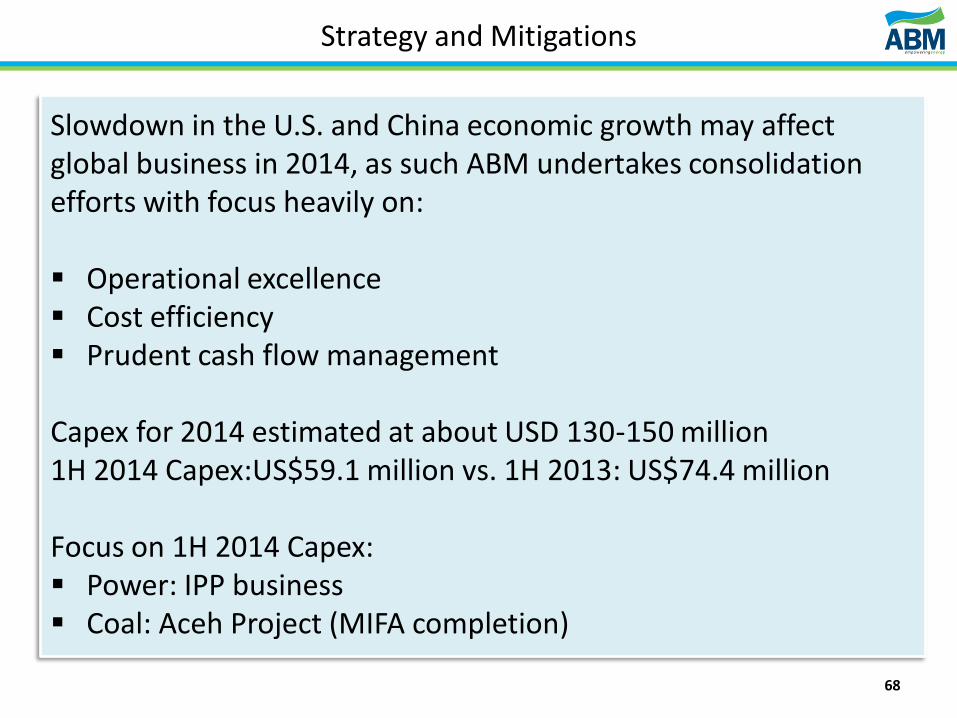
Strategy and Mitigations
Slowdown in the U.S. and China economic growth may affect global business in 2014, as such ABM undertakes consolidation efforts with focus heavily on: Operational excellence Cost efficiency Prudent cash flow management Capex for 2014 estimated at about USD 130-150 million 1H 2014 Capex:US$59.1 million vs. 1H 2013: US$74.4 million Focus on 1H 2014 Capex: Power: IPP business Coal: Aceh Project (MIFA completion)
68
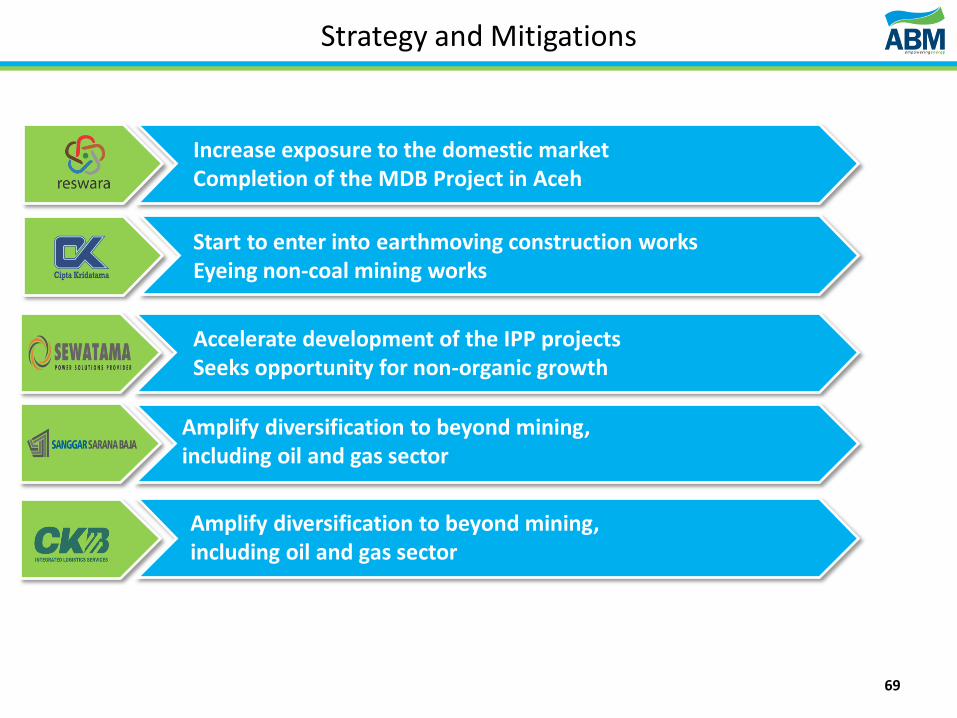
Start to enter into earthmoving construction works Eyeing non-coal mining works
Accelerate development of the IPP projects Seeks opportunity for non-organic growth
Amplify diversification to beyond mining, including oil and gas sector
Amplify diversification to beyond mining, including oil and gas sector
Strategy and Mitigations
Increase exposure to the domestic market Completion of the MDB Project in Aceh
69
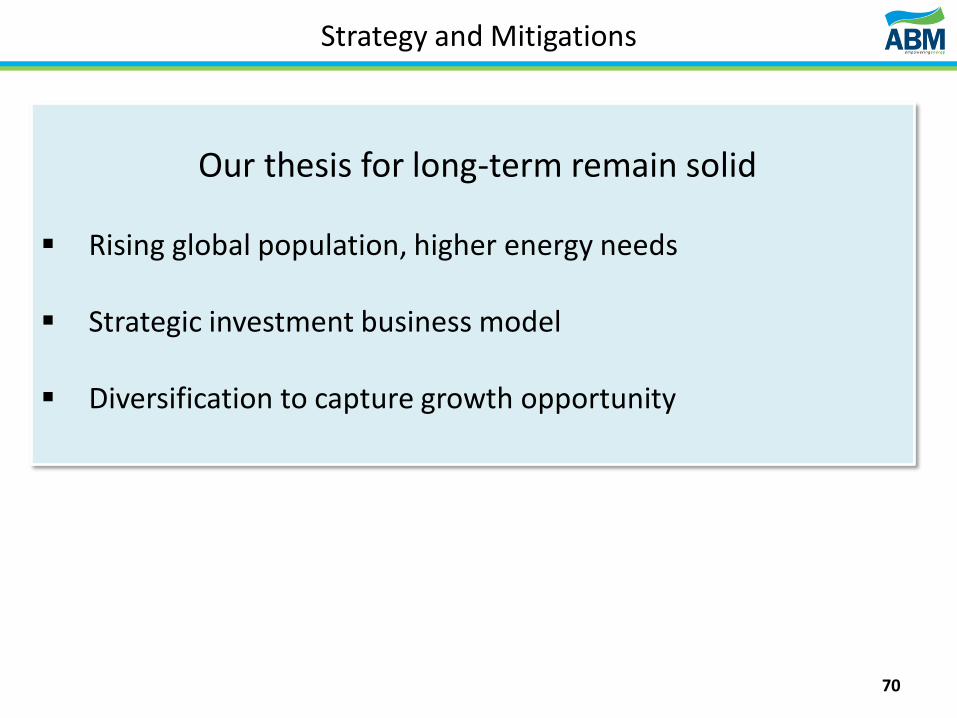
Our thesis for long-term remain solid Rising global population, higher energy needs
Strategic investment business model
Diversification to capture growth opportunity
Strategy and Mitigations
70
Recent Updates Operational Highlights Financial Highlights Strategy and Mitigations
Appendices 72
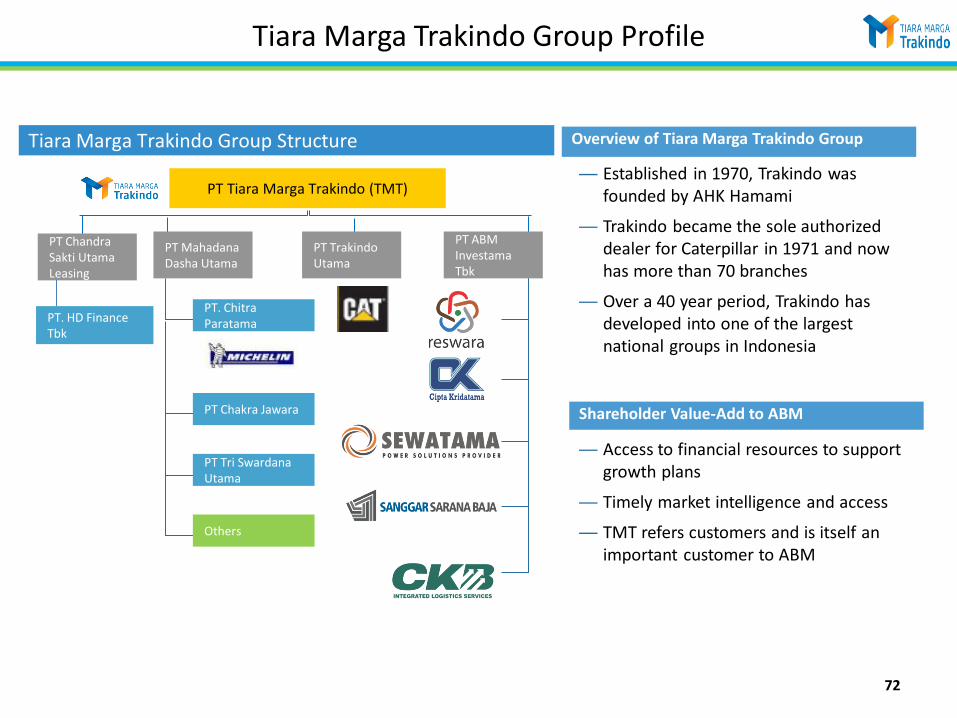
Overview of Tiara Marga Trakindo Group
— Established in 1970, Trakindo was founded by AHK Hamami
— Trakindo became the sole authorized dealer for Caterpillar in 1971 and now has more than 70 branches
— Over a 40 year period, Trakindo has developed into one of the largest national groups in Indonesia
Shareholder Value-Add to ABM
— Access to financial resources to support growth plans
— Timely market intelligence and access
— TMT refers customers and is itself an important customer to ABM
Tiara Marga Trakindo Group Structure
PT Tiara Marga Trakindo (TMT)
PT. Chitra Paratama
PT Tri Swardana Utama
Others
PT Chakra Jawara
PT Mahadana Dasha Utama
PT ABM Investama Tbk
PT Trakindo Utama
PT Chandra Sakti Utama Leasing
72
PT. HD Finance Tbk
Tiara Marga Trakindo Group Profile
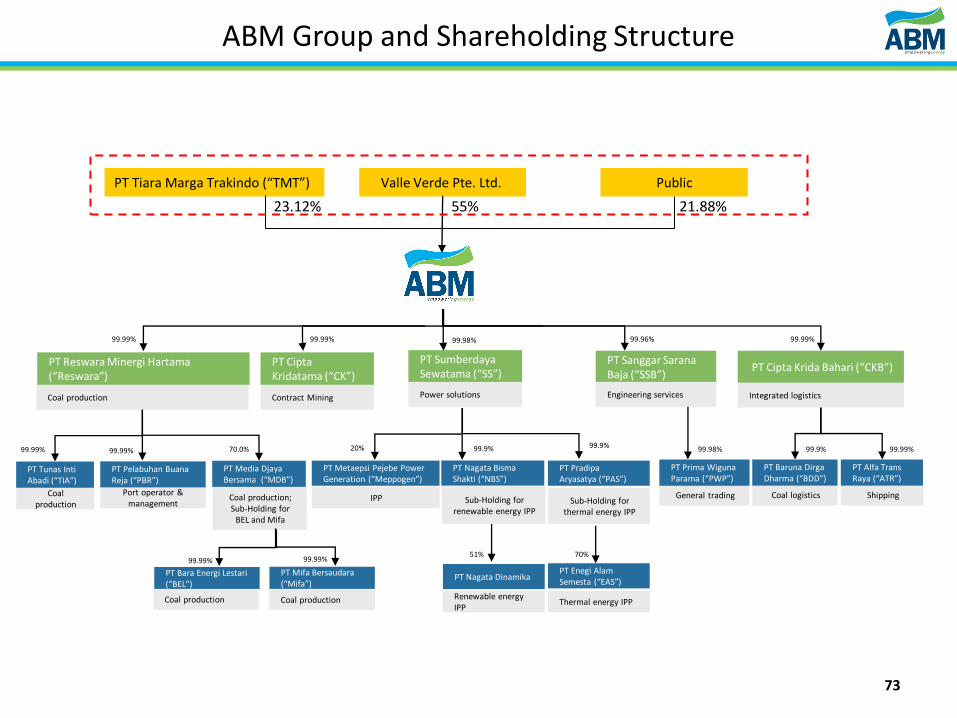
73
Coal production; Sub-Holding for
BEL and Mifa
PT Cipta Kridatama (“CK”)
Contract Mining
99.99%
PT Sumberdaya Sewatama (“SS”)
Power solutions
99.98%
PT Cipta Krida Bahari (“CKB”)
Integrated logistics
99.99%
PT Sanggar Sarana Baja (“SSB”)
Engineering services
99.96%
Sub-Holding for thermal energy IPP
PT Pradipa Aryasatya (“PAS”)
99.9%
Sub-Holding for renewable energy IPP
PT Nagata Bisma Shakti (“NBS”)
99.9% 20%
Coal logistics
PT Baruna Dirga Dharma (“BDD”)
99.9%
Shipping
PT Alfa Trans Raya (“ATR”)
99.99%
Valle Verde Pte. Ltd. Public PT Tiara Marga Trakindo (“TMT”)
23.12% 55% 21.88%
99.98%
IPP
PT Metaepsi Pejebe Power Generation (“Meppogen”)
General trading
PT Prima Wiguna Parama (“PWP”)
PT Reswara Minergi Hartama (“Reswara”)
Coal production
PT Bara Energi Lestari (“BEL”)
Coal production
PT Mifa Bersaudara (“Mifa”)
Coal production
99.99%
70.0% 99.99% 99.99%
99.99% 99.99%
Coal production
PT Tunas Inti Abadi (“TIA”)
Port operator & management
PT Pelabuhan Buana Reja (“PBR”)
PT Media Djaya Bersama (“MDB”)
PT Enegi Alam Semesta (“EAS”)
Thermal energy IPP
PT Nagata Dinamika
Renewable energy IPP
51% 70%
ABM Group and Shareholding Structure
74
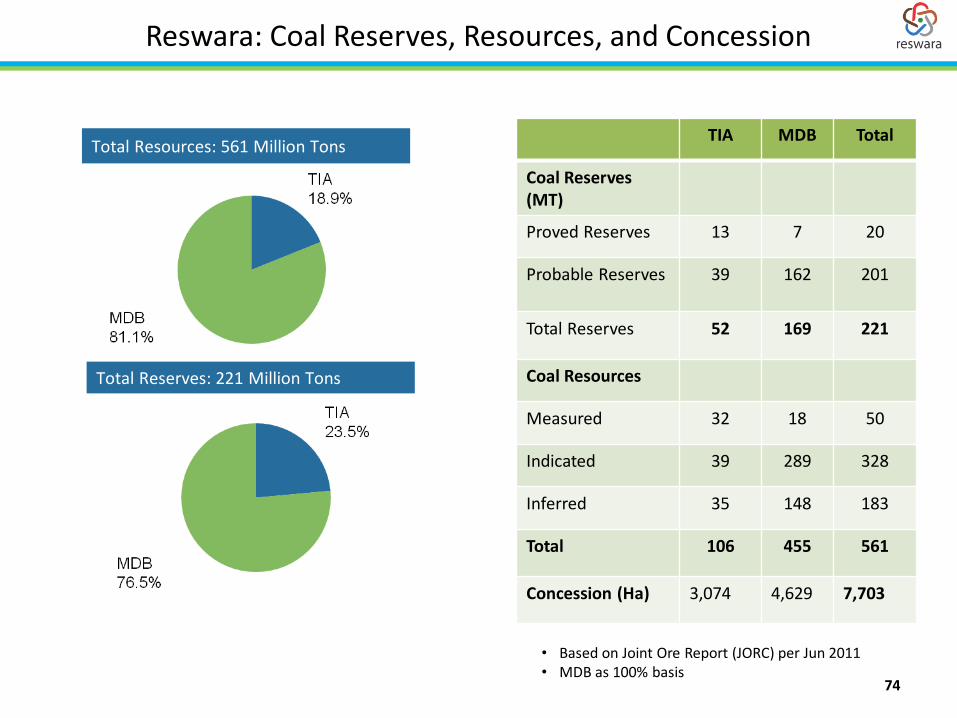
TIA MDB Total
Coal Reserves (MT)
Proved Reserves 13 7 20
Probable Reserves 39 162 201
Total Reserves 52 169 221
Coal Resources
Measured 32 18 50
Indicated 39 289 328
Inferred 35 148 183
Total 106 455 561
Concession (Ha) 3,074 4,629 7,703
Total Resources: 561 Million Tons
Total Reserves: 221 Million Tons
• Based on Joint Ore Report (JORC) per Jun 2011 • MDB as 100% basis
Reswara: Coal Reserves, Resources, and Concession
75
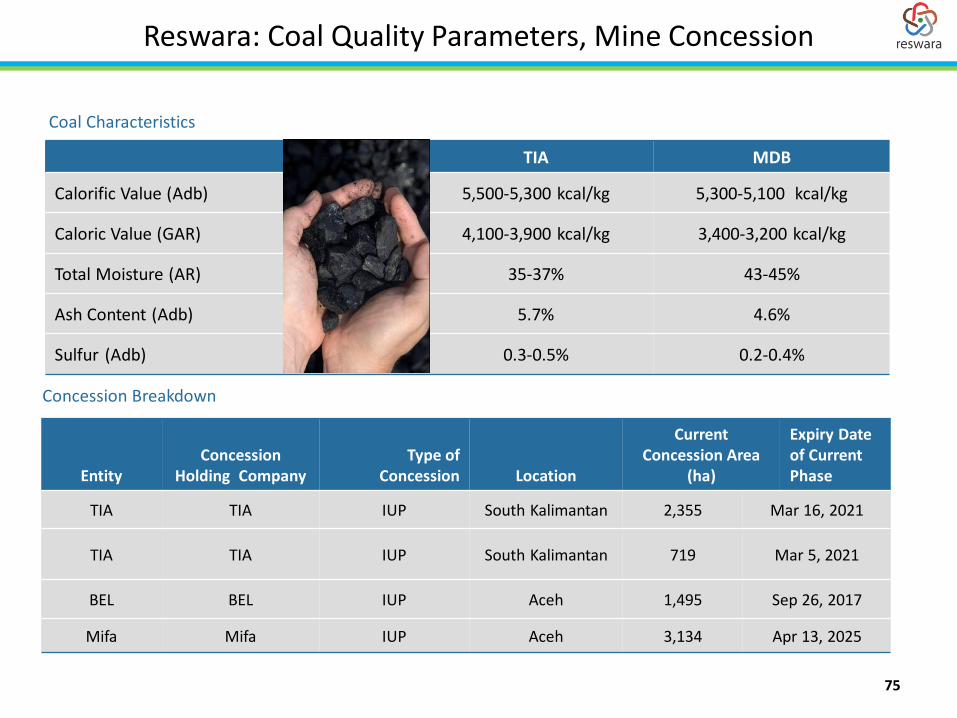
TIA MDB
Calorific Value (Adb) 5,500-5,300 kcal/kg 5,300-5,100 kcal/kg
Caloric Value (GAR) 4,100-3,900 kcal/kg 3,400-3,200 kcal/kg
Total Moisture (AR) 35-37% 43-45%
Ash Content (Adb) 5.7% 4.6%
Sulfur (Adb) 0.3-0.5% 0.2-0.4%
Coal Characteristics
Entity Concession
Holding Company Type of
Concession Location
Current Concession Area
(ha)
Expiry Date of Current Phase
TIA TIA IUP South Kalimantan 2,355 Mar 16, 2021
TIA TIA IUP South Kalimantan 719 Mar 5, 2021
BEL BEL IUP Aceh 1,495 Sep 26, 2017
Mifa Mifa IUP Aceh 3,134 Apr 13, 2025
Concession Breakdown
Reswara: Coal Quality Parameters, Mine Concession
76
Balikpapan
South Kalimantan
Central Kalimantan
Palangkaraya
Banjarmasin
Indonesia
Kalimantan
Tunas Inti Abadi Project Area
Balikpapan
South Kalimantan
Central Kalimantan
Palangkaraya
Banjarmasin
Indonesia
Kalimantan
Tunas Inti Abadi Project Area
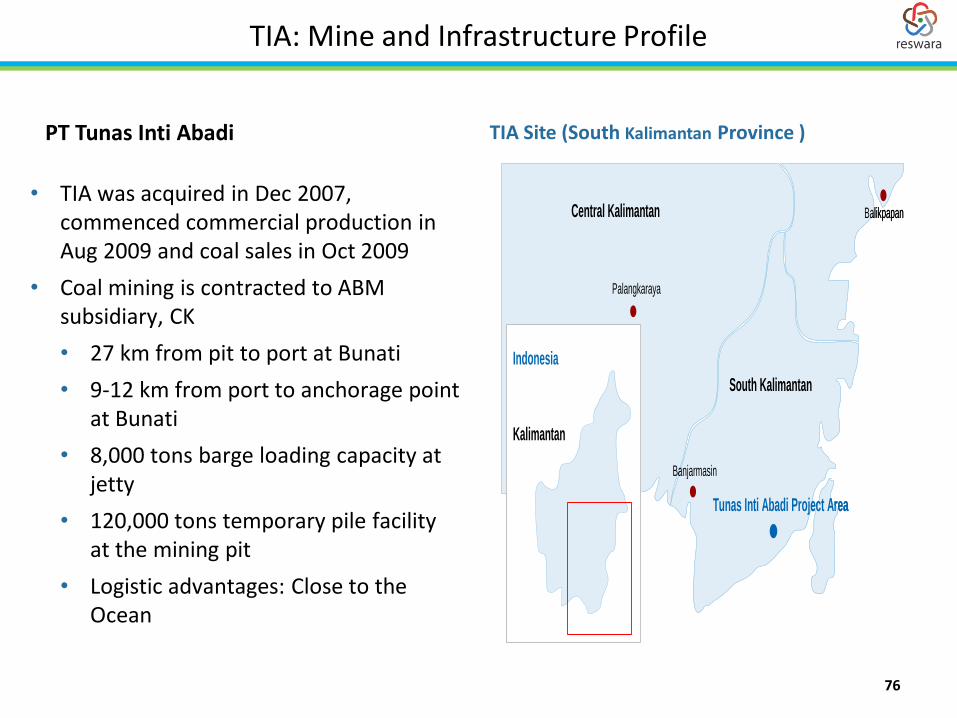
TIA Site (South Kalimantan Province ) PT Tunas Inti Abadi
• TIA was acquired in Dec 2007, commenced commercial production in Aug 2009 and coal sales in Oct 2009
• Coal mining is contracted to ABM subsidiary, CK
• 27 km from pit to port at Bunati
• 9-12 km from port to anchorage point at Bunati
• 8,000 tons barge loading capacity at jetty
• 120,000 tons temporary pile facility at the mining pit
• Logistic advantages: Close to the Ocean
TIA: Mine and Infrastructure Profile
77
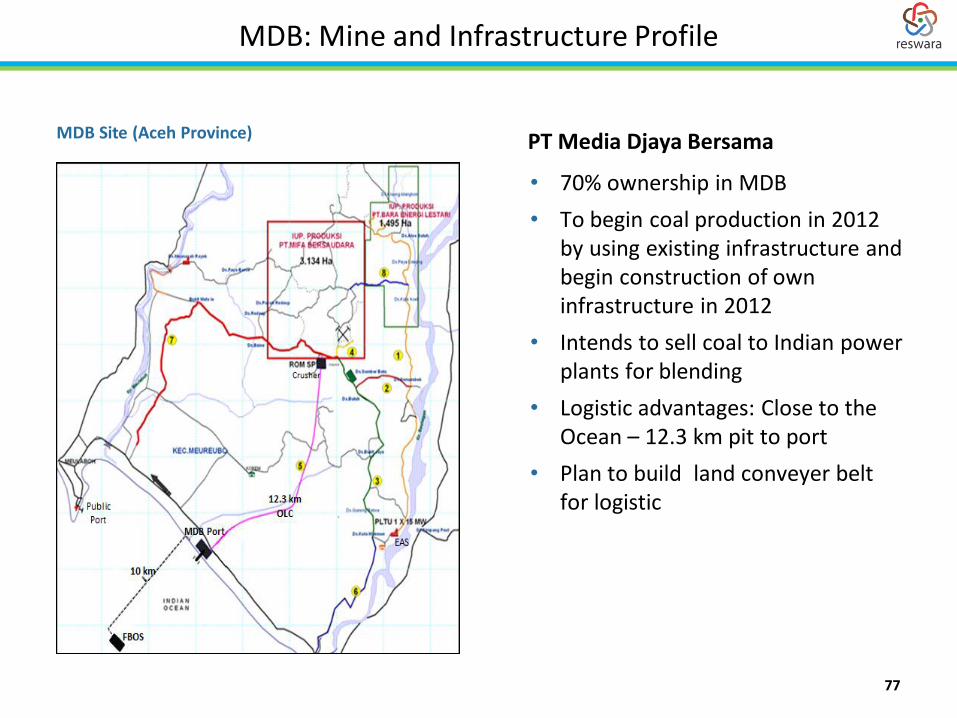
PT Media Djaya Bersama
• 70% ownership in MDB
• To begin coal production in 2012 by using existing infrastructure and begin construction of own infrastructure in 2012
• Intends to sell coal to Indian power plants for blending
• Logistic advantages: Close to the Ocean – 12.3 km pit to port
• Plan to build land conveyer belt for logistic
MDB Site (Aceh Province)
MDB: Mine and Infrastructure Profile
78
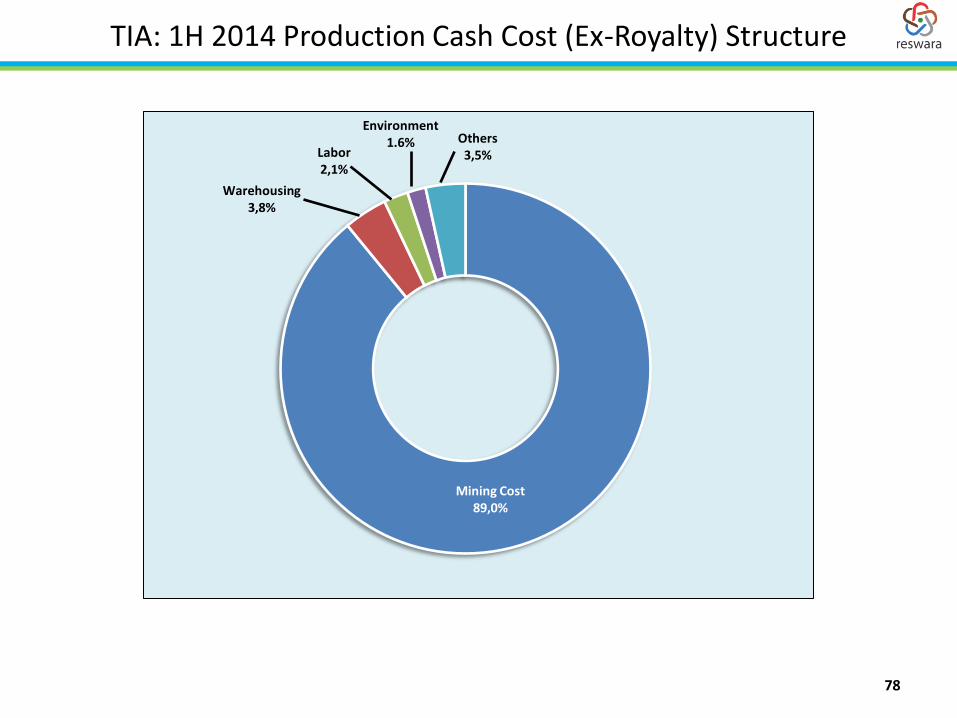
TIA: 1H 2014 Production Cash Cost (Ex-Royalty) Structure
Mining Cost 89,0%
Warehousing 3,8%
Labor 2,1%
Environment 1.6% Others
3,5%
79
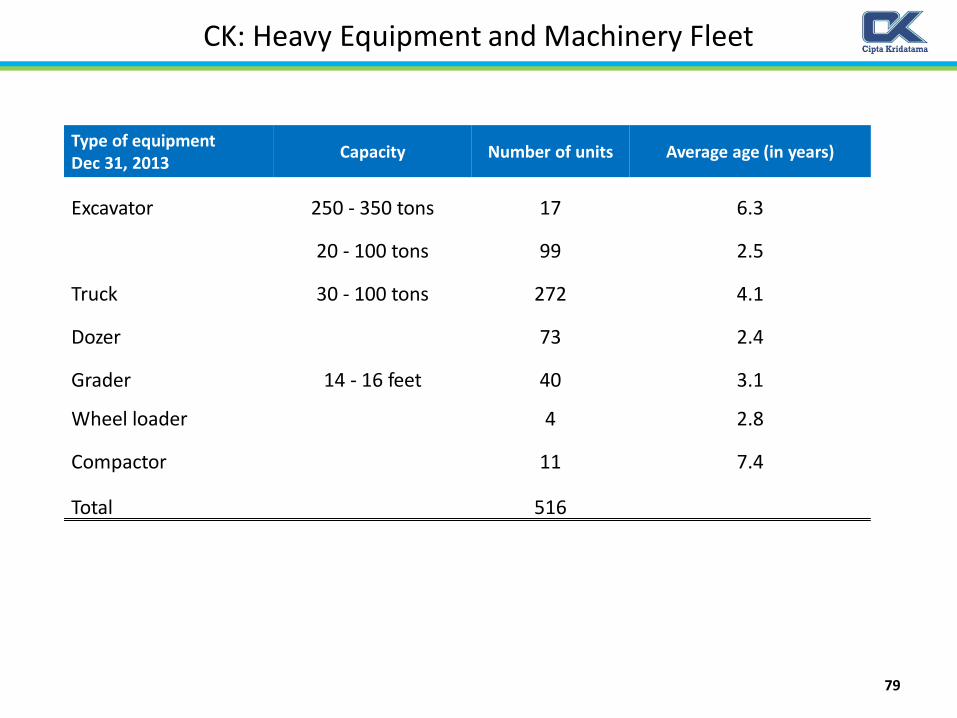
Type of equipment Dec 31, 2013
Capacity Number of units Average age (in years)
Excavator 250 - 350 tons 17 6.3
20 - 100 tons 99 2.5
Truck 30 - 100 tons 272 4.1
Dozer 73 2.4
Grader 14 - 16 feet 40 3.1
Wheel loader 4 2.8
Compactor 11 7.4
Total 516
CK: Heavy Equipment and Machinery Fleet
80
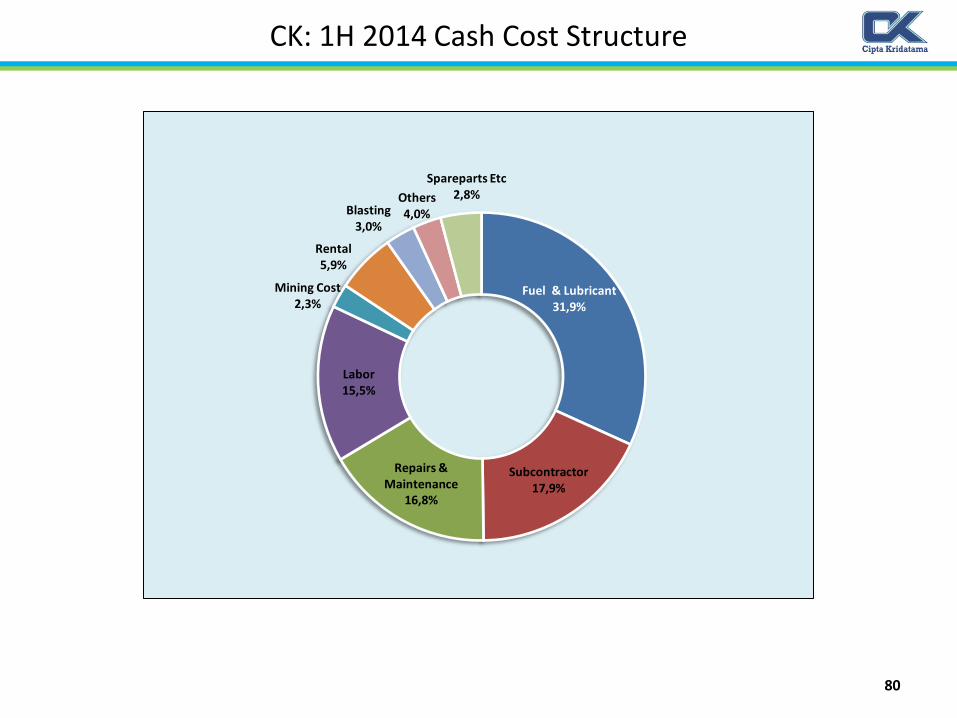
CK: 1H 2014 Cash Cost Structure
Fuel & Lubricant 31,9%
Subcontractor 17,9%
Repairs & Maintenance
16,8%
Labor 15,5%
Mining Cost 2,3%
Rental 5,9%
Blasting 3,0%
Spareparts Etc 2,8% Others
4,0%
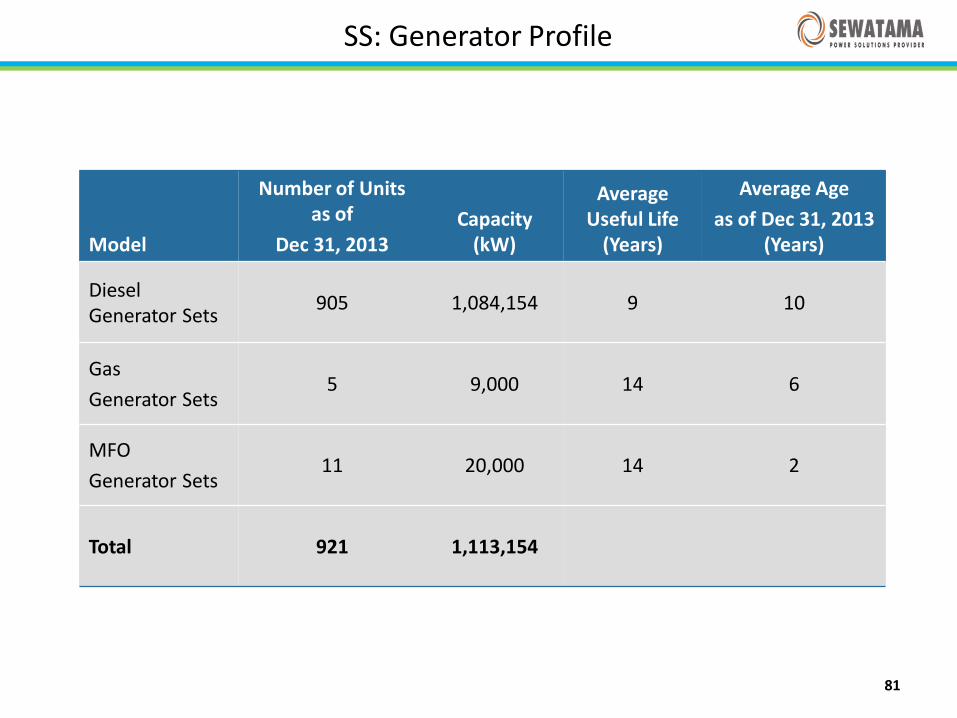
Model
Number of Units as of
Dec 31, 2013 Capacity
(kW)
Average Useful Life
(Years)
Average Age
as of Dec 31, 2013 (Years)
Diesel Generator Sets
905 1,084,154 9 10
Gas
Generator Sets 5 9,000 14 6
MFO
Generator Sets 11 20,000 14 2
Total 921 1,113,154
81
SS: Generator Profile
Contact Investor Relations Adi Hartadi Tel:6221-2997-6767 Ext.1874 Fax : 6221-2997-6768 Email : [email protected] Email : [email protected] Website : www.abm-investama.com A member of Tiara Marga Trakindo Group
Gedung TMT 1, 18th Fl, Suite 1802 Jl Cilandak KKO No.1 Jakarta 12560 - Indonesia